economic consequences of european union subsidies …aic.ucdavis.edu/oa/eutomato.pdf · economic...
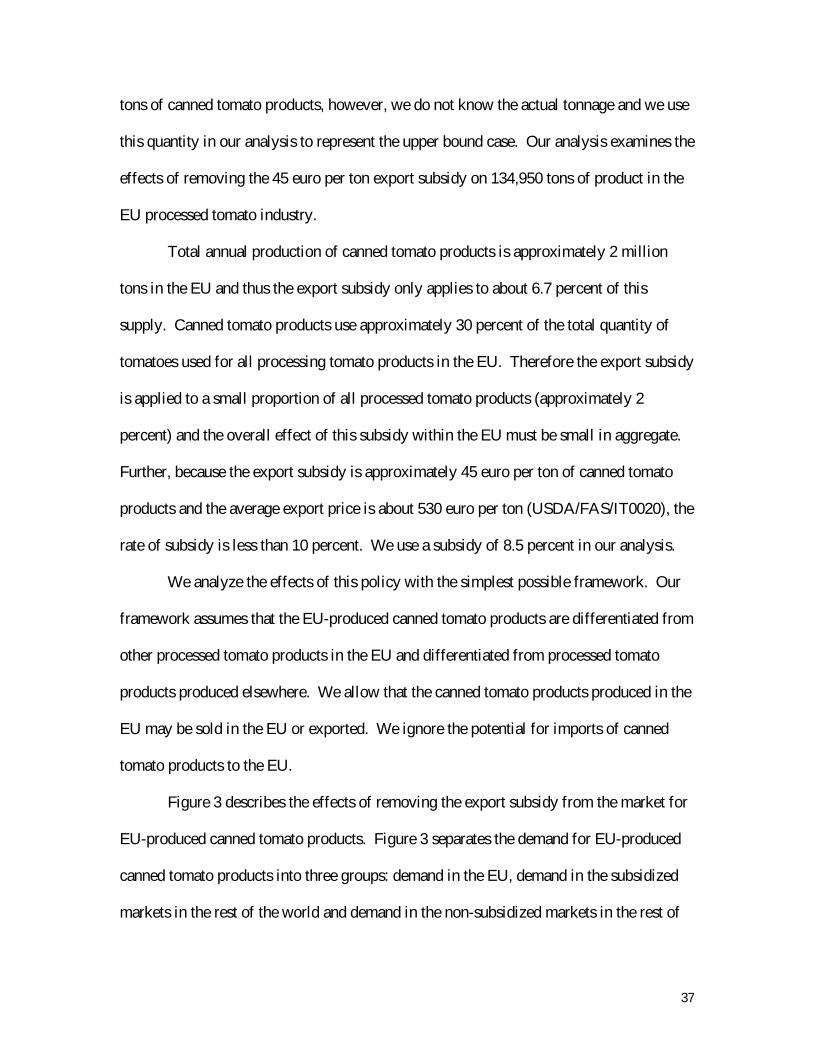
TRANSCRIPT

Economic Consequences ofEuropean Union
Subsidies for Processing Tomatoes
University of California, Agricultural Issues Center
by
Daniel A. Sumner, Bradley J. Rickard and David S. Hart
Spring 2001

i
Executive Summary
The European Union (EU) is a major producer and consumer of processed tomato
products (tomato paste, canned tomatoes, tomato juice, tomato sauce, etc.), representing
slightly less than one-third of world production and consumption. The EU is also a major
exporter of processed products, including tomato paste and canned tomatoes, and a
significant importer of tomato paste and other processed tomato products.
The EU processed tomato industry is subject to export subsidies, import barriers,
and domestic subsidies. These government programs have significant impacts on EU
producers, consumers and taxpayers and on processed tomato market participants outside
the EU. These impacts will be summarized in turn.
The export subsidy regime of the European Union applies to a relatively small
share of total processed tomato production of the European Union--canned tomatoes,
whole or in pieces, not to tomato paste or sauce. The subsidy has been about 45 euro per
metric ton or a bit less than 10 percent of the average export price for these products
(about 500 euro per ton). Exports comprise about 12.5 percent of production of these
canned products, but the export subsidy is limited to at most 135 thousand metric tons or
about 54 percent of total exports of the applicable products. These data mean that this EU
export subsidy program may be important for certain export products in certain markets,
but it does not constitute a major force in the economics of the overall EU processing
tomato market.
Based on this background and a set of supply and demand parameters, we
estimate that, if the export subsidy program were removed, the quantity of EU exports of
the applicable canned tomatoes would fall by about 4 percent, and the exports of all

ii
processed tomato products would fall by about 0.6 percent. The quantity of EU
production of canned tomatoes would fall by about 0.3 percent, and the price of EU
canned tomatoes would fall by about 0.6 percent. The overall effects of the export
subsidy on EU production and prices of all processed tomato products would be quite
small. Losses to producers and exporters would be exceeded by gains to EU consumers
and taxpayers by about 5 million euro per year.
The EU has long maintained an import barrier for processed tomato products.
Currently, the tariff is 14.4 percent, down one fifth since 1995 in accordance with the
Uruguay Round agreement under the auspices of the World Trade Organization. The
tariff applies to all imports of processed tomato products with two exceptions. First,
some product enters the EU under preferential trade agreements. Second, imported
product that is destined for re-export (perhaps after additional processing or packaging) is
allowed an import tariff refund or duty drawback.
Specific data on the share of EU imports in either of these categories is difficult to
obtain. Informal information from industry sources suggests that at least 20 percent of
imports enter the EU duty free. Our analysis is based, in part on this information and also
on other parameter values and model specifications that are detailed in the full report.
We estimate that elimination of the EU import tariff for processed tomato
products would raise EU imports by about 100 percent, lower EU consumer prices of
tomato paste and related products by 12.6 percent, raise EU consumption by 6.3 percent,
and lower EU domestic production of processing tomatoes by about 5 percent. Overall,
the gain to EU consumers would exceed the loss in tariff revenue and producer profits by
about 6 million euro per year.

iii
The internal subsidy program for the processing tomato industry in the European
Union was changed after the year 2000 season. The program now in place has, thus, not
yet been applied. Nonetheless, based on interpretations of official EU documents and
experience with the previous program, we have been able to analyze the likely
consequences of this new program.
Until 2001, the EU domestic subsidy program included direct payments to
processors, minimum prices for growers and quotas that limited the payments/minimum
prices to a fixed quantity per processing plant. The share of production covered by the
subsidy averaged about 80 percent across the whole EU.
All these program features have been replaced by a 34.5 euro per ton production
subsidy payment to growers for the 2001 season. The new program includes a
“threshold” quantity for each nation, but that threshold does not affect the incentives
facing individual growers or processors. Under the new rules, aggregate production in
each nation relative to the threshold will serve as a basis to adjust payment rates in future
years, but does not affect any current year.
The new program continues a significant budget transfer from European taxpayers
to owners of processing firms and tomato farmers in Italy, Spain, Greece, Portugal, and
France. The total transfer has been in the order of 300 million euro ($270 million)
annually and is a large share (about 25 percent) of total processed tomato industry
revenue. Our estimates indicate that this tax transfer is likely to remain large under the
new program in 2001, and be significantly larger than if the previous regime had
remained in place. Under the domestic subsidy program (both prior to 2001 and with the
recent changes), benefits of the payments are distributed roughly in proportion to output,

iv
for both processors and farmers. Therefore, larger operations get most of the subsidy. As
with other such programs, payments tend to be capitalized into the prices of facilities and
farmland.
It is well known that the added social cost from this kind of tax and transfer
program may be large. The magnitude of this excess tax burden depends on: (a) the
efficiency of national tax systems in Europe, (b) the effectiveness of the EU and national
bureaucracies in operating such programs, and (c) the ability and interest of national and
local authorities in the Mediterranean countries to allocate funds and monitor programs
carefully. Analysis of the efficacy of these institutions is beyond the scope of our study.
However, we note that, in general, the increased economic burden associated with these
government transfers is likely to result in less economic activity in other sectors and
lower overall employment, especially in Northern Europe, which is the primary source of
the net tax transfer.
Our analysis shows that the new program has larger market and trade effects than
the program it replaced because the subsidy rate is higher and the production incentives
are more direct and less constrained. Under a reasonable set of supply and demand
parameters, we estimate that elimination of the new subsidy would reduce EU processing
tomato production by about 5 percent, and raise the price of EU processed tomato
products by about 12 percent. Net exports from the EU would decline by about 14
percent because the EU products would be less competitive with imports into the EU and
in outside markets. We note that the production decline that would occur if the new
program were eliminated is about 60 percent larger than that associated with the EU

v
program that was replaced. That is to say, the newly created program has substantially
larger production distortions than its predecessor.
Overall, the European Union continues to subsidize tomato processors and
farmers with an array of border measures and direct domestic production subsidies. This
policy is costly to taxpayers and distorts incentives across economic activities within the
European Union. And as shown above, the policy also distorts trade patterns in the
global market for processed tomato products.

vi
Table of Contents
Executive Summary……………………………………………………. iList of Tables…………………………………………………………... viiiList of Figures…………………………………………………………. ix
1 Introduction and overview…………………………………………… 1
2 The processed tomato industry………………………………………. 3
2.1 Production of tomatoes and processed tomato products..………………. 42.1.1 European Union………………………………………………………… 42.1.2 United States……………………………………………………………. 82.1.3 Processed tomato production in the rest of the world………………….. 92.2 Trade…………………………………………………………………… 12
3 European Union policy for processed tomatoes…………………….. 16
3.1 EU trade policies for processed tomato products……………………….. 173.1.1 Export subsidy………………………………………………………….. 173.1.2 Tariff……………………………………………………………………. 183.2 Internal EU subsidy policies……………………………………………. 193.2.1 Domestic program prior to 2001…………………………………..……. 203.2.1.1 Processor aid…………………………………………………………….. 203.2.1.2 Minimum price…………………………………………………………. 213.2.1.3 Entitlement quota………………………………………………………. 253.3 Domestic program as of 2001………..………………………………….. 30
4 Effects of elimination of EU trade policies…………………………… 36
4.1 Estimated effects from removal of the export subsidy………………….. 364.2 Effects from removal of the tariff………………………………….……. 424.2.1 Simulation of the tariff removal…………………………………………. 434.3 Summary of the effects of removing the trade barriers………………….. 49
5 Analysis of the effects of EU domestic programs for processed tomatoes………………………………………………… 51
5.1 Analysis of EU domestic programs used prior to 2001………………….. 515.1.1 Three models to describe the EU domestic program used prior to 2001… 565.1.2 Development of the illustrative models used to assess
the production effects……………………………………………………. 575.1.3 Reallocation of quota across processors ………………………………… 665.2 Modeling the domestic program effects under the policy changes of 2001 675.2.1 Illustrative model of the EU domestic program effective in 2001……….. 685.3 A summary of the qualitative effects of the EU domestic programs……... 70

vii
6 Simulation of the removal of EU domestic policies…………………… 72
6.1 Model and empirical issues………………………………………………. 726.2 Estimated production effects for removal of policies used prior to 2001… 736.3 Estimated production effects for removal of new program…………….… 806.4 Summary of the effects of removing EU domestic policies………………. 82
7 Concluding remarks…………………………………………………….. 86
A1 Appendix: Models of the effects of EU trade policies……………………. 88A2 Appendix: Models of the effects of EU domestic policies
prior to policy changes in 2001……………….……………………….….. 92A3 Appendix: Calculating the effects of removing both the domestic
program used prior to 2001 and the new domestic program………………. 95

viii
List of Tables
1. Annual data for total production and quota allocation of processed tomato products for tomato growing countries in the EU……………… 5
2. EU imports and exports of tomato paste, excluding intra-EU trade…… 14
3. EU processor aid, minimum price and their ratio, 1978 – 2000………… 23
4. EU processing tomato quota allocation by country and product……….. 26
5. Estimated EU budget costs from processor aid transfersfor all processed tomato products in 1998………………………………. 29
6. Estimated EU processing tomato aid budget costs and components:Selected years……………………………………………………………. 31
7. Processed tomato production, quota entitlements, threshold quantities in the EU, and their ratios…………………………………….. 34
8. Price, quantity, and EU welfare effects from removal of the export subsidy for canned tomato products…………………………………….. 41
9. Price, quantity, and EU welfare effects from removal of the 14.4 percent tariff………………………………….…………………………………… 48
10. Parameters used to estimate the alternative projections of EU production……………………………………………………………75
11. Projections of EU production under removal of domestic programs used prior to 2001 under alternative assumptions about program implementation…………………………………………………………….. 79
12. Estimated EU production and price effects for 2001 program comparedto pre-2001 program and no-program…..…………………………………. 83
13. EU welfare effects from removal of the domestic programs……………….84
ix
List of Figures
1. EU paste production, processed tomato production and quota…………… 6
2. Processor aid payments and minimum price for processed tomatoes in the EU………………………………………………………………… 22
3. Effects of removing the EU export subsidy for canned tomato products…. 38
4. Effects of removing the ad valorem tariff…………………………………. 44
5. Effects of EU minimum price and quota on tomato growers with high, medium and low marginal costs…………………………………… 52
6. Effect of EU minimum price, processor aid and quota on a typical processor of manufactured tomato products……………….. 54
7. The pre-2001 EU processed tomato programwith all production exceeding quota: Infra-marginal case………………. 59
8. Marginal costs for the manufactured tomato product market with regions producing under, at, and above quota……………………… 61
9. Aggregate marginal costs for the EU manufactured tomato product market with quotas applied in each region………………..….…………… 62
10. Marginal costs with pooled price arrangement in low-cost region………………………………………………………… 65
11. The effects of eliminating the per-unit subsidy in the processing tomato market……………………….…………..…………….. 69
1
1 Introduction and Overview
European Union agriculture is large, diverse and heavily influenced by the Common
Agricultural Policy (CAP) that regulates and subsidizes farm production and marketing in
all member nations. This report examines, in detail, one part of the CAP.
The European Union (EU) is a major producer and consumer of processed tomato
products, representing slightly less than one-third of world production and consumption.
The EU is also a major exporter of processed products and a significant importer of
tomato paste and other processed tomato products.
As a part of the CAP, the EU processed tomato industry is subject to export
subsidies, import barriers, and domestic subsidies. These government programs have
significant impacts on EU producers, consumers and taxpayers and on processed tomato
market participants outside the EU. These policies are described and their impacts are
modeled and measured in this report.
We begin with border measures--export subsidies and import barriers. The export
subsidy regime of the European Union applies to a small share of total EU processed
tomatoes. Using a simple simulation model and assumed supply and demand parameters,
we show hat the export subsidy has small aggregate impact. The EU tariff on processed
tomato products is 14.4 percent, down 20 percent since 1995. Informal information from
industry sources suggests that at least 20 percent of imports enter the EU duty free. Some
product enters the EU under preferential trade agreements and imported product that is
destined for re-export is allowed an import tariff refund or duty drawback. We estimate
that elimination of the EU import tariff for processed tomato products would raise EU

2
imports substantially from a small base but would have more modest effects on EU prices
and domestic production.
The internal subsidy program for the processing tomato industry in the European
Union was changed after the year 2000 season. Prior to 2001, the EU domestic subsidy
program included direct payments to processors, minimum prices for growers and non-
transferable quotas that limited the payments/minimum prices to a fixed quantity per
processing plant. All these program features have been replaced by a 34.5 euro per ton
production subsidy payment to growers for the 2001 season. Thus, the new program
continues a significant budget transfer from European taxpayers to owners of processing
firms and tomato farmers. Our estimates indicate that the tax transfer is now significantly
larger than if the previous regime had remained in place. Our simulation analysis also
shows that the new program has larger market and trade effects than the program it
replaced because the subsidy rate is higher and the production incentives are more direct
and less constrained.
Overall, the European Union continues to subsidize tomato processors and
farmers with an array of border measures and direct domestic production subsidies. This
policy is costly to taxpayers, distorts incentives across economic activities within the
European Union and distorts trade patterns in the global market for processed tomato
products.
The concluding section of the report lists some extensions in data collection, data
analysis and simulations that are underway. Completion of these extensions will provide
a firmer basis for understanding the policy effects and understanding the sensitivity of the
estimated results.

3
2 The processed tomato industry
This section summarizes the production and trade of processing tomatoes
throughout the world, including a discussion of production and trade of processed tomato
products (see Hart for a more complete description)1. It provides a context for the
analysis of EU policy. There is a market for fresh tomatoes and a market for processing
tomatoes used to manufacture processed tomato products. Here we concentrate solely on
processing tomatoes and processed tomato products.
Tomato paste is the major processed tomato product. More than two-thirds of
U.S. and EU tomatoes for processing are used to manufacture paste. Paste is sold as a
final consumer product and as an input into other processed tomato products such as
ketchup and pasta sauce. Tomato paste is measured by the amount of tomato solids it
contains; most tomato paste is approximately 30 brix, which means that when dried, the
tomato solids will comprise 30 percent of the weight of the paste. Depending on the
processing technology and national standards, from 5.5 to more than 6 tons of tomatoes
(unless noted otherwise, tons refers to metric tons throughout) yield one ton of paste.
1 Data is taken mainly from United States Department of Agriculture Foreign
Agricultural Service (USDA/FAS) GAIN Reports. Official agricultural statistics from
the EU and most other countries routinely aggregate fruits and vegetables, so they are
generally less helpful. The United Nation’s Food and Agriculture Organization (FAO)
has data specific to tomatoes, however, this source aggregates fresh tomatoes with
processing tomatoes. Other data is available on international trade in tomato paste (e.g.
Henin et al., Tomato News) and these sources were also consulted.

4
Canned tomato products are the second major use for processing tomatoes.
However, three countries (Italy, United States and Spain) account for more than 95
percent of world production of canned tomato products. Canned tomato products include
a number of sub-products; whole peeled, peeled crushed and peeled diced. Whole peeled
canned tomatoes are sold as consumer goods. Peeled crushed and peeled diced canned
tomatoes are used as both consumer goods and inputs into other processed tomato
products. Depending on the product and processing technology, 0.8 to 1.2 tons of fresh
tomatoes are used to make one ton of processed canned tomato product.
2.1 Production of tomatoes and processed tomato products
2.1.1 European Union
The EU is the world’s largest producer of canned tomato products and the second
largest paste producer. Processed tomato production in the EU is concentrated in Italy,
Spain, Greece, Portugal and France. Production in the EU is heterogeneous across the
different production regions and countries.
Table 1 shows the total quantity of tomatoes used for processed tomato
production for each country in the EU for 1997, 1998, 1999 and 2000. Table 1 also
includes the amount of quota tomatoes, which will be discussed in the next section. The
bold line in Figure 1 illustrates total processed tomato production between 1994 and 1999
(using the left vertical axis). The top line in Figure 1 illustrates tomato paste production
using the right vertical axis. The bottom line in Figure 1 is the quota entitlement and we
will discuss this in detail in Section 3.

5
Table 1. Annual data for total production and quota allocation of processed tomato products for tomato growing countr ies in the EU
Country Yeara Total Production(thousand tons tomatoes
used for processing)
Total Quota(thousand tons
tomatoes)
Ratio of Production to
Quota
Italy 1997 3,520.0 3,471.8 1.011998 4,372.0 3,471.8 1.251999 4,900.0 3,537.3 1.382000 4,400.0 3,609.5 1.22
Greece 1997 1,245.0 1,048.9 1.181998 1,325.0 1,048.9 1.261999 1,350.0 1,110.9 1.212000 1,290.0 1,078.2 1.20
Spain 1997 981.0 1,006.4 0.981998 1,336.2 1,006.4 1.321999 1,687.4 1,004.8 1.682000 1,381.9 1,011.0 1.37
Portugal 1997 771.7 939.5 0.821998 987.0 939.5 1.051999 996.5 866.7 1.152000 970.0 866.7 1.12
France 1997 286.0 369.6 0.771998 327.0 369.6 0.851999 363.0 332.6 1.092000 330.0 299.4 1.10
EU 1997 6,803.7 6,836.2 0.991998 8,347.2 6,836.2 1.221999 9,296.5 6,852.3 1.362000 8,371.9 6,864.8 1.22
Source: United States Department of Agriculture. Foreign Agriculture Service GAIN Reports (various). http://www.fas.usda.gov/scriptsw/attacherep/default.aspttp://
a Yields were below trend in 1997 due to unfavorable weather in several regions.

6
Fig u re 1. EU p as te p ro d u c tio n , p ro cessed to m ato p ro d u c tio n an d q u o ta
6500
7000
7500
8000
8500
9000
9500
1994 1995 1996 1997 1998 1999 2000650
700
750
800
850
900
950
1000
1050
1100
Tomato production
Tomato quotaPaste production
Proces s ed tom ato production and quota (000 tons of tom atoes )
Tom ato pas te production (000
tons pas te)
Source: USDA /FA S GA IN Reports . V arious years.

7
The European Union is the world’s second largest paste producer, with about 5.5
million tons of tomatoes processed into paste (European Commission for Production
Statistics). More than one-third of EU paste is produced in Italy. However, in contrast to
the United States (and other EU countries), only 40 percent of Italian processed tomato
production is used for paste. Most of the Italian paste production is in the Emilia
Romagna region of northern Italy (USDA/FAS/IT6025). This production is exclusively
mechanically harvested and uses advanced processing technology (USDA/FAS/IT6025).
Greece is the second largest EU paste producer, with slightly less than 25 percent of EU
production (1.2 million tons of fresh tomatoes). The majority (about 85 percent) of
Greek processing tomatoes are used for paste. Greek production is located in central and
eastern Macedonia, Thessaly, western Peloponnesus and central Greece. Due to the
small plot size common to Greek growers, mechanical harvesting is not widely used and
the processing technology is not as advanced as in Italy or Spain.
Portugal is the third largest EU paste producer, with approximately 20 percent of
EU production (almost 1 million tons of fresh tomatoes). Almost all (over 95 percent) of
Portuguese processing tomatoes are used for paste. This production is centered in the
Ribatejo and Alentejo regions. Most Portuguese farms are small, which limits the use of
mechanical harvesting.
Spanish paste production is centered in the Estremadura valley in southwestern
Spain. About two-thirds of Spanish processing tomatoes are used for paste (over 800,000
tons). The technology used by Spanish tomato processors is highly advanced and
automated. Mechanical harvesting is less common in Spain because farm sizes are
typically small.

8
France is the smallest EU paste producer and the only EU tomato producing
country that is a net importer of processed tomato products. About 250,000 tons of
French tomatoes are processed into paste (approximately 5 percent of EU production).
This represents approximately 75 percent of total French tomato production, which is
centered in the southeastern part of the country.
The EU is by far the world’s largest producer of canned tomato products, with
approximately 2.5 million tons of fresh tomatoes processed into canned tomato products
(world production was approximately 3.3 million tons in 1998). About 50 percent of
Italian processing tomato production is devoted primarily to the production of canned
tomato products (USDA/FAS/IT0020) and is exclusively located in Southern Italy (in the
Apulia and Campania regions). Spain is the other major EU producer of canned tomato
products, with approximately 230,000 tons (approximately 20 percent of Spanish
processed tomato production), located in the Ebro river basin. Tomatoes used for canned
tomato products are harvested exclusively by hand in the EU.
2.1.2 United States
The United States is the world’s largest producer of tomato paste. Total
production of processed tomato products in the United States uses between 9 million and
11 million metric tons of raw tomatoes annually (USDA, 2000). Approximately 80
percent of all processing tomatoes in the United States are used to produce tomato paste
(Mark Evans and Michael Kay). U.S. processed tomato production is centered in the
Central Valley of California, where over 95 percent of U.S. processed tomatoes are

9
grown (USDA, 2000). All the tomatoes are harvested mechanically and the production
and processing technology is similar across growers and processors.
While only about 10 percent of U.S. processing tomatoes are used in canned
tomato products, this represents approximately 750,000 tons of canned tomato products
(about 25 percent of world production). These tomatoes are also harvested exclusively
by machine and are produced in the Central Valley of California.
The U.S. processing tomato industry receives little direct support from the
government; support (including various agriculture-wide input subsidies) usually
accounts for less than 10 percent of the farm gate revenue (see Sumner and Hart). There
is no government subsidy program specifically for processed tomatoes.
2.1.3 Processed tomato production in the rest of the wor ld
China is a major producer of tomato paste. However, there are no USDA FAS
Attache Reports for the Chinese processing tomato industry. The FAO data for global
tomato production aggregate fresh and processing tomatoes. It should be noted that in
the FAO data, China is the world’s largest tomato producer. In the FAO tomato paste
export data, China exports between 50,000 and 100,000 tons. This amount is
approximately 10 to 15 percent of global exports (Food and Agricultural Organization of
the United Nations).
Turkey is the third largest paste producing area in the world for which we have
reliable data (behind the United States and the EU), with approximately 2 million tons of
fresh tomatoes (80 percent of Turkey’s total processing tomato production) used for
paste. The tomato processing industry is centered around the cities of Bursa, Balikesir

10
and Canakkale (USDA/FAS/TU8023). Turkish tomatoes are picked exclusively by hand.
About 80 percent of the crop is produced under forward contracts between processors and
farmers, and under these commercial contracts, processors supply inputs (seed, fertilizer,
pesticides) and agree to buy all production that meets specifications at a set price
(USDA/FAS/TU7022). The Turkish government does not explicitly support tomato
production, but does provide credit at a 50 percent discount, and provides subsidized
irrigation water.
Latin America (Chile, Mexico and Brazil) processes approximately 2 million tons
of tomatoes into paste. Chile is the largest Latin American producer, with almost
900,000 tons of this total. Brazil accounts for approximately 750,000 tons and Mexico
for about 250,000 to 300,000 tons. The vast majority of Latin American processed
tomatoes are used for paste (over 90 percent for Chile and Mexico and 75 percent for
Brazil).
Chile’s output of processed tomatoes has expanded rapidly over the last decade,
principally as a result of strong international demand for tomato paste, the introduction of
new varieties for industrial purposes, and diminished economic returns for alternative
crops (USDA/FAS/CI6043). Increasing labor costs and the availability of tomato
processing facilities are the limiting factors for expansion of the Chilean industry. These
pressures have led to increased mechanization and increased processing capacity.
Brazilian processing tomato production has been shifting from the Sao Paulo and
Bahia/Pernambuco areas to the Minas Gerais/Goais region. Higher profitability of
alternative crops (mainly fruits like bananas, mangos, guavas and grapes) has fueled the
decrease in tomato production in Bahia/Pernambuco. Increased urban expansion around

11
Sao Paolo has caused land values to increase, and made tomato production relatively less
profitable. Approximately $25 million dollars were invested in the processing tomato
industry in Brazil between 1995 and 1999, thereby increasing mechanization and
processing capacity (USDA/FAS/BR7637).
Mexican processing tomato production is mainly located in the northwestern state
of Sinaloa. Like other countries where the fresh tomato market is larger and more
lucrative than the processing tomato market, a high price for fresh tomatoes in export
markets diverts some industrial tomatoes to the domestic fresh market
(USDA/FAS/MX8150).
The contract procedure between processors and growers is similar in Chile, Brazil
and Mexico. Most of the harvest is grown under forward contracts, with the processor
providing seed, fertilizer, sometimes credit, and technical advice. In one region of Brazil,
prices are determined between processors and a grower bargaining association. The
Chilean, Brazilian and Mexican governments provide little support for processed tomato
production.
Israel processes approximately 125,000 tons of fresh tomatoes into tomato paste.
This represents approximately half of Israeli processed tomato production, all of which
takes place in the Galilee region of the country. Growing and harvesting are completely
mechanized (USDA/FAS/IS7003). Israel subsidizes the price to the grower with
$800,000 as assistance to processing plants for paying the growers (USDA/FAS/IS7003).

12
2.2 Trade
In general, the major tomato producers are also the major consumers of processed
tomato products. In both the EU and the United States, about 10 to 15 percent of
production is exported. (European Commission for Production Statistics, Kuminoff et
al.).
Globally there are approximately 650,000 tons of tomato paste exported annually
with a value of between $700 and $1000 per ton. About 310,000 tons of canned tomato
products are exported each year, at approximately $500 per ton.
From 1989 through the first half of 1996, some EU canned tomato products were
subject to a 100 percent ad valorem duty when imported into the U.S. This tariff was
used as one response to the EU ban on hormone treated beef exports from the United
States (Strossman).
Other consumer ready tomato products (e.g. tomato sauce and ketchup) are also
traded, but the volume is smaller than trade in paste and canned tomato products. These
more consumer-ready products have a high value per unit. The United States and Italy
are the major producers of these products, whereas the major consumers are North
America and Western Europe (Food and Agricultural Organization of the United
Nations).
Usually, the consumer demand from these markets is filled regionally (i.e. Brazil
and Chile export to Argentina, and the United States exports to Canada).
The EU is the largest exporter of paste in the world, with approximately 260,000
tons of exports each year. For the purposes of international trade, we consider the EU as
a single unit, and do not consider intra-EU trade as exports or imports. Northern

13
European countries (Germany, United Kingdom and Holland) are the major consumers of
EU paste products from Southern Europe. Major export markets (outside the EU) for EU
tomato paste are in the Middle East, North Africa and Eastern Europe. It is important to
note that for the EU, as well as the rest of the processed tomato producing countries, trade
levels can be highly variable from year to year, depending on production decisions and
growing conditions in each country. For example, in 1995 the Italian tomato harvest was
reduced by about 20 percent from the previous year (and following years). For that year,
Italian imports were higher than forecasted (see UDSA/FAS/IT5029 and
USDA/FAS/IT7023). Table 2 outlines the quantity and values for EU imports and
exports between 1986 and 1998. Table 2 includes only EU trade with countries outside
of the EU.
Libya is a major market for Greek paste (approximately 30,000 tons) and Italian
paste (about 10,000 tons). Poland, Hungary, Japan and the United States are also export
markets (about 4,000 tons each) for EU tomato paste.
The major market for U.S. tomato paste is Canada which accounted for
approximately 50 percent of U.S. paste exports in 1999 (USDC). Asian countries are
also a significant U.S. export market; in 1999 Japan, Korea and Taiwan accounted for
approximately 20 percent of U.S. paste exports (USDC).
South American production tends to remain in South and Central America, with
Argentina being a major export market for Brazil and Chile. Argentina accounts for
nearly 90 percent of Brazilian paste exports (approximately 10,000 tons per year) and
about 15 percent of Chilean paste exports (approximately 10,000 tons per year). Brazil is
the major export market for Chilean paste, receiving almost half of Chilean paste exports

14
Table 2. EU impor ts and expor ts of tomato paste, excluding intra-EU trade
Year Imports(000 tons)
Imports(million $)
Exports(000 tons)
Exports(million $)
Imports($/ton)
Exports($/ton)
1986 29.7 19.2 287.8 192.0 647 6671987 36.1 25.6 291.6 211.9 710 7271988 74.1 60.6 250.1 256.5 818 10261989 99.3 90.3 287.5 347.7 910 12091990 88.8 90.6 212.9 255.8 1020 12011991 89.8 83.6 182.4 195.8 931 10731992 67.9 57.9 192.5 191.0 853 9921993 52.1 39.8 226.5 196.0 764 8661994 60.6 48.9 193.3 193.7 807 10021995 92.6 85.4 235.4 280.6 923 11921996 126.6 110.0 225.9 254.2 869 11251997 100.2 73.6 255.2 247.2 734 9691998 96.5 77.7 279.4 295.5 806 10571999 - not available -2000 - not available -
Source: Food and Agriculture Organization of the United Nations. FAOSTAT Databasehttp://apps.fao.org/cgi-bin/nph-db.pl?subset=agriculture

15
in 1997 (34,000 tons). Venezuela, Honduras, Columbia, Paraguay, Ecuador, the
Dominican Republic and Costa Rica are all export markets for Brazilian and Chilean
paste. Chile regularly exports about 12,000 tons of paste to Japan (about 20 percent of
Chilean exports). Chile also occasionally exports significant amounts (approximately
10,000 tons) of paste to the United States and Italy.
The United States is Mexico’s major export market for tomato paste, ranging
from over 95 percent (in 1994) to approximately two-thirds of Mexican paste exports (in
1997). In quantity terms, this trade is about 10,000 tons per year. In 1995, Mexico
exported about 15,000 tons of paste to Italy, accounting for more than half of Mexican
exports, and constituting a major increase in exports.

16
3 European Union policy for processed tomatoes
Trade barriers and a domestic subsidy continue to comprise the policies used in
the processed tomato industry in the EU. The basic regime has been in place for many
years but it has been adjusted periodically. Most recently, in November 2000, the
European Commission implemented changes to the domestic program that become
effective in 2001. This section describes this policy evolution. The following sections
analyze policy impacts.
The trade policies include a tariff on processed tomato products and an export
subsidy. The export subsidy applies to the EU product code 2002 1010 9100 (OJ L 149,
23.6.2000). This code refers to products within the canned tomato categories.
The domestic policy regime that was in place prior to 2001 included three main
policy tools: processor aid (subsidy) on processed tomato products, a minimum grower
(raw product) price and an entitlement quota on production eligible for the subsidy. The
new policy eliminates the processor aid and the minimum price and changes the nature of
the quota. The changes introduce a fixed per-unit subsidy and a threshold quantity for
growers.
The budget costs of the policies used in the processing tomato industry were
declining prior to 2001. They remain large relative to the size of the industry. Transfers
were approximately 328 million ECU in 1998 and 317 million euro in 1999. The EU
reports that the budget appropriation for 2000 was 267 million euro
(USDA/FAS/E20032), however, we expect that the actual budget costs may have been
lower due to the drop in processor aid in 2000.

17
Understanding each part of the policy is crucial to answering the question: what is
the influence of the whole EU policy on domestic and foreign tomato consumers,
processors, growers, and on EU taxpayers. This section describes these policies in some
detail. We begin with the border measures, then the domestic policy in place up through
2000 is described and the year 2001 policy is outlined.
3.1 EU trade policies for processed tomato products
3.1.1 Expor t subsidy
The EU has an explicit export subsidy for selected canned tomato products,
specifically, peeled tomatoes that are whole or in pieces and that weigh at least one
kilogram. This subsidy is applied on exports to selected destinations but not to the
United States, Slovakia, Latvia and Bulgaria (OJ L 149, 23.6.2000 p. 16).
In order to understand the effects of this policy it is useful to provide some
background information. Within one marketing year there are three distinct periods for
submission of applications for the export subsidy. During the 2000/01 marketing year the
first period was from February 23, 2000 to June 23, 2000; during this period the export
subsidy was limited to 50,000 tons (canned tomato units) and the refund rate was 50
euro/ton (OJ L43.16.2.2000 p.16). The second period was from June 26, 2000 to October
23, 2000, when the export subsidy was limited to 42,477 tons at 45 euro per ton (OJ L149
23.6.2000 p.16). The final period covered October 24, 2000 to February 23, 2001, when
the export subsidy was 45 euro and again limited to 42,477 tons (USDA/FAS/E20135).
Therefore the total available budget for subsidizing exports of processed tomato products
in 2000/01 was approximately 6.3 million euro.

18
Data from the three periods in 2000/01 illustrates that processing tomatoes were
allocated approximately 90 percent of the available export subsidy budget for all
processed fruit and vegetables in the EU. According to USDA/FAS/EU20032 the World
Trade Organization (WTO) was notified of 4.5 million ECU used to subsidize all
processed fruit and vegetable products during the 1998/99 marketing year. We do not
have a published amount for this figure for 2000/01 and we expect that the EU did not
subsidize the full eligible quantity (134,954 tons). However, in our analysis in Section 4
we will assume that the EU subsidized the full quantity; therefore our results will serve as
an upper bound for the effects of removing the export subsidy.
In 2000, total production of canned tomato products in the EU was approximately
2 million tons (which is approximately equal to 2.5 million tons in tomato units) and total
production of all processed tomato products was 8.4 million tons (tomato units).
Therefore, the share of canned tomato products that received the export subsidy was 6.7
percent. The share of total processed tomato production that received an export subsidy
was less than 2 percent. The estimated production and price effects from the export
subsidy policy for canned tomato products is addressed in Section 4.
3.1.2 Tar iff
The EU import barriers for processed tomato products are relatively simple,
especially compared to the complex EU import policies for fresh fruits and vegetables,
and for some processed fruits (cherries and pears).
Processed tomato products are subject to a straightforward ad valorem tariff. The
tariff was 18 percent in the mid 1990s, and was reduced as part of the Uruguay Round

19
Agreement to 14.4 percent in 2001. EU Regulation 1734/96 implements the Uruguay
Round Agreement tariff reduction.
Understanding the impact of the tariff is complicated by preferential trade
agreements that apply to processed tomato products. The preferential trade agreements
allow for tariff reductions or tariff elimination on imports of processed tomato products
exported to the EU from certain countries. The Euro-Mediterranean Agreement is a
preferential trade agreement that the EU has with Morocco, Israel, Turkey, Algeria,
Egypt, Jordan, Tunisia, West Bank and Gaza, Malta and Cyprus. However, this
agreement has had limitations for some tomato-producing countries including Turkey. In
addition, the EU has double-zero agreements with Romania, Slovenia, Slovak Republic,
Czech Republic, Latvia, Bulgaria, Hungary, Estonia, Poland, and Lithuania.
Perhaps more important, the EU also has a duty drawback or tariff-refund policy
whereby the import duty is refunded (or not paid) on products that are imported and then
re-exported. As we understand the policy, the re-exported products may be in a further
processed form and may not contain the same physical product, but must be exported by
the same company. Industry sources state that this program applies to a significant
amount of imported bulk tomato paste and exports of paste that have been repackaged or
converted into sauces or other products containing paste (USDA/FAS/IT0020 p.4).
3.2 Internal EU subsidy policies
As noted above, the internal subsidy program in the EU was changed significantly
in November 2000. These changes will affect the EU budget costs of the program from
2000, the administration of the domestic program and some of the economic impacts.

20
Here we describe the program in place up to 2001 and the new program effective in 2001.
Later we will analyze the effects of each program separately and compare the simulated
impacts. This will allow us to better understand the effects of the 2001 policy change.
3.2.1 Domestic program pr ior to 2001
3.2.1.1 Processor aid
The EU processor aid was a direct transfer (subsidy) from the EU budget to
tomato processors (OJ L 153 7.6.96). There were 16 processed tomato product categories
eligible for the aid; the two main categories were tomato paste and whole peeled canned
tomato products. There were 14 other categories including tomato ketchup, tomato
sauce, tomato juice, and other canned tomato products (e.g. diced, crushed, and chopped).
Aid per product category was based on the dry weight of the product (OJ L 297
21.11.96). The amount of the subsidy was determined by the difference between the EU
raw material price and the raw material price in competing non-EU countries, the amount
of aid in the previous year, and trends in external trade (OJ L 297 21.11.96). There were
two qualifications for a processor to be eligible to receive the subsidy: 1) the processor
must have paid the minimum price to tomato growers from whom it bought raw material
for products receiving aid and 2) raw material must have met certain minimum quality
requirements (OJ L 297 21.11.96).
The subsidy rate was adjusted according to the dry weight content of the
processed product; 28 to 30 percent dry weight received 100 percent of the subsidy (OJ L
162 20.6.84). The computation of the dry weight content, as well as other product quality

21
requirements (with respect to chemical composition and debris levels) were outlined by
the European Commission (see EU Regulation 1764/86 in OJ L 153 7.6.86).
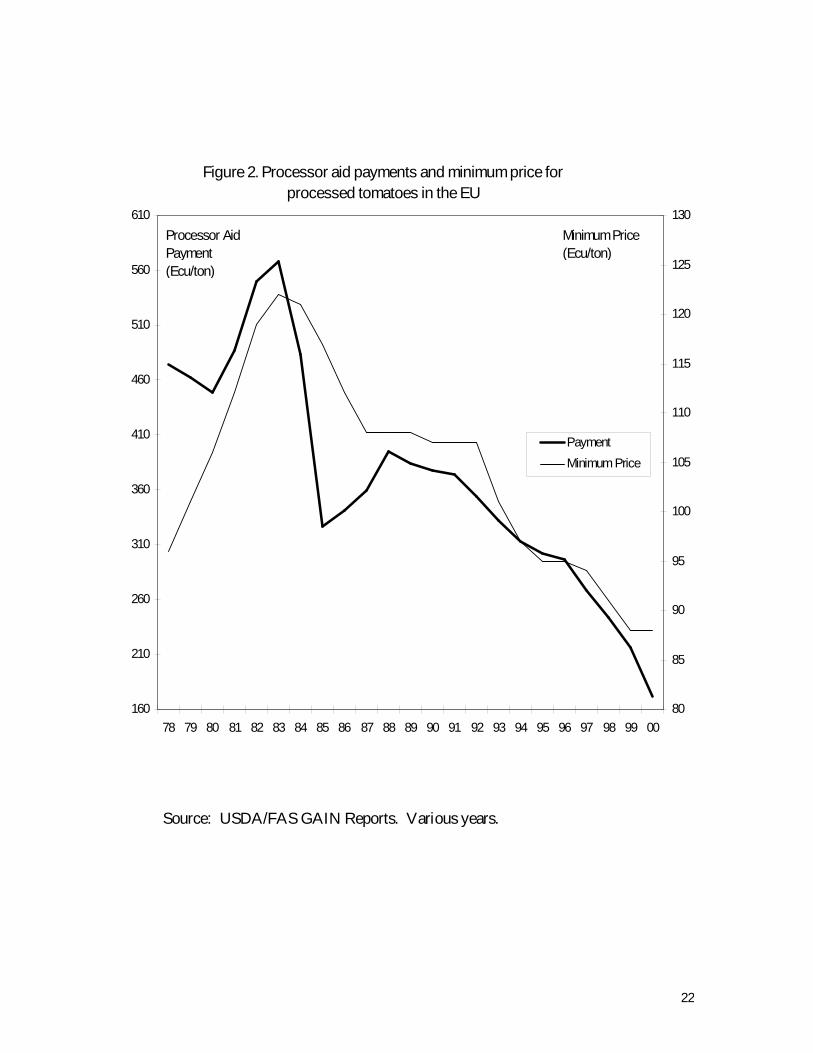
The processor aid per ton of paste was steadily reduced since the late 1980s. It
was 312 ECU per ton in the 1994 marketing year, 301 ECU per ton in the 1995 marketing
year, 296 ECU per ton in 1996 marketing year and 267 ECU per ton in the 1997
marketing year (EU Secretariat, 1997). It then fell to 244 ECU per ton in the 1998, 216
euro per ton in 1999 (USDA/FAS/IT0020), and 172 euro per ton in 2000
(USDA/FAS/SP0049). The average export price for tomato paste in Italy was 885 ECU
per ton for the period 1995 to 1999 (USDA/FAS/IT0020). Therefore, the processor aid
subsidy was a significant percentage of the price of tomato paste, ranging from 25
percent to 35 percent of the average price of tomato paste.
Figure 2 illustrates the pattern of processor aid since 1978. Table 3 provides the
data that was used in Figure 2. The EU entitlement quota limits the amount of raw
product that was eligible for processor aid. The entitlement quota is discussed in detail
below.
3.2.1.2 Minimum pr ice
The EU required that processors pay a minimum price to growers for all tomatoes
used in products that received aid. Each year the European Commission set the minimum
price in the EU. The minimum price between processors and growers was specified
22
Figure 2. Processor aid payments and minimum price for processed tomatoes in the EU
160
210
260
310
360
410
460
510
560
610
78 79 80 81 82 83 84 85 86 87 88 89 90 91 92 93 94 95 96 97 98 99 0080
85
90
95
100
105
110
115
120
125
130
Payment
Minimum Price
Minimum Price (Ecu/ton)
Processor Aid Payment (Ecu/ton)
Source: USDA/FAS GAIN Reports. Various years.

23
Table 3. EU processor aid payment, minimum pr ice and their ratio, 1978 - 2000
Year Processor Aid Payment
(Ecu/ton of Tomato Paste)
Minimum Price(Ecu/ton of Tomatoes)
Ratio of Minimum Price to Processor Aid Payment
1978 475 96 0.201979 462 101 0.221980 448 106 0.241981 487 112 0.231982 550 119 0.221983 568 122 0.211984 483 121 0.251985 326 117 0.361986 341 112 0.331987 359 108 0.301988 395 108 0.271989 384 108 0.281990 377 107 0.281991 374 107 0.291992 354 107 0.301993 332 101 0.301994 313 97 0.311995 302 95 0.321996 296 95 0.321997 268 94 0.351998 244 91 0.371999 216 88 0.412000 172 88 0.51
Source: United States Department of Agriculture. Foreign Agriculture Service GAIN Reports (various years). http://www.fas.usda.gov/scriptsw/attacherep/default.aspttp://

24
in a contract signed before the start of the marketing year (OJ L 297 21.11.96). Beginning
in 1995, portions of the contract amount were between a processor and a producer
organization.2 The share contracted with individual growers was gradually reduced from
1995 to 2000. For example, in the 2000/01 marketing year, 25 percent of the tomatoes
were still contracted from individual growers (OJ L 297 21.11.96).
The EU minimum price was based upon the minimum price in the previous year
and movement of an index of prices in the fruit and vegetable sector (OJ L 297 21.11.96).
The minimum price was approximately 95 ECU per ton of raw tomatoes for several
years: 96.94 ECU per ton in the 1994 marketing year, 95.49 ECU per ton in the 1995 and
1996 marketing years and 93.58 ECU per ton in the 1997 marketing year (EU Secretariat,
1997). For the 1998 marketing year it fell to 90.77 ECU per ton and was 88 euro per ton
in both 1999 and 2000. Figure 2 also illustrates the amount and the pattern for the EU
minimum price from 1978 to 1999. Table 3 provides the yearly data for the minimum
price.
2 In Italy, France, Spain and parts of Greece, a producer organization consisted of either:
40 members and 1.5 million ECU of production, 15 members and 2.5 million ECU or 5
members with 3 million ECU of production. (OJ L 62 4.3.97) These requirements were
relaxed for Portugal and other parts of Greece: 15 members and 0.5 million ECU or 5
members and 1 million ECU (OJ L 62 4.3.97).

25
3.2.1.3 Entitlement quota
There was a limit on the quantity of tomatoes eligible for the processor aid. This
was neither a production nor a marketing quota. We refer to it as an entitlement quota
because it entitled the holder to receive the subsidy and required the holder to pay the
minimum price on this quantity of tomatoes. This quota has analytical similarities to
California dairy quota analyzed by Sumner and Wolf (1996), but also has a number of
differences.
The entitlement quota was allocated to processed products, to EU countries and
then to processors within each country. In Table 1 we included the quota allocations for
each country between 1997 and 2000. We also included a ratio describing the proportion
of production within the quota allocation. In 1997 three countries were producing less
than quota and in 2000 none of the countries were producing less than quota.
Table 4 outlines the breakdown of entitlement quota distribution in 1988 and
1998. The entitlement quota was distributed based upon past production of raw tomatoes
used for certain processed products. In 1997 and 1998 the aggregate EU entitlement
quota was limited to 6,836,000 tons of raw tomatoes for processing (OJ L 297 21.11.96).
In 1999 and 2000 the total quota entitlement was slightly higher at approximately
6,852,000 and 6,865,000 tons.
The total amount of entitlement quota in the EU was adjusted periodically. In
addition, the amount of entitlement quota in each country for each product was adjusted
annually in cases where it was greater or less than production. In 1998 the total EU
entitlement quota was distributed as follows: tomato paste at 4,585,253 tons (67 percent),

26
Table 4. EU processing tomato quota allocation by country and product
Country 1988 1998Quota Allocation (000 tons)
Italy 3,293.9 (54%) 3,471.8 (51%)Greece 1,013.6 (17%) 1,048.9 (15%)Spain 667.0 (11%) 1,006.4 (15%)Portugal 694.7 (12%) 939.5 (14%)France 392.4 (6%) 369.6 (5%) Total 6,061.6 6,836.2
Product
Paste 3,958.6 (65%) 4,585.2 (67%)Whole Peeled Canned 1,487.2 (25%) 1,321.1 (19%)Other 615.8 (10%) 929.9 (14%) Total 6,061.6 6,836.2
Source: United States Department of Agriculture. Foreign Agriculture Service GAIN Reports (various years). http://www.fas.usda.gov/scriptsw/attacherep/default.aspttp://

27
whole peeled canned tomato products at 1,321,119 tons (19 percent), and all other
processed tomato products at 929,890 tons (14 percent) (OJ L 303 6.11.97).
The product entitlement quotas were distributed among the five processed tomato-
producing countries in the EU and then redistributed each year based on a moving
average of the previous three years’ production in compliance with minimum prices (OJ
L 297 21.11.96). National and product allocations did not vary more than 10 percent
from one year to the next (OJ L 297 21.11.96). Reallocation of the entitlement quota was
controversial. In 1997 Portugal lost quota due to below average production. During the
Agenda 2000 CAP Reform negotiations Portugal was reported to have obtained a verbal
agreement that their quota would not be reduced. However, Portugal did lose
approximately 60,000 tons of quota in 1999 and 2000 (USDA/FAS/PO0018 p. 2).
Entitlement quotas were attached to processing facilities within each country.
When a processing facility changed hands, the quota associated with it remained
associated with that facility and was transferred to the new owners (OJ L 100 17.4.97).
In cases where the processor owned multiple plants (with entitlement quota) a
proportional amount of the entitlement quota was transferred with the facility (OJ L 100
17.4.97). Also, processors could not transfer ownership to entitlement quota rights
without transferring ownership of the plant (OJ L 100 17.4.97).
At least 2 percent of each country’s entitlement quota allocation was reserved to
allocate to new processors (OJ L 100 17.4.97). New processors received entitlement
quota based on the amount of processing tomatoes that were bought at the minmum price
in the previous season (OJ L 100 17.4.97). The EU rules stated that if the total
entitlement quota was not allocated between existing and new processors as shown by the

28
preliminary contracts, the remaining entitlement quota was allocated to processors that
were able to use it (OJ L 100 17.4.97).
The reallocation of quota among processors was made proportional to the quantity
of tomatoes purchased at the minimum price, relative to a processor’s quota. The total
entitlement quota was fixed for periods of approximately 4 to 6 years. Prior to 1996, the
European Commission would periodically review (and increase) the processing tomato
entitlement quota (this was done in 1984, 1990 and 1992).
The EU policy used prior to 2001 required a minimum price to be paid on
tomatoes used to make products for which the processor aid was paid. Many processors
exceeded this quantity and produced manufactured tomato products for which no aid was
received. There was no minimum price required on these additional tomatoes. In
reporting contracts to the European Commission, processors were required to show that
they paid at least the minimum price for quota tomatoes. Processors also had an
incentive to pay the minimum price on some additional tomatoes in order to be eligible
for more reallocated quota.
The total budget cost for the production aid of processing tomatoes was 328
million ECU in 1998. Appropriations for production aid in 1999 and 2000 were 317 and
269 million euro (USDA/FAS/E20032). The budget cost for 1998 and the appropriations
in 1999 and 2000 did not include the cost of the export subsidies.
Table 5 provides an approximate breakdown of the budget costs for production
aid for each EU member country that produced processing tomatoes in 1998.

29
Table 5. Estimated EU budget costs from processor aid transfers for all processed tomato products in 1998.
Country Product Quota Quantity(tons of tomatoes)
Processor Aid (ECU per ton of
processed product)
Conversion (units tomatoes per units
processed product)a
Processor Aid (ECU per ton of
tomatoes)
Total Budget Cost
(000 ECU)Italy Paste 1,758,500 244 6.5 37.5 65,950
Whole Peeled Canned 1,090,500 92 1.3 70.7 77,098Other 622,800 55 1.6 34.4 21,424
Total Italy 3,471,800 164,472Greece Paste 999,400 244 6.2 39.4 39,376
Whole Peeled Canned 17,300 92 1.25 73.6 1,273Other 32,100 55 1.6 34.4 1,104
Total Greece 1,048,800 41,753Spain Paste 664,000 244 5.6 43.6 28,950
Whole Peeled Canned 166,600 92 1.2 76.7 12,778Other 175,800 55 1.6 34.4 6,047
Total Spain 1,006,400 47,775Portugal Paste 884,600 244 6.2 39.4 34,853
Whole Peeled Canned 10,600 92 1.25 73.6 780Other 44,300 55 1.6 34.4 1,524
Total Por tugal 939,500 37,157France Paste 278,700 244 6.2 39.4 10,980
Whole Peeled Canned 36,100 92 1.25 73.6 2,657Other 54,800 55 1.6 34.4 1,885
Total France 369,600 15,522Total EU 6,836,100 306,679b
Total EU in thousand USD equivalent (where 1.11 USD=1 ECU in 1998) 337,347
a The conversion rates for Italy and Spain (paste and whole peeled canned) were taken from USDA/FAS/SP9027 and USDA/FAS/IT9024. The conversion rates for the other countries are not reported in the respective GAIN reports and were estimated here. The conversion rate for “Other” was provided by Mark Evans of Morningstar Company as an approximation.
b This figure is the sum of the estimated budget costs by country and product. The actual budget cost in 1998 was 328 million ECU.

30
These budget costs were based on the entitlement quota quantities (in tomato units),
processor aid payments (processed product units) and approximate conversion rates for
processed products. Table 5 reports approximate budget costs of the production aid for
each member country in the EU that produced processing tomatoes in 1998. There are
sixteen categories of processed tomato products that received production aid in the EU.
The main two categories are paste and whole, peeled canned tomatoes. Following data
provided in USDA FAS reports we aggregated the remaining fourteen categories into
“other”. The production aid for the “other” category is estimated and we expect that this
accounts for much of the difference between our estimated budget costs and the actual
budget costs. The estimated budget cost reported in Table 5 is approximately 307 million
ECU whereas the actual budget cost (as reported in USDA/FAS/E20032) in 1998 was
328 million ECU.
Table 6 provides estimates of EU budget costs in 1986 and 1992. Table 6 also
provides an estimate of the “average” processor aid payment (average for all processed
tomato products) in 1999 and 2000.
3.3 Domestic program as of 2001
On November 21, 2000 the EU approved the changes for the domestic program in
the processing tomato industry that had been formally proposed several months earlier.
We have not seen detailed regulations for the new policy; our analysis is based on
information from European Commission #2000/0191, European Commission IP/00/772,
and industry sources.

31
Table 6. Estimated EU processing tomato aid budget costs and components: Selected years
Year EU Budget Costs
(million ECU/euro)
Total Processing Tomato Quota (million tons)
Processor Aid per ton of Tomato Paste Equivalent
(million ECU/euro)1986 415a 6.1 3411992 470a 6.6 3541998 328.3 6.8 2441999 317 6.9 233b
2000 269 6.9 198b
Source: United States Department of Agriculture. Foreign Agriculture Service GAIN Reports including USDA/FAS/E20032. http://www.fas.usda.gov/scriptsw/attacherep/default.aspttp://
a Implied EU budget costs in 1986 and 1992 are calculated from data on processor aid payments and quota quantities in 1986 and 1992 using an aggregate conversion rate of 0.2 units of processed tomato product for each unit of tomatoes.
b Implied processor aid per metric ton of tomato paste equivalent for 1999 and 2000. This was calculated from data on the EU budget costs and quota using an aggregate conversion of 0.2 units of processed product for each unit of tomatoes. The actual processor aid for tomato paste in 1999 was 216 euro per ton and 172 euro per ton in 2000. Using the actual processor aid (and an aggregate conversion rate of 0.2) the implied budget costs are 298.1 million euro for 1999 and 237.4 million euro in 2000.

32
The new program changed the format of the administration of the domestic
policies in the processed tomato industry in the EU. Under the changes, the production
subsidy is provided directly to the growers via producer organizations rather than to
processors. Under the new program the processors no longer receive the processor aid
per unit of processed product, processors no longer must pay growers the minimum price
for the quota quantity and the entitlement quota has been eliminated. Instead, growers
are paid a producer aid on each ton of tomatoes that is shipped to processors. Our EU
sources use the term “producer aid” and we will refer to it as a per-unit grower subsidy.
The new program lists a threshold quantity that applies to each country.
According to current plans, in order to be eligible to receive the full planned per-unit
grower subsidy in subsequent years, production in a country must not exceed the
threshold quantity in the current year. That is, if production exceeds the threshold
quantity for a country in the current year, the per-unit subsidy to growers in that country
will decrease the following year (European Commission 2000/0191 p. 10-4).
The threshold quantities and per-unit grower subsidies are set for each country in
the EU that produces processing tomatoes (see Table 7). For comparison, Table 7 also
includes the processing tomato production and quota entitlement in 2000. The EU per-
unit grower subsidy is set at 34.50 euro for 2001 (USDA/FAS/E20144). The proposed
regulations in July, 2000 (European Commission 2000/0191) state that approximately 9
percent of the grower subsidy will be held back for the first year of operation. If
production does not exceed the threshold quantity in that first year then the final 9
percent will be paid to growers. The 2001 subsidy rate would apply in subsequent years
if production does not exceed the threshold quantity in that country in 2001. We did not

33
find this part of the plan in the more recent descriptions of the program to be applied in
2001. It is not clear if the EU still plans to hold back part of the grower subsidy in 2001.
In the simulations in Section 6 we assume that the full 34.50 euro is paid to growers in
2001 on all production.
The data in Table 7 was used to construct two ratio measures (in the final two
columns): a ratio of the threshold quantity (2001) to entitlement quota (2000) and a ratio
of threshold quantity to production (2000). These ratios offer a comparative description
of the change from the old policy to the new policy. The threshold to quota ratios for
Italy, Spain and Portugal are higher than the EU average of 1.20; the Greek ratio is much
lower and the French ratio is much higher. The total EU threshold quantity for 2001 is
slightly below total EU production in 2000. However, the threshold for 2001 is far above
year 2000 production in France and Portugal and well below year 2000 production in
Greece and Spain.
It is not clear how threshold quantities were allocated to the five EU member
countries that produce processing tomatoes. However, the policy states that countries
with production exceeding threshold quantity will receive less producer aid in subsequent
years. Using past production figures, it appears that Italy, Greece and Spain are more
likely to exceed their current threshold limits than Portugal and France.
It is not obvious how the introduction of new domestic program will change the
total EU budget costs from those under the previous program. The EU appropriation for
the processed tomato program for 2000 was 269 million euro (USDA/FAS/E20032),
however, we would expect actual budget costs to have been less due to a significant
decrease in the processor aid for 2000. If the per-unit subsidy is paid on the threshold

34
Table 7. Processed tomato production, quota entitlements,threshold quantities in the EU, and their ratios
Country Production2000
Entitlement Quota
2000
Threshold Quantity
2001
Ratio of Threshold
to Quota
Ratio of Threshold to
Production(all quantities are thousand metric tons) (percent)
Italy 4,400 3,609 4,350 1.21 0.99
Greece 1,290 1,078 1,211 1.12 0.94
Spain 1,382 1,012 1,238 1.22 0.90
Por tugal 970 867 1,050 1.21 1.08
France 330 299 401 1.34 1.22
Total 8,372 6,865 8,250 1.20 0.99
Source: Production and quota data from USDA/FAS/GAIN Reports. Various years. Threshold quantity data is from USDA/FAS/E20144.

35
quantity in 2001, the budget cost will be approximately 285 million euro. Later, we show
that production is likely to exceed the threshold in 2001 and therefore EU outlays will be
even higher than 285 million euro. These projected budget costs for 2001 indicate that
outlays in 2001 may be significantly more under the new program than under the old
program.
36
4 Effects of elimination of EU trade polices
The EU is both a major exporter of processed tomato products and a significant
import market. The domestic policies and the trade policies affect both imports and
exports. This section assesses the production effects that would result from removal of
the trade policies in the EU processed tomato industry. The export subsidy and the ad
valorem tariff were described earlier. In this section a conceptual/illustrative model is
developed and used to describe the effects from removing each of the trade policies.
Second, the conceptual model is combined with data from the EU to simulate the
magnitude of the effects from removing the trade policies in the EU processed tomato
industry.
Many of the parameters used in our analysis are not known with certainty in this
report and our simulation results depend on the parameters that were selected.
Specifically, our results are subject to the specification of EU production in the
differentiated markets, EU exports and imports, share of exports that receive the export
subsidy, and demand and supply elasticities for various products/markets. A complete
sensitivity analysis would include a range for each of these parameters. Nonetheless, we
do not include a range of parameters or a sensitivity analysis with our simulation results
of removing the trade barriers. Including this analysis is a subject for further research.
4.1 Estimated effects from removal of the expor t subsidy
As noted in Section 3 the export subsidy for processed tomato products was
limited to a maximum 134,950 tons of canned tomato products during the 2000/01
marketing year. We do not expect that the export subsidy was applied to the 134,950
37
tons of canned tomato products, however, we do not know the actual tonnage and we use
this quantity in our analysis to represent the upper bound case. Our analysis examines the
effects of removing the 45 euro per ton export subsidy on 134,950 tons of product in the
EU processed tomato industry.
Total annual production of canned tomato products is approximately 2 million
tons in the EU and thus the export subsidy only applies to about 6.7 percent of this
supply. Canned tomato products use approximately 30 percent of the total quantity of
tomatoes used for all processing tomato products in the EU. Therefore the export subsidy
is applied to a small proportion of all processed tomato products (approximately 2
percent) and the overall effect of this subsidy within the EU must be small in aggregate.
Further, because the export subsidy is approximately 45 euro per ton of canned tomato
products and the average export price is about 530 euro per ton (USDA/FAS/IT0020), the
rate of subsidy is less than 10 percent. We use a subsidy of 8.5 percent in our analysis.
We analyze the effects of this policy with the simplest possible framework. Our
framework assumes that the EU-produced canned tomato products are differentiated from
other processed tomato products in the EU and differentiated from processed tomato
products produced elsewhere. We allow that the canned tomato products produced in the
EU may be sold in the EU or exported. We ignore the potential for imports of canned
tomato products to the EU.
Figure 3 describes the effects of removing the export subsidy from the market for
EU-produced canned tomato products. Figure 3 separates the demand for EU-produced
canned tomato products into three groups: demand in the EU, demand in the subsidized
markets in the rest of the world and demand in the non-subsidized markets in the rest of

38
Figure 3. Effects of removing the EU expor t subsidy for canned
tomato products
Market for EU-produced canned tomato products
DRS (6.7%)*
DRNS (5.8%)DEU (87.5%)
DRS+RNS+EU
Quantity
Price
SRS+RNS+EU
*Note: This illustration is not to scale as the subsidized exports only account for 6.7% of the total market.
The superscript refers to the location of consumption. RS refers to rest of the world with an export subsidy and RNS refers to rest of the world with no export subsidy. Removal of the export subsidy decreases price by 0.59 percent and decreases total production by 0.29 percent of EU-produced canned tomato products.
PSPNS
QNS QS

39
the world. The superscript notation in the figure is as follows: EU is the European Union,
RS is rest of the world with the export subsidy, and RNS is rest of the world with no
export subsidy. In the figure, DRS refers to the demand for EU-produced canned tomato
products in the subsidized export market and DRNS refers to the demand in the rest of the
world that is not subsidized. The demand curve labeled DEU refers to the demand for EU-
produced canned tomato products in the EU. The horizontal sum of these is the total
demand for EU-produced canned tomato products. Removal of the export subsidy would
effectively shift back the demand curve only in the subsidized export market. In turn, the
total demand shifts back, the price falls and total production in the EU falls. The full
calculation of the price and production effects from the removal of the export subsidy is
presented in Appendix A1.
We use data from 1998 to simulate the production effect of removing the export
subsidy. Exports of canned tomato products to non-EU countries are approximately
250,000 tons and total production of canned tomato products is approximately 2 million
tons. The subsidized portion of the exports is approximately 135,000 tons. Therefore,
the total export share is 12.5 percent and the domestic consumption share is 87.5 percent.
Within the 250,000 tons that are exported, 135,000 tons receive an export subsidy, thus
6.7 percent of total EU exports of canned tomato products receive the export subsidy.
Allowing for EU-produced canned tomato products to have considerable product
differentiation in the world market and limited substitution with other goods we use an
aggregate demand elasticity of –0.5. Given that demand for these EU-produced products
is more elastic in non-EU markets we assume that the demand elasticity is –1.0 in the rest
of the world and –0.4 in the EU. We also expect that EU-produced canned tomato

40
products have a relatively inelastic supply; to reflect this we use a low supply elasticity
(0.5) in our analysis.
With these parameters the removal of the export subsidy would result in a
decrease in the price of canned tomato products (0.59 percent) and a decrease in the total
EU-production of canned tomato products (0.29 percent). The model used to calculate
the percentage changes is presented in equations A.1.1a to A.1.1e in Appendix A1. The
percentage change in the quantity of all processed tomato products will be approximately
–0.09 percent because the canned tomato products only use 30 percent of all processing
tomatoes in the EU.
Using the estimated percentage change in price, percentage change in quantity
and initial starting points for price and quantity we can calculate the welfare effects in the
EU from removing the export subsidy. We list the changes in welfare and the changes in
welfare relative to total revenue in the processed tomato industry in Table 8. Total
revenue in the processed tomato industry is the value of all processing tomatoes in terms
of paste (1,260 million euro). From Figure 3 we note that removal of the export subsidy
decreases the price, decreases total quantity demanded, decreases demand in the
subsidized export market, increases demand in the EU market and increases demand in
the non-subsidized export market.
Removal of the export subsidy would lead to a lower price in the EU. The lower
price coupled with increased demand in the EU will increase consumer surplus (by 5.43
million euro). Likewise, the decreased price and decrease in total quantity demanded will
decrease producer surplus (by 6.19 million euro). The net consumer and producer
surplus in the EU decreases by 0.76 million euro, however, the tax cost associated with

41
Table 8 Pr ice, quantity and EU welfare effects from removal of the expor t subsidy for canned tomato products
Percentage Change in: Relative to all canned Tomato products
Relative to all processed tomato products
Price -0.59 -0.18
Total EU quantity demanded
-0.29 -0.09
Quantity demanded in EU market
0.23 0.08
Quantity demanded in subsidized export market
-7.92 -0.63
Quantity demanded in non-subsidized export market
0.59 0.04
Total quantity demanded in the export market
-3.97 -0.57
EU welfare measures Change in EU welfare
(million euro)
Change relative to total industry revenue for all
processed tomato products (% )
Consumer Surplus 5.43 0.43
Producer Surplus -6.19 0.49
Taxpayer Surplusa 6.08 0.48
Total EU Surplus 5.32 0.42
a We do not consider here the potential deadweight loss associated with raising tax revenue. These additional losses would add about 20 percent to this figure.

42
the export subsidy (6.08 million euro) is eliminated. Thus, overall welfare in the EU
would increase by 5.32 million euro if the export subsidy (applied to 135,000 tons) were
removed. The relative change in EU welfare is small; if the export subsidy was removed,
the change in total EU welfare relative to the total industry revenue for processed tomato
products would be 0.42 percent.
Although the aggregate effect is quite small, this does not mean that the removal
of the export subsidy is insignificant in all markets and for all processors. The export
subsidy provides approximately 6 million euro annually to selected exporters to facilitate
selected export sales and this certainly affects sales in those specific cases.
4.2 Effects from removal of the tar iff
The import tariff for processed tomato products is 14.4 percent in 2001 in
accordance with the Uruguay Round Agreement. Such a tariff is significant and allows
EU market prices to remain above the internationally traded prices for processed tomato
products of similar characteristics. However, analysis of the impact of the tariff is
complicated by the differentiated nature of the world market for processed tomato
products.
There is considerable evidence from trade flow and price data that the market for
tomato paste (the most standardized product) may itself be differentiated by product
characteristics, origin, transport costs and season. The EU is both an importer and an
exporter and has an average export price higher than its average import price (Table 2).
This situation is not uncommon and has been modeled, for example, see Armington
(1969) and in the case of wheat markets by several authors including Johnson, Grennes

43
and Thursby (1978), Alston, Carter, Gray and Sumner (1997) and Alston, Gray and
Sumner (1994).
As noted in Section 3, there is evidence that some proportion of the imported
tomato paste is reprocessed or blended and re-exported with a refund of the import duty.
So the tariff does not apply to these imports. However, we do not have data on the extent
of the refund. Further, we do not have access to data on EU imports that arrive duty-free
or with reduced duties from countries with preferential access.
In general, a lower EU tariff would increase imports, decrease EU internal market
prices, decrease EU production and decrease EU net exports. We present a simulation
that attempts to quantify the effects of the import tariff.
Our simulation assumes that there is a single processed tomato product consumed
in the EU; some of it is produced in the EU for use in the EU and some is produced
elsewhere for the EU market. The tariff is applied to the imports that are entering the
domestic market.
The EU consumption market is differentiated from the processed tomato products
that are consumed elsewhere. In particular the EU produces a differentiated product for
export. The advantage of the simulation exercise used in this analysis is that it provides a
simple and tractable view of the effect of the tariff policy.
4.2.1 Simulation of the tar iff removal
Consider the EU consumer market for processed tomatoes as one that includes
two different products (see Figure 4), one produced in the EU and the other produced in
the rest of the world (denoted EU and R respectively). We present a model in Appendix

44
Figure 4. Effects of removing the ad valorem tar iff
SRT (8%)*
SEU (90%)
SEU+RT+RNT
Quantity
* Note: This illustration is not to scale as the tariff is only applied the import share that actually pays the duty; we estimate that this is approximately 8% of the total market.
The superscript refers to location of production; EU and R refer to the EU and the rest of the world respectively. The RT and RNT notation refers to the rest of the world with a tariff and with no tariff respectively.
Market for processed tomato products consumed in the EU
Price
DEU
QT QNT
PT
PNT
SRNT (2%)

45
A1 that describes the effect of removing the tariff. Our results show the percentage
change in EU price and production for the removal of the tariff under a given set of
parameters.
In Figure 4 the supply of processed tomato products in the EU market with the
tariff applied is the horizontal sum of SEU (supply from the EU), SRT (supply from the rest
of the world with the tariff applied) and SRNT (supply from the rest of the world with no
tariff applied). This simple approach treats the internal EU market as separate from the
market for EU exports.
The EU imports a small share of the processed tomato products that are consumed
in the EU. Additionally, the EU imports a very small share of total processed tomato
products that could be sold and consumed in the EU market. We estimate that the EU
imports less than 5 percent of all processed tomato products that could be imported into
the EU. For these reasons, we assume that the EU is a small importer of the processed
tomato products that are imported into the EU. This assumption indicates that the supply
of these products from the rest of the world is completely elastic; this is approximately
true and is used because it simplifies our analysis.
Under the small-country assumption, we treat the tariff as a policy that increased
the price in this market by the same percentage as the ad valorem tariff rate. In this case,
PT = PNT*(1+τ), where (1+τ) is equal to 1.144 for a 14.4 percent tariff. Removal of the
tariff will decrease the price of processed tomato products that are consumed in the EU
and increase the quantity consumed in the EU.
Using a plausible set of parameters for the supply elasticity, demand elasticity and
the proportion of processed tomato products from each market we can estimate the

46
production effects from the removal of the tariff. Using production and trade data from
1998, we estimate that the total imported share of processed tomato products in the EU
consumption market is approximately 10 percent. Imports of paste from non-EU
countries are approximately 600,000 tons (tomato units). The EU also imports a small
amount of canned tomato products and some “other tomato products” such as ketchup
and tomato sauce. Total consumption is estimated to be approximately 6 million tons
(given production of 8.4 million tons and exports of 2.4 million tons in tomato equivalent
production of processed tomato products). Therefore we use 10 percent as an
approximation for the total EU imported share. Of course, some imports that are re-
exported receive a duty drawback and some imports are not subject to the tariff due to
preferential trade agreements. Therefore, imports that actually paid the duty will be less
than 10 percent. Based on discussions with industry sources we estimate that about 20
percent of imports do not pay the duty. Therefore, 80 percent of total imports pay the
duty, implying 8 percent of the total supply in the EU pays the duty. This implies that 2
percent of the supply in the EU is imported duty-free and the remaining 90 percent is
produced domestically.
We note that imports that receive the duty drawback and are re-exported should
not be included in the quantity consumed in the EU. In our analysis, the duty drawback
only accounts for 1 percent of the total quantity consumed in the EU. Therefore actual
quantity consumed in the EU is 6 million tons less the 60,000 tons that are re-exported
under the duty-drawback. Since our estimate of the amount that is re-exported is
relatively small, we leave the quantity consumed in the EU at 6 million tons for
simplicity.

47
Our simulation calculates the effects of the removal of a 14.4 percent ad valorem
tariff where imports that pay the duty are 8 percent of the domestic market. We use a
demand elasticity of –0.5 that there are no close substitutes for processed tomato products
in the EU. The price elasticity of supply for the total supply of processed tomato
products in the EU market is 0.5. Following the assumption that the EU is a small
importer of processed tomato products, supply from the rest of the world is much more
elastic than that from the EU. Therefore, the price elasticity of supply for production
from the EU is less than 0.5; in our analysis we set the price elasticity of supply from the
EU at 0.4. The model included in Appendix A1 describes how the percentage change in
production and price was determined.
As shown in Table 9, removal of the tariff reduces the price of processed tomato
products in the EU by 12.6 percent and increases the total quantity of processed tomato
products in the EU by approximately 6.3 percent. Quantity of EU-produced processed
tomato products in the EU market decrease by 5.04 percent.
We list the EU welfare effects and the welfare effects relative to total revenue due
to the removal of the tariff in Table 9. Elimination of the tariff would decrease the price
in the EU and increase the total quantity consumed in the EU. The quantity of processed
tomato products produced and consumed in the EU falls while the quantity of processed
tomato products that are imported into the EU market increases by approximately 108
percent. The increase in the quantity imported into the EU is relative to the import share
prior to our simulation that examined the effects of removing the tariff.

48
Table 9 Pr ice, quantity and EU welfare effects from removal of the 14.4 percent impor t tar iff
Percentage Change in: Relative to all processed tomato products
Price -12.6
Total EU quantity Demanded
6.3
Quantity supplied from EU market
-5.0
Quantity supplied from import market
108.4
EU welfare measures Change in EU welfare(million euro)
Change relative to total EU industry revenue (% )
Consumer Surplus 116.9 9.3
Producer Surplus -99.4 7.9
Taxpayer Surplusa -11.3 0.9
Total EU Surplus 6.2 0.5
a This loss in tariff revenue would be larger if we included the deadweight cost of alternative sources of government revenue.

49
In the EU, elimination of the tariff would result in a lower price for consumers
and producers. The EU would consume more, produce less and no longer receive the
tariff revenue. Consumer surplus in the EU increases by 116.9 million euro due to the
lower price and increased consumption. The reduced price and decrease in supply from
EU producers would decrease EU producer surplus by 99.4 million euro. The net surplus
to EU consumers and producers would increase by 17.5 million euro, however, there
would be a loss in tariff revenue when the tariff is removed. Overall, elimination of the
tariff increases welfare in the EU by 6.2 million euro.
By lowering the internal market price for processed tomato products and reducing
production in the EU, elimination of the import tariff would also place pressure on the
EU domestic subsidy policy. The EU policy for the past decade has been to reduce rather
than increase support in this industry. Following this pattern, the EU would find it
difficult to preserve production levels or producer welfare with increased domestic
support.
A final caveat is appropriate. In our analysis we estimated that only 80 percent of
imports pay the import tariff and the other 20 percent enter the EU duty free (or receive a
duty drawback). Since we do not have data on quantity for which the duty drawback
applies, it is possible that it applies to a more significant share of imports. In the extreme
case whereby almost all imports receive a duty drawback, the overall effects of tariff
elimination would be very small.
4.3 Summary of the effects of removing the trade policies
The EU export subsidy is applied to a small part of total production and affects

50
the competitiveness only in the specific markets where it applies. We estimate that the
removal of the export subsidy will decrease canned tomato production by approximately
0.29 percent and decrease total processed tomato production by 0.09 percent.
The tariff is a more significant policy for EU production and trade. We calculate
that if the 14.4 percent import tariff were removed the EU price of processed tomato
products would fall by about 12.6 percent. EU production would fall by about 5 percent
and overall sales in the EU would increase by 6.3 percent.

51
5 Analysis of the effects of EU domestic programs for processed tomatoes
The purpose of this section is to describe the effects of domestic programs used in
the processed tomato industry in the EU in qualitative terms. We compare the current
program that was instituted in 2001 to both the previous program that was in place
through 2000 and to a no-subsidy option. We use a series of figures that highlight the
main effects qualitatively and include supporting equations in Appendix A2. Section 6
presents simulations that quantify these effects.
5.1 Analysis of EU domestic programs used pr ior to 2001
The domestic program that was in place prior to 2001 included processor aid,
minimum grower price, and entitlement quota. The effects of such a program vary
depending on marginal costs of production.
Figure 5 illustrates the production effects of the minimum price and quota
program features for three marginal cost conditions. Three marginal cost functions were
used to represent the variety of costs for producing processing tomatoes within the EU.
One region produced more than the quota entitlement, another region produced the quota
entitlement, and the third region produced less than the quota entitlement.
The minimum price set by the EU, denoted Pmin, was the effective price facing
growers out to the quota quantity. With the minimum price shown in Figure 5, growers
with high marginal cost (MCH) produced less than their eligible quota designated by the
point Quota on the horizontal axis. Output of these growers was therefore invariant to
moderate changes in the market price (shown as Pmarket) but did respond to adjustments
in the minimum price.

52
Price of EUtomatoes
MCH
MCM
MCL
Pmin
Pmarket
QuotaQuantity of Tomatoes for Processing
Figure 5. Effects of EU minimum pr ice and quota on tomato growerswith high, medium and low marginal costs
Processing Tomatoes

53
The marginal costs of growers with medium marginal costs (MCM) cut the
vertical line segment (that represents quota) below Pmin and above Pmarket. At the
quota quantity these marginal costs were below Pmin and above Pmarket. Their tomato
output did not respond to moderate changes in either the market price or the minimum
price, but did respond to a change in the quota quantity.
Finally, producers in the region with low marginal costs, MCL, have costs that
were below Pmarket at the quota quantity. Their production of processing tomatoes
responded to market prices, but their output was unaffected by changes in the policy
parameters.
Aggregate data and informal evidence from industry observers suggest that there
were significant groups of producers in all these cost categories.
Figure 5 can be used to consider how the aggregate production of processing
tomatoes would respond to policy changes. Using this model, elimination of the
minimum price and quota policy would cause a grower with high marginal cost to leave
the industry, would cause a grower with medium marginal cost to decrease output and
would leave output of a grower in the low-cost region unchanged. In practice, the quota
is assigned to tomato processors rather than growers of processing tomatoes. Therefore,
next we examine the effects of the domestic program that was used prior to 2001 in the
processed tomato market.
Figure 6 illustrates the effects of the EU domestic policy (prior to 2001) for
processors. In this figure the bold line is the effective net-of-policy marginal cost of
production for processors. The domestic program affected the net marginal costs for
quantities less than the quota. With no domestic program, the dashed line represents

54
Figure 6. Effect of EU minimum pr ice, processor aid and quota on atypical processor of manufactured tomato products
PriceEcu/Ton
MPML Quota MPMHQuantity of manufactured tomato products (M)
Processor Aid
PmarketH
MC - Payment
MC
PmarketM
PmarketL
Manufactured Tomato Products

55
marginal costs for quantities less than the quota. Since processors received the processor
aid for quantities less than the quota, their marginal costs decreased to (MC-Payment) for
that quantity.
The policy included a minimum price for growers and direct aid for processors.
The processor aid reduced the effective or net marginal costs of buying and processing
tomatoes.
The relevant marginal cost curve for determining production in the processed
tomato product market for quantities that were less than quota is the upward sloping line
segment labeled MC - Payment. Otherwise, the relevant marginal cost curve for
determining production (greater than quota) is simply MC.
Figure 6 shows that with a high market price of processed tomato products
(PmarketH), processors would have produced quantity MPMH (M denotes manufactured
tomato product) where MC equals PmarketH. If market prices were this high, the policy
instruments did not affect quantity of output. However, with PmarketM processors
produced only the quota quantity of manufactured tomato products. These processors
produced the quota quantity of manufactured tomato products because the marginal cost
for exceeding quota was above PmarketM and the net-of-payment marginal cost for
production below quota was below PmarketM. Finally, at the lowest market price
(PmarketL) processors would have produced only MPML where the PmarketL crosses the
line segment MC - Payment.
We may also use Figure 6 to show that at the two lower prices, output for
processors was larger with the domestic program than it would have been without the
program. At the medium price and with no policy, output would have been below the

56
quota quantity. Under these conditions quantity would have been found at the point
where PmarketM intersects MC. At the low price, processors would have ceased
production altogether because MC was above PmarketL for all positive output quantities.
Therefore a lowering in payments made to processors would reduce EU processed tomato
output below the level that existed under the policy.
Figures 5 and Figure 6 show the main economic reasoning behind our assessment
that the EU internal subsidy policy as it existed prior to 2001 did stimulate EU
production. We show that for some producers and processors production was stimulated
even though the policy applied to an aggregate fixed quantity of production that is less
than total EU output. These figures also show that the policies kept relatively inefficient
growers and processors in tomato production rather than moving to the economic
activities for which their resources were better suited.
5.1.1 Three models to descr ibe the EU domestic program used pr ior to 2001
In this section consider effects on growers and processors under the following
three alternative interpretations (or models) of the EU domestic program that was in place
prior to 2001.
1. The quota limit on payments and minimum price requirements was not binding in
aggregate, therefore the policy acted as a lump sum payment distributed on an infra-
marginal basis. The first model provides a benchmark for considering the more
complex situation in which different growers, processors and regions differed in
policy effects.

57
2. The quota limit on payments and the minimum price requirements applied differently
for three groups of processors (or three regions) depending on marginal costs. One
region produced above the quota, one region produced at the quota and one region
produced below their quota.
The final policy interpretation builds on the previous interpretation.
3. In the low-cost region there were contracts from processors to growers that set a
delivered quantity and an average or pooled price for all tomatoes (quota tomatoes
and non-quota tomatoes).
Each interpretation will be described below and is supported with illustrations in section
5.1.2 and mathematical models in Appendix A2. Our assessment is that the third
interpretation provides the best approximation of how the program actually operated.
5.1.2 Development of the illustrative models used to assess the production effects
For each of the three models outlined above we used a fixed proportions model to
describe the process of converting tomatoes into final tomato products (see Alston et al.
1995 for further details regarding fixed proportion models). The production of processed
tomatoes includes two inputs (tomatoes and “other” inputs) and there is one aggregate
output (processed tomato products). This model is a simplification of the relationship
between these markets, however, it is a reasonable approximation for our purposes.
There is an upward sloping marginal cost curve in each input market. The
marginal cost for the processed product is derived as the vertical sum of the marginal
costs for raw tomatoes and the “other” input market (the “other” input refers to the

58
processing input). The derived demand for raw tomatoes is the difference between the
demand for the processed tomato product and the supply of the “other” input.
Tomato units are converted to processed units throughout the analysis using a
conversion factor (k). The conversion factor between the tomato input and the
manufactured output is a well known and well documented parameter in this industry.
Figure 7 illustrates the marginal costs and demand for the two input markets and
the output market. For the illustrated case, production exceeds the quota, where the quota
is represented by the vertical line Q/k (or Q in the tomato input market). The purpose of
this illustration is to show the effects of the processor aid, quota and minimum price
policies that were used prior to 2001. The existence of processor aid decreased effective
marginal costs for the processing input and decreased the net costs for the processed
output by the same amount. The existence of a minimum price increased the price
received by growers and increased the costs of the processing input, with no net effect in
the output market. The existence of processor aid decreased net marginal costs in the
output market up to the quota quantity only (shown by the dashed line in the top panel of
Figure 7). The minimum price was paid to the growers (from the processing input) up to
the quota quantity. The minimum price increased marginal costs from the dashed line to
the bold line in the processing input market in Figure 7. The minimum price increased
the price that growers received for the quota quantity from Pmarket to Pmin and is shown
by the bold line in the bottom panel in Figure 7.
With no policy in place, the quantity of the manufactured tomato product,
processing input, and the tomato input are denoted M, O and T respectively (remember M

59
Figure 7. The pre-2001 EU processed tomato program with all production exceeding quota: Infra-marginal case
MCp
Dp
Manufactured Tomato Output
Price
Quantity
Other Processing Input
Price
Quantity
Q/k M* = M
Q/k O* = O
Q T* = T
MCt
MCo
Dt
Processing Tomato Input
Price
Quantity
Do
Pmin
Pmarket

60
is used to denote manufactured tomato product). Quantities with the domestic program in
place are denoted M*, O* and T*; Q is the quota quantity.
As noted earlier, Figure 7 is relevant for the case when all production exceeded
the quota. In this case the policy did not lead to higher tomato production. However, this
infra-marginal case does not capture the complexity of the EU subsidy program for
processing tomatoes. We therefore consider the EU policy as it would apply for three
separate groups of firms or regions. Each region has a distinct marginal cost for the
processed product and a local market for raw tomatoes. These hypothetical regions do
not necessarily correspond to geographical regions in the EU; it is likely that there were
some processors with high costs and others with low costs within each EU-member
country. The sum of these regions comprise the aggregate EU supply where the EU-wide
market price for the processed tomato product is determined.
In Figure 8 there are three marginal cost curves shown in the output market. The
three cost curves can be thought of as representing three regions. The differences in the
marginal cost curves could be due to differences in either costs of the raw tomato input or
the “other” input. The three marginal cost curves for the processed tomato product in
Figure 8 are each a vertical summation of the costs associated with the raw tomato input
and the other input (processing input) with the domestic policies in place. Quota in each
local market is labeled QH (high cost), QM (medium cost), QL (low cost).
The price shown in Figure 8 is the equilibrium price derived in the aggregate
market shown in Figure 9. At the price shown in Figure 8 the high-cost region produces
below its quota allocation, the mid-cost group produces at its quota level and the low-cost
61
Figure 8. Marginal costs for the manufactured tomato product market with regions producing under , at and above quota
MH QH /k QM/k=MM QL/k
P
ML
PriceMC high
MC mid
MC low
Quantity
Manufactured Tomato Product

62
Figure 9. Aggregate marginal costs for the EU manufactured tomato product market with quotas applied in each region
P
Price 1 2 3 4 5 6 7 8 9
Dm
Quantity0 M1 M2 M3 M4 M5 M6 M7 M8
MF M
Aggregate MC with program in place
Aggregate MC with no program
Aggregate Manufactured Tomato Product

63
region produces above its quota quantity. In this illustration only the low-cost region is
infra-marginal.
Figure 9 is the horizontal summation of the marginal costs in the three regions
(from Figure 8). The heavier line is the effective aggregate marginal cost curve. As the
processor aid is only applied on the quota allocation the effective aggregate marginal cost
has distinct segments or sections. The effective marginal cost sub-sections of Figure 9
are numbered 1 through 9. Each of these sub-sections had a unique specification of the
supply curve that was related to the position of each of the three regions relative to quota
for that region. These supply specifications are outlined in equations A2.2.1 through
A2.2.9 in Appendix A2.
From Figure 9 we can see the effect of removing the EU domestic policy regime.
The equilibrium position shifts from the intersection of the demand curve (Dm) and the
marginal cost curve (for the policy used prior to 2001) to the intersection of the demand
curve (Dm) with the no-program marginal cost curve. The no-program marginal cost
curve is the horizontal sum of no-program marginal costs in each region; in this case the
marginal costs in each region do not step down at the quota quantity. The quantity of
processed tomato product would fall from M to MF and the price of the processed tomato
product would rise accordingly. Eliminating the domestic program would affect each
region differently; elimination of the domestic program changes marginal costs and
changes the equilibrium price. In the medium and high-cost regions the shift to higher
marginal costs would decrease production; the shift to higher marginal costs in the low-
cost region would not affect production. The increase in price due to eliminating the
domestic program would increase production in all regions. The price effects would
64
offset part of the effects from higher net marginal costs in the high-cost and mid-cost
regions, however, overall production would be lower in both regions. The price effect
would increase production in the low-cost region.
The models illustrated so far assume that growers in the low-cost regions face two
distinct prices for tomatoes: the minimum price for in-quota tomatoes and a “free” price
for over-quota tomatoes. However, discussions with EU growers and processors
indicated that many processors in these regions did not actually pay two prices. Instead
the processors negotiated an average price or a pooled price to be paid on all tomatoes
used in processing.
According to industry sources, EU regulations do not preclude a pool-price offer
from processors in actual arrangements with growers. That is, a processor may report to
the regulators the minimum price on some large share of their total purchases and a very
low price for the remainder of their purchases to have complied with the EU quota rules.
But, growers actually contracted for an equal average price for all tomatoes delivered
under contract. In that way, growers had a stronger incentive to deliver the full quantity
required to keep the processor’s plant operating at capacity, while the processor pays the
same total outlay as if the two tier pricing were imposed.
Figure 10 illustrates the model that considers a pool-price arrangement in the
output market in the low-cost regionn that exceed quota production. In the low-cost
region, net marginal costs are lower for all quantities (not just the quota quantity) because
the benefits from the payment scheme are pooled over all production. In the low-cost
region, the net marginal cost curve approached the no-program marginal cost curve
asymptotically. Net marginal costs in the high-cost region and mid-cost, quota-

65
Figure 10. Marginal costs with pooled pr ice ar rangement in low-cost region
P
Price
Quantity Quota/k MpoolMC less processor aid payment
Pooled MC for over quota quantities
MC no program
Manufactured Tomato Product (low-cost region)
66
constrained region are the same as those illustrated in Figure 8.
Net marginal costs for the low-cost region are represented by the thick line in
Figure 10. The upper line represents the no-program marginal costs. Previously (Figure
9) the only effect on production in the low-cost region was due to the increased price; the
removal of the EU program had no effect on output in the low-cost region. Under this
interpretation, elimination of the EU program would have decreased production in the
high and mid cost regions (as it did under the previous interpretation) and it would have
also decreased production below Mpool in the low-cost region.
Using the pooled-price model in the low-cost region changes the aggregate supply
function illustrated in Figure 9. The difference between the program and no-program
marginal costs would be greater than it was in Figure 9 because the pooled marginal costs
in the low-cost region adds downward curvature to the aggregate marginal costs.
Additionally, the aggregate marginal costs under the pooling arrangement did not reach
the no-program marginal costs as it did in Figure 9. Overall, the pooling arrangement has
a greater production effect than the interpretation described in Figure 9. We provide a
quantitative assessment of these effects in Section 6.
5.1.3 Reallocation of quota across processors
The EU subsidy program prior to 2001 created an incentive for a processor to
expand quota entitlement. The opportunity to add quota encouraged processors to pay
the minimum price for tomatoes in excess of their quota allocation. Aggregate data
indicate that total quota, quota allocated by country and quota allocated by product
67
adjusted only slowly. However, quota was also reallocated among firms within
countries, so this incentive did apply in practice.
When processors pay a higher price for raw materials it raises the costs of
production. But, if the processors in low-cost regions were already paying a pooled price
for tomatoes they could have maintained their marginal costs and nominally paid the
minimum price on additional tomatoes by simply re-adjusting the composition of the
average price. In this case, the processor would have paid an average of two prices (the
minimum price and a lower “free” price) for all tomatoes. If they recorded more
tomatoes at the higher price they could have decreased the declared price for the smaller
quantity of “free” price tomatoes and left the average price unchanged.
We believe that the production incentive effects of re-allocation were small in the
EU processing tomato industry. Overall, reallocation was relatively small and benefits
would have been discounted by assessments of the stability of the program.
5.2 Modeling the domestic program effects under the policy changes of 2001
The recent changes in the EU domestic program for the processed tomato industry
create different production incentives. This sub-section models the implications of those
incentives and Section 6 quantifies the effects through simulations. We compare the new
program with the program in place prior to 2001 in order to understand the effects of the
policy change on EU processed tomato output.
The policy tools used prior to 2001 were replaced with a seemingly simple
program. As noted in Section 3, our understanding of the new program is based on
information in European Commission 2000/0191, European Commission IP/00/772, and
68
USDA/FAS/E20144. The new program is comprised of a single main component: a per-
unit grower subsidy (referred to as producer aid in our sources). We interpret the new
policy as one that creates the incentives of a per-unit subsidy on all processing tomatoes.
The per-unit subsidy applies to all tomatoes used for processing. Inn addition, we do not
yet know what restrictions may apply regarding the eligibility of the per-unit grower
subsidy. It is not clear if new production in the EU is eligible for the per-unit grower
subsidy or if it is restricted to established growers. And, if new producers or new areas
are eligible, there may be some delay in qualifying for payment.
Also, as discussed in Section 4, each country in the EU that produces processing
tomatoes has a threshold quantity. Under rules for 2001, if a country exceeds its
threshold quantity, the per-unit subsidy in that country will be reduced the following
year. But, individual producers seem to face no direct link between their own output and
the future adjustment in the per-unit subsidy. Thus, the threshold does not change the
production incentive for individual growers or processors, except that the per-unit
subsidy may be lower in the future in some regions. This expectation about future
payment adjustments may affect current production incentives, however, those
complexities are not considered here.
5.2.1 Illustrative model of the EU domestic program effective in 2001
Figure 11 illustrates the effects of removing the per-unit subsidy to tomato
growers in the EU in a fixed proportions model of raw material/processor linkages. The
per-unit subsidy decreases marginal costs in the tomato market. Following the fixed
proportions framework, removing the per-unit subsidy increases the effective marginal

69
Figure 11. The effects of eliminating the per-unit subsidy in the processing tomato market
MCm
Dm
Manufactured Tomato Output
Price
Quantity
Other Processing Input
Price
Quantity
M* M
O* O
T* T
MCt’
Do
MCt
Tomato Input
MCm’
MCo
Dt
Price
Quantity
Do’
Per-unit subsidy

70
costs in the tomato market, increases the effective net marginal costs in the output
market, and decreases demand for the other input. The quantity of processed tomato
output, use of the other input, and use of the tomato input each fall from M, O, and T to
M*, O* and T* respectively.
Note, Figure 11 does not show the transition from the domestic program used
prior to 2001 to the new program. Instead, Figure 11 shows the effects of removing the
new program and this can be compared to the effects of removing the program used prior
to 2001.
5.3 A summary of the qualitative effects of the EU domestic programs
The processing tomato subsidy program that was in place prior to 2001
encouraged more EU processed tomato output. Thus, the EU processed tomato industry
is now larger than it would have been if the policy had not been in place. This added
production was associated with three factors. First, some processors and associated
tomato farmers were kept in the tomato business when their land and other resources
would have been better suited for other activities. For example, this likely occurred in
France and in other regions where there was little production except that accounted for by
processor payments and minimum grower prices. Second, in other regions, excess
production occurred as processors competed for the rights to future reallocated subsidies.
Third, processors offered a pool-price that encouraged additional production in regions
that exceeded quota. For all these reasons a reduction in or elimination of the processor
payment or a cut in minimum prices would have meant lower EU production, even
though the subsidy itself was available on a limited quantity.

71
The entitlement quota used as part of the program prior to 2001 placed constraints
on adjustments within the processing tomato industry. First, the quota constrained the
supply response to the minimum price, thereby decreasing the potential dead-weight loss
relative to an unconstrained support price. Second however, since the quota was non-
transferable across plants, it led to a greater dead-weight loss than would have been
observed with a transferable quota because some high marginal cost plants remained in
production in order to receive payments. Thus, part of the dead-weight loss from the
policy used prior to 2001 was due to the non-transferability of the quota between
processing plants.
The program introduced for 2001 will also increase EU production of processing
tomatoes relative to no program. We estimate that the overall EU budget outlay for the
new program will be greater than what would have been spent if the old program was
continued. In the next section we will assess and compare the magnitudes of production
effects from removing both the new program and the program used prior to 2001. This
allows us to compare the new program to the one it replaced.

72
6 Simulation of the removal of EU domestic policies
Section 6 reports the results of a quantitative specification of the qualitative
models described in Section 5. The results that we present should be interpreted as
intermediate run (three to five years) results. We would expect that the quantity effects
of eliminating the subsidies to be larger and the price effects to be smaller if a longer time
horizon were considered. That is, with more time to adjust, farms and processing firms
would gradually shift more resources out of the processing tomato business.
In section 4 we analyzed the removal of trade barriers under the assumption that
the EU produced and consumed differentiated processed tomato products. The EU
applied an export subsidy in the market for which it exported products and applied a tariff
in the market for which it imported a different product. The imports of the EU are quite
small relative to exports or domestic use. In this section we analyze the removal of the
domestic programs and assume, for simplicity, a homogeneous processed tomato product.
This assumption is not overly restrictive given the small share of the differentiated good
that is imported and given that we do not have precise data for any of the important
parameters. Thus, our projections should be viewed as approximations.
6.1 Model and empir ical issues
The simulation models in this section combine data from the EU processing
tomato industry with models specified in Appendix A2. The calculations that were used
in our simulations are presented in Appendix A3. The primary purpose of the simulation
model is to quantify the potential production effects of removing the domestic subsidy
program in the EU. We compare the estimated production effects of the EU program that

73
was in place prior to 2001 and that which became effective in 2001. We also present
welfare effects associated with the programs.
Of course, many of the parameters used in our analysis are not known with
certainty and our simulation results depend on the parameters that were selected.
Specifically, our results are subject to the specification of EU production in three
hypothetical regions, the quota allocated to each hypothetical regions, the distribution of
production within each hypothetical region, various policy parameters, cost shares for
inputs, initial quantities and prices for input and output markets, and demand and supply
elasticities for various products/markets. Nonetheless, once again, we do not include a
range a parameters or a sensitivity analysis with our simulation results of removing the
domestic programs. A complete sensitivity analysis would include a range for each of
these parameters, but is beyond the scope of this report. Thus, our projections should be
viewed as only approximations.
As presented in the earlier figures, the supply of raw tomatoes and the demand for
the processed product (paste) are specified using a fixed proportions model.
Assumptions about supply and demand elasticities are used to parameterize the model.
Our analysis also incorporates data on tomato and paste production, policy parameters,
tomato and paste prices, cost shares and budget costs.
6.2 Estimated production effects for removal of polices used pr ior to 2001
The production data used for these simulations is from 1998; price and policy
parameters are from 2000 data. We used 1998 production data for two reasons: a)
compared to 1998 and preliminary 2000 data, 1999 appears to be a year with unusually

74
high production in the EU, b) preliminary production data from 2000 appears to be close
to that in 1998. Total production in 1998 was 8.4 million tons and we use this for the
base aggregate quantity. Our analysis focuses on the effects of program changes in
percentage terms. We do not forecast specific prices or production figures for any year.
Some of the simulations require an initial allocation of the quota of 6.8 million
tons across the three hypothetical regions. For this analysis, the high-cost region is
assigned 17 percent of the total quota, the mid-cost region is assigned 33 percent of the
quota and the low-cost region is assigned 50 percent of the quota. The mid-cost region
was assumed to produce at its quota quantity, and the high-cost region was assumed to
produce 10 percent below the quota. Therefore, to satisfy the “adding-up” constraint that
total EU production must equal 8.4 million tons (24 percent above total quota), the low-
cost region produced 150 percent of its quota.
The model requires initial points for quantity and price, the demand elasticity for
the processed tomato output, the supply elasticity for the tomato input, the supply
elasticity for the processing input and the cost share of the tomato input. Given these
parameters, we can also calculate the elasticity of the derived demand in the tomato
market (and in the processing input market) and the elasticity for the derived supply in
the output market. The parameters used to estimate the production effects of removal of
the EU processor aid, quota and minimum price policies are listed in Table 10.
These parameters on cost shares, technical conversion factors, and supply and
demand elasticities are used throughout our analysis. Elasticities are for a given point;
specification of supply and demand functions are based on the point elasticity and the
initial price and quantity. Each of the parameters is based on data supplied by industry

75
Table 10 Parameters used to estimate the alternative projections of EU production
Parameter Description Parameter Notation Parameter Value
Demand elasticity for the processed tomato product
ηM -0.5
Demand elasticity for the tomato input
ηT -0.17
Supply elasticity for the processed tomato product
εM 0.5
Supply elasticity for the tomato input
εT 0.5
Supply elasticity for the processing input
εO 0.5
Cost share for the tomato input
CT 0.50
Cost share for the processing input
CO 0.50
Units of tomatoes required for one unit of processed product
k 6.0
Quota entitlement in the low-cost region
QL 1.14 million tons(tomato units)
Quota entitlement in the mid-cost region
QM 2.26 million tons(tomato units)
Quota entitlement in the high-cost region
QH 3.40 million tons(tomato units)
Total quota entitlement Q 6.80 million tons(tomato units)
Total production of the processed tomato product
M 8.40 million tons(tomato units)

76
sources or built up from factual reasoning about the EU and world markets. Each of the
key parameters will be discussed in turn.
We begin with the elasticities of demand facing EU processors and growers.
With no international trade, we would expect that the demand elasticity for the processed
tomato product facing EU suppliers would to be very inelastic, for example –0.1 (see
Huang for estimates that apply in the United States). This demand elasticity is probably a
lower bound as there are some imports into the EU that compete with EU paste. Further,
the EU exports approximately 30 percent of its paste output and the demand elasticity for
the exported quantity is typically more elastic than that produced domestically, for
example -1.5. Using these estimates, we assume the overall demand elasticity for the
processed tomato product is in the range of –0.5 (ie. 30 percent at –1.5 and 70 percent at
–0.1). Note that this overall demand elasticity is sensitive to the share of imports and
exports. Given the demand for the processed tomato product and our fixed proportions
specification, the demand elasticity for the tomato input is derived using the following
formula: (1/ηM) = CT * (1/ηT) + CO * (1/εO)
The formula above makes use of cost shares and the supply elasticity of the other
processing input. We use a supply elasticity of 0.5 for other processing inputs. Using
our data and assumptions on these parameters we derive a demand elasticity for the raw
tomato input of –0.17.
Next we turn to the price elasticity of supply of raw tomatoes for processing.
Growers and processors say that tomatoes are one of the most profitable crops in the
regions where they are currently grown. This is in a setting where most EU crops are
subsidized. The supply response to a policy change depends on which policies are

77
changing simultaneously. The most reasonable and realistic policy scenario is one in
which, if EU processing tomato subsidies were removed, other competing crop subsidies
would also be removed at the same time. For these reasons, we expect that a relatively
low price elasticity of supply of tomatoes is appropriate in the EU. We use a supply
elasticity of 0.5 for EU tomatoes used in processing.
In a fixed proportions model the supply elasticity (at the initial price and quantity
point) for the processed tomato product equals the cost share weighted average of the
supply elasticity of tomatoes and the supply elasticity of the other input. Therefore the
supply elasticity of 0.5 applies in the processed tomato output market.
The cost share of tomatoes used in the production of processed tomato products
was reported to be approximately 50 percent (Mark Evans). Therefore, the cost share of
the processing input is also 50 percent. These cost shares are sensitive to the market
price of tomatoes and are applicable in the United States, which has a relatively low
tomato price. For example, if the no-subsidy market price of the processed tomato
product was 950 euro, then with a 50 percent cost-share of the tomato input, the cost for
the tomato input is 475 euro per unit of processed tomato product. This is equivalent to
79.17 euro per unit of raw tomatoes (when six tons of tomatoes is used per ton of paste).
The implied cost share of tomatoes is higher when the market price of tomatoes is higher.
Our simulations were also based on several policy parameters for each policy
scenario. The processor aid was 172 euro in 2000 and the minimum price was 88 euro.
In 2000, the price of the manufactured tomato product was 900 euro and the total
production of processing tomatoes was 8.4 million tons.

78
We now turn to simulations of the production effects given these parameters. The
production effects from the removal of the domestic program used prior to 2001 are
summarized in Table 11. Columns in Table 11 show total EU production and production
in each of the three hypothetical regions (where applicable). All calculations used in
these simulations can be found in Appendix A3.
The first row of Table 11 shows total EU production (in tomato units) that applied
under the year 2000 program. The second row of Table 11 simply notes that there is no
production effect of eliminating the policies under the specification that all production
exceeds quota in the EU. The third and fourth rows present cases that include three
different regions within the EU; the results are considered to represent two versions of
how the program may have actually operated through the year 2000.
In both cases, removal of the processor aid/minimum price/quota regime
assuming the three different regions results in lower overall production. In row 3,
production falls by 1.2 percent and the price of processed tomato products rises by about
2.4 percent (because of the small shift in output and a demand elasticity of –0.5).
Production in the high and mid-cost regions fall while production in the low-cost region
rises. With lower subsidies, high and mid-cost producers cut back production, while the
slightly higher market price encourages more output in the low-cost region where the
subsidy does not apply on the margin.

79
Table 11 Projections of EU production under removal of the domestic program used pr ior to 2001 under alternative assumptions about program implementation
Simulations Total EU Production
Production in High-Cost
Regiona
Production in Mid-Cost
Regiona
Production in Low-Cost
Regiona
(Initial Quantities in million tons)
Current regimeb 8.40 1.0 2.3 5.1
(Expressed as percentage change in initial quantity)
Removal of processor aid and quota with all production exceeding quota
0 0 0 0
Removal of domestic programc with the three regions producing below, at and above quota
-1.2 -7.8 -3.2 1.2
Removal of domestic programd with pooled marginal costs in the low-cost region
-3.2 -6.9 -1.8 -3.1
a Total quota is allocated as follows: 17% high-cost, 33% mid-cost, and 50% low-cost. Demand elasticity is –0.5 and supply elasticity is 0.5 for the processed tomato product.
b For current regime we assign initial production levels as: the high-cost region to be 10% below their quota, the mid-cost region at their quota and the low-cost region set such that it sums to the total EU production of 8.4 million tons.
c With this interpretation of the domestic program the decreased production from program elimination would increase the price of processed tomato products by 2.4 percent.
d With this interpretation of the domestic program the decreased production from program elimination would increase the price of processed tomato products by 6.3 percent.

80
The fourth row of Table 11 shows quantitatively the somewhat greater production
effect when we treat the EU policy as one that uses a pooled price in the low-cost region.
In this case production falls by 3.2 percent and production falls in all three regions if the
program were removed. The effects in the high-cost and mid-cost regions change slightly
from row three, however, now the low-cost region responds by reducing output too. In
this scenario market price for the processed tomato product rises by 6.3 percent.
6.3 Estimated production effects for removal of the new program
The changes to the domestic processing tomato program introduced a simple per-
unit subsidy for tomatoes used for processing. In 2001 the per-unit subsidy is set at 34.50
euro. Here we estimate the production effects of this program for its first year of
operation.
The per-unit subsidy is scheduled to fall over time in countries that exceed the
threshold limit (as we expect will happen under normal weather conditions). We start
with the assumption that production will exceed the threshold limit in the year 2001 in
some of the countries producing tomatoes in the EU. If the new program is applied as
specified, the per-unit payment will fall for 2002 in those countries. The per-unit subsidy
will continue to decrease until production equals the threshold limit. Any increase in the
threshold quantities will dampen the need to decrease the per-unit subsidy. The effects in
subsequent years depend on the adjustments made to the policy parameters, weather and
several other contingencies. The calculations used to estimate the production and price
effects from removing the new domestic program are in Appendix A3. We continue to
use the parameters provided in Table 10.

81
The no-subsidy price of the processed tomato product was 956.90 euro after
removal of the pooled arrangement in 2000. Using a 50 percent cost share for tomatoes
yields a no-subsidy policy price of 79.70 euro. Therefore, the per-unit subsidy is
equivalent to a reduction in effective marginal costs of processing tomatoes by
approximately 43 percent (34.5/79.70). With a 50 percent cost share, the per-unit subsidy
decreases marginal costs in the processing tomato market by approximately 22 percent.
Using the formula and parameters specified in Appendix A3 we may calculate the
equilibrium changes in price and quantity compared to the year 2000 program. We may
also calculate the effects of removing the year 2001 program. These effects are shown in
Table 12. If the new domestic subsidy program were removed, the EU quantity supplied
would decrease by 5.1 percent and the price of processed tomato products would increase
by about 12 percent. The quantity demanded in the EU would fall by about 1 percent and
the quantity demanded in the EU export market would fall by about 14 percent. The new
program increases production and depresses market price relative to the pre-2001
program. Therefore, removal of this program would cause a larger percent fall in output
compared to the pre-2001 program (5.1 percent relative to 3.2 percent).
Given the size of the per-unit subsidy paid to growers of processing tomatoes, our
estimate of the reduction in EU supply that would result from the removal of the new
domestic program is relatively small (a decrease of 5.1 percent). Our results are
calculated using a fixed factor proportions model that derives an inelastic price elasticity
of demand for processing tomatoes. A simple way to introduce some flexibility for this
assumption is to re-calculate the effects on EU supply for removal of the new domestic
program using a more elastic price elasticity of demand for the processed tomato product.

82
Our results that are presented above and in Table 12 are based on a price elasticity of
demand for processed tomato products of –0.5. If we change that elasticity to –1.0,
removal of the new domestic program would decrease EU supply by 6.7 percent (as
compared to a decrease of 5.1 percent under the initial parameters). It is clear that our
results are somewhat sensitive to the assumption of fixed factor proportions, however, in
the short to medium run, our analysis indicates that the removal of the new domestic
policy would not significantly reduce the supply of EU processed tomato products.
6.4 Summary of the effects of removing EU domestic policies
The results from our simulations indicate that the production effects from EU
domestic policies were significant before the program changes for 2001 and are larger
under the new program.
The results illustrate that the production effects prior to 2001 depended on
whether production was quota binding or not for European producers and how the policy
was implemented in the EU.
Table 13 outlines the welfare implications of removing the EU subsidy program
for processed tomatoes and compares the pre-2001 program to the one to be implemented
this year. We list the change in welfare in euro and the change in welfare relative to total
revenue in the processed tomato industry (estimated as 1,260 million euro). In Table 13,
the welfare measures for the domestic programs are calculated in the processed product
output market.

83
Table 12. Estimated EU production and pr ice effects for 2001 programcompared to pre-2001 program and no program
Programs Percentage change in EU Production (% )
Percentage change in EU Pr ice (% )
Change to new (2001) program compared to theyear 2000 program
2.0 -5.2
Removal of the new (2001) program
-5.1 12.1

84
Table 13 EU welfare effects from removal of the domestic programs
Pre-2001 2001
Change in:(million euro)
Pooled Price Case New Program
Consumer Surplus -78.4 -144.0
Producer Surplusa -112.2 -144.0
Taxpayer Surplusb 191.8 295.7a
Total EU Surplus 1.2 7.7
Changes Relative to Total Revenue (% )
Consumer Surplus 6.2 11.4
Producer Surplus 8.9 11.4
Taxpayer Surplus 15.2 23.5
Total EU Surplus 0.1 0.6
a Producer surplus refers to surplus to growers and processors in the EU.
b The taxpayer surplus is based on a per-unit subsidy of 34.50 euro per ton applied to production of 8.57 million tons of processing tomatoes.

85
Removal of the domestic subsidy program causes consumer surplus and producer
surplus to fall. But, removal of the costly subsidy would also reduce taxpayer costs. The
tax cost of the domestic program in 2000 was approximately 190 million euro (based on a
processor aid of 172 euro applied to the relevant quota quantity). The tax cost for the
new domestic program will at least be 284.6 million euro (based on a per-unit subsidy of
34.50 euro and production of 8.25 million tons). However, our analysis indicates that EU
production in 2001 will exceed the threshold limit; we estimate that production in 2001
will be 8.57 million tons of processing tomatoes. Thus, the tax cost of the new domestic
program using our production estimate is 295.67 million euro.
Our results indicate that removing the domestic program prior to 2001 (the pooled
case) would have increased total EU surplus by 1.2 million euro. Removal of the new
program would increase total EU surplus by 7.7 million euro.

86
7 Concluding remarks
This report has provided some detailed analysis of EU policies for the processing
tomato industry. Rather than repeat the findings or attempt to summarize the methods,
here we will discuss a few extensions and some additional analyses that are underway.
Our analysis of the EU exports and export program was based on assumptions of
supply and demand elasticities that are not known with certainty. Nonetheless, given the
limited scope of this policy, we are relatively confident that the aggregate impact of this
program on the industry and on world markets is quite small.
We are currently extending of our analysis of import barriers in several ways.
First, we are gathering additional information about the extent of the tariff preferences
and duty refund programs. It is important to know the amount of product to which the
tariff applies. Second, in order to understand the role of trade in an industry that both
imports and exports, we must gather more information about product differentiation.
Also, we must extend our model to include several related but differentiated processed
tomato products, some of which are imported or are close substitutes for imports while
others may be exported. This extension will allow our models of international trade to be
more consistent with our modeling of the internal subsidy program. Finally, we are
pursuing econometric analysis of trade flow panel data to estimate parameters used in the
extended simulation model.
Our analysis of the internal subsidy program is also being extended in several
ways. First, as the new program is applied in to the 2001 marketing year we will learn
more about how this policy is being implemented. Second, we need to gather more
information about the variation in production and processing costs across the EU and to

87
get a better handle on the marginal cost function and the elasticity of supply for both raw
tomatoes and processing itself. In this current report, we use parameters representing
market shares across regions and supply elasticities. We also assume fixed proportions
between raw tomatoes and other inputs. Each of these assumptions needs more analysis.
Finally, our modeling requires information on demand conditions in the EU and
international markets. We are currently investigating the demand elasticities facing EU
processed tomato products in each of the major markets.
Despite the agenda for additional research, we believe that the major conclusions
of this study will prove robust. The Mediterranean countries of the EU would continue to
be significant tomato producers and processors even without the current subsidy system.
But, the EU industry would be smaller, with reduced output especially in those areas in
which other crops are better suited to production conditions. EU consumers would gain
from lower priced access to imports and EU taxpayers would no longer face the burden
of a significant transfer to producers and processors. Competing tomato producers and
processors in other countries would also benefit if the EU trade barriers and subsidies
were reduced or eliminated.
88
A1 Appendix: Models of the effects of EU trade policies
The model used to describe production effects from the removal of the export
subsidy is referred to in Section 4 and is illustrated in Figure 3. The model needs to
describe the demand in three markets for EU-produced canned tomato products, in the
EU market (EU), the rest of the world non-subsidized market (RNS) and the rest of the
world subsidized market (RS). Supply needs to be described for canned tomato products
produced in the EU and marketed in all three markets. The following model is used to
calculate percentage changes in quantity and price for the removal of the export subsidy
in the relevant markets:
(A1.1a) dln DRS = ηRS (dlnP + XS )
(A1.1b) dln DRNS = ηRNS dlnP
(A1.1c) dln DEU = ηEU dlnP
(A1.1d) dln DRS+RNS+EU = δRS dln DRS + δRNS dln DRNS +
(1 - δRS - δRNS) dln DEU
(A1.1e) dln SRS+RNS+EU = ε dlnP
where dlnDj is the percentage change in the demand for EU-produced canned tomato
products for the jth market. Likewise, dlnSRS+RNS+EU is the percentage change in total EU
supply and dlnP is the percentage change in the EU price of canned tomato products. XS
is the export subsidy’s share of the export price for canned tomatoes. In our model we set
XS at 8.5 percent because the subsidy is approximately 45 euro and the export price is
approximately 530 euro. The superscript refers to the location of consumption. The
deltas (δ) refer to size of each market for EU-produced canned tomato products. The
delta for subsidized exports of canned tomatoes is 6.7 percent (54 percent of a 12.5

89
percent export share), the delta for the non-subsidized exports is 5.8 percent and the delta
for the EU market is 87.5 percent. The etas (η) refer to the respective demand elasticities
and the epsilon (ε) refers to the total EU supply elasticity. We set ηRS and ηRNS to –1.0,
ηEU at –0.4 and ε equal to 0.5.
We solved the above model as follows:
from A1.1d, dln DRS+RNS+EU = -0.475dlnP – 0.0057
then set, dln DRS+RNS+EU = dln SRS+RNS+EU
such that, dlnP = -0.00585 and
dln DRS+RNS+EU = -0.0029, dln DRS = -0.079, dln DRNS = 0.0058, dln DEU = 0.0023
We used the results above to calculate the EU welfare effects (shown in Table 8)
as follows:
(A1.1f) ∆ EU Consumer Surplus = (∆ Price*Q0) + 0.5* ∆ Price*(Q0 – Q1 )
(A1.1g) ∆ EU Producer Surplus = -( ∆ Price*Q0EU) + 0.5* ∆ Price*(Q0
EU – Q1EU )
(A1.1h) ∆ EU Taxpayer Surplus = 135,000 * 45
Where ∆ Price = P0 – P0*(1+dlnP), Q1 (the total quantity of EU-produced canned tomato
products once the export subsidy is removed) is Q0*(1+dlnDRS+RNS+EU) and Q1EU (the
quantity of EU-produced canned tomato products sold in the EU once the export subsidy
is removed) is Q0EU *(1+dlnDEU). P0 is set to 530 euro, Q0 is 2 million tons of canned
tomato products and Q0EU is 1.75 million tons. The gain to EU taxpayers for removal of
the export subsidy is the per-unit amount of export subsidy multiplied by the quantity that
is subsidized. The total change in EU surplus is the sum of the changes to consumer
surplus, producer surplus and taxpayer surplus. The changes relative to total industry

90
revenue are the welfare changes divided by total annual revenue for the processed
product (estimated to be 1,260 euro).
The model used to describe the production effects from the removal of the tariff is
referred to in Section 4 and illustrated in Figure 4. In the model we assume that the EU is
a small importer of the processed tomato products that are consumed in the EU.
Removing the 14.4 percent tariff (τ = 0.144) reduces the price in this market by 12.6
percent. The following set of equations was solved to estimate the price and production
effects from the removal of the 14.4 percent ad valorem tariff for processed tomato
products.
(A1.2a) P* (1 + τ) = 900
(A1.2b) dlnP = (900 – P) / 900
(A1.2c) dln DEU = ηEUdlnP
(A1.2d) dln SEU = εEUdlnP
P refers to the price of processed tomato products with no tariff in place and τ is the ad
valorem tariff rate. The term dlnP refers to the percentage change in price in the EU,
dlnDEU is the percentage change in demand for processed tomato products in the EU and
dlnSEU is the percentage change in supply of EU-produced products sold in the EU
market. Eta (ηEU) refers to the price elasticity of demand for processed tomato products
sold in the EU market and εEU refers to the price elasticity of supply for EU-produced
products sold in the EU market. We solved the above model as follows:
from A1.2a, P = 786.71
from A1.2b dlnP = -12.6%
from A1.2c dlnDEU = 6.3%

91
and from A1.2d dln SEU = -5.04%
The EU welfare effects from the removal of the import tariff are as follows:
(A1.2e) ∆ EU Consumer Surplus = (∆ Price*Q0) + 0.5* ∆ Price*(Q1 – Q0 )
(A1.2f) ∆ EU Producer Surplus = -( ∆ Price*Q0EU) + 0.5* ∆ Price*(Q1
EU – Q0EU )
(A1.2g) ∆ EU Taxpayer Surplus = (Q0 – Q0EU) * ∆ Price
Now, ∆ Price = [P* (1 + τ)] – P, Q1 (the total quantity of processed tomato products
consumed in the EU once the tariff is removed) is Q0*(1+dlnDEU) and Q1EU (the quantity
of EU-produced product consumed in the EU once the tariff is removed) is
Q0EU *(1+dlnSEU). We use paste units in this simulation, therefore P is set to 900 euro,
Q0 is 1 million tons and Q0
EU is 0.9 million tons. The total change in EU surplus is the
sum of the changes to consumer surplus, producer surplus and taxpayer surplus. The
changes relative to total industry revenue are the welfare changes divided by estimated
total annual revenues of 1,260 euro.

92
A2 Appendix: Models of the effects of EU domestic policies pr ior to policy change in 2001
The models in Appendix A2 are included as a supplement to the illustrative
models that were introduced in Section 5. In Appendix A3 we explicitly show the
calculations used to reach our results in Section 6.
The first model of the domestic program used prior to 2001 is the infra-marginal
case illustrated in Figure 7 and introduced in Section 5. This model describes the regime
with the processor aid/minimum price/quota policy and all production exceeding quota.
The term “Pay” will refer to the per unit processor aid as specified by the European
Commission. This model can be described using a simple linear model for the marginal
cost and demand as:
(A2.1a) PSO = MCO = αO+BOO for 0 < Quantity ≤ Quota
PSO = MCO = (αO – Pay)+ BOO for Quantity > Quota
(A2.1b) PST = MCT = αT + βTT
(A2.1c) PDM = a-bM
(A2.1d) PDT = {(a-bM) - MCO}/k
(A2.1e) PSM = (MCO + k*MCT)
Where PS refers to the supply price and PD refers to the demand price. The
notation O, T, M refers to the processing input (O is notation for the “other” input),
tomato input and the manufactured product output markets. The output market and the
processing input market are both measured in M units. MCO refers to the marginal costs
in the processing input market. The alpha terms (α) are the supply intercepts in the
respective markets and the demand intercept is denoted “a”. The beta terms (β) are

93
reserved for the supply slopes and the demand slope is denoted “b”. The term k is the
conversion factor (units of tomatoes per unit of manufactured tomato product).
The second model is illustrated in Figures 8 and 9. This model describes the
industry as one with three regions (producing at, above, and below quota) and includes
the processor aid/minimum price/quota regime. Figure 8 is an illustration of the marginal
costs in the output market; the marginal cost in the output market is the vertical sum of
marginal costs in the input markets. For i∈[H, M, L] the marginal costs in Figure 8 are
shown below. In the following equations we assume that the cost variation is in the
processing input market.
(A2.2a) MCiM = kT + (αiO – Pay) + βiOM for 0 < Quantity (M) ≤ Quota
(A2.2b) MCiM = (kαT +αiO) + βiTOM for Quantity (M) > Quota
where βiTO = (k2βT + βiO), kT = k*(αiT + k*βT) and i∈[H, M, L]
Therefore, aggregate marginal costs in each of the 9 sub-sections in Figure 9 are the
horizontal sum of the marginal costs in each cost region. These are described as:
(A2.2.1) MC1 = kT + (αLO – Pay) + βLOM for 0 < M ≤ M1
(A2.2.2) MC2 = kT + (αMO – Pay) + (βLO, MO)(M- M1) for M1 < M ≤ M2
(A2.2.3) MC3 = kT + (αHO – Pay) + (βLO, MO, HO)(M- M2) for M2 < M ≤ M3
(A2.2.4) MC4 = kT + αLO – Pay + βLO(QL/k)+(βMO, HO )(M- M3) for M3 < M ≤ M4
(A2.2.5) MC5 = kT + αLO + βLO(QL/k)+(βLTO, MO, HO)(M- M4) for M4 < M ≤ M5
(A2.2.6) MC6 = kT + αMO – Pay + βMO(QM/k)+(βLTO, HO)(M- M5) for M5 < M ≤ M6
(A2.2.7) MC7 = kT + αO + βMO(QMO/k)+(βLTO, MTO, HO)(M- M6) for M6 < M ≤ M7
(A2.2.8) MC8 = kT + αO – Pay + βHO(QH/k)+ (βLTO, MTO)(M- M7) for M7 < M ≤ M8
(A2.2.9) MC9 = kT + αO + βHO(QH/k)+(βLTO, MTO, HTO )(M- M8) for M > M8

94
where: βX,Y = βX * βY / (βX + βY)
βX,Y, Z = βX * βY * βZ / {(βX * βY ) + (βX * βZ ) + (βY* βZ)}
The third model describes the case with pooled marginal costs in the low-cost
region. It is illustrated in Figure 10. Again assuming that the marginal costs in the other
input market are upward sloping, the marginal cost of paste in each region can be
described as:
(A2.3a) MCiP = kT + (αiO – Pay) + βiOM 0< M <Quota {or i∈(M, H)}
(A2.3b) MCLP = kαT + (αLO – Pay) + Pool + βLTOM M > Quota
(A2.3c) Pool = {(Total Government Payment to low-cost region)/ Mpool}
Figure 10 shows the pooled marginal cost for the low-cost region. In the low-cost
region the processor offers a contract paying one price for all tomatoes, thereby
smoothing the policy benefits across all production. As the high and mid-cost regions
produce below or at quota there is no pooling of policy benefits because production does
not exceed quota.

95
A3 Appendix: Calculating the effects of removing both the domestic programused pr ior to 2001 and the new domestic program
The purpose of this appendix is to outline the calculations used to simulate the
removal of the domestic programs; our results are reported in Section 6. In this
explanation we also have referred to Figure 9 in Section 5. We begin with the
calculations used in the results for removing the domestic program prior to 2001 and then
present the calculations used for removal of the new program.
The first row in Table 11 shows the total EU production and our allocation of EU
production across three hypothetical regions. The second row in Table 11 shows results
for the case whereby all production exceeded quota. The third and fourth rows are
considered to be closer characterizations of this industry; we assume that the results in the
fourth row are the most accurate depiction of removing the old program.
The third row in Table 11 reports the results for removal of the domestic program
that was used prior to 2001 and includes processors from each of the three hypothetical
regions.
In our simulations we begin with a price-quantity pair for the year 2000; the price
was 900 euro for processed tomato products (tomato paste) and total quantity supplied
was 8.4 million tons of processing tomatoes or 1.4 million tons of processed tomato
product (tomato paste). Given the EU aggregate price for processed tomato products and
the allocation of quota across our three hypothetical regions, we calculated the quantities
produced in each region in the year 2000.
With the price elasticity for supply (from Table 10) at the initial point we were
able to specify slopes and intercepts for supply in each region. Summing across the three
regions horizontally, we derived the aggregate EU supply for processed tomato products.

96
Using the price elasticity for demand (from Table 10) we were also able to specify the
slope and intercept for demand of processed tomato products in the aggregate market.
Initial allocations of quota are listed in Table 10. Under our assumptions, initial
production across the three hypothetical regions are listed in Table 11. We combined
these quantities (in manufactured tomato units) with the EU price of paste and the point
elasticity of supply to specify supply in each region. For example, in the low cost region,
the supply elasticity was 0.5, therefore (∆M/∆P)*(P/M) = 0.5. For P equal to 900 and M
equal to 0.852, the slope (∆M/∆P) is equal to 2112.7. We use M to denote the quantity of
manufactured tomato product. Following this logic we specified the supply for each
region as:
(A3.1a) Pl = -900 + 2112.7 Ml
(A3.1b) Pm = -900 + 4761.9 Mm
(A3.1c) Ph = -900 + 10588.2 Mh
Where l, m and h denote the low, mid and high-cost regions. These specifications are
linear approximations and are used only to calculate changes around the initial point. We
do not use the intercept term in our welfare calculations because we are only interested in
the changes in welfare.
Next we specified supply in each region for the no-program case. As mentioned
earlier, the processor aid in 2000 was 172 euro. In this case, removing the policy
changed the marginal costs in each region differently. Since the low-cost region
produced more than its quota, it was already operating on its no-program portion of its
marginal costs; removing the policy will not change its marginal costs. Removal of the
domestic program increased marginal costs in the low-cost region by the full 172 euro.

97
The mid-cost region was producing at quota and also shifted to higher marginal costs.
The increase in marginal costs for the mid-cost region depends on the degree to which the
quota constrained this region; in our analysis we assumed that removal of the program
would increase marginal costs by 86 euro (that is, half of the effect it had in the high-cost
region). The following equations represent supply in each region after removing the
domestic program:
(A3.2a) Pl* = -900 + 2112.7 Ml*
(A3.2b) Pm* = -814 + 4761.9 Mm*
(A3.2c) Ph* = -728 + 10588.2 Mh*
Following the idea in Figure 9 and equations A3.2a to A3.2c we specified the
aggregate EU no-program marginal costs. The quantity M1 (from Figure 9) was found at
the point where marginal costs are –814 in the low-cost region, that is:
(A3.4a) -814 = -900 + 2112.7M1
A similar approach yields M2:
(A3.4b) -728 = -814 + {(2112.7*4761.7)/(2112.7 + 4761.7)}*(M2-M1)
Finally, the no-program aggregate marginal cost in the EU was:
(A3.5a) P = -728 + 1285.7 (M-M2) where
1285.7 = (2112.7*4761.9*10588.2) /
[(2112.7*4761.9) + (2112.7*10588.2) + (4761.9*10588)]
Demand for aggregate processed tomato products was calculated using the
demand elasticity, total quantity, and price. In this case, the slope is equal to –1285.7 and
demand was specified as follows:
(A3.5b) P = 2700 –1285.7M

98
Setting aggregate demand equal to the aggregate no-program marginal costs (set
A3.5a equal to A3.5b) we solved for the no-program quantity and price. Removing the
policy decreased M to 8.30 million tons of processing tomatoes and increased the price to
922.05 euro. Substituting the no-program EU price into equations A3.2a to A3.2c yields
the quantity of processed tomatoes produced in each region: 0.94, 2.19, and 5.17 in the
high, mid, and low-cost regions.
The calculations in the fourth row of Table 11 are very similar to those that were
presented above. The key difference is the no-program supply specification in the low-
cost region (A3.2a). With a pooling arrangement the processors paid an average price for
all tomatoes rather than a high price for tomatoes within the quota and a lower price for
tomatoes outside of the quota. We simulated the pooling effect as one that smoothes the
total processor aid in the low-cost region across all production in that region.
In the previous simulation the processors retained 172 euro for 3.4 million tons of
processing tomatoes in the low cost region and production in that region was 5.1 million
tons. Under the pooling arrangement, the same processors retained 114.50 euro on all
5.11 million tons of processing tomatoes. Therefore the marginal costs in the low-cost
region also shifted up when the domestic program was removed. In addition, the total
EU no-program marginal costs shifted up by more than they did in the previous analysis.
More specifically, the no-program marginal costs in the low-cost region were:
(A3.6) Pl** = -785.5 + 2112.7 Ml**
The no-program marginal costs in the mid and high-cost regions were the same as those
presented in A3.2b and A3.2c. The quantities for M1 and M2 decreased and the no-
program marginal costs for the EU became:

99
(A3.7) P = -728 + 1285.7(M-M2) = -786.21 + 1285.7M
Again, setting the no-program marginal costs equal to demand yielded the no-
program quantity and price with the pooled arrangement. In this case, quantity fell to
8.13 million tons (decreased by 3.2 percent) and the price of the manufactured product
increased to 956.89 (increased by 6.3). At that price, we used equations A3.6, A3.2b, and
A3.2c to calculate production in each region: 4.95, 2.23, and 0.95 in the low, mid, and
high-cost regions.
In Table 13 we list the changes in EU welfare if the domestic programs are
removed. Removal of the program prior to 2001 (under the pooled price case) will
decrease consumer surplus, decrease producer surplus and increase taxpayer surplus. The
decrease in consumer surplus is due to the higher price and a lower quantity consumed in
the EU. In the aggregate EU market for processed tomato products, the decrease in EU
consumer surplus can be described as follows:
(A3.8) ∆ EU Consumer Surplus = - (∆ Price*Q1) + 0.5* ∆ Price*(Q1 – Q0 )
Where ∆ Price = (956.89 - 900) and (Q1 – Q0 ) is the change in the EU quantity supplied
due to removal of the domestic program (in processed product terms) and is equal to
(1.355-1.4). The total change in EU consumer welfare from removal of the old policy
would have been –78.4 million euro.
The change in EU taxpayer surplus due to the removal of the domestic program is
equal to the budget cost of the program. In this case, the cost of the program is the per-
unit cost of the processor aid subsidy mulitplied by the total EU quantity that received the
aid. In our simulation, we used the per-unit aid from the year 2000 of 172 euro and it

100
was applied to 6.69 million tons of processing tomatoes, yielding a program cost of 191.8
million euro.
The change in the producer surplus is more complicated as it is the sum of
changes in producer surplus in the three hypothetical regions. In each region, the
producer surplus is the area above the marginal costs and below the price. The change in
the producer surplus in each region is the difference between that area under the initial
price (900 euro) and the initial marginal costs (A3.1a, A3.1b, and A3.1c) and the area
under the new (no-program) price and the new (no-program) marginal costs (A3.6,
A3.2b, and A3.2c). Our calculations show that the change in producer welfare in the low
cost region was –49.8 million euro, the change in producer welfare in the mid-cost region
was –43.4 million euro, and the change in producer welfare in the high cost region was
–18.9 million euro. The total change in EU producer welfare from removing the old
policy would have been –112.2 million euro.
The total change in EU surplus is the sum of the changes to consumer surplus,
producer surplus and taxpayer surplus. In this case, the total change in EU welfare would
have been 1.2 million euro. The changes relative to total industry revenue are the welfare
changes divided by estimated total annual revenues of 1,260 euro.
The calculations used to estimate the production and price effects from removing
the new domestic program are presented next. We describe how to calculate the
percentage change in production and price from removing the per-unit grower subsidy in
the processed product (output) market in the EU.
(A3.9a) %∆PM = (εM* τ) / (ηM-εM)
(A3.9b) %∆QM = (ηM *εM* τ) / (ηM-εM)

101
Where PM and QM are the prices and quantities of the processed tomato product
and “%∆” denotes percentage change. The τ represents the per-unit grower subsidy
expressed as a percentage of the initial price of the manufactured output. In our analysis,
the per-unit grower subsidy was 34.50 euro in the tomato market. Equivalently, the per-
unit subsidy in the processed tomato market is 207 euro and the initial price of the
manufactured product is 956.89 euro. Therefore, in our analysis τ is set to 22 percent.
The εM represents the supply elasticity and ηM represents the demand elasticity.
We should note that there is also a τT (in the tomato market) which is the per-unit grower
subsidy expressed as a percentage of the initial price of the tomato input. After removing
the pre-2001 domestic program (under the pooled arrangement) the no-program price of
the tomato input was 79.74 euro. Therefore τT is approximately 43 percent. The %∆Q in
the tomato input market is equal to the %∆Q in the processed tomato market. The
percentage change in price in the tomato market is equal to (εT* τT) / (ηT-εT).
Using the formula above and parameters from Table 10 (to determine the effects
of removing the per-unit subsidy) the quantity of processed tomato products (and the
quantity of all inputs) would decrease by 5.4 percent. The price of processed tomato
products would increase by 10.8 percent and the percentage change in price in the tomato
market is approximately 32 percent.
The EU welfare changes associated with the removal of the new program are
shown in Table 13. In this case, the change in EU taxpayer welfare is equal to the budget
cost of the new program. The budget cost of the new program for 2001 is estimated to be
295.7 million euro given a per-unit subsidy of 34.50 euro and production of 8.57 million
tons of processing tomatoes.

102
The change in EU producer and consumer welfare is based on the estimated no-
program price and quantity (following the results for the simulation for removal of the
new program). The consumer surplus was calculated as follows:
(A3.10a) ∆ EU Consumer Surplus = - (∆ Price*Q1) + 0.5* ∆ Price*(Q1 – Q0 )
In case the ∆ Price is equal to {956.89 – [956.89*(1-0.108)]}, Q1 is equal to
Q0*(1+0.05408) and Q0 is equal to the no-program quantity if the pre-2001 domestic
program was removed. The change in EU producer surplus follows :
(A3.10b) ∆ EU Producer Surplus = - (∆ Price)*Q1 + 0.5* ∆ Price*(Q1 – Q0 )
Where ∆ Price is now equal to [956.89*(1-0.108)] – (956.89 – 172).
The total change in EU surplus is the sum of the changes to consumer surplus,
producer surplus and taxpayer surplus. If the new domestic policy were removed, the EU
producer surplus and the EU consumer surplus would both decrease by 144 million euro,
the EU taxpayer surplus would increase by 295.7 million euro and the total change in EU
welfare would be 7.7 million euro. The changes relative to total industry revenue are
the welfare changes divided by estimated total annual revenues of 1,260 euro.

103
References
Alston, J.M., Colin A. Carter, Richard Gray, and Daniel A. Sumner. “Third Country Effects and Second-Best Trade Policies: Export Subsidies and Bilateral Liberalization.” American Journal of Agricultural Economics, 79 (November 1997): 1300-1310.
Alston, J.M. Richard Gray and Daniel A. Sumner. “The Wheat War of 1994”. Canadian Journal of Agricultural Economics, 42(December 1994):231-251.
Alston, J.M. and Brian H. Hurd. “Some Neglected Social Costs of Government Spending in Farm Programs.” American Journal of Agricultural Economics, 72 (February 1990): 149-156.
Alston, J.M., George W. Norton, and Philip G. Pardey. Science Under Scarcity: Principles and Practice of Agricultural Research Evaluation and Priority Setting. Ithaca NY: Cornell University Press, 1995.
Armington, P.S. “A Theory of Demand for Products Distinguished by Place of Production.” IMF Staff Papers, 16 (1969): 159-176.
European Commission. Commission proposes a simpler and more flexible fruit andvegetable regime. IP/00/772. 2000.
European Commission. Proposal for a council regulation. Brussels. 2000/0191. July 12, 2000.
European Union Secretariat. The Agricultural Situation in the European Union. 1997.
Evans, Mark. Morning Star Company. Woodland, CA., Personal Communication. March 1999, March 2000, April 2000.
Food and Agriculture Organization of the United Nations. FAOSTAT Database. Various years.http://apps.fao.org/cgi-bin/nph-db.pl?subset=agriculture
Hart, David S. Effects of European Union Processing Tomato Policy on Trade and Welfare in the European Union and Elsewhere. University of California, Davis, Department of Agricultural and Resource Economics. Masters Thesis. December 2000.
Henin, Vincent, Jose Degand, and Bruno Henry de Frahan. Estudio del sector del tomate procesado en la Union Europea. CAMEF. Belgium. 1999.

104
Huang, Kuo. U.S. Demand for Food: A Complete System of Price and Income Effects. Technical Bulletin No. 1714 ERS-USDA. 1985.
Johnson, Paul R., Thomas Grennes and Marie Thursby. “Trade Models withDifferentiated Products.” American Journal of Agricultural Economics61(February 1979): 120-127.
Kay, Michael. Morning Star Company. Personal Communication. March 2000
Kuminoff, Nicolai, Daniel A. Sumner and Justin Tamony. California’s 1999 International Agricultural Exports. University of California Agricultural Issues Center. Issues Brief No. 13. 2000.
Official Journal of the European Union. OJ L 100 17.4.97. p 42 and various issues for years 1984 to 1999.
Strossman, Christine. The Effects of the Common Agricultural Policy on World Markets: A case study of processed tomatoes. Institut d'Etudes Européenes, Université Libre de Bruxelles. Masters Thesis. 1997.
Sumner, D.A. and Hart, D.S. “Government Policy and California Agriculture.”California Agriculture: Issues and Challenges. J. Seibert and A. Scheuring, eds. University of California, Giannini Foundation. Division of Agriculture and Natural Resources. 1997.
Sumner, Daniel A., and Christopher A. Wolf. 1996. “Quotas Without Supply Control: Effects of Dairy Quota Policy in California.” American Journal of Agricultural Economics, 78(May 1996): 354-366.
Tomato News. Tomato Products in the European Union: Statistical Report. Avignon, France. 1999.
United States Department of Agriculture. Agricultural Statistics. 2000.
United States Department of Agriculture. Foreign Agriculture Service GAIN Reports,Various years and countries. http://www.fas.usda.gov/scriptsw/attacherep/default.aspttp://
United States Department of Commerce. International Trade Association.http://www.ita.doc.gov/td/industry/otea/trade-detail