the measure of california agriculture, 2006 chapter...
TRANSCRIPT

PREPRINT DRAFT November 29, 2006
The Measure of California Agriculture, 2006
CHAPTER FIVE AGRICULTURE’S ROLE IN THE ECONOMY
The direct economic contribution of agriculture
Additional economic linkages of agriculture California agriculture in the global context
Agricultural Issues Center University of California

CHAPTER FIVE ■
Agriculture’s role in the economy■■■■■ The direct economic contribution of agriculture■■■■■ Additional economic linkages of agriculture■ ■ ■ ■ ■ California agriculture in the global context
California farmers constitute an essential part of the state economy. As earlychapters document, farm production is itself large and dynamic. Furthermore,farm production is closely linked to many other industries: the production offarm inputs, the processing of food and beverages, the textile industry, trans-portation and financial services. Including multiplier effects, California farmand closely related processing industries employ 7.3 percent of the state’sprivate sector labor force and account for 5.6 percent of the state laborincome. Every dollar of value added—labor and property income and indirectbusiness taxes—in farming and agricultural related industries generates anadditional $1.27 in the state economy. For every 100 jobs in agriculture,including the food industry, there are 94 additional jobs created throughoutthe state. California agriculture is also large on a global scale. Depending onthe method applied to measure the value of agriculture here and elsewhere,California ranks between 5th and 9th in the world, ahead of such countries asCanada, Mexico, Germany and Spain.
PREPRINT DRAFTNOVEMBER 29, 2006
2 | CHAPTER FIVE AGRICULTURE’S ROLE IN THE ECONOMY
The contribution of agricultureto the California gross stateproduct
California farms have a significant direct ef-fect on the state’s economy. According to theU.S. Bureau of Economic Analysis,California’s gross state product (GSP), thevalue added by all industries in the state, was$1,438 billion in 2003. At $21 billion (Table5.1), agriculture (farming), forestry, fishing,hunting, and support services accounted for1.45 percent of the California GSP.
Determining the share and role of agricul-ture in California’s economy depends in parton how agriculture is defined. Many indus-tries are related to farm production in gen-eral, but the degree of linkage varies. Froma very broad perspective, about 90,000 com-mercial establishments (in addition to farms)in California are related to agricultural pro-duction (Table 5.2). Within this group, someindustries such as food and beverage manu-facturing, are closely linked to local farm-ing, but others, such as restaurants, may beonly weakly related to local farm produc-tion. While food retailing depends on foodproduction, it does not usually depend muchon local production. Food produced in Cali-fornia is sold worldwide and food retailingoccurs even in places where local food pro-duction is minor.
With more than $61 billion in sales, the Cali-fornia food, beverage and tobacco manufac-turing industry employs nearly 200,000workers. There are 4,661 establishments inthe state that process farm products to pro-duce foods, beverages and tobacco. The bak-ery and tortilla manufacturing group has thelargest number of establishments (39%) andemployees (22%), but the beverage indus-try is the largest in sales (24%) (Table 5.3).Wineries account for most of the beveragesales value (fluid milk processing is includedwith dairy products).
California food, beverage and tobacco manu-facturing establishments account for 15 per-cent of these U.S. establishments and 11 per-cent of U.S. sales (Table 5.4). California’sshares of U.S. sales in the fruit and vegetablepreserving, dairy products, bakeries and tor-tilla, and beverage production subsectors areall larger than the state’s share of the agri-cultural and beverage processing sector as awhole.

THE MEASURE OF CALIFORNIA AGRICULTURE |3
TABLE 5.1
California gross state product by industry, 2003
($ million)
Agriculturee 9,304 -1,698 13,228 20,835Crop and animal production (farms) 4,701 -1,834 11,192 14,059Mining and utilities 7,412 5,285 21,666 34,365Manufacturing and construction 152,307 6,438 66,615 225,361Food and beverages manufacturing 9,601 3,056 4,168 16,824Wholesale trade 41,127 21,411 19,370 81,908Retail trade 55,315 22,613 26,529 104,458Transportation and warehousingf 21,544 854 11,350 33,748Information, finance and insurance 99,168 6,651 80,121 185,939Real estate, rental, and leasing 13,408 20,165 190,290 223,864Professional and management 97,573 1,300 40,029 138,903 servicesAdministrative and waste services 30,270 859 11,056 42,185Educational services 9,674 155 407 10,236Health care and social assistance 62,096 1,154 21,525 84,775Arts, entertainment, and recreation 12,199 503 5,966 18,668Accommodation and food services 23,286 3,876 9,895 37,057Other services, except government 22,584 2,451 10,473 35,508
Subtotal private industries 657,269 92,018 528,522 1,277,809
Government 147,740 -2,289 14,875 160,326
Total gross state product g 805,009 89,728 543,397 1,438,134
Source: U.S. Department of Commerce, Bureau of Economic Analysis, www.bea.gov/bea/regional/gsp
a Compensation of employees is the sum of employee wages and salaries and supplements to wages andsalaries. Wages and salaries are measured on an accrual, or “when earned” basis, which may be different fromthe measure of wages and salaries on a disbursement, or “when paid” basis. Wages and salaries and supple-ments of federal military and civilian government employees stationed abroad are excluded from the measure ofGSP.b Taxes on production and imports consist of tax liabilities, such as general sales and property taxes that arechargeable to business expense in the calculation of profit-type incomes. Also included are special assessments.This figure is the sum of state and local taxes — which are primarily nonpersonal property taxes, licenses, andsales and gross receipts taxes — and federal excise taxes on goods and services. Negative values for agricultureare taxes net of direct government subsidy.c Gross operating surplus is a value derived as a residual for most industries after subtracting total intermediateinputs, compensation of employees, and taxes on production and imports less subsidies from total industryoutput. Gross operating surplus includes consumption of fixed capital (CFC), proprietors’ income, corporateprofits, and business current transfer payments (net). Prior to 2003, it was referred to as other value added orproperty-type income.d Value added is equal to the sum of compensation to employees, taxes on production of inputs, and grossoperating surplus.e Agriculture includes farm production, forestry, fishing, hunting, and support services such as soil preparation,planting, harvesting, and management, on a contract or fee basis.f Not including U.S. Postal Service.g Gross state product (GSP) is the sum of value added by labor and capital in all industries located in the state.
Compen- sation to
employees a
Taxes onproduction &
imports b
Grossoperatingsurplus c
Valueadded d

4 | CHAPTER FIVE AGRICULTURE’S ROLE IN THE ECONOMY
TABLE 5.2
California’s agriculture-related industries, 2002
Establishments Sales Payroll Employees
Food, beverages and tobacco mfg. 4,661 61,615 6,515 196,508Textile mills 491 1,753 361 13,170Wood product mfg. 1,337 6,061 1,142 39,490Paper mfg. 560 8,587 1,226 29,379Pesticide, fertilizer and other chemical mfg. 96 668 77 2,020Farm machinery and equipment mfg. 104 284 60 1,729Food product machinery mfg. 73 238 69 1,616Grocery and related product wholesale 5,397 69,228 4,033 108,585Farm products raw materials wholesale 320 2,884 93 2,498Alcoholic beverage wholesale 511 12,071 942 18,843Grocery stores, supermarkets 9,928 55,956 6,407 263,645 and convenience storesSpecialty food stores 2,981 2,008 287 17,886Beer, wine and liquor stores 3,236 2,279 163 10,156Full-service restaurants 23,277 18,580 6,045 440,944Limited-service eating places 29,983 18,633 4,771 428,313Special food services 3,050 2,771 834 50,538Drinking places (alcoholic beverages) 3,769 1,372 327 30,996
Total agriculture-related industries 89,774 264,988 33,353 1,656,316
Total California, not including farming, 820,997 N/A 510,841 12,856,426government, railroad and employed sectors a
Source: U.S. Department of Commerce, Census Bureau, Economic Census, 2002,http:www.census.gov/econ/census02/data/ca/CA000_31.HTM and County Business Patterns.a This total is from the Census Bureau County Business Patterns.
($ million) ($ million)

THE MEASURE OF CALIFORNIA AGRICULTURE |5
TABLE 5.3
California food, beverage and tobacco manufacturing industry, 2002
Establishments Sales Payroll a EmployeesManufacturing industry
Animal feed b 147 3,077 177 4,069Grain and oilseed milling 98 2,838 182 4,042Sugar and confectionery products 220 2,410 346 10,054Fruit & vegetable preserving & specialty food 336 10,391 1,148 38,409Dairy products 211 9,078 624 14,802Animal slaughtering and processing 279 4,359 524 21,019Seafood product preparation and packaging 57 824 93 3,465Bakeries and tortilla 1,814 6,004 1,272 43,527Other food c 653 7,580 798 25,380Beverages 844 15,042 1,349 31,717Tobacco 2 12 1 24
Total food, beverages and tobacco 4,661 61,615 6,515 196,508
Source: U.S. Department of Commerce, Census Bureau, Economic Census, 2002,http://www.census.gov/econ/census02/data/ca/CA003_31.HTMa Annual payroll.b Includes pet and agricultural animal feed.c Includes snack food, coffee, tea, syrup, condiments and spice manufacturing.
TABLE 5.4
California share of the U.S. food, beverage and tobacco manufacturing industry,2002
Manufacturing industry description (percent)
Animal feed a 8.1 11.0 10.1 8.7Grain and oilseed milling 11.5 6.0 7.4 7.3Sugar and confectionery products 12.0 9.5 12.6 12.6Fruit & vegetable preserving & specialty food 19.3 19.5 21.4 21.7Dairy products 12.6 13.8 12.9 11.5Animal slaughtering and processing 7.0 3.6 4.1 4.2Seafood product preparation and packaging 7.6 9.4 8.8 8.4Bakeries and tortilla 15.9 12.4 13.8 14.1Other food b 17.0 13.1 14.9 15.7Beverages 29.1 23.1 24.6 23.3Tobacco 1.8 <0.1 0.1 0.1
Total California share of food, beverages 15.1 11.0 12.4 11.8and tobacco
Source: U.S. Department of Commerce, Census Bureau, Economic Census, 2002.http://www.census.gov/econ/census02/data/ca/CA003_31.HTMa Includes pet and agricultural animal feed.b Includes snack food, coffee, tea, syrup, condiment and spice manufacturing.
Establishments Sales Payroll Employees
($ million) ($ million)

6 | CHAPTER FIVE AGRICULTURE’S ROLE IN THE ECONOMY
The direct plus indirect effectsof agriculture
Agriculture creates significant ripple effects(i.e. multipliers) throughout California’seconomy. Each dollar earned within agricul-ture fuels a more vigorous economy bystimulating additional activity in the formof jobs, labor income and value added.
The Agricultural Issues Center utilizedIMPLAN Pro® version 2.0 software and ac-companying 2002 dataset to determinemultiplier effects. IMPLAN utilizes a modeldeveloped by the USDA Forest Service1 de-signed to model the interrelationshipsbetween the economic sectors in the stateand regional economies. The model employsinput-output tables to show transactionsamong sectors. For any given industry, themodel enables quantification of outputs(value of production), jobs, labor income andvalue added both before and after taking intoaccount the ripple effects on the entireeconomy. These ripple effects are expressedas a dollar value and as an industry multi-plier. Industry multipliers are typically a ratioclose to 2. For the agricultural productionand processing industry there is a valueadded multiplier of 2.27. Thus for everydollar of value added in that sector, there isan additional $1.27 added to the stateeconomy. Ripple effects may also be mea-sured in terms of jobs added to the economy.
Ripple, or multiplier effects are composed
of three types of effects—direct, indirect andinduced. Direct effects measure the directoutputs of a particular industry and thus aredetermined directly by that industry’s in-puts. Indirect effects are the secondaryinter-industry effects that one industry hason another. For example, increases in fertil-izer purchase by the vegetables, fruits andnuts subgroup indirectly results in the pro-duction of additional fertilizer as well asusage of additional natural gas to producethe fertilizer and increased production andtransport of the gas.2 These direct and indi-rect effects result in changes in populationand income, which in turn affect householdconsumption. Induced effects are thechanges in household consumption of goodsand services measured in employment, in-come and value added.
The industry multipliers are essentially theratio of total effects to direct effects for eachindustry. For example, in Table 5.5.A, thedirect effect from agricultural productionand processing was 744,920 jobs, the totaleffect (direct, indirect and induced) was1,445,357 jobs and, in Table 5.5.C, the em-ployment multiplier 1.94 (or additional 0.94jobs created for every job in agricultural pro-duction and processing). Here we can seethat the multiplier of 1.94 can be derived bydividing the total effect (1,445,357) by thedirect effect (744,920).
There is an important caveat when interpret-ing the multiplier effects of particularindustries. The total effects (direct, indirect
1 IMPLAN (IMpact Analysis for PLANning) developed by the U.S. Department of AgricultureForest Service, together with the Federal Emergency Management Agency and U.S. Depart-ment of Interior Bureau of Land Management. IMPLAN’s secondary database is derived frompublished sources including the U.S. Department of Commerce, Bureau of Economic Analysis,U.S. Department of Labor Bureau of Labor Statistics and U.S. Department of Agriculture.2 Our analysis is limited by the data available for use with IMPLAN, including their industryaggregations.

THE MEASURE OF CALIFORNIA AGRICULTURE |7
Multiplier effects differ by commodity be-cause the production of some commoditiesmay be related to more input and process-ing industries located within the state orregion than others. Multipliers may also dif-fer by region due to geographic dispersionof industries related to agriculture, differ-ences in aggregate size of agriculture andtype of commodities produced in that re-gion. In addition, state multiplier effects donot reflect interactions with industries lo-cated out of state. Some industries may havea greater impact at the state level, while otherindustries may have broader geographicimpacts, which are not included in theIMPLAN analysis for California.
Agriculture and the stateeconomy
In 2002, California’s multifaceted economysold goods and services worth almost $2.28trillion, provided 19.8 million jobs, paidnearly $915 billion in labor income (includ-ing employee compensation and proprietaryincome) and created $1.39 trillion of valueadded (Table 5.5.A). Considering direct ef-
fects only, the agriculture production andprocessing industry combined accounted for4.3 percent of the state output, 3.8 percentof the jobs, 2.5 percent of labor income, and2.9 percent of value added in the state (Table5.5.B).
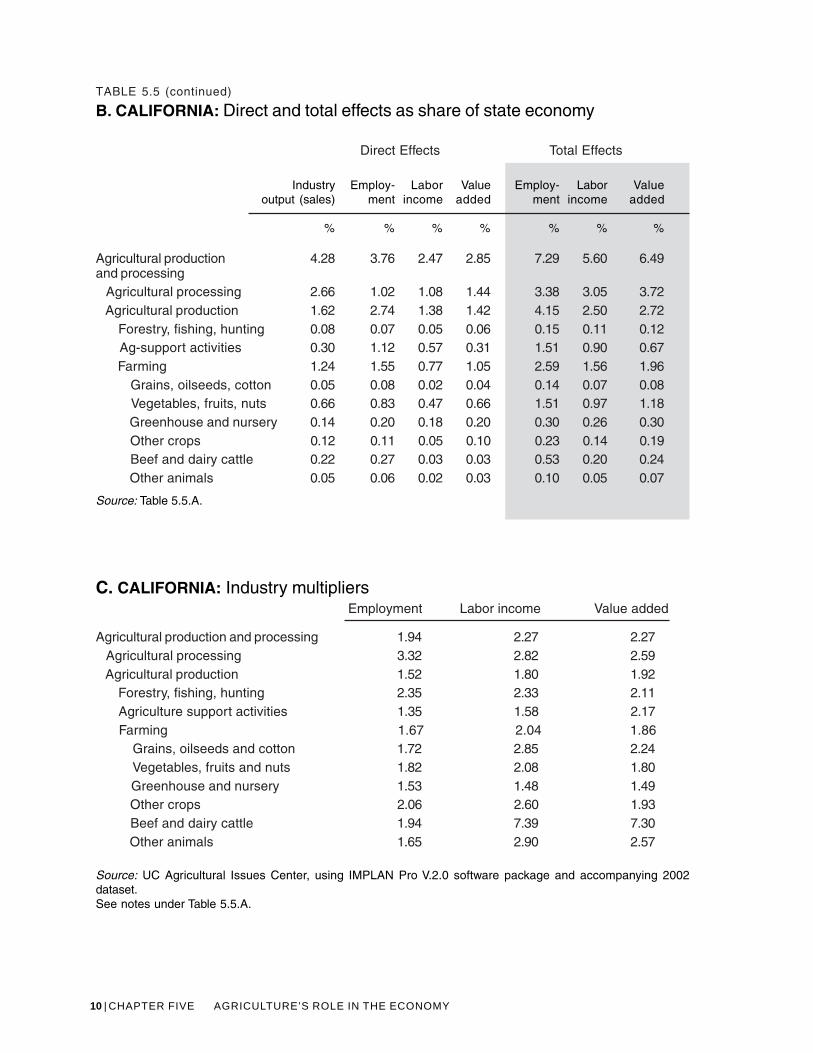
When taking into account direct, indirectand induced effects, the measured share ofagricultural production and processing in-creased to 7.3 percent of the 20 million jobsin the state, 5.6 percent of the state labor in-come, and 6.5 percent of the state valueadded. The total effects from agriculturalproduction alone accounted for 4.2 percentof state employment, 2.5 percent of laborincome and 2.7 percent of value added inthe state economy.
Farming directly accounted for 1.2 percent(i.e. $28.4 billion) of the state output. Thehighest valued subgroup within farming—vegetables, fruits and nuts—was worth $15billion in 2002, or 0.7 percent of the stateoutput. The direct, indirect and induced ef-fects of farming accounted for 2.6 percent(nearly 514 thousand jobs) of employmentin California, 1.6 percent ($14.3 billion) oflabor income, and 2 percent ($27.2 billion)of value added.
Vegetables, fruits and tree nuts accountedfor 1.5 percent of state employment, 1 per-cent of labor income and 1.2 percent of valueadded after including indirect and inducedeffects. Similarly, the beef and dairy indus-try, the second largest group within farming,accounted for $1.8 billion in labor incomeand 105 thousand jobs, or 0.5 percent ofstate employment.
The state and regional multipliers for the beefand dairy subgroup, which are presented inthis chapter, are much higher than those forother industries. Two main factors contrib-
and induced) and industry multipliers foraggregated subgroups are not equivalent tothe sums of the individual subgroups. Agri-cultural activities are related in many ways,so when regional economic impacts of oneindustry are measured, effects associatedwith the production of other industries arealso incorporated. Thus one industry’s out-put becomes another industry’s input. Toavoid double counting, each industry mustbe separately analyzed to determine a unique“net effect” on the regional economy. Thisis why the total economic effect of farmingis not the sum of the effects of each of thesubgroups—field crops, vegetables, fruits,dairy, etc.

8 | CHAPTER FIVE AGRICULTURE’S ROLE IN THE ECONOMY
uted to this unusual result. First, by theirnature, the beef and dairy industries, in con-trast to many other agricultural industries,have a higher portion of purchased inputs(feed, animals) relative to direct labor in-come and value added. Second, the directeffect estimates were biased down for Cali-fornia because the IMPLAN database usesnational parameters that reflect a large shareof activity from very small, part time cattlefarms contributing little or no value added.This makes estimations of total (direct, in-direct and induced) effects seem higher incomparison to the direct effect estimations,and thus the multipliers are higher. For Cali-fornia, the beef and dairy multiplier was 7.39for total labor income and 7.30 for total valueadded, when most other multipliers arecloser to 2.3
Agriculture support activities comprise anumber of activities closely related to agri-cultural production. Some are conducted onthe farm, some are not. All of these supportactivities are managed by a separate firm, notby the farm’s operator. They are reportedhere as a separate group as is done by theU.S. Census Bureau North American Indus-try Classification System (NAICS).Agricultural support activities include, forexample, soil preparation when this is con-tracted out, but does not include fieldpreparations activities done by the farm’soperator. It also includes packing and cool-ing of agricultural products when conductedby a non-farm firm. On-farm contract laboris particularly important for California, con-sidering how labor intensive are many of themost important crops produced in the state.
3 Unfortunately, given the built-in industry aggregation of IMPLAN categories, the beef anddairy industries could not be analyzed as two distinct industries.
Contract labor constitutes a large part of thesupport activity group. Under 2002 businessconditions, the value added directly attrib-utable to agricultural support services wassmaller than labor income, $4,273 millioncompared to $5,197 million, suggesting thatin 2002, the sector had negative return toother inputs (Tables 5.5.A and B).

THE MEASURE OF CALIFORNIA AGRICULTURE |9
TABLE 5.5
Economic impact of California’s agricultural production and processing, 2002
A. CALIFORNIA: Direct and total effectsa
Direct Effects Total Effectsb, c
Agricultural production 97,722 744,920 22,553 39,646 1,445,357 51,227 90,194and processing
Agricultural processingh 60,726 201,812 9,895 19,979 670,829 27,904 51,678 Agricultural production 36,996 543,108 12,658 19,667 822,879 22,843 37,769 Forestry, fishing, hunting 1,913 13,040 448 800 30,590 1,043 1,692 Ag-support activitiesi 6,731 221,819 5,197 4,273 300,351 8,200 9,277 Farming 28,352 308,248 7,013 14,594 513,542 14,283 27,173 Grains, oilseeds, cotton 1,201 16,134 213 519 27,727 608 1,161 Vegetables, fruits, nuts 14,977 164,333 4,279 9,100 298,868 8,881 16,407 Greenhouse and nursery 3,237 39,437 1,613 2,772 60,156 2,389 4,125 Other crops 2,698 21,736 497 1,393 44,806 1,291 2,695 Beef, dairy cattle 5,039 54,227 245 450 105,183 1,809 3,285 Other animals 1,199 12,381 166 361 20,458 483 928
Total California economy 2,281,194 19,831,054 914,708 1,389,164
Source: UC Agricultural Issues Center, using IMPLAN Pro V.2.0 software package and 2002 dataset.a Nominal dollars.b Total effects include direct, indirect and induced effects of the industry named a left.c Values that utilize multiplier effects cannot be aggregated to get totals.d Industry output: value of production (i.e. total sales) by the group of industries named at the left.e Employment: number of jobs directly employed by the corresponding industry.f Labor income: value of wages and salaries and other proprietary income paid by industry.g Value added equals sum of labor income (employee compensation and proprietor income), property income andindirect business taxes. This is the same as total sales (industry output) less purchased inputs and services.h This group includes animal feed, food and beverage industries.i Agricultural support activities includes contract labor, fertilizer and pesticides manufacturing, soil preparation andharvesting services, packing and cooling, and cotton ginning.
Industryoutput (sales)d
($million)
Employ-mente
(jobs)
Laborincomef
Valueaddedg
Employ-ment
(jobs)
Laborincome
Valueadded
($million) ($million)
10 | CHAPTER FIVE AGRICULTURE’S ROLE IN THE ECONOMY
TABLE 5.5 (continued)
B. CALIFORNIA: Direct and total effects as share of state economy
Direct Effects Total Effects
Industry Employ- Labor Value Employ- Labor Valueoutput (sales) ment income added ment income added
% % % % % % %
Agricultural production 4.28 3.76 2.47 2.85 7.29 5.60 6.49and processing Agricultural processing 2.66 1.02 1.08 1.44 3.38 3.05 3.72 Agricultural production 1.62 2.74 1.38 1.42 4.15 2.50 2.72 Forestry, fishing, hunting 0.08 0.07 0.05 0.06 0.15 0.11 0.12 Ag-support activities 0.30 1.12 0.57 0.31 1.51 0.90 0.67 Farming 1.24 1.55 0.77 1.05 2.59 1.56 1.96 Grains, oilseeds, cotton 0.05 0.08 0.02 0.04 0.14 0.07 0.08 Vegetables, fruits, nuts 0.66 0.83 0.47 0.66 1.51 0.97 1.18 Greenhouse and nursery 0.14 0.20 0.18 0.20 0.30 0.26 0.30 Other crops 0.12 0.11 0.05 0.10 0.23 0.14 0.19 Beef and dairy cattle 0.22 0.27 0.03 0.03 0.53 0.20 0.24 Other animals 0.05 0.06 0.02 0.03 0.10 0.05 0.07
Source: Table 5.5.A.
C. CALIFORNIA: Industry multipliersEmployment Labor income Value added
Agricultural production and processing 1.94 2.27 2.27 Agricultural processing 3.32 2.82 2.59 Agricultural production 1.52 1.80 1.92 Forestry, fishing, hunting 2.35 2.33 2.11 Agriculture support activities 1.35 1.58 2.17 Farming 1.67 2.04 1.86 Grains, oilseeds and cotton 1.72 2.85 2.24 Vegetables, fruits and nuts 1.82 2.08 1.80 Greenhouse and nursery 1.53 1.48 1.49 Other crops 2.06 2.60 1.93 Beef and dairy cattle 1.94 7.39 7.30 Other animals 1.65 2.90 2.57
Source: UC Agricultural Issues Center, using IMPLAN Pro V.2.0 software package and accompanying 2002dataset.See notes under Table 5.5.A.

THE MEASURE OF CALIFORNIA AGRICULTURE |11
Agriculture and regionaleconomies
The Central Valley region, which includesthe San Joaquin Valley in the south and Sac-ramento Valley in the north, is the largestagricultural region in the state. With $42 bil-lion output in 2002, Central Valleyagricultural production and processing ac-counted for 43 percent of California’s totalagricultural production and processingwhile the Central Coast region accounted for14 percent ($14 billion). In comparison tothe Central Coast, the Central Valley has asmaller total economy, so agriculture in theregion directly accounts for a much greatershare of the Central Valley economy.
Just as state multiplier effects do not includeinput and processing industries located outof state, regional multiplier effects do not re-flect out-of-region interactions. This explains,in part, differences in regional multipliers.Moreover, as with state estimates based onIMPLAN’s multipliers, which have been ad-justed to avoid double counting, we againcaution that one cannot determine regionaleffects by aggregating subgroups.
Central Valley
In 2002, agriculture production and process-ing industries in the Central Valley4 regiondirectly provided close to 368 thousand jobs,$9.2 billion in labor income, and $16 billionin value added (Table 5.6.A). In other words,15.6 percent of total regional output was di-rectly attributable to the agriculturalproduction and processing industry in theValley, 12.6 percent of regional employment,and 10 percent of value added (Table 5.6B).
4 Central Valley consists of Butte, Colusa, Fresno, Glenn, Kern, Kings, Madera, Merced,Sacramento, San Joaquin, Solano, Stanislaus, Sutter, Tehama, Tulare, Yolo and Yuba counties.
Vegetable, fruit, and nut production is thelargest farming industry in the Central Val-ley followed by the beef and dairy industry.
The Central Valley agricultural processingindustry accounts for about one-third of thestate’s agricultural processing output. Butwhen looking at the regional economy, theagricultural processing industry has a largertotal impact in the Central Valley region thanits overall impact in the state economy. Con-sidering direct, indirect and induced effects,the Central Valley agricultural processing in-dustry accounts for almost 8 percent of theregional employment, 7 percent of the re-gional labor income, and 9 percent of theregional value added, in contrast to less than4 percent for valued added in the state as awhole.
The Central Valley employment multiplierof the agricultural production and process-ing industry was 1.91, which means that forevery job in this sector 0.91 additional jobswere created in the Central Valley (Table5.6.C). Twenty-four percent of regionaljobs—about 704 thousand—were directlyand indirectly supported by the industry. Forvalue added, the production and process-ing multiplier was 2.21 and in total generated22.2 percent of the regional economy’s valueadded. The total impact of vegetable, fruitand nut production alone was estimated atnearly 7 percent (194 thousand jobs) of theoverall regional employment, almost 5 per-cent ($5.2 billion) of the labor income, and6 percent ($9.6 billion) of the regional out-put. The entire farming subgroup, includingvegetables, fruit and nuts, had an estimatedvalue added multiplier of 1.9 and directlyand indirectly was responsible for 9.2 per-cent of the regional value added and 10percent (nearly 303 thousand) of the jobs.

12 | CHAPTER FIVE AGRICULTURE’S ROLE IN THE ECONOMY
TABLE 5.6
Economic impact of Central Valley agricultural production and processing, 2002a
A. CENTRAL VALLEY: Direct and total effects in the regionb
Agricultural production 41,964 367,700 9,159 16,016 703,804 20,168 35,410
and processing
Agricultural processingi 20,503 65,029 2,854 5,595 228,777 7,935 14,526
Agricultural production 21,460 302,671 6,305 10,421 495,857 11,903 20,546
Forestry, fishing, hunting 1,018 4,383 182 383 17,395 540 895
Ag-support activitiesj 3,793 139,868 2,824 2,308 188,116 4,317 4,746
Farming 16,650 158,420 3,298 7,730 302,566 7,334 14,719
Grains, oilseeds, cotton 1,132 14,679 200 489 29,280 586 1,079
Vegetables, fruits, nuts 9,066 89,314 2,352 5,377 194,256 5,169 9,573
Greenhouse & nursery 541 4,374 214 463 7,501 309 626
Other crops 1,685 12,799 300 871 31,835 810 1,664
Beef and dairy cattle 3,550 33,120 148 317 80,696 1,333 2,472
Other animals 676 4,133 84 212 8,696 226 466
Total Central Valley 268,917 2,912,659 108,895 159,416economy
Source: UC Agricultural Issues Center, using IMPLAN Pro V.2.0 software package and 2002 dataset.
a Central Valley comprises San Joaquin and Sacramento Valleys. San Joaquin Valley is Fresno, Kern, Kings,Madera, Merced, San Joaquin, Stanislaus and Tulare counties. Sacramento Valley is Butte, Colusa, Glenn,Sacramento, Solano, Sutter, Tehama, Yolo and Yuba counties.b Nominal dollars.c Total effects include direct, indirect and induced effects of the industry named a left.d Values that utilize multiplier effects cannot be aggregated to get totals.e Industry output: value of production (i.e. total sales) by the group of industries named at the left.f Employment: number of jobs directly employed by the corresponding industry.g Labor income: value of wages and salaries and other proprietary income paid by industry.h Value added equals sum of labor income (employee compensation and proprietor income), property incomeand indirect business taxes. This is the same as total sales (industry output) less purchased inputs and services.i This group includes animal feed, food and beverage industries.j Agricultural support activities includes contract labor, fertilizer and pesticides manufacturing, soil preparationand harvesting services, packing and cooling, and cotton ginning.
Industryoutput (sales)e
($million)
Employ-mentf
(jobs)
Laborincome
($million)
Valueadded
($million)
Employ-ment(jobs)
Laborincomeg
($million)
Valueaddedh
($million)
Direct Effects Total Effectsc, d

THE MEASURE OF CALIFORNIA AGRICULTURE |13
TABLE 5.6 (continued)
B. CENTRAL VALLEY: Direct and total effects as share of regional economy
Agricultural production 15.60 12.62 8.41 10.05 24.16 18.52 22.21
and processing
Agricultural processing 7.62 2.23 2.62 3.51 7.85 7.29 9.11
Agricultural production 7.98 10.39 5.79 6.54 17.02 10.93 12.89
Forestry, fishing, hunting 0.38 0.15 0.17 0.24 0.60 0.50 0.56
Ag-support activities 1.41 4.80 2.59 1.45 6.46 3.96 2.98
Farming 6.19 5.44 3.03 4.85 10.39 6.74 9.23
Grains, oilseeds, cotton 0.42 0.50 0.18 0.31 1.01 0.54 0.68
Vegetables, fruits, nuts 3.37 3.07 2.16 3.37 6.67 4.75 6.01
Greenhouse & nursery 0.20 0.15 0.20 0.29 0.26 0.28 0.39
Other crops 0.63 0.44 0.28 0.55 1.09 0.74 1.04
Beef and dairy cattle 1.32 1.14 0.14 0.20 2.77 1.22 1.55
Other animals 0.25 0.14 0.08 0.13 0.30 0.21 0.29
Source: Table 5.6.A.
C. CENTRAL VALLEY: Industry multipliers
Employment Labor income Value added
Agricultural production and processing 1.91 2.20 2.21 Agricultural processing 3.52 2.78 2.60 Agricultural production 1.64 1.89 1.97 Forestry, fishing, hunting 3.97 2.96 2.33 Agriculture support activities 1.34 1.53 2.06 Farming 1.91 2.22 1.90 Grains, oilseeds and cotton 1.99 2.94 2.21 Vegetables, fruits and nuts 2.17 2.20 1.78 Greenhouse and nursery 1.71 1.44 1.35 Other crops 2.49 2.70 1.91 Beef and dairy cattle 2.44 9.00 7.80 Other animals 2.10 2.69 2.19
Source: UC Agricultural Issues Center, using IMPLAN Pro V.2.0 software package and 2002 dataset.See notes under Table 5.6.A.
Direct Effects Total Effects
Industryoutput (sales)
%
Employ-ment
%
Laborincome
%
Valueadded
%
Employ-ment
%
Laborincome
%
Valueadded
%

14 | CHAPTER FIVE AGRICULTURE’S ROLE IN THE ECONOMY
San Joaquin ValleyThe San Joaquin Valley5 regional output—including agricultural and non-agriculturalindustries—was $148 billion in 2002. Thetotal number of jobs was about 1.6 million,and the regional value added was $83 bil-lion. In this region (Table 5.7) the relativeimportance of agricultural production andprocessing output of the region is larger thanfor the state as a whole or the Central Valley.Agricultural production and processing out-put in this region accounted for 34.8 percentof the agricultural production and process-ing in the state. The San Joaquin Valleyagricultural production and processingindustry’s direct value added of $12.7 bil-lion (Table 5.7A) accounted for 15.3 percentof the value added in the regional economy,a much larger share than the 2.9 percentgenerated by the agricultural industry in thestate.
Considering direct effects only, farming ac-counted for 9.2 percent of regional output,8 percent of regional employment, and 7.4percent of regional value added. Within thefarming subgroup, vegetable, fruit, and nutproduction accounted for 5 percent of re-gional output, 4.6 percent of employment,and 5.3 percent of value added.
5San Joaquin Valley consists of Fresno, Kern, Kings, Madera, Merced, San Joaquin, Stanislausand Tulare counties.
The share of the total direct, indirect andinduced effects on the regional economy at-tributable to agricultural production andprocessing was larger for the San JoaquinValley than for any other region. Agriculturalproduction and processing industries in theSan Joaquin Valley accounted for 37.8 per-cent of regional employment, almost 30percent of regional labor income, and 34.2percent of regional total value added. Agri-cultural production alone supported 427thousand jobs (26.9 percent of the region’sjobs), generated $10 billion in labor income(18.1%) and $16.8 billion in value added(20.3%). The farming subgroup accountedfor 15.5 percent of employment, 10.6 per-cent of labor income, and 14 percent of valueadded. Within farming, the vegetable, fruit,and nut industry in the San Joaquin Valleyaccounted for 10.1 percent of regional em-ployment, 7.6 percent of labor income, and9.2 percent of value added.
The San Joaquin Valley employment multi-plier of the agricultural production andprocessing industry was 1.92, which meansthat for every 100 agricultural productionand processing jobs in the San Joaquin Val-ley, 92 additional jobs were created in theregion. The value added multiplier was 2.23and labor income was 2.19.

THE MEASURE OF CALIFORNIA AGRICULTURE |15
TABLE 5.7
Economic impact of San Joaquin Valley agricultural production and processing,2002a
A. SAN JOAQUIN VALLEY: Direct and total effects in the regionb
Agricultural production 34,005 313,277 7,567 12,698 601,102 16,580 28,345and processing Agricultural processingi 16,045 51,672 2,169 4,111 178,659 5,973 10,732 Agricultural production 17,960 261,605 5,398 8,587 427,260 10,033 16,836 Forestry, fishing, hunting 888 3,444 156 328 15,154 467 763 Ag-support activitiesj 3,447 130,858 2,560 2,085 174,076 3,843 4,156 Farming 13,625 127,303 2,681 6,174 245,542 5,883 11,648 Grains, oilseeds, cotton 815 8,368 146 349 19,127 419 755 Vegetables, fruits, nuts 7,380 73,077 1,946 4,388 160,132 4,192 7,658 Greenhouse & nursery 420 3,275 166 359 5,652 235 478 Other crops 1,147 9,224 208 592 22,481 548 1,108 Beef and dairy cattle 3,247 30,013 138 290 73,985 1,191 2,178 Other animals 617 3,346 77 197 7,450 201 416
Total San Joaquin Valley 147,716 1,588,703 55,411 82,999economy
Source: UC Agricultural Issues Center, using IMPLAN Pro V.2.0 software package and 2002 dataset.
a San Joaquin Valley is Fresno, Kern, Kings, Madera, Merced, San Joaquin, Stanislaus and Tulare counties.b Nominal dollars.c Total effects include direct, indirect and induced effects of the industry named a left.d Values that utilize multiplier effects cannot be aggregated to get totals.e Industry output: value of production (i.e. total sales) by the group of industries named at the left.f Employment: number of jobs directly employed by the corresponding industry.g Labor income: value of wages and salaries and other proprietary income paid by industry.h Value added equals sum of labor income (employee compensation and proprietor income), property income andindirect business taxes. This is the same as total sales (industry output) less purchased inputs and services.i This group includes animal feed, food and beverage industries.j Agricultural support activities includes contract labor, fertilizer and pesticides manufacturing, soil preparation andharvesting services, packing and cooling, and cotton ginning.
Industryoutput (sales)e
($million)
Employ-mentf
(jobs)
Laborincomeg
($million)
Valueaddedh
($million)
Direct Effects
Laborincome
($million)
Valueadded
($million)
Employ-ment
(jobs)
Total Effectsc, d

16 | CHAPTER FIVE AGRICULTURE’S ROLE IN THE ECONOMY
TABLE 5.7 (continued)
B. SAN JOAQUIN VALLEY: Direct and total effects as share of regional economy
Agricultural production 23.02 19.72 13.66 15.30 37.84 29.92 34.15and processing Agricultural processing 10.86 3.25 3.91 4.95 11.25 10.78 12.93 Agricultural production 12.16 16.47 9.74 10.35 26.89 18.11 20.28 Forestry, fishing, hunting 0.60 0.22 0.28 0.40 0.95 0.84 0.92 Ag-support activities 2.33 8.24 4.62 2.51 10.96 6.94 5.01 Farming 9.22 8.01 4.84 7.44 15.46 10.62 14.03 Grains, oilseeds, cotton 0.55 0.53 0.26 0.42 1.20 0.76 0.91 Vegetables, fruits, nuts 5.00 4.60 3.51 5.29 10.08 7.56 9.23 Greenhouse & nursery 0.28 0.21 0.30 0.43 0.36 0.42 0.58 Other crops 0.78 0.58 0.38 0.71 1.42 0.99 1.34 Beef and dairy cattle 2.20 1.89 0.25 0.35 4.66 2.15 2.62 Other animals 0.42 0.21 0.14 0.24 0.47 0.36 0.50
Source: Table 5.7.A.
C. SAN JOAQUIN VALLEY: Industry multipliers
Employment Labor income Value
Agricultural production and processing 1.92 2.19 2.23 Agricultural processing 3.46 2.75 2.61 Agricultural production 1.63 1.86 1.96 Forestry, fishing, hunting 4.40 2.99 2.33 Agriculture support activities 1.33 1.50 1.99 Farming 1.93 2.19 1.89 Grains, oilseeds and cotton 2.29 2.87 2.16 Vegetables, fruits and nuts 2.19 2.15 1.75 Greenhouse and nursery 1.73 1.42 1.33 Other crops 2.44 2.64 1.87 Beef and dairy cattle 2.47 8.60 7.51 Other animals 2.23 2.60 2.11
Source: UC Agricultural Issues Center, using IMPLAN Pro V.2.0 software package and 2002 dataset.See notes under Table 5.7.A.
Employ-ment
%
Laborincome
%
Valueadded
%
Employ-ment
%
Laborincome
%
Valueadded
%
Direct Effects Total Effects
Industryoutput (sales) %

THE MEASURE OF CALIFORNIA AGRICULTURE |17
Agriculture in the SacramentoValley
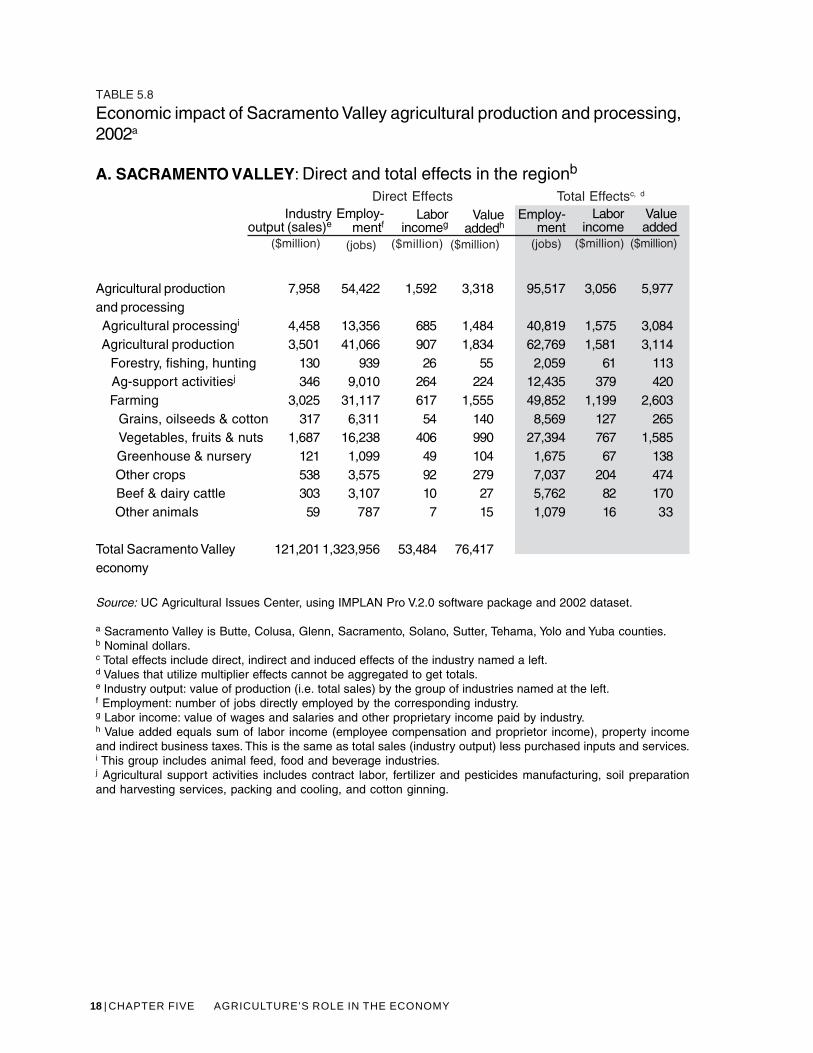
The total economy of the Sacramento Val-ley6 is similar in size to the economy of theSan Joaquin Valley. In 2002 the SacramentoValley economy recorded $121.1 billion intotal output, 1.3 million jobs, and $53 bil-lion in labor income. The regional valueadded was $76.4 billion. Agricultural pro-duction and processing output was $8.0billion, employment was above 54 thousandjobs, labor income was near $1.6 billion, andvalue added was $3.3 billion. Agriculturalproduction alone directly supported 41thousand jobs, $907 million in labor incomeand $1.8 billion in value added. The Sacra-mento Valley accounted for 8.1 percent ofthe total state output from agricultural pro-duction and processing.
Considering the multiplier effects, the agri-cultural production and processing industryaccounted for 96 thousand direct, indirectand induced jobs (7.2% of the regional to-tal), and $6 billion in value added (7.8%).For this industry the employment multiplierwas 1.76, the labor multiplier was 1.92, andvalue added 1.80. Agricultural productionalone supported nearly 63 thousand direct,indirect and induced jobs (4.7 percent of theregional employment), 1.6 billion in laborincome (3% of the regional labor income),and $3.1 billion in value added (4% of theregional economy).
In 2002, due to direct, indirect and inducedeffects, agricultural processing in the regionwas responsible for 41 thousand jobs, $1.6billion in labor income and $3.1 billion invalue added in the region—4 percent of Sac-
6Sacramento Valley consists of Butte, Colusa, Glenn, Sacramento, Solano, Sutter, Tehama, Yoloand Yuba counties.
ramento Valley’s value added. Like the SanJoaquin Valley and Central Valley, vegetables,fruits and nuts was the largest farming sub-group. Vegetables, fruit and nut productionin the Sacramento Valley generated 2.1 per-cent (over 27 thousand) of the jobs in theregion, 1.4 percent ($767 million) of laborincome and 2.1 percent ($1.6 billion) of thevalue added.
18 | CHAPTER FIVE AGRICULTURE’S ROLE IN THE ECONOMY
TABLE 5.8
Economic impact of Sacramento Valley agricultural production and processing,2002a
A. SACRAMENTO VALLEY: Direct and total effects in the regionb
Agricultural production 7,958 54,422 1,592 3,318 95,517 3,056 5,977and processing Agricultural processingi 4,458 13,356 685 1,484 40,819 1,575 3,084 Agricultural production 3,501 41,066 907 1,834 62,769 1,581 3,114 Forestry, fishing, hunting 130 939 26 55 2,059 61 113 Ag-support activitiesj 346 9,010 264 224 12,435 379 420 Farming 3,025 31,117 617 1,555 49,852 1,199 2,603 Grains, oilseeds & cotton 317 6,311 54 140 8,569 127 265 Vegetables, fruits & nuts 1,687 16,238 406 990 27,394 767 1,585 Greenhouse & nursery 121 1,099 49 104 1,675 67 138 Other crops 538 3,575 92 279 7,037 204 474 Beef & dairy cattle 303 3,107 10 27 5,762 82 170 Other animals 59 787 7 15 1,079 16 33
Total Sacramento Valley 121,201 1,323,956 53,484 76,417economy
Source: UC Agricultural Issues Center, using IMPLAN Pro V.2.0 software package and 2002 dataset.
a Sacramento Valley is Butte, Colusa, Glenn, Sacramento, Solano, Sutter, Tehama, Yolo and Yuba counties.b Nominal dollars.c Total effects include direct, indirect and induced effects of the industry named a left.d Values that utilize multiplier effects cannot be aggregated to get totals.e Industry output: value of production (i.e. total sales) by the group of industries named at the left.f Employment: number of jobs directly employed by the corresponding industry.g Labor income: value of wages and salaries and other proprietary income paid by industry.h Value added equals sum of labor income (employee compensation and proprietor income), property incomeand indirect business taxes. This is the same as total sales (industry output) less purchased inputs and services.i This group includes animal feed, food and beverage industries.j Agricultural support activities includes contract labor, fertilizer and pesticides manufacturing, soil preparationand harvesting services, packing and cooling, and cotton ginning.
Industryoutput (sales)e
($million)
Employ-mentf
(jobs)
Laborincome
($million)
Valueadded
($million)
Employ-ment
(jobs)
Laborincomeg
($million)
Valueaddedh
($million)
Direct Effects Total Effectsc, d

THE MEASURE OF CALIFORNIA AGRICULTURE |19
TABLE 5.8 (continued)
B. SACRAMENTO VALLEY: Direct and total effects as share of regional economy
Agricultural production 6.57 4.11 2.98 4.34 7.21 5.71 7.82and processing Agricultural processing 3.68 1.01 1.28 1.94 3.08 2.94 4.04 Agricultural production 2.89 3.10 1.70 2.40 4.74 2.96 4.07 Forestry, fishing, hunting 0.11 0.07 0.05 0.07 0.16 0.11 0.15 Ag-support activities 0.29 0.68 0.49 0.29 0.94 0.71 0.55 Farming 2.50 2.35 1.15 2.03 3.77 2.24 3.41 Grains, oilseeds & cotton 0.26 0.48 0.10 0.18 0.65 0.24 0.35 Vegetables, fruits & nuts 1.39 1.23 0.76 1.29 2.07 1.43 2.07 Greenhouse & nursery 0.10 0.08 0.09 0.14 0.13 0.13 0.18 Other crops 0.44 0.27 0.17 0.37 0.53 0.38 0.62 Beef & dairy cattle 0.25 0.23 0.02 0.04 0.44 0.15 0.22 Other animals 0.05 0.06 0.01 0.02 0.08 0.03 0.04
Source: Table 5.8.A.
C. SACRAMENTO VALLEY: Industry multipliersamento Valley: Industry multipliers
Employment Labor income Value added
Agricultural production and processing 1.76 1.92 1.80 Agricultural processing 3.06 2.30 2.08 Agricultural production 1.53 1.74 1.70 Forestry, fishing, hunting 2.19 2.37 2.05 Agriculture support activities 1.38 1.44 1.88 Farming 1.60 1.94 1.67 Grains, oilseeds and cotton 1.36 2.34 1.89 Vegetables, fruits and nuts 1.69 1.89 1.60 Greenhouse and nursery 1.52 1.39 1.33 Other crops 1.97 2.22 1.70 Beef and dairy cattle 1.85 8.43 6.28 Other animals 1.37 2.44 2.18
Source: UC Agricultural Issues Center, using IMPLAN Pro V.2.0 software package and 2002 dataset.See notes under Table 5.8.A.
Direct Effects Total EffectsIndustry
output (sales)
%
Employ-ment
%
Laborincome
%
Valueadded
%
Employ-ment
%
Laborincome
%
Valueadded
%

20 | CHAPTER FIVE AGRICULTURE’S ROLE IN THE ECONOMY
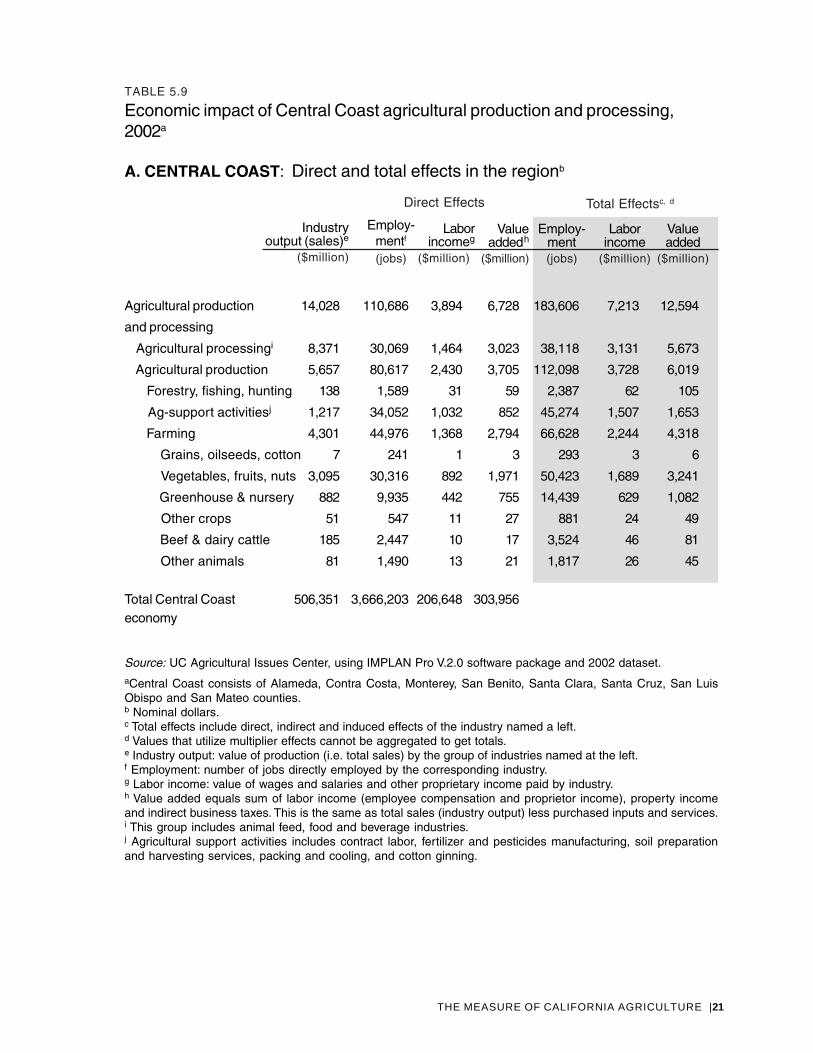
Central CoastWith $14 billion in output, the agriculturalproduction and processing industry in theCentral Coast region7 accounted for 14 per-cent of the agricultural production andprocessing in the state in 2002. Because theoverall Central Coast economy is verylarge—22 percent of the state economy—theregional agricultural production and pro-cessing industry contributed a smaller shareof the regional output than either the SanJoaquin or Sacramento Valley regions eventhough the value of agriculture in the Cen-tral Coast is larger than Sacramento Valley’sindustry.
Because it includes the relatively urban coun-ties of Alameda and San Mateo, despite alarge agriculture Central Coast agriculturalproduction and processing directly pro-duced only 2.8 percent ($14 billion) of theregional output, 3 percent (almost 111 thou-sand jobs) of regional employment, and 2.2percent ($6.7 billion) of the regional valueadded.
Based on IMPLAN estimates, Central Coastagricultural production and processing hasan employment multiplier of 1.66, meaningfor every 100 jobs in the industry 66 jobsadditional jobs are created in the region. Thisamounted to 184 thousand jobs, or 5 per-cent of regional employment as the direct,indirect and induced result of agriculturalproduction and processing in the region.The industry’s total impact on labor incomewas estimated as $7.2 million (3.5 percentof regional labor income), and the impact
on regional value added was $12.6 million(4 percent of the regional value added). Re-gional agricultural production alonesupported 3.1 percent (112 thousand jobs)of total regional employment, 1.8 percent($3.7 billion) of labor income, and 2 percent($6 billion) of value added. Farming ac-counted for 1.8 percent of employment, 1.1percent of labor income, and 1.4 percent ofvalue added.
7 Central Coast consists of Alameda, Contra Costa, Monterey, San Benito, San Luis Obispo, SanMateo, Santa Clara and Santa Cruz counties.
THE MEASURE OF CALIFORNIA AGRICULTURE |21
TABLE 5.9
Economic impact of Central Coast agricultural production and processing,2002a
A. CENTRAL COAST: Direct and total effects in the regionb
Agricultural production 14,028 110,686 3,894 6,728 183,606 7,213 12,594
and processing
Agricultural processingi 8,371 30,069 1,464 3,023 38,118 3,131 5,673
Agricultural production 5,657 80,617 2,430 3,705 112,098 3,728 6,019
Forestry, fishing, hunting 138 1,589 31 59 2,387 62 105
Ag-support activitiesj 1,217 34,052 1,032 852 45,274 1,507 1,653
Farming 4,301 44,976 1,368 2,794 66,628 2,244 4,318
Grains, oilseeds, cotton 7 241 1 3 293 3 6
Vegetables, fruits, nuts 3,095 30,316 892 1,971 50,423 1,689 3,241
Greenhouse & nursery 882 9,935 442 755 14,439 629 1,082
Other crops 51 547 11 27 881 24 49
Beef & dairy cattle 185 2,447 10 17 3,524 46 81
Other animals 81 1,490 13 21 1,817 26 45
Total Central Coast 506,351 3,666,203 206,648 303,956economy
Source: UC Agricultural Issues Center, using IMPLAN Pro V.2.0 software package and 2002 dataset.aCentral Coast consists of Alameda, Contra Costa, Monterey, San Benito, Santa Clara, Santa Cruz, San LuisObispo and San Mateo counties.b Nominal dollars.c Total effects include direct, indirect and induced effects of the industry named a left.d Values that utilize multiplier effects cannot be aggregated to get totals.e Industry output: value of production (i.e. total sales) by the group of industries named at the left.f Employment: number of jobs directly employed by the corresponding industry.g Labor income: value of wages and salaries and other proprietary income paid by industry.h Value added equals sum of labor income (employee compensation and proprietor income), property incomeand indirect business taxes. This is the same as total sales (industry output) less purchased inputs and services.i This group includes animal feed, food and beverage industries.j Agricultural support activities includes contract labor, fertilizer and pesticides manufacturing, soil preparationand harvesting services, packing and cooling, and cotton ginning.
Industryoutput (sales)e
($million)
Employ-mentf
(jobs)
Laborincome
($million)
Valueadded
($million)
Employ-ment(jobs)
Laborincomeg
($million)
Valueadded
h
($million)
Direct Effects Total Effectsc, d

22 | CHAPTER FIVE AGRICULTURE’S ROLE IN THE ECONOMY
Laborincome
Valueadded
Employ-ment
Total Effects
%
TABLE 5.9 (continued)
B. CENTRAL COAST: Direct and total effects as share of regional economy
Agricultural productionand processing 2.77 3.02 1.88 2.21 5.01 3.49 4.14 Agricultural processing 1.65 0.82 0.71 0.99 1.04 1.52 1.87 Agricultural production 1.12 2.20 1.18 1.22 3.06 1.80 1.98 Forestry, fishing, hunting 0.03 0.04 0.01 0.02 0.07 0.03 0.03 Ag-support activities 0.24 0.93 0.50 0.28 1.23 0.73 0.54 Farming 0.85 1.23 0.66 0.92 1.82 1.09 1.42 Grains, oilseeds & cotton 0.00 0.01 0.00 0.00 0.01 0.00 0.00 Vegetables, fruits & nuts 0.61 0.83 0.43 0.65 1.38 0.82 1.07 Greenhouse & nursery 0.17 0.27 0.21 0.25 0.39 0.30 0.36 Other crops 0.01 0.01 0.01 0.01 0.02 0.01 0.02 Beef & dairy cattle 0.04 0.07 0.00 0.01 0.10 0.02 0.03 Other animals 0.02 0.04 0.01 0.01 0.05 0.01 0.01
Source: Table 5.9.A
C. CENTRAL COAST: Industry multipliers
Employment Labor income Value added
Agricultural production and processing 1.66 1.85 1.87 Agricultural processing 1.27 2.14 1.88 Agricultural production 1.39 1.53 1.62 Forestry, fishing, hunting 1.50 2.01 1.77 Agriculture support activities 1.33 1.46 1.94 Farming 1.48 1.64 1.55 Grains, oilseeds and cotton 1.21 2.55 2.06 Vegetables, fruits and nuts 1.66 1.89 1.64 Greenhouse and nursery 1.45 1.42 1.43 Other crops 1.61 2.27 1.83 Beef and dairy cattle 1.44 4.86 4.93 Other animals 1.22 2.08 2.12
Source: UC Agricultural Issues Center, using IMPLAN Pro V.2.0 software package and 2002 dataset.See notes under Table 5.9.A.
Industryoutput (sales)
Employ-ment
Laborincome
Valueadded
Direct Effects
% % % % %%

THE MEASURE OF CALIFORNIA AGRICULTURE |23
California agriculture in theglobal California agriculture inthe global context
California is one of the top 10 economies inthe world. California overall economy islarger than Brazil, Russia, Canada or Mexico.California ranks 9th in the world using grossdomestic product (GDP)—where the UnitedStates as a whole is number one with or with-out California—and exchange rates adjustedfor purchasing power of cur-rency in the local economy(Table 5.10). Using market ex-change rates California movesto sixth, well ahead of Chinaand India (which move welldown in the ranking) and justahead of Italy.
Common currency units arenecessary to compare the GDPacross countries or states. Us-ing market exchange rates canbe misleading. For example, ifthe value of the Mexican pesowere to fall by half comparedto the U.S. dollar in a particu-lar year, the gross domesticproduct measured in dollarswould also fall by half. How-ever, the change in theexchange rate would resultfrom financial markets’ fluc-tuations. It does notnecessarily mean that Mexicanworkers or businesses aremuch poorer, particularly ifthey buy mainly local goodsand services. Incomes andprices measured in pesoswould likely change little andconsumers and businesseswould be affected only for the
goods with imported components. As an al-ternative to market exchange rates, column3 in Table 5.10 presents GDP purchasingpower parity (PPP) terms, which uses ratesof currency conversion that eliminate thedifferences in domestic price levels amongcountries. For comparison, column 5 listsGDP using market exchange rates.
Purchasing power parity exchange rates areespecially useful when official market ex-change rates are manipulated bygovernments. Countries with heavy govern-
TABLE 5.10
Gross domestic product (GDP)a of the top-15economies of the world, 2004
Rank ($ billion) Rank ($ billion)
United Statesd 1 11,249.2 1 11,649.8
China 2 6,353.8 8 1,412.3
Japan 3 3,517.8 2 4,296.2
India 4 2,889.8 13 579.7
Germany 5 2,256.0 3 2,406.3
France 6 1,619.6 5 1,762.2
United Kingdom 7 1,606.1 4 1,797.6
Italy 8 1,537.7 7 1,470.9
California 9 1,490.7 6 1,543.8
Brazil 10 1,390.6 16 492.3
Russia 11 1,290.0 17 432.8
Canada 12 977.3 9 869.9
Mexico 13 929.1 11 626.1
Spain 14 903.0 10 842.1
South Korea 15 836.9 12 605.4
Source: UC Agricultural Issues Center based on International MonetaryFund and Bureau of Economic Analysis, U.S. Department of Commerce.a GDP is the market value of goods and services produced by labor andproperty in the individual country.b GDP, based on purchasing power parity (PPP) exchange rates.c GDP, based on market exchange rates.d
Includes California
Country GDP marketexchange ratesc
GDP purchasing powerparity exchange rates b
24 | CHAPTER FIVE AGRICULTURE’S ROLE IN THE ECONOMY
ment control of the economysometimes enforce official ex-change rates that make theirown currency artificially strongor artificially weak. In suchcases, a purchasing power par-ity exchange rate is likely to bethe most realistic basis for aneconomic comparison. Coun-tries such as Japan, withinflated prices, see their agri-cultural GDP decline markedlyby using the purchasing powerparity approach. Note thateven using the PPP approachthe agriculture value-addedmeasures have not been ad-justed to reflect localagricultural prices relative toworld prices—a very difficultadjustment because of differen-tiated product quality.
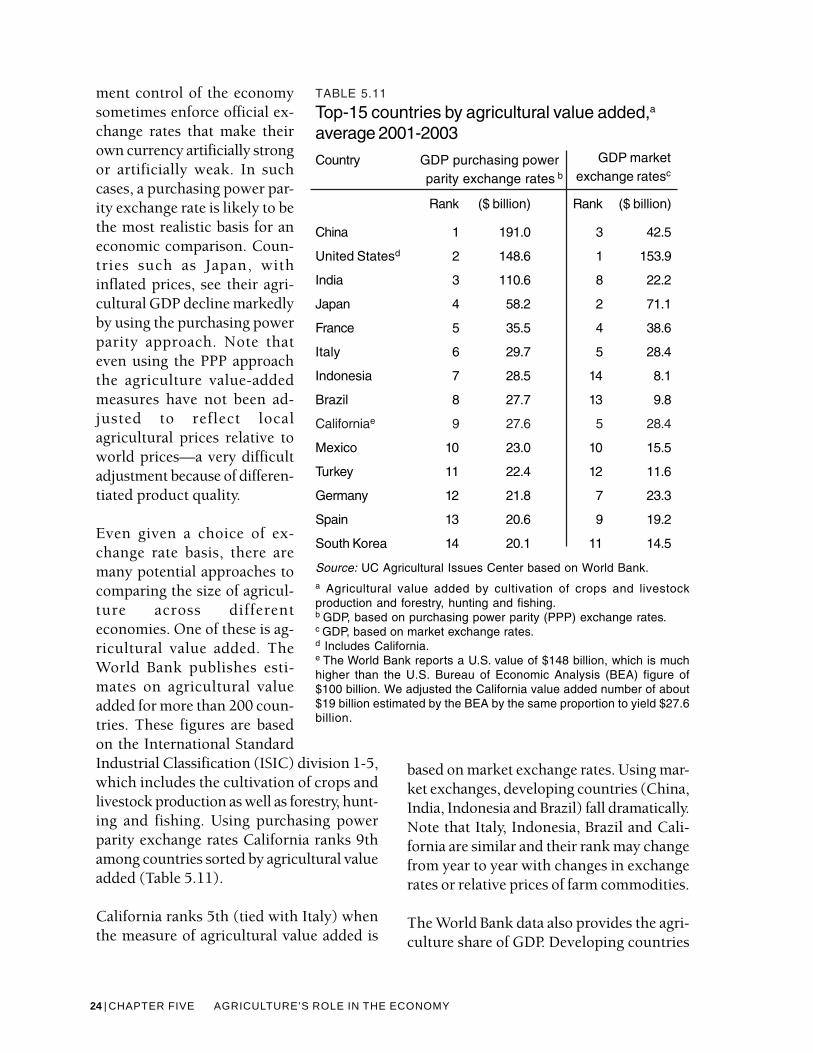
Even given a choice of ex-change rate basis, there aremany potential approaches tocomparing the size of agricul-ture across differenteconomies. One of these is ag-ricultural value added. TheWorld Bank publishes esti-mates on agricultural valueadded for more than 200 coun-tries. These figures are basedon the International StandardIndustrial Classification (ISIC) division 1-5,which includes the cultivation of crops andlivestock production as well as forestry, hunt-ing and fishing. Using purchasing powerparity exchange rates California ranks 9thamong countries sorted by agricultural valueadded (Table 5.11).
California ranks 5th (tied with Italy) whenthe measure of agricultural value added is
based on market exchange rates. Using mar-ket exchanges, developing countries (China,India, Indonesia and Brazil) fall dramatically.Note that Italy, Indonesia, Brazil and Cali-fornia are similar and their rank may changefrom year to year with changes in exchangerates or relative prices of farm commodities.
The World Bank data also provides the agri-culture share of GDP. Developing countries
GDP marketexchange ratesc
TABLE 5.11
Top-15 countries by agricultural value added,a
average 2001-2003
Country GDP purchasing power parity exchange rates b
Rank ($ billion) Rank ($ billion)
China 1 191.0 3 42.5
United Statesd 2 148.6 1 153.9
India 3 110.6 8 22.2
Japan 4 58.2 2 71.1
France 5 35.5 4 38.6
Italy 6 29.7 5 28.4
Indonesia 7 28.5 14 8.1
Brazil 8 27.7 13 9.8
Californiae 9 27.6 5 28.4
Mexico 10 23.0 10 15.5
Turkey 11 22.4 12 11.6
Germany 12 21.8 7 23.3
Spain 13 20.6 9 19.2
South Korea 14 20.1 11 14.5
Source: UC Agricultural Issues Center based on World Bank.a Agricultural value added by cultivation of crops and livestockproduction and forestry, hunting and fishing.b GDP, based on purchasing power parity (PPP) exchange rates.c GDP, based on market exchange rates.d Includes California.e The World Bank reports a U.S. value of $148 billion, which is muchhigher than the U.S. Bureau of Economic Analysis (BEA) figure of$100 billion. We adjusted the California value added number of about$19 billion estimated by the BEA by the same proportion to yield $27.6billion.
THE MEASURE OF CALIFORNIA AGRICULTURE |25
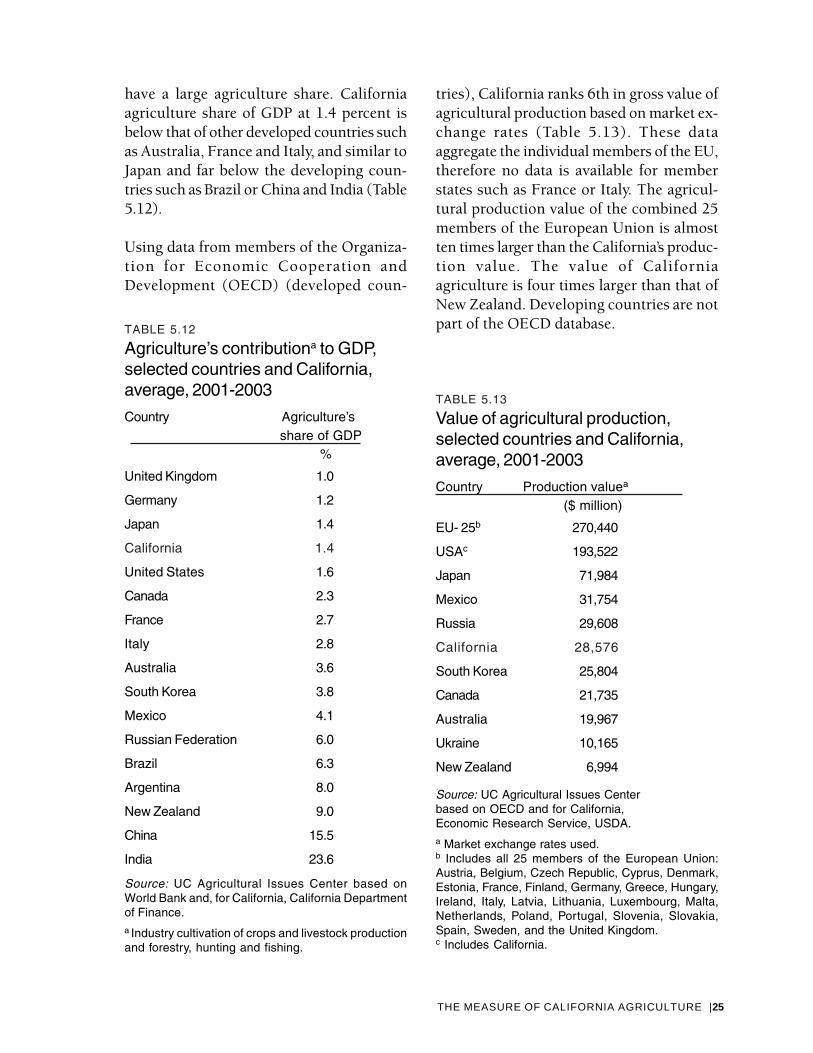
have a large agriculture share. Californiaagriculture share of GDP at 1.4 percent isbelow that of other developed countries suchas Australia, France and Italy, and similar toJapan and far below the developing coun-tries such as Brazil or China and India (Table5.12).
Using data from members of the Organiza-tion for Economic Cooperation andDevelopment (OECD) (developed coun-
TABLE 5.12
Agriculture’s contributiona to GDP,selected countries and California,average, 2001-2003
Country Agriculture’s share of GDP
%
United Kingdom 1.0
Germany 1.2
Japan 1.4
California 1.4
United States 1.6
Canada 2.3
France 2.7
Italy 2.8
Australia 3.6
South Korea 3.8
Mexico 4.1
Russian Federation 6.0
Brazil 6.3
Argentina 8.0
New Zealand 9.0
China 15.5
India 23.6
Source: UC Agricultural Issues Center based onWorld Bank and, for California, California Departmentof Finance.a Industry cultivation of crops and livestock productionand forestry, hunting and fishing.
TABLE 5.13
Value of agricultural production,selected countries and California,average, 2001-2003
Country Production valuea
($ million)
EU- 25b 270,440
USAc 193,522
Japan 71,984
Mexico 31,754
Russia 29,608
California 28,576
South Korea 25,804
Canada 21,735
Australia 19,967
Ukraine 10,165
New Zealand 6,994
Source: UC Agricultural Issues Centerbased on OECD and for California,Economic Research Service, USDA.a Market exchange rates used.b Includes all 25 members of the European Union:Austria, Belgium, Czech Republic, Cyprus, Denmark,Estonia, France, Finland, Germany, Greece, Hungary,Ireland, Italy, Latvia, Lithuania, Luxembourg, Malta,Netherlands, Poland, Portugal, Slovenia, Slovakia,Spain, Sweden, and the United Kingdom.c Includes California.
tries), California ranks 6th in gross value ofagricultural production based on market ex-change rates (Table 5.13). These dataaggregate the individual members of the EU,therefore no data is available for memberstates such as France or Italy. The agricul-tural production value of the combined 25members of the European Union is almostten times larger than the California’s produc-tion value. The value of Californiaagriculture is four times larger than that ofNew Zealand. Developing countries are notpart of the OECD database.

26 | CHAPTER FIVE AGRICULTURE’S ROLE IN THE ECONOMY
ConclusionCalifornia agriculture plays a major role inCalifornia’s large and diverse economy. Farmactivity is just a part of this role because up-stream and downstream linkages mean thatinputs both to farming and the processingand marketing of farm products depend onfarm production in California.
In this chapter we show that farming, for-estry, fishing and hunting account for about1.5 percent of the gross state product. Whenwe include activity closely related to farm-ing and indirect effects, the share rises to 6.5percent of the state value added. The sharesare larger in the Central Valley and especiallythe San Joaquin Valley.
California agriculture is large compared tothe economic activity generated by agricul-ture in other countries. California agricultureranks between 5th and 9th among countriesof the world, depending which currency ex-change rates are used.