economic consequence analysis, prof. adam rose, usc
TRANSCRIPT
Ex Ante Estimation of Economic
Consequences of Disasters
Adam Rose
Center for Risk and Economic Analysis of Terrorism Events
CREATE
October 27, 2016

2
Questions
• In what context are ex-ante econ loss evaluations useful?
>>Where events are infrequent and data are sparse
• How should gov’ts undertake them and in what form?
>>Best when standardized across disasters
>>Range of models, depending on accuracy needed
• How can ex-ante evaluations complement the gathering of
ex-post economic loss data?
>>Provide framework for analysis; fill in gaps
• Is the collection of ex-post data still necessary with the
increasing precision of ex ante economic modelling?
>>Ex-post can serve as validation checks

3
Overview
• Broad ECA Framework Imperative for Accuracy
- resilience
- extreme behavioral responses
- complex supply-chain linkages
- remediation
- mitigation and spillovers
• Overview
- CREATE ECA Framework
- example applications: resilience, behavioral, supply-chain
- implications for decision-making
- E-CAT Tool

4
Economic Consequences of
Bioterrorism Attacks (gross output impacts in billions of 2007 dollars)
Attack Target
Loss of Life
Ordinary
Business
Interruption
Behavioral
Linkage
Resilience
Total Gross
Output
Stadium −57.2 −0.5 −16.2 8.5 −65.4
Urban Center -2.2 −8.2 4.4 −6.0
Airport −1.0 −0.1 −220.0 119.5 −101.5
Foot & Mouth −5.4 −40.8 4.2 −42.0
Water Service −27.3 −2.6 26.7 −3.2

5
CREATE Economic Consequence
Analysis Framework

6
Economic Resilience
• Static:
- General Definition: Ability of a system to maintain
function when shocked.
- Econ Definition: Efficient use of remaining resources
at a given point in time to produce as much as possible.
• Dynamic
- General: Ability & speed of a system to recover.
- Economic: Efficient use of resources over time for
investment in repair and reconstruction, including
expediting the process & adapting to change.
o Metric: averted losses as % of potential losses
7
Background on Economic Resilience
• Two major perspectives:
1. Include everything done to reduce losses, pre- and
post-disaster (focus is mitigation of property damage)
2. Limit to actions implemented after the disaster hits
(acknowledging that resilience is a process; things can
be done to advance to build resilience capacity)
- e.g., emergency drills, back-up generators, alternative suppliers
- however, these are not implemented until after the disaster hits
• The latter perspective may strike some as odd:
How can you reduce property damage post-disaster?

8
New Hazard Loss Estimation Paradigm
• Focus shifts to the flow of goods and services
emanating from the property, or capital stock
(typically measured in terms of GDP or employment,
often referred to as Business Interruption, or BI)
• BI just begins at the point of the disaster &
continues until an entity has recovered
• Thus BI is more complicated in many ways than
addressing property damage, because it includes:
- behavioral considerations
- policy considerations
9
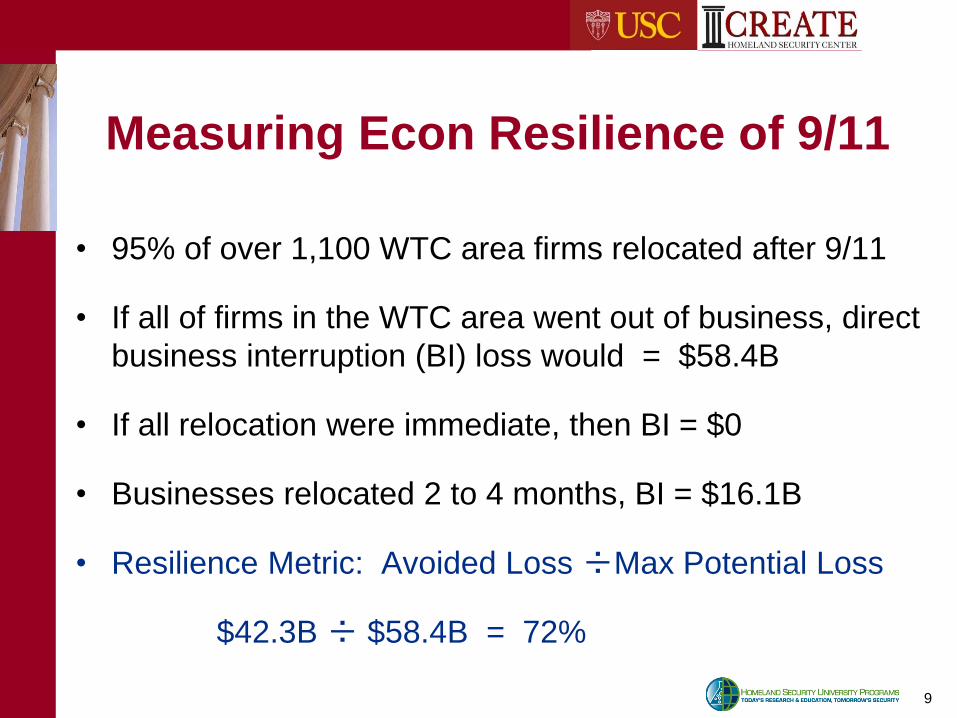
Measuring Econ Resilience of 9/11
• 95% of over 1,100 WTC area firms relocated after 9/11
• If all of firms in the WTC area went out of business, direct
business interruption (BI) loss would = $58.4B
• If all relocation were immediate, then BI = $0
• Businesses relocated 2 to 4 months, BI = $16.1B
• Resilience Metric: Avoided Loss ÷Max Potential Loss
$42.3B ÷ $58.4B = 72%

10
Supply-Chain Example: Port Valuation
• Recent CREATE studies
- 90-day closure of Port Arthur/Port Beaumont [USCG]
- 2-day tsunami closure of Ports of LA/LB [USGS]
• Standard approach for estimating economic
impact of a port: direct econ activity X multiplier
- Direct economic activity = Port revenue
- PA/PB: $220 million X 5.9 = $1.3 billion
• But the standard approach misses the value of the
cargo & its contribution to rest of the economy

11
Estimating Total Economic Impacts of a Port Disruption, Cargo Damages & Terminal Downtime

12
CGE Modeling Overview
• Computable General Equilibrium Analysis:
Model of the entire economy based on decisions by
individual producers & consumers in response to price
signals within limits of available K, L, I, M, N.
(The economy as a set of intercnnected supply chains)
• USCGE Model:
- 58 Economic Sectors
- 3 Factor Payment types plus Taxes
- 9 Household Income Brackets
- Other Institutions and Trade

13
Resilience to Port Disruptions (90-day Port Arthur Disruption; Avoided BI Losses)
Strategic Petroleum Reserve 2.4%
Ordinary Inventories of All Goods 17.0
Conservation by Customers 3.0
Import Ship Rerouting 23.1
Export Diversion (Replace Imports) 7.0
Production Rescheduling 25.4
Total Resilience (not additive) 67.0%

14
Results for Port Arthur/Beaumont (90-day Disruption; Business Interruption Loss)
• Comparison of estimates:
- Standard estimate: $1.3 billion
- SOA approach (w/o resilience): $14.8 billion
- SOA approach (w/ resilience): $4.8 billion
• Supply chain effects increase impacts 10-fold
• Resilience lowers impacts 67% (relatively low-cost)

15
Behavioral Linkages
• Off-site responses associated with behavioral
changes (business, household, investor, worker)
• Emanates from social amplification of risk &
stigma effects (media coverage, rumor)
• Fear feeds on itself and spreads
• Translates into direct and indirect BI losses
• Can be 2 to 3 orders of magnitude higher

16
Behavioral Linkage Examples
• 9/11 led to a 2-year reduction in air travel
• Workers fear of riding the subway/bus
• Business fear of staying open after dark
• Investor fear of taking high risk
• General avoidance behavior
• Gov’t premature shutdown or evacuation

17
RDD Attack Example
Direct Economic Losses
• Casualties: $26.2 million for labor input
(modeled as decrease in L productivity)
• Capital Damage: relatively minor
(capital simply off limits for 30 days)
• Business interruption: $1.4 billion of lost output
(recalibration of technical efficiency parameter)

Direct Behavioral Effects
(Burns and Slovic Experiment)
• Consumer/tourist risk perceptions
- 15 to 23% price discount (subset of goods)
- mid-range of stigma-related WTP literature
• Employee risk perceptions
- >25% risk premium in affected area
- much higher than WTP literature
• Investor risk perceptions (non-survey)
- 20% rate of return premium
- mid-range of property value studies, factoring in Tobin’s Q
19
Behavioral Results & Conclusions
• Psychological impacts of disasters are measurable
(fear & uncertainty from SAR and Stigma)
• Can translate them into changes in econ behavior
• For terrorist attacks may be especially high in L-R
- 19.4 times as high as ordinary direct effects
- 14.9 times as high as total ordinary effects
• Policy Implications
- gov’t needs to provide assurances of safety
- media has a responsibility in reporting

20
E-CAT Objectives
• Develop a standardized capability to estimate
economic consequences of 30+ types of threats
- includes a comprehensive set of impact categories
- standardization facilitates comparisons
• Transition the research into a user-friendly, fast
software tool for high-level decision-makers
- risk mgt: resource allocation across multiple threats
- rapid response: estimates for remediation/aid/recovery

21
E-CAT Analytical Stages
Step 1:
Enumeration Tables
Step 2:
Direct Impact
Step 3:
User Interface Variables
Step 4:
CGE Analysis
Step 5:
Reduced Form
Analysis
Step 6:
Uncertainty Analysis
Step 7:
E-CAT Software
1. Enumeration Tables – Qualitative Direct Impact estimates identified
from historical data, literature, or expert judgment
2. Lower- and upper-bound Direct Impact values estimated for each
category above the “Low Influence” threshold
3. User Interface Variables identified: (Magnitude, Time of Day, Duration, Economic Structure, Location, Clean Up,
Behavioral Avoidance & Aversion, Resilience Relocation, Substitution, Recapture)
4. Randomized draws of 100 variable combinations converted to CGE
inputs and run to estimate GDP and employment impacts
5. Reduced-form equation estimated with OLS & quantile regression
6. Uncertainty distributions generated with reduced-form results
7. Reduced-form equations and uncertainty analysis combined into the
user-friendly interface of the E-CAT tool
22
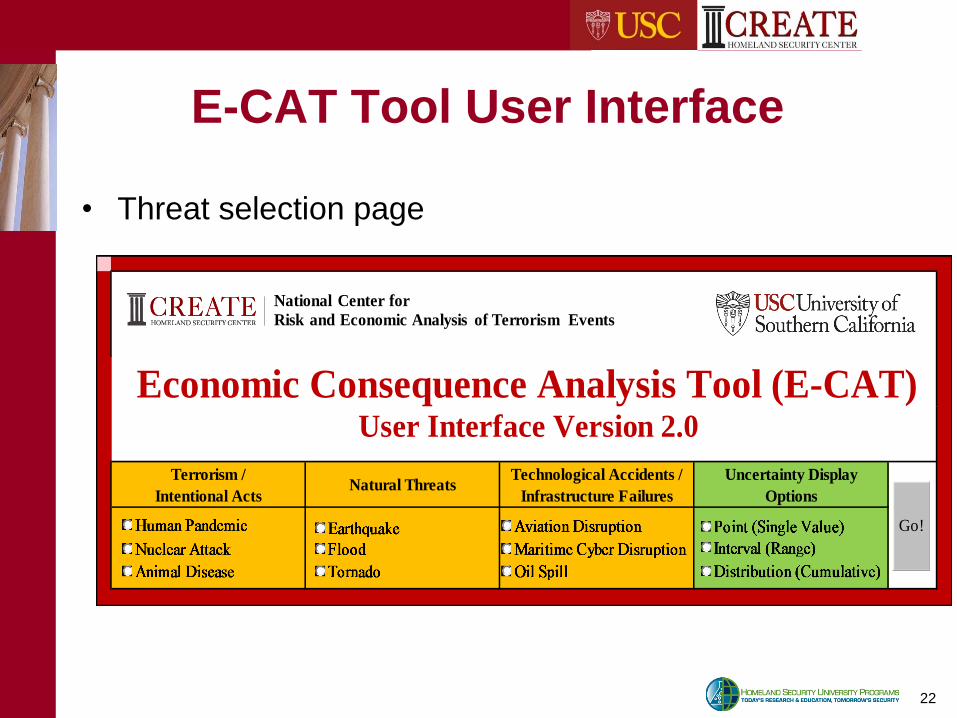
E-CAT Tool User Interface
• Threat selection page
Economic Consequence Analysis Tool (E-CAT)User Interface Version 2.0
Technological Accidents /
Infrastructure FailuresNatural Threats
Terrorism /
Intentional Acts
Uncertainty Display
Options
Go!
National Center for
Risk and Economic Analysis of Terrorism Events
23
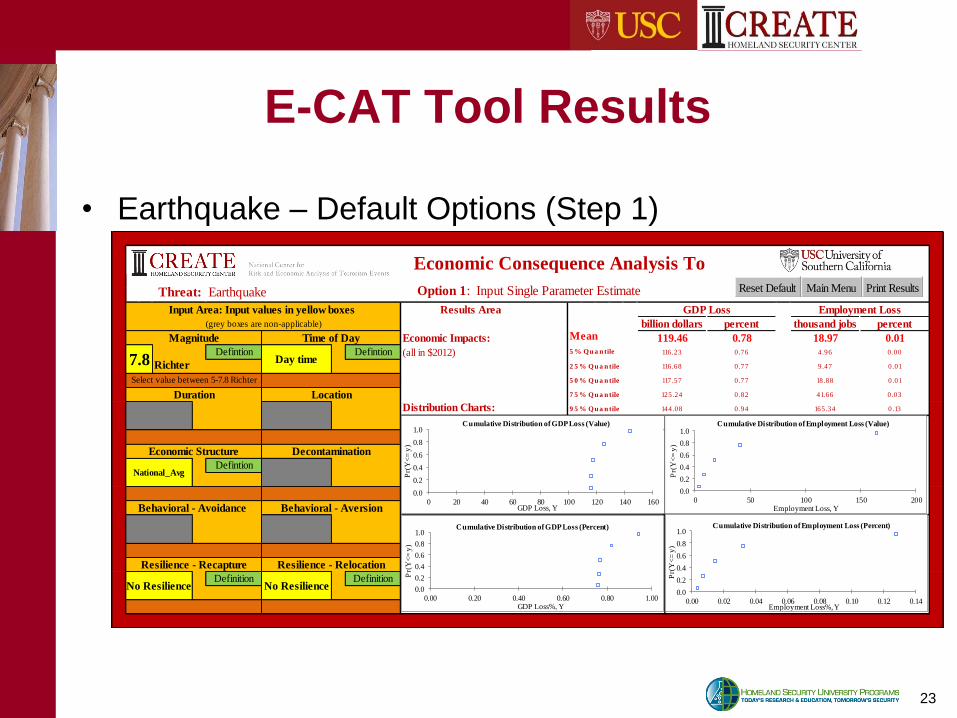
E-CAT Tool Results
• Earthquake – Default Options (Step 1)
Economic Impacts: Mean
(all in $2012) 5 % Qu a n tile
Richter 2 5 % Qu a n tile
5 0 % Qu a n tile
7 5 % Qu a n tile
Distribution Charts: 9 5 % Qu a n tile
No Resilience
Resilience - Recapture Resilience - Relocation
DefinitionNo Resilience
Definition
Behavioral - Avoidance Behavioral - Aversion
Economic Structure Decontamination
National_AvgDefintion
Select value between 5-7.8 Richter
Duration Location
7.8Defintion
Day timeDefintion
Input Area: Input values in yellow boxes
Economic Consequence Analysis Tool
(grey boxes are non-applicable)
Magnitude Time of Day
Threat: Earthquake Option 1: Input Single Parameter Estimate
Results Area GDP Loss Employment Loss
billion dollars percent thousand jobs percent
119.46 0.78 18.97 0.01
116.23 4.96
116.68
117.57
125.24
144.08
0.76
0.77
0.77
0.82
0.94
9.47
18.88
41.66
165.34
0.00
0.01
0.01
0.03
0.13
0.0
0.2
0.4
0.6
0.8
1.0
0 20 40 60 80 100 120 140 160
Pr(
Y<
= y
)
GDP Loss, Y
Cumulative Distribution of GDP Loss (Value)
0.0
0.2
0.4
0.6
0.8
1.0
0.00 0.20 0.40 0.60 0.80 1.00
Pr(
Y<
= y
)
GDP Loss%, Y
Cumulative Distribution of GDP Loss (Percent)
0.0
0.2
0.4
0.6
0.8
1.0
0 50 100 150 200
Pr(
Y<
= y
)
Employment Loss, Y
Cumulative Distribution of Employment Loss (Value)
0.0
0.2
0.4
0.6
0.8
1.0
0.00 0.02 0.04 0.06 0.08 0.10 0.12 0.14
Pr(
Y<
= y
)
Employment Loss%, Y
Cumulative Distribution of Employment Loss (Percent)
Main Menu Print ResultsReset Default

24
E-CAT Tool Results
• Earthquake – 6.0 Richter Magnitude (Step 2)
Economic Impacts: Mean
(all in $2012) 5 % Qu a n tile
Richter 2 5 % Qu a n tile
5 0 % Qu a n tile
7 5 % Qu a n tile
Distribution Charts: 9 5 % Qu a n tile
No Resilience
Resilience - Recapture Resilience - Relocation
DefinitionNo Resilience
Definition
Behavioral - Avoidance Behavioral - Aversion
Economic Structure Decontamination
National_AvgDefintion
Select value between 5-7.8 Richter
Duration Location
6.0Defintion
Day timeDefintion
Input Area: Input values in yellow boxes
Economic Consequence Analysis Tool
(grey boxes are non-applicable)
Magnitude Time of Day
Threat: Earthquake Option 1: Input Single Parameter Estimate
Results Area GDP Loss Employment Loss
billion dollars percent thousand jobs percent
6.41 0.04 2.48 0.00
6.00 0.62
6.01
6.09
6.49
7.29
0.04
0.04
0.04
0.04
0.05
1.06
1.96
3.86
10.72
0.00
0.00
0.00
0.00
0.01
0.0
0.2
0.4
0.6
0.8
1.0
0 1 2 3 4 5 6 7 8
Pr(
Y<
= y
)
GDP Loss, Y
Cumulative Distribution of GDP Loss (Value)
0.0
0.2
0.4
0.6
0.8
1.0
0.00 0.01 0.02 0.03 0.04 0.05 0.06
Pr(
Y<
= y
)
GDP Loss%, Y
Cumulative Distribution of GDP Loss (Percent)
0.0
0.2
0.4
0.6
0.8
1.0
0 2 4 6 8 10 12
Pr(
Y<
= y
)
Employment Loss, Y
Cumulative Distribution of Employment Loss (Value)
0.0
0.2
0.4
0.6
0.8
1.0
0.00 0.00 0.00 0.01 0.01 0.01
Pr(
Y<
= y
)
Employment Loss%, Y
Cumulative Distribution of Employment Loss (Percent)
Main Menu Print ResultsReset Default

25
E-CAT Tool Results
• Earthquake – Relocation (high)
Economic Impacts: Mean
(all in $2012) 5 % Qu a n tile
Richter 2 5 % Qu a n tile
5 0 % Qu a n tile
7 5 % Qu a n tile
Distribution Charts: 9 5 % Qu a n tile
Lower_B
Resilience - Recapture Resilience - Relocation
DefinitionUpper_B
Definition
Behavioral - Avoidance Behavioral - Aversion
Economic Structure Decontamination
ManufacturingDefintion
Select value between 5-7.8 Richter
Duration Location
6.0Defintion
Day timeDefintion
Input Area: Input values in yellow boxes
Economic Consequence Analysis Tool
(grey boxes are non-applicable)
Magnitude Time of Day
Threat: Earthquake Option 1: Input Single Parameter Estimate
Results Area GDP Loss Employment Loss
billion dollars percent thousand jobs percent
2.19 0.01 4.75 0.00
2.10 2.98
2.11
2.13
2.23
2.30
0.01
0.01
0.01
0.01
0.01
3.36
3.74
5.32
9.68
0.00
0.00
0.00
0.00
0.01
0.0
0.2
0.4
0.6
0.8
1.0
2 2 2 2 2 2 2
Pr(
Y<
= y
)
GDP Loss, Y
Cumulative Distribution of GDP Loss (Value)
0.0
0.2
0.4
0.6
0.8
1.0
0.01 0.01 0.01 0.01 0.01 0.01 0.01 0.01
Pr(
Y<
= y
)
GDP Loss%, Y
Cumulative Distribution of GDP Loss (Percent)
0.0
0.2
0.4
0.6
0.8
1.0
0 2 4 6 8 10 12
Pr(
Y<
= y
)
Employment Loss, Y
Cumulative Distribution of Employment Loss (Value)
0.0
0.2
0.4
0.6
0.8
1.0
0.00 0.00 0.00 0.00 0.00 0.01 0.01 0.01 0.01
Pr(
Y<
= y
)
Employment Loss%, Y
Cumulative Distribution of Employment Loss (Percent)
Main Menu Print ResultsReset Default

26
Summary
• In what context are ex-ante econ loss evaluations useful?
>>Where events are infrequent and data are sparse
• How should gov’ts undertake them and in what form?
>>Best when standardized across disasters
>>Range of models, depending on accuracy needed
• How can ex-ante evaluations complement the gathering of
ex-post economic loss data?
>>Provide framework for analysis; fill in gaps
• Is the collection of ex-post data still necessary with the
increasing precision of ex ante economic modelling?
>>Ex-post can serve as validation checks

27
Selected ECA Case Studies
Study Topic Threat Direct Impact
Location Impact Scope Net Impact
Rose et al. (2016) tsunami California tsunami
California Coast
California & U.S.
-$0.63B (US)
(GDP)
Wing et al. (2015) severe winter
storm ARkStorm California California -$236.4B
(GDP)
Rose and Wei
(2013) seaport disruption port shutdown/
tanker accident
Port Beaumont &
Port Arthur, Texas Port Metro Area
& US -$2.1B (Port) -$4.2B (US)
(gross output)
Oladosu et al.
(2013) agroterrorism
foot and mouth
disease San Joaquin
Valley, CA United States -$0.09B
(GDP)
Geisecke et al.
(2012) radiological
dispersal device dirty bomb Los Angeles
Financial District Los Angeles County -$12.8B
(10-year)
(GDP)
Rose et al. (2011) earthquake Verdugo
Earthquake Los Angeles
City Los Angeles
County -$0.35B
(gross output)
Rose et al. (2011) earthquake ShakeOut Earthquake
San Andreas Fault Southern California -$67B (gross output)
Rose et al. (2009) airliner as weapon 9/11 attacks on
WTC New York
City NY Metro Area and
US -$109B (US)
(GDP)
Rose et al. (2007) electricity
blackout attack on electric
system Los Angeles
City Los Angeles
County -$2.84B
(gross output)
Rose et al. (2007) water outage
attack on water system
Los Angeles
City Los Angeles County -$2.25B
(gross output)

28
Economic Consequence Publications
• Rose, A., M. Avetisyan, W. Burns, H. Rosoff, and P. Slovic. 2016. “The Role of Behavioral Responses in the Total
Economic Consequences of Terrorist Attacks on U.S. Air Travel Targets,” Risk Analysis, forthcoming.
• Rose, I. Sue Wing, D. Wei and A. Wein. 2016. “Economic Impacts of a California Tsunami,” Natural Hazards Review,
published on-line thus far.
• Prager F., D. Wei, and Rose. 2016. “Total Economic Consequences of an Influenza Outbreak in the United States,”
Risk Analysis, published on-line thus far.
• Rose, A. and C. Huyck. 2016. “Improving Catastrophe Modeling for Business Interruption Insurance Needs,” Risk
Analysis, published on-line thus far.
• Rose, A. 2015. “Macroeconomic Consequences of Terrorist Attacks: Estimation for the Analysis of Policies and
Rules," in C. Mansfield and V.K. Smith (eds.), Benefit Transfer for the Analysis of DHS Policies and Rules,
Cheltenham, UK: Edward Elgar.
• Rose, A. and E. Krausmann. 2013. “An Economic Framework for the Development of a Resilience Index for Business
Recovery,” International Journal of Disaster Risk Reduction 5(October): 73-83
• Rose, A. and D. Wei. 2013. “Estimating the Economic Consequences of a Port Shutdown: The Special Role of
Resilience,” Economic Systems Research 25(2): 212-32.
• Geisecke, J., A. Rose, P. Slovic et al. 2012. "Assessment of the Regional Economic Impacts of Catastrophic Events:
A CGE Analysis of Resource Loss and Behavioral Effects of a Radiological Dispersion Device Attack Scenario," Risk
Analysis 32: 583-600.
• Rose, A., S. Liao and A. Bonneau. 2011. “Regional Economic Impacts of a Verdugo Earthquake Disruption of Los
Angeles Water Supplies: A Computable General Equilibrium Analysis,” Earthquake Spectra 27(3): 881-906.
• Rose, A. 2009. "A Framework for Analyzing and Estimating the Total Economic Impacts of a Terrorist Attack and
Natural Disaster,” Journal of Homeland Security and Emergency Management 6: Article 4.
• Rose, A., G. Oladosu, B. Lee and G. Beeler Asay. 2009. "The Economic Impacts of the 2001 Terrorist Attacks on the
World Trade Center: A Computable General Equilibrium Analysis," Peace Economics, Peace Science, and Public
Policy 15: Article 6.