economic assessment of subsidence in semarang and demak
TRANSCRIPT

Economic assessment of subsidence in Semarang and Demak, Indonesia

2 of 60 Economic assessment of subsidence in Semarang and Demak, Indonesia
1220476-002-ZKS-0009, 1 February 2021
Economic assessment of subsidence in Semarang and Demak, Indonesia
Author(s)
Mila Mahya
Sien Kok
Amrit Cado van der Lelij
Miguel de Lucas Pardo
3 of 60 Economic assessment of subsidence in Semarang and Demak, Indonesia
1220476-002-ZKS-0009, 1 February 2021
Economic assessment of subsidence in Semarang and Demak, Indonesia
Client Wetlands International
Contact Frank Hoffman
Reference
Keywords Subsidence, Ground water extraction, Economic assessment, Semarang and Demak
Document control
Version V1.0
Date 01-02-2021
Project nr. 1220476-002
Document ID 1220476-002-ZKS-0009
Pages 61
Classification
Status final
Author(s)
Mila Mahya
Sien Kok
Amrit Cado van der Lelij
Doc. version Author Reviewer Approver Publish
V1.0 Mila Mahya Toon Segeren
Sien Kok
Amrit Cado van der Lelij

4 of 60 Economic assessment of subsidence in Semarang and Demak, Indonesia
1220476-002-ZKS-0009, 1 February 2021
Summary
Context
In the past decades, economic growth has stimulated industrialization and urbanization in
Indonesian coastal cities such as Semarang and Demak. Against this backdrop of economic
growth, water demand in Semarang and Demak has increased over time. However, clean
(piped) water supply has not kept pace with rising demand, and industrial activities largely rely
on direct groundwater extraction.
Extraction of groundwater is expected to be the key driver of subsidence in the area, particularly
in locations situated on unconsolidated sediments like the northern part of Semarang and
Demak. In a natural state, subsidence due to consolidation of such sediments rarely exceeds
1 cm/year. However, over-extraction of groundwater can significantly exacerbate subsidence
rates: in Semarang and Demak, subsidence exceeds 8 cm/year in the northern part of
Semarang, and in Sayung District of Demak. In areas where the groundwater head drops most
strongly, subsidence is more severe. This subsiding area hosts the majority of industries and
is densely populated.
Subsidence can cause immense direct and indirect damage. Direct damage includes damage
to infrastructures and buildings. Indirect damage includes increasing flood risk due to lower
elevation, over time leading to permanent land loss. Attention for this issue is increasing in the
area, and a subsidence roadmap is in the making to help adapt and mitigate the land
subsidence.
Study aims
This study provides a basis for the development of this roadmap, by assessing the economic
consequences under different subsidence scenarios. This provides a better understanding of
the socio-economic impact of subsidence, and the economic rationale of (investment in)
addressing this problem. An economic impact assessment can provide the economic rationale
of implementing mitigative measures, and support decision making in this context. By
comparing economic impacts of subsidence under business as usual (no additional measures
taken) with economic impacts under alternative scenarios (additional measures taken), the
benefits of taking action are identified and quantified. For example, the results can be used in
Cost Benefit Analysis to weigh investment costs and benefits of different measures. Such
results also can be used to determine the groundwater extraction taxes that would reduce
incentives to over-extract groundwater, and as a result would mitigate regional welfare losses
from land subsidence (Wade, Cobourn, Amacher, & Hester, 2018). Furthermore, an
assessment of the economic impacts of subsidence can help increase the awareness and
sense of urgency of addressing the subsidence problem.
Although the impacts are manifold, due to limitations in scope and data, this study quantifies
only direct damage to roads and buildings, and indirect damage due to increased flood risk and
land loss due to the lowering of the area that becomes below mean sea level. These impacts
are likely the most significant, although damage to other types of infrastructure (e.g. drainage,
sewage, railway) may also be significant. The damage due to increased flood risk, land loss,
and road and building damage calculated in this study is estimated to be 60-80% of the total
damage of subsidence (Lixin, et al., 2010). Indirect economic damage such a traffic disruption,
and production loss were not quantified in this study. Calculated damage is assessed using a
risk-approach: overlying hazard and exposure maps, and using damage-effect relationships
from global sources, or extrapolated from other areas.

5 of 60 Economic assessment of subsidence in Semarang and Demak, Indonesia
1220476-002-ZKS-0009, 1 February 2021
Scenarios
We calculate damage between 2020-2040 with a Business as Usual (BAU) and two alternative
scenarios: A) After 10 years, subsidence rate is half compared to the BAU and B) after 10
years, subsidence rate is compared to the BAU.
Results
By far the most significant economic impact of subsidence is land loss, followed by increased
road maintenance costs and flood risk. There is a progressive scale between flood risk and
land loss: land that is prevented from being fully lost is still subject to increased flood risk.
The results of this study show that the damage over the course of 20 years under business as
usual scenario (BAU) in Semarang amounts to 79 trillion IDR (present value), while in Demak,
the damage might amount to 39 trillion IDR. Per year, this translates into about 2% and 7% of
GRDP for Semarang and Demak. If the subsidence rate is halved (scenario A), economic
damage from subsidence is estimated at 58 trillion IDR and 29 trillion IDR respectively for
Semarang and Demak. In other words, this means that by taking measures to reduce the
Table 1-1 Summary of economic loss due to subsidence in Semarang and Demak in 2020-2040 (present
value) in billion IDR. PM = Pro memorie: to be remembered when reviewing results from this study. All cells
marked with PM were not included in the analysis. The results presented here are thus an underestimation
of the total damages.
Effect Damage in Semarang (billion IDR) Damage in Demak (billion IDR)
A B BAU A B BAU
Direct
Increased road maintenance
1,350 1,200 1,700 800 700 1,000
Increased arterial road maintenance
750 670 950 550 480 680
Damage to buildings 50 50 70 5 4 70
Damage to other infrastructure
PM PM PM PM PM PM
Indirect
Land Loss 56,000 14,000 76,000 27,000 23,000 37,000
Increased Coastal Flood risk
300 350 250 150 180 140
Increased pluvial and fluvial flood risk
PM PM PM PM PM PM
Reduced attractiveness of business climate; lower agricultural yields
PM PM PM PM PM PM
Lower quality of life population
PM PM PM PM PM PM
Total (present value in billion IDR)
58,500 16,300 79,000 28,500 24,300 39,000

6 of 60 Economic assessment of subsidence in Semarang and Demak, Indonesia
1220476-002-ZKS-0009, 1 February 2021
subsidence rate by half, 21 trillion IDR in damage can be prevented in Semarang, and 10 trillion
IDR in Demak (corresponding to approximately 1.48 and 0.74 billion $ respectively). Reducing
subsidence rates to a quarter subsidence rate (scenario B), economic damage of subsidence
for Semarang and Demak are 16 trillion IDR and 25 trillion IDR respectively. Quartering
subsidence rate by applying a combination of measures is estimated to reduce the economic
loss of subsidence by 63 trillion IDR and 14 trillion IDR for Semarang and Demak respectively
(corresponding to approximately 4.48 and 1,02 billion $ respectively).
These results only represent a part (estimated to be 60-80%) of the full extent of economic
damage from subsidence in Demak-Semarang, as illustrated by the PM posts: the numbers
above are an underestimation of the full range of economic costs of subsidence. In particular,
the impact of subsidence on other infrastructures besides roads may be significant: water
management infrastructure (drinking water and sewage pipes, drainage channels, pumping
stations, dikes), transport infrastructure (railway, ports, airports) and telecommunication and
energy infrastructure (e.g. oil and gas pipes, cables). The potential social impacts, such as
sustainable livelihoods, quality of life and gender equality and ecological damages are not
included in this assessment but are in no way less important when quantifying the impacts of
a subsidence. Other potentially significant impacts include increased fluvial and pluvial flood
risk, and reduced attractiveness of the business climate.
In conclusion
With subsidence rates reaching 8 cm/year in some areas, northern Semarang may have
subsided 1.5-2 meters within 20 years from now. If nothing is done to prevent this, the minimum
expected damage is approximately 82.7 trillion IDR in Semarang and 30.9 trillion IDR in Demak.
The expected damages can become even more due to increased (fluvial / pluvial) flood risk,
driving up the costs of future adaptation measures that are needed to protect the cities against
flooding and land loss. Halving the land subsidence rate (50% reduction) could reduce the
minimum expected damage by approx. 21 trillion IDR (26% less compared to BAU) in
Semarang and 10 trillion IDR (13% less compared to BAU) in Demak. Quartering the land
subsidence rate (75% reduction) could reduce the minimum expected damage by approx. 63
trillion IDR (80% less compared to BAU) in Semarang and 14 trillion IDR (37% less compared
to BAU) in Demak. This study shows that the potential monetary damages that can be avoided
is vast, if the proper measures are implemented. With the strong correlation of land subsidence
to groundwater extraction, responsible use of water resources and proper (piped) drinking
water supply; reduced water demand and recycling of available water could be the potential
measures to reduce the subsidence damage.

7 of 60 Economic assessment of subsidence in Semarang and Demak, Indonesia
1220476-002-ZKS-0009, 1 February 2021
Contents
Summary 4
1 Introduction 9
2 System Description 12
2.1 Geological characteristics of the study area 12
2.2 Subsidence rates 12
2.3 Drivers of subsidence 13
2.4 Current measures dealing with subsidence 15
3 Methods 17
3.1 Overview of subsidence damage 18
3.2 Economic valuation 20
3.3 Direct subsidence damage 22 3.3.1 Subsidence hazard 22 3.3.2 Damage to roads 23 3.3.3 Damage to buildings 24
3.4 Indirect subsidence damage 25 3.4.1 Flood hazard 25 3.4.2 Increased coastal flood risk 27 3.4.3 Loss of land 29
3.5 Overview of data sources 31
4 Subsidence scenarios 32
4.1 BAU (Business as usual) 32
4.2 Scenario A: subsidence rate reduced by 50% 32
4.3 Scenario B: subsidence rate reduced by 75% 32
5 Results 33
5.1 Direct subsidence damage 33 5.1.1 Road infrastructure 33 5.1.2 Damage to buildings 33 5.1.3 Other 34
5.2 Indirect subsidence damage 34 5.2.1 Increased coastal flood risk 34 5.2.2 Loss of land 35 5.2.3 Other 37
5.3 Overview of economic impact of subsidence 38
6 Discussion, conclusions and recommendations 42 6.1.1 Discussion/ study limitations 42 6.1.2 Conclusions 43

8 of 60 Economic assessment of subsidence in Semarang and Demak, Indonesia
1220476-002-ZKS-0009, 1 February 2021
6.1.3 Recommendations 43
7 References 44
A Additional hazard and exposure information 49
A.1 Land loss 49
B Subsidence impacts 53
C Economic valuation 55
D Sensitivity analysis 57
D.1 Sensitivity to discount rate 57
D.2 Flood risk and land loss - sensitivity to DEM 57
D.3 Flood risk and land loss - impact of planned toll road 59

9 of 60 Economic assessment of subsidence in Semarang and Demak, Indonesia
1220476-002-ZKS-0009, 1 February 2021
1 Introduction
People and assets around the globe experience an increase in exposure to natural hazards
(Peduzzi, Chatenoux et al. 2012, Woodruff, Irish et al. 2013). The Intergovernmental Panel on
Climate Change (IPCC) projects that this will only worsen as sea levels continue to rise with
an average estimated 3 mm/yr, and storms are becoming more severe and frequent (Milly,
Wetherald et al.2002, Donnelly, Cleary et al. 2004, Knutson, McBride et al. 2010, Lin, Emanuel
et al. 2012). Coastal megacities are especially vulnerable, as they are often located in low-lying
areas and/or river flood plains (McGranahan, Balk et al. 2007, Nicholls, Herwijer et al. 2007,
Woodruff, Irish et al. 2013). In many coastal (mega) cities situated on soft soils, the effects of
climate change are exacerbated due to land subsidence: many exhibit subsidence rates
between 6–100mmyr (Erkens, 2015).
Subsidence in South East Asia
In South East Asia, land subsidence is a problem for many urbanized coastal cities like Jakarta
(Letitre & Kooi, 2018), Bangkok (Phien-wej, Giao, & Nutalaya, 2006), Shanghai (Chai, Shen,
Zhu, Zhang, & L., 2004), Hanoi (Phi & Strokova, 2015), and the Vietnamese Mekong delta
(Erban, Gorelick, & Zebker, 2014). The main driver of subsidence in coastal regions is
compaction of young alluvial deposits due to groundwater extraction (Krynine & Judd, 1957;
Dudley, 1970; Bakr, 2015; Shen, Ma, Xu, & Ýin, 2013; Sun, Grandstaff, & Shagam, 1999;
Mousavi, Shamsai, El Naggar, & Khamehchian, 2001). Driven by economic development,
Figure A-1Subsidence rate in cm per year in Semarang (Ellipsis, 2020) and Demak (Yuwono, Subiyanto, Pratomo,
& Najib, 2019)

10 of 60 Economic assessment of subsidence in Semarang and Demak, Indonesia
1220476-002-ZKS-0009, 1 February 2021
ground water extraction rates continue to increase as populations grow in urban deltaic areas
(Yeung 2001, Small and Nicholls 2003, Nicholls 2004, Hanson, Nicholls et al. 2011). Economic
development is thus a double-edged sword, as it indirectly drives land subsidence and directly
increases the total asset value at risk. Land subsidence causes significant structural damage
and increases maintenance costs of roads, sewage, drainage, and flood protection
infrastructure and buildings. Subsidence indirectly damages urban areas by increasing their
exposure to floods (Hallegatte et al., 2013). Furthermore, subsidence in coastal wetlands such
as mangroves can substantially increases chances of erosion and land loss. Deforestation of
mangrove habitat can generate vast amounts of carbon to be released in the (Donato et al.,
2011; Rovai et al., 2018). Overall, the total damages associated with subsidence worldwide is
estimated in billions of dollars annually (Erkens, 2015).
Subsidence in Demak-Semarang
The deltaic area Semarang-Demak, located in the north of central Java, Indonesia has become
an industrial epicentre in Indonesia, housing 783 large scale industries and more than 35000
small scale industries as of 2018 (Central Java Statistics Indonesia, 2020). In 2019, the
industrial sector has contributed to 27.22% and 30.84% of the GDP of Semarang and Demak
respectively. The population, fuelled by economic development, has grown from 1.3 million in
1995 to 1.8 million in 2018 in Semarang, and from 0.9 million to 1.2 million in Demak (Central
Java Statistics Indonesia, 2020). As a result, water demand has risen from 48.5 million m3 in
1999 and increased to 68.5 million m3 in 2005. With the growing urbanization, the projected
Semarang water demand is expected to be 336 million m3 in 2030 (Central Java Government,
2020). However, the local drinking water company in Semarang and Demak, PDAM
(Perusahaan Daerah Air Minum), only covers 61.2% and 23.68% of the administrative
boundaries in Semarang and Demak respectively (Association of Indonesian Drinking Water
Companies Central Java, 2020). Due to this inadequate clean water provision, 24% of clean
water demand in Semarang is fulfilled by means of groundwater extraction and industrial
activities rely more on groundwater sources (Valentino, 2013). Based on 2011 and 2012 data,
53% of groundwater extraction permit was issued for industry and the rest was for domestic
use. The deep groundwater extraction has led to significant subsidence in the area, with rates
ranging from 0-2 cm to >10 cm per year. Most notable consequences in the area include
damage to buildings and infrastructure and a high coastal flooding hazard.
Adaptation to land subsidence and flooding
To address the flood problem in the Semarang-Demak region, various adaptive measures have
been taken in the past decades. Dikes have been constructed along the floodway canals and
shorelines to prevent floods (van Beek, Letitre, Hadiyanto, & Sudarno, 2019), and a polder
system including pumping stations has been installed to drain the protected but low-lying land.
Roads and bridges have been elevated. To address fluvial flooding, floodways have been
constructed. To address pluvial flooding, the drainage system in the city has been improved.
To address coastal flooding, mangrove habitats have been restored (Andreas, Abidin, Gumilar,
Sidiq, & Yuwono, 2017).
Mitigative Measures to slow down the subsidence in Semarang include coastal and integrated
water resource planning and management (Marfai & King, 2008), public education (Marfai &
King, 2008) and dam utilization to retain water for usage during the dry season (and prevent
additional groundwater extraction) (van Beek, Letitre, Hadiyanto, & Sudarno, 2019). Since
subsidence is intimately linked with the lack of water supply it can only be stopped if alternative
water sources are available. It is difficult to quantify the impact of individual or combination of
measures in slowing down subsidence rate as comprehensive monitoring of subsidence is
absent.
In the long term, adaptation to flood risk such as building dikes provide only temporary
solutions, as they fail to tackle the root cause of the problem. When planning for the medium

11 of 60 Economic assessment of subsidence in Semarang and Demak, Indonesia
1220476-002-ZKS-0009, 1 February 2021
and long-term effects of flood risk, relative sea level rise (rSLR) must be considered: the
cumulative effect of sea level rise and land subsidence. Because of the slow onset and
invisibility of subsidence as a hazard it is often not seen as an urgent problem (Lixin, et al.,
2010).
Economic assessment of subsidence impact
An assessment of the economic impacts of subsidence can help increase the awareness and
sense of urgency of addressing the subsidence problem. Furthermore, economic impact
assessment can provide the economic rationale of implementing mitigative measures, and
support decision making in this context. By comparing economic impacts of subsidence under
business as usual (no additional measures taken) with economic impacts under alternative
scenarios (additional measures taken), the benefits of taking action are identified and
quantified.
In this report, the economic impact of subsidence in the Semarang-Demak region is assessed
under three scenarios:
• Business as Usual (100% of current subsidence rate)
• Scenario A (50% of current subsidence rate)
• Scenario B (25% of current subsidence rate)
This will provide valuable insight in the economic damage that can be avoided by stopping or
reducing groundwater extraction (the main driver of subsidence) in the area, and in providing
economic justification of investment in mitigative measures. Policy alternatives and their
investment costs are not included in this study: this topic is addressed in a parallel study by
Witteveen + Bos, expected in 20
12 of 60 Economic assessment of subsidence in Semarang and Demak, Indonesia
1220476-002-ZKS-0009, 1 February 2021
2 System Description
2.1 Geological characteristics of the study area
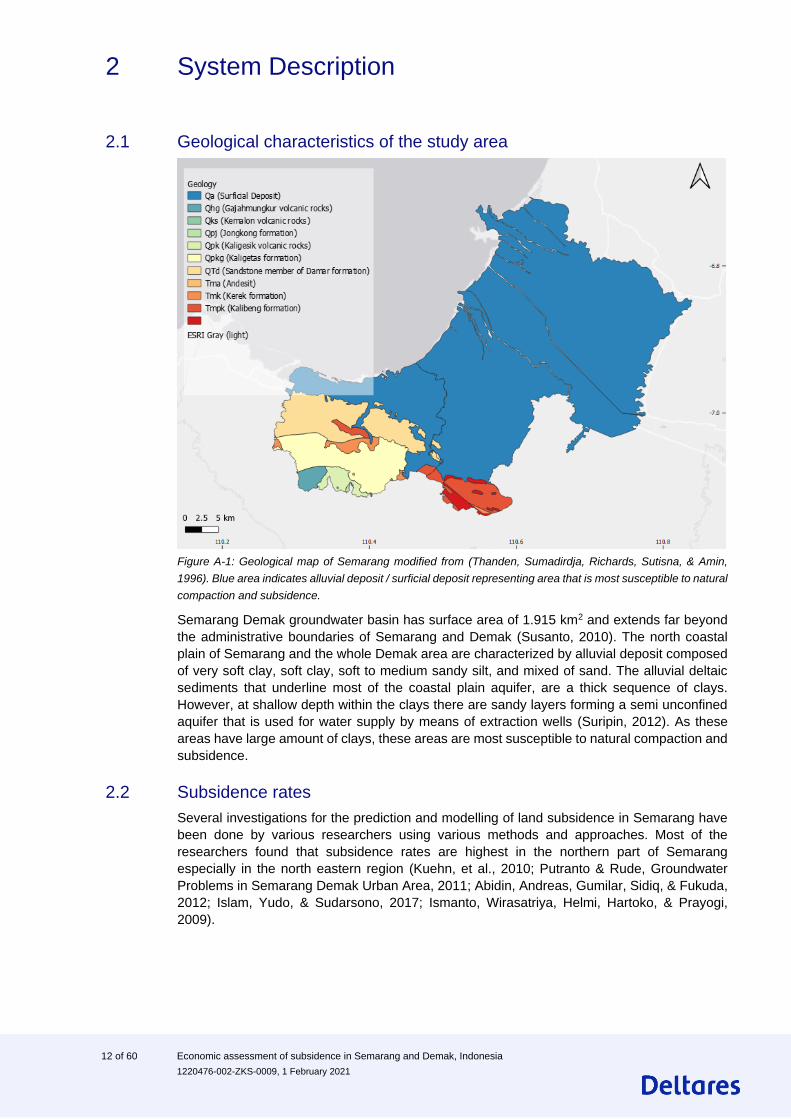
Figure A-1: Geological map of Semarang modified from (Thanden, Sumadirdja, Richards, Sutisna, & Amin,
1996). Blue area indicates alluvial deposit / surficial deposit representing area that is most susceptible to natural
compaction and subsidence.
Semarang Demak groundwater basin has surface area of 1.915 km2 and extends far beyond
the administrative boundaries of Semarang and Demak (Susanto, 2010). The north coastal
plain of Semarang and the whole Demak area are characterized by alluvial deposit composed
of very soft clay, soft clay, soft to medium sandy silt, and mixed of sand. The alluvial deltaic
sediments that underline most of the coastal plain aquifer, are a thick sequence of clays.
However, at shallow depth within the clays there are sandy layers forming a semi unconfined
aquifer that is used for water supply by means of extraction wells (Suripin, 2012). As these
areas have large amount of clays, these areas are most susceptible to natural compaction and
subsidence.
2.2 Subsidence rates
Several investigations for the prediction and modelling of land subsidence in Semarang have
been done by various researchers using various methods and approaches. Most of the
researchers found that subsidence rates are highest in the northern part of Semarang
especially in the north eastern region (Kuehn, et al., 2010; Putranto & Rude, Groundwater
Problems in Semarang Demak Urban Area, 2011; Abidin, Andreas, Gumilar, Sidiq, & Fukuda,
2012; Islam, Yudo, & Sudarsono, 2017; Ismanto, Wirasatriya, Helmi, Hartoko, & Prayogi,
2009).

13 of 60 Economic assessment of subsidence in Semarang and Demak, Indonesia
1220476-002-ZKS-0009, 1 February 2021
Table 2-1: Subsidence rate in Semarang from different authors and methods
Method Year Reference Genuk [cm/year
]
Harbour [cm/year
]
Tawang [cm/year
]
Marina [cm/year]
Airport [cm/year]
Levelling 2000-2001
(Murdohardono, Sudrajat, Wirakusumah, Kuhn, & Mulyasari, 2009)
4-8 8-20 6-8 4-8 2-4
Levelling 1999-2003
Centre of Environmental Geology
>6 >8 6-8 4-8 2-4
GPS 2009-2011 2008-2016
(Abidin, Andreas, Gumilar, Sidiq, & Fukuda, 2012; Andreas H. , et al., 2019)
9-15 6-9 3-7 6-9 3-6
Insar Until 2019
(Ellipsis, 2020) >10 6-10 6-8 3-6 0-4
SPN 2002-2006
(Kuehn, et al., 2010)
>7 >7 6-7 >7 5-6
DInSAR 2015-2016
(Islam, Yudo, & Sudarsono, 2017)
10 8-15 8 4-6 4-6
Modeling with Plaxis and Terzaghi
2002-2008
(Sarah, Syahbana, Lubis, & Mulyono, 2011)
- - 3-7 - -
Bench mark elevation and field measurement with DGPS
2009 (Ismanto, Wirasatriya, Helmi, Hartoko, & Prayogi, 2009)
>8.1 8.1-12 4.1-8 4.1-8 1.1-4
Microgravity
2002-2005
(Supriyadi, 2008) <6.5 8-9.5 5-8 15 <6.5
Unlike Semarang, subsidence study in Demak is relatively scarce. Study from (Yuwono,
Subiyanto, Pratomo, & Najib, 2019) using DSInSAR method indicates that subsidence in
Demak is varied in time and space, with the highest rate in Sayung District. In Demak, Sayung
district has subsidence rate up to 13 cm/year in 2017 (Yuwono, Subiyanto, Pratomo, & Najib,
2019).
2.3 Drivers of subsidence
Compaction is a natural process but can also be caused by uncontrolled usage and
over-exploitation of ground water (Kuehn, et al., 2010). Natural subsidence rates rarely exceed
1 cm/year, whereas man-induced subsidence can reach 50 cm/year and even more (Dolan &
Grant, 1986). Groundwater extraction induced subsidence occurs because water pressure in
the aquifer drops causing consolidation and compression within the sand layers. A hydraulic
gradient is developed between the aquifer and aquitard, starting a slow dewatering process of
the clayey layers and aquitards (Kuehn, et al., 2010). Compaction of the soil increases its
density and reduces its pore spaces. Soils are elastic material to only a limited extends. Soil

14 of 60 Economic assessment of subsidence in Semarang and Demak, Indonesia
1220476-002-ZKS-0009, 1 February 2021
compaction which beyond the elastic deformation becomes a plastic deformation and will not
rebound even if the causes of that compaction is removed (Suripin, 2012).
In Semarang, groundwater has been exploited as a natural resource since 1841 (Putranto &
Rude, 2016). Based on Semarang groundwater extraction data from different studies,
groundwater extraction has increased substantially since 1980. Groundwater extraction rate in
1980 was less than 5 million m3/year. While in 1990, the extraction rate was increased to
approximately 20 million m3/year. Only 10 years later in 2000, the extraction amount was
drastically increased reaching almost 40 m3/year. Even though the absolute values differ
between different dataset (Figure A-1), the overall patterns are similar, which shows the
reliability of the data.
Despite of this substantial increase in groundwater extraction, groundwater monitoring is still
considerably lacking with only ten automated groundwater monitoring wells in Semarang and
Figure A-1: Top figure: Groundwater well distribution in Semarang and Demak. Bottom figure: Semarang
groundwater extraction from a) DGTL (Sihwanto & Iskandar, 2000), b) (Semarang City Governent, 2010) c)
DGTL (Putranto & Rude, 2016), d) (Marsudi, 2000), e) (Schmidt, 2002), f) (GIM International, 2004), g)
(Murdohardono, Sudrajat, Wirakusumah, Kuhn, & Mulyasari, 2009)
0,00
10,00
20,00
30,00
40,00
50,00
60,00
1880 1900 1920 1940 1960 1980 2000 2020
Ab
stra
ctio
n (
mill
ion
m3
/ye
ar)
a b c d e f g

15 of 60 Economic assessment of subsidence in Semarang and Demak, Indonesia
1220476-002-ZKS-0009, 1 February 2021
Demak. Figure A-1 shows the distribution of monitoring groundwater wells in Semarang and
Demak between 1980 to 2020 (Department of Energy and Mineral Resources Central Java,
2020).
The rapid subsidence area corresponds with where most groundwater head drop occurs.
Spatial distribution of groundwater drop (Schmidt, 2002) from (Kuehn, et al., 2010) shows that
the subsidence is only apparent within alluvium area. As the geological formation of Northern
Semarang and Northern Demak is similar, Demak is also expected to experience subsidence
in the area where over-extraction of groundwater occurs.
2.4 Current measures dealing with subsidence
Currently, there are several small-scale adaptation measures implemented by the local
governments and individuals, aiming to reduce the damages of subsidence and risk of flooding,
such as elevation of roads and buildings, construction of dikes and water management
infrastructure (Andreas et al., 2017). Measures recently implemented in Semarang and Demak
include:
• Projects addressing water resource and flood management;
• Integrates water resource and flood management project in Semarang
• Water resource planning (Pola Rencana Sumber Daya Air)
• Construction of dikes and a polder system along floodway canal and shoreline
(van Beek, Letitre, Hadiyanto, & Sudarno, 2019)
• Construction of a pumping station (Andreas et al., 2017)
• Construction of floodway to reduce fluvial flood hazard
• Drainage masterplan in Semarang
• Elevation of roads and bridges
• Mangrove restoration
• Projects addressing sustainable land use
• Land arrangement models Sukorejo
• Coastal planning and management (Marfai & King, 2008)
• Projects addressing subsidence:
• Drinking water master plan
At the national level, a working group aiming to create a national ‘roadmap for subsidence’ is
in the process of being established, initiated by the Coordinating Ministry for Maritime and
Investment (KEMENKO MARVES). At the local level, the public authorities in Semarang and
Demak plan several measures that contribute to mitigation of subsidence risk and adapting to
its consequences (mostly increasing flood risk):
• Projects addressing water resource and flood management:
o Construction of retention ponds in North Semarang district
o Construction of Coastal dikes in Tugu District, West Semarang District, North
Semarang District and Genuk District
• Projects addressing subsidence cause (groundwater extraction)
o Spatial plan of Semarang City 2011-2031: including improvement of water
supply system, with development of four large and 19 smaller drinking water
reservoirs.
o Improvement and development of surface water infrastructure systems
through a piping system in all district
o Employment of rainwater in all districts
o Restrictions on groundwater extraction in Tugu District, West Semarang
District, North Semarang District, Central Semarang District, South Semarang

16 of 60 Economic assessment of subsidence in Semarang and Demak, Indonesia
1220476-002-ZKS-0009, 1 February 2021
District, East Semarang District, Genuk District, Pedurungan District and
Gayamsari District
The consequences of increased coastal flooding and land loss is evident in the housing market
in the region. In some areas, people (with sufficient funds) elevate their house regularly – in
some cases, up to 1 meter every 5 years. There are people that remain living in flooded areas,
building a small bridge from their (elevated) house to the (elevated) road. In other permanently
inundated areas, houses have been abandoned (Abidin et al. 2018). The study of (Ali, 2010)
shows that the majority of inhabitants of communities impacted by coastal flooding have the
aspiration to elevate their house (Table 2-2 and Table 2-3); however, this does not always
happen due to the high costs.
To conclude, at present efforts focus mostly on adapting to the adverse consequences of
subsidence, particularly increased flood risk. For the coming decade, there are several projects
and regulations planned that do address the root cause of subsidence itself, i.e. groundwater
extraction. Whether the scale of these plans and measures is sufficient to significantly reduce
or stop the subsidence process is unknown. At the national level, the development of a
Roadmap for Subsidence may offer strategic support in the medium to long term.
Table 2-2: Aspirations of the coastal flooding impacted community in Bandarharjo Village, Semarang modified
from (Ali, 2010)
Table 2-3: Actual measures taken by coastal flooding impacted community in Bandarharjo Village, Semarang
(Ali, 2010)
Measure Frequency
Damming drainage channel 26
Make small embankments in the garden 35
No measure 30
Others 9
Total 100
Aspiration Frequency
Move to safer area 9
Elevate building 74
No aspiration 13
Others 4
Total 100

17 of 60 Economic assessment of subsidence in Semarang and Demak, Indonesia
1220476-002-ZKS-0009, 1 February 2021
3 Methods
To assess the economic rationale of investments or policy intervention regarding subsidence
in Semarang and Demak, this study analyzes the economic damage of subsidence under three
alternative scenarios. As such, this study provides a basis for a full cost-benefit analysis, in
which investments costs of policy alternatives are compared against the expected effects
(Romijn, 2013).
In this study we largely follow key steps from cost-benefit analysis (as presented in Figure A-1;
source Renes and Romijn (2013)): 1) problem analysis, 2) establishment of expected
development of damage under a business-as-usual scenario 3) development of alternative
scenarios, 4) an analysis of economic damage under these scenarios – where possible valued
in monetary terms, 5) an overview of all damage effects is presented in which damage over a
pre-determined period is discounted to the same base year.
In this chapter, we identify key effects of subsidence and select effects which will be monetized
(section 3.1), explain the overall approach of valuation (3.2) and elaborate how the effects will
be quantified and monetized (section 3.3 and 3.4). Chapter 4 introduces the subsidence
scenarios (policy alternatives).
Figure A-1 Generic approach for cost-benefit analysis. Source: Romijn & Renes (2013)

18 of 60 Economic assessment of subsidence in Semarang and Demak, Indonesia
1220476-002-ZKS-0009, 1 February 2021
3.1 Overview of subsidence damage
Hallegatte and Przyluski (2010) distinguish direct and indirect economic effects of natural
hazards (e.g. subsidence). Direct effects of subsidence relate to loss of capital, increased life
cycle costs or reduced performance as a result of direct damage to physical assets: including
critical infrastructure, buildings and other physical elements in public or private space. Indirect
economic effects of subsidence include 1) effects relating to direct, physical damage to
infrastructure and buildings or 2) effects related to other natural hazards driven or aggravated
by subsidence – such as flooding.
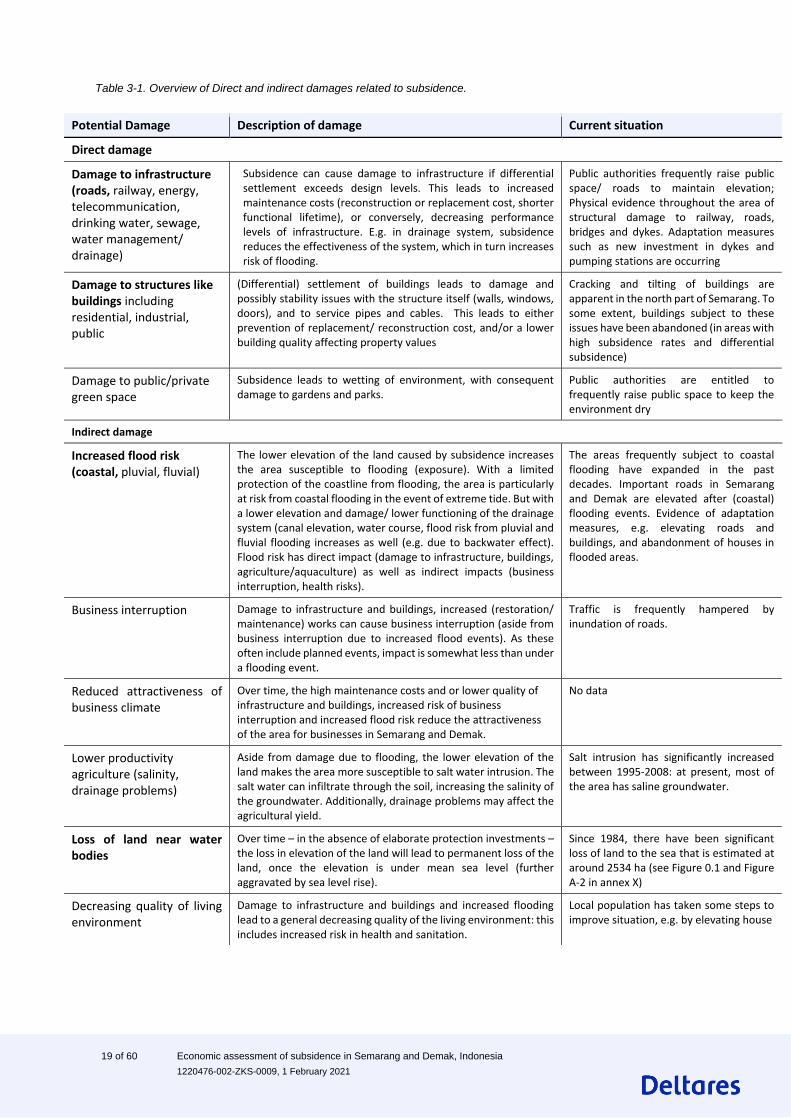
The potential types of subsidence damage in Semarang and Demak are listed in (Table 3-1).
To assess the current situation in regard to these damage factors, a desk study and literature
review has been applied: valuable sources describing damage in the area include Abidin et al.
(2013); Andreas, Heri et al. (2019); Andreas et al. (2017) and Rahmawati and Marfai (2013).
As can be seen in this Table, the economic implications of subsidence in the area are manifold,
and already very visible on the ground today.
Based on this assessment, underlying literature, and subsidence damage in other countries
(e.g. Lixin et al., 2010), we expect that the majority of economic damage includes damage to
infrastructure and buildings (for illustrations, see Annex B), increased risk of flooding and loss
of land. The focus of this study will be on quantification of these aspects. Due to data and scope
limitations, not all aspects can be monetized. Regarding flood risk, only coastal flood risk will
be quantified as sufficient flood hazard models for pluvial and alluvial flooding are lacking1.
Regarding damage to infrastructure, we will monetize only damage to roads due to limitations
in data and damage relationships.
—————————————— 1 To calculate increased risk in fluvial and pluvial flooding, hydrological and hydrodynamic models are required, as
well as a high(er) resolution DEM. As this data is not available and the development of such models is very time-
intensive, we exclude fluvial and pluvial flooding risk assessment from this study.
19 of 60 Economic assessment of subsidence in Semarang and Demak, Indonesia
1220476-002-ZKS-0009, 1 February 2021
Potential Damage Description of damage Current situation
Direct damage
Damage to infrastructure (roads, railway, energy, telecommunication, drinking water, sewage, water management/ drainage)
Subsidence can cause damage to infrastructure if differential settlement exceeds design levels. This leads to increased maintenance costs (reconstruction or replacement cost, shorter functional lifetime), or conversely, decreasing performance levels of infrastructure. E.g. in drainage system, subsidence reduces the effectiveness of the system, which in turn increases risk of flooding.
Public authorities frequently raise public space/ roads to maintain elevation; Physical evidence throughout the area of structural damage to railway, roads, bridges and dykes. Adaptation measures such as new investment in dykes and pumping stations are occurring
Damage to structures like buildings including residential, industrial, public
(Differential) settlement of buildings leads to damage and possibly stability issues with the structure itself (walls, windows, doors), and to service pipes and cables. This leads to either prevention of replacement/ reconstruction cost, and/or a lower building quality affecting property values
Cracking and tilting of buildings are apparent in the north part of Semarang. To some extent, buildings subject to these issues have been abandoned (in areas with high subsidence rates and differential subsidence)
Damage to public/private green space
Subsidence leads to wetting of environment, with consequent damage to gardens and parks.
Public authorities are entitled to frequently raise public space to keep the environment dry
Indirect damage
Increased flood risk (coastal, pluvial, fluvial)
The lower elevation of the land caused by subsidence increases the area susceptible to flooding (exposure). With a limited protection of the coastline from flooding, the area is particularly at risk from coastal flooding in the event of extreme tide. But with a lower elevation and damage/ lower functioning of the drainage system (canal elevation, water course, flood risk from pluvial and fluvial flooding increases as well (e.g. due to backwater effect). Flood risk has direct impact (damage to infrastructure, buildings, agriculture/aquaculture) as well as indirect impacts (business interruption, health risks).
The areas frequently subject to coastal flooding have expanded in the past decades. Important roads in Semarang and Demak are elevated after (coastal) flooding events. Evidence of adaptation measures, e.g. elevating roads and buildings, and abandonment of houses in flooded areas.
Business interruption
Damage to infrastructure and buildings, increased (restoration/ maintenance) works can cause business interruption (aside from business interruption due to increased flood events). As these often include planned events, impact is somewhat less than under a flooding event.
Traffic is frequently hampered by inundation of roads.
Reduced attractiveness of business climate
Over time, the high maintenance costs and or lower quality of infrastructure and buildings, increased risk of business interruption and increased flood risk reduce the attractiveness of the area for businesses in Semarang and Demak.
No data
Lower productivity agriculture (salinity, drainage problems)
Aside from damage due to flooding, the lower elevation of the land makes the area more susceptible to salt water intrusion. The salt water can infiltrate through the soil, increasing the salinity of the groundwater. Additionally, drainage problems may affect the agricultural yield.
Salt intrusion has significantly increased between 1995-2008: at present, most of the area has saline groundwater.
Loss of land near water bodies
Over time – in the absence of elaborate protection investments – the loss in elevation of the land will lead to permanent loss of the land, once the elevation is under mean sea level (further aggravated by sea level rise).
Since 1984, there have been significant loss of land to the sea that is estimated at around 2534 ha (see Figure 0.1 and Figure A-2 in annex X)
Decreasing quality of living environment
Damage to infrastructure and buildings and increased flooding lead to a general decreasing quality of the living environment: this includes increased risk in health and sanitation.
Local population has taken some steps to improve situation, e.g. by elevating house
Table 3-1. Overview of Direct and indirect damages related to subsidence.

20 of 60 Economic assessment of subsidence in Semarang and Demak, Indonesia
1220476-002-ZKS-0009, 1 February 2021
3.2 Economic valuation
As discussed in section 3.1. we will assess economic damage of subsidence of two direct
impacts (damage to infrastructure and to buildings), and two indirect impacts (land loss and
increased flood risk). Other impacts that cannot be quantified due to data and time limitations,
such as such as adverse health impacts, loss in landscape quality and social disruption, will be
described qualitatively. Those impacts that do not have a direct reflection in a real market, are
not addressed in this study as there is no good way to assess these impacts without elaborate
local data collection.
Figure A-1 shows a schematic overview of the methodology. To arrive at an economic value for subsidence effects, we use a risk approach to make the link between the hazard (subsidence or flood risk) and the exposed assets, such as roads and buildings and people.
This study examines the impact of subsidence directly, and the impact on flood risk. As the land sinks below the sea level (Clark, 2013) more areas will be susceptible to coastal flooding. Pluvial and fluvial flooding may also increase as inundation depths become larger, and the changing elevation complicates the discharge of water from the drainage system to rivers, and from the river to the sea, but these hazards are not quantified due to data limitations. Exposure is the amount and type of assets exposed to the hazard. In this study, the assets under consideration include the land use type, infrastructure and buildings exposed to subsidence and coastal flooding.
Figure A-1. Schematic representation of the relationship between the drivers of subsidence (green), the hazards
(red), exposure (grey blue) and the economic valuation methods used.

21 of 60 Economic assessment of subsidence in Semarang and Demak, Indonesia
1220476-002-ZKS-0009, 1 February 2021
Table 3-2 gives an overview of the approach used for each quantified effect, based on a
combination of hazard and exposure information and the value or price of damage. The
following sections (listed in the last column of the figure) will provide more background and
underlying assumptions for estimating damage for each of these effects.
We calculate impacts of subsidence for 20 years in the future, for the period of 2020 to 2040.
We assume damage will increase over time with average inflation over 2010-2020 4,65%
(Central Bank of Indonesia, 2020). Building on recommendations from the ADB for Asia, we
use a social discount rate of 10%. All values in this study are in price level of 2020. Results will
be presented for Semarang and Demak separately, as well as together, as these have distinct
jurisdictional mandates (local governments).
To some extent, there may be double counting between direct damage to roads and buildings
and land loss, as there are no additional maintenance costs of assets located in lost land.
Table 3-2. Overview of the different evaluation approaches for each type of damage. The evaluation approach
is explained in detail in the shown sections.
Potential Damage
Evaluation approach Section
Direct damage
Damage to infrastructure: roads
Additional costs in road maintenance = # m2/road type/subsidence category * additional costs (IDR)/m2/road type/ subsidence category
3.3.2
Damage to buildings
Damage to buildings due to subsidence = # buildings/ subsidence category * estimate restoration costs (IDR)/building/subsidence category
3.3.3
Indirect damage
Increased coastal flood risk
Increased coastal flood risk = ∫#ha per land use newly exposed to coastal flooding * damage-effect relationship (f(inundation depth, land use, return period)
3.4.2
Loss of land near water bodies
Economic value of land loss = #ha/land use type below MSL (Scenario A/B)*land price/ha/land use type (IDR)
3.4.3

22 of 60 Economic assessment of subsidence in Semarang and Demak, Indonesia
1220476-002-ZKS-0009, 1 February 2021
3.3 Direct subsidence damage
Direct subsidence damage includes damage to infrastructure and buildings as a result of
settlement. Expected economic damage is a function of hazard (subsidence rate), exposure (#
exposed assets) and vulnerability (damage relationship per asset/subsidence rate).
For direct subsidence damage, damage-effect relationships – estimating e.g. amount of
damage to buildings or roads under a specific subsidence rate – are largely missing. We
therefore base the analysis on extrapolating numbers from locations where such damage
relations have been established, complemented by assumptions described in the sections
below. To calculate the direct damage to roads and buildings due to subsidence, we make use
of damage restoration costs.
3.3.1 Subsidence hazard
Subsidence data is derived from Ellipsis data (Ellipsis, 2020) for the Semarang area and from
available DSInSAR data (Yuwono, Subiyanto, Pratomo, & Najib, 2019) for the Demak area2.
The subsidence rate is generally higher in the Northeastern part of Semarang, and in the
Sayung and Karangtengah district in Demak. In the Genuk district in north-eastern Semarang,
where the Genuk Industrial area is located, subsidence is particularly severe with > 10 cm /
year (Fout! Verwijzingsbron niet gevonden.).
—————————————— 2 Ellipsis subsidence rate was derived from Sentinel-1A bi-monthly observation data that was taken since April 2016
to October 2019 and processed with inSAR (Interferometric synthetic aperture radar) technique (Ellipsis Earth,
2020). Demak subsidence data was derived using DinSAR (Interferometric synthetic aperture radar) techniques and
GNSS (Global Navigation Satellite System) technology to predict the rate of land subsidence coastal of Demak.
Box 1: Background - economic valuation of subsidence impact Estimation of direct market effects is relatively straightforward, particularly for structural damage (e.g. to roads and buildings): this can be estimated using cost-based approaches such as damage restoration costs and lifecycle cost. More time-intensive approaches such as revealed or stated preference can also be applied to estimate direct market effects (e.g. hedonic pricing): this includes for example the statistical analysis of a large dataset of house characteristics – and prices to derive the value of a single characteristic – e.g. the subsidence rate. Indirect market effects can be estimated using production functions and revealed preference methods such as hedonic pricing, and by identifying the contribution of subsidence to risk to natural hazards or environmental impacts. In a data-scarce environment, the mitigation cost or engineering approach can also be applied: in this approach, the cost of preventing (negative consequences of) subsidence are used as a proxy for the economic value of the negative impacts. Although not technically correct, this approach does give valuable information: if the prevented negative consequences of subsidence are valued higher (e.g. by stakeholders/ expert assessment) than the mitigation costs, there is a rationale for prevention. Direct and indirect non-market effects can be estimated using revealed and stated preference methods which derive the willingness to pay or accept, such as contingent valuation (Damigos, Tentes, Balzarini, Furlanis, & Vianello, 2017), choice experiment and hedonic pricing (Willemsen, Kok, & Kuik, 2020; Wade, Cobourn, Amacher, & Hester, 2018).

23 of 60 Economic assessment of subsidence in Semarang and Demak, Indonesia
1220476-002-ZKS-0009, 1 February 2021
3.3.2 Damage to roads
Subsidence leads to differential settlement, tilting and cracks/ potholes in roads, reducing their
quality. To maintain a stable performance level (quality), more maintenance is needed3.
Data on location and type of roads in the area is derived from the critical infrastructure dataset
(Central Java Government, 2020): Figure A-1. Two types of roads can be distinguished: large,
arterial roads (highways) and regular roads.
Figure A-1 Critical infrastructure in Semarang and Demak (Central Java Government, 2020)
Roads that are subject to subsidence have a shorter lifetime and they have to be periodically
elevated and require more frequent maintenance. This results in higher lifecycle costs. To
estimate the additional life-cycle costs of roads as a result of subsidence, we take the following
assumptions:
• The service level of a regular road is lower than an arterial road: we assume that this
translates in a factor 1,5 higher maintenance costs per m2 for arterial roads compared
to regular roads.
• Damage-effect relationships on subsidence and life cycle costs for roads are largely
missing. A recent study on additional maintenance costs for regular roads under
subsidence from the Netherlands (van de Ridder et al., 2020) does give an average
additional costs of €2,1/m2 per year. Most locations in the studied area subside on
average 0,5-1 cm. In absence of better, local estimates, we extrapolate this result to
this study. As the Netherlands have one of this highest performance levels for roads in
—————————————— 3 If this increased maintenance is not done, the service level of the road reduces: this also has economic
consequences, like increased travel time, damage to vehicles and lower safety (more incidents).
Additional lifecycle costs of roads = # m2/road type/subsidence category * additional costs (IDR)/m2/
year/ subsidence category

24 of 60 Economic assessment of subsidence in Semarang and Demak, Indonesia
1220476-002-ZKS-0009, 1 February 2021
the world, we assume that this estimate (€2,1/year for a rate between 0,5-1 cm)
translates to the Indonesian context for higher subsidence rates: 2-4 cm/year. Adjusted
for price level 2020 based on OECD price indices4 this is 13.409 IDR/m2/year5 .
• We assume areas with lower subsidence rate have lower costs (-20%) and areas with
higher rates (>4 m) have higher costs (+20%)
• Based on the above, we assume the following additional maintenance costs due to
subsidence (Table 3-3).
Table 3-3 Assumed additional maintenance costs due to subsidence in IDR/year/m2 road
Subsidence rate Assumed additional maintenance costs in IDR/year
Arterial road Regular road
0-2 cm/year 16.080 10.720
2-4 cm/year 20.100 13.400
>4 cm/year 24.120 16.080
3.3.3 Damage to buildings
Economic damage to buildings resulting directly from subsidence includes (restoration/ and or
loss of building value due to) tilting of the house, cracks, damage to windows and doors. In
extreme form, this may lead to integral instability and danger of collapse. There is no detailed
study of the extent and underlying causes6 of damage to buildings in the area but is clear that
these issues occur (see 7B ).
Building data was generated from Open Street Map database (Openstreetmap, 2020). In
Semarang, this covers all buildings in the area affected by subsidence. In Demak however,
building information in the database is incomplete and does not cover the entire study area:
this may lead to underestimation of building affected by subsidence.
To estimate the direct damage to buildings due to subsidence, we take the restoration costs
approach7. As damage-effect relationships are largely lacking (i.e. how high are restoration
costs for buildings under certain subsidence rate), we extrapolate results from the Netherlands
to the study area. As type of buildings, subsidence and damage mechanisms are not similar
between the two countries, we conservatively take the following assumptions;
—————————————— 4 Comparative price level provides a measure of the differences in the general price level between countries. Indices
are derived from https://data.oecd.org/price/price-level-indices.htm
5 The order of magnitude of our assumptions seems realistic, based on reported costs for elevating roads in the project
area. Reported costs for elevating an arterial road with 40 cm are 5000 million IDR / km (Pramesti, 2020). Elevating
costs for smaller roads are 551 million IDR / km (Electronic Procurement Services Demak Government, 2020).
Assuming an arterial road is 20 m broad, annual additional costs/km amount to IDR 420 million based on our
assumptions. This corresponds to the costs for elevating it once every 12 years, which seems a reasonable interval.
6 There might e.g. be different impacts based on building age, type and quality of the foundation/ overall construction.
Damage to buildings due to subsidence = # buildings/ subsidence category * restoration costs
(IDR)/building/subsidence category

25 of 60 Economic assessment of subsidence in Semarang and Demak, Indonesia
1220476-002-ZKS-0009, 1 February 2021
• Restoration costs for buildings in Indonesia are 50%8 of those in the Netherlands
(Costa et al., 2020; see also Table 24 in Annex), after adjusting the price level based
on OECD price indices
• We assume that damage from buildings in low-medium and medium damage
categories (i.e. filling up cracks up to 15 mm, repainting in and/ or outdoors) is restored
once every 10 years: as superficial damage is restored but underlying building
foundations are not strengthened, the effect will be short-lived.
• Damage from buildings in a severe damage class will be restored once between 2020-
2040 (i.e. repainting, filling cracks >20 mm width, restoring tilted floors, stuck windows
and door frames, stabilization of building foundation) – assuming that during
maintenance preventive measures are taken to avoid further damage.
Table 3-4 Assumed damage restoration costs for buildings affected by subsidence
Subsidence rate Assumed damage level Restoration costs/building in IDR
0-2 cm/year Low-medium 29.000
2-4 cm/year Medium 170.000
>4 cm/year Severe 587.000
3.4 Indirect subsidence damage
Indirect subsidence damage includes damage related to direct, physical damage to
infrastructure and buildings (e.g. business interruption or health risks) or 2) direct effects related
to other natural hazards driven or aggravated by subsidence – such as flooding. In this study,
we focus on the latter, and monetise impacts of subsidence in relation to increasing flood risk,
and land loss to the sea (permanently inundated).
3.4.1 Flood hazard
A flood hazard is defined as the probability (e.g. 1:10 years) and intensity (inundation depth,
extent) of coastal flooding.
Table 3-5 gives information about the extreme storm surge in the area, based on global data.
As the variance of the storm surge for different return periods is very small (less than 0.01),
we use the extreme storm surge value of 2 m for all flood return periods, instead of assigning
the different inundation depths for each different return period. To single out the effect of
subsidence on the flood hazard, we consider the potential flood extent as key hazard
parameter for both increased flood risk and land loss. Other factors related to flood risk such
as daily and monthly tidal oscillations, sea level rise, changing extreme storm surge,
tsunami’s and hurricane conditions and land use change (which do affect the coastal hazard
in the area are assumed to remain constant for the purpose of this analysis (Muis, et al.,
2020) .
—————————————— 8 Costa et al show restoration costs in €/m3. In the Netherlands, buildings are on average 200 m3 in size. For
Indonesia, we assume buildings are 50% of this: 100 m2.

26 of 60 Economic assessment of subsidence in Semarang and Demak, Indonesia
1220476-002-ZKS-0009, 1 February 2021
Table 3-5: Extreme storm surge for different return period in Semarang - Demak area (Muis, et al., 2020)
Station Location
Return Period / Storm surge (m) Average (m)
Variance (m)
2 5 10 25 50 100 250 500 1000
Demak 1.92 1.94 1.96 1.98 2.00 2.01 2.04 2.05 2.07 2.00 0.00
To calculate the development of potential flood extent (inundated areas) over time, we calculate
elevation in 2040 by subtracting the total subsidence between 2020-20409 from the current
(2020) Digital Elevation Model (DEM).
The area below storm surge height but above mean sea level and connected to the sea in the
projected 2040 DEM, is considered as the increased flood extent due to subsidence. Projected
areas that are below mean sea level in 2040 and connected to the sea are considered as
permanently inundated and therefore considered lost (land loss). These areas are excluded
from the flood risk assessment (section 3.4.2); economic costs of land loss is valued in a
different manner, as described in section 3.4.3.
To isolate the impact of additional subsidence over the period of 2020-2040 on land loss and
increased flood risk, we only consider additional flood risk extent between 2020-2040
compared to the current flood extent.
Figure A-1 Overview of assumptions regarding flood hazard and land loss in relation to elevation in 2040
—————————————— 9 Based on the assumption the current subsidence rates remain constant over time.

27 of 60 Economic assessment of subsidence in Semarang and Demak, Indonesia
1220476-002-ZKS-0009, 1 February 2021
3.4.2 Increased coastal flood risk
Figure A-1 gives an overview of the flood risk damage calculation procedure in this study.
The steps and data are further explained in this section.
Potential flood extent maps (3.4.1) are overlaid with the land use map to calculate the
number of hectares of exposed residential, industry, agriculture, and aquaculture area. The
land use map used for this assessment is the Central Java Government spatial planning map
for 2030 (Figure A-2), since there are no maps for 2020 and 2040. As the planned
development in the area (e.g. urbanisation, expansion of industrial areas) is likely to continue
after 2030, this may lead to an underestimation of damage for the period 2030-2040, and an
overestimation for 2020-2030.
Damage resulting from a flood event is dependent on the inundation depth and land use type.
To derive damage for each inundation depth in each different land use type we use the
database with Indonesia-specific depth-damage functions (Huizinga, de Moel, & Szewczyk,
2017). This dataset contains damage curves depicting fractional damage as a function of
water depth as well as the relevant maximum damage values for a variety of assets and land
use classes derived from extensive literature survey. The estimated damage for each
inundated depth taken is presented in Table 3-6. Aquaculture damage is not available in
hence we assume that aquaculture damage is equal to agriculture damage.
Increased coastal flood risk =
∫(# ha per land use newly exposed to coastal flooding (DEM2040) x damage −
effect relationship (f(inundation depth, land use, return period)))
Figure A-1. Overview of the damage calculation procedure in this study. ∑1 is a calculation in which the discount
rate is applied, and ∑2 is a calculation in which the Expected annual damage (EAD) from coastal flooding is
calculated

28 of 60 Economic assessment of subsidence in Semarang and Demak, Indonesia
1220476-002-ZKS-0009, 1 February 2021
Table 3-6: Maximum damage of flooding for each land use type (Huizinga, de Moel, & Szewczyk, 2017)
between 2020-2030.
For each land use type, damage is calculated as a function of inundation depth and the
maximum damage, following the function presented in Figure A-3. We combine above factors
to calculate expected annual damage (EAD) from coastal flooding by taking the integral of the
damage as function of the return periods, as illustrated in Figure A-1.The dots are the
calculated damages at different return periods; the blue line is the linear interpolation between
each flood return period damage calculations. As the storm surge height does not significantly
vary for different return periods (Table 3-5 and Figure A-1), we use the average storm surge
height for all flood return period, therefore, damage for different flood return periods in this
study are equal. The blue surface under this dotted line is the EAD in million IDR/year. To
calculate the present value of this flood risk over 20 years, this EAD is discounted.
Inundation Depth (m) Maximum damage (2010 value)
Residential 105600 IDR / m2
Industry 475200 IDR / m2
Agriculture 140800 IDR / hectare
Aquaculture 140800 IDR / hectare
Figure A-2 Planned land use in Semarang and Demak (Semarang Municipality Government, 2011; Central
Java Government, 2020)

29 of 60 Economic assessment of subsidence in Semarang and Demak, Indonesia
1220476-002-ZKS-0009, 1 February 2021
3.4.3 Loss of land
Over time – in the absence of extensive investments in coastal protection – the coastline will
move inwards, and land is permanently lost. Section 3.4.1 explains how we calculate the extent
of land lost to the sea by 2040. The economic value of land loss is based on the average land
price per land use type.
The land use map used for this assessment is the Central Java Government spatial planning
map for 2030 (Figure A-2). For the year 2040 we assume land use is the same as in 2030.
Land prices give a reasonable proxy for the economic value of land. To calculate the damage
from land loss, we therefore use land prices. As comprehensive regional data is lacking, we
assume land prices based online advertisements covering residential, industrial, and
agricultural areas (rumah123.com, 2020; olx.com, 2020). We assume the value of aquaculture
land is similar to agricultural land. We further assume land prices will increase over time with
average inflation over 2010-2020 4,65% (Central Bank of Indonesia, 2020)(Table 3-7).
To calculate the economic damage from land loss between 2020 and 2040, we further assume
that the rate of land loss between 2020 and 2040 is linear.
Economic value of land loss = #ha/land use type below MSL (Scenario A/B) * land price/ha/land
use type (IDR)
0
0,2
0,4
0,6
0,8
1
1,2
0 1 2 3 4 5
Dam
age
fact
or
Inundation Depth (m)
damage fraction residential and industrial
damage fraction agriculture and aquaculture
Figure A-3. Depth damage function used in this study to calculate the damage of residential,
industrial, agriculture, and aquaculture to different inundation depth. The calculated damage is
the product of damage factor times maximum damage (see also Table 3-6)

30 of 60 Economic assessment of subsidence in Semarang and Demak, Indonesia
1220476-002-ZKS-0009, 1 February 2021
Table 3-7 Overview of land prices (price level 2020) per land use type
Land use type Land price (million IDR/m2, 2020)
Semarang Demak
Residential 8.90 3.54
Industry 6.47 2.32
Agriculture 0.11 0.30
Aquaculture 0.11 0.30
Figure A-1. Illustration of calculation of the Expected Annual Damage (EAD). The dots are the results
from the damage calculation at different return periods and the blue area represents the EAD

31 of 60 Economic assessment of subsidence in Semarang and Demak, Indonesia
1220476-002-ZKS-0009, 1 February 2021
3.5 Overview of data sources
In Table 3-8 an overview is presented of the datasets used to calculate subsidence impacts
in this study.
Table 3-8: List of datasets used for the calculation in this study
Type Data Source
Hazard Subsidence rate Semarang (Ellipsis, 2020)
Subsidence rate Demak (Yuwono, Subiyanto, Pratomo, & Najib, 2019)
Extreme storm surge (Muis, et al., 2020)
Digital Elevation Model DEMNAS
Exposure Land use (Semarang Municipality Government, 2011; Central Java Government, 2020)
Vital infrastructure of Semarang and Demak
(Central Java Government, 2020)
Building (Openstreetmap, 2020)

32 of 60 Economic assessment of subsidence in Semarang and Demak, Indonesia
1220476-002-ZKS-0009, 1 February 2021
4 Subsidence scenarios
In this study, we assess the economic impact of subsidence in Semarang and Demak in two
subsidence scenarios:
1. Scenario A, where the subsidence rate is reduced to half its current rate after 10 years.
2. Scenario B, where the subsidence rate is reduced to a quarter of its current after 10
years.
Economic impact is assessed over a time span of 20 years: from 2020 to 2040 and compared
against a business as usual scenario.
4.1 BAU (Business as usual)
In BAU, the subsidence rate will remain constant over time. Currently planned measures that
address groundwater extraction are assumed to either be ineffective in significantly reducing
the subsidence rate or will not take effect until after 2040. With ongoing economic growth, the
number of assets exposed to subsidence and aggravated coastal flooding will be higher: to
address this, we use land use map of 2030. Although economic growth will likely also increase
groundwater demand and consequent subsidence, this relationship a knowledge gap and
cannot be quantified: we therefore assume the current subsidence rate will continue but not
increase in the future.
4.2 Scenario A: subsidence rate reduced by 50%
Experiences from other countries indicate that with full effort in minimizing subsidence, the
process can be significantly reduced over the span of 10 years after measures have been taken
(Sato, Haga, & Nishino, 2006). Building on this, we assume that in this the subsidence rate will
remain constant in the first 10 years (2020-2030), and then be reduce by 50% as a result of
efforts to mitigate subsidence.
4.3 Scenario B: subsidence rate reduced by 75%
We assume that in scenario B the subsidence rate will remain constant in the first 10 years
2020-2030), and then reduce by 75% as a result of efforts to mitigate subsidence.

33 of 60 Economic assessment of subsidence in Semarang and Demak, Indonesia
1220476-002-ZKS-0009, 1 February 2021
5 Results
5.1 Direct subsidence damage
5.1.1 Road infrastructure
Based on overlaying the subsidence map and road map in GIS, the amount of km road
impacted per subsidence class was calculated, presented in Table 5-1.
Table 5-1. Overview of # road (in km) impacted per subsidence rate.
subsidence (cm/year)
# Road impacted (km)
Road Arterial Road
Semarang Demak Semarang Demak
0-2 1202 160 125 0
2 to 4 127 744 5 91
4 to 6 149 12
6 to 8 153 15
8 to 10 229 138 26 23
> 10 125 8
Based on these quantities and the prices (for additional maintenance) presented in Table 3-310,
the annual costs of additional road maintenance due to subsidence amount to 128 billion
IDR/year in Semarang and 80 million IDR/year in Demak for regular roads, and 72 billion
IDR/year and 55 billion IDR/year respectively for arterial roads.
Under BAU, in which subsidence is expected to continue in the same rate, this amounts to
4307 billion IDR in present value. For scenario A, in which subsidence rate is halved after 10
years when measures come into effect, this amounts to 3456 billion IDR. For Scenario B this
amounts to 3030 billion IDR.
5.1.2 Damage to buildings
Based on overlaying the subsidence map and building data from Openstreetmap (see 3.3.3),
the amount of buildings impacted per subsidence class was calculated (Table 5-2).
Table 5-2 Number of buildings affected by subsidence
subsidence (cm/year) Affected Buildings (unit)
Semarang Demak
0-2 220148 2447
2 to 4 25201 25135
—————————————— 10 To arrive from IDR/m2 road to IDR/ km, we assume average width of arterial road 20m, and for regular road 5 m

34 of 60 Economic assessment of subsidence in Semarang and Demak, Indonesia
1220476-002-ZKS-0009, 1 February 2021
4 to 6 29833
6 to 8 32124
8 to 10 43036 1110
> 10 28165
Based on these quantities and the prices for restoration of damage presented in Table 3-4, we
calculate the damage to buildings due to subsidence (cracks, damage to windows etc).
In scenario BAU in Semarang, the present value of damage to buildings amounts to IDR 66
billion, and in Demak IDR 6 billion. In Scenario A, damage is respectively IDR 53 billion and
IDR 8 billion. In Scenario B, damage is respectively IDR 47 and 4 billion.
5.1.3 Other
Aside from damage to roads and buildings, there are many other physical assets that may be
damaged by subsidence and thus lead to restoration costs/ higher maintenance, or lower
service levels. These include damage to drinking water and water management infrastructure
(sewage pipes, drainage channels, pumping stations, dikes), transport infrastructure (railway,
ports, airports) and telecommunication and energy infrastructure (e.g. oil and gas pipes,
cables). It was not possible to monetize these impacts, but there is already evidence these
assets are subject to damage from subsidence in the area (illustrations in B): it can be expected
this will continue in the future.
5.2 Indirect subsidence damage
5.2.1 Increased coastal flood risk
To calculate the increase in coastal flooding relative to the current condition due to subsidence,
the increase in areas exposed to inundation are calculated for Semarang and Demak under
subsidence scenario A and B (see 3.4.2). Land that becomes permanently inundated is
deemed lost (see following section 5.2.2). Both for Semarang and Demak, inundation depths
are exceeding 1,5 m. In Semarang, mostly residential and industrial areas become subject to
inundation, in Demak mostly agricultural areas.
In Semarang, 249 hectares will become subject to inundation under BAU (additional to current
flood extent in 2020); 456 hectares under scenario A, and 327 hectares under scenario B. The
difference between scenario A and B and BAU is explained as under BAU more land will be
permanently lost instead of just subject to additional flooding.
In Demak, 765 hectares will become subject to inundation under scenario BAU (and also a
significant amount of land will be permanently lost, see next section 5.2.2). Under scenario A,
less land will become subject to flooding than in BAU. Scenario B has the highest increase in
total hectares flooded. These results might seem counterinitiative as Scenario B presumes
lowest subsidence rate. However, scenario B has the highest flood extent because scenarios
A and BAU have high loss of land. Thus, more area under scenario B becomes subject to
flooding instead of being completely lost (Table 5-3 and Table 5-5; see also in Annex).

35 of 60 Economic assessment of subsidence in Semarang and Demak, Indonesia
1220476-002-ZKS-0009, 1 February 2021
Table 5-3 Additional inundated area under BAU, scenario A and B in 2040, as compared to the current
situation (2020) in Semarang and Demak
Area Additional flood risk area addition under scenario A
(hectares)
Additional flood risk area addition under scenario B (hectares)
Additional flood risk area under BAU
(hectares)
Semarang 456 327 249
Demak 597 886 765
In present value, the overall increased flood risk due to subsidence over 2020-2040 amounts
to 390 billion IDR in BAU, 392 billion IDR in scenario A, and 158 billion IDR in scenario B.
Table 5-4:Damage from coastal flooding in Semarang and Demak relative to current condition for different land
use types (present value, in IDR x billion)
Land Use A B BAU
Semarang Residential 164 132 140
Industrial 136 216 108
Agriculture 0 0 0
Aquaculture 0 0 0
Total 300 348 248
Demak Residential 25 46 54
Industrial 121 135 88
Agriculture 0 0 0
Aquaculture 0 0 0
Total 146 181 142
5.2.2 Loss of land
As can be seen in Figure A-1, already in the current situation quite some land has been lost to
the sea in the past decades (in grey). If land subsidence continues unabated (BAU) further loss
of land will be significant (in green); if subsidence can be halved (scenario A) much land loss
will be prevented (in blue), and almost all can be prevented in scenario B with quartered
subsidence rate (in black).

36 of 60 Economic assessment of subsidence in Semarang and Demak, Indonesia
1220476-002-ZKS-0009, 1 February 2021
Figure A-1: Loss of land under the different scenarios and current condition.
Table 5-5: Land Loss under BAU, scenario A, and scenario B in Semarang and Demak as compared to 2020
Area Land Loss addition under scenario A (hectares)
Land Loss addition under scenario B
(hectares)
Land Loss addition under BAU (hectares)
Semarang 1216 671 1738
Residential 893 513 1313
Industrial 289 125 388
Agriculture + aquaculture
34 33 37
Demak 4989 4046 6463
Residential 736 601 1160
Industrial 275 218 436
Agriculture + Aquaculture
3978 3227 4867
Table 3-7 in section 3.4.3 gives an overview of the land value (price level 2020) for different
land use types in Semarang and Demak.
Economic damage due to loss of land is calculated as the product of lost area (Table 5-5) and
its land value (Table 3-7). Although overall less land is lost in Semarang, the damage is
relatively high as compared to Demak due the higher land value, as mostly industrial and
residential land is lost (Table 5-5). Total economic damage under BAU is IDR 113 trillion, IDR
83 trillion in scenario A, and IDR 37 trillion in scenario B.

37 of 60 Economic assessment of subsidence in Semarang and Demak, Indonesia
1220476-002-ZKS-0009, 1 February 2021
Table 5-6: Damage from land loss in Semarang and Demak relative to current condition for different land use
types (present value, in IDR x billion)
Land Use A B BAU
Semarang Residential 45002 11628 62428
Industrial 10727 2074 13714
Agriculture 23 60 25
Aquaculture 1 1 1
Total 55753 13764 76168
Demak Residential 16328 14100 23325
Industrial 3509 2892 5252
Agriculture 7254 6204 8481
Aquaculture 66 68 108
Total 27157 23263 37166
5.2.3 Other
Aside from increased coastal flood risk and land lost permanently to the sea, subsidence also
increases pluvial and fluvial flood risk. As the hydrodynamic structure of the land changes, it
will become increasingly difficult for rivers to discharge to the sea, leading to high water levels
at the river mouth and farther inland. Furthermore, it will become increasingly difficult to drain
(rain)water from quickly subsiding areas, leading to inundation during rain event.
The high (shallow) groundwater tables and increasing salinization of groundwater in the area
will also negatively affect agricultural yields (aside from flooding).
Overall, the increasing flood risk and land loss, lower yields of agriculture, and lower quality
and/ or higher costs for upkeep of buildings and infrastructures will reduce the attractiveness
of the entire area for businesses: as illustrated by the recent decision in Jakarta to relocate
administrative functions elsewhere.
For the population, all these impacts – increasing flood risk, damage to infrastructure, lower
agricultural yields and negative implications for the business climate, reduce the quality of life
in general.

38 of 60 Economic assessment of subsidence in Semarang and Demak, Indonesia
1220476-002-ZKS-0009, 1 February 2021
5.3 Overview of economic impact of subsidence
Table 5-7 shows the overview of economic impacts of subsidence under BAU, scenario A and
B over 2020-2040, in billion IDR. The most significant impact of subsidence by far is land loss,
followed by increased costs for maintenance of roads and arterial roads, and increased coastal
flood risk.
If no new policy adopted (BAU), the total order of magnitude of impacts monetized in this study
is around IDR 76 trillion for Semarang, and IDR 37 trillion for Demak, corresponding to
approximately $5,4 billion and $2,6 billion. By reducing subsidence with 50 % (Scenario A) or
75 % (Scenario B) after 10 years, respectively 30% and 66s% of this damage can be prevented
(Table 5-8).
These results do not give a full picture of the extent of damage (prevented) under different
subsidence scenarios, as not all effects could be quantified. In terms of economic impact,
particular increased pluvial and fluvial flood risk may be expected to significantly increase with
land subsidence. Other infrastructures beside roads will likely also have significantly higher life
cycle costs due to subsidence. Furthermore, consequences of subsidence may lead to a
reduced attractiveness of the business climate, possibly lower agricultural yields and an overall
lower quality of the life for the population. These effects are mentioned in overview
Effect Damage in Semarang (billion IDR)
Damage in Demak (billion IDR)
A B BAU A B BAU
Direct
Increased road maintenance
1346 1180 1677 798 700 994
Increased arterial road maintenance
764 670 951 549 481 684
Damage to buildings 53 47 66 5 4 66
Damage to other infrastructure
PM PM PM PM PM PM
Indirect
Land Loss 55753 13764 76168 27157 23263 37166
Increased Coastal Flood risk
300 348 248 146 181 142
Increased pluvial and fluvial flood risk
PM PM PM PM PM PM
Reduced attractiveness of business climate; lower agricultural yields
PM PM PM PM PM PM
Lower quality of life population
PM PM PM PM PM PM
Total (present value in billion IDR)
58216 16009 79110 28655 24629 39052

39 of 60 Economic assessment of subsidence in Semarang and Demak, Indonesia
1220476-002-ZKS-0009, 1 February 2021
Table 5-7 as Pro Memorie (PM): to be remembered when reviewing results from this study.
Table 5-7: Summary of economic loss due to subsidence in Semarang and Demak in 2020-2040 (present
value) in billion IDR. PM = Pro memorie
Effect Damage in Semarang (billion IDR)
Damage in Demak (billion IDR)
A B BAU A B BAU
Direct
Increased road maintenance
1346 1180 1677 798 700 994
Increased arterial road maintenance
764 670 951 549 481 684
Damage to buildings 53 47 66 5 4 66
Damage to other infrastructure
PM PM PM PM PM PM
Indirect
Land Loss 55753 13764 76168 27157 23263 37166
Increased Coastal Flood risk
300 348 248 146 181 142
Increased pluvial and fluvial flood risk
PM PM PM PM PM PM
Reduced attractiveness of business climate; lower agricultural yields
PM PM PM PM PM PM
Lower quality of life population
PM PM PM PM PM PM
Total (present value in billion IDR)
58216 16009 79110 28655 24629 39052

40 of 60 Economic assessment of subsidence in Semarang and Demak, Indonesia
1220476-002-ZKS-0009, 1 February 2021
Table 5-8 shows the benefits of Scenario A and B as compared to the damage incurred by land
subsidence under BAU. In Semarang, reducing subsidence has benefits of respectively IDR
21 trillion and IDR 63 trillion under Scenarios A and B. In Demak, reducing subsidence has
benefits of respectively IDR 10 and 14 trillion for scenario A and B.
Table 5-8 Benefits of Scenario A and B as compared to damage under BAU (in billion IDR, present value)
Sensitivity analysis
In annex C the sensitivity of some key elements from the analysis is tested: the accuracy of
the DEM, and the (not yet solidified) plans for a sea wall.
Accuracy of the Digital elevation model
The DEM is the basis for the calculation of the amount of land that will be lost and/ or subject
to flooding, in relation to the current situation (by subtracting expected subsidence in 2040 from
the 2020 DEM). In relation to land loss, results indicate that the outcome highly depends on
the quality of the DEM. If the DEM overestimates actual elevation (i.e. actual elevation is lower),
the results remain relatively similar. However, if the DEM underestimates actual elevation (i.e.
actual elevation is higher), this results in significantly lower land loss.
Flood risk adaptation plans: sea wall
There is currently a plan to establish a 27 km long sea wall along Semarang-Sayung coastline
section. If this sea wall is successfully installed, the low-lying area in northern Semarang will
still be connected to the sea and therefore still be subject to land loss and increased flood
hazard. In the Sayung district in Demak however, the sea wall will significantly prevent further
land loss and increased flood coastal risk.
Other key assumptions
Besides the impacts above which have been studied in more detail, the following factors/
assumptions may be expected to have a high impact on the results in this study:
Semarang Demak Total
Effect A B A B A B
Reduction LCC regular roads
331 497 196 295 528 792
Reduction LCC arterial roads
188 282 135 203 323 484
Prevented damage to buildings
13 20 61 62 75 82
Land Loss Prevented
20415 62404 10009 13903 82819 23912
Coastal Flood risk reduction
-52 -100 -4 -39 -152 -143
Total benefits 20895 63103 10397 14424 83593 25127

41 of 60 Economic assessment of subsidence in Semarang and Demak, Indonesia
1220476-002-ZKS-0009, 1 February 2021
• Cost transfer from the Netherlands for buildings and infrastructure:
Despite conservative extrapolation, transferring costs from the Netherlands – with very
different type of buildings and performance levels – may lead to an overestimation of
damage.
• Discount rate and time horizon;
In absence of a specific recommendation from the Indonesian public authorities on
which discount rate to use in economic appraisal studies, we used a social discount
rate of 10% as recommended by the ADB. This is quite high: a lower (or no) discount
rate would give very different estimates. The selected time horizon is also important:
20 years is relatively short. The impact of (reducing) subsidence will last beyond 2040.
• Set-up of scenario A and B.
For both scenarios we assume that measures to reduce subsidence will not be effective
in the first 10 years: damage is the same as BAU. Although it may be technically correct,
this means that in practice we only review (reduced) damage in the period between
2030-2040. This may lead to an underestimation of the benefits of reducing
subsidence.

42 of 60 Economic assessment of subsidence in Semarang and Demak, Indonesia
1220476-002-ZKS-0009, 1 February 2021
6 Discussion, conclusions and recommendations
6.1.1 Discussion/ study limitations
In this study we did a quick scan of potential economic impact of subsidence in Semarang and
Demak. As there was limited data available – particularly regarding damage-effect relationships
of direct infrastructure (how much damage is caused by a certain amount of subsidence), many
assumptions were taken to enable this – necessarily coarse – assessment of potential damage,
and not all identified impacts have been quantified. These assumptions may lead to an over –
or underestimation of the actual damage due to subsidence. We shortly discuss the most
prominent limitations of this study.
Development of damage under BAU
Economic development in the area will lead to 1) increased exposure to damage and 2)
possibly speeding up of subsidence rate with drinking water demand (and groundwater
extraction). In the analysis we only address the former, by using prognosis land use maps for
2030 (no maps available for 2040). As little is known about the relation between groundwater
extraction, we assume the subsidence rate to be constant. If in reality increased groundwater
extraction leads to more subsidence, this means our results could be an underestimation. If on
the other hand the negative impacts of subsidence lead to a reduced attractiveness of the
business climate and moving away of water-intensive industries towards 2030/2040, the
corresponding reduced groundwater extraction and subsidence rate could lead to an
overestimation of our results. Beyond the economic development over time, we have assumed
in this study that implementation of flood risk adaptation (e.g. 27 km long sea wall) and
subsidence mitigation plans (piped water supply) will either come into effect after 2040 or not
be effective before that time; if these measures are implemented successfully in the short term,
this means we overestimate development of damage under BAU (particularly in relation to flood
risk and land loss).
Flood risk and land loss
The model used to assess additional coastal flood extent and land loss in this model is very
simplistic: a comparison between areas on DEM (2020 and 2040) with the mean sea level and
average storm surge height under extreme events. This disregard any flood risk protection
measures currently in place, or small-scale adaptation measures (e.g. dikes, mangroves,
elevated roads) that may to some degree alleviate coastal flood risk. Regardless, overall, we
have reasonable confidence in this assessment as satellite images show that this analysis
works well for the current situation (2020) – in the past decades, already a significant amount
of land has been lost. A large gap in this study is the lack of flood risk assessment of fluvial
and pluvial flooding due to time and data limitations (such studies require complex flood
modelling). As subsidence will likely lead to hydrodynamic changes in the landscape and
increasing difficulty to discharge rainwater to the rivers, and river water to the sea, it is expected
both types of flood risk will increase significantly due to subsidence.
Cost transfer
As there are no damage-effect relationships established for the local context regarding the
impact of subsidence on roads and buildings, cost transfer from the Netherlands has been
used to estimate these impacts. The Netherlands have very high standards for performance of
roads; one of the highest in the world. Transferring cost estimates for management to Indonesia
(despite adjusting for the price level) inadvertently assumes the same performance level for
Indonesian roads. This has been addressed by adjusting the extrapolation to some extent (cost
estimate for 0-2 cm subsidence in NL correspond to 2-4 cm in Indonesia), but this is quite
arbitrary. The same goes for damage to buildings: damage restoration costs and damage-effect

43 of 60 Economic assessment of subsidence in Semarang and Demak, Indonesia
1220476-002-ZKS-0009, 1 February 2021
relationships (i.e. X cm of subsidence leads to Y level of damage) are likely very different in
Indonesia. This has been addressed to some extent (assuming damage in Indonesia is 50%
of that in Dutch context), but these assumptions may lead to over- or underestimation.
6.1.2 Conclusions
Against a backdrop of economic growth, water demand in Semarang and Demak have
increased over time, leading to significant groundwater extraction which in turn has spurred
subsidence in the area: in some locations over 8 cm/year. To address this issue, a roadmap
for mitigating and adapting to subsidence will be developed in coming years. In support of this
roadmap, this study addresses the following questions: ‘how much economic damage will
caused by subsidence if no new policy is adopted (business as usual; BAU), and how much of
this damage can be prevented under two alternative scenarios (A and B) in which subsidence
is reduced by respectively 50 and 75% after 10 year? This will provide valuable insight the
economic rationale of taking mitigative (or adaptive) measures.
We identified the following key economic impacts of subsidence: damage to infrastructure (e.g.
roads, railway, drinking water, water management), damage to buildings, increased flood risk
and eventual land loss, reduced attractiveness of the business climate, lower agricultural
production and decreased quality of life for the population. Of these measures, damage to
roads and buildings, coastal flood risk and land loss have been monetized. Other impacts, in
particular damage to other types of infrastructure (e.g. water management, sewage), fluvial
and pluvial flood risk and reduced attraction of the business climate are likely also significant
in terms of economic impact but could not be quantified due to time and data limitations.
If no new policy adopted (BAU), the total order of magnitude of impacts monetized in this study
is around IDR 76 trillion for Semarang, and IDR 37 billion for Demak, corresponding to
approximately $5,4 billion and $2,6 billion. By reducing subsidence with 50 % (Scenario A) or
75 % (Scenario B) after 10 years, respectively 30 and 66% of this damage can be prevented.
The most significant impact of subsidence by far is land loss, followed by increased costs for
maintenance of roads and increased coastal flood risk.
These results indicate that damage from subsidence in Semarang and Demak is very
significant, particularly in relation to land loss. Direct damage to buildings and infrastructure is
significant as well for individual home owners and infrastructure owners. The extent of flood
risk and land loss, and the long duration before measures could take effect (10 years),
demonstrate a high urgency to act in the short term.
6.1.3 Recommendations To support development and prioritization of adaptation and mitigation strategies for subsidence in Demak and Semarang, development of a full cost-benefit analysis is recommended. This analysis should encompass the following elements. First, a more elaborate study including assessment of impact that could not be quantified in this study, such as fluvial and coastal flood risk and damage to other types of infrastructure. Second, cooperation and/ or interviews with local stakeholders such as infrastructure owners would be very valuable in gathering relevant data such as dose-effect relationships and cost estimates. Third, a CBA should include a more elaborate assessment of the effectiveness of suggested measures in reducing subsidence and/ or the damage resulting from subsidence. Fourth, a more elaborate scenario assessment under BAU (high versus low economic development, climate change) would be valuable.
We also recommend an exercise to attribute damage to specific stakeholder (groups), as this
will be valuable in local dialogue on subsidence, measures and awareness raising.
44 of 60 Economic assessment of subsidence in Semarang and Demak, Indonesia
1220476-002-ZKS-0009, 1 February 2021
7 References
Abidin, H. Z., Andreas, H., Gumilar, I., Sidiq, T. P., & Fukuda, Y. (2012). Land subsidence in
coastal city of Semarang (Indonesia): characteristics, impacts and causes.
Geomatics, Natural Hazards and Risk, 4(3), 226-240.
doi:10.1080/19475705.2012.692336 Ali, M. (2010). Residantial Losses due to Coastal Flooding and its Handling Policy Direction
in Bandarharjo Village, Semarang City. Semarang: Diponegoro University.
Andreas, H., Abidin, H. Z., Gumilar, I., Sidiq, T. P., & Yuwono, B. (2017). Adaptation and
Mitigation of Land Subsidence in Semarang. AIP Conference Proceeding, 1857.
doi:10.1063/1.4987088
Andreas, H., Abidin, H. Z., Gumilar, I., Sidiq, T. P., Sarsito, D. A., & Pradipta, D. (2019). On
the acceleration of land subsidence rate in Semarang City as detected from GPS
surveys. E3S Web of Conferences, 94. Retrieved from
https://doi.org/10.1051/e3sconf/20199404002
Andreas, H., Abidin, Z. A., Pradipta, D., Anggreni, D., & Gumilar, I. (2018). Insight look the
subsidence impact to infrastructures in Jakarta and Semarang area; Key for
adaptation and mitigation. MATEC Web of Conferences. Retrieved from
https://doi.org/10.1051/matecconf/201814708001
Association of Indonesian Drinking Water Companies Central Java. (2020, 08 10). DPD
Perpamsi Jateng. Retrieved from http://www.dpdperpamsijateng.or.id/pdam-kab-
demak/
Bakr, M. (2015). Influence of Groundwater Management on Land Subsidence in Deltas.
Water Resource Managementr, 29, 1541-1555. Retrieved from
https://doi.org/10.1007/s11269-014-0893-7
Bappenas. (2010). Indonesia Climate Change Sectoral Roadmap. Scientific Basis: Analysis
and Projection of Sea Level Rise and Extreme Weather. Bappenas.
Bockarjova, M., Jonkman, S. N., Kok, M., & Bernardini, P. (2008). Integrated Hydrodynamic
and Economic Modelling of Flood Damage in The Netherlands. Ecological
Economics, 77-90.
Brouwer, R., & Bateman, J. (2005). Temporal stability and transferability of models of
willingness to pay for flood control and wetland conservation. Water Resource
Research. doi:10.1029/2004WR003466
Cabral-Cano, E., Dixon, T. H., Miralles-Wilhelm, F., Díaz-Molina, O., Sánchez-Zamora, O., &
Carende, R. E. (2008). Space geodetic imaging of rapid ground subsidence in
Mexico City. Bulletin of the Geological Society of America, 1556-1566.
Central Bank of Indonesia. (2020, August 16). Bank Indonesia. Retrieved from
https://www.bi.go.id/id/moneter/inflasi/data/Default.aspx
Central Java Government. (2020, August 31). Rencana Tata Ruang dan Wilayah Provinsi
Jawa Tengah. Retrieved from
http://geoportal.jatengprov.go.id/geoserver/wfs?service=WFS&version=1.0.0&reques
t=GetFeature&typeName=ADMIN:rtrwp_330020200106083814&outputFormat=shap
e-zip
Central Java Statistic Indonesia. (2020, October 6). Badan Pusat Statistik Provinsi Jawa
Tengah. Retrieved from
https://jateng.bps.go.id/statictable/2020/06/11/1792/penduduk-laju-pertumbuhan-
penduduk-distribusi-persentase-penduduk-kepadatan-penduduk-rasio-jenis-kelamin-
penduduk-menurut-kabupaten-kota-di-provinsi-jawa-tengah-2010-dan-2019.html
Central Java Statistics Indonesia. (2020, October 6). Badan Pusat Statistik Provinsi Jawa
Tengah. Retrieved from
https://jateng.bps.go.id/subject/9/industri.html#subjekViewTab3

45 of 60 Economic assessment of subsidence in Semarang and Demak, Indonesia
1220476-002-ZKS-0009, 1 February 2021
Central Java Statistics Indonesia. (2020, August 31). Badan Pusat Statistik Provinsi Jawa
Tengah. Retrieved from https://jateng.bps.go.id/subject/157/produk-domestik-
regional-bruto--kabupaten-kota-.html#subjekViewTab5
Central Java Statistics Indonesia. (2020, August 1). Badan Pusat Statistik Provinsi Jawa
Tengah. Retrieved from https://jateng.bps.go.id/statictable/2017/02/13/1410/-seri-
2010-pdrb-atas-dasar-harga-berlaku-menurut-kabupaten-kota-di-jawa-tengah-juta-
rupiah-2010---2019.html
Central Java Statistics Indonesia. (2020, October 6). Badan Pusat Statistik Provinsi Jawa
Tengah. Retrieved from https://jateng.bps.go.id/indicator/12/87/9/jumlah-penduduk-
menurut-jenis-kelamin.html
Chai, J. C., Shen, S. L., Zhu, H. H., Zhang, X., & L. (2004). Land subsidence due to
groundwater drawdown in Shanghai. Geotechnique, 54(2), 143-147. Retrieved from
https://doi.org/10.1680/geot.2004.54.2.143
Damigos, D., Tentes, G., Balzarini, M., Furlanis, F., & Vianello, A. (2017). Revealing the
economic value of managed aquifer recharge: Evidence from a contingent valuation
study in Italy. Water Resources Research, 6597-6611. doi:10.1002/2016WR020281
Deltares. (2015, 11 10). Sinking cities. Delft: Deltares. Retrieved from www.deltares.nl:
https://www.deltares.nl/app/uploads/2015/09/Sinking-cities.pdf
Department of Energy and Mineral Resources Central Java. (2020). Groundwater well
monitoring data. Central Java.
Development Planning Board of Semarang, Government of Semarang, Indonesia (Bappeda
Semarang). (2010). Semarang Long Term Planning 2005-2025. Semarang:
Development Planning Board of Semarang, Government of Semarang, Indonesia
(Bappeda Semarang).
Dolan, R., & Grant, G. H. (1986). Sinking Cities. American Scientist, 74(1), 38-47.
Dudley, J. H. (1970). Review of collapsing soils. Journal of the Soil Mechanics and
Foundation Division, 96, 925-947.
Electronic Procurement Services Demak Government. (2020, 10 04). LPSE Kabupaten
Demak. Retrieved from
http://lpse.demakkab.go.id/eproc/lelang/view/3853423;jsessionid=5zJcSsuOZBLTRb
UjEctIL8lN0hDO1fG9QDFnaCgB
Ellipsis. (2020, July 8). ellipsis-earth. Retrieved from https://insar.ellipsis-earth.com/
Ellipsis Earth. (2020). Applying InSAR to Sentinel 1 data: Compete guide. Ellipsis Earth.
Erban, L. E., Gorelick, S. M., & Zebker, H. A. (2014). Groundwater extraction, land
subsidence, and sea-level rise in the Mekong Delta, Vietnam. Environmental
Research Letters, 9(8), 084010. doi:10.1088/1748-9326/9/8/084010
Erkens, G., Bucx, T. H., Dam, R. A., Lange, G. d., & Lambert, J. (2015). Sinking Coastal
Cities. Proceedings of the International Association of Hydrological Sciences, 189-
198. doi:10.5194/piahs-372-189-2015
Galbusera, L., & Giannopoulos, G. (2018). On input-output economic models in disaster
impact assessment. International Journal of Disaster Risk Reduction, 186-198.
Retrieved from https://doi.org/10.1016/j.ijdrr.2018.04.030
Geospatial Agency of Indonesia. (2020, October 6). DEMNAS. Retrieved from
http://tides.big.go.id/DEMNAS/#
GIM International. (2004). Suitability of levelling, GPS, and InSAR for monitoring land
subsidence in urban areas in Indonesia. GIM International. Retrieved from
https://www.gim-international.com/content/article/land-subsidence-in-urban-areas-of-
indonesia
Google Earth. (2020, October 13). Google Earth. Retrieved from
https://earth.google.com/web/@-
6.96367526,110.3759972,3.56084681a,0d,60y,350.68734572h,78.30087693t,0r/dat
a=IhoKFkV0MTRXdG5aaThJa1ItaDdhcmd3bEEQAg
Google Satellites. (2020, October 3). Retrieved from https://www.google.com/maps/@-
6.9365793,110.4814213,5707m/data=!3m1!1e3

46 of 60 Economic assessment of subsidence in Semarang and Demak, Indonesia
1220476-002-ZKS-0009, 1 February 2021
Gumilar, I., Abidin, H. Z., Sidiq, T. P., Andreas, H., Gamal, G., Gamal, M., & Fukuda, Y.
(2013). Mapping And Evaluating The Impact Of Land Subsidence In Semarang
(Indonesia). Indonesian Journal of Geospatial, 26-41.
Hallegatte, S., & Przyluski, V. (2016). The Economics of Natural Disasters: Concepts and
Methods. World Bank Policy Research Working Paper.
doi:https://ssrn.com/abstract=1732386
Huizinga, J., de Moel, H., & Szewczyk, W. (2017). Global flood depth-damage functions.
Luxembourg: Joint Research Center. doi:10.2760/1651
Hutton, J. (2020, 12 1). The Straits Times. Retrieved from
https://www.straitstimes.com/asia/se-asia/semarang-is-sinking-all-has-become-sea-
for-its-tiny-neighbour
Islam, L. J., Yudo, P., & Sudarsono, B. (2017). Analisis Penurunan Muka TAnah
(Subsidence) Kota Semarang Menggunakan Citra Sentinel-1 Berdasarkan
MEtodeDinsar pada Perangkat Lunak Snap. Jurnal Geodesi Undip, 29-36.
Ismanto, A., Wirasatriya, A., Helmi, M., Hartoko, A., & Prayogi. (2009). Model Sebaran
Pernurunan Tanah di Wilayah Pesisir Semarang. Ilmu Kelautan UNDIP, 189-196.
Juyantono, Alvianto, K., Dipl, T. H., & Sentani, A. (2019). Study of the Semarang sea wall
project. Semarang: Sultan Agung Islamic University.
Kreibich, H., & Bubeck, P. (2015). Natural Hazards: Direct Cost and Losses Due to the
Disruption of Production Processes. The United Nation Office for Disaster Reduction.
Krynine, D. P., & Judd, W. R. (1957). Principles of Engineering Geology and Geotechnics.
New York: McGraw-Hill.
Kuehn, F., Albiol, D., Cooksley, G., Duro, J., Granda, J., Haas, S., . . . Murdohardono, D.
(2010). Detection of land subsidence in Semarang, Indonesia, using stable points
network (SPN) technique. Environmental Earth Science, 60, 909-921.
doi:10.1007/s12665-009-0227-x
Lazzaroni, S., & van Bergeijk, P. A. (2014). Natural disasters' impact, factors of resilience and
development: A meta-analysis of the macroeconomic literature. Ecological
Economics, 333-346. Retrieved from https://doi.org/10.1016/j.ecolecon.2014.08.015
Letitre, P., & Kooi, H. (2018). National Capital Integrated Coastal Development; Roadmap
Land Subsidence. Deltares. Deltares. Retrieved June 2020
Lixin, Y., Jie, W., Chuanqing, S., Guo, J., Yanxiang, J., & Liu, B. (2010). Land subsidence
disaster survey and its economic loss assessment in Tianjin, China. Natural Hazards
review, 35-41.
Marfai, M. A., & King, L. (2007). Monitoring land subsidence in Semarang, Indonesia.
Environmental Geology, 53, 651-659. doi:10.1007/s00254-007-0680-3
Marfai, M. A., & King, L. (2008). Coastal flood management in Semarang, Indonesia.
Environmenta Geology, 55, 1507-1518. doi:10.1007/s00254-007-1101-
Marsudi, M. (2000). Prediksi Laju Amblesan Tanah di Dataran Alluvial Semarang Propinsi
Jawa Tengah. Bandung: Institut Teknologi Bandung.
Merz, B., Kreibich, H., Schwarze, R., & Thieken, A. (2010). Review article ‘assessment of
economic flood damage'. Natural Hazards and Earth System Science, 1697-1724.
Ministry of Public Work Indonesia. (2010). Pola Pengelolaan Sumber Daya Air Wilayah
Sungai Jratunseluna. Jakarta: Ministry of Public Work Indonesia. Retrieved June
2020
Ministry of Publuc Work. (2020, 11 24). Ministry of Public Work. Retrieved from
https://www.pu.go.id/berita/view/17475/pembangunan-tol-semarang-demak-
terintegrasi-tanggul-laut-dimulai
Mousavi, S. M., Shamsai, A., El Naggar, M. H., & Khamehchian, M. (2001). A GPS-based
monitoring program of land subsidence due to groundwater withdrawal in Iran.
Canadian Journal of Civil Engineering, 28(3), 452-464. doi:10.1139/cjce-28-3-452
Muis, S., Apecechea, M. I., Dullaart, J., Rego, J. L., Madsen, K. S., Su, J., . . . Verlaan, M.
(2020). A High-Resolution Global Dataset of Extreme Sea Levels, Tides, and Storm

47 of 60 Economic assessment of subsidence in Semarang and Demak, Indonesia
1220476-002-ZKS-0009, 1 February 2021
Surges, Including Future Projections. Frontiers in Marine Science, 7, 263.
doi:10.3389/fmars.2020.00263
Murdohardono, D., Sudrajat, G. M., Wirakusumah, A. D., Kuhn, F., & Mulyasari, F. (2009).
Land subsidence analysis through remote sensing and implementation on
municipality level; Case study: Semarang municipality, Central Java Province,
Indonesia. BGR-GAI-CCOP Workshop on Management of Georisk. Yogyakarta.
Nurtyawan, R., & Fiscarina, N. (2020). Assessment of teh accuracy of DEM from
panchromatic pleiades imagery (Case studyL Bandung City, West Java).
International Journal of Remote Sensing and Earth Sciences, 35-44.
olx.com. (2020, 7 10). Retrieved from olx.com
Openstreetmap. (2020, 11 10). Building retrieved from https://www.openstreetmap.org/.
PDAM Semarang city. (2013). Drinking Water Supply System Masterplan of Semarang City.
Semarang: PDAM KOta Semarang.
Phi, H. P., & Strokova, L. A. (2015). Prediction maps of land subsidence caused by
groundwater exploitation in Hanoi, Vietnam. Resource-Efficient Technologies, 1(2),
80-89. Retrieved from https://doi.org/10.1016/j.reffit.2015.09.001
Phien-wej, N., Giao, P. H., & Nutalaya, P. (2006). Land Subsidence in Bangkok, Thailand.
Engineering Geology, 82(4), 187-201. doi:10.1016/j.enggeo.2005.10.004
Pramesti, D. (2020, July 11). Semarangpos. Retrieved from
https://www.semarangpos.com/atasi-genangan-air-rob-jalan-pantura-semarang-
demak-ditinggikan-1044359
Putranto, T. T., & Rude, T. R. (2011). Groundwater Problems in Semarang Demak Urban
Area. RWTH Aachen. Aachen: Aachen : Mainz. Retrieved May 2020
Putranto, T. T., & Rude, T. R. (2011). Hydrogeology of Semarang Demak Groundwater
Basin: an Overview and its Challenges in Preliminary Groundwater Flow Modeling.
The 36th HAGI and 40th IAGI Annual Convention and Exhibition. Makassar.
Putranto, T. T., & Rude, T. R. (2016). Hydrogeological Model of an Urban City in a Coastal
Area, Case study: Semarang, Indonesia. Indonesian Journal on Geoscience, 3(1),
17-27. doi:10.17014/ijog.3.1.17-27
rumah123.com. (2020, July 7). Retrieved from rumah123.com
Sarah, D., Syahbana, A. J., Lubis, R. F., & Mulyono, A. (2011). Modelling of Land
Subsidence Along TAnah Mag- Pelabuhan Section Semarang City Using Finite
Element Method. Riset Geologi dan Pertambangan, 21(2), 105-119.
Sato, C., Haga, M., & Nishino, J. (2006). Land Subsidence and Groundwater Management in
Tokyo. Special Feature on Groundwater Management and Policy, 403-424.
Schmidt, G. (2002). Groundwater quantification—validation of groundwater . Bundesanstalt
fu¨r Geowissenschaften.
Semarang City Governent. (2010). Lon Term Development Plan for the Semarang Area.
Semarang: Semarang City Government.
Semarang City Government. (2013). Semarang Mayor's Accountability Statement Report
(LKPJ) at the end of the 2013 Fiscal Year. Semarang: Semarang City Government.
Semarang Municipality Government. (2011). Local Government Regulation no 14 2011
concerning Spatial Plan for the City of Semarang, 2011-2031 . Semarang.
Shen, S., Ma, L., Xu, Y., & Ýin, Z. (2013). Interpretation of increased deformation rate in
aquifer IV due to groundwater pumping in Shanghai. Canadian Geotechnical Jornal,
50(11), 1129-1142. Retrieved from https://doi.org/10.1139/cgj-2013-0042
Sihwanto, S., & Iskandar, N. (2000). Konservasi Airtanah Daerah Semarang dan Sekitarnya.
Bandung: DGTL.
Sun, H., Grandstaff, D., & Shagam, R. (1999). Land subsidence due to groundwater
withdrawal: Potential damage of subsidence and sea level rise in southern New
Jersey, USA. Environmental Geology, 37, 290-296. Retrieved from
https://doi.org/10.1007/s002540050386

48 of 60 Economic assessment of subsidence in Semarang and Demak, Indonesia
1220476-002-ZKS-0009, 1 February 2021
Supriyadi. (2008). Separation of gravity anomaly caused subsidence and ground water level
lowering of time lapse microgravity data using model based filter: case study
Semarang alluvial plain (in Indonesian). Bandung: Institute of Technology Bandung.
Suripin. (2012). Contribution of Groundwater Abstraction to Landsubsidence at the North
Coast of Semarang. Media Komunikasi Teknik Sipil, 13(2), 27-36. Retrieved from
https://doi.org/10.14710/mkts.v13i2.3906
Susanto, A. (2010). Strategi Kebijakan Pemanfaatan Air Tanah Sebagai Sumber Air Bersih di
Kota Semarang yang Berkelanjutan. Bogor: Institut Pertanian Bogor.
Thanden, R. E., Sumadirdja, H., Richards, P. W., Sutisna, K., & Amin, T. C. (1996).
Geological Map of The Magelang and Semarang Sheet, Java, Scale 1:100.000.
Bandung: Geological Research and Development Centre.
Valentino, D. (2013). Study of Groundwater Resource Utilization Supervision in Industrial
Area of Semarang City. Jurnal Wilayah dan Lingkungan, 1(3), 265-274.
van Beek, W., Letitre, B., Hadiyanto, H., & Sudarno, S. (2019). Alternatives to groundwater
abstraction as a measure to stop land subsidence: a case study of Semarang,
Indonesia. E3S W eb of C onferences, 125. Retrieved from https://doi.o
rg/10.1051/e3sconf/201912501003
van der Veen, A. (2004). Disasters and economic damage: macro, meso and micro
approaches. Disaster Prevention Management, 274-279. Retrieved from
https://doi.org/10.1108/09653560410556483
Wade, C., Cobourn, K. M., Amacher, G. S., & Hester, E. T. (2018). Policy Targeting to
Reduce Economic Damages. Advance Space and Earth Science, 4401-4416.
doi:10.1029/2017WR022133
Willemsen, W., Kok, S., & Kuik, O. (2020). The effect of land subsidence on real estate
values. Proceedings of the International Association of Hydrological Sciences, 703–
707. Retrieved from https://doi.org/10.5194/piahs-382-703-2020
Xie, W., Li, N., Wu, J., & Hao, X. (2014). Modeling the economic costs of disasters and
recovery: Analysis using a dynamic computable general equilibrium model. Natural
Hazards and Earth System Sciences. doi:10.5194/nhess-14-757-2014
Yuwono, B. D., Subiyanto, S., Pratomo, A. S., & Najib. (2019). Time Series of Land
subsidence rate on Coastal Demak Using GNSS CORS UDIP and DINSAR. E3S
Web of Conferences, 94. Retrieved from
https://doi.org/10.1051/e3sconf/20199404004

49 of 60 Economic assessment of subsidence in Semarang and Demak, Indonesia
1220476-002-ZKS-0009, 1 February 2021
A Additional hazard and exposure information
A.1 Land loss
Figure A-1 Loss of land between 1984-2020. The image was taken at year a) 1984, b)1994, c)2004, and d)
2016. Source: google maps
Figure A-2: Land loss and inundated area in current condition

50 of 60 Economic assessment of subsidence in Semarang and Demak, Indonesia
1220476-002-ZKS-0009, 1 February 2021
Figure A-3: Land loss and inundated area in halved subsidence rate condition (scenario A)
Figure A-4: Land loss and inundated area in quartered subsidence rate condition (scenario B)
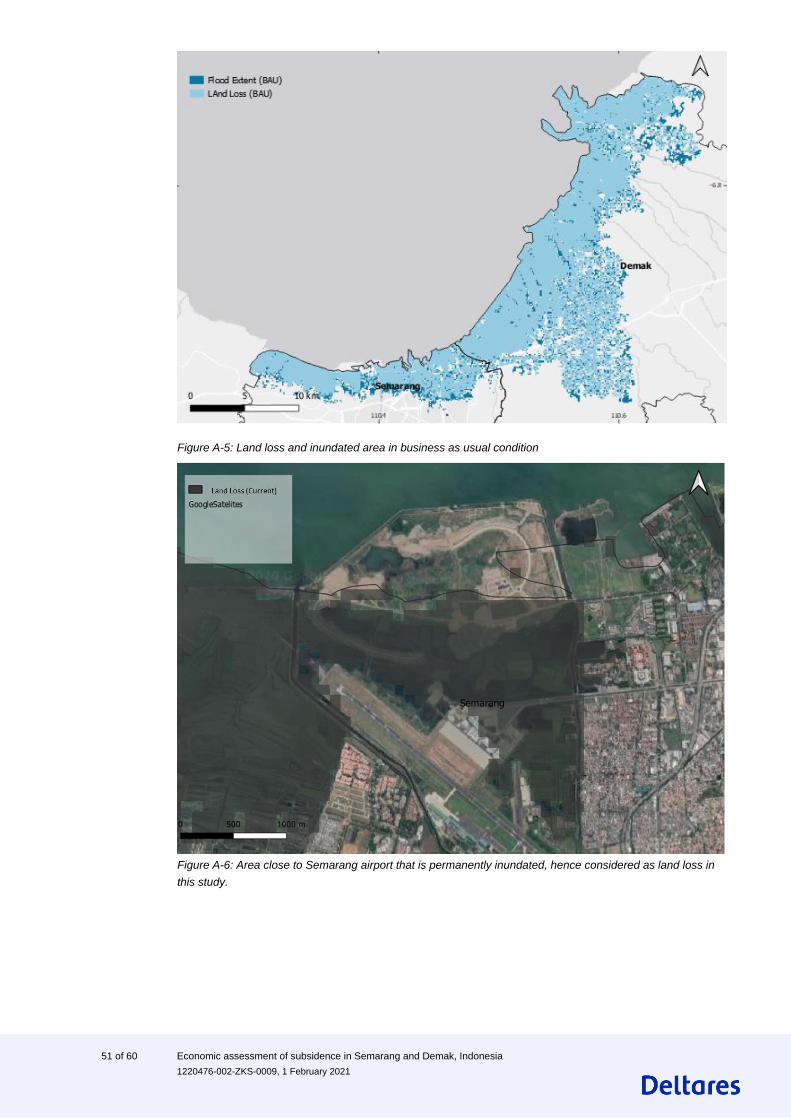
51 of 60 Economic assessment of subsidence in Semarang and Demak, Indonesia
1220476-002-ZKS-0009, 1 February 2021
Figure A-5: Land loss and inundated area in business as usual condition
Figure A-6: Area close to Semarang airport that is permanently inundated, hence considered as land loss in
this study.

52 of 60 Economic assessment of subsidence in Semarang and Demak, Indonesia
1220476-002-ZKS-0009, 1 February 2021
Figure A-7: Street view of the area in Figure A-6 (Google Earth, 2020)

53 of 60 Economic assessment of subsidence in Semarang and Demak, Indonesia
1220476-002-ZKS-0009, 1 February 2021
B Subsidence impacts
Figure B-1Illustration of subsidence impacts in Semarang. From Abidin et al (2012).
B-2: Evidence of land loss (Hutton, 2020)

54 of 60 Economic assessment of subsidence in Semarang and Demak, Indonesia
1220476-002-ZKS-0009, 1 February 2021
B-3: Evidence of elevated road in subsiding area (Hutton, 2020)

55 of 60 Economic assessment of subsidence in Semarang and Demak, Indonesia
1220476-002-ZKS-0009, 1 February 2021
C Economic valuation
In Table C-1 the method to monetize the market subsidence effect in this study is presented.
Table C-1: Economic costs of subsidence
Market
Direct • Loss in critical infrastructure like drinking water infrastructure, waste water treatment, surface water management/ drainage, railway, energy and telecommunication facilities, are difficult to be monetized as there is no available replacement cost or increase maintenance cost dataset of those type infrastructures. Therefore, in this study, we only qualitatively assess the potential damage attributed to these critical infrastructures by calculating the number of critical infrastructures impacted by subsidence without quantify the economic value of the exposed asset.
• Loss in structures like buildings including houses, factories, public/private space, gardens, and parks are also difficult to be monetized as there is no comprehensive study on subsidence-damage relation on these kinds of structures. Therefore, in this study, we only qualitatively assess the potential damage attributed to these critical infrastructures by calculating the number (or length) of the structures impacted by subsidence without quantifying the economic value of the exposed asset.
• Increased life cycle costs or reduced performance are calculated by calculating the increased maintenance cost and will be further explained in section 3.3
Indirect • Business interruption can be monetized using production function approach (Kreibich & Bubeck, 2015). This can be done by estimating the lost value of the production due to the impact of subsidence, i.e. the decreased in productivity during the coastal flooding event related to subsidence. To do this analysis, the production lost must be specifically attributed to the increased risk of coastal flooding related to subsidence. As there is no available dataset of loss of productivity in Semarang and Demak area related to coastal flooding and subsidence, therefore, this approach is not conducted in this study.
• Reduced attractiveness of business climate is also difficult to be monetized. This might be monetized by applying stated preference method with extensive questionnaire and interview. Due to the limitation of this study and the COVID-19 restriction, this approach is also not conducted in this study.
• Changes in elevation and slope of streams, canals, drainage, and reduced drainage capacity causing fluvial flood damage can be monetized by calculating the increase in fluvial risk damage. However, this calculation involves the hydrodynamic model of fluvial flooding and is outside the scope of this study.
• Aggravated coastal flood damage is calculated and further explained in section 3.4
• Increased salinization can further lower agricultural production. However, attribution of salinization to subsidence is not a straightforward approach as this approach requires groundwater and transport modeling and outside the scope of this study.
• Loss of land near water bodies is calculated and further explained in section 3.5
• Loss of property value can be analyzed by applying the hedonic pricing method (Willemsen, Kok, & Kuik, 2020). However, this approach requires an extensive dataset on sales and characteristics of property and this dataset is currently not available. Therefore, this approach is also not included in this study.

56 of 60 Economic assessment of subsidence in Semarang and Demak, Indonesia
1220476-002-ZKS-0009, 1 February 2021
Table C-2 Assumptions for restoration costs subsidence damage, extrapolating restoration costs for the
Netherlands based on (Costa et al., 2020) to Indonesian price level in 2019 (based on
https://data.oecd.org/price/price-level-indices.htm) .
Damage level
Damage Reparation works Average restoration costs per €/ m3 of building
in € / M3 on price level Indonesia**
Average restoration costs per IDR/ building (100 M3)
D0 No damage
D1 Very small cracks in inner wall (up to 1 mm width)
Repainting indoors €3,25 0,621 10376
D2 Cracks up to 5 mm width in inner and outer walls, slightly sticking doors and windows.
Repainting indoors, filling in cracks, equipment rental (e.g. scaffolding)
€ 15 2,868 47890
D3 Cracks with a width of 5-15 mm, sticking doors and windows, possible damage to utility infrastructure (sewage, drinking water)
Repainting indoors, filling in cracks, restoration plaster/ stucco , equipment rental (e.g. scaffolding)
€ 53 10,13 2E+05
D4 Cracks of 15-25 width, walls bulging or sagging: loss of carying capacity. Damage to pipes. Strongly sticking doors and windows.
Repainting indoors, filling in cracks, restoration plaster/ stucco , equipment rental (e.g. scaffolding), restoration of floors and window frames
€ 184 35,18 6E+05
D5 Cracks of over 25 mm width. Walls lose carying capacity; windows break; risk of instability/ collapse of building
Repainting indoors, filling in cracks, restoration plaster/ stucco , equipment rental (e.g. scaffolding), restoration of floors and window frames, restoration and/ or stabilization of foundation
€ 670 128,1 2E+06

57 of 60 Economic assessment of subsidence in Semarang and Demak, Indonesia
1220476-002-ZKS-0009, 1 February 2021
D Sensitivity analysis
D.1 Sensitivity to discount rate
Nominal values (no discount rate)
D.2 Flood risk and land loss - sensitivity to DEM
A sensitivity analysis is also conducted by introducing the vertical uncertainty of one meter.
One meter is selected to represent the DEMNAS vertical inaccuracy (Nurtyawan & Fiscarina,
2020). The difference between estimated land loss under current condition with three different
DEM are shown in Figure D-1. It shows that the estimated area loss is dependent on the DEM
used. The results of estimated additional land loss using the DEMNAS and DEMNAS-1m are
relatively comparable under BAU (Table D-3). However, DEMNAS+1m input yields to
significantly lower land loss addition under BAU. It infers that if the DEMNAS used for the
calculation of the study underestimates the current elevation in the northern part of Semarang,
the damage calculated might be overestimated.
Table D-3: Addition of land loss under BAU in Semarang sensitivity analysis
Scenario Addition of land loss (hectares) using DEMNAS
+ 1 meter
Addition of land loss (hectares) using DEMNAS
Addition of land loss (hectares) using
DEMNAS – 1 meter
BAU 351 1738 2345
Component Damage in Semarang (billion IDR, nominal value)
Damage in Demak (billion IDR, nominal value)
B A BAU B A BAU
Land Loss 175618 33509 264905 74381 57351 117999
Coastal Flooding -63 202 -316 129 302 107
Increase Road Maintenance 1984 2688 1239 1679
Increase Arterial Road Maintenance
1118 1515 868 1176
Damage to buildings 154 208 14 20
Total
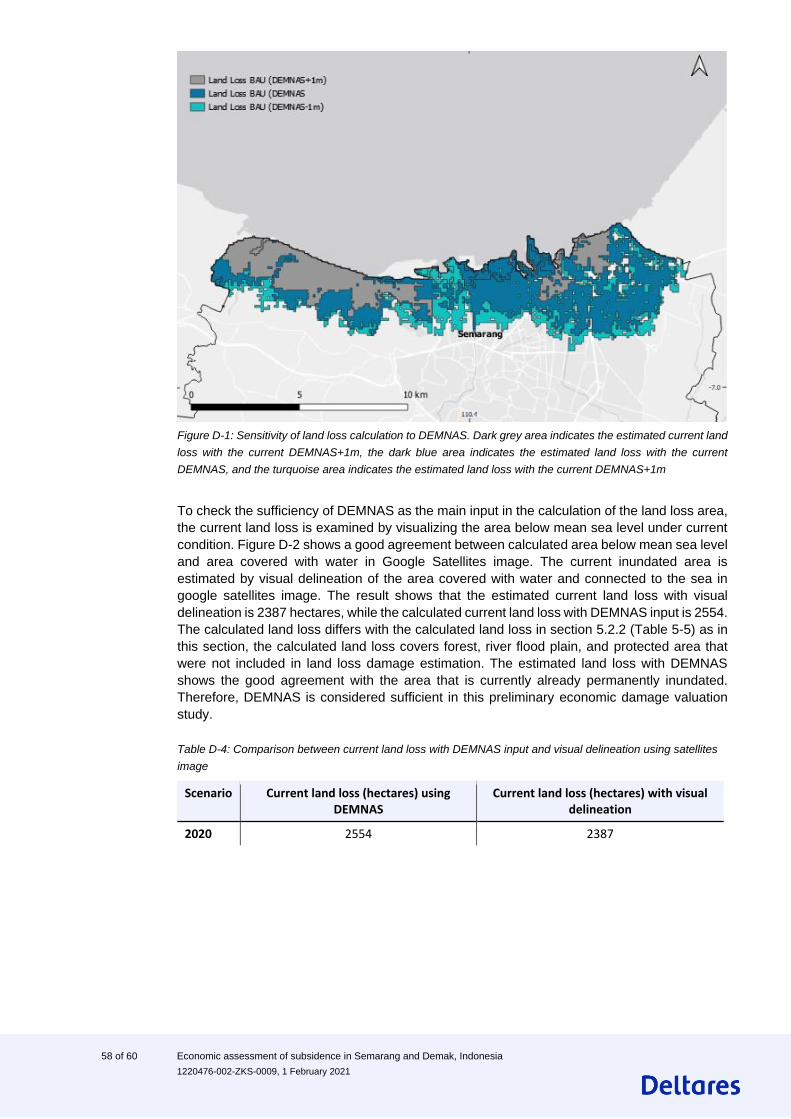
58 of 60 Economic assessment of subsidence in Semarang and Demak, Indonesia
1220476-002-ZKS-0009, 1 February 2021
Figure D-1: Sensitivity of land loss calculation to DEMNAS. Dark grey area indicates the estimated current land
loss with the current DEMNAS+1m, the dark blue area indicates the estimated land loss with the current
DEMNAS, and the turquoise area indicates the estimated land loss with the current DEMNAS+1m
To check the sufficiency of DEMNAS as the main input in the calculation of the land loss area,
the current land loss is examined by visualizing the area below mean sea level under current
condition. Figure D-2 shows a good agreement between calculated area below mean sea level
and area covered with water in Google Satellites image. The current inundated area is
estimated by visual delineation of the area covered with water and connected to the sea in
google satellites image. The result shows that the estimated current land loss with visual
delineation is 2387 hectares, while the calculated current land loss with DEMNAS input is 2554.
The calculated land loss differs with the calculated land loss in section 5.2.2 (Table 5-5) as in
this section, the calculated land loss covers forest, river flood plain, and protected area that
were not included in land loss damage estimation. The estimated land loss with DEMNAS
shows the good agreement with the area that is currently already permanently inundated.
Therefore, DEMNAS is considered sufficient in this preliminary economic damage valuation
study.
Table D-4: Comparison between current land loss with DEMNAS input and visual delineation using satellites
image
Scenario Current land loss (hectares) using DEMNAS
Current land loss (hectares) with visual delineation
2020 2554 2387

59 of 60 Economic assessment of subsidence in Semarang and Demak, Indonesia
1220476-002-ZKS-0009, 1 February 2021
Figure D-2: Calculated current area under mean sea level (land loss) in North Eastern Semarang and North
Western Demak overlaid with google satellites image (Google Satellites, 2020)
D.3 Flood risk and land loss - impact of planned toll road
There is currently a plan to establish Semarang-Sayung sea wall that is also served as a toll
road with length of 27 Km. The seawall is designed to prevent coastal erosion and damage
from wave action and storm surges, such as flooding. This project has investment value of IDR
15 trillion (Ministry of Publuc Work, 2020) while the operational and maintenance costs reach
100 billion rupiah per year (Juyantono, Alvianto, Dipl, & Sentani, 2019). For the implementation
plan in Semarang, the sea wall is planned as a protection from sea water, as well as a vehicle
access road. In addition, this embankment will also directly function as a polder embankment
for the East Semarang water system. This designed sea wall is already incorporated the
subsidence effect; hence the sea water would not overtop the dike at least within 20 years
period.
Figure D-3 shows the planned sea wall, the estimated land loss, and inundated area under
current condition. It shows that for Semarang area, inundated area behind the sea wall will still
be connected to the sea, hence the sea wall will not reduce the impact of subsidence in
Semarang. This also applies to scenario A, B, and BAU, where the projected inundated area
in Semarang will still be connected to the sea.
Unlike in Semarang, this sea wall might reduce the land loss and inundated area in Sayung
district, Demak, under scenario A, scenario B, and BAU scenario as this projected land loss
and inundated area are not connected to the sea anymore with the establishment of the sea
wall. Under BAU, this sea wall might protect 189 hectares of residential land, 110 hectares of
industrial land, and 73 hectares of agriculture land from land loss. Under scenario A, this sea
wall might protect 87 hectares of residential area and 53 hectares of industrial area from land
loss. Under scenario B, the sea wall might protect 76 hectares of residential area and 53
hectares of industrial area from land loss.

60 of 60 Economic assessment of subsidence in Semarang and Demak, Indonesia
1220476-002-ZKS-0009, 1 February 2021
Figure D-3: The estimated land loss and inundated area under current condition and the planned sea wall

7 of 7 test
1 February 2021, draft