economic and revenue...
TRANSCRIPT

Economic and Revenue Update
A Briefing for theMoney Committees
Aubrey L. Layne, Jr., MBA, CPASecretary of Finance
Commonwealth of Virginiawww.finance.virginia.gov
May 2018
Topics for Discussion
• National and State Economic Indicators
• April Year-to-Date Revenue Collections, Fiscal Year 2018
• Next Significant Data Points
• Revenue Analysis
• Rating Agency – PRAG Report
• Federal Tax Reform Interim Update
2

National and State Economic Indicators
• According to the advance estimate, real GDP grew at an annualized rate of 2.3 percent in the first quarter of 2018, following 2.9 percent in the fourth quarter.
• Payroll employment rose by 164,000 jobs in April, below expectations.– The March gain was revised up by 33,000 to 135,000.
• The national unemployment rate fell to 3.9 percent in April due to a contraction in the labor force.
• Initial claims for unemployment rose by 2,000 to 211,000 during the week ending April 28.
– The four-week moving average fell by 7,750 to 221,500, the lowest level since March 3, 1973.
• The Conference Board’s index of leading indicators rose 0.3 percent in March, following a 0.7 percent increase in February, suggesting the economic expansion should strengthen over the coming months.
• The Conference Board’s index of consumer confidence rose 1.7 points to 128.7 in April. Both the expectations and current conditions components increased for the month.
• Conditions in the manufacturing sector were somewhat weaker than expected in April. The Institute of Supply Management index fell from 59.3 to 57.3, but remains in expansionary territory.
3

National and State Economic Indicators• The CPI fell 0.1 percent in March after a 0.2 percent gain in February and stands 2.4
percent above March 2017. – Core inflation (excluding food and energy prices) rose 0.2 percent, and has
increased 2.1 percent from last year.
• At its May meeting, the Federal Reserve left the federal funds target rate range unchanged at 1.50 to 1.75 percent.
• In Virginia, payroll employment rose 1.1 percent from March of last year. Northern Virginia posted growth of 1.8 percent; Hampton Roads grew 0.1 percent; and Richmond-Petersburg rose 0.6 percent.
• The seasonally adjusted unemployment rate fell 0.1 percentage point to 3.4 percent in March, the lowest rate since March 2008.
• The Virginia Leading Index fell less than 0.1 percent in March after increasing 0.6 percent in February.
– The U.S. leading index and future employment improved in March, while auto registrations declined and initial claims for unemployment rose.
– The indexes increased in Northern Virginia, Hampton Roads, Charlottesville, Bristol, Harrisonburg, and Staunton, while decreasing in Richmond, Lynchburg, Blacksburg, and Winchester. The Roanoke index was unchanged.
4

5

5.4%
3.0% 4.1%
4.9% 4.9%
5.9% 5.8%
6.2%5.2%
6.7%
-4%
-2%
0%
2%
4%
6%
8%
10%
12%
14%
16%
18%
Jul Aug Sep Oct Nov Dec Jan Feb Mar Apr May Jun
Growth in Total General Fund Revenue CollectionsFY18 Monthly and Year-to-Date
Monthly Year-to-Date
• Total general fund revenues increased 17.8 percent in April.– Individual nonwithholding payments received ahead of the May 1st due date accounted for most of the
increase.
• On a year-to-date basis, total revenues increased 6.7 percent, ahead of the annual forecast of a 3.4 percent increase.
Forecast: 3.4%
Monthly Growth: 5.4% 1.1% 5.5% 7.7% 4.9% 10.0% 5.1% 10.9% -3.5% 17.8%
6

6.7%
3.5%4.0% 4.0% 4.0%
3.0%
4.7%5.6%
4.2%4.4%
-6%
-4%
-2%
0%
2%
4%
6%
8%
10%
12%
14%
Jul Aug Sep Oct Nov Dec Jan Feb Mar Apr May Jun
Growth in Withholding Tax CollectionsFY18 Monthly and Year-to-Date
Monthly Year-to-Date
• Collections increased 6.1 percent in April, a small amount of growth was due to an additional deposit day.
• Year-to-date, withholding collections increased 4.4 percent compared with the same period last year, ahead of the projected annual growth rate of 3.5 percent.
Monthly Growth: 6.7% 0.8% 5.0% 4.0% 4.1% -1.8% 14.0% 11.8% -4.7% 6.1%
Forecast: 3.5%
7

8
0
100
200
300
400
500
600
700
800
900
1,000
Jul Aug Sep Oct Nov Dec Jan Feb Mar Apr May Jun
Milli
ons
Nonwithholding Tax CollectionsFY16 - FY18 Monthly
FY16 FY17 FY18 FY18 Required to attain annual estimate
• To date, roughly 83 percent of the nonwithholding forecast has been collected, and collections increased 23.6 percent from the same period last year, ahead of the annual estimate of 4.3 percent growth.
• May receipts will mainly be final payments for tax year 2017 and continues to be a significant unknown positive affecting the revenue forecast.

Analysis of High Net Worth Individuals
• In December and January– 781 high-income tax payers (more than $1.7 million in taxable income) submitted
$297 million in payments.– This compares to the average of the last three years where 423 high-income
taxpayers submitted $162 million.• Previous peaks in payments were in FY07 and FY08 where an average of 478 high-income taxpayers
submitted $177 million.
• From April 1 through May 10– 22 have filed returns and requested $1.1 million in refunds. – 38 have filed returns and paid an additional $1.5 million in payments.– 175 have paid $34.7 million via extension returns and have until November 1st to
file returns.– The remaining 546 have had no additional activity and have a six-month
automatic extension to file their returns by November 1st.
9

Individual Income Tax Refunds
Net Individual Income Tax
• Through April, collections of net individual income tax rose 8.4 percent from the same period last year, ahead of the annual estimate of 3.4 percent growth.
10
• As the main filing season continues, $499.8 million in refunds were issued in April compared with $469.1 million last April.
• Year-to-date, refunds increased 4.2 percent from the same period last year, as compared to the estimate of a 5.8 percent increase.– Since the filing season began in January, TAX has issued 2.3
million refunds, about 60,000 more than through April of last year.

• Collections of sales and use taxes, reflecting mainly March sales, had a 5.3 percent increase in April.
• On a year-to-date basis, collections increased 3.2 percent, ahead of the annual estimate of 3.0 percent growth.
Monthly Growth: 5.7% -1.3% 5.0% 9.0% 5.1% 0.0% 0.8% 3.6% 0.4% 5.3%
5.7%
1.1%
2.7%
4.5% 4.7%
3.8%3.2% 3.2%
2.9%
3.2%
-2%
0%
2%
4%
6%
8%
10%
Jul Aug Sep Oct Nov Dec Jan Feb Mar Apr May Jun
Growth in Sales Tax Collections FY18 Monthly and Year-to-Date
Monthly Year-to-Date
Forecast: 3.0%
11

Net Corporate Income Tax Collections
12
• Collections of corporate income tax were $181.0 million in April, compared with $162.5 million last April.– Most of the activity in April is from companies making final tax year
2017 payments.
• On a year-to-date basis, collections in this source have increased 7.2 percent, ahead of the estimate of 5.7 percent growth.

Recordation Tax Collections
• Collections of wills, suits, deeds, and contracts – mainly recordation tax collections – increased 10.2 percent in April. – On a year-to-date basis, collections are down 0.3 percent, behind
the forecast of 3.3 percent growth.
Insurance Premiums Tax
1313
• Insurance companies made their first estimated payment for tax year 2018 in April. Collections in this source were $128.5 million compared with $126.1 million in April of last year.– Estimated payments are due in June.
• For the fiscal year to-date, net insurance premiums tax collections are $212.2 million compared with $223.3 million during the same period last year.

Summary of Fiscal Year 2018 Revenue CollectionsJuly through April
14
As a %of Total YTD Annual May-Jun Req'd Prior Year
Major Source Revenues Actual Estimate Variance to Meet Est. May-JunWithholding 63.7 % 4.4 % 3.5 % 0.9 % (1.2) % 7.2 %Nonwithholding 16.3 23.6 4.3 19.3 (40.8) 4.8Refunds (10.2) 4.2 5.8 (1.6) 15.7 39.3 Net Individual 69.8 8.4 3.4 5.0 (16.7) 4.0
Sales 17.9 3.2 3.0 0.2 2.4 3.6Corporate 4.5 7.2 5.7 1.5 0.8 12.3Wills (Recordation) 2.1 (0.3) 3.3 (3.6) 18.2 2.9Insurance 1.9 (5.0) 6.2 (11.2) 27.4 (4.9)All Other Revenue 3.8 (0.9) 1.6 (2.5) 7.2 (0.9)
Total 100.0 % 6.7 % 3.4 % 3.3 % (8.8) % 3.7 %
Percent Growth over Prior Year

Summary of Fiscal Year 2018 Revenue CollectionsJuly through April
15
TotalFY Collections Jul Aug Sep Oct Nov Dec Jan Feb Mar Apr May Jun
2000 10,788.5 699.1 1,435.8 2,503.0 3,210.6 3,977.8 5,080.0 6,067.5 6,704.5 7,374.1 8,411.9 9,663.1 10,788.5 2001 11,105.3 688.0 1,452.7 2,546.4 3,312.7 4,106.3 5,052.9 6,295.8 6,981.1 7,652.5 8,696.8 9,998.9 11,105.3 2002 10,679.0 705.4 1,483.7 2,485.4 3,315.4 4,136.9 5,071.2 6,184.7 6,794.7 7,459.8 8,388.0 9,414.6 10,679.0 2003 10,867.1 644.3 1,409.6 2,513.3 3,324.3 4,109.7 5,203.2 6,320.5 6,933.6 7,547.7 8,579.5 9,539.0 10,867.1 2004 11,917.9 699.3 1,553.7 2,724.3 3,618.2 4,449.1 5,570.2 6,721.0 7,377.9 8,130.2 9,393.7 10,423.6 11,917.9 2005 13,687.3 772.5 1,698.8 3,009.8 3,998.0 4,964.5 6,295.1 7,684.7 8,415.7 9,300.7 10,745.5 12,012.3 13,687.3 2006 14,834.3 840.5 1,987.8 3,445.8 4,510.5 5,537.3 7,006.6 8,542.7 9,306.7 10,273.3 11,758.2 13,253.6 14,834.3 2007 15,565.8 1,059.7 2,158.2 3,707.7 4,778.6 5,873.0 7,303.6 8,882.9 9,684.8 10,658.1 12,180.5 13,883.2 15,565.8 2008 15,767.0 1,095.6 2,231.1 3,842.1 5,023.2 6,085.2 7,540.8 9,175.5 9,916.1 10,920.8 12,664.1 14,131.9 15,767.0 2009 14,315.1 1,126.9 2,188.0 3,679.9 4,848.9 5,861.6 7,278.9 8,667.9 9,307.9 10,173.1 11,572.9 12,811.3 14,315.1 2010 14,219.5 1,036.2 2,027.7 3,407.0 4,482.0 5,465.7 6,960.9 8,258.9 8,861.4 9,752.5 11,157.9 12,394.4 14,219.5 2011 15,040.2 867.4 1,911.7 3,348.1 4,462.9 5,537.9 7,062.6 8,523.8 9,226.6 10,228.2 11,655.4 13,113.5 15,040.2 2012 15,846.7 955.4 2,080.6 3,573.2 4,722.6 5,903.2 7,356.7 8,868.2 9,692.1 10,770.1 12,347.9 13,927.3 15,846.7 2013 16,684.6 938.0 2,137.6 3,619.5 4,948.9 6,091.0 7,615.0 9,421.8 10,229.6 11,242.1 12,855.0 14,757.7 16,684.6 2014 16,411.4 1,059.9 2,201.4 3,722.3 4,980.1 6,134.4 7,670.6 9,371.5 10,151.7 11,242.9 13,017.7 14,526.7 16,411.4 2015 17,735.6 1,208.9 2,370.4 3,972.6 5,286.0 6,451.6 8,189.9 9,871.8 10,821.7 12,041.3 13,997.6 15,595.1 17,735.6 2016 18,040.1 1,088.3 2,309.0 4,066.3 5,312.6 6,538.5 8,318.1 10,111.0 11,048.9 12,360.6 14,185.1 15,883.0 18,040.1 2017 18,695.1 1,128.1 2,495.9 4,211.3 5,500.4 6,890.2 8,651.3 10,576.8 11,548.5 12,934.7 14,697.5 16,472.7 18,695.1
Average 14,566.7 923.0 1,951.9 3,354.3 4,424.2 5,450.8 6,846.0 8,308.2 9,055.7 10,003.5 11,461.4 12,877.9 14,566.7 % of Total 100.0% 6.3% 13.4% 23.0% 30.4% 37.4% 47.0% 57.0% 62.2% 68.7% 78.7% 88.4% 100.0%
2018HB/SB 29 19,328.2 1,188.6 2,572.0 4,382.3 5,770.2 7,227.8 9,165.2 11,189.5 12,267.0 13,605.4 15,682.0 - - % of Estimate 6.1% 13.3% 22.7% 29.9% 37.4% 47.4% 57.9% 63.5% 70.4% 81.1% 0.0% 0.0%
Revenue Collections Through:

Total General Fund Revenue Growth Relative to TargetWith and Without Individual Nonwithholding
16
FY 2018 Revised Estimate Commonwealth of Virginia/Department of AccountsPer House Bill 29, December 18, 2017 Summary Report on General Fund (GF) Revenue Collections
For the Fiscal Years 2017 and 2018(Dollars in Thousands)
% Annual% FY 2018 Growth Percent
Revenue FY 2017 FY 2018 Change Estimate Req By Est Variance Total GF Revenues $14,697,469 $15,682,039 6.7 $19,328,200 3.4 3.3
Total GF Revenues Less Tax Dues/Estimated Payments $12,585,909 $13,071,199 3.9 $16,180,900 3.2 0.6
Year-To-Date
• The first line represents the Total General Fund Revenues through April on page 1 of the revenue report from the Department of Accounts.
• The second line removes individual nonwithholding payments – estimated and tax due payments – from the Total General Fund Revenues calculation. On net, all the other major sources (withholding, sales, corporate, insurance and
recordation) and minor sources are tracking within 0.6 percent (or $80 - $100 million) of the annual estimate.
• The last deposit day in fiscal year 2018 could be worth $300 million in gross deposits.
Next Significant Data Points
• May– Key payments from individual nonwithholding will be received.– Continue to monitor tax refunds.
• June– Individual, corporate and insurance companies have estimated payments due
June 15th.– Continue to monitor tax refunds.
17

18
Revenue Analysis Based on Collections through April(millions of dollars)
Source FY18 FY19 FY20Withholding 90.0 90.0 90.0 Nonwithholding No additional data availableRefunds - - - Net Individual 90.0 90.0 90.0 Sales 10.0 - - Corporate 20.0 20.0 20.0 Wills (Recordation) (10.0) (10.0) (10.0) Insurance (25.0) (15.0) (15.0) All Other (25.0) (25.0) (25.0) Total Revenues 60.0 60.0 60.0
• Payroll withholding is tracking toward 4.3% with two months remaining in the fiscal year. An adjustment is made to all three years to maintain growth rates close to the introduced budget.
• Nonwithholding receipts and refunds are incomplete through April. Additional data will be received from May - November to update this source and anticipate other adjustments, including the “collar”.
• Sales tax appears to be headed to a small surplus. No out-year increases are included as new personal income and consumer spending forecasts will be developed in the fall.
• Other sources and minor sources have small additions and reductions that are made to all three years to maintain growth rates close to the introduced budget.

19

20
I. Comparison of Budget Reserves• Rating Agency Criteria Related to Budget Reserves• Description and Comparison of Reserve Funds• Rating Agency Commentary on Reserves for Triple-A States
II. Pricing and Debt Service Cost ComparisonIII. Rating Agency Credit Factors and Scorecards
• S&P Scorecard• Moody’s Scorecard• Fitch Scorecard
IV. RecommendationsAppendix A: S&P U.S. State Ratings Methodology – Scoring of
Rating Factors
Table of Contents – Scope of Work
21
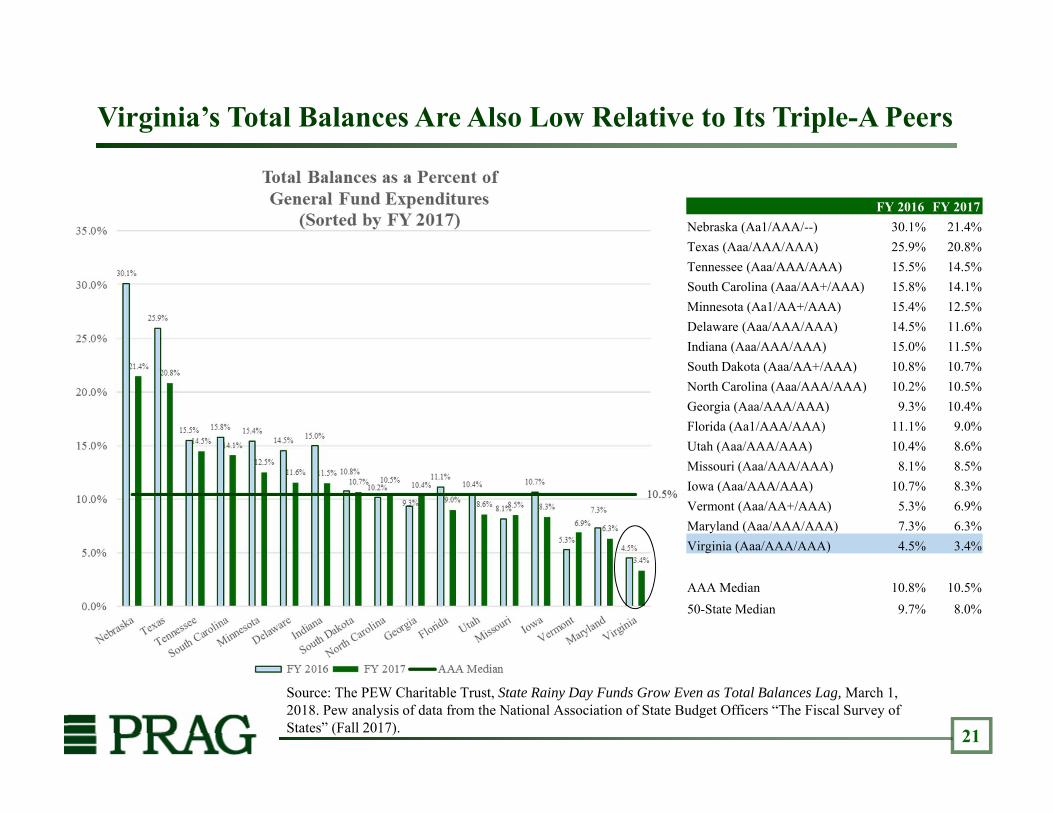
Virginia’s Total Balances Are Also Low Relative to Its Triple-A Peers
FY 2016 FY 2017Nebraska (Aa1/AAA/--) 30.1% 21.4%Texas (Aaa/AAA/AAA) 25.9% 20.8%Tennessee (Aaa/AAA/AAA) 15.5% 14.5%South Carolina (Aaa/AA+/AAA) 15.8% 14.1%Minnesota (Aa1/AA+/AAA) 15.4% 12.5%Delaware (Aaa/AAA/AAA) 14.5% 11.6%Indiana (Aaa/AAA/AAA) 15.0% 11.5%South Dakota (Aaa/AA+/AAA) 10.8% 10.7%North Carolina (Aaa/AAA/AAA) 10.2% 10.5%Georgia (Aaa/AAA/AAA) 9.3% 10.4%Florida (Aa1/AAA/AAA) 11.1% 9.0%Utah (Aaa/AAA/AAA) 10.4% 8.6%Missouri (Aaa/AAA/AAA) 8.1% 8.5%Iowa (Aaa/AAA/AAA) 10.7% 8.3%Vermont (Aaa/AA+/AAA) 5.3% 6.9%Maryland (Aaa/AAA/AAA) 7.3% 6.3%Virginia (Aaa/AAA/AAA) 4.5% 3.4%
AAA Median 10.8% 10.5%50-State Median 9.7% 8.0%
Source: The PEW Charitable Trust, State Rainy Day Funds Grow Even as Total Balances Lag, March 1, 2018. Pew analysis of data from the National Association of State Budget Officers “The Fiscal Survey of States” (Fall 2017).

22
Comparison of Rainy Day Fund Balances and Rainy Day Fund Balancesas a Percent of Expenditures for Triple AAA Rated States*
Rainy Day Fund Balances($ in millions)
Rainy Day Fund Balances(Percent of Expenditures)
FY 2016 FY 2017 FY 2018 FY 2016 FY 2017 FY 2018Delaware 215 221 232 5.5 5.4 5.6Georgia 2,033 N/A N/A 9.3 N/A N/AIndiana 1,468 1,474 1,434 9.8 9.5 9.2Iowa 729 605 624 10.1 8.3 8.6Maryland 832 832 859 5.0 4.8 5.0Missouri 291 294 304 3.2 3.2 3.3North Carolina
1,575 1,838 1,838 7.4 8.3 8.0
South Dakota 143 157 165 9.8 10.2 10.4
Tennessee 568 668 800 4.5 4.9 5.5Texas 9,715 10,297 10,457 18.0 19.2 19.1Utah 493 493 493 7.8 7.7 7.4Virginia 236 549 283 1.2 2.7 1.4Source: “The Fiscal Survey of States, Fall 2017”, National Association of State Budget Officials.*Hold AAA rating across all three rating agencies.

Economic Dependency
• Virginia is significantly dependent on federal activities.– Number 1 recipient of federal defense dollars.
• Virginia depends on two revenue sources for approximately 88% of its general fund dollars.– Net individual income tax (70%)– Sales tax (18%)
• Cash reserves are at historic lows.
23

Constitution of VirginiaArticle X. Taxation and Finance
Section 8. Limit of tax or revenue; Revenue Stabilization Fund.
24
No other or greater amount of tax or revenues shall, at any time, be levied than may be required for the necessary expenses of the government, or to pay the indebtedness of the Commonwealth.
The General Assembly shall establish the Revenue Stabilization Fund. The Fund shall consist of an amount not to exceed fifteen percent of the Commonwealth's average annual tax revenues derived from taxes on income and retail sales as certified by the Auditor of Public Accounts for the three fiscal years immediately preceding. The Auditor of Public Accounts shall compute the fifteen percent limitation of such fund annually and report to the General Assembly not later than the first day of December."Certified tax revenues" means the Commonwealth's annual tax revenues derived from taxes on income and retail sales as certified by the Auditor of Public Accounts.
The General Assembly shall make deposits to the Fund to equal at least fifty percent of the product of the certified tax revenues collected in the most recently ended fiscal year times the difference between the annual percentage increase in the certified tax revenues collected for the most recently ended fiscal year and the average annual percentage increase in the certified tax revenues collected in the six fiscal years immediately preceding the most recently ended fiscal year. However, growth in certified tax revenues, which is the result of either increases in tax rates on income or retail sales or the repeal of exemptions therefrom, may be excluded, in whole or in part, from the computation immediately preceding for a period of time not to exceed six calendaryears from the calendar year in which such tax rate increase or exemption repeal was effective. Additional appropriations may be made at any time so long as the fifteen percent limitation established herein is not exceeded. All interest earned on the Fund shall be part thereof; however, if the Fund's balance exceeds the limitation, the amount in excess of the limitation shall be paid into the general fund after appropriation by the General Assembly.
The General Assembly may appropriate an amount for transfer from the Fund to compensate for no more than one-half of the difference between the total general fund revenues appropriated and a revised general fund revenue forecast presented to the General Assembly prior to or during a subsequent regular or special legislative session. However, no transfer shall be made unless the general fund revenues appropriated exceed such revised general fund revenue forecast by more than two percent of certified tax revenues collected in the most recently ended fiscal year. Furthermore, no appropriation or transfer from such fund in any fiscal year shall exceed more than one-half of the balance of the Revenue Stabilization Fund. The General Assembly may enact such laws as may be necessary and appropriate to implement the Fund.
– The amendment ratified November 3, 1992 and effective January 1, 1993 -- Added the second, third, and fourth paragraphs.– The amendment ratified November 2, 2010, and effective January 1, 2011 – In the heading of the section, after "revenue",added "; Revenue
Stabilization Fund". In paragraph two, deleted "ten" and added "fifteen" after "exceed" and after "compute the". In paragraph three, after "as the", deleted "ten" and added "fifteen" in the third sentence.

Revenue Stabilization Fund ActivityFiscal Years 1995 - 2018
(Dollars in millions)
Fiscal YearBeginning Balance
Appropriation(Mandatory
Deposit)
Appropriation(Additional Deposit)
Withdrawal to General Fund
Interest Earnings
Amount over RSF Maximum reverted to GF
Ending Balance
RSF Constitutional
Maximum Value - based on 3-year average
Has Balance Reached
Maximum?
Balance as a Percent of
Fund Maximum
Balance as a Percent of Annual Certified
Revenues1995 0.0 79.9 0.0 0.0 0.2 0.0 80.1 533.6 NO 15.0% 1.3%1996 80.1 0.0 0.0 0.0 4.9 0.0 85.0 570.8 NO 14.9% 1.3%1997 85.0 66.6 0.0 0.0 5.0 0.0 156.6 605.0 NO 25.9% 2.2%1998 156.6 58.3 0.0 0.0 9.3 0.0 224.3 649.1 NO 34.5% 2.9%1999 224.3 123.8 0.0 0.0 13.4 0.0 361.5 706.3 NO 51.2% 4.2%2000 361.5 194.1 0.0 0.0 19.0 0.0 574.6 777.9 NO 73.9% 6.0%2001 574.6 103.3 0.0 0.0 37.6 0.0 715.6 864.9 NO 82.7% 7.3%2002 715.6 187.1 0.0 (467.7) 37.4 0.0 472.4 934.5 NO 50.6% 5.0%2003 472.4 0.0 0.0 (247.5) 22.6 0.0 247.5 963.0 NO 25.7% 2.6%2004 247.5 87.0 0.0 0.0 5.6 0.0 340.1 958.3 NO 35.5% 3.3%2005 340.1 0.0 134.5 0.0 7.7 0.0 482.3 977.8 NO 49.3% 4.0%2006 482.3 584.2 0.0 0.0 17.3 (19.1) 1,064.7 1,064.7 YES 100.0% 8.1%2007 1,064.7 0.0 106.7 0.0 52.7 (34.2) 1,189.8 1,189.8 YES 100.0% 8.5%2008 1,189.8 114.8 0.0 (351.5) 61.7 0.0 1,014.9 1,304.7 NO 77.8% 7.1%2009 1,014.9 21.3 0.0 (490.0) 28.9 0.0 575.1 1,377.7 NO 41.7% 4.3%2010 575.1 0.0 0.0 (295.1) 15.2 0.0 295.2 1,380.5 NO 21.4% 2.2%2011 295.2 0.0 0.0 0.0 4.2 0.0 299.4 1,354.4 NO 22.1% 2.1%2012 299.4 0.0 0.0 0.0 4.2 0.0 303.6 2,018.1 NO 15.0% 2.1%2013 303.6 132.7 0.0 0.0 3.7 0.0 440.0 2,095.2 NO 21.0% 2.8%2014 440.0 244.6 0.0 0.0 2.9 0.0 687.5 2,215.1 NO 31.0% 4.5%2015 687.5 243.2 0.0 (467.7) 4.7 0.0 467.7 2,287.7 NO 20.4% 2.8%2016 467.7 0.0 0.0 (235.5) 3.3 0.0 235.5 2,385.7 NO 9.9% 1.4%2017 235.5 605.6 0.0 (294.7) 2.4 0.0 548.8 2,456.5 NO 22.3% 3.1%2018 548.8 0.0 0.0 (272.5) 5.5 0.0 281.8 2,566.1 NO 11.0% 1.5%
1. Interest earnings and ending fund balance for FY 2018 are estimates.
2. From FY 1995 until 2010, the fund maximum cap was calculated as 10% of the average of total income and sales tax revenues for the past three years. A constitutional amendment approved by Virginia voters on November 2, 2010, became effective January 1, 2011, thus increasing the cap from 10% to 15% beginning FY 2012.
3. The fund balance exceeded the fund maximum twice (FY 2006 and 2007). The amount in excess of the fund maximum was reverted to the general fund. 25

Where will the Revenue Stabilization Fund be in FY 2018?(based on the current revenue forecast)
• The $218.8 million balance estimated for the end of FY 2018 will be only 11 percent of the constitutionally permitted balance of $2,566.1 million.
• 11 percent is the second lowest percentage of the fund maximum in the history of the RSF.
• The estimated FY 2018 balance is only 1.5 percent of Virginia’s annual certified revenues, which is only the fourth time in the RSF’s 24-year history that it has fallen below two percent.
• If actual collections exceed the revenue forecast, approximately one of every two dollars collected after the first $100 million will be required to be deposited to the RSF.
26

27
Section IVRecommendations
28
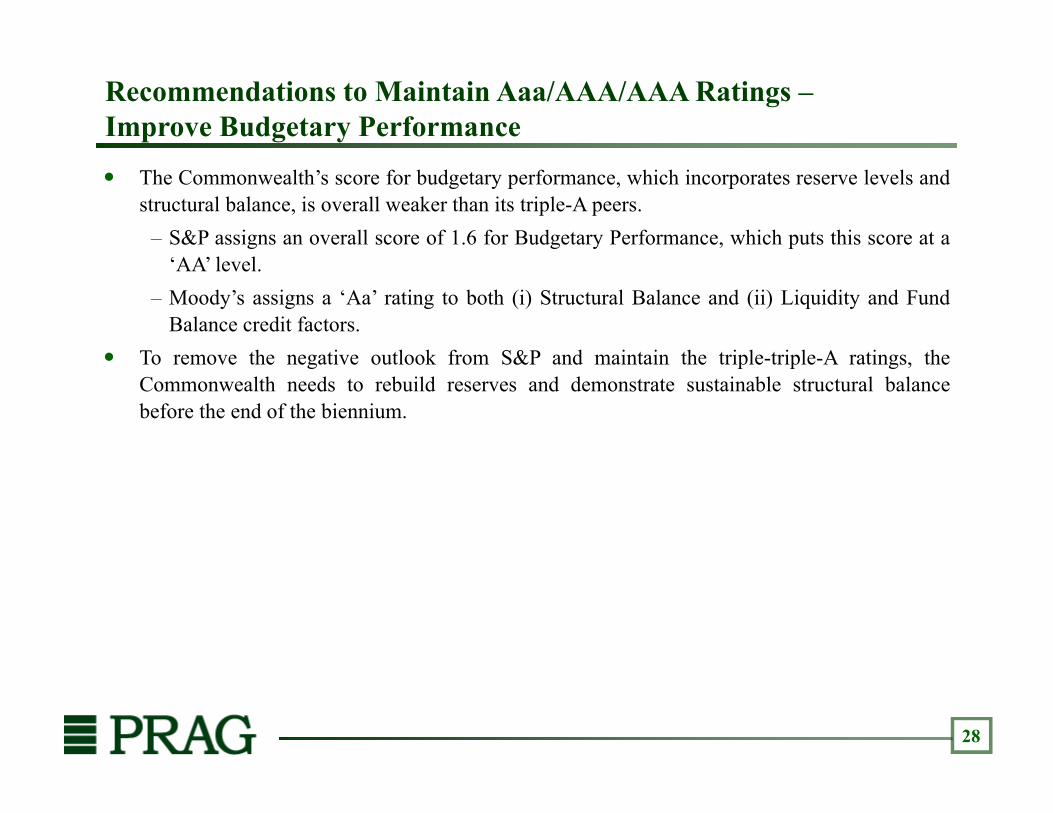
The Commonwealth’s score for budgetary performance, which incorporates reserve levels andstructural balance, is overall weaker than its triple-A peers.
– S&P assigns an overall score of 1.6 for Budgetary Performance, which puts this score at a‘AA’ level.
– Moody’s assigns a ‘Aa’ rating to both (i) Structural Balance and (ii) Liquidity and FundBalance credit factors.
To remove the negative outlook from S&P and maintain the triple-triple-A ratings, theCommonwealth needs to rebuild reserves and demonstrate sustainable structural balancebefore the end of the biennium.
Recommendations to Maintain Aaa/AAA/AAA Ratings –Improve Budgetary Performance

29
The Commonwealth reserves are comprised of balances in the Revenue Stabilization Fund andthe newly established Revenue Reserve Fund (together, the “Reserves”).
PRAG recommends that the Commonwealth adopt a plan to phase-in the rebuilding ofReserves relative to revenues or expenditures to a level of at least 8%.
– The Commonwealth currently anticipates ending fiscal year 2018 with $281.7 million in itsRevenue Stabilization Fund, or 1.39% of expenditures.
– At this level, PRAG estimates that S&P assigns the Commonwealth the lowest scoreamong the 14 states rated ‘AAA’ by S&P for the Budget Reserve rating factor.
– Moody’s also cites drawing down reserves to an inadequate level as a factor that could leadto a downgrade.
The Commonwealth’s new Revenue Reserve Fund is a step in the right direction.– Given the revenue surplus for 2017, the Commonwealth expects to deposit a minimum of
$156.4 million to the Revenue Reserve Fund, increasing the Reserves to about 2.2%.– With revenues exceeding estimates for 2018, the PRAG recommends that the
Commonwealth consider depositing 100% of the surplus into the Revenue Reserve Fund,potentially bringing Reserves closer to the 4% level.
– PRAG believes S&P will view additional funding of the Revenue Reserve Fund positively,as it mitigates the withdrawals from the Revenue Stabilization Fund.
Recommendations to Maintain Aaa/AAA/AAA Ratings – Improve Budgetary Performance by Rebuilding Reserves

30
PRAG recommends that the Commonwealth develop a plan to rebuild Reserves to a level at orabove 8%, which would bring the Commonwealth’s score in line with the median of the‘AAA’ rated states by S&P.
PRAG recommends that the Commonwealth initially establish target levels between 4% and8% in the short-term, which based on S&P criteria should gradually improve the BudgetReserve score, with the overall future target level above 8%.
Recommendations to Maintain Aaa/AAA/AAA Ratings – Improve Budgetary Performance by Rebuilding Reserves (Continued)

31
The Commonwealth needs to consistently demonstrate structural balance rather than relyingon one-time measures and draws on its Reserves to balance its budget.
With the revenue surplus in fiscal year 2017 and year-to-date revenues exceeding estimates infiscal year 2018, the pressure on the Commonwealth’s financial performance has eased.
However, with significant uncertainty on the Federal level and potential impact on the Virginiaeconomy, the Commonwealth should closely monitor economic trends and ensure that itsrevenue forecasts are in line with the latest trends and expenditures are adjusted accordingly toachieve structural balance.
Because the Commonwealth has not yet determined the full impact of the Tax Cuts and JobsAct of 2017, the Commonwealth should adopt a balanced budget based on currentassumptions.
The Commonwealth should limit the use of one-time measures to balance the budget.– The Commonwealth should refrain from continuing drawdowns of the Reserves, until the
combined Reserves can be maintained at a level that is consistent with its triple-A peers.– The Commonwealth should not reduce its funding of the actuarially determined
contribution to its pensions, as it did in the 2014-2016 biennium and which would alsohurt its debt and pensions scoring.
– The Commonwealth should refrain from budgeting mid-year salary increases in the secondyear of the biennium.
Recommendations to Maintain Aaa/AAA/AAA Ratings – Improve Budgetary Performance by Demonstrating Structural Balance

32
S&P assigns a weaker score to the Commonwealth’s Structural Budget Performance and if theCommonwealth does not demonstrate structural balance going forward, S&P will furtherweaken the score for Structural Budget Performance.
Based on the S&P methodology, an indicative credit score of 1.0 to 1.5 translates to a ‘AAA’rating, and S&P currently assigns an overall indicative credit score of 1.5 to theCommonwealth, which is the weakest point of the ‘AAA’ range.
– If the Structural Budget Performance score is assigned the weakest score, this wouldincrease the Commonwealth’s overall indicative credit score and translate to an indicativecredit level of ‘AA+’.
To improve its Structural Budget Performance, the Commonwealth would need to regularlyrecord surpluses in periods of positive economic growth and use surpluses to fund reservesand other non-recurring items.
The Commonwealth may want to consider adopting appropriation limits, where expendituresare limited to a certain percentage of budgeted revenues.
– Among its triple-A peers, Delaware has an appropriation limit of 98% and Iowa has anappropriation limit of 99% of revenues.
If the Commonwealth demonstrates a commitment to building its reserves and returning tostructural balance, PRAG believes S&P will change the outlook to stable and theCommonwealth will be able to maintain its triple-triple-A status.
Recommendations to Maintain Aaa/AAA/AAA Ratings – Improve Budgetary Performance by Demonstrating Structural Balance (Cont’d)

Fully Funding the Revenue Reserve at 2% of Operating Appropriations by End of FY 2020
Fiscal Year
Fiscal Year Operating
Appropriations before Revenue Cash Reserve
Annual Deposits
Cumulative Balance
% of Operating Appropriations
Fiscal Year Ending
Balance in Revenue
Stabilization Fund
% of Operating Appropriations
Fiscal Year Ending Balance in
Revenue Stabilization Fund
+ Revenue Reserve
% of Operating Appropriations
FY 2018 20,299,447,487 156,395,372 156,395,372 0.8% 281,784,246 1.4% 438,179,618 2.2%
FY 2019 20,821,213,958 50,000,000 206,395,372 1.0% 284,611,509 1.4% 491,006,881 2.4%
FY 2020 21,334,283,087 220,700,000 427,095,372 2.0% 287,457,624 1.3% 714,552,996 3.3%
8% of Annual Operating Expenses 1,706,742,647
Additional Funds Needed to Reach
8% of Annual Operating Expenses 992,189,651
33
Federal Tax ReformInterim Update
Background
• The Tax Cuts and Jobs Act of 2017 (TCJA) is the most substantial federal tax legislation since 1986.
• Certain provisions, such as rate and bracket changes, have no Virginia impact.
• Many provisions do have a Virginia impact.
34

Federal Tax ReformInterim Update
Background on Chainbridge
• Has been developing and delivering tax policy analysis tools for state government clients for nearly two decades.
• Eric Cook, PhD, revenue estimator at the U.S. Congressional Joint Committee on Taxation during federal tax reform efforts leading to the Tax Reform Act of 1986.
• Directed development of tax modeling projects for state government clients (Price Waterhouse and KPMG), left KPMG to form Chainbridge in 2000.
35

Federal Tax ReformInterim Update
Chainbridge: Approach
• Construct two microsimulation models (individual income tax and corporation income tax)
• For each individual, business or international provision:
– Determine the likely impact that the provision has on Virginia
– Determine whether an on-model (using the microsimulation models) or off-model approach would be employed
– Generate the revenue estimates and prepare a report presenting the results
36

Federal Tax ReformInterim Update
Chainbridge: Estimating Approach
• Different from economic forecasting model
• Database includes Virginia TY 2015 returns matched with federal returns for Virginia residents (as opposed to current Virginia Tax model with state data only), extrapolated to future years
• Allows tax to be recalculated for alternative scenarios using federal data and federal law (including indexing provisions), and to minimize combined Virginia and federal taxes
37

Federal Tax ReformInterim Update
Overall Impact
• The TCJA results in significant tax cuts for individuals and businesses at the federal level.
• Offset by increases in individual and business taxes for the Commonwealth.
38

Federal Tax ReformInterim Update
Impact on the Decision to Either Itemize or Take the Standard Deduction
Itemized Deduction Standard Deduction NumberVirginia Number of Returns Number of Returns Switching from
Adjusted Gross Income (Prior Law) (New Law) (Prior Law) (New Law) Itemized to Standard
< 0 25,000 232,957 77,651 893,850 1,049,156 155,306
25,000 50,000 172,199 94,442 620,794 698,551 77,757
50,000 75,000 209,331 127,340 289,086 371,077 81,991
75,000 100,000 204,205 125,902 151,932 230,235 78,303
100,000 125,000 182,734 105,273 71,134 148,595 77,461
125,000 150,000 143,671 89,384 27,874 82,160 54,286
150,000 175,000 106,783 71,504 12,158 47,438 35,280
175,000 200,000 77,565 54,641 5,782 28,705 22,923
200,000 250,000 100,557 73,970 4,218 30,805 26,587
250,000 500,000 120,865 93,769 1,549 28,646 27,097
500,000 1,000,000 25,235 21,024 350 4,561 4,211
1,000,000 > 1,000,000 10,533 9,468 275 1,340 1,065
TOTALS 1,586,635 944,368 2,079,002 2,721,269 642,267
39