ecological aspects of climate patterns within the …1979; de lisle and k err,1963). the relative...
TRANSCRIPT

G. T. JANE AND T. G. A. GREEN1. New Zealand Forest Service, P.O. Box 25-022, Christchurch, New Zealand.2. University of Waikato, Private Bag, Hamilton, New Zealand.
183
ECOLOGICAL ASPECTS OF CLIMATE PATTERNS WITHIN THEKAIMAI RANGES, NORTH ISLAND, NEW ZEALANDSummary: Meteorological data from stations around and within the Kaimai Ranges and data fromtemporary sites are used to characterise the climate of the ranges. Lowland climate is warm temperate withample rainfall but the upland region is cooler, wetter and frequently enveloped in fog. Frequent fog plays animportant part in the climate of upland regions. By modifying light, moisture and temperature regimes fogmay be a significant determinant of plant associations and may severely restrict growth. The absence of fogduring prolonged drought may accentuate plant water stresses and appears to playa significant role in theoccurrence and location of forest mortality.
Keywords: Climate; rainfall, temperature; fog; drought; forest ecology; Kaimai Ranges; New Zealand.
Introduction
Recent studies of vegetation mortality in theKaimai Ranges have suggested that climaticfactors, especially waterlogging and drought, playa significant role in the initiation of periods ofmortality (Green and Jane, 1984; Jane and Green,1983a). It has also been suggested that, as aresult of vegetation mortality, reduced forestcover and weakened root systems, there has beenincreased susceptibility to landslides in severestorms (Jane and Green, 1983b).Drought stress is known to cause localised
mortality on sensitive sites (Coulter, 1966;Finkelstein, 1971; Atkinson and Greenwood,1972; Ashton, 1976) and may place a wide rangeof species at risk to disease (Peace, 1960;Schoenewiss, 1975; Tobiessen and Buchsbaum,1976). Yet it is difficult to envisage droughtdamage initiating the mortality in the KaimaiRanges, an area of high rainfall. Soils, however,are shallow and frequently saturated, thusrestricting root systems. Consequently factorssuch as soil flooding, waterlogging and gleyingplay an important part in plant development andthe onset of disease symptoms through modifyingthe physiological responses of the plants (Greenand Jane, 1983a, b). The end result is that dryspells readily place the plants under water stressand initiate the periods of mortality (Jane andGreen, 1983a).The spatial distribution of vegetation mortality
appears to be related to climatic discontinuityproduced by the prevalent fog and low cloud onthe ranges and through effects on the hydrologicalregime (Jane and Green, 1983b). The persistentfog, through effects on soil and air temperaturesand light regimes may also have a significantimpact on plant growth under normal conditions.Accordingly, climate studies in the Kaimai
Ranges and analyses of data from local stationswere initiated to clarify these points. The two
main uses for the data were to provideenvironmental data for plant physiological studiesand to identify major climatic events which couldhave disrupted plant growth and hence inducedthe reported incidents of plant mortality.
Data Sources and Collection
The location of the main meteorological stationsaround the Kaimai Ranges and periods of recordare noted on Figure 1. Rainfall records at T eAroha began in 1889 and temperature recordsbegan on the same site in 1907. Between 1896and 1907 records are fragmentary but from 1908they can be regarded as continuous. Thecontinuity of the record was not significantlyaffected when the station was shifted a few metresin 1954 (Hessell, 1980). Site modification due tolocal clearance of forest and development of thetown is regarded as insignificant compared withchanges at urban meteorological stations such asAuckland and Christchurch (Tomlinson, 1976).Devereux (1910) began rainfall records at
Waihi in 1899. Temperature records began in1907 but many discontinuities and shifts instation location limit the value of the data. From1960 a number of climate stations wereestablished on the fringes of the forest, ataltitudes of up to 300 m (Fig. 1). These recently-established meteorological stations provide usefuldetail for establishing climatic patterns but are oflimited value for determining long-term trends. In1967 a meteorological station was establishedwithin the forest at the summit of Mt Te Aroha.For 1968, 1969 and 1971 the instruments wereread daily but in other years instruments wereonly read when clerical staff were present, fivedays a week or less. As a result, Monday readingsare the accumulated values for the previous threedays and there may be breaks in the recordextending over several weeks during holidays.
New Zealand Journal of Ecology 7: 183-197 © New Zealand Ecological Society
21

184 NEW ZEALAND JOURNAL OF ECOLOGY, VOL. 7, 1984
Figure 1: Location of meteorological stations aroundthe Kaimai Ranges; * indicates the approximatelocation of gauging stations. Dates are the establishmentand closing dates for rainfall records.
These inconsistencies place limitations on the useof the data, particularly the interpretation of dailyrecords.River gauging stations were established within
the Waihou River system at Karangahake in1956, at the mouth of the Waiorongomaihydrological representative basin in 1967, at T eAroha in 1969, and Shaftesbury in 1969 (Fig. 1).The base flows from these stations provide auseful indication of the long term effects ofrainfall trends on soil moisture storage levels.
Supplementary local dataStudy ridges were selected at three localities; TeAroha, Te Rere and Te Hunga, and instrumentsplaced at a range of altitudes (Table 1). The TeRere and Te Hunga ridges were traversed weeklyfrom September 1980 to April 1981, andfortnightly for the next year. Te Aroha sites werevisited monthly from October to April each year.
Table 1: Location of recording stations on the three studyridges. Instruments used were: T, min-max thermometers; P,Piche evaporimeter; R, rain gauges; S, soil temperatures;M, soil moisture samples. Summit height at Te Hunga was850m; Te Rere 750m (bush line 700m); and Te Aroha 950m.
Study Area
As far as was practical, instruments were placedadjacent to one another and successivemeasurements were made in the same place.In three study areas simple maximum-minimum
thermometers were set out without screensalthough each thermometer was nailed to thesouth side of large trees at 1.5 m height inpermanent deep shade. These were read at eachvisit. Continuous records were made, at selectedthermometer stations in rotation, using screenedthermocouple probes attached to Grantthermographs to calibrate and supplement datafrom the simple thermometers. Soil samples werecollected with a Dutch clay auger from 20 cm and50 cm depth at monthly intervals from Septemberto April for gravimetric soil moisturedetermination. Soil temperature at 20 cm depthwas recorded at each thermometer station at eachvisit. Rain gauges were placed in suitable openareas and read at each visit. Piche evaporimeterswere placed at a number of thermometer stationson Te Hunga from November 1981 to April 1982and read at irregular intervals.
Synoptic SituationsNew Zealand weather is largely influenced by theeasterly movement of frontal systems (De Lisle,1967; Maunder, 1970). In summer the weather ofthe Kaimai Ranges is dominated by southeasterlymovement of anticyclones from the north TasmanSea (tropical influences) and in winter by thenortheasterly movement of troughs to the south
Altitude Te Hunga T e Rere Te Aroha
300 TSMPR TSMR TSM400 TSM TSM500 TSMP TSMR TSM550 T600 TSMP TSM TSM650 TSMP TS700 TSM TSM750 TSMP R800 TSM TSM850 TSMPR900 SM

JANE AND GREEN: CLIMATE OF THE KAIMAI RANGES 185
of New Zealand (Garnier, 1958). Much of thelocal rain comes from a westerly quarter(Maunder, 1973) with the result that the east ofthe ranges are in a minor rain shadow. Lesscommon extreme events are also significant.The study areas are affected by two storm
patterns. Summer tropical cyclones, originating tothe north of New Zealand, characteristicallysweep southwards following the east coast ofNorth Island to Coromandel Peninsula, just northof the study areas, and then veer eastward outthrough East Cape bringing intense storms to theranges (Devereux, 1909; Barnett, 1938). Winterstorm fronts arising from the southeasterlymovement of low pressure troughs sweepnortheastwards along the central mountain chainof North Island to Mt Ruapehu and then swingeastward to East Cape and only occasionallycontinue northward to give cold rains or snow tothe Kaimai Ranges (Burrows and Greenland,1979; De Lisle and Kerr, 1963). The relativeimportance of these patterns is determined by thelocation of stable sub-tropical blockinganticyclones situated to the north of the Bay ofPlenty and can give long dry or wet periods (DeLisle and Kerr, 1963; Maunder, 1973;Tomlinson, 1980a). General changes in thecirculation patterns appear to be related to thequasi-biennial oscillation (Tomlinson, 1976) and,to a lesser extent, to sunspot activity (Seelye,1950; Salinger, 1979; Tomlinson, 1980b). Theformer produces short term changes and the latterlong period oscillations in weather patterns(Burrows and Greenland, 1979; De Lisle, 1961;De Lisle and Kerr, 1963; Tomlinson, 1980b).The effect of the winter and summer storm
patterns is to produce different weather patternsin the Waikato River basin, to the west of theranges, and in Bay of Plenty, to the east (DeLisle, 1967). For instance, coastal sea breezesmay moderate the climate of Bay of Plenty attimes when the barrier of the ranges leads toeither calm warm or frosty conditions inWaikato. As a result, the region is usuallyconsidered as part of two weather districts(Maunder, 1970; Salinger, 1979; Tomlinson,1981) and correlations between climaticparameters for T e Aroha and Waihi are poor(Table 2).
Fog and Low CloudLow cloud or fog along the crest of the KaimaiRanges is very frequent (Martin, 1889; Clay ton

186 NEW ZEALAND JOURNAL OF ECOLOGY, VOL. 7, 1984
Table 3: Percentage of days clear, or with cloud cover on thesummit in each of the three study areas. Based on 2-hourlyobservations from September 1981 to April 1982.
Full Half 4 2 ClearTe Hunga day day hours hours dayTe Hunga 28.6 57.6 73.3 79.0 21.0T e Rere 26.6 55.3 65.3 73.3 26.7Te Aroha 25.3 51.0 58.6 70.0 30.0
Greene, 1976). Records kept at Mt Te Arohoaduring 1969-72 indicate an average of 200 fogdays per year at 9 am. Observations made duringthe wet summer, 1980-1981, showed that fogcommonly persisted for much of the day (Table3). Average figures indicate that the cloud basewas at a differing altitude but at about 150 mbelow the summit in each of the study areas (Janeand Green, 1983b). There was considerablevariation in the cloud base with season, weatherconditions, time of the day, and the mechanismof fog formation.
Mechanisms of fog formationFog formation on the Kaimai Ranges normallyoccurs through thermal inversions or air pressureanomalies similar to those described by Coulter(1967). The exact mechanism depends on weatherconditions, and the fog duration is of ecologicalsignificance:1. air ponding under calm conditions can produce
lowland fogs in winter: At Te Aroha town,over the period 1926-1978, there was anaverage of 7.7 fog days per month duringwinter (June-August), and 2.1, 1.6 and 7.2days per month during spring, summer andautumn respectively. Such fog rarely extendsabove 300 m altitude although on severalfrosty occasions in winter the Waikato basinfilled to the height of the lowest points on therange (550 m). These fogs rise slowly and, ifstrong thermal inversions are present, mayleave the crest of the range in calm, clear,warm conditions possibly placing plants thereunder extreme water stress (Green and Jane,1983b).
High soil moisture content, producing highlocal humidities, may also favour this form offog formation particularly in calm conditionsfollowing rain but the fog is usually transient.During the early part of the dry 1981/82summer, fog was often present in the lowlands
in the morning, rose to arrive at the range crestin the late morning and clear about three hourslater thus blocking the full heat of the middaysun. After six weeks with little rain, in January1981, the fog became restricted to only a fewhours in the morning or was absent altogetheras lowland soils dried out.
2. Trapped adiabatic air flows, resulting fromnormal air flows over mountains, causing eddycurrents in the lee of the ranges (Tricker,1970), produce a uniform cloud baseparticularly after rain. These fogs are of shortduration and have little ecological impact.
3. Pressure reductions arising from the flow ofhigh speed winds over the mountains producecapping fogs of variable height usuallyaccompanied by strong winds (Grace, 1977).The barrier of the ranges is known to modifythe dominant westerly surface air tides(Trenberth, 1977a) and fog in these conditionsappears to be related to incoming low pressureor frontal systems when rain is imminent.Cloud base levels are highest on Mt Te Aroha,often capping only the summit, and lowest atT e Rere. When this form of fog occurs thecloud level rises rapidly to cap only the top100 m of the range by mid-morning and mayclear briefly in mid-afternoon. The high windsthat frequently accompany the fog are a well-known local phenomenon and were observedby the authors to cause down-draughtingeasterly winds that reached gale force in astanding wave 0.5-3 km from the western footof the ranges. Temperatures are often low andsince the fog may persist for several daysconditions may be very unfavourable for plantgrowth.
4. Orographic cloud, directly associated withfrontal rain, that results from the normal raincloud conditions. At times of heavy rain thecloud base is as low as 300 m altitude alongthe whole western side of the range but withlight rain the cloud base may form a line at800 m. These fogs are of short duration andlittle adverse ecological impact.
PrecipitationMean annual rainfall increases eastward from1500 mm at Te Aroha to 2000 mm at Waihi andsouthwards from 1500 mm at Te Aroha to2500 mm at Shaftesbury at the base of the TeRere study area (Coulter and Hessell, 1980). Italso increases with altitude from 1500 mm at Te

JANE AND GREEN: CLIMATE OF THE KAIMAI RANGES 187
Aroha town to 2000 mm at the summit of Mt T eAroha and field observations suggest an increaseof 60% at other points to give about 3000 mmper annum at Te Rere and Te Hunga summits.During periods in which tropical influences
predominate the effects of the quasi-biennialoscillation may be strengthened and very highrainfalls occurring in one year may be followed bya year of very low summer rainfall (Burrows andGreenland, 1979; Maunder, 1969; Seelye, 1950;Tomlinson, 1976, 1980). Summer rainfall forWaihi (Fig. 2) shows this strongly oscillatingpattern. Similar fluctuations are absent at TeAroha possibly because that side of the rangesreceives more rain from predominant stablewesterly conditions (De Lisle, 1967). Rainfallrecords from Te Aroha show a long term trend ofincreasing rainfall and decreasing annualvariability (Fig. 3), similar to that generally notedfor northern regions of New Zealand (Trenberth,1977b; Vines and Tomlinson, 1980) and resultingfrom changes in circulation pattern about 1954 asnoted by Trenberth (1976). These changes appearto have resulted in a lower occurrence of tropicalstorms and a predominence of less severe stormsof southern origins in more recent years (Burrowsand Greenland, 1979; Trenberth, 1976).Snowfalls occur about every second year but
Figure 2: Trends in summer (January and February)rainfall at Waihi: A strong oscillating quasi-biennualtrend suggesting influences of summer storms and along period oscillation peaking in 1939 and 1969.
Figure 3: Trends in Te Aroha total rainfall shown bysmoothing splines (Schlicht, 1981), with alpha = 1,alpha = 100 and alpha = 1000. Trends indicate ageneral increase in rainfall to about 1960 and asubsequent decline. The period of higher averagerainfall (1950-60) is characterised by lower variability.

188 NEWZEALAND JOURNAL OF ECOLOGY, VOL. 7, 1984
melt rapidly and contribute little to totalprecipitation. The heaviest known falls occurredin 1918 and 1980 and extended down to Waihiand Te Aroha. These falls lay for several days atupper altitudes.Fog and accompanying light drizzle probably
add considerably to annual precipitation ataltitudes above 500 m. Overseas studies haveindicated that fog in forested areas can contributeover 300 mm to annual precipitation (Kerfoot,1967; Chaney, 1981) and examination of therainfall records for days on which the fogpersisted at Te Aroha summit indicate up to2 mm per day are trapped in a normal rain gauge.Evapotranspiration is also affected by fogoccurrence. Piche evaporimeters placed at TeHunga show little difference in evaporation withaltitude over periods of wet weather but a markedreduction in evaporation is apparent above 650 mduring extended periods of foggy weather (Janeand Green, 1984). Similarly soil moisturecontents show a distinctive discontinuity abovethe cloud base (Green and Jane, 1983a) reflectingthe decreased evapotranspiration and increasedprecipitation resulting from the persistent fog.
DroughtDrought intensity can be measured in a number
of ways. A commonly used measure of droughtintensity is the number of days without rain orlength of period with less than 5 mm precipitation(Coulter, 1966; Kidson, 1930; Maunder, 1973).Waihi recorded 38 days without rain in 1908 and31 days in 1928 (Table 4) and the longest periodwithout rain at Te Aroha was 27 days in 1957(Maunder, 1973). None of these periods wereregarded as significant or severe droughts in theKaimai Ranges (Bondy, 1950). There were anumber of other periods of below normal rainfallthroughout New Zealand but their effects appearto have been localised. Finkelstein (1971)compared the severity of the 1969/70 droughtwith that of 1908 and noted the localisedcharacter of these and the 1928 and 1946droughts. Droughts reported for Waikato or Bayof Plenty, in decreasing order of severity,occurred in 1913/14, 1918/9, 1945/46, 1953/4,1908,1927/8,1969/70, and 1957 (Bondy,1950; Kidson, 1930; Finkelstein, 1971; Coulter,1969).'Days without rain' may not be a reliable
indicator of drought severity because the dryperiods may not occur at times of highevaporative losses or high levels of soil waterdepletion. Values of tank evaporation forRuakura (in central Waikato) are probablyapplicable to the local lowland area, and indicate
Table 4:Major droughts and dry years at Te Aroha and Waihi. The figures are the recorded rainfall for January and Februarycombined, and the total recorded for the year. (1. December 1927 was also dry with 26.9mm; 2. Drought extended 38 daysinto March (30.5mm))
Rainfall (mm)
Te Aroha Waihi
Drought year January / February Total January/February Total
1889 no data 1,413 no data no data1890 81.5 1,628 no data no data1900 64.0 not avail. 90.7 2,4181908 2.0 2,248 45.7 2,2481914 66.3 812 no data no data1915 92.7 1,428 no data no data1919 69.3 917 no data no data1925 89.9 1,320 no data no data1928' 56.9 1,956 96.3 3,2341939' 37.1 1,300 126.2 2,1841946 29.0 1,582 27.3 2,3581950 46.5 1,128 43.2 1,7931954 39.6 1,844 76.2 2,0311970 63.8 1,432 95.0 2,0831982 235.7 1,089Normals 192.7 1,498 246.9 2,163

JANE AND GREEN: CLIMATE OF THE KAIMAI RANGES 189
that net losses are about 1100 mm per annum(Maunder, 1973). Rainfall fell below tankevaporation in only four years, 1914, 1919, 1942and 1982, when rainfalls were 891 mm, 994 mm,993 mm, and 1089 mm respectively. The period1913-15, as well as containing the summerdrought of 1913/14, had less than 50% of thenormal rainfall. Then 1917, a wet year, wasfollowed by 1919 again containing low rainfallsand summer drought. Between 1940 and 1950there were several years of low rainfall and in afour-month period from December 1945 only82 mm rain was recorded. This resulted in severedrought conditions on local farms (Te ArohaNews 2/3/46). Bondy (1950) and Maunder(1973) do not mention the area specifically butthe Kaimai Ranges could be included in the partsof Auckland province affected by the 1939 and1946 droughts. Between 1928 and 1934 therewere several dry years but rainfall average for theperiod was near normal and as a result theseyears were possibly of minor ecologicalsignificance.Lowland information is difficult to apply to the
upland forests because of limited data, the impactof fog on evaporative losses, lower temperatures,higher rainfall and greater wind runs. However,the same extreme years are likely to havesignificant effects on plant growth. Someindication of the importance of these dry yearscan be seen in the marked decline in soil moisturecontent noted within the Kaimai Ranges during1980-82, a period of very low rainfall anddecline in the extent of waterlogging between1980 and 1983 in the absence of a recogniseddrought (Jane and Green, 1983b). The dry yearobviously had a severe impact on aquifer storagewithin the ranges which was sustained over morethan the one year.Some assessment of the significance of these
long term deficits on soil water storage levels canbe obtained from examining the flow data for theWaihou River system. There is a linearrelationship between summer rainfall andminimum flows in successive years (Fig. 4) but attwo points, 1969 and 1976, it is displaced to givea rhomboid shape (for the years 1969-75correlations and regression coefficients are:r=0.75, a=237, b=0.21 and for other yearsr = 0.86, a = 153, b = 0.35) implying that thedisplacement may result from changes in aquiferstorage. One interpretation of the diagram is thatwinter rainfall following the 1969/70 droughtwas insufficient to recharge the aquifer, a
situation which persisted until 1975 when twowet years may have resulted in full recharge.Obviously, a mild drought occurring when theaquifers were depleted could have a more severeimpact on river flows than a longer droughtoccurring when soil recharge levels were high.No similar data are available for the earlier
droughts but it is evident that those of 1914,1919 and 1946 occurring during or at the end ofa series of dry years will be more damaging toplant growth than others in periods of normalrainfall such as 1928 and 1969/70.
Figure 4: Trends in river summer base flow at TeAroha Bridge in relation to summer rainfall (January,February and March) at Te Aroha. Discontinuities inthe relationship follow the dry 1969/70 summer andthe wet 1975 and 1976 winter.
Lowland TemperaturesMean annual temperature at Te Aroha is 14.5 ºCbut on the coastal side of the range at Waihi it is13.7 ºC. At both stations the diurnal range isapproximately 9 ºC, typical of most coastal areasof New Zealand (Coulter, 1973; Cox, 1968).There are no general trends in the recorded meantemperatures but maximum and minimumtemperatures are now less. extreme (Hessell,1980). Such changes could have been broughtabout as a consequence of the extensive forestclearance and swamp drainage in the area, in areverse manner to that suggested by Hessell(1980) for urban areas; however, it appears morelikely to be linked with changes in annual rainfall(Goulter and Hurnard,.1980).Ground frosts occur principally between April
and September although there is a large year toyear variability (Fig. 5). Ground frosts at TeAroha have declined from over 30 per annum to

190 NEW ZEALAND JOURNAL OF ECOLOGY, VOL. 7, 1984
only 10 per annum over the last 70 years with asimilar decline since records began at Waihi, in1930 (Fig. 5). Unseasonal frosts are rare butsummer frosts were recorded in 1913 and 1914.The cold winters at Te Aroha, with monthlyaverage temperatures below 2 ºC, occurred in1914, 1918, 1942 and 1945. The period 1914 to1919 was marked by particularly low wintertemperatures and the periods 1942-45 and1969-72 contained a series of cold winters. Highmaximum temperatures often occurred in thesame years. It is striking that these years coincidewith the years of extended rainfall deficit andsuggests that clear skies were then moreprevalent. On the other hand, the significantcorrelation between maximum temperatures andtotal rainfall reflects a more general trend forwarm years at Te Aroha to occur in yearsdominated by tropical influences in which one ortwo severe storms occurred (Table 2).
Upland TemperaturesBetween 1967 and 1977 Mt Te Aroha stationrecorded extreme maximum daily temperatures ofup to 17.6 ºC and similar values were found atthe uppermost study sites (Fig. 6). Lack ofcontinuous recent data at Mt T e Aroha does notpermit direct comparison. Diurnal temperature
Figure 5: Annual ground frost numbers at Te Arohaand Waihi. A marked long-term decline in number isevident although numbers are high at Te Aroha in thedry 1943-1946 and 1970-1972 periods.
range at the summit is lower than at Te Arohatown because of cloud influences. This wasparticularly well demonstrated by a thermographrecord at 600 m altitude on T e Hunga during oneextended fog period of 17 days. A mean diurnalvariation of only 2.5 ºC was recorded and valuesfor individual days were as low as 1.25 ºC. Thetemperature range over the 17 days was 6.0 ºC.In this period temperatures were governed byincoming frontal systems rather than diurnalvariations in incident radiation (Fig. 7). Briefsunshine periods of less than half an hour recordon the 6th, 17th and 21st days resulted intransient temperature peaks and an arithmeticmean temperature which lay below the median ofdaily values. The transient values indicated theextent of depression of temperatures below thevalues expected in the absence of fog (Fig. 7). Onoccasion, during a series of physiologicalexperiments, clearance of fog from Te Hunga wasobserved to result in a rise in temperature from11 ºC to 19º C and a decline in relative humidityfrom 89% to 50% in less than an hour. Wintertemperatures at Mt Te Aroha averaged 4.2 ºC butscreen frosts were not common. In 1968 therewere just over three times as many frosts as at the
Figure 6: Seasonal variation in actual air temperaturesat Te Hunga measured between 8 am and 10 am,ascending by altitude. Almost identical values wereobtained at Te Rere. Records began in October 1980and terminated in March 1982. Observations weremade at weekly intervals from October 1980 to April1981 and fortnightly thereafter.

JANE AND GREEN: CLIMATE OF THE KAIMAI RANGES 191
town (37 cf. 11) but in wet years, such as 1968,numbers were similar between base and summitof the mountain.
Lapse RatesA uniform lapse rate is often assumed forestimating temperatures at altitudes different froma recording station. In the study areas thisassumption was not valid because the lapse ratevaried with season, altitude and presence of fog.On Mt Te Aroha lapse rate of the mean dailymaximum temperature between the town andsummit is uniform through the season whereasthat for mean daily minimum temperatures islowest in winter, down to 0.4 oC/100 m (Fig. 8)perhaps resulting from more intense air pondingand still air at lower altitudes as opposed towinds at the range crest. Similar values andseasonal variability were noted by Coulter (1967)for the Black Birch Range.At Te Hunga lapse rates show a small
depression just below the fog zone, at between500 m and 700 m from 1 ºC/100 m to less than0.3ºC/100 m altitude and there is anaccompanying depression in the diurnal range(Fig. 8). Temperatures below 500 m often differconsiderably from those at higher altitudes wherethey are frequently uniform. The difference is
Figure 7: Daily mean temperatures calculated from halfhourly temperature records on a Grant Thermographmade at 600 m on Te Hunga during a period of cloudyweather from 15th November to 16th December 1980.
greater in winter from the 35th to 60th visits(June to September, Fig. 9). On a number ofoccasions a thermal inversion was present at600 m resulting in temperatures of 1-2 ºC higheron the summit plateau. These could be
Figure 8: Lapse rates. (a) Seasonal varition in lapserates in minimum and maximum temperatures betweenTe Aroha Town (30 m) and the Mountain summit(950 m) for 1967-1977. (b) Air temperatures byaltitude at Te Hunga calculated by subtractingtemperatures at 500 m from the respective temperaturesat other altitudes and adding 2. This shows the smalldifference in temperature at middle altitudes about thecloud base and the depressed diurnal range.

192 NEW ZEALAND JOURNAL OF ECOLOGY, VOL. 7, 1984
responsible for the observed zonation of thevegetation (Jane and Green, 1984).Lapse rates for mountain areas often differ
considerably from free air values above arecording station. Garnier (1958) gives valuesranging from 0.27 to 0.80 oC/100 m altitudewith values of about 0.6ºC/l00 m generallyapplying to upland mountain area above 700 m.Values for specific studies range0.4-0.6ºC/100 m (Coulter, 1967) and manystudies of mountain areas have shown a similarthermal belt or zone of low lapse rates extendingover several hundred metres altitude (Geiger,1965; Hayes, 1941; Morris, 1965). Examinationof lapse rates for several paired stations inmountain areas suggests that thermal belts are ofcommon occurrence in New Zealand and relatedto areas of high fog incidence. Sites such asWharakite peak and Te Aroha with high fogfrequencies have low lapse rates and a smalldirunal temperature range while stations such asEgmont Mountain House, with fewer fog days,have a higher lapse rate and diurnal temperaturerange close to that at adjacent lowland stations(Table 5). In drier areas such as the Old ManRange a steep lapse rate has been recorded(Mark, 1965). Mean temperatures and diurnalrange at Mt Egmont, a fog free area, is
comparable to Invercargill and other coastalstations in the south of South Island, but becauseof fog and inhomogeneity in lapse rates,comparisons for foggy areas such as between T eAroha town and summit or Ohakea/Wharakitecan be misleading.
Growing SeasonThe growing season at Te Aroha town extendsfrom September to May and there are 1727degree days above 10 ºC (New ZealandMeteorological Service, 1978). For Te Arohasummit insufficient temperature data andincomplete records do not permit reliablecalculation of degree day totals but the observedgrowing season extends from December to March(Jane, 1983). Taking Invercargill, a station withsimilar mean monthly temperatures and diurnaltemperature range as a guide, there are only 514degree days at the summit. Similar values arefound in dry mountain areas such as Mt St John(438 degree-days) or the Heritage (507 degree-days). These figures are liable to be reducedconsiderably by the effects of fog, as indicated bythe Chateau which has only 250 degree-days.Data for the wet 1968/69 summer suggests thatin this summer there were less than 120 degree-
Figure 9: Seasonal air temperatures differences at Te Hunga calculated by subtracting temperatures at 300 m fromthe respective temperatures at higher altitudes. Left hand side: below 650 m Right hand side: above 650 m.Temperatures above 500 m were usually closely similar whilst 400 m and 300 m temperatures were one and twodegrees lower respectively.
JANE AND GREEN: CLIMATE OF THE KAIMAI RANGES 193
Table 5: Mean temperature, mean daily range, and lapse rates for selected pairs of adjacent uplands and lowlandsmeteorological stations in coastal situations and data for two other comparable meteorological stations.
Temperature
Altitude Mean daily Mean daily range Lapse rate Days ofStation (m) ºC ºC ºC/100m fog
Te Aroha 30 15.4 8.7 0.60 20Mt. Te Aroha 950 9.3 5.3 200Ohakea 48 13.2 8.7 0.66Wharakite 914 7.3 5.9 173New Plymouth 97 13.6 9.3 1.0Mt. Egmont Mountain house 846 8.9 8.7 51Invercargill 20 9.6 9.4Milford 0 10.3 8.0
days. Data from O'Rourke and Terjung (1981)indicates that fog reduces net photosynthesis by75% without taking into account temperatureeffects. Hence the fog zone is liable to be a verydifficult climate for plant growth.
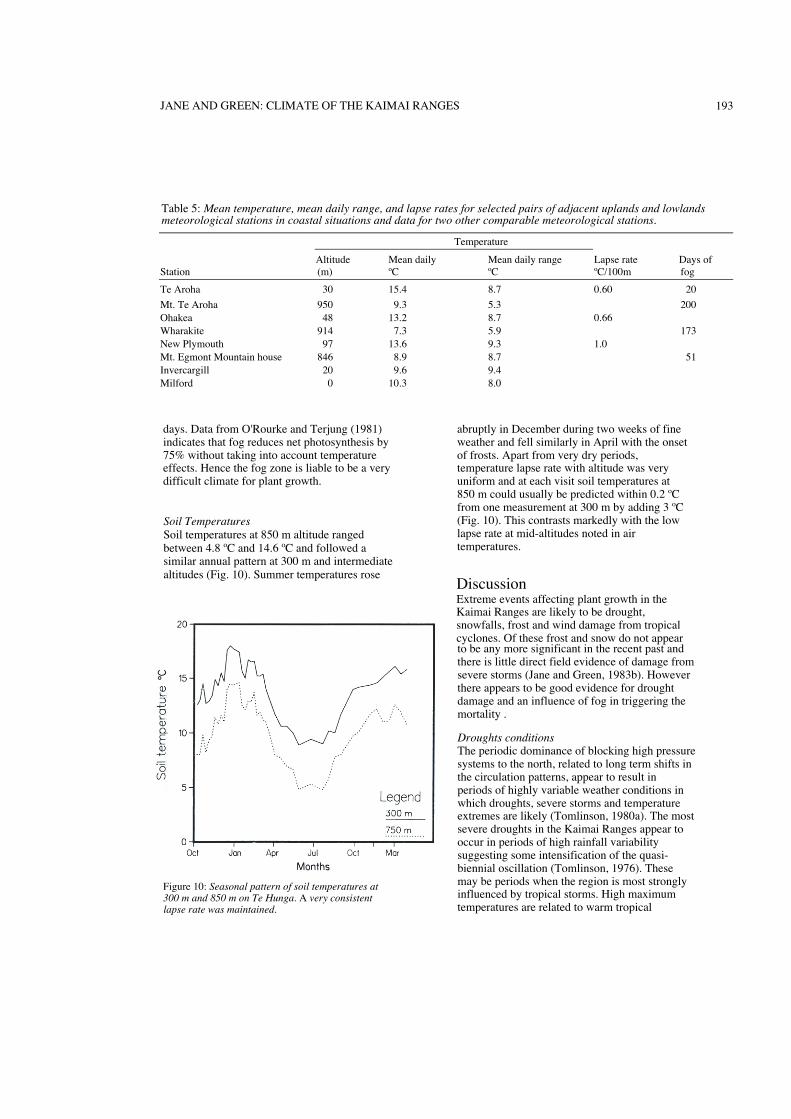
Soil TemperaturesSoil temperatures at 850 m altitude rangedbetween 4.8 ºC and 14.6 ºC and followed asimilar annual pattern at 300 m and intermediatealtitudes (Fig. 10). Summer temperatures rose
Figure 10: Seasonal pattern of soil temperatures at300 m and 850 m on Te Hunga. A very consistentlapse rate was maintained.
abruptly in December during two weeks of fineweather and fell similarly in April with the onsetof frosts. Apart from very dry periods,temperature lapse rate with altitude was veryuniform and at each visit soil temperatures at850 m could usually be predicted within 0.2 ºCfrom one measurement at 300 m by adding 3 ºC(Fig. 10). This contrasts markedly with the lowlapse rate at mid-altitudes noted in airtemperatures.
DiscussionExtreme events affecting plant growth in theKaimai Ranges are likely to be drought,snowfalls, frost and wind damage from tropicalcyclones. Of these frost and snow do not appearto be any more significant in the recent past andthere is little direct field evidence of damage fromsevere storms (Jane and Green, 1983b). Howeverthere appears to be good evidence for droughtdamage and an influence of fog in triggering themortality .
Droughts conditionsThe periodic dominance of blocking high pressuresystems to the north, related to long term shifts inthe circulation patterns, appear to result inperiods of highly variable weather conditions inwhich droughts, severe storms and temperatureextremes are likely (Tomlinson, 1980a). The mostsevere droughts in the Kaimai Ranges appear tooccur in periods of high rainfall variabilitysuggesting some intensification of the quasi-biennial oscillation (Tomlinson, 1976). Thesemay be periods when the region is most stronglyinfluenced by tropical storms. High maximumtemperatures are related to warm tropical

194 NEW ZEALAND JOURNAL OF ECOLOGY, VOL. 7, 1984
conditions bringing rain to Te Aroha from intensecyclonic storms in January or February but thewinters may be dry. This is reflected in thesignificant positive correlation between Januaryrainfall and frost days at Te Aroha (Table 2). Inother years the storms may be less frequent, orabsent, and severe droughts may occur. Thisappears to have happened in the period 1913-20.The dry period appears to have terminated with achange in circulation pattern about 1918, asnoted by Burrows and Greenland (1979).
Reports written at the time of the 1914-20droughts were not readily able to assess severitysince the prior climatic records were short (Bates,1915, De Lisle, 1967) and population density waslight especially in the Waikato and Hauraki Plains(Tye, 1974; Vennel, Fitzgerald and Gordon,1951). In retrospect, these were the most severeever recorded in the area. Kidson (1930) stated"for the Auckland Province, 1914 wasundoubtedly the driest year hitherto recorded"and indicated that, in 1919, deficits of up to 30inches (760 mm) may have been present in theKaimai Ranges. The 1914 drought occurred inthe middle of a series of dry years a situationrepeated in 1919 suggesting tht the impact ofthese droughts must have been severe. In contrast,the 1928 drought occurred in a period of abovenormal rainfall and the 1939 and 1946 droughtsat the beginning and end, respectively, of thesame series of dry years. Of the last threedroughts only the one in 1946 was significant foragricultural crops. The 1969/70 droughtoccurred in a period of near normal rainfall andprovoked no local comment. Neither was 1972regarded as a severe drought.
Other factors also permit an assessment of thenature of the droughts. In 1908 day temperaturesover 27 °C, and night temperatures of 14 °C forJanuary and 12 °C for February indicate humidweather, described as sultry (Te Aroha News, Bayof Plenty Times), with frequent cloud. Incontrast, the summer of 1913-14 wascharacterised by both very hot days, over 27 °C,and very cool nights. The maxima and minimafor January are the most extreme on record andthose for December 1913 and February 1914 arealso unusually extreme. This extreme weathersuggests exceptionally dry soils and clear skieswith little fog. This situation appears to havecontinued for much of the year since the winter isthe coldest on record. Extreme conditionscontinued for the next five years with low rainfalland cold winters in 1915, 1916 and 1918. Similar
conditions appeared in 1928 but did not persist.From the various viewpoints expounded above
it should be clear that the period 1913-1920contained the most severe droughts recorded inthe region. A similar but far less severe periodoccurred between 1939 and 1948 and otherdroughts in 1928/30, 1934/5, 1956/7, and1969/70, although severe by some measures,were relatively unimportant. These datescorrespond well with suggested dates for recentmortality episodes within the ranges (Jane andGreen, 1983b).
Significance of fogFog has wide-ranging effects on climate andconsequently on plant growth. The fog types oflongest duration and most ecological significanceare related to prolonged periods of wetter weatherresulting in high soil moisture contents or frontalsystems associated with rain. As a result a veryconsiderable reduction in fog frequencies occursduring drought periods.
Fog modifies the hydrological regimes byincreasing precipitation and reducingevapotranspiration, leading to long-term soilflooding in the Kaimai Ranges. This results in aseverely restricted rooting zone for trees andshrubs and in some of the species to adaptation topermanent waterlogging (Jane, 1983). Fog alsolowers mean temperatures, delaying the springflush (Jane, 1983) and lowering potential carbonfixation. Reduced light exacerbates the growthdeficiencies and not only reduces the ability ofplants to respond to stresses but also results in anumber of shade tolerant shrubs assumingdominance (Jane, 1983).
On the other hand, in the prolonged absence offog, the shade-tolerant species are placed undersevere stress (Green and Jane, 1983a) and manyother plants with restricted root systems have alimited ability to respond to water stress (Greenand Jane, 1983b).
Summary of climatic conditions within the rangesThe lowland areas can be very adequatelydescribed from the current meteorological database as having a warm temperate climate, usuallyof adequate rainfall, but agricultural droughtsmay occur every 10-15 years. The climate ofupland areas, in which much of the currentecological investigations were carried out, cannotbe as well described. Extrapolation of lowlandvalues suffer from many difficulties. Rainfall isclearly much higher and evapotranspiration can

195JANE AND GREEN: CLIMATE OF THE KAIMAI RANGES
be considerably lower due to fog and lowertemperatures. The climatic gradient is not evenand there appears to be a sharp change at thecloud base at which there is a lowering of thetemperature gradient and an increase in soilmoisture to waterlogging levels (Jane and Green,1983b). There is considerable difficulty inextrapolating lowland drought severity to theupland areas and the higher rainfall suggests thatdrought impact would be slight. However,reduced fog incidence during drought may wellaccentuate soil water deficits and there is a strongprobability that plants in the cloud forests may beslow growing and unusually sensitive to smallclimatic perturbations (Jane and Green, 1983b).The high cloud frequencies markedly reduce lightlevels and consequently photosynthesis. Coolertemperatures will affect growth and frequent leafwerting may impede stomatal gas exchange. It isalso known that soil waterlogging, by restrictingroot systems to the upper soil horizons, places theplants at a higher risk during drought (Jane andGreen, 1983c; Kozlowski, 1982).
ReferencesAshton, D. A. 1976. The development of even aged
stands of Eucalyptus regnans F. Muall. in centralVictoria. Australian Journal of Botany 24:397-444.
Atkinson, I. A. E.; Greenwood, R. M. 1972. Effects ofthe 1969-70 drought on two remnants ofindigenous lowland forest in the Manawatudistrict. Proceedings of the New ZealandEcological Society 29: 34-42.
Barnett, M. A. F. 1938. The cyclonic storms innorthern New Zealand on the 2nd February and26th March 1936. Department of Scientific andIndustrial Research, Meteorological Office Note22, 34pp.
Bates, D. C. 1915. Rainfall in 1914. New ZealandJournal of Agriculture 10: 153-4.
Bondy, F. 1950. Droughts in New Zealand. NewZealand Journal of Science and Technology 32B(2): 7-10.
Burrows, C. J.; Greenland, D. E. 1979. An analysis ofevidence for climatic change in New Zealand inthe last thousand years: Evidence from diversenatural phenomena and from instrumental records.Journal of the Royal Society of New Zealand 9:321-73.
Chaney, W. R. 1981. Sources of water. In:Kozlowski, T. T. (Editor). Water deficits andplant growth. pp 1-49. Academic Press. NewYork.
Clayton-Greene, K. A. 1976 (unpublished). Vegetationof Mt Karioi and of forested areas of the Waikato,
North Island New Zealand. MSc thesis, Universityof Waikato.
Coulter, J. D. 1966. Dry spells as an ecological factorin plant ecology. Proceedings of the New ZealandEcological Society 13: 4-7.
Coulter, J. D. 1967. Mountain climate. Proceedings ofthe New Zealand Ecological Society 14: 40-56.
Coulter, J. D. 1969. On rainfall variations in NewZealand. New Zealand Meteorological Office,Technical Information Note 132, 17pp.
Coulter, J. D. 1973. Ecological aspects of climate. In:Williams, G. R. (Editor). The natural history ofNew Zealand. pp 28-60. A. H. and A. W. Reed,Wellington.
Coulter, J. D.; Hessell, J. D. 1980. Frequency of highintensity rainfalls in New Zealand. New ZealandMeteorological Service, Miscellaneous Publication162.
Cox, J. E. 1968. An evaluation of climate and itscorrelation with soil groups. New Zealand SoilBureau Bulletin 26: 33-44.
De Lisle, J. F. 1961. Filter analysis of New Zealandannual rainfall New Zealand Journal of Science 4:296-308.
De Lisle, J. F. 1967. Climate of the Waikato basin.Earth Science Journal. 1: 2-6.
De Lisle, J. F.; Kerr, I. S. 1963. The climate andweather of the Bay of Plenty region. New ZealandMeteorological Service, Miscellaneous Publication115, 12pp.
Devereux, H. B. 1909. The remarkable rainfall andmeteorology of Waihi. Transactions of the NewZealand Institute 42: 408-11.
Devereux, H. B. 1910. Report of the RoyalCommission on the silting up of the Waihou andOhinemuri rivers. Journal of the House ofRepresentatives of New Zealand. C-14, p288.
Finkelstein, J. 1971. The 1969-70 droughts in NewZealand. New Zealand Meteorological OfficeTechnical Note 204.
Garnier, B. J. 1958. The climate of New Zealand.Edward Arnold, London, 191pp.
Geiger, R. 1965. The climate near the ground. HarvardUniversity Press, 611pp.
Goulter, S. W.; Hurnard, S. M. 1979. Some aspects oftemperature variability over New Zealand.Proceedings of the Agronomy Society of NewZealand 9: 79-84.
Grace, J. 1977. Plant response to wind. AcademicPress. London, 200pp.
Green, T. G. A.; Jane, G. T. 1983a. Diurnal patternsof water potential in the evergreen cloud forests ofthe Kaimai Ranges, North Island, New ZealandNew Zealand Journal of Botany 21: 379-89.
Green, T. G. A.; Jane, G. T. 1983b. Changes inosmotic potential during bud break and leafdevelopment of Nothofagus menziesii,Weinmannia racemosa, Quintinia acutifolia andIxerba braxioides. New Zealand Journal of Botany21: 391-95.

196 NEW ZEALAND JOURNAL OF ECOLOGY, VOL. 7, 1984
Green, T. G. A.; Jane, G. T. 1984. Biotic influences onlandslide incidence in the Kaimai Ranges, NewZealand. New Zealand Journal of Geology andGeophysics 26: 381-93.
Hayes, G. L. 1941. Influence of altitude and aspect ondaily variations in factors of forest fire danger.United States Department of Agriculture Circular591, 37pp.
Hessell, J. W. D. 1980. Apparent trends of meantemperatures in New Zealand since 1930. NewZealand Journal of Science 23: 1-9.
Jane, G. T. 1983. (unpublished). Vegetation mortalityin the Kaimai Ranges, New Zealand. D.Phil.thesis, University of Waikato.
Jane, G. T.; Green, T. G. A. 1983a. Morphology andincidence of landslides in the Kaimai Ranges,North Island, New Zealand. New Zealand Journalof Geology and Geophysics 26: 71-84.
Jane, G. T.; Green, T. G. A. 1983b. Vegetationmortality in the Kaimai Ranges. New ZealandJournal of Botany 21: 21-31.
Jane, G. T.; Green, T. G. A. 1983c. Utilisation ofpressure-volume techniques and non-linear leastsquares analysis to investigate site induced stressesin evergreen trees. Oecologia 57: 380-90.
Kerfoot, O. 1967. Mist precipitation on vegetation.Forest Abstracts 29: 8-20.
Kidson, E. 1930. Dry years in New Zealand. NewZealand Journal of Science and Technology 13:79-81.
Kozlowski, T. T. 1982. Water supply and tree growth.Part II, flooding. Forest Abstracts 43: 145-161.
Mark A. F. M. 1965. Vegetation and mountainclimate. In: Lister, R. G.; Hardgreaves, B. P.(Editors). Central Otago pp 69-91. New ZealandGeographical Society. Miscellaneous Series No. S.Geographical Society, Dunedin.
Martin, J. 1889. Thames and Te Aruha goldfieldsguide. Geddis and Denise, Newtown, Auckland,31pp.
Maunder, W. J. 1970. World survey of ClimatologyVol. 13,243-401. Enselvier, Amsterdam.
Maunder,W. J. 1973. Climate of the Waikato. In:Natural Resources Survey Pt III. WaikatoCoromandel and King Country Region. NewZealand Ministry of Works, Town and CountryPlanning Division, 2I5pp.
Morris, J. Y. 1965. Climate investigations in theCraigieburn Range, New Zealand New ZealandJournal of Science 8: 556-82.
New Zealand Meteorological Service. 1978. Averagedegree-day tables for selected New Zealand
Stations. New Zealand Meteorological Service,Miscellaneous Publication 159, 55pp.
O'Rourke, P. A.; Terjung, W. H. 1981. Total standleaf net photosynthetic rates affected by cloudtypes and amounts. Pohtosynthetica 15: 504-10.
Peace, T. R. 1960. Pathology of trees and shrubs.Oxford University Press. 753pp.
Salinger, J. M. 1979. Climatic regions of New Zealandbased on cluster techniques. New ZealandStatistician 14 (1): 26-34.
Schoeneweiss, D. F. 1975. Predisposition stress andplant disease. Annual Review Phytopathology 13:193-211.
Seelye, D. 1950. Fluctuations and secular trends inNew Zealand rainfall. New Zealand Journal ofScience and Technology 6: 11-24.
Tobiessen, P.; Buchsbaum, S. 1976. Ash dieback anddrought. Canadian Journal of Botany 54: 543-45.
Tobiessen, P.; Kana, T. M. 1974. Drought-stressavoidance in three pioneer tree species. Ecology55: 667-70.
Tomlinson, A. I. 1976. Short-priod fluctuations of NewZealand rainfall. New Zealand Journal of Science19: 149-61.
Tomlinson, A. I. 1980a. A non-random feature in NewZealand rainfall. New Zealand Geographer 36:68-72.
Tomlinson, A. I. 1980b. A superposed epoch analysisof New Zealand rainfall, Search 11: 383-5.
Tomlinson, A. I. 1981. Some variations in rainfall andriver flow in New Zealand. New Zealand Journalof Science 24: 103-10.
Trenberth, K. E. 1976. Spatial and temporal changes inthe southern oscillation. Quarterly Journal of theRoyal Meteorological Society 102: 639-53.
Trenberth, K. E. 1977a. Surface atmospheric tides inNew Zealand. New Zealand Journal of Science20: 339-56.
Trenberth, K. E. 1977b. Climatic change: a NewZealand perspective. New Zealand MeteorologicalService, Miscellaneous Publication 141.
Tricker, R. A. R. 1970. Science of clouds. Mills andBoone, 144pp.
Tye, R. E. 1974. Hauraki Plans story. Thames ValleyNews, Te Aroha, 184pp.
Vennell, C. W.; Fitzgerald, T. E.; Gordon, M. 1951Centenial history of Matamata plains. MatamataCounty Council, 148pp.
Vines, R. G.; Tomlinson, A. I. 1980. Analysis of NewZealand rainfall. New Zealand Journal of Science23: 205-16.