ecological and evolutionary impacts of changing climatic ... · ecological and evolutionary impacts...
TRANSCRIPT
Ecological and evolutionary impacts of changing climatic variability
Diego P. Vázquez1,2,*,§, Ernesto Gianoli3,4, William F. Morris5 and Francisco
Bozinovic6,§
1Instituto Argentino de Investigaciones de las Zonas Áridas, CONICET, CC 507, 5500 Mendoza,
Argentina
2Facultad de Ciencias Exactas y Naturales, Universidad Nacional de Cuyo, Padre Jorge Contreras
1300, M5502JMA Mendoza, Argentina
3Departamento de Biología, Universidad de La Serena, Casilla 554 La Serena, Chile
4Departamento de Botánica, Universidad de Concepción, Casilla 160-C Concepción, Chile
5Biology Department, Duke University, Durham, North Carolina 27708-0325, USA
6Departamento de Ecología and Center of Applied Ecology & Sustainability (CAPES), Facultad de
Ciencias Biológicas, Pontificia Universidad Católica de Chile, Santiago 6513677, Chile
*Author for correspondence (Tel.: +54-261-524-4121; Fax: +54-261-524-4001; E-mail:
§Authors contributed equally.
ABSTRACT
While average temperature is likely to increase in most locations on Earth, many places will
simultaneously experience higher variability in temperature, precipitation, and other climate
variables. Although ecologists and evolutionary biologists widely recognize the potential impacts of
changes in average climatic conditions, relatively little attention has been paid to the potential
1
5
10
15
20
impacts of changes in climatic variability and extremes. We review the evidence on the impacts of
increased climatic variability and extremes on physiological, ecological and evolutionary processes
at multiple levels of biological organization, from individuals to populations and communities. Our
review indicates that climatic variability can have profound influences on biological processes at
multiple scales of organization. Responses to increased climatic variability and extremes are likely
to be complex and cannot always be generalized, although our conceptual and methodological
toolboxes allow us to make informed predictions about the likely consequences of such climatic
changes. We conclude that climatic variability represents an important component of climate that
deserves further attention.
Key words: climate change, community structure, demography, fitness, geographic range limits,
phenological mismatches, phenotypic plasticity, physiological traits, population dynamics, species
interactions.
2
25
30
35

CONTENTS
I. Introduction 5
II. Physiology, individual performance and fitness 6
(1) Individual performance and fitness 6
(2) Macrophysiological patterns 9
III. Phenotypic plasticity 10
(1) Phenotypic plasticity and adaptation to changing environments 10
(2) Patterns of phenotypic plasticity at the population level 12
(3) Evolution of increased plasticity 13
IV. Demography and population dynamics 17
(1) Review of relevant theory 17
(2) Empirical estimates of population sensitivity to increased environmental variability 23
(3) Summary and future directions 25
V. Species interactions and community structure 26
(1) Phenological mismatches, species interactions and geographic range limits 26
(2) Community structure and dynamics 28
VI. Conclusions 32
VII. Acknowledgments 35
VIII. References 35
IX. Appendix A1: using Tuljapurkar’s ‘small-noise’ approximation to understand the influence
of increased variance of vital rates on the stochastic population growth rate
I. INTRODUCTION
The Earth's climate is changing rapidly. Available data indicate a trend towards increasing global
temperatures. Causes for these temperature changes are intricate and associated with a network of
3
40

events in which human activities appear to play a determinant role (Trenberth, 2011). In addition to
increased temperature averages, human-caused climate change is expected to lead to increased
climatic temporal variability and increased occurrence of climatic extremes in many places (e.g.
droughts, excessive precipitation, heat waves; Easterling et al., 2000; Burroughs, 2007; Meehl et
al., 2007; Coumou & Rahmstorf, 2012). Under some climate change scenarios, climatic variability
and extremes are expected to increase more than climatic averages for some regions (Meehl et al.,
2007).
A mechanistic understanding of the biological consequences of climate change requires the
integration of physiology, ecology, and evolutionary biology (Spicer & Gaston, 1999). Although
biologists widely recognize the potential impacts of changes in average climatic conditions,
relatively little attention has been paid to the potential impacts of changes in climatic variability and
extremes (Benedetti-Cecchi, 2003; Jentsch, Kreyling & Beierkuhnlein, 2007; Bozinovic, Calosi &
Spicer, 2011b; Thompson et al., 2013), and we know relatively little about the mechanisms
underlying these potential impacts. Enhancing this understanding and highlighting gaps in our
knowledge is the main goal of this review.
When discussing the ecological and evolutionary implications of increased climatic
variability and climatic extremes, it is important to define precisely these attributes of climate.
Climatic variability can be defined as the standard deviation or the variance of a climate variable
such as temperature, or by a relativized measure of variability such as the coefficient of variation.
Defining the frequency of occurrence of extreme climatic events in statistically precise terms is
more elusive. Often extremes are defined in relation to a climate record for a certain period (e.g.
three standard deviations away from the mean temperatures from 1960 to 2010). However, this
definition is problematic, as it implies that an increase in the mean temperature, with no change in
the shape of the distribution around the mean, would increase the frequency of high extremes and
decrease the frequency low extremes, whereas a change in climatic variability might lead to
4
45
50
55
60
65

increased extremes at both ends of the distribution. Alternatively, extremes can be defined as events
that influence the shape of the distribution of a climatic variable without influencing the mean and
the variance—i.e. the kurtosis (Fig. 1). Thus, an increase in the frequency of extreme events would
make the distribution of the climatic variable more leptokurtic, while a decrease in the frequency of
extreme events would make the distribution more platykurtic, without necessarily changing the
mean or the variance of the climatic variable.
Here we review the evidence on the impacts of increased climatic variability and extremes
on physiological, ecological and evolutionary processes at multiple levels of biological
organization, from individuals to populations and communities. Specifically, we consider the
responses to increased climatic variability and extremes in terms of (i) physiology and performance
including Darwinian fitness, (ii) phenotypic plasticity, (iii) demography and population dynamics,
and (iv) community structure and dynamics.
II. PHYSIOLOGY, INDIVIDUAL PERFORMANCE AND FITNESS
(1) Individual performance and fitness
Recent models of the physiological, ecological and evolutionary responses of organisms to
climate change indicate that a change in thermal variance could have as much (or more) of an
impact on fitness as does a change in the mean temperature (Bozinovic et al., 2013a; Bozinovic,
Catalán & Kalergis, 2013b; Estay, Lima & Bozinovic, 2014). The typically unimodal, asymmetric
shape of the relationship between temperature and performance, which tends to accelerate below the
optimum temperature but decelerate above the optimum, implies that the impact of thermal
variation on physiological performance will depend on the mean temperature in relation to the
temperature at which performance peaks (Bozinovic et al., 2011a). When mean temperature is
below the thermal optimum, thermal variation can either enhance or reduce physiological
performance; by contrast, when mean temperature is equal to or greater than the thermal optimum,
5
70
75
80
85
90

thermal variation will always impair performance (Fig. 2). Thus, the mean and variance of
temperature will interact predictably to determine Darwinian fitness in a variable environment.
Several studies provide experimental evidence for the influence of thermal variance on
individual performance. Bozinovic et al. (2011a) observed that thermal variation enhanced the
population growth rate of the fruit fly Drosophila melanogaster at a low mean temperature, while it
decreased this rate at the thermal optimum, despite the fact that flies improved their heat and cold
tolerances through environmental acclimation. Siddiqui, Barlow & Randolph (1973) reported
significantly different effects of constant and alternating temperatures on population growth of the
pea aphid Acyrthosiphon pisum; in addition, the net reproductive rate (R0) and the intrinsic rate of
increase (r) differed in their response to different temperature regimes. More recently, Clavijo-
Baquet et al. (2014) found similar results for the effects of thermal mean and variability on R0, r and
the generation length Tg, of D. melanogaster, with no effects of temperature variation on r despite
strong effects on R0 and Tg. Thus, considering that r ≈ ln (R0 )/T g , thermal effects on R0 and Tg
cancel each other. Likewise, Kjaersgaard et al. (2013) reported that increased temperature
variability decreased the individual performance of yellow dung flies Scatophaga stercoraria.
Furthermore, some studies have shown that moderate amounts of environmental variability do not
necessarily have detrimental effects on performance, compared to greater levels of variability
(Pétavy et al., 2004; Folguera et al., 2011). Although experimental approaches cannot capture the
wide range of abiotic and biotic conditions in nature, they help us to understand the mechanisms by
which climate change may impact organisms. This kind of experiment can also shed light on
geographic variation in phenotypes, because diel and seasonal patterns of environmental
temperature change along latitudinal and altitudinal gradients (Angilletta, 2009). Indeed,
Kjaersgaard et al. (2013) advocate the use of more relevant fluctuating temperatures in
experimental studies of the ecological impact of climate change.
It is important to note that individual performance can change with increased temperature
6
95
100
105
110
115

variability even if average temperature does not change. This is because of Jensen's inequality, a
property of nonlinear functions, which states that, for a sample of x values with mean x and
a nonlinear function f ( x ) , f ( x )>f ( x ) if f ( x ) is accelerating (second derivative is positive)
and f ( x )<f ( x ) if f ( x ) is decelerating (second derivative is negative; Ruel & Ayres, 1999).
Thus, the typically unimodal, asymmetric shape of the relationship between body temperature and
physiological performance (Fig. 2) should lead to complex effects of thermal variance (Estay et al.,
2011): close to the peak of the function, greater temperature variability should decrease
physiological performance, whereas at the lower tails of the function greater temperature variability
should increase performance. For example, Siddiqui & Barlow (1972), conducted a now classic
study that showed that thermal fluctuations, within the range of temperatures favourable for
reproduction, enhanced the rate of population growth. Later, Orcutt & Porter (1983) observed a
slightly positive effect of thermal variation on the population growth rate of water fleas Daphnia sp.
This result could be attributed to the range of experimental temperatures used, which was in the
accelerating (left tail) part of the performance curve. In turn, Estay et al. (2011) found that thermal
variation had a negative effect on the population growth of flour beetles Tribolium confusum when
mean temperature was in the decelerating part of the performance curve. Similar interactions
between the mean and the variance of temperature have been observed in other studies (Dallwitz,
1984; Paaijmans et al., 2010; Bozinovic et al., 2013a; Estay et al., 2014).
A mechanistic understanding of organismal responses to climatic variability requires
elucidating the underlying cellular and physiological processes that allow animals to cope with such
variation. When exposed to stress, organisms respond in multiple ways, including DNA and protein
repair, apoptosis, removal of cellular and molecular waste generated by stress, and changes in
cellular metabolism to switch from cellular growth to repair (Kassahn et al., 2009). Thus, organisms
are constrained by a trade-off between response to stress and allocation to growth and reproduction
(Somero, 1995). A key component of such responses are heat shock proteins, which have an
7
120
125
130
135
140

important function in cells under stressful conditions and are necessary for the survival and
recovery of organisms, often by rescuing critical metabolic enzymes from destruction (Parsell &
Lindquist, 1994). Experiments have shown that small amounts of induced heat shock proteins can
influence development, life span, fecundity and stress resistance (Sørensen et al., 1999). Therefore,
the influence of heat shock proteins has the potential to scale up to populations and communities.
The very existence of these molecular and integrative responses to climate suggests that thermal
fluctuation may be an important selective factor in nature. In addition, the effects of different
thermal conditions are directly related to the thermal safety margin—i.e. the difference between an
organism’s thermal optimum and its current environmental temperature (Deutsch et al., 2008;
Folguera, Bastías & Bozinovic, 2009). Future interpopulation comparisons might reveal higher
sensitivity to thermal amplitude in, for instance, lowland than in highland populations, indicating
that important effects on biodiversity may be expected in the context of increasing thermal
amplitude.
(2) Macrophysiological patterns
Macrophysiology seeks to explain how physiological traits are affected by environmental variation
over large geographic scales. For instance, compared to tropical taxa, species from temperate
latitudes are thought to experience selection for greater plasticity because they live in more seasonal
environments (Chown, Gaston & Robinson, 2004; Ghalambor et al., 2006). The latter is the case
particularly in northern latitudes, where differences between absolute maximum and absolute
minimum temperatures are greatest (Addo-Bediako, Chown & Gaston, 2000; Chown et al., 2004).
Supporting evidence of a hemispheric asymmetry in physiological tolerance (with assumed
underlying plasticity) has been reported for insects (Addo-Bediako, Chown & Gaston, 2002;
Sinclair, Addo-Bediako & Chown, 2003) and terrestrial isopods (Bozinovic et al., 2014), but
evidence for other taxa is lacking.
8
145
150
155
160
165

Data on latitude and thermal amplitude show that the increased temperature variation in
temperate regions results from the pattern of variation of minimum temperatures, with maximum
temperatures being equally variable across latitude (Chown et al., 2004b; Ghalambor et al., 2006).
Therefore, the expected increased selection on plasticity in temperate species—compared to tropical
taxa—should occur for responses to cold and not to warming. This prediction has been corroborated
for insects, frogs, and lizards (see Ghalambor et al., 2006). In addition, Vasseur et al. (2014)
recently demonstrated the independent and interactive effects of mean temperature and its
variability on thermal performance curves for nearly 40 ectothermic invertebrates with worldwide
distributions. With the use of fine-grained, site-specific historical temperature data, Vasseur et al.
(2014) showed how changes in the mean, variance and positive skewness of historical temperatures
have significant influences on organismal performance. Furthermore, for ectotherms, thermal
performance—and hence fitness—tends to decline or remain unchanged under future climate
scenarios, with greater declines occurring at mid to low latitudes (see also Deutsch et al., 2008).
III. PHENOTYPIC PLASTICITY
(1) Phenotypic plasticity and adaptation to changing environments
Increased climatic variability may be envisioned as a particular case within the general phenomenon
of changing environments. Adaptation of organisms to changing environments occurs mainly by
two mechanisms: (i) genetic differentiation, i.e. across-generations phenotypic adjustment to the
prevailing environmental conditions as a result of selection on heritable traits, and (ii) phenotypic
plasticity, i.e. within-generation phenotypic changes induced by the environment (Schlichting &
Pigliucci, 1998; Réale et al., 2003). Evidence strongly suggests that phenotypic plasticity, which
may even be reversible (Garland & Kelly, 2006), is essential for adaptation to climate change and
increased climatic variability, and that evolutionary rates cannot always keep up with climate
change (Jump & Peñuelas, 2005; Davis, Shaw & Etterson, 2005; Gienapp et al., 2008; Charmantier
9
170
175
180
185
190

et al., 2008; Ozgul et al., 2010; Hoffmann & Sgrò, 2011; but see Visser, 2008). For instance, the
advancement in parturition date of the North American red squirrel, Tamiasciurus hudsonicus, in
response to climate change is mostly due to phenotypic plasticity (62%), while microevolutionary
changes account for 13% of the phenotypic change (Berteaux et al., 2004; Anderson et al., 2012). In
a modelling study, Chevin, Lande & Mace (2010) found that the critical rate of environmental
change, i.e. the maximum rate of sustained environmental change that allows population
persistence, increases with decreasing absolute difference between phenotypic plasticity and the
environmental sensitivity of selection (the change in the optimum phenotype with the environment).
In other words, the closer plastic responses in a given population track the shift in the favoured
phenotype that occurs when the environment changes, the greater magnitude of sustained
environmental change this population will tolerate. Nonetheless, it is likely that rapid responses to
environmental change via phenotypic plasticity may be followed by selection and microevolution
(Matesanz, Gianoli & Valladares, 2010; Godoy et al., 2011; Brunet & Larson-Rabin, 2012).
Phenotypic plasticity is expressed in the reaction norm: the repertoire of phenotypic
responses to environmental variation of a given genotype, population, or species (Pigliucci, 2001;
Gianoli & Valladares, 2012). The reaction norm itself may evolve by natural selection (Scheiner &
Lyman, 1991; Pigliucci & Schlichting, 1996; Scheiner & Callahan, 1999; Garland & Kelly, 2006;
Baythavong & Stanton, 2010). Selection on reaction norms and performance curves in a population
should be driven by the frequency (and predictability) of the environments experienced by
organisms (Weis & Gorman, 1990; Gilchrist, 1995; Alpert & Simms, 2002; Kingsolver et al., 2007).
Phenotypic plasticity should be important not only to deal with the increasing rate of climate
change, but also with the increased unpredictability of climatic anomalies (Arias, Poupin & Lardies,
2011). An experimental study with ten sub-Antarctic weevil species found that phenotypic plasticity
accounted for most of the between-population variation in critical thermal minimum (CTmin) and
critical thermal maximum (CTmax) (Klok & Chown, 2003). Weevils acclimated for only one week at
10
195
200
205
210
215

15 ºC raised their CTmax by 2.4 ºC, compared to those maintained at 0 ºC (Klok & Chown, 2003).
Interestingly, Skelly et al. (2007) estimated the potential for evolutionary response in CTmax in
ectotherms and predicted an increase in 3.2 ºC across 10 generations (50 years). Thus, within a
single generation plastic responses drive an increase in CTmax that is 75% of that calculated for 10
generations when only evolutionary responses are considered. Furthermore, an extreme
environment may allow the expression of formerly ‘hidden’ parts of the reaction norm, which may
reveal the existence of cryptic genetic variation upon which natural selection may act (Schlichting,
2008). Overall, in view of the problem of decreased performance in ectotherms caused by climatic
variation illustrated in Fig. 2, adaptive phenotypic plasticity may be conceived to function as a
buffer to minimize the coupling of environmental temperature and body temperature, in a context of
increased climatic variability.
(2) Patterns of phenotypic plasticity at the population level
Theory predicts that increased environmental variation should select for increased phenotypic
plasticity (Schlichting & Pigliucci, 1998; Alpert & Simms, 2002). Some studies have proved the
increased magnitude and adaptive value of phenotypic plasticity in spatially heterogeneous
environments (Lind & Johansson, 2007; Hollander, 2008; Baythavong, 2011), but in the context of
climatic variation associated with climate change it is more relevant to focus on temporal
heterogeneity. We surveyed published studies to evaluate this theoretical prediction in plant
populations from habitats with contrasting temporal environmental heterogeneity. Plants are
appropriate study subjects to evaluate this prediction because they are sessile, which means they
cannot migrate to avoid harsh climatic conditions (Post et al., 1999; Réale et al., 2003; Battisti et
al., 2006). We specifically focused on those studies reporting plant responses to temperature and
soil moisture, which are the components of climate change that are more relevant to plants
(Matesanz et al., 2010). We found 11 studies that met these conditions, including 14 cases from 12
11
220
225
230
235
240

species (Table 1). Phenotypic plasticity data included physiological, morphological, and life-history
traits (references in Table 1).
Results support the theoretical expectation that increased plasticity is selected for in more
variable environments. There was a significant positive association between phenotypic plasticity in
plant populations and temporal heterogeneity in rainfall or temperature (10 out of 14 cases; Table
1). These preliminary results with plant species suggest that increased phenotypic plasticity may
drive adaptation to increased climatic variability in natural populations. A broader sample of studies
is needed to determine whether other taxa respond similarly, and whether the detection of this
relationship is influenced by the type of traits studied or the intrinsic characteristics of the
organisms.
(3) Evolution of increased plasticity
How could increased climatic variability select for increased phenotypic plasticity? Schlichting &
Pigliucci (1998) discuss two general models for genetic control of plastic responses: allelic
sensitivity and gene regulation. Allelic sensitivity refers to changes in the amount of a given gene
product in response to changes in the environment, and is considered a ‘passive’ form of plastic
response that is not necessarily adaptive (Schlichting & Pigliucci, 1998). This mechanism has been
found in insects (Schmalhausen, 1949), bacteria (Hartl & Dykhuizen, 1981), plants (Kliebenstein,
Figuth & Mitchell-Olds, 2002) and nematodes (Gutteling et al., 2007), and is expected to be
involved in plastic responses to temperature because of the close link between enzyme activity and
temperature (Schlichting & Pigliucci, 1998). By contrast, gene regulation involves the existence of
an environment-dependent regulatory switch in gene expression, resulting in a threshold response,
and is considered an ‘active’ form of plastic response, most likely of adaptive nature (Schlichting &
Pigliucci, 1998). Examples of taxa in which this mechanism has been observed include plants
(Doebley, Stec & Gustus, 1995), insects (Fairbairn & Yadlowski, 1997), molluscs (Egg et al., 2009),
12
245
250
255
260
265

and bacteria (Rivera-Gómez, Segovia & Pérez-Rueda, 2011). These two mechanisms are not
mutually exclusive, as shown by Wu (1998) for growth traits in poplar trees. Furthermore,
epigenetic phenomena, i.e. heritable changes in gene expression that are not mediated by changes in
DNA sequence (Richards, 2006), may mediate functional responses to the environment (Bossdorf,
Richards & Pigliucci, 2008; Chinnusamy & Zhu, 2009; Bräutigam et al., 2013; Herman et al.,
2014). Examples of epigenetic modifications driving phenotypic plasticity include flowering
regulation in response to cold exposure in Arabidopsis thaliana (Kim & Sung, 2012), biomass
allocation responses to water shortage in poplars (Gourcilleau et al., 2010), niche width in a flower-
living yeast (Herrera, Pozo & Bazaga, 2012), and transgenerational induction of plant defences
against herbivores and pathogens (Holeski, Jander & Agrawal, 2012).
Gene regulation should be particularly advantageous for non-instantaneous plastic
responses, such as those involving biomass allocation, whose complete expression involves a time
lag between the appearance of the environmental cue (the stimulus) and the deployment of the
target phenotype in the selective environment. Several studies indicate that reliable cues triggering
plastic responses and somewhat predictable environments are required for plasticity to be adaptive
(DeWitt, Sih & Wilson, 1998; Langerhans & DeWitt, 2002; Alpert & Simms, 2002; Van Kleunen &
Fischer, 2005; Ghalambor et al., 2007; Reed et al., 2010; Scheiner & Holt, 2012; van den Heuvel et
al., 2013). Pigliucci (2001) provides a detailed analysis of evolutionary outcomes concerning
phenotypic plasticity in the presence and absence of environmental cues, considering the duration of
temporal fluctuation as compared to generation time. In some masting plant species (those that
show sporadic reproductive outbreaks that satiate herbivores) synchronous fruiting was associated
with anomalously high temperatures in the summer before seedfall, a cue linked with the La Niña
climatic phenomenon (Schauber et al., 2002). If the frequency of such anomalously high
temperatures increases, masting might no longer be adaptive in terms of realized herbivore satiation
(McKone, Kelly & Lee, 1998). In fact, in most of the reported cases of successful tracking of
13
270
275
280
285
290

climate change, including species from diverse phyla, the climatic shift has been rather monotonic
(Parmesan & Yohe, 2003; Root et al., 2003; Parmesan, 2006; Cleland et al., 2007; Walther et al.,
2007; Charmantier et al., 2008). In general, if in order to adapt to seasonal changes species rely on
photoperiod alone (e.g. Lambrechts & Perret, 2000), they are likely to fail to adjust to the actual
environment because of the recent shift (or even uncoupling) in the relationship between
temperature and photoperiod driven by climate change (Visser, Both & Lambrechts, 2004).
Alternatively, if species rely on temperature alone (e.g. Condon, Chenoweth & Wilson, 2010),
anomalous high-temperature periods may induce maladaptive responses (Powell & Logan, 2005),
depending on the threshold of response. A mixed control on plasticity of phenology, by both
photoperiod and temperature, could be a better strategy; this has been shown for several moth
species at high latitudes (Valtonen et al., 2011). The interaction between resource availability and
climate as environmental cues is also a potentially advantageous alternative to track climate change-
driven anomalies better (Visser et al., 2004).
Returning to the question of how increased climatic variability could select for phenotypic
plasticity, and assuming a gene regulatory system underlying the plastic responses, we show in a
conceptual model (Fig. 3) the likely outcomes for two climate change scenarios: (i) a temporal shift
in environmental quality, and in its corresponding cue for the initiation of the plastic response (Fig.
3A), and (ii) a temporal shift in environmental quality plus climatic variability (a short-term
anomaly counteracting the climatic trend; Fig. 3B). Our analysis considers three genotypes with
different phenotypic responses to the environment across the season (Fig. 3C,D). The black
genotype is not responsive to climate change or climatic variability, thus maintaining the phenotypic
trajectory that matches the historical climate. The red genotype tracks both climate change and
climatic variability, adjusting its reaction norm accordingly. The purple genotype adjusts its reaction
norm, as for the red genotype, and shows increased plasticity, envisioned as a likely response to an
increasingly heterogeneous environment. We then estimate the relative advantage of each strategy
14
295
300
305
310
315

(genotype) considering two possible adaptive landscapes: directional and stabilizing selection
(Endler, 1986). When directional selection prevails, increased phenotypic plasticity (purple) is
favoured under both climatic scenarios, especially under climatic variability (Fig. 3E,F). By
contrast, if stabilizing selection prevails, increased plasticity is not beneficial, being as
(mal)adaptive as the unresponsive black genotype under both climatic scenarios; the red genotype is
favoured instead. Therefore, whether increased plasticity is favoured would ultimately depend on
the form of natural selection acting at the end of the season. The latter is influenced by both the
selective factors operating and the traits involved (Endler, 1986; Kingsolver et al., 2001; Geber &
Griffen, 2003), which may show ontogenetic variation in their environmental sensitivity (e.g. Arias
et al., 2011). Thus, temperature-related performance traits regularly show an optimum, with low and
high levels having a lower adaptive value (Huey & Kingsolver, 1989; Angilletta, Niewiarowski &
Navas, 2002; Seebacher, 2005); by contrast, water-economy traits often show linear relationships
with performance (Dudley, 1996; Heschel et al., 2004; Saldaña et al., 2007). Nonetheless,
stabilizing selection is less frequent and usually weaker than directional selection in natural
populations (Kingsolver et al., 2001). In any event, increased levels of climatic complexity (the
particular sequence and duration of environmental states) may complicate patterns of selection on
thermal performance curves and other continuous reaction norms (Valladares, Gianoli & Gómez,
2007; Kingsolver et al., 2007). Moreover, a comprehensive and realistic analysis must take into
account the role of correlations between characters of functional value, which may constrain the
evolution of adaptive responses to climate change (Etterson & Shaw, 2001; Gianoli & Palacio-
López, 2009).
The above analysis may allow identifying the different targets involved in adaptive
evolution of phenotypic plasticity to deal with climatic variability. First, it may entail the evolution
of responsiveness (the red genotype), i.e. a shift in the environmental threshold of response or a
change in the eliciting cue. This has been shown for the flowering time in an annual plant, with
15
320
325
330
335
340

summer drought selecting for early flowering and causing adaptive evolution in a few generations
(Franks, Sim & Weis, 2007). Second, it may involve the evolution of increased plasticity (the purple
genotype), i.e. a reaction norm with a steeper slope. This has been demonstrated for an
insectivorous bird, which was able to change the duration of components of breeding behaviour in
order to track the temporal shift in food availability (Charmantier et al., 2008). Finally, adaptation
to climatic variability may include the arrestment or reversion of phenotypic changes, once the
climatic anomaly is detected (the red and purple genotypes). Of course, this is possible only for
certain traits, with behaviour appearing as a suitable candidate. Besides the above-mentioned study
on adaptive responses to climate change in bird breeding behaviour (Charmantier et al., 2008), it
has been reported for the same species that (i) there is no response of birds to warming in
physiological or morphological traits (Visser et al., 2011), (ii) the cue is increased temperature and
not mean temperature (Schaper et al., 2012), and (iii) there is genetic variation for cue sensitivity
(Visser et al., 2011), thus providing the basis for an evolutionary response to natural selection. In a
related species, Vedder (2012) recently showed experimentally that birds are able to advance
offspring hatching in response to increased temperature after the start of laying. Can other groups
do equally well when the trait is other than behaviour? Further research is needed to address this
question (see Parmesan, 2006; Skelly et al., 2007; Visser, 2008; Hoffmann & Sgrò, 2011).
IV. DEMOGRAPHY AND POPULATION DYNAMICS
(1) Review of relevant theory
Population theory has primarily examined how changes in environmental variability will influence
the average rate of annual population growth over the long term, the so-called stochastic population
growth rate, λs (Caswell, 2001). This rate represents the appropriate average multiple by which
the size of the population changes from one year to the next over a long period of time during which
the actual population growth rates differ from year to year because of environmental variation. If
16
345
350
355
360
365

λs>1 , the population tends to increase over the long term, while if it is below one, the population
tends to decline. Year-to-year variation in the population growth rate arises because of variation in
the ‘vital rates’ (survival, somatic growth, and reproduction of individuals in all life stages, plus
recruitment of new individuals) that collectively govern the loss of existing individuals and the
addition of new individuals to the population. Temporal variation in the vital rates is in turn driven
by year-to-year variation in environmental conditions (e.g. Doak & Morris, 2010).
Ideally, we would like to be able to say whether an increase in the variance of the vital rates
driven by changes in environmental variability (keeping the mean vital rates constant) would either
increase or decrease λ s . Unfortunately, population theory demonstrates that a categorical
statement about the effects of increasing environmental variability on the population growth rate is
impossible to make. Instead, the answer is that increasing variability can either increase or decrease
the rate of population growth over the long term, depending on numerous details about how the
environment varies and about the demography of the species in question (Fig. 4). We now briefly
summarize the most important of these details.
The first thing we need to know to predict if increasing environmental variability would
increase or decrease the long-term population growth rate is how the environment varies. The
simplest case is that environmental variability is independently and identically distributed (IID),
meaning that environmental conditions (or more precisely the resulting vital rates) are drawn each
year from a statistical distribution with a constant (i.e. ‘identical’) shape and in which the value in
one year is drawn ‘independently’ from the values in all previous years. We would then be asking
how a step-like increase in the variance of the distribution (i.e. a one-time change in the variance to
a new, higher value) affects λ s . In the simplest case in which the population is ‘unstructured’ (i.e.
all individuals contribute equally to population growth) and generations do not overlap, increasing
the variance of the annual population growth rate (i.e. the degree to which births exceed deaths)
decreases λ s , because λs is the geometric mean of the annual population growth rates, and the
17
370
375
380
385
390

geometric mean of any set of numbers decreases as the variance of those numbers increases
(Lewontin & Cohen, 1969). This argument, which ignores the complexity of demography in a
structured population, would suggest that increasing environmental variability is detrimental to
long-term population growth.
However, in the case of a structured population, even in the simple and often unrealistic case
of IID environmental variability, increased variance of a single vital rate can either increase or
decrease λs , depending on two demographic factors. First, it depends on whether that vital rate
covaries, either positively or negatively, with other vital rates. Positive covariation means that the
two rates tend to be relatively high in the same years (and both relatively low in the other years),
and negative covariation means that one vital rate tends to be low when the other is high (and vice
versa). A number of biological factors can determine whether vital rates covary, and if so, whether
the covariation is positive or negative. For example, vital rates that represent the same type of
demographic process (e.g. survival of newborns and survival of adults) might respond similarly to
environmental conditions, creating positive covariation between those rates. Negative covariation
may arise when rates represent opposing types of demographic processes (e.g. years of high
individual growth are also years of low shrinkage to smaller size in plants), or it may reflect life
history trade-offs (e.g. high investment in reproduction leads to low growth in the same year). The
second demographic factor that determines how λs will respond to an increase in vital rate
variance are the ‘sensitivities’ of the deterministic population growth rate to changes in that vital
rate and in all other vital rates with which it covaries (de Kroon et al., 1986; Caswell, 2001).
Graphically, a sensitivity represents the slope of a graph of the population growth rate versus the
value of a vital rate, with all vital rates at their current mean values (see Chapter 9 in Morris &
Doak, 2002). The sensitivities play an important role, because they govern the degree to which
year-to-year variability in the vital rates translates into variability in the annual population growth
rate, which in turn influences λs . Specifically, variation in vital rates with high-magnitude
18
395
400
405
410
415

sensitivity produces greater variation in the population growth rate. The sign of the sensitivity also
indicates whether increasing a vital rate increases (as for individual growth rate) or decreases (as for
shrinkage) the population growth rate. When two vital rates covary, we must know if the signs of
their sensitivities are the same or different to predict the effect of increasing the variance of one of
those rates. But if we know the environment is IID, and have estimated the means, variances,
covariances, and sensitivities of all the vital rates, we can predict whether increased variance in a
vital rate will increase or decrease λs , as laid out in Fig. 4. These results rely on Tuljapurkar’s
(1990) ‘small-noise’ approximation for λs , as explained in greater detail in Appendix A1 (see
Section IX).
However, environmental variation may not be IID. One common case in which it is not is
represented by ecosystems influenced by repeated cycles of disturbance (such as fires or hurricanes)
and recovery. Here, environmental conditions, and therefore vital rates, are correlated across years
because, following a disturbance, recruitment opportunities and individual growth tend to be high
for several years running, while late in the disturbance cycle when competition is intense,
recruitment and growth are both persistently low (e.g. Menges & Quintana-Ascencio, 2004; Menges
et al., 2006). In such Markovian environments (so-called because we use a Markov matrix to
govern the choice of next year’s environmental state—for example, the number of years since the
last fire—given the environmental state this year, which may influence the probability of another
fire), variation even in high-sensitivity vital rates can be adaptive, and thus greater—not less—
variation can lead to higher population growth (Tuljapurkar, Horvitz & Pascarella, 2003; Haridas &
Tuljapurkar, 2005). For example, in a fire-prone ecosystem, high survival of seedlings immediately
after a fire followed by low seedling survival once full vegetation cover has been restored and
opportunities for recruitment have vanished may yield a higher long-run population growth rate
than would the same average rate of seedling survival every year, regardless of the stage in the fire
cycle. If so, climate change leading to less variation in survival among the phases of the fire cycle
19
420
425
430
435
440

could be detrimental to population growth, as Morris et al. (2006) predicted for two species of fire-
adapted plants. But to add further complication, greater environmental variation at each stage of the
disturbance/recovery cycle (e.g. due to an increase in precipitation variability unrelated to fires)
could reduce population growth even while greater variation between disturbance phases increases
population growth. Morris et al. (2006) also observed this conflicting effect of increasing the two
kinds of variability in the two study plants, although the effect of changing between-phase
variability was greater, suggesting that reducing both kinds of variability simultaneously would
depress population growth.
An important caveat is that the results in the preceding paragraph assume no change in the
frequency of disturbance; they apply only to changes in the between- and within-disturbance phase
variabilities of the vital rates at a fixed disturbance frequency. Yet changes in climatic variability
will often drive changes in the frequency of disturbance (e.g. making fires or hurricanes more or
less likely). When the disturbance frequency changes, it becomes meaningless to ask how changing
vital rate variability per se will affect λ s . The reason is that changing the disturbance frequency
will simultaneously change the means and the variances of the vital rates, so we can no longer
assess the effect of changing the variance while holding the mean constant, as we have done so far.
Changing disturbance frequency will also change the temporal correlations within and between vital
rates (these correlations measure how similar a vital rate’s values are from one year to the next, as
well as the similarity in one vital rate in one year to all the other vital rates in the next year). All of
these changes to means, variances, and temporal correlations will collectively result in changes to
λs (Tuljapurkar & Haridas, 2006).
Given this complexity, it is possible for changing disturbance frequency to change the
variance of a vital rate and λs in the same or in opposite directions. For example, consider the
situation in which conditions are best for a species immediately after a disturbance, as would likely
be the case for a fugitive species. Increasing the disturbance frequency would then be expected to
20
445
450
455
460
465

increase the long-term population growth rate, but decrease the vital rate variances (e.g. Caswell &
Kaye, 2001; Tuljapurkar et al., 2003; Horvitz, Tuljapurkar & Pascarella, 2005; Tuljapurkar &
Haridas, 2006). Other species may show poorer population performance immediately after a
disturbance but better performance at intermediate times since the last disturbance. For example, a
fire may kill aboveground plants but spur recruitment from the seed bank. If recruits take several
years to reach reproductive size, too high a fire frequency would preclude reproduction and prevent
replenishment of the seed bank. In this scenario, an increase in disturbance frequency could
decrease both λ s and the vital rate variances (e.g. see Gross et al., 1998; Satterthwaite, Menges
& Quintana-Ascencio, 2002; Menges & Quintana-Ascencio, 2004; Menges et al., 2006). In general,
the variance of a vital rate as a function of the disturbance frequency should follow a unimodal
curve, being low when disturbance frequency is low (and environmental conditions are almost
always in the undisturbed state) or when it is high (and the environment is nearly always disturbed),
but highest at an intermediate disturbance frequency (when disturbed and undisturbed
environmental states alternate frequently). Whether increasing disturbance frequency will increase
or decrease λ s and the vital rate variances will depend on the current disturbance frequency as
well as whether the population performs best at low, high, or intermediate disturbance frequency.
Finally, environmental variability may be neither IID nor Markovian. One important
example is temporal trends in the mean and/or the variance of a climatic driver of demography,
resulting in shifts in the means and/or variances of vital rates. Importantly, the mean and variance of
a vital rate need not both increase or both decrease, but may change in opposite directions (Fig. 5).
When the distribution from which annual environmental conditions are drawn is continuously
shifting, the results summarized above may only serve as a general guide to the short-term response
of the population growth rate, and computer simulations with changing means and/or variances
would be required to predict the effective population growth rate—or population size—over time
(Fig. 4).
21
470
475
480
485
490

To summarize what population theory has to say about the likely effect of changing
environmental variability, greater variability can either increase or decrease the long-term rate of
population growth. To predict the outcome, in addition to characteristics of the environmental
variability and of the demography of the species in question, we may also need to consider
simultaneous changes in the means and temporal correlations of environmental drivers, especially
in the face of changing disturbance frequency or of long-term trends in the distribution of
environmental conditions.
(2) Empirical estimates of population sensitivity to increased environmental variability
Another way to assess the potential effects of increased climatic variability on population growth is
to compute the so-called stochastic sensitivities of the long-run population growth rate to the
standard deviations of the vital rates (Tuljapurkar et al., 2003). These are different from the
sensitivities of the deterministic population growth rate to the vital rate means that were described
in the preceding section; they represent the slope of the long-run stochastic growth rate with respect
to the temporal standard deviation of a vital rate, evaluated at the current standard deviation. The
computation of the stochastic elasticities (Tuljapurkar et al., 2003) can account for any temporal
correlations in environmental conditions, and therefore vital rates, in a Markovian—indeed in any
auto-correlated—environment. Using multi-year demographic data, Morris et al. (2008) computed
the stochastic sensitivities to changes in the means and standard deviations of vital rates for 36
animal and plant species ranging from insects to mammals and annual to long-lived perennial
plants. In general, the population growth rates of these species are more sensitive to climate-driven
changes in the vital rate means than they are to changes in vital rate standard deviations driven by
changes in climatic variability. Nevertheless, short-lived species showed relatively greater
sensitivity to increasing vital rate variability than did long-lived species. This result suggests that an
increase in climate variability might have a disproportionately negative impact on the demography
22
495
500
505
510
515

of short-lived species. Conversely, in regions expected to experience reduced climatic variability,
problems for humans and other species posed by (mostly short-lived) agricultural pest insects and
disease vectors, and by invasive annual plants, may worsen.
It is important to emphasize that the preceding paragraph describes what could happen to the
study populations should climatic variability change. We still have no definitive examples in which
a change in the temporal variability of vital rates has been demonstrated to have resulted from a
change in climatic variability. Showing that variability in vital rates has changed is substantially
more difficult than documenting a trend in the mean of a vital rate over time, because we need a
series of years of demographic data just to make one reliable estimate of the variability of a vital
rate, and at least two such series to assess whether variability has changed. But as the number of
long-term demographic studies has increased in recent years (Crone et al., 2011), we may
eventually be able to correlate changes in vital rate variability with changes in climate variability. In
the shorter term, if we can correlate particular vital rates with specific climatic drivers, then is it
probably safe to conclude that changes in the variabilities of those drivers will cause the
variabilities of the vital rates to change, with the likely population consequences reviewed above.
A less direct way to assess whether increasing climatic variability will elevate variation in
vital rates is to compare the temporal vital rate variances in central and peripheral populations. A
species may more often experience climatic conditions that are farther from optimum at the range
margin compared to the range centre (although another possibility is that conditions are always less
suitable at the margin, or that climate plays no role in setting a particular range limit). If so, vital
rate variances may be higher in peripheral populations, suggesting that even higher climatic
variability beyond the margin may be contributing to the range limit. While some studies have
found higher demographic variation in peripheral populations (Angert, 2009; Doak & Morris,
2010), others have not (Villellas, Morris & García, 2013b; Villellas et al., 2013a).
23
520
525
530
535
540

(3) Summary and future directions
In summary, we cannot make any blanket statements about whether increasing demographic
variability driven by increasing variability in climate would be detrimental for the rate of population
growth (or, conversely, whether decreasing variability would be beneficial). The answer depends on
such factors as the organism’s life history (which influences the sensitivities of the vital rates), the
precise vital rates whose variabilities are changing, whether those vital rates are correlated with one
another, whether the environmental variability is IID versus Markovian (as it would likely be in a
disturbance-prone environment), and if the latter, whether climate change alters the frequency of
disturbance, the variation between disturbance phases, or the variation within phases. But with
sufficient demographic data, the modelling tools, some of which have been summarized here, exist
to predict the effects of changing variability per se on population growth.
But changes in vital rate variability alone may not capture all of the effects of climate
change on population growth. Changes in the frequencies of extreme values of the vital rates driven
by changes in climatic extremes may affect long-run population growth in ways that are not well
captured by measures of population growth based on small-noise approximations. Instead, the
demographic consequences of changes in the frequency of extremes may be better explored by
means of computer simulations, drawing vital rates from the ‘normal’ range of variation with
occasional (and perhaps increasingly frequent) extreme values ‘thrown in’, or by slowly changing
the kurtosis (as well as the mean and variance) of the probability distribution from which each vital
rate’s values are drawn. A yet more promising approach is to link vital rates to environmental
drivers, so that climatic extremes will produce vital rate extremes directly. Simulating changes in
climatic means, variabilities, and extremes, and then predicting in turn the resulting vital rates,
population growth (including density-dependent effects), and population size is perhaps the most
comprehensive way to assess the likely effects of changes in all aspects of climate for the dynamics
of populations (Ehrlén & Morris, 2015).
24
545
550
555
560
565

V. SPECIES INTERACTIONS AND COMMUNITY STRUCTURE
(1) Phenological mismatches, species interactions and geographic range limits
Climate change will influence species interactions and communities either by directly affecting the
abundances of interacting species through demographic effects, or by affecting their phenology,
which may disrupt the phenological matching among interacting species. We have already discussed
demographic effects in the previous section. Below we discuss how climate change, and particularly
increased climatic variability, can lead to phenological mismatches among interacting species, and
how those mismatches can influence geographic range limits.
Climate change should lead to phenological mismatches among interacting species if species
respond idiosyncratically to climatic variables. If so, changes in one climatic variable may influence
the phenology of one species but not of its interaction partners (Harrington, Woiwod & Sparks,
1999; Visser & Both, 2005; Parmesan, 2006; Devoto, Zimmermann & Medan, 2007; Memmott et
al., 2007; Tylianakis et al., 2008; Hegland et al., 2009; Yang & Rudolf, 2010). For example, a plant
could respond to increased average temperature by advancing its flowering period (as has been
frequently observed; Cleland et al., 2007; Gordo & Sanz, 2010; CaraDonna, Iler & Inouye, 2014),
while an insect pollinator may respond more strongly to photoperiod (which is determined by
latitudinal position, not climate), so that its developmental phenology remains unaffected in spite of
increased average temperature; this differential response to climate change would result in a
phenological mismatch between these species. There are several examples in the literature of how
gradual changes in climatic averages have led to phenological mismatches and concomitant
demographic consequences for the interacting species (Visser et al., 1998; Visser & Both, 2005;
Both et al., 2009; Plard et al., 2014). Of course, a partial phenological mismatch between
interacting species does not necessarily indicate the influence of climate change, as mismatches are
known to have occurred naturally before the onset of human-driven climate change, even for
25
570
575
580
585
590

relatively specialized interactions (Singer & Parmesan, 2010); however, such mismatches are likely
to be exacerbated by climate change, which may in turn exacerbate the demographic vulnerability
of the interacting species.
The ecological consequences of climate-driven changes in the phenological matching of
interacting species are likely to be qualitatively different under changes in climatic averages and
changes in climatic variability and extremes. A change in a climatic average may lead to a slow
adjustment of phenologies over decades or centuries (Parmesan et al., 1999; Easterling et al., 2000;
Parmesan & Yohe, 2003; Root et al., 2003; Thomas et al., 2004; Pounds et al., 2006), which may
allow species to adapt to changes in the phenology of their interaction partners to minimize
mismatches (Harrington et al., 1999; Visser & Both, 2005; Parmesan, 2006; Visser, 2008; Hegland
et al., 2009). By contrast, increased inter-annual variability and the increased occurrence of climatic
extremes may lead to high temporal variation in the phenological matching of interacting species,
which may impose conflicting selective pressures on interacting species, preventing adaptation and
maintaining mismatches in the long run. Furthermore, the magnitude of mismatches generated by
year to year climatic variation is likely to be substantially greater than that generated by gradual
changes in average climatic conditions.
Mismatches in the phenologies of interacting species generated by climate change should
influence the limits of geographic ranges if they influence demography, and if such influence is
stronger at range limits than away from them. Under such circumstances, it is at least possible that
increased climatic variation could lead to a shrinkage of geographic ranges, even if average climatic
conditions remained unchanged. A greater influence of phenological mismatches on demography at
range limits may occur through at least two distinct mechanisms likely to operate with particular
strength at range limits: the greater influence of extreme climatic events, and the decreased
sampling probability of phenological tails.
First, phenological shifts may expose populations to harsh, extreme climatic events, which
26
595
600
605
610
615

are likely to be particularly frequent at range limits; this greater exposure to extreme climatic events
at range limits may impose strong constraints on resource availability and, therefore, should have
more detrimental demographic effects (Fig. 6A). For example, earlier flowering because of
increased temperature may also mean a greater likelihood of flower damage due to early spring
frosts or snows at the upper altitudinal or latitudinal range limits (Inouye, 2008); thus, the same
phenological shift in flowering may have greater consequences for an animal feeding on these
flowers at its range limit.
Second, if the abundance of resources, mutualists or antagonists decreases towards range
limits, the demographic consequences of phenological mismatches should also be particularly
strong at range limits. This is because the high likelihood of not sampling from the tails of the
phenological distribution when abundance is low leads to a shortening of the phenological period
(Fig. 6B); this is the same sampling issue that makes dates of first flowering unreliable to study
phenological shifts (van Strien et al., 2008; Miller-Rushing, Inouye & Primack, 2008). A similar
effect is expected if climatic conditions decrease resource abundance without shifting phenology.
Thus, for example, if resources are rarer at range limits, a bad year with lower-than-average
resource abundance may leave individuals with too few resources, sending populations into decline.
(2) Community structure and dynamics
Although many studies have discussed the potential effects of climate change on community
structure and dynamics (e.g. Memmott et al., 2007; Hegland et al., 2009; Woodward et al., 2010),
the focus of the vast majority of these studies is on climatic averages. Only recently have a few
studies begun to consider how climatic variability and climatic extremes can influence communities
(e.g. Knapp et al., 2002; Stireman et al., 2005; Benedetti-Cecchi et al., 2006; Jentsch et al., 2007;
Post, 2013; Reyer et al., 2013; Thompson et al., 2013). For example, Knapp et al. (2002) found that
increased variability in precipitation leads to increased plant diversity in a temperate North
27
620
625
630
635
640

American grassland, while Benedetti-Cecchi et al. (2006) showed that temporal variance mitigates
the impact of mean intensity of stress in climate change in Mediterranean algal and invertebrate
intertidal assemblages. In turn, Stireman et al. (2005) have shown that parasitism by insect
parasitoids on multi-species assemblages of host caterpillars decreases with increasing inter-annual
variation in precipitation. As is usual in community ecology (see, e.g. Lawton, 1999), our ability to
draw generalizations about the potential effects of such climatic changes is likely to be contingent
upon the way the community is organized and the type of ecosystem considered. Yet, the few
available studies give us some hints as to how increased climatic variability and extremes may
influence community structure and dynamics.
One way in which environmental variability can influence community structure and
dynamics is through the storage effect, an ecological mechanism that promotes coexistence among
competing species in variable environments (Chesson, 1994, 2000). Three conditions must be met
for the storage effect to operate. First, species must have some kind of ‘storage’ ability to persist
during unfavourable periods, such as a seed bank or diapause. Second, species must have
idiosyncratic (i.e. species-specific) responses to the environment. Third, the effects of intraspecific
competition on each species must covary with the effects of environmental conditions, so that
competition is stronger in favourable years. Thus, under the storage effect, greater climatic
variability should promote coexistence and enhance species diversity. Several studies provide
evidence that the storage effect may be a common, albeit not universal, mechanism promoting
community stability and diversity. In a North American temperate grassland, Adler et al. (2006)
found that interannual climatic variability promoted the coexistence of three common grass species.
By contrast, a similar analysis in a temperate sagebrush steppe found only weak effects of climatic
variability on species coexistence (Adler, HilleRisLambers & Levine, 2009). In experimental
aquatic microcosms, several studies have shown that species coexistence is favoured by increased
temperature fluctuation (Eddison & Ollason, 1978; Descamps-Julien & Gonzalez, 2005; Jiang &
28
645
650
655
660
665

Morin, 2007); however, the type of environmental fluctuation appears to determine the type of
mechanism involved, with the storage effect operating under red (positively autocorrelated)
fluctuations and other mechanisms (particularly relative non-linearity; Chesson, 1994, 2000) under
white (random) fluctuations (Jiang & Morin, 2007).
The type of interaction dominating the organization of the community is likely to influence
the community's response to climate change. For example, analysing communities with a simple,
tri-trophic structure, Post (2013) found that the trophic level with the weakest self-regulation
exhibited the strongest response to climatic variation, which may in turn cause instability of the
entire community. By contrast, in communities structured mainly through competitive interactions,
climatic variation may help to prevent instability. A similar result was found by Kuang & Chesson
(2009) for an annual plant assemblage, in which generalist seed predation shifted plant–plant
interactions from resource competition to apparent competition (i.e. potential competitors
interacting indirectly through common predators; Holt, 1977), thus weakening the storage effect
that promotes coexistence among plant species.
The size of the community (i.e. the number of species) may also influence the community's
response to increased climatic variability. In a simulation study of model communities, Kaneryd et
al. (2012) found that the likelihood of extinction cascades increased with increasing community
size, particularly under low correlation in species' responses to environmental fluctuations. These
results suggest that species-rich communities may be less robust to increasing levels of
environmental variability than their species-poor counterparts.
The breadth of resource use and the degree of specialization/generalization of interactions
are also likely to influence how community structure and dynamics are influenced by climatic
variability. In particular, greater variability should affect specialists more strongly, because they
depend on fewer resources and hence should be more susceptible to environmental variability, all of
which should favour generalists (MacArthur, 1972; Reyer et al., 2013). In turn, the differential
29
670
675
680
685
690
negative effect of climatic variability on specialists could lead to decreased species richness in the
community (MacArthur, 1972; Vázquez & Stevens, 2004), and to a re-arrangement of the
interaction structure of the community (e.g. increased connectance—the proportion of potential
links that actually occur).
Different functional groups are also likely to respond differently to increased climatic
variation. In an analysis of the responses of North American grassland communities to interannual
variation in precipitation, Cleland et al. (2013) concluded that systems dominated by perennial
plants should be more stable to increasing interannual climatic variation, while systems with many
rare, annual species should exhibit the greatest temporal variability in species composition in
response to increased climatic variability, especially increased interannual variability in
precipitation. In aquatic systems, increased temperature variability has been found to lead to
increased richness of zooplankton in lakes (Shurin et al., 2010), while it led to decreased richness of
phytoplankton in experimental aquatic microcosms (Burgmer & Hillebrand, 2011). Of course, the
contrasting results of the above studies might simply reflect methodological differences of the
studies; but it is also possible that they partly reflect the underlying mechanisms that govern the
dynamics of different functional groups.
In consumer–resource interactions, the relative size of the consumer and the resource
species might also determine the effects of climatic variability on the outcome of interactions and,
therefore, species coexistence. Rohr et al. (2013) have argued that parasites are typically smaller
and their metabolisms faster than their hosts, which would allow them to achieve faster
acclimatization to temperature shifts than their hosts, facilitating their transmission and successful
infection. Several studies provide evidence in favour of this conjecture. For example, increased
climatic temporal variability appears to increase transmission of a fungal parasite of amphibians
believed to be partly responsible for the drastic declines of many amphibian species worldwide
(Rohr & Raffel, 2010; Hamilton et al., 2012; Raffel et al., 2013). Similarly, increased climatic
30
695
700
705
710
715

variability may enhance the transmission of malaria (Zhou et al., 2004; Paaijmans et al., 2010),
dengue (Lambrechts et al., 2011), avian influenza (Liu et al., 2007), and cholera (Rodó et al., 2002).
In addition to the ecological characteristics of the community and the interacting species, the
community's response is also likely to depend on the magnitude of changes in climatic variability
and extremes. Based on an extensive review of the literature on dryland ecosystems, McCluney et
al. (2012) predicted that modest increases in the variability of water availability should lead to
strong bottom-up effects in dryland communities, whereas greater increases in the variability of
water availability should lead to a dominance of top-down effects, and more non-linear and
unpredictable community dynamics.
VI. CONCLUSIONS
(1) Our review indicates that climatic variability can influence biological processes at multiple
scales of biological organization, from individuals to populations and communities, and from
physiological to ecological and evolutionary processes. Although responses to climatic variability
are usually complex and cannot always be generalized, climatic variability represents an important
component of climate with potentially profound biological consequences.
(2) At the level of individual performance, the nonlinear relationship between temperature and
performance implies that the impact of thermal variation on physiological performance will be
contingent on the temperature at which performance peaks. Thus, close to the peak of the
performance function, greater temperature variability should decrease physiological performance,
whereas at the tails of the function greater temperature variability should increase performance. The
relationships among thermal environments, thermal tolerance and population growth may reflect
natural selection on developmental acclimation. Many researchers have examined geographic
variation in thermal tolerance, which indicates that genotypes from higher latitudes tolerate low
temperatures better and recover from thermal shock more rapidly, which probably provides a fitness
31
720
725
730
735
740

advantage. In addition, the ability to recover from thermal shock covaries with environmental
conditions, suggesting that temperature acts as a selective agent. Because environmental
temperature varies over space and time, organisms are continually challenged to maintain
homeostasis. Thus, populations are expected to evolve physiological adaptations to local climatic
conditions in heterogeneous environments.
(3) Functional phenotypic adjustments to changing environmental conditions may occur via
adaptive evolution across generations and/or within-generation adaptive phenotypic plasticity.
Increased environmental variation should select for increased phenotypic plasticity, a prediction
supported by our review of studies on plants. Evolutionary responses to selection on plasticity may
include a shift in the environmental threshold of response, a change in the eliciting cue, increased
magnitude of plasticity (steeper slope of the reaction norm), and even the arrestment or reversion of
phenotypic changes. The mechanisms underlying such phenotypic patterns may include allelic
sensitivity, gene regulation, and epigenetic control. Our conceptual model suggests that the extent to
which increased plasticity is favoured by increased climatic variation would ultimately depend on
the type of selection operating. Thus, directional selection would clearly favour increased plasticity,
while stabilizing selection may render enhanced plasticity maladaptive. However, directional
selection often prevails over stabilizing selection in the wild. Therefore, the advantageous nature of
increased plasticity in the context of increased climatic variation should be verified in most cases.
(4) At the level of populations, the effects of changing climatic variability on population growth can
be predicted with the appropriate modelling tools. Whether the effects of increased climatic
variation are positive or negative depends on such factors as the organism’s life history, the precise
vital rates whose variabilities are changing, the degree of correlation among vital rates, the type of
environmental variability involved (IID versus Markovian), the impact of climate change on
disturbance frequency, and the degree of variation between versus within phases of the disturbance
recovery cycle. Furthermore, changes in the frequencies of extreme values of the vital rates driven
32
745
750
755
760
765

by changes in climatic extremes are also important, as they may affect long-run population growth
in ways that are not well captured by measures of population growth based on ‘small-noise’
approximations. In this case, an alternative approach is the use of computer simulations, drawing
vital rates from the ‘normal’ range of variation with occasional (and perhaps increasingly frequent)
extreme values ‘thrown in’, or by slowly changing the kurtosis (as well as the mean and variance)
of the probability distribution from which each vital rate’s values are drawn. A yet more promising
approach is to link vital rates to environmental drivers, so that climatic extremes will produce vital
rate extremes directly. Computer simulations may be the only feasible way to link complex changes
in climatic means, variabilities, and extremes, as well as biotic interactions and intraspecific density,
to their effects on vital rates, population growth, and the future abundance and distribution of
species.
(5) At the level of species interactions and communities, climate-driven phenological mismatches
are a key mechanism underlying the potential effects of increased climatic variability and extremes.
Increased inter-annual variability and the increased occurrence of climatic extremes may lead to
high year to year variations in the phenological matching of interacting species. The magnitude of
such mismatches is likely to be substantially greater than that generated by gradual changes in
average climatic conditions, which may impose conflicting selective pressures on interacting
species, preventing adaptation and maintaining mismatches in the long run. These climate-driven
phenological mismatches are likely to be especially strong towards the limits of geographic ranges;
thus, it is possible that increased climatic variation could lead to a shrinkage of geographic ranges,
even if average climatic conditions remain unchanged. Our ability to draw generalizations about the
potential effects of increased climatic variability at the level of entire communities is rather limited,
given their inherent complexity; the response of communities to increased climatic variability will
be most likely influenced by the mechanisms regulating coexistence among interacting species, the
type of interaction dominating the organization of the community, the community's species richness,
33
770
775
780
785
790

the relative size and the degree of specialization of the interacting species, the functional groups
involved, and the magnitude of the climatic changes.
(6) To conclude, our review shows that although increased climatic variability is likely to have
important biological consequences, this aspect of climate change has received little attention
compared to changes in climatic averages. Given the prospect of increased climatic variability as a
component of climate change in many locations, there is a clear need to increase research efforts to
understand how this component of climate change influences physiological, ecological and
evolutionary processes.
VII. ACKNOWLEDGMENTS
Funded by grants from FONCYT (PICT-2010-2779) to D.P.V., FONDECYT (1140070) to E.G.,
U.S. National Science Foundation LTREB program to W.F.M., and FONDECYT-1130015 and
CAPES-FB002 line 3 to F.B. The CYTED network ECONS (410RT0406) promoted the discussions
that gave rise to this manuscript.
VIII. REFERENCES
ADDO-BEDIAKO, A., CHOWN, S.L. & GASTON, K.J. (2000). Thermal tolerance, climatic variability
and latitude. Proceedings of the Royal Society of London B 267, 739–745.
ADDO-BEDIAKO, A., CHOWN, S.L. & GASTON, K.J. (2002). Metabolic cold adaptation in insects: a
large-scale perspective. Functional Ecology 16, 332–338.
ADLER, P.B., HILLERISLAMBERS, J., KYRIAKIDIS, P.C., GUAN, Q. & LEVINE, J.M. (2006). Climate
variability has a stabilizing effect on the coexistence of prairie grasses. PNAS 103, 12793–
12798.
ADLER, P.B., HILLERISLAMBERS, J. & LEVINE, J.M. (2009). Weak effect of climate variability on
coexistence in a sagebrush steppe community. Ecology 90, 3303–3312.
34
795
800
805
ALPERT, P. & SIMMS, E.L. (2002). The relative advantages of plasticity and fixity in different
environments: when is it good for a plant to adjust? Evolutionary Ecology 16, 285–297.
ANDERSON, J.T., INOUYE, D.W., MCKINNEY, A.M., COLAUTTI, R.I. & MITCHELL-OLDS, T. (2012).
Phenotypic plasticity and adaptive evolution contribute to advancing flowering phenology in
response to climate change. Proceedings of the Royal Society of London B: Biological
Sciences, rspb20121051.
ANGERT, A.L. (2009). The niche, limits to species’ distributions, and spatiotemporal variation in
demography across the elevation ranges of two monkeyflowers. Proceedings of the National
Academy of Sciences of the United States of America 106 Suppl 2, 19693–19698.
ANGILLETTA, M.J. (2009). Thermal Adaptation: A Theoretical and Empirical Synthesis. Oxford
University Press.
ANGILLETTA, M.J., NIEWIAROWSKI, P.H. & NAVAS, C.A. (2002). The evolution of thermal
physiology in ectotherms. Journal of Thermal Biology 27, 249–268.
ARIAS, M.B., POUPIN, M.J. & LARDIES, M.A. (2011). Plasticity of life-cycle, physiological thermal
traits and Hsp70 gene expression in an insect along the ontogeny: Effect of temperature
variability. Journal of Thermal Biology 36, 355–362.
BATTISTI, A., STASTNY, M., BUFFO, E. & LARSSON, S. (2006). A rapid altitudinal range expansion
in the pine processionary moth produced by the 2003 climatic anomaly. Global Change
Biology 12, 662–671.
BAYTHAVONG, B.S. (2011). Linking the spatial scale of environmental variation and the evolution of
phenotypic plasticity: selection favors adaptive plasticity in fine-grained environments. The
American Naturalist 178, 75–87.
BAYTHAVONG, B.S. & STANTON, M.L. (2010). Characterizing selection on phenotypic plasticity in
response to natural environmental heterogeneity. Evolution 64, 2904–2920.
BENEDETTI-CECCHI, L. (2003). The importance of the variance around the mean effect size of
35

ecological processes. Ecology 84, 2335–2346.
BENEDETTI-CECCHI, L., BERTOCCI, I., VASELLI, S. & MAGGI, E. (2006). Temporal variance reverses
the impact of high mean intensity of stress in climate change experiments. Ecology 87,
2489–2499.
BERTEAUX, D., RÉALE, D., MCADAM, A.G. & BOUTIN, S. (2004). Keeping pace with fast climate
change: can arctic life count on evolution? Integrative and Comparative Biology 44, 140–
151.
BOSSDORF, O., RICHARDS, C.L. & PIGLIUCCI, M. (2008). Epigenetics for ecologists. Ecology
Letters 11, 106–115.
BOTH, C., VAN ASCH, M., BIJLSMA, R.G., VAN DEN BURG, A.B. & VISSER, M.E. (2009). Climate
change and unequal phenological changes across four trophic levels: constraints or
adaptations? The Journal of Animal Ecology 78, 73–83.
BOZINOVIC, F., BASTÍAS, D.A., BOHER, F., CLAVIJO-BAQUET, S., ESTAY, S.A. & ANGILLETTA, M.J.
(2011a). The mean and variance of environmental temperature interact to determine
physiological tolerance and fitness. Physiological and Biochemical Zoology 84, 543–552.
BOZINOVIC, F., CALOSI, P. & SPICER, J.I. (2011b). Physiological correlates of geographic range in
animals. Annual Review of Ecology, Evolution, and Systematics 42, 155–179.
BOZINOVIC, F., CATALÁN, T.P., ESTAY, S.A. & SABAT, P. (2013a). Acclimation to daily thermal
variability drives the metabolic performance curve. Evolutionary Ecology Research 15,
579–587.
BOZINOVIC, F., CATALÁN, T.P. & KALERGIS, A.M. (2013b). Variabilidad inmunológica y ajustes a la
variabilidad térmica ambiental. Revista Chilena de Historia Natural 86, 475–483.
BOZINOVIC, F., ORELLANA, M.J.M., MARTEL, S.I. & BOGDANOVICH, J.M. (2014). Testing the heat-
invariant and cold-variability tolerance hypotheses across geographic gradients.
Comparative Biochemistry and Physiology Part A: Molecular & Integrative Physiology
36

178, 46–50.
BRÄUTIGAM, K., VINING, K.J., LAFON-PLACETTE, C., FOSSDAL, C.G., MIROUZE, M., MARCOS, J.G.,
FLUCH, S., FRAGA, M.F., GUEVARA, M.Á., ABARCA, D., JOHNSEN, Ø., MAURY, S., STRAUSS,
S.H., CAMPBELL, M.M., ROHDE, A., DÍAZ-SALA, C. & CERVERA, M.-T. (2013). Epigenetic
regulation of adaptive responses of forest tree species to the environment. Ecology and
Evolution 3, 399–415.
BRUNET, J. & LARSON-RABIN, Z. (2012). The response of flowering time to global warming in a
high-altitude plant: the impact of genetics and the environment. Botany 90, 319–326.
BURGMER, T. & HILLEBRAND, H. (2011). Temperature mean and variance alter phytoplankton
biomass and biodiversity in a long-term microcosm experiment. Oikos 120, 922–933.
BURROUGHS, W.J. (2007). Climate Change: A Multidisciplinary Approach. Cambridge University
Press.
CARADONNA, P.J., ILER, A.M. & INOUYE, D.W. (2014). Shifts in flowering phenology reshape a
subalpine plant community. Proceedings of the National Academy of Sciences of the United
States of America 111, 4916–4921.
CASWELL, H. (2001). Matrix Population Models: Construction, Analysis, and Interpretation. 2nd
edition. Sinauer Associates, Sunderland, Mass.
CASWELL, H. & KAYE, T.N. (2001). Stochastic demography and conservation of an endangered
perennial plant (Lomatium bradshawii) in a dynamic fire regime. Advances in Ecological
Research 32, 1–51.
CHARMANTIER, A., MCCLEERY, R.H., COLE, L.R., PERRINS, C., KRUUK, L.E.B. & SHELDON, B.C.
(2008). Adaptive phenotypic plasticity in response to climate change in a wild bird
population. Science 320, 800–803.
CHESSON, P. (1994). Multispecies competition in variable environments. Theoretical Population
Biology 45, 227–276.
37

CHESSON, P. (2000). Mechanisms of maintenance of species diversity. Annual Review of Ecology
and Systematics 31, 343–366.
CHEVIN, L.-M., LANDE, R. & MACE, G.M. (2010). Adaptation, plasticity, and extinction in a
changing environment: towards a predictive theory. PLoS Biology 8, e1000357.
CHINNUSAMY, V. & ZHU, J.-K. (2009). Epigenetic regulation of stress responses in plants. Current
Opinion in Plant Biology 12, 133–139.
CHOWN, S.L., GASTON, K.J. & ROBINSON, D. (2004a). Macrophysiology: large-scale patterns in
physiological traits and their ecological implications. Functional Ecology 18, 159–167.
CHOWN, S.L., SINCLAIR, B.J., LEINAAS, H.P. & GASTON, K.J. (2004b). Hemispheric asymmetries in
biodiversity—a serious matter for ecology. PLoS Biology 2, e406.
CLAVIJO-BAQUET, S., BOHER, F., ZIEGLER, L., MARTEL, S.I., ESTAY, S.A. & BOZINOVIC, F. (2014).
Differential responses to thermal variation between fitness metrics. Scientific Reports 4,
5349.
CLELAND, E.E., CHUINE, I., MENZEL, A., MOONEY, H.A. & SCHWARTZ, M.D. (2007). Shifting plant
phenology in response to global change. Trends in Ecology & Evolution 22, 357–365.
CLELAND, E.E., COLLINS, S.L., DICKSON, T.L., FARRER, E.C., GROSS, K.L., GHERARDI, L.A.,
HALLETT, L.M., HOBBS, R.J., HSU, J.S., TURNBULL, L. & SUDING, K.N. (2013). Sensitivity
of grassland plant community composition to spatial vs. temporal variation in precipitation.
Ecology 94, 1687–1696.
CONDON, C.H., CHENOWETH, S.F. & WILSON, R.S. (2010). Zebrafish take their cue from
temperature but not photoperiod for the seasonal plasticity of thermal performance. The
Journal of Experimental Biology 213, 3705–3709.
COOK, S.A. & JOHNSON, M.P. (1968). Adaptation to heterogeneous environments. I. Variation in
heterophylly in Ranunculus flammula L. Evolution 22, 496–516.
COUMOU, D. & RAHMSTORF, S. (2012). A decade of weather extremes. Nature Climate Change 2,
38

491–496.
CRONE, E.E., MENGES, E.S., ELLIS, M.M., BELL, T., BIERZYCHUDEK, P., EHRLÉN, J., KAYE, T.N.,
KNIGHT, T.M., LESICA, P., MORRIS, W.F., OOSTERMEIJER, G., QUINTANA-ASCENCIO, P.F.,
STANLEY, A., TICKTIN, T., VALVERDE, T. & WILLIAMS, J.L. (2011). How do plant ecologists
use matrix population models? Ecology Letters 14, 1–8.
DALLWITZ, R. (1984). The influence of constant and fluctuating temperatures on development rate
and survival of pupae of the Australian sheep blowfly Lucilia cuprina. Entomologia
Experimentalis et Applicata 36, 89–95.
DAVIS, M.B., SHAW, R.G. & ETTERSON, J.R. (2005). Evolutionary responses to changing climate.
Ecology 86, 1704–1714.
DE KROON, H., PLAISIER, A., VAN GROENENDAEL, J. & CASWELL, H. (1986). Elasticity: the relative
contribution of demographic parameters to population growth rate. Ecology 67, 1427–1431.
DESCAMPS-JULIEN, B. & GONZALEZ, A. (2005). Stable coexistence in a fluctuating environment: an
experimental demonstration. Ecology 86, 2815–2824.
DEUTSCH, C.A., TEWKSBURY, J.J., HUEY, R.B., SHELDON, K.S., GHALAMBOR, C.K., HAAK, D.C. &
MARTIN, P.R. (2008). Impacts of climate warming on terrestrial ectotherms across latitude.
Proceedings of the National Academy of Sciences USA 105, 6668–6672.
DEVOTO, M., ZIMMERMANN, M. & MEDAN, D. (2007) Robustness of plant-flower visitor webs to
simulated climate change. Ecología Austral 17, 35–50.
DEWITT, T.J., SIH, A. & WILSON, D.S. (1998). Costs and limits of phenotypic plasticity. Trends in
Ecology & Evolution 13, 77–81.
DOAK, D.F. & MORRIS, W.F. (2010). Demographic compensation and tipping points in climate-
induced range shifts. Nature 467, 959–962.
DOAK, D.F., MORRIS, W.F., PFISTER, C., KENDALL, B.E. & BRUNA, E.M. (2005). Correctly
estimating how environmental stochasticity influences fitness and population growth. The
39

American Naturalist 166, E14–E21.
DOEBLEY, J., STEC, A. & GUSTUS, C. (1995). teosinte branched1 and the origin of maize: evidence
for epistasis and the evolution of dominance. Genetics 141, 333–346.
DUDLEY, S.A. (1996). Differing selection on plant physiological traits in response to environmental
water availability: a test of adaptive hypotheses. Evolution 50, 92–102.
EASTERLING, D.R., MEEHL, G.A., PARMESAN, C., CHANGNON, S.A., KARL, T.R. & MEARNS, L.O.
(2000). Climate extremes: observations, modeling, and impacts. Science 289, 2068–2074.
EDDISON, J.C. & OLLASON, J.G. (1978). Diversity in constant and fluctuating environments. Nature
275, 309–310.
EGG, M., HÖCKNER, M., BRANDSTÄTTER, A., SCHULER, D. & DALLINGER, R. (2009). Structural and
bioinformatic analysis of the Roman snail Cd-Metallothionein gene uncovers molecular
adaptation towards plasticity in coping with multifarious environmental stress. Molecular
Ecology 18, 2426–2443.
EHRLÉN, J. & MORRIS, W.F. (2015). Predicting changes in the distribution and abundance of species
under environmental change. Ecology Letters 18, 303–314.
ENDLER, J.A. (1986). Natural Selection in the Wild. Princeton University Press.
ESTAY, S.A., CLAVIJO-BAQUET, S., LIMA, M. & BOZINOVIC, F. (2011). Beyond average: an
experimental test of temperature variability on the population dynamics of Tribolium
confusum. Population Ecology 53, 53–58.
ESTAY, S.A., LIMA, M. & BOZINOVIC, F. (2014). The role of temperature variability on insect
performance and population dynamics in a warming world. Oikos 123, 131–140.
ETTERSON, J.R. & SHAW, R.G. (2001). Constraint to Adaptive Evolution in Response to Global
Warming. Science 294, 151–154.
FAIRBAIRN, D.J. & YADLOWSKI, D.E. (1997). Coevolution of traits determining migratory
tendency: correlated response of a critical enzyme, juvenile hormone esterase, to selection
40

on wing morphology. Journal of Evolutionary Biology 10, 495–513.
FOLGUERA, G., BASTÍAS, D.A. & BOZINOVIC, F. (2009). Impact of experimental thermal amplitude
on ectotherm performance: Adaptation to climate change variability? Comparative
Biochemistry and Physiology. Part A, Molecular & Integrative Physiology 154, 389–393.
FOLGUERA, G., BASTÍAS, D.A., CAERS, J., ROJAS, J.M., PIULACHS, M.-D., BELLÉS, X. &
BOZINOVIC, F. (2011). An experimental test of the role of environmental temperature
variability on ectotherm molecular, physiological and life-history traits: implications for
global warming. Comparative Biochemistry and Physiology. Part A, Molecular &
Integrative Physiology 159, 242–246.
FRANKS, S.J., SIM, S. & WEIS, A.E. (2007). Rapid evolution of flowering time by an annual plant in
response to a climate fluctuation. Proceedings of the National Academy of Sciences USA
104, 1278–1282.
GARLAND, T. & KELLY, S.A. (2006). Phenotypic plasticity and experimental evolution. Journal of
Experimental Biology 209, 2344–2361.
GEBER, M.A. & GRIFFEN, L.R. (2003). Inheritance and natural selection on functional traits.
International journal of plant sciences 164, S21–S42.
GHALAMBOR, C.K., HUEY, R.B., MARTIN, P.R., TEWKSBURY, J.J. & WANG, G. (2006). Are
mountain passes higher in the tropics? Janzen’s hypothesis revisited. Integrative and
Comparative Biology 46, 5–17.
GHALAMBOR, C.K., MCKAY, J.K., CARROLL, S.P. & REZNICK, D.N. (2007). Adaptive versus non-
adaptive phenotypic plasticity and the potential for contemporary adaptation in new
environments. Functional Ecology 21, 394–407.
GIANOLI, E. (2004). Plasticity of traits and correlations in two populations of Convolvulus arvensis
(Convolvulaceae) differing in environmental heterogeneity. International Journal of Plant
Sciences 165, 825–832.
41

GIANOLI, E. & GONZÁLEZ-TEUBER, M. (2005). Environmental heterogeneity and population
differentiation in plasticity to drought in Convolvulus chilensis (Convolvulaceae).
Evolutionary Ecology 19, 603–613.
GIANOLI, E. & PALACIO-LÓPEZ, K. (2009). Phenotypic integration may constrain phenotypic
plasticity in plants. Oikos 118, 1924–1928.
GIANOLI, E. & VALLADARES, F. (2012). Studying phenotypic plasticity: the advantages of a broad
approach. Biological Journal of the Linnean Society 105, 1–7.
GIENAPP, P., TEPLITSKY, C., ALHO, J.S., MILLS, J.A. & MERILÄ, J. (2008). Climate change and
evolution: disentangling environmental and genetic responses. Molecular Ecology 17, 167–
178.
GILCHRIST, G.W. (1995). Specialists and generalists in changing environments. I. Fitness
landscapes of thermal sensitivity. The American Naturalist 146, 252–270.
GODOY, O., SALDAÑA, A., FUENTES, N., VALLADARES, F. & GIANOLI, E. (2011). Forests are not
immune to plant invasions: phenotypic plasticity and local adaptation allow Prunella
vulgaris to colonize a temperate evergreen rainforest. Biological Invasions 13, 1615–1625.
GORDO, O. & SANZ, J.J. (2010). Impact of climate change on plant phenology in Mediterranean
ecosystems. Global Change Biology 16, 1082–1106.
GOURCILLEAU, D., BOGEAT-TRIBOULOT, M.-B., THIEC, D.L., LAFON-PLACETTE, C., DELAUNAY, A.,
EL-SOUD, W.A., BRIGNOLAS, F. & MAURY, S. (2010). DNA methylation and histone
acetylation: genotypic variations in hybrid poplars, impact of water deficit and relationships
with productivity. Annals of Forest Science 67, 208–208.
GROSS, K., LOCKWOOD, J.R., III, FROST, C.C. & MORRIS, W.F. (1998). Modeling controlled
burning and trampling reduction for conservation of Hudsonia montana. Conservation
Biology 12, 1291–1301.
GUTTELING, E.W., RIKSEN, J. A. G., BAKKER, J. & KAMMENGA, J.E. (2007). Mapping phenotypic
42

plasticity and genotype-environment interactions affecting life-history traits in
Caenorhabditis elegans. Heredity 98, 28–37.
HAMILTON, P.T., RICHARDSON, J.M.L., GOVINDARAJULU, P. & ANHOLT, B.R. (2012). Higher
temperature variability increases the impact of Batrachochytrium dendrobatidis and shifts
interspecific interactions in tadpole mesocosms. Ecology and Evolution 2, 2450–2459.
HARIDAS, C.V. & TULJAPURKAR, S. (2005). Elasticities in variable environments: properties and
implications. The American Naturalist 166, 481–495.
HARRINGTON, R., WOIWOD, I. & SPARKS, T. (1999). Climate change and trophic interactions.
Trends in Ecology & Evolution 14, 146–150.
HARTL, D.L. & DYKHUIZEN, D.E. (1981). Potential for selection among nearly neutral allozymes of
6-phosphogluconate dehydrogenase in Escherichia coli. Proceedings of the National
Academy of Sciences USA 78, 6344–6348.
HEGLAND, S.J., NIELSEN, A., LÁZARO, A., BJERKNES, A.-L. & TOTLAND, Ø. (2009). How does
climate warming affect plant-pollinator interactions? Ecology Letters 12, 184–195.
HERMAN, J.J., SPENCER, H.G., DONOHUE, K. & SULTAN, S.E. (2014). How stable ‘should’
epigenetic modifications be? Insights from adaptive plasticity and bet hedging. Evolution;
International Journal of Organic Evolution 68, 632–643.
HERRERA, C.M., POZO, M.I. & BAZAGA, P. (2012). Jack of all nectars, master of most: DNA
methylation and the epigenetic basis of niche width in a flower-living yeast. Molecular
Ecology 21, 2602–2616.
HESCHEL, M.S., SULTAN, S.E., GLOVER, SUSAN & SLOAN, D. (2004). Population differentiation and
plastic responses to drought stress in the generalist annual Polygonum persicaria.
International Journal of Plant Sciences 165, 817–824.
HOFFMANN, A.A. & SGRÒ, C.M. (2011). Climate change and evolutionary adaptation. Nature 470,
479–485.
43

HOLESKI, L.M., JANDER, G. & AGRAWAL, A.A. (2012). Transgenerational defense induction and
epigenetic inheritance in plants. Trends in Ecology & Evolution 27, 618–626.
HOLLANDER, J. (2008). Testing the grain-size model for the evolution of phenotypic plasticity.
Evolution 62, 1381–1389.
HOLT, R.D. (1977). Predation, apparent competition, and the structure of prey communities.
Theoretical Population Biology 12, 197–229.
HORVITZ, C.C., TULJAPURKAR, S. & PASCARELLA, J.B. (2005). Plant-animal interactions in random
environments: habitat-stage elasticity, seed predators, and hurricanes. Ecology 86, 3312–
3322.
HUEY, R.B. & KINGSOLVER, J.G. (1989). Evolution of thermal sensitivity of ectotherm
performance. Trends in Ecology & Evolution 4, 131–135.
INOUYE, D.W. (2008). Effects of climate change on phenology, frost damage, and floral abundance
of montane wildflowers. Ecology 89, 353–362.
JENTSCH, A., KREYLING, J. & BEIERKUHNLEIN, C. (2007). A new generation of climate-change
experiments: events, not trends. Frontiers in Ecology and the Environment 5, 365–374.
JIANG, L. & MORIN, P.J. (2007). Temperature fluctuation facilitates coexistence of competing
species in experimental microbial communities. Journal of Animal Ecology 76, 660–668.
JUMP, A.S. & PEÑUELAS, J. (2005). Running to stand still: adaptation and the response of plants to
rapid climate change. Ecology Letters 8, 1010–1020.
KANERYD, L., BORRVALL, C., BERG, S., CURTSDOTTER, A., EKLÖF, A., HAUZY, C., JONSSON, T.,
MÜNGER, P., SETZER, M., SÄTERBERG, T. & EBENMAN, B. (2012). Species-rich ecosystems
are vulnerable to cascading extinctions in an increasingly variable world. Ecology and
Evolution 2, 858–874.
KASSAHN, K.S., DANG, V.T., WILKINS, S.J., PERKINS, A.C. & RAGAN, M.A. (2009). Evolution of
gene function and regulatory control after whole-genome duplication: comparative analyses
44

in vertebrates. Genome Research 19, 1404–1418.
KIM, D.-H. & SUNG, S. (2012). Environmentally coordinated epigenetic silencing of FLC by
protein and long noncoding RNA components. Current Opinion in Plant Biology 15, 51–56.
KINGSOLVER, J.G., HOEKSTRA, H.E., HOEKSTRA, J.M., BERRIGAN, D., VIGNIERI, S.N., HILL, C.E.,
HOANG, A., GIBERT, P. & BEERLI, P. (2001). The strength of phenotypic selection in natural
populations. The American Naturalist 157, 245–261.
KINGSOLVER, J.G., MASSIE, K.R., SHLICHTA, J.G., SMITH, M.H., RAGLAND, G.J. &
GOMULKIEWICZ, R. (2007). Relating environmental variation to selection on reaction norms:
an experimental test. The American Naturalist 169, 163–174.
KJÆRSGAARD, A., PERTOLDI, C., LOESCHCKE, V. & BLANCKENHORN, W.U. (2013). The effect of
fluctuating temperatures during development on fitness-related traits of Scatophaga
stercoraria (Diptera: Scathophagidae). Environmental Entomology 42, 1069–1078.
KLIEBENSTEIN, D.J., FIGUTH, A. & MITCHELL-OLDS, T. (2002). Genetic architecture of plastic
methyl jasmonate responses in Arabidopsis thaliana. Genetics 161, 1685–1696.
KLOK, C.J. & CHOWN, S.L. (2003). Resistance to temperature extremes in sub-Antarctic weevils:
interspecific variation, population differentiation and acclimation. Biological Journal of the
Linnean Society 78, 401–414.
KNAPP, A.K., FAY, P.A., BLAIR, J.M., COLLINS, S.L., SMITH, M.D., CARLISLE, J.D., HARPER, C.W.,
DANNER, B.T., LETT, M.S. & MCCARRON, J.K. (2002). Rainfall variability, carbon cycling,
and plant species diversity in a mesic grassland. Science 298, 2202–2205.
KUANG, J.J. & CHESSON, P. (2009). Coexistence of annual plants: generalist seed predation
weakens the storage effect. Ecology 90, 170–182.
LACEY, E.P., LOVIN, M.E., RICHTER, S.J. & HERINGTON, D.A. (2010). Floral reflectance, color, and
thermoregulation: what really explains geographic variation in thermal acclimation ability of
ectotherms? The American Naturalist 175, 335–349.
45

LAMBRECHTS, L., PAAIJMANS, K.P., FANSIRI, T., CARRINGTON, L.B., KRAMER, L.D., THOMAS,
M.B. & SCOTT, T.W. (2011). Impact of daily temperature fluctuations on dengue virus
transmission by Aedes aegypti. Proceedings of the National Academy of Sciences 108,
7460–7465.
LAMBRECHTS, M.M. & PERRET, P. (2000). A long photoperiod overrides non-photoperiodic factors
in blue tits’ timing of reproduction. Proceedings. Biological Sciences / The Royal Society
267, 585–588.
LANGERHANS, R.B. & DEWITT, T.J. (2002). Plasticity constrained: over-generalized induction cues
cause maladaptive phenotypes. Evolutionary Ecology Research 4, 857–870.
LAWTON, J.H. (1999). Are there general laws in ecology? Oikos 84, 177.
LÁZARO-NOGAL, A., MATESANZ, S., GODOY, A., PÉREZ-TRAUTMAN, F., GIANOLI, E. &
VALLADARES, F. (2015). Environmental heterogeneity leads to higher plasticity in dry-edge
populations of a semi-arid Chilean shrub: insights into climate change responses. Journal of
Ecology 103, 338–350.
LEWONTIN, R.C. & COHEN, D. (1969). On population growth in a randomly varying environment.
Proceedings of the National Academy of Sciences USA 62, 1056–1060.
LIND, M.I. & JOHANSSON, F. (2007). The degree of adaptive phenotypic plasticity is correlated with
the spatial environmental heterogeneity experienced by island populations of Rana
temporaria. Journal of Evolutionary Biology 20, 1288–1297.
LIU, C.-M., LIN, S.-H., CHEN, Y.-C., LIN, K.C.-M., WU, T.-S.J. & KING, C.-C. (2007). Temperature
drops and the onset of severe avian influenza a h5n1 virus outbreaks. PLoS ONE 2, e191.
LIU, Y., ZHANG, L., NIU, H., SUN, Y. & XU, X. (2014). Habitat-specific differences in plasticity of
foliar δ13C in temperate steppe grasses. Ecology and Evolution 4, 648–655.
MACARTHUR, R.H. (1972). Geographical Ecology. Princeton University Press, Princeton.
MATESANZ, S., GIANOLI, E. & VALLADARES, F. (2010). Global change and the evolution of
46

phenotypic plasticity in plants. Annals of the New York Academy of Sciences 1206, 35–55.
MCCLUNEY, K.E., BELNAP, J., COLLINS, S.L., GONZÁLEZ, A.L., HAGEN, E.M., NATHANIEL
HOLLAND, J., KOTLER, B.P., MAESTRE, F.T., SMITH, S.D. & WOLF, B.O. (2012). Shifting
species interactions in terrestrial dryland ecosystems under altered water availability and
climate change. Biological Reviews 87, 563–582.
MCKONE, M.J., KELLY, D. & LEE, W.G. (1998). Effect of climate change on mast-seeding species:
frequency of mass flowering and escape from specialist insect seed predators. Global
Change Biology 4, 591–596.
MEEHL, G.A., STOCKER, T.F.C., W. D., FRIEDLINGSTEIN, P., GAYE, A.T.G., J. M., KITOH, A.,
KNUTTI, R., MURPHY, J.M., NODA, A., RAPER, S.C.B., WATTERSON, I.G., WEAVER, A.J. &
ZHAO, Z.-C. (2007). Global climate projections. In Climate Change 2007: The Physical
Science Basis. Contribution of Working Group I to the Fourth Assessment Report of the
Intergovernmental Panel on Climate Change (eds S. SOLOMON, D. QIN, M. MANNING, Z.
CHEN, M. MARQUIS, K.B. AVERYT, M. TIGNOR & H.L. MILLER), pp. 747–846. Cambridge
University Press.
MEMMOTT, J., CRAZE, P.G., WASER, N.M. & PRICE, M.V. (2007). Global warming and the
disruption of plant-pollinator interactions. Ecology Letters 10, 710–717.
MENGES, E.S. & QUINTANA-ASCENCIO, P.F. (2004). Population viability with fire in Eryngium
cuneifolium: deciphering a decade of demographic data. Ecological Monographs 74, 79–99.
MENGES, E.S., QUINTANA ASCENCIO, P.F., WEEKLEY, C.W. & GAOUE, O.G. (2006). Population
viability analysis and fire return intervals for an endemic Florida scrub mint. Biological
Conservation 127, 115–127.
MILLER-RUSHING, A.J., INOUYE, D.W. & PRIMACK, R.B. (2008). How well do first flowering dates
measure plant responses to climate change? The effects of population size and sampling
frequency. Journal of Ecology 96, 1289–1296.
47

MOLINA-MONTENEGRO, M.A., ATALA, C. & GIANOLI, E. (2010). Phenotypic plasticity and
performance of Taraxacum officinale (dandelion) in habitats of contrasting environmental
heterogeneity. Biological Invasions 12, 2277–2284.
MOLINA-MONTENEGRO, M.A. & NAYA, D.E. (2012). Latitudinal patterns in phenotypic plasticity
and fitness-related traits: assessing the climatic variability hypothesis (CVH) with an
invasive plant species. PLoS ONE 7, e47620.
MORRIS, W.F. & DOAK, D.F. (2002). Quantitative Conservation Biology: Theory and Practice of
Population Viability Analysis1 edition. Sinauer Associates, Sunderland, Mass.
MORRIS, W.F. & DOAK, D.F. (2004). Buffering of life histories against environmental stochasticity:
accounting for a spurious correlation between the variabilities of vital rates and their
contributions to fitness. The American Naturalist 163, 579–590.
MORRIS, W.F., PFISTER, C.A., TULJAPURKAR, S., HARIDAS, C.V., BOGGS, C.L., BOYCE, M.S.,
BRUNA, E.M., CHURCH, D.R., COULSON, T., DOAK, D.F., FORSYTH, S., GAILLARD, J.-M.,
HORVITZ, C.C., KALISZ, S., KENDALL, B.E., KNIGHT, T.M., LEE, C.T. & MENGES, E.S.
(2008). Longevity can buffer plant and animal populations against changing climatic
variability. Ecology 89, 19–25.
MORRIS, W.F., TULJAPURKAR, S., HARIDAS, C.V., MENGES, E.S., HORVITZ, C.C. & PFISTER, C.A.
(2006). Sensitivity of the population growth rate to demographic variability within and
between phases of the disturbance cycle. Ecology Letters 9, 1331–1341.
ORCUTT, J.D. & PORTER, K.G. (1983). Diel vertical migration by zooplankton: constant and
fluctuating temperature effects on life history parameters of Daphnia. Limnological
Oceanography 28, 720–730.
OZGUL, A., CHILDS, D.Z., OLI, M.K., ARMITAGE, K.B., BLUMSTEIN, D.T., OLSON, L.E.,
TULJAPURKAR, S. & COULSON, T. (2010). Coupled dynamics of body mass and population
growth in response to environmental change. Nature 466, 482–485.
48

PAAIJMANS, K.P., BLANFORD, S., BELL, A.S., BLANFORD, J.I., READ, A.F. & THOMAS, M.B. (2010).
Influence of climate on malaria transmission depends on daily temperature variation.
Proceedings of the National Academy of Sciences USA 107, 15135–15139.
PARMESAN, C. (2006). Ecological and evolutionary responses to recent climate change. Annual
Review of Ecology, Evolution, and Systematics 37, 637–669.
PARMESAN, C., RYRHOLM, N., STEFANESCU, C., HILL, J.K., THOMAS, C.D., DESCIMON, H.,
HUNTLEY, B., KAILA, L., KULLBERG, J., TAMMARU, T., TENNENT, W.J., THOMAS, J.A. &
WARREN, M. (1999). Poleward shifts in geographical ranges of butterfly species associated
with regional warming. Nature 399, 579–583.
PARMESAN, C. & YOHE, G. (2003). A globally coherent fingerprint of climate change impacts
across natural systems. Nature 421, 37–42.
PARSELL, D.A. & LINDQUIST, S. (1994). Heat shock proteins and stress tolerance. In The Biology of
Heat Shock Proteins and Molecular Chaperones (eds R.I. MORIMOTO, A. TISSIERES &
GEORGOPOULOS), pp. 457–494. ColdSpring Harbor Laboratory Press, ColdSpring Harbor.
PÉTAVY, G., DAVID, J., DEBAT, V., GIBERT, P. & MORETEAU, B. (2004). Specific effects of cycling
stressful temperatures upon phenotypic and genetic variability of size traits in Drosophila
melanogaster. Evolutionary Ecology Research 6, 873–890.
PFISTER, C.A. (1998). Patterns of variance in stage-structured populations: Evolutionary predictions
and ecological implications. Proceedings of the National Academy of Sciences USA 95, 213–
218.
PIGLIUCCI, M. (2001). Phenotypic Plasticity: Beyond Nature and Nurture. Johns Hopkins
University Press.
PIGLIUCCI, M. & SCHLICHTING, C.D. (1996). Reaction norms of Arabidopsis IV. Relationships
between plasticity and fitness. Heredity 76 ( Pt 5), 427–436.
PLARD, F., GAILLARD, J.-M., COULSON, T., HEWISON, A.J.M., DELORME, D., WARNANT, C. &
49

BONENFANT, C. (2014). Mismatch between birth date and vegetation phenology slows the
demography of roe deer. PLoS Biology 12, e1001828–e1001828.
POST, E. (2013). Ecology of Climate Change: The Importance of Biotic Interactions. Princeton
University Press, Princeton.
POST, E., PETERSON, R.O., STENSETH, N.C. & MCLAREN, B.E. (1999). Ecosystem consequences of
wolf behavioural response to climate. Nature 401, 905–907.
POUNDS, J.A., BUSTAMANTE, M.R., COLOMA, L.A., CONSUEGRA, J.A., FOGDEN, M.P.L., FOSTER,
P.N., LA MARCA, E., MASTERS, K.L., MERINO-VITERI, A., PUSCHENDORF, R., RON, S.R.,
SÁNCHEZ-AZOFEIFA, G.A., STILL, C.J. & YOUNG, B.E. (2006). Widespread amphibian
extinctions from epidemic disease driven by global warming. Nature 439, 161–167.
POWELL, J.A. & LOGAN, J.A. (2005). Insect seasonality: circle map analysis of temperature-driven
life cycles. Theoretical Population Biology 67, 161–179.
PRATT, J.D. & MOONEY, K.A. (2013). Clinal adaptation and adaptive plasticity in Artemisia
californica: implications for the response of a foundation species to predicted climate
change. Global Change Biology 19, 2454–2466.
RAFFEL, T.R., ROMANSIC, J.M., HALSTEAD, N.T., MCMAHON, T.A., VENESKY, M.D. & ROHR, J.R.
(2013). Disease and thermal acclimation in a more variable and unpredictable climate.
Nature Climate Change 3, 146–151.
RÉALE, D., MCADAM, A.G., BOUTIN, S. & BERTEAUX, D. (2003). Genetic and plastic responses of a
northern mammal to climate change. Proceedings of the Royal Society B 270, 591–596.
REED, T.E., WAPLES, R.S., SCHINDLER, D.E., HARD, J.J. & KINNISON, M.T. (2010). Phenotypic
plasticity and population viability: the importance of environmental predictability.
Proceedings of the Royal Society B, rspb20100771.
REYER, C.P.O., LEUZINGER, S., RAMMIG, A., WOLF, A., BARTHOLOMEUS, R.P., BONFANTE, A.,
LORENZI, F., DURY, M., GLONING, P., ABOUT JAOUDÉ, R., KLEIN, T., KUSTER, T.M.,
50

MARTINS, M., NIEDRIST, G., RICCIARDI, M., WOHLFAHRT, G., DE ANGELIS, P., DE DATO,
G., FRANÇOIS, L., MENZEL, A. & PEREIRA, M. (2013). A plant’s perspective of extremes:
terrestrial plant responses to changing climatic variability. Global Change Biology 19, 75–
89.
RICHARDS, E.J. (2006). Inherited epigenetic variation — revisiting soft inheritance. Nature Reviews
Genetics 7, 395–401.
RIVERA-GÓMEZ, N., SEGOVIA, L. & PÉREZ-RUEDA, E. (2011). Diversity and distribution of
transcription factors: their partner domains play an important role in regulatory plasticity in
bacteria. Microbiology 157, 2308–2318.
RODÓ, X., PASCUAL, M., FUCHS, G. & FARUQUE, A.S.G. (2002). ENSO and cholera: A
nonstationary link related to climate change? Proceedings of the National Academy of
Sciences 99, 12901–12906.
ROHR, J.R. & RAFFEL, T.R. (2010). Linking global climate and temperature variability to
widespread amphibian declines putatively caused by disease. Proceedings of the National
Academy of Sciences 107, 8269–8274.
ROHR, J.R., RAFFEL, T.R., BLAUSTEIN, A.R., JOHNSON, P.T.J., PAULL, S.H. & YOUNG, S. (2013).
Using physiology to understand climate-driven changes in disease and their implications for
conservation. Conservation Physiology 1, cot022.
ROOT, T.L., PRICE, J.T., HALL, K.R., SCHNEIDER, S.H., ROSENZWEIG, C. & POUNDS, J.A. (2003).
Fingerprints of global warming on wild animals and plants. Nature 421, 57–60.
RUEL, J.J. & AYRES, M.P. (1999). Jensen’s inequality predicts effects of environmental variation.
Trends in Ecology & Evolution 14, 361–366.
SALDAÑA, A., LUSK, C.H., GONZÁLES, W.L. & GIANOLI, E. (2007). Natural selection on
ecophysiological traits of a fern species in a temperate rainforest. Evolutionary Ecology 21,
651–662.
51

SATTERTHWAITE, W.H., MENGES, E.S. & QUINTANA-ASCENCIO, P.F. (2002). Assessing scrub
buckwheat population viability in relation to fire using multiple modeling techniques.
Ecological Applications 12, 1672–1687.
SCHAPER, S.V., DAWSON, A., SHARP, P.J., GIENAPP, P., CARO, SAMUEL P. & VISSER, M.E. (2012).
Increasing temperature, not mean temperature, is a cue for avian timing of reproduction. The
American Naturalist 179, E55–E69.
SCHAUBER, E.M., KELLY, D., TURCHIN, P., SIMON, C., LEE, W.G., ALLEN, R.B., PAYTON, I.J.,
WILSON, P.R., COWAN, P.E. & BROCKIE, R.E. (2002). Masting by eighteen New Zealand
plant species: the role of temperature as a synchronizing cue. Ecology 83, 1214–1225.
SCHEINER, S.M. & CALLAHAN, H.S. (1999). Measuring natural selection on phenotypic plasticity.
Evolution 53, 1704–1713.
SCHEINER, S.M. & HOLT, R.D. (2012). The genetics of phenotypic plasticity. X. Variation versus
uncertainty. Ecology and Evolution 2, 751–767.
SCHEINER, S.M. & LYMAN, R.F. (1991). The genetics of phenotypic plasticity. II. Response to
selection. Journal of Evolutionary Biology 4, 23–50.
SCHLICHTING, C.D. (2008). Hidden reaction norms, cryptic genetic variation, and evolvability.
Annals of the New York Academy of Sciences 1133, 187–203.
SCHLICHTING, C.D. & PIGLIUCCI, M. (1998). Phenotypic Evolution: A Reaction Norm Perspective.
Sinauer Associates, Sunderland.
SCHMALHAUSEN, I.I. (1949). Factors of Evolution: The Theory of Stabilizing Selection. Blakiston,
Philadelphia.
SEEBACHER, F. (2005). A review of thermoregulation and physiological performance in reptiles:
what is the role of phenotypic flexibility? Journal of Comparative Physiology. B,
Biochemical, Systemic, and Environmental Physiology 175, 453–461.
SHURIN, J.B., WINDER, M., ADRIAN, R., KELLER, W.B., MATTHEWS, B., PATERSON, A.M.,
52

PATERSON, M.J., PINEL-ALLOUL, B., RUSAK, J.A. & YAN, N.D. (2010). Environmental
stability and lake zooplankton diversity - contrasting effects of chemical and thermal
variability. Ecology Letters 13, 453–463.
SIDDIQUI, W.H. & BARLOW, C.A. (1972). Population growth of Drosophila melanogaster (Diptera:
Drosophilidae) at constant and alternating temperatures. Annals of the Entomological
Society of America 65, 993–1001.
SIDDIQUI, W.H., BARLOW, C.A. & RANDOLPH, P.A. (1973). Effects of some constant and alternating
temperatures on population growth of the pea aphid, Acyrthosiphon pisum (Homoptera:
Aphididae). The Canadian Entomologist 105, 145–156.
SINCLAIR, B.J., ADDO-BEDIAKO, A. & CHOWN, S.L. (2003). Climatic variability and the evolution
of insect freeze tolerance. Biological Reviews 78, 181–195.
SINGER, M.C. & PARMESAN, C. (2010). Phenological asynchrony between herbivorous insects and
their hosts: signal of climate change or pre-existing adaptive strategy? Philosophical
Transactions of the Royal Society of London B: Biological Sciences 365, 3161–3176.
SKELLY, D.K., JOSEPH, L.N., POSSINGHAM, H.P., FREIDENBURG, L.K., FARRUGIA, T.J., KINNISON,
M.T. & HENDRY, A.P. (2007). Evolutionary responses to climate change. Conservation
Biology 21, 1353–1355.
SOMERO, G.N. (1995). Proteins and temperature. Annual Review of Physiology 57, 43–68.
SØRENSEN, J.G., MICHALAK, P., JUSTESEN, J. & LOESCHCKE, V. (1999). Expression of the heat-
shock protein HSP70 in Drosophila buzzatii lines selected for thermal resistance. Hereditas
131, 155–164.
SPICER, J.I. & GASTON, K.J. (1999). Physiological Diversity: Ecological Implications. Blackwell,
Oxford.
STIREMAN, J.O., DYER, L.A., JANZEN, D.H., SINGER, M.S., LILL, J.T., MARQUIS, R.J., RICKLEFS,
R.E., GENTRY, G.L., HALLWACHS, W., COLEY, P.D., BARONE, J.A., GREENEY, H.F.,
53

CONNAHS, H., BARBOSA, P., MORAIS, H.C. & DINIZ, I.R. (2005). Climatic unpredictability
and parasitism of caterpillars: Implications of global warming. Proceedings of the National
Academy of Sciences of the United States of America 102, 17384–17387.
SULTAN, S.E. & BAZZAZ, F.A. (1993). Phenotypic plasticity in polygonum persicaria. II. Norms of
reaction to soil moisture and the maintenance of genetic diversity. Evolution 47, 1032–1049.
THOMAS, C.D., CAMERON, A., GREEN, R.E., BAKKENES, M., BEAUMONT, L.J., COLLINGHAM, Y.C.,
ERASMUS, B.F.N., FERREIRA DE SIQUEIRA, M., GRAINGER, A., HANNAH, L., HUGHES, L.,
HUNTLEY, B., VAN JAARSVELD, A.S., MIDGLEY, G.F., MILES, L., ORTEGA-HUERTA, M.A.,
PETERSON, A.T., PHILLIPS, O.L. & WILLIAMS, S.E. (2004). Extinction risk from climate
change. Nature 427, 145–148.
THOMPSON, R.M., BEARDALL, J., BERINGER, J., GRACE, M. & SARDINA, P. (2013). Means and
extremes: building variability into community-level climate change experiments. Ecology
Letters 16, 799–806.
TRENBERTH, K.E. (2011). Changes in precipitation with climate change. Climate Research 47, 123–
138.
TULJAPURKAR, S. (1990). Population dynamics in variable environments. Springer-Verlag, New
York.
TULJAPURKAR, S. & HARIDAS, C.V. (2006). Temporal autocorrelation and stochastic population
growth. Ecology Letters 9, 327–337.
TULJAPURKAR, S., HORVITZ, C.C. & PASCARELLA, J.B. (2003). The many growth rates and
elasticities of populations in random environments. The American Naturalist 162, 489–502.
TYLIANAKIS, J.M., DIDHAM, R.K., BASCOMPTE, J. & WARDLE, D.A. (2008). Global change and
species interactions in terrestrial ecosystems. Ecology Letters 11, 1351–1363.
VALLADARES, F., GIANOLI, E. & GÓMEZ, J.M. (2007). Ecological limits to plant phenotypic
plasticity. New Phytologist 176, 749–763.
54

VALTONEN, A., AYRES, M.P., ROININEN, H., PÖYRY, J. & LEINONEN, R. (2011). Environmental
controls on the phenology of moths: predicting plasticity and constraint under climate
change. Oecologia 165, 237–248.
VAN DEN HEUVEL, J., SAASTAMOINEN, M., BRAKEFIELD, P.M., KIRKWOOD, T.B.L., ZWAAN, B.J. &
SHANLEY, D.P. (2013). The predictive adaptive response: modeling the life-history evolution
of the butterfly Bicyclus anynana in seasonal environments. The American Naturalist 181,
E28–E42.
VAN KLEUNEN, M. & FISCHER, M. (2005). Constraints on the evolution of adaptive phenotypic
plasticity in plants. New Phytologist 166, 49–60.
VAN STRIEN, A.J., PLANTENGA, W.F., SOLDAAT, L.L., VAN SWAAY, C.A.M. & WALLISDEVRIES,
M.F. (2008). Bias in phenology assessments based on first appearance data of butterflies.
Oecologia 156, 227–235.
VASSEUR, D.A., DELONG, J.P., GILBERT, B., GREIG, H.S., HARLEY, C.D.G., MCCANN, K.S.,
SAVAGE, V., TUNNEY, T.D. & O’CONNOR, M.I. (2014). Increased temperature variation
poses a greater risk to species than climate warming. Proceedings of the Royal Society B
281, 20132612.
VÁZQUEZ, D.P. & STEVENS, R.D. (2004). The latitudinal gradient in niche breadth: concepts and
evidence. The American Naturalist 164, E1–E19.
VEDDER, O. (2012). Individual birds advance offspring hatching in response to increased
temperature after the start of laying. Oecologia 170, 619–628.
VILLELLAS, J., EHRLÉN, J., OLESEN, J.M., BRAZA, R. & GARCÍA, M.B. (2013a). Plant performance
in central and northern peripheral populations of the widespread Plantago coronopus.
Ecography 36, 136–145.
VILLELLAS, J., MORRIS, W.F. & GARCÍA, M.B. (2013b). Variation in stochastic demography
between and within central and peripheral regions in a widespread short-lived herb. Ecology
55

94, 1378–1388.
VISSER, M.E. (2008). Keeping up with a warming world; assessing the rate of adaptation to climate
change. Proceedings. Biological Sciences / The Royal Society 275, 649–659.
VISSER, M.E. & BOTH, C. (2005). Shifts in phenology due to global climate change: the need for a
yardstick. Proceedings of the Royal Society B 272, 2561–2569.
VISSER, M.E., BOTH, C. & LAMBRECHTS, M.M. (2004). Global climate change leads to mistimed
avian reproduction. Advances in Ecological Research 35, 89–110.
VISSER, M.E., NOORDWIJK, A.J. VAN, TINBERGEN, J.M. & LESSELLS, C.M. (1998). Warmer springs
lead to mistimed reproduction in great tits (Parus major). Proceedings of the Royal Society
B 265, 1867–1870.
VISSER, M.E., SCHAPER, S.V., HOLLEMAN, L.J.M., DAWSON, A., SHARP, P., GIENAPP, P. & CARO,
S.P. (2011). Genetic variation in cue sensitivity involved in avian timing of reproduction.
Functional Ecology 25, 868–877.
WALTHER, G.-R., GRITTI, E.S., BERGER, S., HICKLER, T., TANG, Z. & SYKES, M.T. (2007). Palms
tracking climate change. Global Ecology and Biogeography 16, 801–809.
WEIS, A.E. & GORMAN, W.L. (1990). Measuring selection on reaction norms: an exploration of the
Eurosta-Solidago system. Evolution 44, 820–831.
WOODWARD, G., BENSTEAD, J.P., BEVERIDGE, O.S., BLANCHARD, J., BREY, T., BROWN, L.E., ET
AL. (2010). Ecological networks in a changing climate. Advances in Ecological Research 42,
71–138.
WU, R. (1998). The detection of plasticity genes in heterogeneous environments. Evolution 52,
967–977.
YANG, L.H. & RUDOLF, V.H.W. (2010). Phenology, ontogeny and the effects of climate change on
the timing of species interactions. Ecology Letters 13, 1–10.
ZHOU, G., MINAKAWA, N., GITHEKO, A.K. & YAN, G. (2004). Association between climate
56

variability and malaria epidemics in the East African highlands. Proceedings of the National
Academy of Sciences of the United States of America 101, 2375–2380.
IX. APPENDIX A1: USING TULJAPURKAR’S (1990) ‘SMALL-NOISE’
APPROXIMATION TO UNDERSTAND THE INFLUENCE OF INCREASED VARIANCE
OF VITAL RATES ON THE STOCHASTIC POPULATION GROWTH RATE
In this appendix, we explain how, in the case of independently and identically distributed (IID)
environmental variation, the predictions about whether increased variance of a vital rate will
increase or decrease the long-term stochastic population growth rate λs can be understood in
terms of Tuljapurkar’s (1990) ‘small-noise’ approximation.
A population projection matrix integrates the effects of the vital rates into a single measure
of the population growth rate. Much of the population theory that describes the effect of
environmental variation on population growth relies on Tuljapurkar’s (1990) ‘small-noise’
approximation, derived using a stochastic projection matrix model and assuming the vital rate
variances are not too large (hence ‘small noise’). In its simplest form, Tuljapurkar’s approximation
relates the long-run stochastic population growth rate λ s to the means, standard deviations, and
correlations among vital rates as follows:
log λs≈ log λ̄−1
2 λ̄2 ∑i , j
S iS j σ i σ j ρi , j .
[Note that this version of the approximation is written in terms of the underlying vital rates,
accounting for the effects that each vital rate may have on multiple elements in the projection
matrix; see Doak et al. (2005). For an alternative version based directly on the matrix elements, see
Caswell (2001).] The means of the vital rates affect λ̄ , the asymptotic population growth rate
57
810
815
820
825
830

predicted by the average of all the annual projection matrices. The sum is taken over all the vital
rate pairs i,j. The sensitivity S i is the slope of a graph of λ̄ versus vital rate i at that vital
rate’s current value (mathematically, it is the partial derivative of λ̄ with respect to the vital rate,
evaluated at that rate’s current value and keeping all other vital rates fixed). Sensitivity measures the
influence that each vital rate has on the population growth rate. The sensitivities appear in the
‘small-noise’ approximation because we must weigh the impact of variation in the vital rates by the
influence that each vital rate has upon annual population growth rate in order to predict the amount
of temporal variation in annual population growth, which is what affects the long-run growth rate
λs . Temporal variation in low-sensitivity vital rates will produce less variation in the annual
population growth rate than will variation in high-sensitivity vital rates. The sensitivities are
computed directly from the mean projection matrix, just as λ̄ is, so they are influenced only by
the means of the vital rates. The parameters σ i and σ j are the standard deviations of the two
vital rates, and ρij is the coefficient of correlation between vital rates i and j, positive values
indicating that the two rates tend to be relatively high in the same years (and relatively low in the
same years), and negative values meaning one tends to be low when the other is high. This simple
version of the ‘small-noise’ approximation assumes that there is no correlation in environmental
conditions across years (that is, we imagine choosing at random from a set of vital rate values each
year, without regard to whether we chose favourable or unfavourable rates in the previous year).
The ‘small-noise’ approximation becomes even simpler in the special case in which vital
rates vary independently of one another, so that the correlation ρij is zero except when i = j, and
then it equals one. Thus, the term for vital rate i within the sum becomes simply S i2σ i
2 , the
product of the squared sensitivity and the variance of the vital rate, which is always positive.
Because the entire sum is then positive, the minus sign in front of it means that an increase in the
variances of the vital rates will cause a decrease in the long-run population growth rate relative to
the rate ( λ̄ ) that would occur in the absence of environmental variability. So, independent
58
835
840
845
850
855
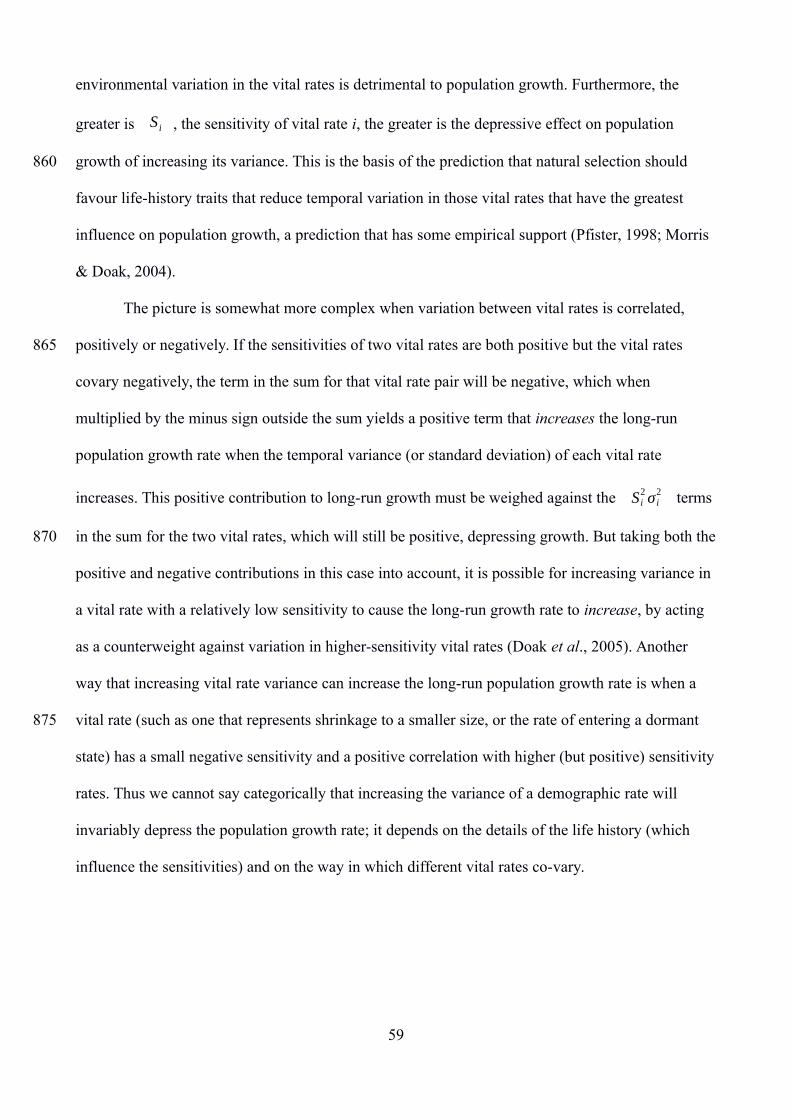
environmental variation in the vital rates is detrimental to population growth. Furthermore, the
greater is S i , the sensitivity of vital rate i, the greater is the depressive effect on population
growth of increasing its variance. This is the basis of the prediction that natural selection should
favour life-history traits that reduce temporal variation in those vital rates that have the greatest
influence on population growth, a prediction that has some empirical support (Pfister, 1998; Morris
& Doak, 2004).
The picture is somewhat more complex when variation between vital rates is correlated,
positively or negatively. If the sensitivities of two vital rates are both positive but the vital rates
covary negatively, the term in the sum for that vital rate pair will be negative, which when
multiplied by the minus sign outside the sum yields a positive term that increases the long-run
population growth rate when the temporal variance (or standard deviation) of each vital rate
increases. This positive contribution to long-run growth must be weighed against the S i2σ i
2 terms
in the sum for the two vital rates, which will still be positive, depressing growth. But taking both the
positive and negative contributions in this case into account, it is possible for increasing variance in
a vital rate with a relatively low sensitivity to cause the long-run growth rate to increase, by acting
as a counterweight against variation in higher-sensitivity vital rates (Doak et al., 2005). Another
way that increasing vital rate variance can increase the long-run population growth rate is when a
vital rate (such as one that represents shrinkage to a smaller size, or the rate of entering a dormant
state) has a small negative sensitivity and a positive correlation with higher (but positive) sensitivity
rates. Thus we cannot say categorically that increasing the variance of a demographic rate will
invariably depress the population growth rate; it depends on the details of the life history (which
influence the sensitivities) and on the way in which different vital rates co-vary.
59
860
865
870
875

Table 1. A sample of studies addressing phenotypic plasticity in plant functional traits in response to treatments of water or temperature. Experimental
plants came from populations with contrasting temporal heterogeneity in soil moisture or temperature. In Outcome, + indicates greater plasticity in the
population(s) from the more variable habitat(s), – indicates the opposite, and 0 refers to no differences in plasticity among populations. N pop =
number of populations. Overall, there was a statistically significant trend for populations from more heterogeneous environments to show increased
phenotypic plasticity (P < 0.05, sign-test).
Species (N pop) Environmental
factor
Scale of temporal
heterogeneity
Outcome Reference
Artemisia californica (5) Water Between years + Pratt & Mooney (2013)
Artemisia frigida (2) Water Between years + Liu et al. (2014)
Convolvulus arvensis (2) Water Within year + Gianoli (2004)
Convolvulus chilensis (3) Water Between years + Gianoli & González-Teuber (2005)
Leymus chinensis (5) Water Between years + Liu et al. (2014)
Plantago lanceolata (29) Temperature Within year – Lacey et al. (2010)
Polygonum persicaria (2) Water Between years 0 Sultan & Bazzaz (1993)*
Polygonum persicaria (3) Water Within year 0 Heschel et al. (2004)
Ranunculus flammula (10) Water Between years + Cook & Johnson (1968)
60
880
885

Species (N pop) Environmental
factor
Scale of temporal
heterogeneity
Outcome Reference
Senna candolleana (4) Water Between years + Lázaro-Nogal et al. (2015)
Stipa grandis (2) Water Between years – Liu et al. (2014)
Stipa krylovii (3) Water Between years + Liu et al. (2014)
Taraxacum officinale (2) Water Within year + Molina-Montenegro et al. (2010)
Taraxacum officinale (5) Temperature Within year + Molina-Montenegro & Naya (2012)
* The authors did not compare plasticity levels between populations; the outcome was inferred after statistical comparison of F-ratios.
61

FIGURE LEGENDS
Fig. 1. An example to illustrate the difference between changing the variance and the kurtosis
(occurrence of extreme events) of a climatic variable. (A) Three contrasting distributions of a
climatic variable are shown, one following the normal distribution with a variance of 1 (black),
another following the normal distribution with a variance of 5/3 (blue), and the last following
Student's t distribution with a variance of 5/3 (green). Thus, the black curve has lower variance than
the blue curve but both have the same kurtosis, as by definition the normal distribution has zero
kurtosis. In turn, the green curve has the same variance as the blue curve (5/3) and is leptokurtic,
with a kurtosis value of 6. Thus, it exhibits greater occurrence of extreme events than the other
curves and has greater kurtosis than the black and blue curves. The three curves are centered on the
same mean. (B) The same three curves shown in A with the ordinates in log scale, which helps
when comparing the frequency of extreme events among the curves.
Fig. 2. Given the nonlinear relationships between performance and body temperature, mean
performance differs between ectothermic organisms inhabiting constant and fluctuating
environmental conditions. Coloured circles symbolize the performance of individuals kept at either
a low (blue circle) or a high (red circle) constant temperature. Green circles denote performances of
individuals kept at thermal cycles following a step function; arrows indicate the range of the step
function. When the mean temperature lies below the thermal optimum (T0), thermal variation
increases the mean performance. Contrarily, when the mean temperature exceeds the thermal
optimum, thermal variation reduces the mean performance. Modified from Bozinovic et al. (2011a).
Fig. 3. The adaptive value of phenotypic plasticity under two different scenarios of climate change:
(i) a temporal shift in environmental quality (and in its corresponding cue for the initiation of the
62
890
895
900
905
910

plastic response) (left column), and (ii) a temporal shift in environmental quality plus climatic
variability (a short-term anomaly counteracting the climatic trend) (right column). (A, B) Seasonal
variation in environmental quality in historical climate (black curve) versus climate change (red
curve) scenarios. (A) Climate change = continuous trend. (B) Climate change = a shift in historical
climate plus climatic variability. The level of environmental quality that acts as a cue for the
initiation of the plastic response is indicated. (C, D) Reaction norms from three genotypes in the
climate change scenarios depicted in A and B. Their responses to environmental cues (or lack
thereof) are evidenced by a change in the slope of their reaction norms. It is assumed that the trait
changes continually after the threshold is exceeded. The black genotype does not respond to the
temporal shift in the appearance of the cue (C) or climatic variability (D), keeping the phenotypic
trajectory corresponding to the historical climate. The red genotype has adjusted its reaction norm
to the shift in the cue (C) or climatic variability (D). The purple genotype, together with adjusting
its reaction norm as for the red genotype, shows increased plasticity (steeper slopes; C, D). The
plateaus in the red and purple genotypes (D) arise when the environment goes back above the
threshold in B. The orange dashed line indicates the occurrence of selection at the end of the season.
(E, F) Adaptive landscape assuming directional selection, showing the relative position of the three
genotypes in the scenarios of continuous climate change (E) and climatic variability (F), following
the phenotypic trait expression observed at the time of selection (orange dashed line). (G, H) As for
E and F, but this time assuming stabilizing selection when building the adaptive landscape.
Fig. 4. A partial summary of population theory describing the effect of a change in environmental
variability on the long-term stochastic population growth rate, λs . Abbreviations: IID,
independently and identically distributed; VR, vital rate; VRV, vital rate variance. References: 1:
Tuljapurkar (1990); Pfister (1998); 2: Doak et al. (2005); 3: Morris et al. (2006); 4: Gross et al.
(1998), Caswell & Kaye (2001), Tuljapurkar et al. (2003), Menges & Quintana-Ascencio (2004),
63
915
920
925
930
935

Tuljapurkar & Haridas (2006).
Fig. 5. In a changing climate, the mean and variance of environmental conditions may change in the
same or in opposite directions, and may drive similar changes in the means and variances of vital
rates.
Fig. 6. Mechanisms exacerbating phenological mismatches at geographic range limits. (A) Greater
influence of harsh climatic events at range limits. In the example, the phenology of a consumer
(blue) overlaps well with the average phenology of its resource (green). If the probability of
occurrence of harsh climatic events that damage the resource is greater at range limits (black dotted
line) than at the range center (grey dotted line), a phenological shift in the resource (red) should
exacerbate the phenological mismatch at range limits. The black arrow indicates the direction of the
shift in the plant phenology. (B) Decreased sampling probability of phenological tails at range
limits. If the abundance of a key resource that is abundant throughout the geographic range (green)
decreases towards range limits (red), statistical sampling will dictate a shorter resource phenology at
range limits, with a later start and earlier end of the phenological period (dotted vertical lines). In
the example, resource phenologies were generated by randomly sampling from a normal
distribution, with the abundance away from range limits being five times greater than the abundance
at range limits.
64
940
945
950
955
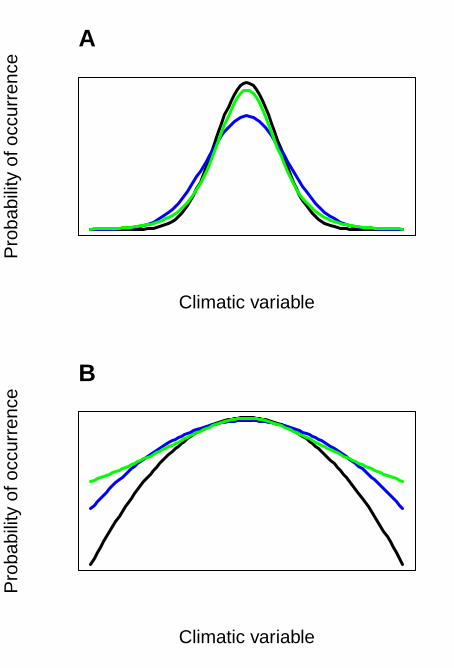
Climatic variable
Pro
babi
lity
of o
ccur
renc
e
A
Climatic variable
Pro
babi
lity
of o
ccur
renc
e
B

Body temperature
Per
form
ance
T0
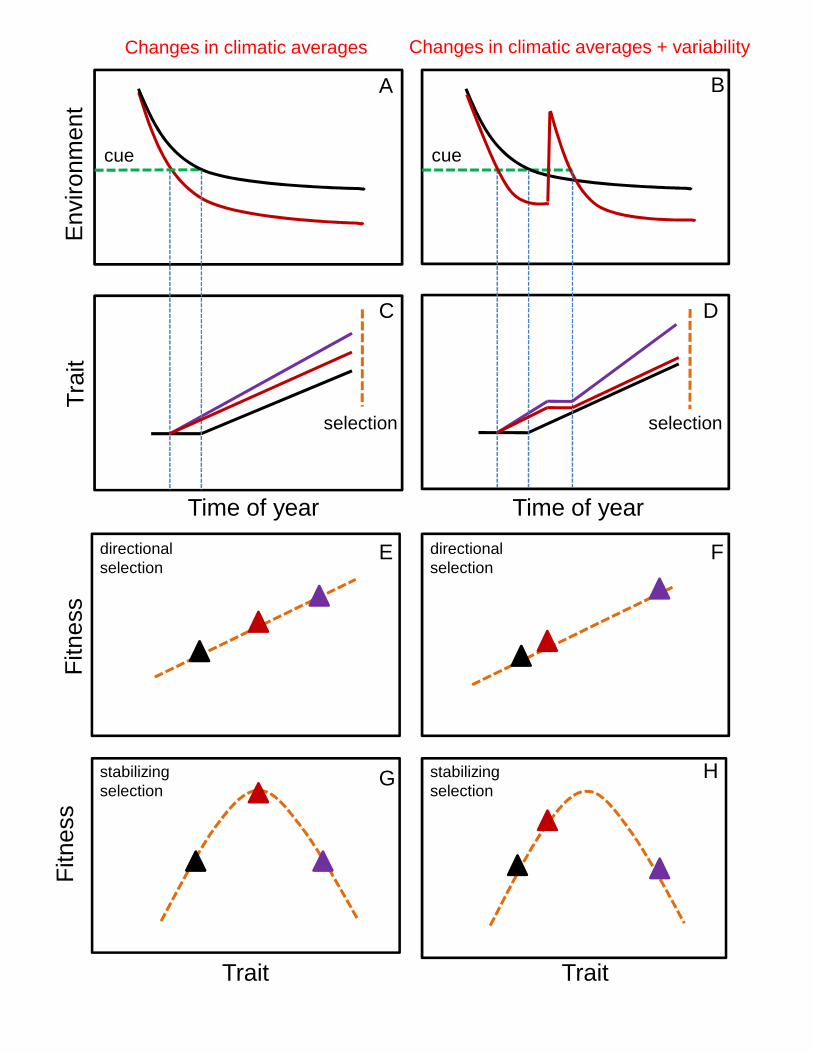
Time of year
Env
ironm
ent
Tra
it
selection
cue
selection
cue
A B
C D
Time of year
Changes in climatic averages Changes in climatic averages + variability
Fitn
ess
Fitn
ess
Trait Trait
E F
G H
directional selection
directional selection
stabilizing selection
stabilizing selection

Effects of
environment
are IID?
Vital rate
pairs
covary
within
years?Sign of vital
rate
covariation
Increased VRV decreases λs;
Increased VRV in high-sensitivity VRs decreases λs
more 1
If both VRs affect λspositively or both negatively,
increased VRV in either VR decreases λs;
If one VR affects λspositively and one negatively,
increased VRV in the lower-sensitivity VR can
increase λs
2
If both VRs affect λspositively or both negatively,
increased VRV in the lower-sensitivity VR can
increase λs;
If one VR affects λspositively and one negatively,
increased VRV in either VR decreases λs
2
Yes
Yes
No
+
-
Is variation
in the
environment
Markovian?
No Environment
state
transition
rates fixed?
Increased variance in VR means among
environmental states can increase λs, while
increased VRV within states tends to decrease λs
3
Increased frequency of (e.g.) fires or hurricanes
can increase or decrease VR means, VRVs, and VR
temporal correlations; collectively, these changes
can increase or decrease λs, in complex ways. 4
Example: Long-term trends in VR means and VRVs;
no existing theory, so effects on λs
must be
examined by means of computer simulations
Yes
No
No
Yes

5 10 15 20 25 30 5 10 15 20 25 30
5 10 15 20 25 30 5 10 15 20 25 30
Year
Mean increasing Mean decreasingV
ari
ab
ilit
yin
cre
asi
ng
Va
ria
bil
ity
de
cre
asi
ng
Va
lue
of
clim
ate
va
ria
ble

Time
Res
ourc
e or
con
sum
er a
bund
ance
A B
Time