ecological and evolutionary characteristics of - cornell university
TRANSCRIPT

ECOLOGICAL AND EVOLUTIONARY CHARACTERISTICS
OF FLIGHT-CALLS OF THE WOOD-WARBLERS (PARULIDAE)
A Dissertation
Presented to the Faculty of the Graduate School
of Cornell University
in Partial Fulfillment of the Requirements for the Degree of
Doctor of Philosophy
by
Andrew Farnsworth
January 2007

© 2007 Andrew Farnsworth

ECOLOGICAL AND EVOLUTIONARY CHARACTERISTICS
OF FLIGHT-CALLS OF THE WOOD-WARBLERS (PARULIDAE)
Andrew Farnsworth, Ph.D.
Cornell University 2007
Many songbirds produce simple, species-specific flight-calls. Some fundamental
features of flight-calls remain poorly known, including their functions and variability.
I reviewed available information on flight-calls and studied: 1) relationships between
calling and weather; 2) seasonal flight-call use in warblers; 3) inter- and intraspecific
variation in warbler flight-calls; 4) methods for analyzing flight-calls; and 5)
relationships between warbler flight-calls and ecological and evolutionary
characteristics.
I examined relationships among call counts, weather, and bird density. I
studied flight-calling in warblers during migratory and non-migratory periods. I
recorded flight-calls from captive warblers to evaluate inter- and intraspecific
differences and quantify variance among species, individuals, and ages and between
sexes. I compared three methods to assign calls to caller using discriminant analysis:
1) spectrographic cross-correlation (SPCC); 2) energy-distribution (ED)
measurements; and 3) classification tree analysis (CTA) of ED measurements. I used
a multi-locus phylogeny to quantify the extent of phylogenetic signal in flight-call
spectrographic characteristics. I employed a quantile regression and null model
approach to compare interspecific phylogenetic divergence with corresponding
spectrographic differences.

I found that: 1) call counts correlated with bird density and weather, but not
with weather alone after controlling for density; 2) warblers use flight-calls most
extensively during migration, but not exclusively; 3) variation in flight-call properties
is greatest among species, with subtle variation among individuals and ages and
between sexes; 4) SPCC data yielded the lowest misclassification rates and may best
represent individual differences; and 5) in phylogenetically controlled and
uncontrolled analyses many energy distribution and syllable structure measurements
associated with phylogeny, vegetation density and vegetation height but not with
migration strategy, wintering distribution, or morphological characteristics.
Flight-calls are probably more functional as species identifiers than as
individual identifiers, and such functions may extend beyond migratory periods.
Additionally, phylogenetic and ecological effects occur in flight-calls, and
evolutionary histories of structural and signal properties may differ. Species
recognition may be important in the evolution of syllable structure, whereas adaptation
to environment may be important in the evolution of spectral and temporal properties.
Incorporating individual-specific information and meteorological data into acoustic
monitoring protocols could increase dramatically the power of these methods.

iii
BIOGRAPHICAL SKETCH
Andrew Farnsworth developed a keen interest in birds at a young age. By age five, he
was birding around his home in Rye, New York. As his passion for birds grew,
Andrew developed a particular interest in bird migration, fostered by many autumn
days at local hawk watch sites. By age ten, Andrew was regularly leading bird walks
at Westchester County parks, especially at Marshlands Conservancy in Rye. In May
1990, Andrew captained the first youth-birding team in the 24-hour World Series of
Birding in New Jersey. Andrew attended Cornell University in August 1991, making
the acquaintance of Bill Evans, flight-call research pioneer, and later receiving his
B.S. in Natural Resources in May 1995. In August 1995, he co-led his first tour for
Victor Emanuel Nature Tours in Peru and continues to lead tours until the present.
In 1998 and 1999, Andrew captained consecutive winning teams in the Great
Texas Birding Classic. Although birds had always been his true passion, Andrew is
also a performing musician; since July 1997, he has toured extensively with his band,
Mectapus, which has released three CDs to date. However, Andrew realized that his
true calling was in unraveling the remaining mysteries of nocturnal migration and
flight-calling behavior, so he returned to academic pursuits, energized by meeting Dr.
Sidney Gauthreaux at the American Ornithologists’ Union meeting in St. Louis during
April 1998. By the fall of 1999, Andrew had returned to school, beginning at
Clemson University as a research assistant in Dr. Gauthreaux’s radar ornithology
laboratory. He received his M.S. in Zoology in August 2001, comparing nocturnal
bird density measures from surveillance radar and nocturnal flight-call counts from
acoustic sensors. It was during his research at Clemson that Andrew met his wife-to-
be, Patricia Ryan. After graduation, Andrew moved to New York to join Patricia and
to begin working for the National Audubon Society as the Ford Audubon Science

iv
Fellow. He worked for a year analyzing bird distribution data and developing Internet
technology to improve access to such data for the public.
Andrew returned to Cornell University in the fall of 2002 after completing his
Audubon fellowship, beginning his doctoral research in the Department of Ecology
and Evolutionary Biology under Dr. John Fitzpatrick. Upon returning to academic
pursuits, Andrew combined his extensive field experience with explicit research goals
focused on nocturnal bird migration, flight-calling behavior, and radar ornithology.
He continued this trend at Cornell, conducting his fieldwork on flight-calls in
numerous locations across the United States, Mexico, and the Greater and Lesser
Antilles while pursuing a variety of other ornithological projects, including two Rapid
Biological Inventories in Cuba, and the Ivory-billed Woodpecker Recovery Project in
Arkansas, and co-authoring species’ accounts for Handbook of the Birds of the World.
At present, Andrew lives in New York, New York with his wife, Patricia Ryan.
He plans to continue his research on flight-calls and bird migration and to begin
applying his knowledge and experience to conservation goals.

v
ACKNOWLEDGMENTS
I deeply appreciate the support and inspiration from my committee, Drs. John W.
Fitzpatrick, J. Irby Lovette, Jack W. Bradbury, and Chris W. Clark, without whom I
would be lost in a sea of confusion. I would also like to thank some “ghost”
committee members, Drs. Stephen Emlen and Kurt Fristrup, for advice during the
earliest stages of the dissertation process and data collection as well as invaluable
critical review and commentary during manuscript preparation. While each of their
contributions is far greater than I could possibly hope to summarize in a few
sentences, I will highlight a few specific instances of thanks for my special committee.
I thank Jack for agreeing to “co-advise” me, for offering honest opinions from
the earliest stages of my research, and for schooling me in statistical arts, the likes of
which I could only have dreamed (nightmare?). I thank Chris for his boundless energy
and enthusiasm, in particular for guiding me toward the possibilities of conservation
through acoustics. I thank Irby for wisdom and advice far beyond his years, for
providing me with the insight and inspiration to pursue a direction I would likely not
have otherwise traveled, and for providing the raw materials to make my visions of
comparative analysis a reality. Finally, I thank Fitz for an idea jotted on a napkin in
1997 that began my graduate career, for providing a passionate and informed (as well
as insane and highly mobile!) role model, and for leading (hurtling) me into a diversity
and abundance of opportunities greater than I could possibly imagine (for example,
Cuba, Handbook of the Birds of the World, Ivory-billed Woodpecker).
In addition, I must make it clear that without Dr. William Provine, I would not
have continued my pursuit of higher education in graduate school. His tireless and
dogged efforts on my behalf and his kind words opened the doors to Clemson and
Cornell, and for all his support, I thank him dearly.

vi
I received financial support in the form of grants from the Department of
Ecology and Evolutionary Biology at Cornell University (teaching assistantships in
2002, 2003, and 2004), Kieckhefer Adirondack Fellowship (2003, 2004), Cornell
Laboratory of Ornithology (2005), Lynx Edicions and the Handbook of the Birds of
the World project (2005), a Clemson University Radar Ornithology Laboratory grant
from the Department of Defense Legacy Resource Management (initial data collection
in 2000, 2001). I also received support from Victor Emanuel Nature Tours for tour
leading in North America (2003, 2004, 2005), the Caribbean (2003), and South
America (2006).
I am indebted to Michael Lanzone, Robert Mulvihill and the Powdermill Avian
Research Center for providing logistical, technical, and moral support for the
collection of flight-call recordings from captive birds. Michael’s ideas and energy, in
conjunction with Robert’s drive to support young ornithologists, were the perfect
catalysts for the genesis of the Acoustic Cone and the recording of tens of thousands
of flight-calls from captive birds. Cornell Laboratory of Ornithology, Powdermill
Avian Research Center, the flight-call research world, and the birding community at
large will benefit for years from the initial efforts brought about by these two
exceptional people!
For providing access to an extensive library of sounds and digital data and for
guidance on recording equipment, I thank Greg Budney, Claudia Zan, Ben Clock,
Mike Andersen, and Curtis Marantz among many others at the Macaulay Library at
Cornell Laboratory of Ornithology.
William Cochran provided me with insight into a world of migration,
technology, and bizarre sleep habits that inspired me to pursue my goals of
understanding individual variation and relationships between meteorology, migration,

vii
and flight-calling. I only wish I could have spent more time in his basement learning
the wealth of knowledge lurking quietly therein.
My life has not been the same since I met Victor Emanuel in 1986, and this
fact was never more apparent than it was during my dissertation. Whether the
countless hours of discussing migration, the opportunities to travel anywhere and
everywhere, or the connections to an incredibly talented and diverse network of first-
rate ornithologists and birders, the wealth of experiences that Victor made possible has
enriched my life beyond my capacities to explain.
In the fall of 1991 during my first semester as an undergraduate at Cornell
University, I met Bill Evans. Little did I know that this meeting would change the
course of my career in ways I could never have anticipated? By putting names to the
sounds I had heard for years at night, Bill opened my eyes and ears to a world of
migration I had never known (and that few truly understood!). Bill’s knowledge and
passion for migration, coupled with a fun-loving, thoughtful, reasonable, and
competitive streak, set me ablaze on my path to studying flight-calls. My time with
him in the field over the last 15 years has always been enlightening, inspiring, and
often frightening!
For holding my hands through the thickest statistical analysis and battling the
ugliness of imperfect data, I thank Leila Hatch, Kathryn Cortopassi, Wesley
Hochachka, Kurt Fristrup, Harold Figueroa, Matt Robbins, Aisha Thorn, Tim Krein,
Russ Charif, Stefan Hames, Daniel Fink, the BORG collective (David Winkler, James
Mandel, David Cerasale, Gernot Huber), Karen Grace-Martin, Françoise Vermeylen,
Dan Steinberg and Salford Systems, Chuck Jessop and the CIT staff, and Josh Donlan.
Your direction has been invaluable, helping me attain a level of comfort with a subject
that previously lacked all things comfortable.

viii
A special thank you goes to David Agro, Mike Andersen, Tim Barksdale,
Carroll Belser, K. D. Bishop, John Black, Bruno Bruderer, Greg Budney, Tom Burke,
Dan Cooper, Alan Cunningham, James D’Alterio, Peter English, Kimball Garrett,
Sidney A. Gauthreaux, Brian Gibbons, Frank Gill, Donald Griffin, Andy Guthrie,
Stefan Hames, William Hamilton III, Marc Herremans, Steve Hilty, Marshall Iliff,
Eduardo Inigo-Elias, Dave Jasper, Lukas Jenni, Steve Kelling, Ron Larkin, Geoff
LeBaron, Dan Lebbin, Tony Leukering, Felix Liechti, Rhonda Millikin, Harold Mills,
Shai Mitra, Dana Nayduch, Bjorn Olav-Tveit, Narena Olliver, Mike Powers, Robert
Ridgely, Magnus Robb, Ken Rosenberg, Brian Sullivan, Guy Tudor, Nicasio Vina,
Andrew Whittaker, and Kevin Zimmer. I thank all the administrative staff in the
Graduate School, Department of Ecology and Evolutionary Biology, and Cornell
Laboratory of Ornithology, in particular Alberta Jackson, Linda Harrington, Patty
Jordan, Rosie Brainard, Minnie Empson, Diane Yates, Phyllis Dague, Connie Gordon,
Nancy Rice, and Myrah Bridwell. There were many times you saved me! A special
thank you to Kristen Ebert-Wagner for editorial advice, formatting, and helping me
finish the end game of submitting my dissertation. A special thank you to Edward
Abelson as well, for years of sound advice.
I also thank the following groups for information, logistics, access, and
additional support: Powdermill Avian Research Center, Fundacion Jocotoco,
Braddock Bay Bird Observatory, Gulf Coast Bird Observatory, the Fitzpatrick and
Lovette Lab Groups, EUROBIRDNET, ORIENTALBIRDS, SABIRDS, and ID-
FRONTIERS online communities, the American Museum of Natural History and the
Southwestern Research Station, The Nature Conservancy, and Rapid Biological
Inventory teams including the Field Museum, BIOECO, University of Havana, and the
Centro Oriental de Ecosistemas y Biodiversidad in Santiago de Cuba. Thanks to
Gotham Sound and Stith Recording for outfitting me with the state-of-the-art

ix
recording gear. I also thank the numerous anonymous reviewers for vital critiques and
helpful comments, without whom these chapters and manuscripts would not exist in
their present form today. Special thanks to Dr. Spencer Sealy and The Auk as well as
Dr. Roland Sandberg and the Journal of Avian Biology for publication permissions.
I put my desire to play music on hold during most of my graduate research.
However, without music, I would have lacked a crucial balance to the rational and
cerebral pursuits of science (statistics in particular!). For this reason, I thank Russell
Davis, Dave Yantorno, and in particular, the six members of my band, Mectapus, for
giving me the framework to push the envelope of a completely different sort of
acoustical world. I especially highlight Mectapus: since 31 July 1997 Joe Palermo,
Charlie Shew, Chad Lieberman, Eric Aceto, Michael Cerza, and Pete Dougan have
been part of the vehicle to keep my creativity alive. The mantra is still alive: first, we
lay down the Snoopy, and then we shred. Oh, yes.
My families have supported me lovingly in all my ornithological endeavors for
nearly three decades, and I am deeply thankful: thank you to every member, far and
wide, of the Sollins, Farnsworth, Liebmann, and Ryan families, particularly Marybeth,
Michael, and Evelyne. I thank Thomas H. Ryan for the most wonderful gifts of five
years’ worth of stories and your beautiful daughter – I will miss you dearly. I thank
Irving V. Sollins for my first pair of binoculars and a quality of life that I never take
for granted – I wish you were here to read this.
Most of all, I thank my wife, Patricia A. Ryan, who has seen all the glory and
the horror, all the insanity and the calm. Yet, each day, she continues to stand by me,
behind me, and before me, supporting my whims with a love for the ages. For all she
is, for all she adds to my life, I am eternally grateful. The joy of life with you is,
without fail, the source of my desire to explore!

x
TABLE OF CONTENTS
BIOGRAPHICAL SKETCH.........................................................................................iii ACKNOWLEDGMENTS..............................................................................................v TABLE OF CONTENTS ...............................................................................................x LIST OF FIGURES.......................................................................................................xi LIST OF TABLES ......................................................................................................xiii CHAPTER ONE: FLIGHT-CALLS AND THEIR VALUE FOR FUTURE ORNITHOLOGICAL STUDIES AND CONSERVATION PROJECTS .....................1 CHAPTER TWO: EFFECTS OF WEATHER CONDITIONS ON FLIGHT-CALL COUNTS OF NOCTURNALLY MIGRATING BIRDS ............................................30 CHAPTER THREE: FLIGHT-CALLS OF WOOD-WARBLERS ARE NOT EXCLUSIVELY ASSOCIATED WITH MIGRATORY BEHAVIORS ....................49 CHAPTER FOUR: INTER- AND INTRASPECIFIC VARIATION IN FLIGHT-CALLS AMONG WOOD-WARBLERS.....................................................................61 CHAPTER FIVE: A COMPARISON OF SOUND ANALYSIS METHODS USING WARBLER FLIGHT-CALLS, A SIMPLE AVIAN VOCALIZATION .......97 CHAPTER SIX: EVOLUTION OF NOCTURNAL FLIGHT-CALLS IN MIGRATING WOOD-WARBLERS: APPARENT LACK OF MORPHOLOGICAL CONSTRAINTS.....................................................................137 CHAPTER SEVEN: THE EVOLUTION OF SIMPLE AVIAN VOCALIZATIONS: PHYLOGENETIC AND ECOLOGICAL EFFECTS ON INTERSPECIFIC VARIATION IN FLIGHT-CALLS ...........................................................................168

xi
LIST OF FIGURES
Figure 1.1. Examples of passerine flight-calls. .............................................................3
Figure 1.2. Flight-calls of American Redstart Setophaga ruticilla. ..............................6
Figure 3.1. Flight-calls of Nashville Warbler (Vermivora ruficapilla) recorded during three different seasonal periods: A) migration (Fall 2004, Ithaca, NY), B) breeding (Summer 2003, Adirondacks SP, NY), and C) wintering (December 2004, Morelos, Mexico).........................................................................................................................55
Figure 3.2. Flight-calls of Cape May Warbler (Dendroica tigrina) recorded during two different seasonal periods: A) migration (Spring 2005, New York, NY and B) wintering (February 2004, Humboldt NP, Cuba). ........................................................56
Figure 4.1. Least squares means and standard errors for frequency concentration contour median (MeFCC) and equivalent bandwidth contour median (MeEBC) measurements for flight-calls of 14 species of warbler................................................71
Figure 4.2. Least squares means and standard errors for median frequency (MePS) and median frequency contour median (MeFMED) measurements for flight-calls of 14 species of warbler. ........................................................................................................72
Figure 4.3. Box plots of variation in flight-call frequency characteristics among warbler species. ............................................................................................................79
Figure 4.4. Difference in least squares mean values for median frequency (MePS) and median frequency contour median (MeFMED) between Magnolia Warbler sexes and ages. ..............................................................................................................................83
Figure 5.1. Spectrograms of the flight-calls of five warbler species, with two flight-calls from each of three individuals per species. ........................................................100
Figure 5.2. Spectrogram representation (a) of a signal, generating an aggregate time envelope (b) and a frequency spectrum (c) by summing power values in each short- time spectrum or narrow-band envelope, respectively...............................................101
Figure 5.3. Equivalent-duration is the width of the rectangle whose height is the value of the median, centered on the median such that the area in the rectangle is equal to the total area under the amplitude-time envelope curve...................................................102
Figure 5.4. Sorted aggregate time envelope (a) and frequency spectrum (c) of a signal.....................................................................................................................................103
Figure 5.5. Spectrogram representation (a) of a signal with an overlay of the median frequency contour (FMED), which is based on the medians of the successive short-time spectra.................................................................................................................107

xii
Figure 5.6. Scatterplot matrix of SPCC PCOs 1 and 2 of flight-calls of five species of warblers. .....................................................................................................................112
Figure 5.7. Scatterplot matrix of ED PCOs 1 and 2 of flight-calls of five species of warblers. .....................................................................................................................117
Figure 6.1. Phylogenetic hypothesis with a Spindalis zena outgroup for 33 species of wood-warblers with associated spectrograms of flight-calls and songs.....................140
Figure 6.2. Frequency (kHz) of flight-calls and songs on body mass (g) .................148
Figure 6.3. Frequency contrasts of flight-calls and songs on body mass contrasts...150
Figure 6.4. Flight-call frequency (kHz) on song frequency (kHz)............................152
Figure 7.1. Relationships between the number of significantly different measurements and ecological overlap and genetic distance among species-pairs. ............................199
Figure 7.2. Quantile regression plots of quantile intervals from 5% to 95% in 5% intervals for acoustic distance (Ordinate axis) against genetic distance (Abscissa axis).....................................................................................................................................201
Figure 7.3. Quantile regression plots of the median (50% quantile) values for actual (solid line) and random (dashed line) distributions of PCOs against genetic distance.....................................................................................................................................203
Figure 7.4. Quantile regression plots of the median (50% quantile) values for actual (solid line) and random (dashed line) distributions of PCAs against genetic distance.....................................................................................................................................204

xiii
LIST OF TABLES
Table 2.1. Results of a principal component analysis for 10 surface weather variables.......................................................................................................................................36
Table 2.2. Models of call counts with and without statistical controls for density effects for Clemson, SC................................................................................................37
Table 2.3. Models of call counts with and without statistical controls for density effects for Rye, NY.......................................................................................................38
Table 2.4. Models of call counts with weather, Julian date, number of hours after sunset, and combined effects with and without controls for density effects for Rye, NY. ...............................................................................................................................39
Table 2.5. Simple models of call counts and bird density from Farnsworth (2001) and Farnsworth et al. (2004). ..............................................................................................43
Table 3.1. Date, location, and season of observations of flight-calling behavior for 23 species of warblers. ......................................................................................................52
Table 3.2. Seasonal prevalence of flight-calls and numbers of calls counted for 23 species of warblers. ......................................................................................................53
Table 4.1. Total number of flight-calls and individuals for 14 species of warblers and total number of flight-calls and individuals from age-sex sub-sample for six species of warblers. .......................................................................................................................64
Table 4.2. XBAT energy-distribution measurements recorded from each flight call spectrogram. .................................................................................................................69
Table 4.3. Pooled median, interpercentile range, and range for 28 measurements recorded from flight-calls of 14 species of warblers, with the species with minimum and maximum range for each of 28 flight-call measurements. ....................................73
Table 4.4. Species-specific median, standard error, and range for 28 measurements recorded from flight-calls of 14 species of warblers. ...................................................75
Table 4.5. Ratios significantly greater than 1 for among species and among individual variance in flight-call measurements relative to among-call (residual) variance.........78
Table 4.6. Differences between sexes and ages in least squares mean values by flight-call measurement and species.......................................................................................81
Table 4.7. Significant differences in least squares mean values of flight-call characteristics between age-sex interaction classes. ....................................................84

xiv
Table 5.1. XBAT energy-distribution measurements recorded from each flight call spectrogram. ...............................................................................................................106
Table 5.2. Cumulative goodness of fit of five principal coordinate axes extracted from flight-call correlation matrices of spectrographic cross-correlation data (SPCC) and XBAT energy-distribution measurement data (ED)...................................................109
Table 5.3. Misclassification rate means and ranges by species for misclassifying flight-calls to known flight-caller. ..............................................................................122
Table 5.4. Stepwise regression of PCOs against each other and PCOs against energy-distribution measurements..........................................................................................124
Table 5.5. Canonical correlations for first canonical variables extracted from SPCC and ED PCO data........................................................................................................125
Table 5.6. Variable importance for classification tree analysis (CTA) of individual warblers by species.....................................................................................................125
Table 6.1. Individual bill lengths, body masses, frequency data for flight-calls and songs and associated group means, standard deviations, maxima, minima, and ranges for 33 species of wood-warblers.................................................................................143
Table 6.2. Means, standard deviations, and paired T-test results for maximum, minimum, and bandwidth frequencies (kHz) for flight-calls and songs of 33 species of wood-warblers. ...........................................................................................................152
Table 6.3. Comparison of species groups, presence of significant relationship trends, sample sizes, means, minima, maxima, ranges, coefficients of variation and variances among four studies of relationships between morphology and vocal frequencies. ....156
Table 7.1. XBAT measurements of aggregate time and frequency distributions recorded from each flight-call spectrogram summarized from Fristrup and Watkins (1992,1993) and Figueroa (2002) documentation. .....................................................181
Table 7.2. Eigenvalue-based measurements derived from principal coordinate (PCO) and principal component (PCA) analysis. ..................................................................182
Table 7.3. Categories and coding for additional qualitative flight-call measurements and ecological characters............................................................................................185
Table 7.4. Genetic distances and probabilities of local co-occurrence for 13 regionally sympatric species of warblers.....................................................................................192
Table 7.5. Significant and near-significant phylogenetic autocorrelation between acoustic and ecological characters. Acoustic measurements are abbreviation consistent with Tables 1 and 2....................................................................................194

xv
Nothing will ever be attempted, if all possible objections must first be overcome.
—Dr Samuel Johnson, 1759

1
CHAPTER ONE: FLIGHT-CALLS AND THEIR VALUE FOR FUTURE
ORNITHOLOGICAL STUDIES AND CONSERVATION PROJECTS*
Abstract
Many passerine birds and their relatives have flight-calls, species-specific
vocalizations given primarily during sustained flight (for example, migration). While
references to flight-calls appear in the ornithological literature as early as the 1890s,
some of their most basic features remain poorly known, including their functions,
origins, ontogeny, the distances over which they are used, and how much individual
variation exists in call characters and calling rates. With improved knowledge of these
vocalizations, flight-calls could be useful in a variety of applications. Identifying the
function of flight-calls could illuminate how birds refine migration strategies during
crucial decision-making periods. Because flight-calls are relatively simple
vocalizations, they could be useful characters for future evolutionary and comparative
analyses. Flight-call monitoring can be a powerful method for studying nocturnal
migration. However, all such applications require more detailed knowledge of
nocturnal calling behavior. This review article summarizes the available information
on flight-calls, and it highlights areas where future research could improve and expand
this knowledge. Much of the information on flight-calls is archived in personal field
notes and recordings. Hence, this review relies unusually heavily on unpublished
information provided by colleagues.
What is a flight-call and what species give flight-calls?
Flight-calls of passerine and related birds (cuckoos and woodpeckers, among others)
are defined as species-specific notes, either frequency-modulated or pure, of up to
* Dr. Spencer Sealy granted permission on 24 July 2006 to use this perspective piece, or modifications of it, published in The Auk, Volume 122: 733-746, 2005, in this doctoral dissertation.
2
several syllables, generally in the 1-9 kHz frequency band and 50-300 ms in duration.
Spectrograms of a range of representative passerine flight-calls are depicted in Figure
1.1. These calls are the primary vocalizations given by many species of birds during
long, sustained flights, particularly migratory flights (Evans and O’Brien 2002).
Despite the name flight-call, birds may produce these calls in a variety of contexts
other than migratory flight, including while perched (notably the cardueline finches,
Mundinger 1970) and while interacting with fledged young (notably the parulid
warblers; personal observations). Many species also use their flight-calls year-round
(Evans and O’Brien 2002), and some species regularly give flight-calls while in
diurnal flight (e.g. Yellow-rumped Warbler Dendroica coronata; Evans and O’Brien
2002). Flight-calls are distinct from songs, and more importantly they are distinct
from other types of short calls, such as chip notes and alarm calls.
Nearctic and Neotropical species – Flight-calls have been studied most intensively in
North America, and Evans and O’Brien (2002) compiled a guide to the flight-calls of
migratory birds occurring in the eastern part of the continent (mostly east of the 100th
meridian). This unique resource provides detailed information on flight-calls,
including descriptions of the vocalizations and flight-calling behavior, spectrographic
representations, examples, and identification tips. Not all of the species contained in
the guide regularly give flight-calls, and not all of those that regularly give flight-calls
give them at night. For example, cuckoos, woodpeckers, corvids, larks, swallows,
thrushes, wood-warblers, tanagers and grosbeaks, emberizid sparrows, blackbirds, and
finches (among other groups) give flight-calls regularly, but most woodpeckers,
corvids, larks, swallows, and finches rarely use these calls at night (these are primarily
diurnal migrants). Groups of species that do not regularly give flight-calls (during
diurnal or nocturnal movements) include New World flycatchers (Tyrannidae), vireos
(Vireonidae), and mimids (Mimidae).

3
Figure 1.1. Examples of passerine flight-calls. A) Bobolink Dolichonyx oryzivorus. B) Indigo Bunting Passerine cyanea. C) Blackpoll Warbler Dendroica striata. D) Swainson’s Thrush Catharus ustulatus. Note that these axes of these spectrograms have identical scales, facilitating comparison among the different species’ calls. B and C depict modulated calls, while A and D depict flight-calls or parts of flight-calls with pure tones. These flight-calls come from Evans and O’Brien (2002).
Palearctic and Paleotropical species – Although less intensively studied than Nearctic
species, numerous Palearctic and Paleotropical species also give flight-calls (Chappuis
1989, van den Berg et al. 2003). Some of these are closely related to vocal New
World species, such as Turdus thrushes (e.g. Fieldfare Turdus pilaris and Redwing
Turdus iliacus), cardueline finches, pipits, and Regulus crests; others species are more
typically Old World, like bee-eaters (Meropidae), Emberiza buntings (such as Rustic
Bunting Emberiza rustica and Ortolan Bunting Emberiza hortluna), many wagtails
(Motacillidae) and larks (Alaudidae), and fringillid finches. Like some Nearctic birds,
not all of these species regularly give these vocalizations at night. In fact, it is
primarily European Turdus thrushes (Siivonen 1936, Browne 1953, Vleugel 1954,
1960, Chappuis 1989, van den Berg 2003) and some Emberiza buntings and Regulus

4
crests (Magnus Robb, personal communication) that regularly give flight-calls during
nocturnal migration. Other Palearctic-Paleotropical species also give flight-calls at
night, including several species of pitta (Fairy Pitta, SRS Lin, personal
communication; Blue-winged Pitta, Phillip Round, personal communication), some
Asian and Australo-Papuan cuckoos such as Long-tailed Koel Eudynamys taitensis
and Pied Cuckoo Clamator jacobinus (Narena Olliver, personal communication), and
Woodland Kingfisher Halcyon senegalensis (Dalena Mostert, personal
communication). Future field work in Africa, Asia, and Australia will probably
highlight numerous additional species that also give flight-calls at night.
Like New World exceptions that rarely give flight-calls, there are also
Palearctic birds that rarely give flight-calls: Old World flycatchers (Muscicapidae) and
Old World warblers (Sylviidae) are generally silent during migration. However, some
species, such as Pied Ficedula hypoleuca and Spotted Flycatcher Muscicapa striata,
not normally heard during nocturnal movements apparently vocalize under poor
visibility conditions (Bruderer, personal communication; also Herremans 1993), and
some sylviid warblers infrequently use vocalizations (similar to fledgling calls) during
diurnal movements (Blackcap Sylvia atricapilla, Chiffchaff Phylloscopus collybita;
Marc Herremans personal communication; African River Warbler; JM Kriek personal
communication).
Identification – A frequently asked question is, how does one know the identity of a
calling bird when it is migrating at night and is not visible? Identification of some
calls is simple because the nocturnal vocalizations are the same as the diurnal
vocalizations (Catharus; Howes 1912, Evans 1994). However, the identification of
many species is often more complicated and requires deeper investigation and
additional information. This information generally comes from two distinct sources
(Evans and Mellinger 1999, Evans and Rosenberg 2000):

5
1) Comparisons of the spectrograms of diurnal flight-calls of known species and
unknown nocturnal flight-calls – Many birds observed in visible morning
flights often give flight-calls (Evans and Rosenberg 2000, Evans and O’Brien
2002; see Gauthreaux 1978, Hall and Bell 1981, Weidner et al. 1992 for a
description of the morning flight phenomenon); also, direct comparison of
unknown nocturnal vocalizations and flight-calls recorded from birds in
captivity or from birds with attached miniature microphones, is possible
(Hamilton 1962, Farnsworth and Lanzone unpublished data, Cochran
unpublished data). See Figure 1.2 for an example of these types of
comparisons.
2) Correlating the seasonal timing and geographic range of nocturnal calls with
known timing and migration ranges for each species. Species-specific
migration calendars are available for many species and locations in North
America, often generated from accounts of the species killed during nocturnal
migration and collected at tall structures (colliding with television towers,
lighthouses or buildings) and historical arrival and departure dates (see Evans
1994, Evans and Rosenberg 2000; also Hedges 2001).

6
Figure 1.2. Flight-calls of American Redstart Setophaga ruticilla. A) Diurnal flight-call. B) Nocturnal flight-call. C) Flight-call recorded in captivity.
Early flight-call research (pre-1959): evidence of nocturnal migration and
patterns
Although ornithologists debated certain aspects of bird migration strategies and
patterns into the late 19th and early 20th centuries (for example, do birds migrate across
the Gulf of Mexico? Frazar 1881, Cooke 1904, Lowery 1945, 1946, Williams 1945,
1947), most accepted that many species of birds migrate at night (Chapman 1888,
Cooke 1904, 1915, Lowery 1946). It was largely the flight-calls of migrating birds
that authors cited as direct evidence of such nocturnal movements, using the calls to
identify species, to assess the magnitude of migration, and as a quaint reminder of the
wonders of bird migration. Libby (1899) tallied 3600 calls during the course of five
hours of passive listening near Madison, Wisconsin on 14 September 1896, the first
published attempt to quantify nocturnal migration using flight-calls. Kopman (1904)
and Carpenter (1906) referenced thrush vocalizations heard during nocturnal migration
7
(especially Veery Catharus fuscescens and Gray-cheeked Thrush Catharus minimus).
Howes (1912) detailed the nocturnal vocalizations of Swainson’s Thrush (Catharus
ustulatus) in terms of the location and timing of this species’ migratory routes during
fall in northeastern United States. Tyler (1916) highlighted the diversity of flight-calls
and also noted that flight-calls appear in a species’ vocal repertoire during periods of
migration.
Studies through the 1950s illuminated the temporal pattern of nocturnal calling
(Turdus in Finland and Ireland, Siivonen 1936 and Browne 1953, respectively;
Catharus in Gaspé, Ball 1952). Ball (1952) produced one of the most comprehensive
studies on the timing of migration of a particular species through a region using flight-
calls (autumn migration of Catharus thrushes in the Gaspé Peninsula). Popular
accounts of nocturnal call counts from eastern North America also appeared regularly,
usually as call totals or interpreted numbers of Catharus thrushes passing over during
a portion of an evening (Audubon Field Notes; see brief summary in Evans and
O’Brien 2002).
Toward the end of the 1950s, interest in quantifying nocturnal migration
sparked a new debate about the relationship between the timing of peak bird density
aloft and the timing of peak flight-call counts. The relationship between flight-call
counts and direct visual observations of migratory birds passing in front of the full
moon (Lowery and Newman 1955, Newman 1956) suggested that calling peaks at a
different time than the actual density of birds in the atmosphere: bird density peaked
2-3 hours after sunset (Lowery and Newman 1955, Newman 1956) while vocalization
peaked in the hours just before dawn (Ball 1952). Also, direct visual data indicated
that the distribution of nocturnal migrants in the air was relatively even, in contrast to
flight-call data that suggested a clumped distribution (Ball 1952). To some, the record
of nocturnal calling exaggerated the impression of large-scale migration detected by

8
moon-watching (Vleugel 1960); and to further confound the situation, European call
count data indicated Turdus calling activity peaked close to local midnight with
another spike in activity just before dawn (Vleugel 1954, summarized 1960). The
interpretation of the acoustic record, especially in relation to actual numbers of birds
aloft at night, was not at all clear.
Modern flight-call research (post 1959): automation, recognition, and
identification
Although the limits and variability of human hearing largely prevented objective
comparisons among earlier studies of migration, technological developments of the
1940s and 1950s enabled researchers to make audio recordings of nocturnal bird
migration useful for more efficient and objective data collection, analysis, and
comparisons (see Evans and O’Brien 2002). The invention of the sound spectrograph
made visual comparisons of similar sounds possible (Koenig et al. 1946), and the
perfection of magnetic tape and tape recording devices made archiving sounds a
reality. Graber and Cochran (1959) sampled nocturnal flight-calls using a microphone
and a parabolic antenna, automatically recording calls to magnetic tape at 10-minute
intervals during entire nights of migration. Such techniques provided the foundation
for future, in-depth examination of the aural records of nocturnal migration. Graber
(1968) further advanced these techniques by comparing the acoustic record of
nocturnal migration with radar and diurnal field census data. However, the meaning
of the acoustic record of nocturnal migration remained equivocal (Graber 1968),
although Graber and Cochran (1959, 1960) suggested that qualitative data from
acoustic monitoring complemented quantitative data from visual methods.
Additionally, the function of flight-calls was still unknown, although Hamilton (1962)
presented evidence from birds recorded in captivity that suggested that calls
functioned as a means of communication among individuals in flocks.

9
Whereas electronic technologies made possible acoustic sampling across
increasingly large temporal and spatial scales of migration, labor-intensive data
collection and analysis, expensive and bulky recording media, and unwieldy and often
unreliable recording devices effectively limited the scope of acoustic studies.
However, by the late 1980s and early 1990s technological advances (for example,
increased computer processor speed, detection algorithms; see www.oldbird.org for
details) allowed researchers to resolve many technical issues that hindered previous
attempts using acoustics to study nocturnal migration. Dierschke (1989) recorded
nocturnal flight-calls automatically at Helgoland, Germany using a device activated by
signals of specific duration, loudness and frequency. This method conserved audio
tape and saved analysis time, bypassing portions of night when no calling occurred.
Improved detection and classification algorithms (Mills 1995, Taylor 1995) provided
the means to extract flight-calls automatically from either previously made recordings
or real-time data from an active microphone. Such software generally detects
nocturnal flight-calls by locating isolated temporal energy peaks in a specified
frequency range and classifies calls by tracking frequencies over time with an artificial
neural network. Simultaneous advances in spectrographic analysis methods (Clark et
al. 1987) and computer software and programs (Canary, Charif et al. 1995) made more
rapid examination and discrimination of similar calls a reality.
Inexpensive portable and durable microphone designs, pioneered by Evans
(1994, 2000, Evans and Mellinger 1999), provided the means to collect flight-call data
across larger geographic and temporal scales (Evans and Rosenberg 2000, Mills
2000). Improved radar technologies and coverage afforded the opportunity to
compare measures of nocturnal migration at much greater scales (after Graber 1968;
Larkin et al. 2002, Farnsworth et al. 2004). Flight-call identification also progressed,
culminating in the production of the first electronic identification guide (Evans and

10
O’Brien 2002). With increasing knowledge of the identity of nocturnal vocalizations,
research and conservation efforts could use acoustic methods to examine species-
specific patterns (Evans 1994, Millikin 1998, Evans and Mellinger 1999, Evans and
Rosenberg 2000, Evans 2000).
Patterns of flight-calling behavior
Effects of atmospheric conditions – Several relationships between call counts and
atmospheric conditions are apparent from the literature and to observers in the field
during a migration season. Call counts increase with increasing cloud cover and
decreasing cloud ceiling, especially in the presence of artificial lighting (Cochran and
Graber 1958, Graber and Cochran 1960, Ogden 1960, Graber 1968, Clemens 1978,
Dorka 1966, Thake 1983, Evans and Mellinger 1999). Call counts also increase as
birds approach frontal boundaries, the transition between air masses of different
density (Peterssen 1956), where conditions unfavorable for migration such
precipitation, high winds, and poor visibility force birds to pile up or descend (Graber
and Cochran 1960). Calling usually occurs during periods of seasonally appropriate
wind directions (Graber and Cochran 1960). Vleugel (1960) found that call counts of
Turdus thrushes in Holland during autumn increased with the passage of cold fronts
and decreasing temperature. Call counts are also positively correlated with 24-hour
trends of falling temperatures in autumn, and the converse is true in the spring (Graber
and Cochran 1960). There are two potential caveats to extrapolating from the results
of these studies: the studies represent site-specific results; and there is a lack of
information about rates of calling and their relationship to independent measure of
bird numbers.
Effects of altitude and topography – The effects of flight altitudes on calling rates are
not well known. Evans (2000) recorded many vocalizations in the lowest 500m above

11
the ground during autumn migration (see also Black 1997). Evans and Rosenberg
(2000) and Evans (2000) indicated that flight altitudes of calling warblers was lower
(less than 200-300 m) than the flight altitudes of calling thrushes (up to 450-500 m).
There is also temporal variation in the flight altitudes of calling birds, and average
altitudes can be substantially lower or higher on different nights (Black 1997, Evans
personal communication). Whether calling is primarily a boundary layer
phenomenon, occurring only in the atmospheric strata close to the ground, is not
known.
Although migration occurs across broad spatial scales (Lowery and Newman
1955, Parslow 1969, Gauthreaux et al. 2003), there is evidence suggesting that
topographic features such as mountains or hilly terrain and coastlines concentrate birds
(Eastwood 1967, Bruderer 1978, Richardson 1978, 1990, Åkesson 1993, Williams et
al. 2001); these features also appear to concentrate flight-calls. Evans and Mellinger
(1999) found that changing wind conditions resulted in larger numbers of calls
counted on the coast of Texas; southwesterly winds for bird migrating inland toward
the coast, and to avoid drifting over the Gulf of Mexico birds piled up on the coast and
then moved north along it. Additionally, Evans (2005) reported that during low cloud
ceiling conditions, altitudinal variations of terrain disrupt the flight of calling migrant
passerines, effectively concentrating calling birds in areas with lower altitudes.
Temporal patterns – Despite the variability in all of these relationships, patterns of call
counts across seasons and years are often consistent and probably represent some true
behavioral and biological patterns (for example, the migration timing of different
species). Conversely, nightly temporal patterns of calling exhibit much greater
variability. These patterns could represent site-specific differences and additional
unknown behavioral and biological patterns. Ball (1952) recorded approximately 90%
of thrush vocalizations in the hours just before dawn with a ratio of 27 calls after
12
midnight to 1 call before midnight (from a total of 33921 calls). Graber and Cochran
(1960) supported this conditionally: although they detected migration consistently at
any hour of the night, there was a marked peak in calling in the hours just before dawn
if migration occurred all night. Farnsworth and Russell (2005) reported a similar
pattern in an acoustic study of migration over the Gulf of Mexico (south of Alabama),
finding that the nightly peak of call counts occurred in the 2 hours just before dawn.
In contrast, call counts of Turdus thrushes in Europe usually peaked in the hours
closest to local midnight, with deviations from this pattern usually associated with a
frontal passage (Siivonen 1936, Browne 1953, Vleugel 1954, 1960). Furthermore,
recent studies found that flight-call counts varied extensively throughout the night,
though many nights showed peaks in the hours close to local midnight (Ross et al.
1995, Farnsworth et al. 2004).
The factors responsible for the variability in nightly patterns of peak call
counts are not known; these might include meteorological phenomena (patterns of
local weather variations; Graber and Cochran 1960, Graber 1968, Evans and Mellinger
1999, Evans and Rosenberg 2000, Evans 2000) and variation in flock sizes and species
composition (Miller 1921, Marler 1956, Hamilton 1962, Thake 1981, 1983,
Farnsworth et al 2004). Some variability might be a function of different species
descending at different times of night and calling at different rates during descent
(Graber 1968). Furthermore, high individual variation in the rate of calling rate could
be a major factor. Cochran (personal communication) placed small microphones on
migrating Swainson’s Thrushes. He found that mean call rates of migrating
Swainson’s Thrushes “ranged from 0 to 37 calls hour-1, including one individual
vocalizing 16 times minute-1 and one individual that did not call for 3 hours.”
Hemispheric patterns – Another intriguing (and as yet unexplained) pattern is that, by
nearly all accounts, vocalization by nocturnally migrating birds in the Palearctic seems

13
to exhibit a different pattern than vocalization in the Nearctic migration system. Calls
occur with greater frequency, greater magnitude, and greater species diversity in the
New World. Whether this is a function of small sample sizes of European studies,
fundamental behavioral differences between the migration systems, phylogenetic
effects, or some combination thereof, the explanation for this pattern is unknown.
Anecdotal accounts from numerous European researchers suggest that flight-calling is
limited even in the species that regularly vocalize at night (see Vleugel 1960 nightly
call counts relative to Ball 1952).
Function of flight-calls
Previous workers have suggested that birds give flight-calls in response to fear
(Hudson 1923), loneliness (Drost 1963), hunger or the light of approaching dawn (Ball
1952). In some species the use of flight-calls might signify the presence of a transient
individual in a resident individual’s territory (Blackbird Turdus merula; Magnus Robb
personal communication). Further anecdotal information indicates that some parulid
warblers might use flight-calls in aggressive interactions, though this behavioral
association is apparently rare (Farnsworth personal observations). Some
monomorphic, non-passerine birds (Swinhoe’s Storm-Petrel Oceanodroma monorhis)
use flight-calls for sex-specific discrimination in situations with limited visual
information (for example, at night; James and Robertson 1985, Taoka and Nakamura
1990), though it is not known whether this is true for passerines. The consensus from
the recent literature, together with anecdotal evidence, suggests that flight-calls
function to maintain groups and to stimulate zugunruhe (migratory restlessness or
activity) in conspecifics, perhaps especially in inexperienced birds (Tyler 1916, Ball
1952, Hamilton 1962, Drost 1963, Graber 1968, Thake 1981, 1983). Hamilton (1962)
presented supporting evidence for these functions of flight-calls from his studies of
captive Bobolinks: calling triggered mutual responses from birds in close proximity

14
and was associated with migratory periods, nightly unrest and increased fluttering, and
calling.
Flight-calls also highlight differences among geographically separated
populations and, at least in some species, allow recognition of individuals (Mundinger
1970, Marler and Mundinger 1975, Mundinger 1979, Adkisson 1981, Groth 1993b,
Hahn et al. 2001, Sewall et al. 2004). Whether the flight-calls of nocturnally
migrating birds perform the same function is not known. Furthermore, whether birds
use flight-calls in a way that is similar to use of contact calls and alarm calls, for group
cohesion and social affiliation, is not known (Mammen and Nowicki 1981, Nowicki
1983, Groth 1993b, Marzlu and Balda 1992, Dufty and Hanson 1999, Baker 2000,
Hahn et al. 2001, Sewall et al. 2004, Baker 2004). Nocturnal groupings might be
social, maintained by flight-calls functioning to communicate such information
(Lowery and Newman 1955, Graber and Cochran 1960, Hamilton 1962, 1967,
Gauthreaux 1972, Balcomb 1977). Interspecific grouping does occur during nocturnal
migration (Graber and Cochran 1960, Hamilton 1962, Evans and Mellinger 1999,
Evans and Rosenberg 2000). However, concentrations could also be random
groupings or the results of small-scale atmospheric motion that could generate such
structure (Larkin 1982).
Although Balcomb (1977) argued against the benefits of coordinated migrant
groups for nocturnal orientation, migrating birds could use flight-calls to obtain
orientation information, to reduce dispersion of headings, and to determine changing
wind direction by echolocation and monitoring Doppler shifts (Lowery and Newman
1955, Griffin 1969, Griffin and Buchler 1978, Thake 1981, 1983); such functions
could be especially useful in reduced visibility, increasing the likelihood of being
heard, hearing others, and avoiding collisions (Graber 1968, D’Arms and Griffin 1972,
Thake 1983, Larom et al. 1997). Such a function could also have particular

15
importance for inexperienced migrants, and there is some evidence to suggest that
young birds vocalize more frequently than adults (Cochran personal communication).
Many flight-calls exhibit a pattern of rapid frequency sweeps that might be
advantageous for birds deriving information (contra Thake 1983), with some
frequencies encountering complex and favorable interference patterns for sound
reflection or retransmission (Griffin and Buchler 1978). The ability to locate calls of
other individuals improves as a function of abrupt beginnings and endings,
discontinuities and repetition (Hamilton 1962), that are also characteristic of many
flight-calls. Birds possess the ability to resolve small changes in frequency (Rock
Pigeon Columba livia: Price et al. 1967; Budgerigar Melopsittacus undulatus: Dooling
and Saunders 1973, Park and Dooling 1985, 1986; Brown et al.. 1988; Ali et al.. 1993;
Barn Owl Tyto alba, Quine and Konishi 1974).
Future directions
As is clear from the review above, major gaps exist in our understanding of flight-
calling behavior. Exploring the immediate causation, the ontogenetic aspects of the
behavior, the behavior’s evolutionary history and the patterns of change over time are
all critical for understanding the functional significance of the behavior (Tinbergen
1963).
Are flight-calls learned? – Although flight-calls are one of the earliest call types to
appear in the repertoire of juvenile cardueline finches (Mundinger 1979), these species
learn and change flight-calls by imitation throughout life (Mundinger 1970). Is this
pattern true for other passerines? Hamilton (1962) suggested that the calls were
innate. Comparing the flight-calls of captive-bred birds with diurnal and nocturnal
vocalizations of wild birds could provide some answers. No detailed seasonal usage
pattern of flight-call vocalizations is available, and developing a time table for many

16
species will probably be informative. Understanding the ontogeny of flight-calls is
crucial for future attempts to classify these calls, and it has important implications for
determining flight-call functions. Furthermore, if flight-calls are learned behaviors in
a diverse array of passerines, the influence of vegetation structure and ambient noise
spectra could play an important role in the development of flight-calls (Hansen 1979,
Nottebohm 1985).
What factors constrain flight-calls? – Recent studies show that different species of
birds have different detection thresholds for signals in ambient noise (Klump 1996,
Langemann et al. 1998), as well as different hearing thresholds (Dooling 1982,
Dooling and Saunders 1975, Okanoya and Dooling 1987). Differences in the
perceptual abilities of species could play important roles in determining variation in
flight-call frequencies. Flight-calls may also experience different selection pressures
related to encoding information (relative to selective pressure on songs).
Reverberation, amplitude modulation rate, consistency of transmission and spectral
distribution of ambient noise are important sonic properties defining song
vocalizations, and these properties vary with selection pressures among habitats
(Marler 1955, Morton 1975, Wiley 1991, Ryan and Brenowitz 1985). How these
properties relate to the use and the function of flight-calls is not known. Additionally,
although Hamilton (1962) did not believe that predators play a major role in shaping
flight-calls, Gill and Sealy (2003, 2004) found evidence that high frequency “seet”
calls alert individuals to brood parasites. Is it possible that flight-calls, similarly high
in frequency and short in duration, could be used to communicate information above
the frequency thresholds of predators (Langemann et al. 1998)? If flight-calls do have
some explicit relationship to fledgling vocalizations (flight-calls originated from such
vocalizations; Tyler 1916), is there a direct relationship between such anti-predatory
behaviors and flight-calls?

17
Over what distances are flight-calls used? – No studies have examined the range of
distances over which birds use flight-calls for communication. Because signals
indicative of longer range communication are lower in frequency (Larom 2002, Larom
et al. 1997, Marten and Marler 1977), the pattern of high frequencies in flight-calls
suggests that flight-calls might be used primarily for short distance communication.
However, the constraints associated with sound production during flight are not
known, but they have implications for nocturnal communication and the architecture
of nocturnal groupings. Furthermore, optimal in-flight communication using certain
frequencies could shape flight-call vocalizations that either travel best in specific
atmospheric and microclimatic strata or avoid specific ambient noise spectra (Larom
2002, Rundus and Hart 2002, Slabbekoorn et al. 2002, Slabbekoorn and Peet 2003).
How variable are flight-call characters – Intraspecific variation in flight-calls is not a
recent discovery (Catharus, Ball 1952), but the extent of this intraspecific variation in
flight-call characters such as frequency has only recently received greater attention
(Hahn et al. 2001, Evans and O’Brien 2002, Sewall et al. 2004). Some evidence
suggests that certain species, notably thrushes, larks, pipits, and finches, have
substantial variation in flight-call characters (Evans and O’Brien 2002, Magnus Robb
personal communication; Cochran unpublished data, Farnsworth and Lanzone in
preparation). The importance of such variation is also unknown, although Mundinger
(1977) suggested that call-matching and imitation could be important factors.
Furthermore, while a few studies have explored the extent of phylogenetic signal in
songs (e.g. kinglets; Packert et al. 2003) and calls (e.g. herons; McCracken and
Sheldon 1997), a limited number of species are represented and none of these studies
explicitly address flight-calls. Similarly, there is nothing known about the existence of
character release in flight-calls: if this exists, what is the relationship between
character release and diversity of related species?

18
Are there potential applications for flight-calls? – Flight-calls are simple vocalizations
(especially relative to songs) and could be useful behavioral characters in comparative
analyses among taxa (Mundinger 1979, Farnsworth and Lovette 2005). Flight-calls
also could aid in resolving cryptic species (Groth 1988) and delineating taxa
(Mundinger 1979, Adkisson 1981, Groth 1988, 1993a, Hahn et al. 2001, Sewall et al.
2004). However, categorizing natural variation in flight-calls and expanding the
sampling of spatial and temporal distributions of flight-call datasets are critical
precursors to pursuing such directions (Sewall et al. 2004, Farnsworth and Lanzone in
preparation). Flight-calls may also shed light on habitat preference and morphology
(Groth 1993 a,b). For example, in phylogenetically controlled and uncontrolled
analyses, Farnsworth and Lovette (2005) found little support for morphological
constraints on flight-call frequencies in parulid wood-warblers. This pattern differs
from the widely reported pattern of birds with larger body mass exhibiting
vocalizations with lower frequencies (Greenewalt 1968, Wallschläger 1980). There
are also diverse and potential powerful applications for monitoring flight-calls to
document broad front patterns of species-specific nocturnal movements and altitudinal
distribution of calling migrants (Tyler 1916, Ball 1952, Graber and Cochran 1960,
Graber 1968, Evans 1994, Evans and Mellinger 1999, Evans and Rosenberg 2000,
Evans 2000) and to identify the points of origin of calling migrants (Evans personal
communication).
The patterns of nocturnal bird migration as detected by radar and acoustic
methods do not always differ, although these methods do illuminate what are likely
fundamental differences in patterns of behaviors (Ross et al. 1995, Larkin et al. 2002,
Farnsworth et al. 2004). Nocturnal call counts of migrating birds can be useful as
indices of nocturnal bird density aloft (Larkin et al.. 2002, Farnsworth et al. 2004),
although extensive variation in calling rates (both among and within species) poses

19
major challenges for measuring bird density from flight-calls alone (Libby 1899,
Graber 1968, Dierschke 1989, Evans and Mellinger 1999, Farnsworth 2001,
Farnsworth et al. 2004). Moreover, there can be substantial differences between high
volume of migration and high incidences of calling (Graber and Cochran 1960, Ross
et al. 1995, Farnsworth et al. 2004). More detailed studies of nocturnal migration
using radar and acoustic methods simultaneously, and studies that span even larger
spatial and temporal scales are necessary to resolve these issues in greater detail.
More studies using stand-alone methods based on flight-call counts are also valuable
(Evans and Mellinger 1999), generating a database of departure and arrival data as
well as relative proportions of species on different nights.
Concluding remarks
Many additional questions remain unanswered, and future studies of flight-calls
clearly face challenges; however, they also provide excellent opportunities for
improving the understanding of avian migration and life histories and the way these
relate to such a variable behavior. Why do some species remain silent during
nocturnal migration? Is the regular use of flight-calls related to other behavioral traits
(flock foraging)? Do birds migrating in similar directions at similar times of the year
show convergent vocalizations (Hamilton 1962 and 1967, Graber 1968, Thake 1981,
1983)? Do birds benefit from reciprocal calling by enhancing associations with
conspecifics and, after landing, by reducing predation risk on the ground (after
Hamilton 1971)? There are numerous applications for flight-calls in applied
conservation, ecological, behavioral, and evolutionary studies. Intraspecific variation
could be the result of proximate factors on a migratory route (dynamic environmental
variation such as changing weather conditions, approaching ecological barriers),
whereas interspecific variation could be the result of ultimate factors (evolution of
migratory strategies, differences in foraging strategies). Regardless of the hypotheses

20
or the applications, it is important to remember that interpreting call counts or flight-
calling behavior could be greatly misleading without considering such underlying
behavioral information (Graber 1968, Evans and Mellinger 1999).

21
Literature Cited Adkisson, C. S. 1981. Geographic-Variation in Vocalizations and Evolution of North-American Pine Grosbeaks. Condor 83: 277-288.
Åkesson, S. 1993. Coastal migration and wind drift compensation in nocturnal passerine migrants. Ornis Scandanavica 24: 87-94.
Baker, M. C. 2000. Cultural diversification in the flight call of the Ringneck Parrot in Western Australia. Condor 102: 905-910.
Baker, M. C. 2004. The chorus song of cooperatively breeding laughing kookaburras (Coraciiformes, Halcyonidae: Dacelo novaeguineae): Characterization and comparison among groups. Ethology 110: 21-35.
Balcomb, R. 1977. The grouping of nocturnal passerine migrants. Auk 94: 479-488.
Ball, S. C. 1952. Fall bird migration in the Gaspé Peninsula. Peabody Museum of Natural History, Yale University Bulletin 7: 1-211.
Black, J. E. 1997. The relation between the number of calls of a nocturnally migrating bird species heard and the actual number of individuals of that species passing overhead. Brock University Physics Department, Brock University, St. Catherines, Ontario. PR-1997-3.
Brown, S. D., R. J. Dooling and K. O’Grady. 1988. Perception organization of acoustic stimuli by budgerigars (Melopsittacus undulatus). III. Contact calls. Journal of Comparative Psychology 102: 236-247.
Browne, P. W. P. 1953. Nocturnal migration of thrushes in Ireland. British Birds 46: 370-274.
Bruderer, B. 1978. Effects of alpine topography and winds on migrating birds. Pages 252–265 in Animal Migration, Navigation, and Homing (K. Schmidt-Koenig and W. Keeton, Eds.). Springer-Verlag, Berlin.
Chapman, F. M. 1888. Observations of the nocturnal migration of birds. Auk 5: 37-39.
Chappuis, C. 1989. Sounds of Migrant and Wintering Birds. Privately published. Two cassettes.
Charif, R. A., S. Mitchell and C. W. Clark. 1995. Canary 1.2 User’s Manual. Cornell Laboratory of Ornithology, Ithaca, NY.
Clark, C. W., P. Marler, and K. Beeman. 1987. Quantitative analysis of animal vocal phonology – an application to Swamp Sparrow song. Ethology 76: 101-115.

22
Clemens, T. 1978. Vergleichende Untersuchung des Nachtvogelzuges auf Helgoland im März 1976 und 1977 nach Radar- und Feldbeobachtungen. Unveröff. Diplomarbeit, Universität Oldenburg, 105 S.
Cochran, W. W. and R. R. Graber. 1958. Attraction of nocturnal migrants by lights on a television tower. Wilson Bulletin 70: 378-380.
Cooke, W.W. 1904. Distribution and migration of North American warblers. U.S. Department of Agriculture, Division of Biological Survey Bulletin No. 18.
Cooke, W.W. 1915. Bird migration. U.S. Department of Agriculture Bulletin No. 185.
D’Arms, E. and D. R. Griffin. 1972. Balloonists’ reports of sound audible to migrating birds. Auk 89: 269-279.
Dierschke, V. 1989. Automatisch-akustische erfassung des nachtlichen vogelzuges bei Helgoland im Sommer 1987. Die Vogelwarte 35: 115-131.
Dooling, R. J. 1982. Auditory perception in birds. Pages 95-110 in Acoustic communication in birds, Volume 1 (Kroodsma, D. E., E. H. Miller, and H. Ouellet, Eds.). New York. Academic Press.
Dooling, R. J. and Saunders, J. C. 1975. Hearing in the parakeet (Melopsittacus undulates): absolute thresholds, critical ratios, frequency difference limits, and vocalizations. Journal of Comparative Physiology and Psychology 88: 1–20.
Drost, R. 1963. Zur Frage der Bedeutung nachtlicher Zugrufe. Die Vogelwarte 22: 23-26.
Dufty, A. M. and A. Hanson. 1999. Vocal and behavioral responses of Brown-headed Cowbirds to flight whistles from different dialects. Condor 101: 484-492.
Eastwood, E. 1967. Radar ornithology. Methuen, London.
Evans, W. R. 1994. Nocturnal flight call of Bicknell's Thrush. Wilson Bulletin 106:55-61.
Evans, W.R. 2000. Applications of acoustic bird monitoring for the wind power industry PNAWPPM-III. Pages 141-152 in Proceedings of National Avian - Wind Power Planning Meeting III, San Diego, California, May 1998 (Prepared for the Avian Subcommittee of the National Wind Coordinating Committee by LGL Ltd.). King City, Ont. 202 p. http://www.nationalwind.org/publications/avian/avian98/21-Evans-Acoustics.pdf
Evans, W. R. 2005. Broad-front migration + Low Cloud Ceiling + Hilly Terrain = Migration Channeling. Abstract, Wilson Ornithological Society Meeting, Washington, D.C.

23
Evans, W. R. and D. K. Mellinger. 1999. Monitoring grassland birds in nocturnal migration. Studies in Avian Biology No. 19: 219-229.
Evans, W. R. and M. O’Brien. 2002. Flight calls of migratory birds: Eastern North American landbirds. CD-ROM. Oldbird, Inc., Ithaca NY.
Evans, W. R. and K. V. Rosenberg. 2000. Acoustic monitoring of night-migrating birds: a progress report. In Strategies for Bird Conservation: Creating the Partners in Flight Planning Process (Bonney, R. E., Jr.; D. N. Pashley and R. Cooper, Eds.). Proceedings of the 3rd Partners in Flight Workshop; 1995 October 1-5; Cape May, NJ. Proceedings RMRS-P-16. Ogden, UT: U.S. Department of Agriculture, Forest Service, Rocky Mountain Research Station.
Farnsworth, A. 2001. The density of nocturnal bird migration: a comparison between Doppler radar and acoustic measures. M.S. thesis, Clemson University, South Carolina.
Farnsworth, A., S. A. Gauthreaux, Jr., and D. Van Blaricom. 2004. A comparison of nocturnal call counts of migrating birds and reflectivity measurements on Doppler radar (WSR-88D). Journal of Avian Biology 35: 365-369.
Farnsworth, A. and I. J. Lovette. 2005. Evolution of nocturnal flight calls in migrating wood-warblers: apparent lack of morphological constraints. Journal of Avian Biology 36: 1-11.
Farnsworth, A. and R. W. Russell. 2005. Evaluation of a Method for Monitoring Audible Fall Bird Migration Traffic Over Platforms. Pages 247-256 in Interactions Between Migrating Birds and Offshore Oil and Gas Platforms in the Northern Gulf of Mexico (Russell, R. W., Ed.). Minerals Management Service Publication 2005-009.
Frazar, A.M. 1881. Destruction of birds by a storm while migrating. Bulletin of the Nuttall Ornithological Club 6: 250-252.
Gauthreaux, S. A., Jr. 1972. Behavioral responses of migrating birds to daylight and darkness: A radar and direct visual study. Wilson Bulletin 84: 136-148.
Gauthreaux, S. A., Jr. 1978. Importance of the daytime flights of nocturnal migrants: Redetermined migration following displacement. Pages 219-227 in Animal migration, navigation, and homing (Schmidt-Koenig, K. and W. T. Keeton, Eds.). Springer-Verlag, Berlin.
Gauthreaux, S. A., Jr., C. G. Belser, and D. Van Blaricom. 2003. Using a network of WSR88-D weather surveillance radars to define patterns of bird migration at large spatial scales. Pages 335-346 in Avian Migration (Berthold, P., E. Gwinner, and E. Sonnenschein, Eds.). Springer-Verlag, Germany.

24
Gill, S. A., and S. G. Sealy. 2003. Tests of two functions of alarm calls given by yellow warblers during nest defence. Canadian Journal of Zoology-Revue Canadienne de Zoologie 81: 1685-1690.
Gill, S. A., and S. G. Sealy. 2004. Functional reference in an alarm signalgiven during nest defence: seet calls of yellow warblers denote brood-parasitic brown-headed cowbirds. Behavioral Ecology and Sociobiology 56: 71-80.
Graber, R. R. 1968. Nocturnal migration in Illinois - different points of view. Wilson Bulletin 80: 36-71.
Graber, R. R. and W. W. Cochran. 1959. An audio technique for the study of the nocturnal migration of birds. Wilson Bulletin 71: 220-236.
Graber, R. R. and W. W. Cochran. 1960. Evaluation of an aural record of nocturnal migration. Wilson Bulletin 72: 252-273.
Greenwalt, C. H. 1968. Bird Song: Acoustics and Physiology. Smithsonian Institution Press, Washington, DC.
Griffin, D. R. 1969. The physiology and geophysics of bird navigation. Quarterly Review of Biology 44: 255-276.
Griffin, D. R. and E. R. Buchler. 1978. Echolocation of extended surfaces. Pages 201-208 in Animal Migration, Navigation, and Homing (Schimdt-Koenig, K. and W. T. Keeton, eds.). Springer-Verlag, Berlin Heidelberg New York.
Groth, J. G. 1988. Resolution of Cryptic Species in Appalachian Red Crossbills. Condor 90: 745-760.
Groth, J. G. 1993a. Call Matching and Positive Assortative Mating in Red Crossbills. Auk 110: 398-401.
Groth, J. G. 1993b. Evolutionary differentiation in morphology, vocalizations, and allozymes among nomadic sibling species in the North American Red Crossbill Loxia curvirostra complex. University of California Publications of Zooloogy. 127: 1-143.
Hahn, T. P., T. R. Kelsey, and M. E. Pereyra. 2001. Geographic variation in flight calls of a nomadic cardueline finch, the evening grosbeak (Coccothraustes vespertinus). American Zoologist 41: 1462-1463.
Hall, G. A., and R. K. Bell. 1981. The diurnal migration of passerines along an Appalachian ridge. American Birds 35: 135-138.
Hamilton, W. J., III. 1962. Evidence concerning the function of nocturnal call notes of migratory birds. Condor 64: 390-401.

25
Hamilton, W. J. III. 1967. Social aspects of bird orientation mechanisms. Pages 57-72 in Animal orientation and navigation (Storm, M., Ed.). Oregon State University Press, Corvallis, OR.
Hamilton, W. D. 1971. Geometry for the selfish herd. Journal of Theoretical Biology 31: 295-311.
Hansen, P. 1979. Vocal learning: its role in adapting sound structure to long distance propagation, and a hypothesis on its evolution. Animal Behavior 27: 1270-1271.
Hedges, S. 2001. Developing and implementing a bird migration monitoring assessment, and public outreach program for your community: The Birdcast Project. United States Environmental Protection Agency 625 R-01/007. National Risk Management Research Laboratory, Office of Research and Development, US EPA, Cincinnati, OH.
Herremans M. 1993. Why is artificial grounding of migratory passerines at night rather unsuccessful in southern Africa? Safring News 22: 43-46.
Howes, P. G. 1912. Fall migration of the Olive-backed Thrush, 1912. The Oologist 31:162-167.
Hudson, W. H. 1923. A hind in Richmond Park. E. P. Dutton and Company, New York.
James, P. C. and H. A. Robertson. 1985. The Calls of Male and Female Madeiran Storm-Petrels (Oceanodroma castro). Auk 102: 391-393.
Klump, G. M. 1996. Bird communication in the noisy world. Pages 321-393 in Ecology and Evolution of Acoustic Communication in Birds.(Kroodsma, D. E. and E. H. Miller, Eds.). Ithaca, New York. Cornell University Press.
Koenig, W., H. K. Dunn, and L. Y. Lacy. 1946. The sound spectrograph. Journal of the Acoustical Society of America 18: 19–49.
Kopman, H. H. 1904. Bird migration phenomena in the extreme lower Mississippi Valley. Auk 11: 45-50.
Langemann, U., Gauger, B., and Klump, G. M. 1998. Auditory sensitivity in the great tit: perception of signals in the presence and absence of noise. Animal Behaviour 56: 763–769.
Larkin. R. P. 1978. Radar observations of behavior of migrating birds in response to sounds broadcast from the ground. Pages 209-218 in Animal Migration, Navigation, and Homing (Schimdt-Koenig, K. and W. T. Keeton, eds.). Springer-Verlag, Berlin Heidelberg New York.

26
Larkin, R. P. 1982. Spatial distribution of migrating birds and small-scale atmospheric motion. Pages 29-37 in Avian Navigation (Papi, R. and H. G. Walraff, eds.). Springer-Verlag, Berlin.
Larkin, R. P., W. R. Evans and R. H. Diehl. 2002. Nocturnal flight calls of Dickcissels and Doppler radar echoes over south Texas in spring. Journal of Field Ornithology 73: 2-8.
Larom, D. 2002. Auditory communication, meteorology, and the Umwelt. Journal of Comparative Psychology 116: 133–136.
Larom, D., Garstang, M., Payne, D., Raspet, R., and Lindeque, M. 1997. The influence of surface atmospheric conditions on the range and area reached by animal vocalizations. Journal of Experimental Biology 200: 421-431.
Libby, O. G. 1899. The nocturnal flight of migrating birds. Auk 16: 140-145.
Lowery, G. H., Jr. 1945. Trans-Gulf migration of birds and the coastal hiatus. Wilson Bulletin 57: 92-121.
Lowery, G. H., Jr. 1946. Evidence of trans-Gulf migration. Auk 63: 175-211.
Lowery, G. H., Jr. and R.J. Newman 1955. Direct studies of nocturnal bird migration. Pages 238-263 in Recent Studies in Avian Biology (Wolfson, A. Ed.). University of Illinois Press.
Mammen, D. L., and S. Nowicki. 1981. Individual-Differences and Within-Flock Convergence in Chickadee Calls. Behavioral Ecology and Sociobiology 9: 179-186.
Marler, P. 1955. Characteristics of Some Animal Calls. Nature 176: 6-8.
Marler, P. 1956. Behaviour of the Chaffinch. Behaviour Supplement 5.
Marler, P. 2004. Bird calls - Their potential for behavioral neurobiology. Behavioral Neurobiology of Birdsong 1016: 31-44.
Marler, P. and P. C. Mundinger. 1975. Vocalization, social organization, and breeding biology of Twite Acanthis flavirostris. Ibis 117: 1-7.
Marten, K. and P. Marler. 1977. Sound transmission and its significance for animal vocalization I: temperate habitats. Behavioral Ecology and Sociobiology 2: 271-290.
Marzlu, J. M. and R. P. Balda. 1992. The Pinyon Jay: Behavioral Ecology of a Colonial and Cooperative Corvid. T. & A. D. Poyser, London.

27
McCracken, K. G. and F. H. Sheldon. 1997. Avian vocalizations and phylogenetic signal. Proceedings of the National Academy of Sciences of the United States of America 94: 3833-3836.
Millikin, R. L. 1998. A preliminary analysis of acoustic recordings of migrating birds at Rocky Point, British Columbia. Canadian Wildlife Service, Pacific and Yukon Region.
Millikin, R. L. 2002. Sensor fusion for the localization of birds in flight. Ph.D. Dissertation. Royal Military College of Canada, Kingston, Ontario.
Mills, H. G. 1995. Automatic detection and classification of nocturnal migrant bird calls. Journal of the Acoustical Society of America 97: Abstract.
Mills, H. G. 2000. Geographically distributed acoustical monitoring of migrating birds. Journal of the Acoustical Society of America 108: 2582.
Moore, F. R. 1987. Sunset and the orientation behavior of migrating birds. Biological Reviews of the Cambridge Philosophical Society 62: 65-86.
Morton, E. S. 1975. Ecological sources of selection on avian sounds. American Naturalist 109: 17-34.
Mundinger, P. C. 1970. Vocal imitation and individual recognition of finch calls. Science 168: 480-482.
Mundinger, P. C. 1979. Call learning in the Carduelinae: ethological and systematic considerations. Systematic Zoology 28: 270-283.
Nottebohm, F. 1985. Sound transmission, signal salience, and song dialects. Behavioral and Brain Sciences 8: 112-113.
Nowicki, S. 1983. Flock-specific recognition of chickadee calls. Behavior Ecology and Sociobiology 12: 317-320.
Ogden, J. 1960. Observations at a T.V. tower during a bird fall. Migrant 31: 65-67.
Okanoya, K. and Dooling, R. J. 1987. Hearing in passerine and psittacine birds: a comparative study of absolute and masked auditory thresholds. Journal of Comparative Psychology 101: 7-15.
Packert, M., J. Martens, J. Kosuch, A. A. Nazarenko, and M. Veith. 2003. Phylogenetic signal in the songs of crests and inglets (Aves: Regulus). Evolution 57: 616-629.
Palmgren, P. 1949. On the diurnal rhythm of activity and rest in birds. Ibis 91: 561-576.

28
Park, T. J. and R. J. Dooling 1985. Perception of species-specific contact calls by the budgerigar (Melopsittacus undulatus). Journal of Comparative Psychology 99: 391-402.
Parslow, J. L.F. 1969. The migration of passerine night migrants across the English Channel studied by radar. Ibis 111: 48-79.
Peterssen, S. 1956. Weather analysis and forecasting, Volume 1: Motions and motion systems. McGraw Hill.
Richardson, W. J. 1978. Timing and amount of bird migration in relation to weather – a review. Oikos 30: 224-272.
Richardson, W. J. 1990. Timing of bird migration in relation to weather: Updated review. Pages 78-101 in Bird migration: physiology and ecophysiology (Gwinner, E., Ed.). Springer.
Ross, R., S. Smith, and J. E. Black. 1995. A fall study (1995) of nocturnal bird migrations in southern Ontario using acoustic microphones and radar. Brock University Physics Department, Brock University, St. Catherines, Ontario. PR-1995-6.
Rundus, A. S. and Hart, L. A. 2002. Overview: Animal acoustic communication and the role of the physical environment. Journal of Comparative Psychology 116: 120-122.
Ryan, M. J. and Brenowitz, E. A. 1985. The role of body size, phylogeny, and ambient noise in the evolution of bird song. American Naturalist 126: 87-100.
Sewall, K., R. Kelsey, and T. P. Hahn. 2004. Discrete variants of Evening Grosbeak flight calls. Condor 106: 161-165.
Siivonen, L. 1936. Die Starkevariation des nachtlichten Zuges bei Turdus ph. philomelos und T. musicus L., auf Grund der Zuglaute einer gekafigten Singdrossel verglichen. Ornis Fennica 13: 59-63.
Slabbekoorn, H., Eller, J., and Smith, T. B. 2002. Birdsong and sound transmission: The benefits of reverberations. Condor 104: 564–573.
Slabbekoorn, H. and M. Peet. 2003. Birds sing at a higher pitch in urban noise. Nature 424: 267.
Taoka, M. and H. Okumura. 1990. Sexual Differences in Flight Calls and the Cue for Vocal Sex Recognition of Swinhoe’s Storm-Petrels. Condor 92: 571-575.
Taylor, A. J. 1995. Bird Flight Call Discrimination using Machine Learning. Pages 3369-3371 in Proceedings of 129th Meeting: Acoustical Society of America, Washington, DC, May 1995. Acoustical Society of America.

29
Thake, M. A. 1981. Calling by nocturnal migrants: A device for improving orientation? Die Vogelwarte 31: 111.
Thake, M. A. 1983. "A simple model for use of Doppler shifted vocalizations by migrating birds." Die Vogelwarte 32: 33-39
Tinbergen, N. 1963. On aims and methods of ethology. Zeitschrift fur Tierpyschologie 20: 410-433.
Thayer, G. H. 1903. The Mystery of the Black-billed Cuckoo. Bird Lore 5: 143-145.
Tyler, W. M. 1916. The call-notes of some nocturnal migrating birds. Auk 33: 132-141.
van den Berg, A. B., M. Constantine, and M. S. Robb. 2003. Out of the blue: flight calls of migrants and vagrants. The Sound Approach/Dutch Birding. CD-ROM.
Vleugel, D. A. 1954. Waarnemingen over de nachttrek van lijsters (Turdus) en hun waarschijnlikje orienteering. Limosa 27: 1–9.
Vleugel, D. A. 1960. On the temporal pattern of nocturnal migration in thrushes. Auk 77: 10-18.
Wallschläger, D. 1980. Correlation of song frequency and body-weight in passerine birds. Experientia 36: 412.
Wiedner, D. S., P. Kerlinger, D. A. Sibley, P. Holt, J. Hough, and R. Crossley. 1992. Visible morning flight of neotropical landbird migrants at Cape May, New Jersey. Auk 109: 500-510.
Wiley, R. H. 1991. Associations of song properties with habitats for territorial oscine birds of Eastern North America. American Naturalist 138: 973-93.
Williams, G. G. 1945. Do birds cross the Gulf of Mexico in spring? Auk 62: 98-111.
Williams, G. G. 1947. Lowery on trans-Gulf migration. Auk 64: 217-238.
Williams, T. C., J. M. Williams, P. G. Williams, and P. Stokstad. 2001. Bird migration through a mountain pass studied with high resolution radar, ceilometers, and census. Auk 118: 389-403.
Yodlowski, M. L., M. L. Kreithen, and W. T. Keeton. 1977. Detection of atmospheric infrasound by homing pigeons. Nature 265: 725-726.

30
CHAPTER TWO: EFFECTS OF WEATHER CONDITIONS ON FLIGHT-CALL
COUNTS OF NOCTURNALLY MIGRATING BIRDS*
Abstract
Monitoring flight-calls of migrating birds may be a useful way to quantify bird
numbers across space and time, but migrant density and call counts are only loosely
correlated. In an effort to determine additional sources of call count variation and to
improve upon simple density-call count models, we examined relationships between
10 weather variables and hourly call counts with and without removing statistically the
effects of bird density. We sampled radar, acoustic, and local climatic data hourly for
556 hours during 58 nights in western SC and southeastern NY. Although call counts
were significantly correlated to bird density and weather variables, call counts were
not significantly correlated to weather conditions after statistically controlling for
density effects. Weather factors improved explanatory power of simple density-call
count models, but additional variation in call counts remained unexplained.
Introduction
Conservation of migrant birds is a high priority (Andrew and Andres 2002, Donovan
et al. 2002, Ruth et al. 2003, Tankersley 2004, Kelly and Hutto 2005). Some current
migration monitoring programs have either used or proposed acoustic monitoring of
flight-calls as a method for quantifying migration, identifying species-specific routes,
and enhancing monitoring protocols with information about passing migrants that
traditional methods might not detect (Evans and Mellinger 1999, Evans 2000, Evans
and Rosenberg 2000, Hedges 2001). Flight-calls are vocalizations primarily given by
birds in sustained flight, and the vocalizations are usually single notes that are less
* Andrew Farnsworth, Department of Ecology and Evolutionary Biology, Cornell Laboratory of Ornithology, Cornell University, Ithaca, NY 14850; Sidney A. Gauthreaux, Jr., Department of Biological Sciences, Clemson University, Clemson, SC 29630.

31
than one second in duration and that vary among species in frequency, modulation,
and bandwidth (see Evans and O’Brien 2002 and Farnsworth 2005 for additional
definitions).
Flight-call monitoring theoretically could be useful for generating estimates of
the number of vocal birds passing at night (Evans and Mellinger 1999), but models
based on radar reflectivity measurements of bird density suggest that call counts vary
extensively from hour-to-hour and night-to-night (Larkin et al. 2002, Farnsworth et al.
2004). Additional variables might increase the explanatory power of such models and
provide clues for understanding flight-calling behavior.
Atmospheric conditions that promote or inhibit bird migration are well known,
and similar conditions generally correspond to similar migratory behaviors across a
broad geographic range (for examples, see Lack 1960, Nisbet and Drury 1968, Able
1973, Richardson 1990, Erni et al. 2003). The relationships between weather
conditions and flight-calling behavior are less clear and not sufficiently understood to
be generally applicable across geographic regions. The following patterns are
apparent (Farnsworth 2005): 1) call counts increase with increasing cloud cover and
decreasing cloud ceiling, especially in the presence of artificial lighting (Cochran and
Graber 1958, Graber and Cochran 1960, Ogden 1960, Graber 1968, Clemens 1978,
Dorka 1966, Thake 1983, Evans and Mellinger 1999) and as birds approach frontal
boundaries (Graber and Cochran 1960); 2) call counts of Turdus thrushes in Holland
during autumn increased with the passage of cold fronts and decreasing temperature
(Vleugel 1960); and 3) call counts correlated positively with 24-hour trends of falling
temperatures in autumn and rising temperatures in the spring in Illinois (Graber and
Cochran 1960). These studies suggest that increasing call counts associate with poor
flying conditions and, perhaps more generally, with conditions associated with
movements of areas of low air pressure (hereafter, frontal passages or boundaries).

32
Additionally, calling is density-dependent. Therefore, higher call counts may be
associated with poor flying conditions and frontal passages or with large movements
of birds, or both (Graber 1968).
Here, we test for the significance of the correlation between poor weather
conditions and call counts. We examine relationships between local weather
conditions and call counts of nocturnally migrating birds using a unique data set that
combines local climatological data and previously published call count data and radar
reflectivity measurements of bird density aloft (Farnsworth et al. 2004).
Methods
Data collection methods are described in Farnsworth et al. 2004. To summarize
briefly, we sampled flight-calls of nocturnally migrating birds using a pressure zone
microphone stationed on the roof of a house. We recorded the audio stream from each
night to videocassettes and then digitized these data using software available on the
Internet (www.oldbird.org). This software detects calls in user-defined frequency
ranges based on the strength of the call signal relative to background noise levels, and
time- and date-stamps the resultant .wav file. Additionally, we sampled radar
reflectivity measurements of bird density from the displays of the WSR-88D radar
during spring and fall 2000 in western South Carolina (Clemson and KGSP
Greenville-Spartanburg) and southeastern New York (Rye and KOKX New York).
We gathered base reflectivity and radial velocity data from the Clemson University
Radar Ornithology Laboratory archive of WSR-88D products (Gauthreaux and Belser
1998, Gauthreaux et al. 2003). Detailed description of the screening, validation, and
analysis procedures for these radar data are available in Farnsworth (2001),
Gauthreaux et al. (2003), and Farnsworth et al. (2004). We sampled hourly for 556
hours during 58 nights (30 minutes after sunset to 30 minutes before sunrise). We also
gathered local climatic data from weather recording stations at Greenville-Spartanburg

33
Airport, Greer, SC and Westchester County Airport, White Plains NY (approximately
60 km and 12 km from the audio recording locations, respectively; local
climatological data are available online from National Climatic Data Center,
www.ncdc.noaa.gov).
We used the following 10 weather variables in our analyses: local barometric
pressure, visibility, dry bulb and wet bulb temperatures (dry bulb is air temperature
typically reported by a thermometer, whereas wet bulb temperature is reported from a
thermometer wrapped in a wet cloth reflecting the cooling effect of evaporating
water), dew point temperature, relative humidity, meridional wind (–(wind speed) *
cos (wind direction); a positive value indicates southerly winds), zonal wind (–(wind
speed) * sin (wind direction); a positive value indicates westerly winds), sky cover,
and cloud ceiling. Because these variables are not independent, we used the SAS
version 9.1.3 PROC FACTOR statement (SAS 2000-2004) to remove the effects of
dependence and reduce the number of variables in our models by extracting principal
component (PC) axes. We selected PCs from this analysis for use in regression
models. We chose components based on eigenvalue scores, excluding any component
loading an eigenvalue less than one (these components explain less variation than any
of the original variables). We used SAS version 9.1.3 PROC REG statements (SAS
2000-2004) to model relationships among call counts, bird density, and PCs extracted
from the weather variables. We also used the residuals of call count-bird density
models as a density control to regress call counts on the weather PCs with the effects
of bird density removed. In addition, we included two other non-meteorological
variables, Julian date and number of hours after sunset, in all models.
We set our initial significance level to α = 0.05. However, we corrected for
multiple comparisons by using a typical Bonferroni correction (e.g., Miller 1981), and
we set our adjusted significance level to α = 0.002 to account for 24 significance tests.

34
We also used a slightly less conservative sequential Bonferroni technique to generate a
similar adjusted significance value (Holm’s Method: see Holm 1979, Rice 1989;
assessments use the statement P1 ≤ α/(1 + k – i) where k is the number of comparisons
and i is the number of the sequential repetition from 0 to k). We use the term non-
significant trend (trend) for any analyses producing significance values between P =
0.05 and P = 0.002.
We defined the following poor flying conditions (flying conditions: Lack 1960,
Able 1973, Richardson 1990, Erni et al. 2003; frontal boundaries: Peterssen 1956) to
assess the effects of seasonally appropriate weather on flight-call counts:
1) For spring, increasing barometric pressure, visibility, sky cover, cloud ceiling
and zonal winds and decreasing dry bulb and wet bulb temperatures, dew
point, relative humidity, and meridional winds. These conditions are
associated with the passage of a low pressure center consistent with poor
visibility, overcast conditions and easterly winds (pre-frontal) followed by
cooler temperatures, lower humidity, clearing skies, and northerly winds (post-
frontal).
2) For fall, decreasing barometric pressure, visibility, sky cover, cloud ceiling and
zonal winds, dry bulb and wet bulb temperatures, dew point, relative humidity,
and meridional winds. These conditions are associated with the approach of a
low pressure center consistent with warmer temperatures, high humidity,
southerly winds, and eventually poor visibility (pre-frontal) followed by
westerly winds, cooler temperatures, and clearing skies (post-frontal).
We did not include precipitation in our analyses of call counts and weather conditions
despite clear associations between precipitation and poor flying conditions (e.g. Erni et

35
al. 2003). Precipitation obscured birds on radar, making separation of birds and
precipitation from radar imagery impossible in any areas where the two overlap in a
radar scan. In addition, precipitation confounded audio recording because high levels
of ambient noise associated with precipitation falling on the microphone made
detecting relatively weak flight-call signals impossible.
Results
Principal Component Analysis
We extracted three PCs for the weather data in hourly call analyses that accounted for
97% of the variation in the 10 weather variables (Table 2.1). PC1 loaded positive
correlations for barometric pressure and meridional and zonal winds and negative
correlations for sky cover. PC2 loaded positive correlations of the three temperature
variables. PC3 loaded positive correlations for relative humidity.
Call Count Relationships
In Clemson spring call counts exhibited significant correlations for each of the three
PCs without statistical control of bird density (Table 2.2.) However, with density
controls we found no significant patterns between the residuals of call counts and any
PC. Fall relationships between call counts and PCs with and without density controls
are similar to the patterns we found for spring analyses. The major distinction is that
we found trends in count residuals with PC1 and PC3 (Table 2.2). The addition of
Julian date and number of hours after sunset to each model by season did little to
improve significant models (4-10% increase in variance explained, data not shown).

36
Table 2.1. Results of a principal component analysis for 10 surface weather variables. Eigenvalue shows the value for each component extracted by the analysis. Proportion shows the proportion of variation explained by each component. Cumulative represents the total amount of variation in the data explained by each component. Factor Loadings are correlation coefficients for each component by weather variable. High scores indicate that variables are well-represented by a component.
Principal Component 1 2 3
Eigenvalue 3.95 3.16 1.02 Proportion 0.47 0.38 0.12 Eigenvalues Cumulative 0.47 0.85 0.97
Cloud Ceiling 0.56 -0.15 -0.22 RelHum 0.06 0.10 0.97
Sky Cover -0.96 0.06 0.03 Pressure 0.99 -0.02 0.05 Visibility 0.04 -0.20 -0.45 DryBulb -0.07 1.00 -0.01 WetBulb -0.04 0.95 0.31 DewPoint -0.03 0.83 0.53 EWWind 0.83 0.05 0.09
Factor Loadings
NSWind 0.98 -0.01 0.05
In Rye spring call counts did not correlate significantly with any PC without
controlling for bird density (Table 2.3). However, call count residuals showed a non-
significant trend with each PC (Table 2.3). For fall data we found no significant
relationship between call counts and any PC with and without controlling for bird
density (Table 2.3). When we added Julian date and number of hours after sunset to
Rye models, the percentage of variation explained improved drastically in some cases
(Table 2.4). In particular, spring models with density controls for PC1 and PC3
showed greater than 4-fold improvements in variance explained when models included
Julian date and number of hours after sunset. In addition to similar improvements in
the fall, a non-significant relationship between calls without density controls and PC3
became significant (Table 2.4).

37
Table 2.2. Models of call counts with and without statistical controls for density effects for Clemson, SC. Each row represents a model from a given season of sample size N hours. Responses show call counts with and without density controls. Regressor represents the independent model terms. Correlated variables show which weather variables loaded high correlation coefficients from the PCA analysis for easing interpretation. R2 and P-values come from model outputs. Sign of parameter estimate shows the model sign of the slope value for given regressors. Flying conditions and frontal location represent an analysis of seasonally appropriate weather conditions associated for the given model regressors.
N Season Response Regressor Correlated Weather Variables R2 P Sign of Parameter
Estimate Flying
Conditions Frontal
Location
Calls Density, PC1 0.11 0.0008 Negative Poor Passage
Call Residuals PC1
Barometric Pressure, Sky Cover, Meridional and Zonal Winds
0 0.49 Negative Poor Passage
Calls Density, PC2 0.13 0.0003 Negative Poor Passage
Call Residuals PC2
DryBulb, WetBulb, and DewPoint Temperatures
0.02 0.09 Negative Poor Passage
Calls Density, PC3 0.11 0.0008 Positive Favorable Approach
124 Eigenvalue
Call Residuals PC3
Relative Humidity
0.01 0.23 Negative Poor Passage
Calls Density, PC1 0.17 < 0.0001 Negative Favorable Passage
Call Residuals PC1
Barometric Pressure, Sky Cover, Meridional and Zonal Winds
0.03 0.01 Negative Favorable Passage
Calls Density, PC2 0.16 < 0.0001 Negative Favorable Passage
Call Residuals PC2
DryBulb, WetBulb, and DewPoint Temperatures
0 0.88 Positive Poor Approach
Calls Density, PC3 0.19 < 0.0001 Positive Poor Approach
216 Fall
Call Residuals PC3
Relative Humidity
0.04 0.02 Positive Poor Approach

38
Table 2.3. Models of call counts with and without statistical controls for density effects for Rye, NY. Each row represents a model from a given season of sample size N hours. Responses show call counts with and without density controls. Regressor represents the independent model terms. Correlated variables show which weather variables loaded high correlation coefficients from the PCA analysis for easing interpretation. R2 and P-values come from model outputs. Sign of parameter estimate shows the model sign of the slope value for given regressors. Flying conditions and frontal location represent an analysis of seasonally appropriate weather conditions associated for the given model regressors.
N Season Response Regressor Correlated Weather Variables R2 P Sign of Parameter
Estimate Poor Flying Conditions
Frontal Location
Calls Density, PC1 0 0.94 Negative Poor Passage
Call Residuals PC1
Barometric Pressure, Sky Cover, Meridional and Zonal Winds
0.08 0.01 Positive Favorable Approach
Calls Density, PC2 0 0.93 Negative Poor Passage
Call Residuals PC2
DryBulb, WetBulb, and DewPoint Temperatures
0.17 0.003 Negative Poor Passage
Calls Density, PC3 0 0.93 Positive Favorable Approach
69 Eigenvalue
Call Residuals PC3
Relative Humidity
0.07 0.03 Positive Favorable Approach
Calls Density, PC1 0.01 0.45 Negative Poor Approach
Call Residuals PC1
Barometric Pressure, Sky Cover, Meridional and Zonal Winds
0.01 0.25 Positive Favorable Passage
Calls Density, PC2 0.03 0.09 Negative Favorable Passage
Call Residuals PC2
DryBulb, WetBulb, and DewPoint Temperatures
0.01 0.15 Positive Favorable Passage
Calls Density, PC3 0.03 0.11 Negative Favorable Passage
144 Fall
Call Residuals PC3
Relative Humidity
0 0.8 Negative Favorable Passage

39
Table 2.4. Models of call counts with weather, Julian date, number of hours after sunset, and combined effects with and without controls for density effects for Rye, NY. Each row represents a model from a given season of sample size N hours. Responses show call counts with and without density controls. Regressor represents the independent model terms. Correlated variables show which weather variables loaded high correlation coefficients from the PCA analysis for easing interpretation. R2 and P-values come from model outputs.
Weather Weather+Julian Weather+Sunset Weather+Julian and Sunset
N Eigenvalue Response Regressor R2 P R2 P R2 P R2 P
Calls Density, PC1 0.002 0.94 0.05 0.34 0.04 0.41 0.07 0.34
Call Residuals PC1 0.08 0.01 0.19 0.0009 0.18 0.002 0.33 <0.0001
Calls Density, PC2 0.002 0.93 0.05 0.34 0.04 0.4 0.07 0.34
Call Residuals PC2 0.17 0.003 0.28 <0.0001 0.26 <0.0001 0.4 <0.0001
Calls Density, PC3 0.002 0.93 0.06 0.3 0.04 0.4 0.07 0.3
69 Spring
Call Residuals PC3 0.07 0.03 0.17 0.002 0.15 0.004 0.31 <0.0001
Calls Density, PC1 0.01 0.45 0.02 0.51 0.06 0.05 0.06 0.09
Call Residuals PC1 0.009 0.25 0.09 0.002 0.15 <0.0001 0.24 <0.0001
Calls Density, PC2 0.03 0.09 0.03 0.19 0.06 0.03 0.06 0.06
Call Residuals PC2 0.01 0.15 0.08 0.004 0.19 <0.0001 0.24 <0.0001
Calls Density, PC3 0.03 0.11 0.03 0.18 0.12 0.0005 0.12 0.001
144 Fall
Call Residuals PC3 0.004 0.8 0.08 0.004 0.19 <0.0001 0.3 <0.0001

40
Poor Seasonally Appropriate Flying Conditions
Clemson
In analyses uncontrolled for bird density spring call counts showed significant
negative correlations with PC1 and PC2 and a significant positive correlation with
PC3 (Table 2.2). The conditions associated with these PCs are decreasing pressure,
northerly and easterly winds, and increasing sky cover (negative PC1); decreasing
dewpoint, dry bulb, and wet bulb temperatures (negative PC2); and increasing relative
humidity (positive PC3). Weather associated with PC1 and PC2 are characteristic of
poor flying conditions during spring associated with the passage of a cold front.
Weather associated with PC3 is characteristic of more favorable flying conditions in
advance of a frontal approach.
We found a similar pattern for fall counts uncontrolled for bird density with
significant negative correlations between call count and PC1 and PC2 and a significant
positive correlation between call count and PC3 (Table 2.2). These PCs correspond to
increasing pressure, northerly and easterly winds, and increasing sky cover (negative
PC1); decreasing dewpoint, dry bulb, and wet bulb temperatures (negative PC2); and
increasing relative humidity (positive PC3). Weather associated with PC1 and PC2 are
characteristic of favorable flying conditions during fall associated with the passage of
a cold front. Weather associated with PC3 is characteristic of poorer flying conditions
as a front approaches.
We did not find any significant correlations between call counts residuals and
PCs in either season. However, there are two trends in the fall analyses. Call
residuals showed non-significant trends with PC1 and PC3, corresponding to
increasing pressure, northerly and easterly winds, and increasing sky cover (negative
PC1) and increasing relative humidity (positive PC3).

41
Rye
In analyses uncontrolled for bird density we found no significant correlations between
call counts and PCs in either season (Table 2.3). However, in analyses controlled for
bird density spring count residuals showed significant negative correlations with PC2
(R2 = 0.17, P = 0.003). Weather conditions associated with this PC are decreasing
dewpoint, dry bulb, and wet bulb temperatures (-PC2), characteristic of poor flying
conditions after the passage of a cold front. We also found positive trends for count
residuals and PC1 and PC3 (P = 0.01 and P = 0.03, respectively), associating
increasing pressure, southerly and westerly winds, decreasing sky cover (+PC1) and
increasing relative humidity (+PC3). Weather associated with PC1 is characteristic of
poor flying conditions after a frontal passage, while conditions associated with PC3
are more favorable for flying. Fall analyses controlling for density effects did not
show any significant relationships or trends between call counts and PCs.
Discussion
Despite positive correlations between flight-call counts and bird density, bird density
alone does not always explain much of the variation in nocturnal call counts (Larkin et
al. 2002; Table 2.5 displays specific results from Farnsworth 2001 and Farnsworth et
al. 2004). Our results suggest that weather factors could explain some of the
unexplained call count variation. For example, models from Clemson for both seasons
showed improvement in R2 values when PCs of weather variables are included (Table
2.2). Our results also suggest that higher call counts are associated with poor flying
conditions and frontal passages in conjunction with large movements of birds (Tables
2.2 and 2.3). Clemson call counts without density controls correlated significantly
with poor flying conditions (PC1 and PC2 in spring, PC3 in fall) or those conditions
associated with the passage or approach of a frontal boundary (PC3 in spring, PC1 and
PC2 in fall). However, in controlling for density effects our data showed only non-
42
significant trends in associations between call count residuals and poor flying
conditions or frontal passages.
The addition of Julian date and number of hours after sunset explained little
additional variation in Clemson models. However, Rye models with and without
density controls improved two- to four-fold in percentage of variance explained. The
effect of number of hours after sunset followed a similar pattern at both site,
suggesting that more calling occurs as hours after sunset increases. The effects of
Julian date appear more complex: at Clemson, more calls are associated with later
dates with and without density controls; at Rye, more calls are associated with earlier
dates without density controls. Because Rye is a coastal location in the Northeastern
US, the effects of the time of year and time of night may be more striking than at
Clemson due to the composition of birds passing and the positions of origins and
destinations.
Higher call counts may associate with frontal passages because large numbers
of birds tend to be present under such conditions (Lack 1960, Graber 1968, Nisbet and
Drury 1968, Able 1973, Richardson 1990, Larkin et al. 2002, Erni et al. 2003).
Calling could hasten grouping or descent in the face of poor flying conditions, in
agreement with theories describing the pattern of increased call counts as a function of
descent at the end of a night of migration (Ball 1952, Lowery and Newman 1955,
Newman 1956, Graber and Cochran 1960, Graber 1968). We speculate that calling
facilitates communicating positional information or maintaining association during
landing (or both) and may be adaptive for birds maintaining flock structure after
landing (Hamilton 1962, Graber 1968, Griffin 1969, Thake 1983). This may be
especially useful in the vicinity of frontal boundaries, where higher call counts could
indicate that birds are attempting to stimulate conspecifics to organize or to land. As
such, we would expect call counts to correlate with weather conditions regardless of

43
the migration density to support such a hypothesis. However, we found only non-
significant trends to suggest that such a pattern might exist. Additional studies could
clarify the meaning of these trends to support or to refute this hypothesis.
Table 2.5. Simple models of call counts and bird density from Farnsworth (2001) and Farnsworth et al. (2004). N is the sample size for each model representing total hour observations for each location by season.
Location N Season R2 P New York Eigenvalue Spring 0.00 0.77
144 Fall 0.01 0.21 South Carolina 124 Spring 0.11 0.0002
216 Fall 0.16 < 0.0001
A number of drawbacks in the present study require attention in future studies.
We sampled weather conditions at ground level and not at higher altitudes where birds
are flying. We also sampled local climatic data and flight-calls at different locations;
and although several studies suggest that generalizing local temperatures from lower
resolution, regional data are still valid (i.e. downscaling; see Wilks 1989, Carbone and
Bramante 1995, Brinkmann 2002, Tatli et al. 2005), the lack of geographic
correspondence undoubtedly introduced error into our models. Furthermore, this
study has the same potential sources of error as described by Farnsworth et al. (2004),
stemming from an imperfect relationship between bird density and radar reflectivity
measurements (Gauthreaux and Belser 1999). Finally, we did not control for artificial
illumination, which probably contributes to changes in calling rates and flight
behaviors in migrating birds (Cochran and Graber 1958, Graber 1968, Gauthreaux and
Belser 2006).
More extensive studies of weather and call counts across multiple years and
broader geographic range that incorporate more complete atmospheric profiles (for
example, conditions aloft in the densest layers of migration) in close proximity to

44
recording stations could substantially improve our understanding of flight-calling
behavior. However, while weather factors improve models of call count variation,
much additional variation remains unexplained. We speculate that this additional
variation could be the result of differences among species, including species-specific
calling behaviors (such as rates and temporal pattern of calling), and species-specific
migration timing. As such, future studies would also benefit from direct analysis of
species-specific calling patterns and by including such variables into the models of
call counts and bird density. Expanding studies in these ways could provide insight
into observed patterns of flight-calling behavior as well as their functions.

45
Literature Cited Able, K. P. 1973. The role of weather variables in the study of nocturnal bird migration. Ecology 54: 1031-1041.
Andrews, J. M. and Andres, B. A. 2002. Towards integrated bird conservation in North America: A US Fish and Wildlife Service perspective. Waterbirds 25: 122-127.
Ball, S. C. 1952. Fall bird migration on the Gaspe Peninsula. Bulletin of the Peabody Museum 7: 1-211.
Brinkmann, W. A. R. 2002. Local versus remote grid points in climate downscaling. Climate Research 21: 27-42.
Carbone, G. J. and Bramante, P. D. 1995. Translating monthly temperature from regional to local scale in the southeastern United States. Climate Research 5: 229-242.
Clemens, T. 1978. Vergleichende Untersuchung des Nachtvogelzuges auf Helgoland im März 1976 und 1977 nach Radar- und Feldbeobachtungen. Unveröff . Diplomarbeit, Universität Oldenburg.
Donovan, T. M., Beardmore, C. J., Bonter, D. N., Brawn, J. D., Cooper, R. J., Fitzgerald, J. A., Ford, R., Gauthreaux, S. A. Jr., George, T. L., Hunter, W. C., Martin, T. E., Price, J., Rosenberg, K. V., Vickery, P. D., and Wigley, T. B. 2002. Priority research needs for the conservation of Neotropical migrant landbirds. Journal of Field Ornithology 73: 329-339.
Dorka, V. 1966. Das jahres- und tageszeitlithe Zugmuster von Kurzund Langstreckenzichern nach Beobachtungen auf den Alpenpassen Cou-Bretolet. Ornithologische Beobachter 63:165-223.
Erni, B., Liechti, F., Underhill, L. G. and Bruderer, B. 2002. Wind and rain govern the intensity of nocturnal bird migration in central Europe: a log-linear regression analysis. Ardea 90: 155-166.
Evans, W. R. 2000. Applications of acoustic bird monitoring for the wind power industry. Pages 141–152 in Proceedings of National Avian–Wind Power Planning Meeting III, San Diego, California, May 1998. Avian Workgroup, National Wind Coordinating Committee, Washington, D.C.
Evans, W. R. and Mellinger, D. K. 1999. Monitoring grassland birds in nocturnal migration. Studies in Avian Biology 19: 219-229.
Evans, W. R. and Rosenberg, K. V. 2000. Acoustic monitoring of night-migrating birds: A progress report. Pages 151-159 in Strategies for Bird Conservation: Creating the Partners in Flight Planning Process (R. E. Bonney, Jr., D. N. Pashley, and R. Cooper, Eds.). Proceedings of the 3rd Partners in Flight Workshop, Cape May, New

46
Jersey, October 1–5 1995. U.S. Department of Agriculture, Forest Service, Rocky Mountain Research Station, RMRSP- 16. [Online.] Available at birds.cornell.edu/ pifcapemay/evans_rosenberg.htm.
Evans, W. R. and O’Brien, M. 2002. Flight-calls of migratory birds: eastern North American landbirds. CD-ROM. Oldbird, Inc., Ithaca NY.
Farnsworth, A. 2001. The density of nocturnal bird migration: a comparison between Doppler radar and acoustic measures. M.S. thesis, Clemson University, South Carolina.
Farnsworth, A. 2005. Flight-calls and their value for future ornithological studies and conservation research. Auk 122: 733-746.
Farnsworth, A. F., Gauthreaux, S. A., Jr., and Van Blaricom, D. 2004. A comparison of nocturnal call counts of migrating birds and reflectivity measurements on Doppler radar (WSR-88D). Journal of Avian Biology 35:365–369.
Gauthreaux Sidney A., Jr. 1972. Behavioral responses of birds to daylight and darkness: a radar and visual study. Wilson Bulletin 84: 136-148.
Gauthreaux, S. A., Jr. and Belser, C. G. 1998. Displays of bird movements on the WSR-88D: patterns and quantification. Weather and Forecasting 13: 453-464.
Gauthreaux S. A., Jr. and Belser, C. G. 1999. Reply to Black and Donaldson (1999), ‘Comments on ‘‘Displays of Bird Movements on WSR-88D: patterns and quantification’’’. Weather and Forecasting 14: 1041-1042.
Gauthreaux A., S. A. Jr., Belser, C. G. and Van Blaricom, D. 2003. Using a network of WSR-88D weather surveillance radars to define patterns of bird migration at large spatial scales. / In Berthold, P., Gwinner, E. and Sonnenschein, E. (eds.) Avian Migration. Springer-Verlag, Heidelberg, Germany.
Gauthreaux, S. A., Jr., and Belser, C. G. 2006. Effects of artificial night lighting on migratory birds. Pages 67- 93 in Rich, C. and Longcore, T. (eds.) Ecological Consequences of Artificial Night Lighting. Island Press, Washington.
Graber, R. R. 1968. Nocturnal migration in Illinois – different points of view. Wilson Bulletin 80: 36-71.
Graber, R. R. and Cochran, W. W. 1960. Evaluation of an aural record of nocturnal migration. Wilson Bulletin 72: 252-273.
Griffin, D. R. 1969. The physiology and geophysics of bird navigation. Quarterly Review of Biology 44: 255-276.

47
Hamilton, W. J., III. 1962. Evidence concerning the function of nocturnal call notes of migratory birds. Condor 64: 390-401.
Hedges, S. 2001. Developing and implementing a bird migration monitoring assessment, and public outreach program for your community: The Birdcast Project. U.S. Environmental Protection Agency, 625 R-01/007.
Kelly, J. F. and Hutto, R. L. 2005. An east-west comparison of migration in North American wood warblers. Condor 107: 197-211.
Lack, D. 1960. The influence of weather on passerine migration: a review. Auk 77: 171-209.
Larkin, R. P., Evans, W. R. and Diehl, R. H. 2002. Nocturnal flight-calls of dickcissels and Doppler radar echoes over South Texas in spring. Journal of Field Ornithology 73: 2-8.
Lowery, G. H. and Newman, R. J. 1955. Direct studies of nocturnal bird migration. / In: Wolfson, A. (ed.). Recent Studies in Avian Biology. University of Illinois Press, pp. 238-263.
Newman, R. J. 1956. Hour-to-hour variation in the volume of nocturnal migration in autumn./ Ph.D. thesis, Louisiana State University.
Nisbet, I.C.T. and Drury, W. H., Jr. 1968. Short-term effects of weather on bird migration: a field study using multivariate statistics. Animal Behaviour 16:496-530.
Ogden, J. 1960. Observations of a T.V. tower during a bird fall. Migrant 31: 65-67.
Peterssen, S. 1956. Weather analysis and forecasting, Volume 1: Motions and motion systems. McGraw Hill.
Richardson, W. J. 1990. Timing of bird migration in relation to weather: Updated review. Pages 78-101 in Gwinner, E. (ed.). Bird migration: physiology and ecophysiology. Springer.
Ruth, J. M., Petit, D. R., Sauer, J. R., Samuel, M. D., Johnson, F. A., Fornwall, M. D., Korschgen, C. E., and Bennett, J. P. 2003. Science for avian conservation: Priorities for the new millennium. Auk 120: 204-211.
SAS Institute Inc. 2000-2004. SAS 9.1.3 Help and Documentation, SAS Institute Inc., Cary. NC.
Tankersley, R. D. 2004. Migration of birds as an indicator of broad-scale environmental condition. Environmental Monitoring and Assessment 94: 55-67.

48
Tatli, H., Dalfes, H. N., and Mentes, S. S. 2005. Surface air temperature variability over Turkey and its connection to large-scale upper air circulation via multivariate techniques. International Journal of Climatology 25: 331-350.
Thake, M. A. 1983. A simple model for use of Doppler shifted vocalizations by birds. Die Vogelwarte 32:33–39.
Vleugel, D. A. 1960. On the temporal pattern of nocturnal migration in thrushes. Auk 77: 10-18.
Wilks, D. S. 1989. Statistical specification of local surface weather elements from large-scale information. Theoretical and Applied Climatology 40: 119-134.

49
CHAPTER THREE: FLIGHT-CALLS OF WOOD-WARBLERS ARE NOT
EXCLUSIVELY ASSOCIATED WITH MIGRATORY BEHAVIORS*
Abstract
Wood-warblers (Parulidae), among many other species of birds, have species-specific
flight-calls given day and night in migratory periods. These vocalizations are not well
understood, although they are generally believed to maintain flocks and stimulate
migratory activity during periods of migration. However, flight-calls are not limited
to migratory periods, and they appear to have functions additional to those served
exclusively during migration.
Avian flight-calls are simple, species-specific notes that are usually less than 300 ms
in duration and generally in the 1-11 kHz range (Evans and O’Brien 2002). They are
usually single syllables and can be pure tones or modulated. These vocalizations are
narrow in bandwidth overall and high in frequency, distinctly different from broad-
bandwidth alarm calls or contact notes. Additionally, these calls are significantly
higher in frequency, narrower in bandwidth, and shorter in duration than most notes
that compose bird song (Farnsworth and Lovette 2005).
Many species of birds use flight-calls during migratory periods (Evans and
O’Brien 2002, Farnsworth 2005). However, flight-calls also occur in certain species’
repertoires outside of migration (for example, Catharus thrushes: Evans 1994; Evans
and O’Brien 2002). Because these vocalizations are not associated exclusively with
migratory behavior, comprehensive evaluation of the functions of flight-calls must
address their prevalence and use in both migratory and non-migratory periods. In this
paper, I present some of the first data available on seasonal patterns of flight-calling in
* Submitted to Wilson Journal of Ornithology as: Short Communications.

50
23 species of wood-warblers (Parulidae, hereafter warblers) in non-migratory breeding
and over-wintering periods.
Methods
Between December 2003 and January 2006, I observed 23 species of warblers during
three different non-migratory periods that I define as: pre-fledging (hereafter the
breeding period) from 1 June-14 July 2003, at which time no young birds were present
outside the nest; post-fledging (hereafter the fledgling period) from 1 July-1 August
2004, when young had left the nest but still traveled in the company of adults; and the
non-breeding over-wintering (hereafter the wintering period) from 27 December-27
February between 2003-2006, at which time birds traveled in flocks or individually or
birds established territories (Tables 3.1 and 3.2). I observed individuals for randomly
chosen 10-minute periods during daylight hours, noting presence and number of
flight-calls. I recorded flight-calls using a Sennheiser MKH 70 microphone. I
recorded analog data with a Sony TCM-5000 recorder and digital data with a Nagra
Ares BB+ flash memory recorder. All flight-calls were either recorded or digitized at
16-bit, 22050 Hz sampling rates as uncompressed .wav files.
Results
I determined that flight-calls recorded during this study outside migratory periods are
similar to those of known individuals recorded during migratory periods (Figure 3.1
and 3.2). Of the 16 species observed during the breeding period (140 periods of
observations over 23 hours and 20 minutes total time), only Nashville Warbler ever
gave flight-calls, all three of which were recorded during two periods (Table 3.2). Of
the 10 species observed during fledgling periods (61 periods of observation over 10
hours and 10 minutes total time), five species gave a total of 42 flight-calls, recorded
during 13 periods (Table 3.2). During the wintering period (248 periods of
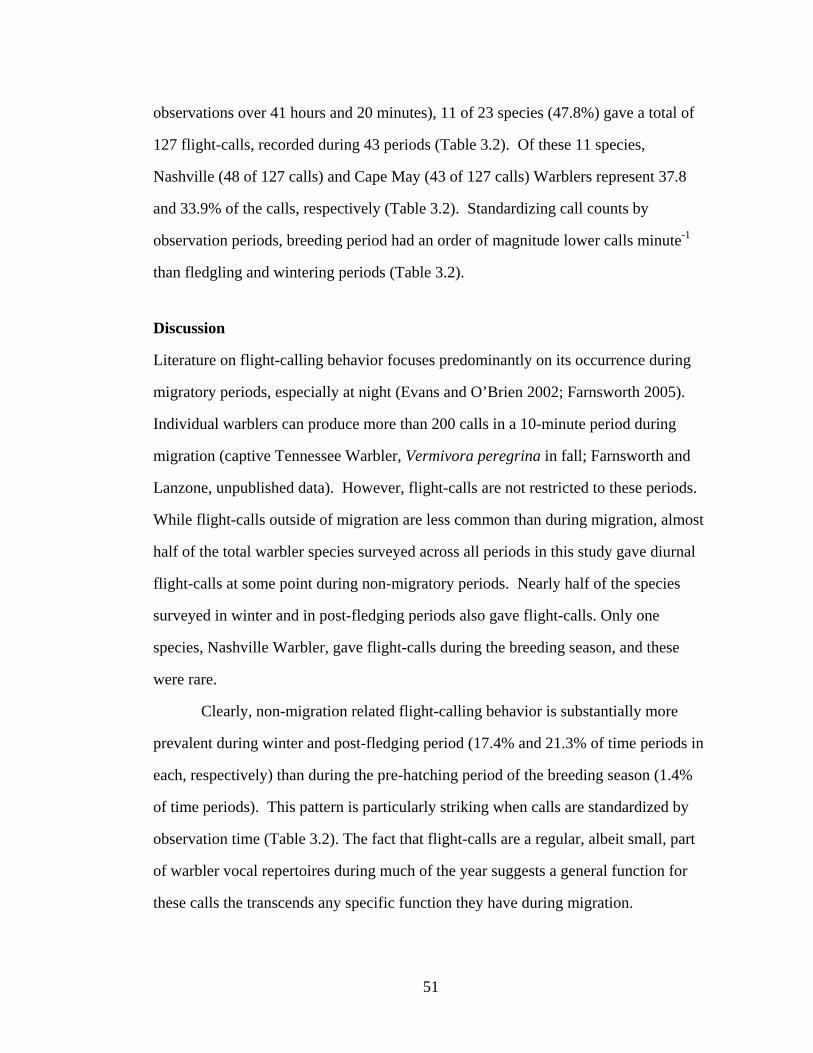
51
observations over 41 hours and 20 minutes), 11 of 23 species (47.8%) gave a total of
127 flight-calls, recorded during 43 periods (Table 3.2). Of these 11 species,
Nashville (48 of 127 calls) and Cape May (43 of 127 calls) Warblers represent 37.8
and 33.9% of the calls, respectively (Table 3.2). Standardizing call counts by
observation periods, breeding period had an order of magnitude lower calls minute-1
than fledgling and wintering periods (Table 3.2).
Discussion
Literature on flight-calling behavior focuses predominantly on its occurrence during
migratory periods, especially at night (Evans and O’Brien 2002; Farnsworth 2005).
Individual warblers can produce more than 200 calls in a 10-minute period during
migration (captive Tennessee Warbler, Vermivora peregrina in fall; Farnsworth and
Lanzone, unpublished data). However, flight-calls are not restricted to these periods.
While flight-calls outside of migration are less common than during migration, almost
half of the total warbler species surveyed across all periods in this study gave diurnal
flight-calls at some point during non-migratory periods. Nearly half of the species
surveyed in winter and in post-fledging periods also gave flight-calls. Only one
species, Nashville Warbler, gave flight-calls during the breeding season, and these
were rare.
Clearly, non-migration related flight-calling behavior is substantially more
prevalent during winter and post-fledging period (17.4% and 21.3% of time periods in
each, respectively) than during the pre-hatching period of the breeding season (1.4%
of time periods). This pattern is particularly striking when calls are standardized by
observation time (Table 3.2). The fact that flight-calls are a regular, albeit small, part
of warbler vocal repertoires during much of the year suggests a general function for
these calls the transcends any specific function they have during migration.

52
Table 3.1. Date, location, and season of observations of flight-calling behavior for 23 species of warblers.
Year Location Dates Days Observation
Periods Species
Recorded Species
giving calls Life History 2003 Adirondacks and
Finger Lakes 1 June-14 July 27 140 16 1 Breeding
2004 Adirondacks and Finger Lakes
1 July-1 August 10 61 10 5 Fledging
2004 Eastern Cubaa 31 January-27 February 22 189 18 9 Wintering
2003-2004 Morelosb 27 December-2 January 7 18 9 3 Wintering
2004-2005 Morelosb 27 December-3 January 8 17 6 2 Wintering
2005-2006 Morelos, Jaliscoc 27 December-7 January 12 24 6 2 Wintering
a) Cayo Guam, Bahia de Taco, Nuevo Mundo, Barrio Nuevo, Uvero, Santiago, Gran Piedra b) Cuernavaca c) Cuernavaca and Careyes
53
Table 3.2. Seasonal prevalence of flight-calls and numbers of calls counted for 23 species of warblers. Each period represents a 10-minute observation.
Season Breedinga Fledgingb Winterc,d,e,f All
Species Calling Periods
Total Periods Calls Calls/
Minute Calling Periods
Total Periods Calls Calls/
Minute Calling Periods
Total Periods Calls Calls/
Minute Total
Periods American Redstart 0 11 0 0 3 12 12 0.1 2 14 3 0.02 37 Black-and-white
Warblerg 0 8 0 0 0 4 0 0 4 14 6 0.04 26
Black-throated Blue Warbler 0 9 0 0 2 7 4 0.06 2 37 4 0.01 53
Black-throated Gray Warblerh 0 5 0 0 5
Black-throated Green Warblerg 0 10 0 0 2 6 12 0.2 0 9 0 0 25
Cape May Warbler 14 34 43 0.13 34 Chestnut-sided
Warbler 0 5 0 0 4 8 11 0.14 13
Common Yellowthroat 0 11 0 0 0 6 0 0 2 9 4 0.04 26
Hooded Warbler 0 1 0 0 2 7 3 0.04 0 1 0 0 9 Louisiana
Waterthrush 0 2 0 0 0 2 0 0 0 1 0 0 5
MacGillivray's Warblerh 0 5 0 0 5
a) Adirondacks and Finger Lakes 2003: 27 days, 140 observations, June 1-July 14 b) Adirondacks and Finger Lakes 2004: 10 days, 61 observations, July 1-August 1 c) Cuba 2004: 22 days, 189 observations, January 31-February 27 d) Mexico 2003-2004: 8 days, 18 observations, December 27-January 2 e) Mexico 2004-2005: 8 days, 17 observations, December 27-January 3 f) Mexico 2005-2006: 8 days, 24 observations, December 27-January 7 g) Cuba and Mexico h) Mexico

54
Table 3.2 (Continued). Season Breedinga Fledgingb Winterc,d,e,f All
Species Calling Periods
Total Periods Calls Calls/
Minute Calling Periods
Total Periods Calls Calls/
Minute Calling Periods
Total Periods Calls Calls/
Minute Total
Periods Nashville Warblerh 2 15 3 0.02 11 21 48 0.23 36
Northern Parula 0 5 0 0 1 14 2 0.01 19
Northern Waterthrush 0 10 0 0 0 5 0 0 0 5 0 0 20 Orange-crowned
Warblerh 4 10 15 0.15 10
Ovenbird 0 8 0 0 0 4 0 0 0 11 0 0 23
Palm Warbler 0 12 0 0 0 15 0 0 27
Prairie Warbler 0 2 0 0 1 11 1 0.01 13
Wilson's Warblerh 0 8 0 0 8
Worm-eating Warbler 1 5 0 0 5
Yellow Warbler 0 12 0 0 0 3 0 0 15 Yellow-rumped
Warblerg 0 19 0 0 0 12 0 0 31
Yellow-throated Warbler 1 4 1 0.03 4
Total 2 140 3 0.002 13 61 42 0.07 43 248 127 0.05 449

55
A) B) C)
Figure 3.1. Flight-calls of Nashville Warbler (Vermivora ruficapilla) recorded during three different seasonal periods: A) migration (Fall 2004, Ithaca, NY), B) breeding (Summer 2003, Adirondacks SP, NY), and C) wintering (December 2004, Morelos, Mexico). The flight-calls are shown as waveform (upper ordinate axis) and spectrogram (lower ordinate axis) representations.

56
A) B) C)
Figure 3.2. Flight-calls of Cape May Warbler (Dendroica tigrina) recorded during two different seasonal periods: A) migration (Spring 2005, New York, NY and B) wintering (February 2004, Humboldt NP, Cuba). The flight-calls are shown as waveform (upper ordinate axis) and spectrogram (lower ordinate axis) representations.

57
Flight-calls are short, high frequency, narrow bandwidth vocalizations, perfect
for short-distance communication outside the range of many predators’ hearing
(Dooling 1982, Okanoya and Dooling 1987, Langemann et al. 1998, Gill and Sealy
2003, Farnsworth and Lovette 2005). Possibly, flight-calls serve a grouping role
among recently fledged birds foraging with adults in family groups. Additionally,
warblers that give flight-calls in winter may use flight-calls in much the same way as
they are used for recently fledged young birds traveling with adults. For example,
Nashville Warblers forage in inter- and conspecific flocks in winter in western Mexico
(Howell and Webb 1995; Hutto 1980, 1994; Williams 1996), and this species gives
flight-calls with some regularity (Table 3.2). Similarly, Cape May Warblers in Cuba
gave flight-calls more than any other local species observed, and nearly as often as
Nashville Warbler (Table 3.2). Both Nashville and Cape May Warbler also engage in
local facultative movements often involving groups (Baltz and Latta 1998).
Not all species that form or join flocks in winter give flight-calls, and the
reasons behind such variation are not yet understood. For example, Palm Warbler
winters in large numbers in Cuba (Wilson 1996) and occasionally forms large flocks
in which birds do not use flight-calls but instead produce another call type (“chip”
notes; Farnsworth personal observations). Similarly, Yellow-rumped Warblers, which
flock extensively on wintering grounds, rarely use their flight-call diurnally in place of
the ubiquitous chip note. Interestingly, this species engages in facultative nocturnal
migration after typical migration seasons end (Terrill and Ohmart 1984, Terrill and
Crawford 1988), though it is unknown whether birds use flight-calls during these
movements. Examining these facultative nocturnal movements could provide
additional insights into the functions of flight-calls both during migration and beyond.
Non-migratory flight-calling could be an important behavioral clue for
understanding both the evolution and the ontogeny of these calls. Research on

58
specific behavioral contexts associated with flight-calls is needed. Additional
sampling of the annual cycle is also crucial. Such research is especially important for
determining the prevalence of flight-calls during periods such as hatching for which
information is still scant.

59
Literature Cited BALTZ, M. E., and S. C. LATTA. 1998. Cape May Warbler (Dendroica tigrina). The
Birds of North America, No. 332.
DOOLING, R. J. 1982. Auditory perception in birds. – Pages 95-130 in Acoustic communication in birds, Vol. 1. (D. E. Kroodsma, E. H. Miller, and H. Ouellet, eds.). Academic Press, New York.
EVANS, W. R. 1994. Nocturnal flight call of Bicknell’s thrush. Wilson Bulletin 106, 55-61.
EVANS, W. R. and M. O’BRIEN. 2002. Flight calls of migratory birds: eastern North American landbirds. - CD-ROM. Oldbird, Inc., Ithaca NY.
FARNSWORTH, A. 2005. Flight calls and their value for future ornithological studies and conservation research. Auk 122, 733-746.
FARNSWORTH, A. and I. J. LOVETTE. 2005. Evolution of nocturnal flight calls in migrating wood-warblers, apparent lack of morphological constraints. Journal of Avian Biology 36, 1-11.
GILL, S. A. and S. G. SEALY. 2003. Tests of two functions of alarm calls given by Yellow Warblers during nest defence. Canadian Journal of Zoology 81,1685–1690.
HOWELL, S. N. G. and S. WEBB. 1995. A guide to the birds of Mexico and northern Central America. Oxford University Press, Oxford, U.K.
HUTTO, R. L. 1980. Winter habitat distribution of migratory landbirds in western Mexico, with special reference to small foliage-gleaning insectivores. In Migrant birds in the neotropics (A. Keast and E. S. Morton, eds.), pp. 181–203. Smithsonian Institution Press, Washington, D.C.
HUTTO, R. L. 1994. The composition and social organization of mixed-species flocks in a tropical deciduous forest in western Mexico. Condor 96, 105–118.
LANGEMANN, U., B. GAUGER, and G. M. KLUMP. 1998. Auditory sensitivity in the great tit, perception of signals in the presence and absence of noise. - Animal Behaviour 56, 763-769.
OKANOYA, K. and R. J. DOOLING. 1987. Hearing in passerine and psittacine birds, a comparative study of absolute and masked auditory thresholds. Journal of Comparative Psychology 101, 7-15.
TERRILL, S. B. and R. D. OHMART. 1984. Facultative extension of fall migration by Yellow-rumped Warblers (Dendroica coronata). Auk 101, 427-438.

60
TERRILL, S. B. and R. L. CRAWFORD. 1988. Additional evidence of nocturnal migration by Yellow-rumped Warblers in winter. Condor 90, 261-263.
WILLIAMS, J. M. 1996. Nashville Warbler (Vermivora ruficapilla). The Birds of North America, No. 205.
WILSON, W. H., Jr. 1996. Palm Warbler (Dendroica palmarum). The Birds of North America, No. 238.

61
CHAPTER FOUR: INTER- AND INTRASPECIFIC VARIATION IN FLIGHT-
CALLS AMONG WOOD-WARBLERS*
Abstract
Flight-calls of wood-warblers differ in duration and frequency, both within and among
species. To evaluate these differences, we recorded 3,405 flight-calls from 171
captive individuals of known identity, age, and sex representing 14 warbler species.
We measured spectral and temporal energy distributions from spectrograms of these
calls, using mixed models to quantify variance in flight-call characteristics among
species and individuals as well as between ages and sexes. Among-species and
among-individual variances were significantly greater than random among-call
variance for 10 spectral and temporal measurements of flight-call spectrograms, while
age- and gender-related variance were not significantly greater for any measurements.
Median frequency and median frequency contour exhibited substantial variation
among individuals, but both were even more variable among species. These findings,
the first such assessment for any avian flight-calls, support the hypotheses that flight-
calls are species-specific and more functional as species identifiers rather than as a
method of individual recognition. We suggest that incorporating the information
available in individually identifiable flight-call measurements into current methods for
monitoring flight-calls of nocturnal migrants could increase the power of these
methods for counting vocal nocturnal migrants. It remains unknown if variation
among individuals within species is recognizable and biologically relevant to warblers.
* Andrew Farnsworth, Department of Ecology and Evolutionary Biology, Cornell Laboratory of Ornithology, Cornell University, Ithaca NY 14850; Michael Lanzone, Carnegie Museum of Natural History, Powdermill Avian Research Center, 1847 Route 381, Rector, PA 15677.

62
Introduction
Variation in bird vocalizations reflects adaptation for signal transmission in local
habitats, provides a basis for individual recognition, and encodes information about
the individual sender (Martens and Marler 1977, Morton 1975, Morton 1977, Richards
and Wiley 1982, Wiley 1991, Naguib et al. 2001, Slabbekoorn and Smith 2002).
While birds’ songs are the primary source for this information, the diverse vocal
repertoires of many birds include numerous types of calls that also exhibit variation.
While singing is mostly associated with breeding behaviors, calling behavior is far
more opportunistic and erratic.
Avian calls are primarily transient signals with highly variable patterns in the
timing and context of calls, and such diversity may increase their potential to
communicate an array of messages dependent on their contextual associations (for
example, birds often use different calls for alarm, group cohesion, and aggressive
interactions). In contrast, a song likely contains an important but highly specific type
of information (such as displaying male quality or defining territorial boundaries).
Although calls are structurally simple, and usually monosyllabic, variation in calls
may play an important role in communication in some species of birds. Yet bird calls
are generally neglected in the study of bird communication (Baptista and Gaunt 1994,
Marler 2004).
In this paper, we describe inter- and intra-specific variation in flight-call
characteristics of 14 species of North American wood-warblers. Warbler flight-calls
are species-specific vocalizations usually given as single notes. They are often
amplitude- and frequency-modulated (sometimes rapidly), usually less than a second
in duration, and between 3-11 kHz in frequency (Evans and O’Brien 2002, Farnsworth
2005).
63
Recent studies have provided insights into the temporal and seasonal patterns
of flight-calling behavior (Evans 1994, Evans and O’Brien 2002, Larkin et al. 2002,
Farnsworth et al. 2004, Farnsworth and Lovette 2005), and interest in flight-calls as a
method for monitoring bird migration is increasing (Evans and Mellinger 1999, Evans
and Rosenberg 2000, Mills 2000, Hedges 2001). However, information on
intraspecific variation is generally lacking (also for interspecific variation, but see
Evans and O’Brien 2002). Moreover, there is no information available about sex- and
age-related variation in flight-calls.
Methods
Recordings of warbler flight-calls from migrant North American species occurring
east of the Rocky Mountains are available as part of a published compilation (Evans
and O’Brien 2002). Although this compilation provides some information on
intraspecific variation in some species, its primary focus is differences among species.
We recorded 3,405 flight-calls of 171 captively held warblers of 14 species at two
different locations: Powdermill Avian Research Center near Pittsburgh, PA and
Mormon Lake near Phoenix, AZ (Table 4.1). By recording flight-calls from captive
warblers, we could gather calls from known individuals to examine intraspecific
individual variation. We captured birds using mist nets, banded each individual with a
USFWS band, and recorded its age (HY, hatching-year including second year birds;
AHY, after-hatching-year including after second year birds, unknown) and sex (male,
female, unknown). We placed birds for 10 minutes in an apparatus equipped with a
microphone, designed to hold birds and to record any vocalizations they produced
(Lanzone and Farnsworth in preparation). If a bird did not call during this 10-minute
period, we released it. Upon release, when possible, we followed birds with a shotgun
microphone (Sennheiser MKH70, www.sennhesier.com for specifications) to record
any flight-calls given during free-flight.

64
Table 4.1. Total number of flight-calls and individuals for 14 species of warblers and total number of flight-calls and individuals from age-sex sub-sample for six species of warblers.
Species Calls Individuals American Redstart Setophaga ruticilla* 283 10
Black-throated Blue Warbler Dendroica caerulescens 159 8 Black-throated Green Warbler Dendroica virens* 318 13
Common Yellowthroat Geothlypis trichas 23 3 Chestnut-sided Warbler Dendroica pennsylvanica* 162 9
Grace's Warbler Dendroica graciae 154 14 Hooded Warbler Wilsonia citrina 164 12
Magnolia Warbler Dendroica magnolia* 1147 51 Nashville Warbler Vermivora ruficapilla* 273 16
Ovenbird Seiurus auricapillus 257 10 Palm Warbler Dendroica palmarum 131 6
Tennessee Warbler Vermivora peregrina 213 10 Virginia's Warbler Vermivora virginiae 34 3
Yellow-rumped Warbler Dendroica coronata* 87 6 Total Sample 3405 171 Age-Sex Sample* 2270 105
*Species used in age-sex sampling
The acoustic cone contained a pressure zone microphone with a Knowles
EK3132 microphone element (see applications by Evans and Mellinger 1999, Evans
and Rosenberg 2000, Farnsworth et al. 2004) with a flat (± 1 dB) frequency response
in the 2000 - 10000 Hz range, connected to a digital recording device (Terapin Mine,
www.terapintech.com) that recorded 22,050 kHz, 16-bit WAV files. Before analysis,
all digital files were filter-decimated to a 22,050 Hz sampling rate. We used Raven
1.2.1 (Charif et al. 2004) to edit flight-call spectrograms, and after editing flight-call
samples contained approximately 20-40 ms initial and terminal portions of ambient
noise that were not part of the call. We excluded any flight-calls if spectrograms
contained noise that interfered with the call signal, and all calls from birds of unknown
age or sex.

65
We used XBAT 0.6.3 (www.xbat.org; Figueroa 2002) to compute
spectrograms representing the time-varying distribution of sound intensity level in a
call. All spectrograms were computed with identical parameters (Hamming window,
87.5% overlap, 256-point FFT, 256-point frame length) resulting in temporal and
frequency resolutions of 11.6 ms and 112 Hz. We implemented a feature extraction
process to measure automatically acoustic characteristics of flight-calls. This set of
features was a subset of those based on ACUSTAT (Fristrup and Watkins 1992,
1993), and XBAT 0.6.3 provided the analytical environment to implement a
customized auto-feature-measurement routine. Measuring acoustic properties
involved selecting a signal of interest (in this case, a flight-call) by drawing a box
around a flight-call onscreen using the cursor. This box represents the bounds within
which the feature extraction process occurred, extracting measurements automatically
and logging these in a data file. For these analyses, each spectrogram’s amplitude-
time envelope (aggregate power as a function of time) and power spectrum envelope
(power as a function of frequency) were treated conceptually as probability density
functions in the time and frequency dimensions, respectively. More details of this
procedure are available in Chapter 5 and from the Cornell Laboratory of Ornithology
Bioacoustic Research Program (Cortopassi, www.birds.cornell.edu/brp/
research/algorithms/RSM.html.)
XBAT records 120 measures from the aggregate distributions and contour
extractions of each signal analyzed. However, many of these measurements are
redundant and highly correlated with one another. We produced a correlation matrix
among all characters and removed variables in the matrix with correlation coefficients
greater than r=0.71 (> 50% of the variation of original variables, based on R2 values),
keeping only the variables to which these eliminated variables correlated. (We chose
not to perform principal component analysis because of the difficulties involved in

66
accounting for non-independent, nested levels within our data and in interpreting any
resultant component axes, such as flight-calls of individuals of species; for additional
information on this issue, see Longford and Muthen 1992; K. Grace-Martin personal
communication.) We reduced our total number of uniquely descriptive measurements
of each flight-call from 120 to 28: 16 from the amplitude-time and power spectrum
envelopes and 12 concentration measures derived from sorted probability density
functions of the time-varying features in the spectral frames, 9 from the amplitude-
time envelope and 3 from the power spectrum envelope. The following are brief
descriptions for each of these 28 ACUSTAT measurements. Table 4.2 is a look-up
table to match the terms given here with those in ACUSTAT as implemented in
XBAT.
1) Median, equivalent-duration and skewness of the amplitude-time envelope
(MeENV, EqENV, and SkENV, in seconds);
2) Median, equivalent-bandwidth and skewness of the power spectrum envelope
(MePS, EqPS, and SkPS, in Hz);
3) Median, equivalent-width and skewness of the discrete Fourier transform of
the amplitude-time envelope, computing the frequency spectrum of the
amplitude-time envelope and measuring from that (MeENVM, EqENVM, and
SkENVM, in Hz);
4) Median, equivalent-width and skewness of the discrete Fourier transform of
the median frequency contour from the amplitude-time envelope weighted by
¼ power of the amplitude-time envelope (MeAFM, EqAFM, and SkAFM in
Hz);

67
5) Attack fraction (ATTACKFR, unitless), fraction of data blocks that have
higher energy than the previous block, similar to the musical definition of a
crescendo;
6) Up-sweep fraction (UPSWFR, unitless), fraction of data blocks that have
higher frequency (based on the peak frequency contour) that the previous
block;
7) Up-sweep mean (UPSWM, in Hz), average slope of the peak frequency
contour;
8) Sweep magnitude (SWMAG, in Hz), sum of the absolute value of the
derivative of the peak frequency contour;
9) Median, spread and skewness of the median-frequency contour (MeFMED,
EqFMED, and SkFMED, in Hz), where FMED is the vector of the median-
frequency values in each spectral frame of the power spectrum (Figure 4.1);
10) Median, spread and skewness of the frequency-concentration contour
(MeFCC, EqFCC, and SkFCC, in Hz), where FCC is the vector of the number
of bins needed to accumulate 50% of the total energy in the sorted energy
distribution for each spectral frame;
11) Median, spread and skewness of the equivalent-bandwidth contour (MeEBC,
EqEBC, and SkEBC, in Hz), where EBC is the vector of equivalent-bandwidth
values for each spectral frame;

68
12) Median, spread and skewness of the frequency-skewness contour (MeFSKEW,
EqFSKEW, and SkFSKEW in Hz), where FSKEW is the vector of skewness
values for each spectral frame;
Species in our dataset did not have equal numbers of flight-calls when parsed by
individual or by species, so, for all our analyses, we used mixed-model approaches
that account for unbalanced experimental design (Herr 1986, Shaw and Mitchell-Olds
1993, Littell et al. 1996, Langsrud 2003). Analysis of our data using a stratified
random sample of flight-calls to create a balanced design experiment revealed only
slight differences from the patterns observed in the complete, unbalanced dataset. We
used two different mixed models to analyze our data, one to examine variance
components and another to model fixed and random effects. We corrected for
multiple comparisons by using Tukey-Kramer multiple comparison adjustments
(PROC MIXED, option LSMEANS; SAS Institute 1999) to adjust all p-values and
confidence limits for the differences among least-squares means (Kramer 1956); all
significant p-values we report presented adjusted values.
We assessed the variance components for the different sound measures in our
sample by modeling them against the following effects as random effects: species,
individuals, age, and gender (Littell et al. 1996). The SAS output for such an analysis
includes a ratio of variance (PROC MIXED, RATIO option, SAS Institute 1999)
attributable to the random effects relative to residual variation attributable to a model
without any effects. The value of this ratio describes variance in sound measures
resulting from random effects relative to the variance in sound measures of a model
with no effects. In this case, a model with no effects represents variance in sound
measures among calls irrespective of any additional effects of species, individuals,
ages, or sexes (PROC MIXED, SAS Institute 1999). In SAS output, residual variance
is always equal to 1, so all variance components are scaled to this value.

69
Table 4.2. XBAT energy-distribution measurements recorded from each flight call spectrogram. Measurement Analogous ACUSTAT Measurement Description Estimates
1) Amplitude Time Envelope (ENV, in sec)
Energy Envelope (ENV) Amplitude time envelope from the aggregate energy envelope
Median (Me), Equivalent Duration (EQD), Skewness (Sk)
2) Power Spectrum Envelope (PS, in Hz)
Frequency Bandwidth (TS) Power spectrum envelope from the aggregate power spectrum
Median (Me), Equivalent Bandwidth (EQB), Skewness (Sk)
3) Frequency Spectrum of Amplitude Time Envelope
(ENVM, in Hz)
Amplitude Modulation (AM) Discrete Fourier transform of the amplitude-time envelope, computing the frequency spectrum of the amplitude-time envelope and measuring from that
Median (Me), Equivalent Bandwidth (EQB), Skewness (Sk)
4) Median Frequency Contour Spectrum of Amplitude Time
Envelope (AFM, in Hz)
Amplitude-Frequency Modulation (AFM) Discrete Fourier transform of the median frequency contour from the amplitude-time envelope weighted
by ¼ power of the amplitude-time envelope
Median (Me), Equivalent Bandwidth (EQB), Skewness (Sk)
5) Attack Fraction (ATTACKFR, unitless)
Attack Fraction (ATTACKFR) Fraction of data blocks that have higher energy than the previous block
6) Up-sweep Fraction (UPSWP, unitless)
Up-sweep Fraction (UPSWFR) Fraction of data blocks that have higher frequency (peak frequency contour) that the previous block
7) Up-sweep Mean (UPSWM, in Hz)
Up-sweep Mean (UPSWM) Average slope of the peak frequency contour
8) Sweep Magnitude (SWMAG, in Hz)
Sweep Magnitude (SWMAG) Sum of the absolute value of the derivative of the peak frequency contour
9) Median Frequency Contour (FMED, in Hz)
Median Frequency Contour (FMED) The vector of the median-frequency values in each spectral frame of the power spectrum
Median (Me), Spread (Sp), Skewness (Sk)
10) Frequency Concentration Contour (FCC, in Hz)
Frequency Concentration Contour (CONC)
The vector of the number of bins needed to accumulate 50% of the total energy in the sorted
energy distribution for each spectral frame
Median (Me), Spread (Sp), Skewness (Sk)
11) Equivalent Bandwidth Contour (EBC, in Hz)
Equivalent Bandwidth Contour (MODW) The vector of equivalent-bandwidth values for each spectral frame
Median (Me), Spread (Sp), Skewness (Sk)
12) Frequency Skewness Contour (FSKEW, in Hz)
Frequency Asymmetry Contour (FASYM) The vector of skewness values for each spectral frame
Median (Me), Spread (Sp), Skewness (Sk)
Parenthetical notation represents the abbreviations used in XBAT. Estimates refer to order statistics used to describe measurements. Measures and estimates (for example FMED and ME = FMEDME) describe the acoustic characteristics of flight-calls measured.

70
We also used a more traditional approach to produce least squares means from
a mixed model of fixed and random effects (Little et al. 1996). We modeled fixed and
random effects, choosing species, age, sex, and age*sex interactions (hatching-year
male or female, after-hatching-year male or female) as fixed effects and individuals as
random effects. By using a restricted maximum likelihood method (REML), PROC
MIXED generates parameter estimates that are best linear unbiased predictors
(BLUPS, Littel et al. 1996) for intercepts (model without fixed effects) and fixed
effects. Plots of these estimates display the deviation of a model with effects from a
model without effects, with the intercept representing a null hypothesis to test for
differences in the sound measure response variable. We produced BLUPS for fixed
effects of age, sex, and age*sex interactions for each sound measurement, and we
plotted these against the intercept value to depict differences among effects for each
sound measurement.
Results
Warbler flight-calls exhibited variation in acoustic characteristics within species
(Table 4.3) and among species (Table 4.4). As such, flight-call characteristics were
not necessarily distinctly different for each species, nor were flight-calls uniformly
variable among all species. Flight-calls of Virginia’s warbler (Vermivora virginiae)
and Black-throated Blue warbler (Dendroica caerulescens) had significantly wider
frequency concentration contour (MeFCC) than the remaining 12 species and differed
significantly from each other (Figure 4.1). However, these same species did not differ
significantly in equivalent bandwidth contour (MeEBC), despite exhibiting
significantly wider values than the remaining 12 species (Figure 4.1). Additionally,
flight-calls of Palm warbler (Dendroica palmarum), Virginia’s warbler, Grace’s
warbler (Dendroica graciae), and Nashville warbler (Vermivora ruficapilla) are
significantly lower in median frequency (MePS) than all other species, but the median

71
frequencies of these species’ flight-calls not significantly different from each other
(Figure 4.2). Also, flight-calls of Magnolia Warbler (Dendroica magnolia) showed
the maximum range for eight measurements of acoustic characteristics, while flight-
calls of Common Yellowthroat (Geothlypis trichas) showed the minimum range for
eight measurements of acoustic characteristics (Table 4.3).
0
50
100
150
200
250
300
350
400
450
500
CSWA COYE MAWA HOWA AMRE YRWA OVEN BTNW GRWA NAWA TEWA PAWA VIWA BTBW
Freq
uenc
y (H
z)
Frequency Concentration Contour MedianEquivalent Bandwidth Contour Median
Figure 4.1. Least squares means and standard errors for frequency concentration contour median (MeFCC) and equivalent bandwidth contour median (MeEBC) measurements for flight-calls of 14 species of warbler.
Although all measurements of acoustic characteristics of flight-calls varied to
some extent among species and individuals and between ages and sexes, this variation
was most significant and extensive among species. Mixed model results showed that
variance among species was higher relative to random, among-call variance than
variance among individuals and between ages and sexes in 10 variables (Table 4.5).
The measurements with the highest among-species to among-call ratios were median

72
frequency (MePS) and median frequency contour median (MeFMED). This species-
level variability is also apparent in plots of median frequency (MePS, Figure 4.3a) and
median frequency contour (MeFMED, Figure 4.3b). While among-species variance
was several times greater than among-individual variance for these measurements,
variance among individuals in median frequency (MePS) and median frequency
contour median (MeFMED) was also significantly greater than residual, random
variation among calls. These were the only measurements among individuals that
were significantly greater than random among-call variation.
4000
4500
5000
5500
6000
6500
7000
7500
8000
PAWA VIWA GRWA NAWA COYE CSWA OVEN TEWA MAWA YRWA BTNW HOWA AMRE BTBW
Freq
uenc
y (H
z)
Median FrequencyMedian Frequency Contour
Figure 4.2. Least squares means and standard errors for median frequency (MePS) and median frequency contour median (MeFMED) measurements for flight-calls of 14 species of warbler.

73
Table 4.3. Pooled median, interpercentile range, and range for 28 measurements recorded from flight-calls of 14 species of warblers, with the species with minimum and maximum range for each of 28 flight-call measurements.
Range extremes Measurement* Median Minimum Maximum
SkAFM 0.62 ± 0.1 (0.89) Palm Warbler Magnolia Warbler MeAFM 16.55 ± 5.06 (53.87) Palm Warbler Magnolia Warbler EqAFM 8.63 ± 3 (21.61) Virginia's Warbler Magnolia Warbler
SkENVM 0.59 ± 0.08 (0.85) Virginia's Warbler Magnolia Warbler MeENVM 14.81 ± 4.1 (45.32) Common Yellowthroat Magnolia Warbler EqENVM 7.17 ± 2.12 (14.93) Common Yellowthroat American Redstart
ATTACKFR 0.55 ± 0.17 (0.76) Common Yellowthroat Black-throated Green Warbler SkFCC 0.43 ± 0.27 (0.98) Common Yellowthroat Magnolia Warbler MeFCC 208.35 ± 75.44 (615.89) Yellow-rumped Warbler Black-throated Blue Warbler SpFCC 106.51 ± 80.08 (679.17) Common Yellowthroat Grace's Warbler SkENV 0.1 ± 0.23 (0.66) Black-throated Blue Warbler Ovenbird MeENV 0.05 ± 0.02 (0.08) Virginia's Warbler Black-throated Green Warbler EqENV 0.02 ± 0.01 (0.03) Black-throated Blue Warbler Chestnut-sided Warbler
SkFSKEW 0.48 ± 0.26 (0.92) Common Yellowthroat Tennessee Warbler MeFSKEW 0.3 ± 0.16 (0.68) Common Yellowthroat Tennessee Warbler SpFSKEW 0.29 ± 0.15 (0.73) Common Yellowthroat Tennessee Warbler SkFMED 0.64 ± 0.35 (0.98) Palm Warbler Grace's Warbler MeFMED 7051.24 ± 754.46 (5258) Virginia's Warbler Grace's Warbler
*Based on Table 4.1

74
Table 4.3 (Continued). Range extremes
Measurement* Median Minimum Maximum SPFMED 538.01 ± 674.88 (5199) Hooded Warbler Palm Warbler SkEBC 0.42 ± 0.25 (0.94) Chestnut-sided Warbler Magnolia Warbler MeEBC 122.94 ± 45.65 (391.34) Yellow-rumped Warbler Black-throated Blue Warbler SPEBC 64.27 ± 49.02 (388.89) Chestnut-sided Warbler Palm Warbler
SWMAG 287.33 ± 205.27 (1843) Yellow-rumped Warbler Grace's Warbler SkPS 0.37 ± 0.28 (0.91) Common Yellowthroat Grace's Warbler MePS 7127.27 ± 748.92 (4219) Virginia's Warbler Black-throated Blue Warbler EqPS 163.82 ± 92.86 (713.1) Grace's Warbler Black-throated Blue Warbler
UPSWFR 0.56 ± 0.27 (0.92) Virginia's Warbler Magnolia Warbler UPSWM 137.35 ± 183.04 (2262) Yellow-rumped Warbler Palm Warbler

75
Table 4.4. Species-specific median, standard error, and range for 28 measurements recorded from flight-calls of 14 species of warblers.
Measurement* American Redstart Black-throated Blue Warbler
Black-throated Green Warbler Chestnut-sided Warbler Common Yellowthroat
SkAFM 0.65 ± 0 (0.38) 0.66 ± 0.01 (0.36) 0.64 ± 0 (0.36) 0.6 ± 0.01 (0.5) 0.57 ± 0.02 (0.41) MeAFM 18.38 ± 0.25 (35.68) 24.13 ± 0.35 (21.58) 16.48 ± 0.17 (21.39) 12.5 ± 0.2 (19.9) 13.11 ± 0.79 (13.6) EqAFM 9.26 ± 0.11 (15.8) 13.08 ± 0.25 (14.93) 8.53 ± 0.1 (12.6) 5.99 ± 0.12 (9.96) 6.01 ± 0.49 (8.73)
SkENVM 0.61 ± 0.01 (0.54) 0.65 ± 0.01 (0.31) 0.6 ± 0 (0.27) 0.55 ± 0.01 (0.34) 0.5 ± 0.01 (0.13) MeENVM 15.56 ± 0.19 (23.83) 21.94 ± 0.2 (13.01) 15.41 ± 0.13 (18.27) 11.32 ± 0.19 (18.03) 11.67 ± 0.42 (8.41) EqENVM 7.43 ± 0.1 (14.12) 11.35 ± 0.11 (6.72) 7.48 ± 0.07 (8.34) 5.21 ± 0.09 (6.67) 5.18 ± 0.23 (4.28)
ATTACKFR 0.53 ± 0.01 (0.62) 0.45 ± 0.01 (0.63) 0.5 ± 0.01 (0.7) 0.47 ± 0.01 (0.44) 0.53 ± 0.02 (0.3) SkFCC 0.45 ± 0.01 (0.85) 0.52 ± 0.02 (0.89) 0.4 ± 0.01 (0.82) 0.44 ± 0.01 (0.76) 0.52 ± 0.04 (0.64) MeFCC 231.65 ± 3.93 (356.98) 374.2 ± 9.62 (530.33) 159.86 ± 2.22 (250.86) 208.12 ± 2.5 (203.63) 429.42 ± 17.72 (359.67) SpFCC 165.56 ± 4 (336.03) 172.5 ± 6.1 (435.51) 111.51 ± 4.21 (539.45) 79.86 ± 2.4 (184.24) 141.41 ± 10.58 (179.72) SkENV 0.11 ± 0.01 (0.56) 0 ± 0 (0.16) 0.08 ± 0.01 (0.5) 0.31 ± 0.01 (0.6) 0.25 ± 0.03 (0.49) MeENV 0.05 ± 0 (0.07) 0.04 ± 0 (0.06) 0.05 ± 0 (0.07) 0.06 ± 0 (0.06) 0.06 ± 0 (0.05) EqENV 0.02 ± 0 (0.02) 0.01 ± 0 (0.01) 0.01 ± 0 (0.01) 0.02 ± 0 (0.03) 0.02 ± 0 (0.01)
SkFSKEW 0.48 ± 0.01 (0.87) 0.45 ± 0.02 (0.78) 0.44 ± 0.01 (0.92) 0.54 ± 0.01 (0.89) 0.49 ± 0.03 (0.58) MeFSKEW 0.29 ± 0.01 (0.57) 0.39 ± 0.01 (0.47) 0.18 ± 0.01 (0.47) 0.35 ± 0.01 (0.56) 0.41 ± 0.02 (0.32) SpFSKEW 0.34 ± 0.01 (0.54) 0.26 ± 0.01 (0.6) 0.32 ± 0.01 (0.64) 0.27 ± 0.01 (0.5) 0.21 ± 0.02 (0.3) SkFMED 0.64 ± 0.01 (0.89) 0.63 ± 0.02 (0.94) 0.7 ± 0.01 (0.91) 0.54 ± 0.02 (0.84) 0.79 ± 0.04 (0.7) MeFMED 7553.58 ± 28.37 (2712.75) 6450.46 ± 50.28 (3361.45) 7168.97 ± 22.97 (1656.61) 5942.69 ± 29.73 (2605.99) 5536.6 ± 90.7 (1483.28) SPFMED 932.78 ± 22.49 (2117.7) 813.64 ± 66.11 (4515.4) 476.3 ± 26.79 (2504.29) 497.37 ± 26.9 (2028.13) 808.98 ± 161.41 (2602.01) SkEBC 0.42 ± 0.01 (0.81) 0.41 ± 0.01 (0.83) 0.4 ± 0.01 (0.91) 0.45 ± 0.01 (0.64) 0.41 ± 0.04 (0.67) MeEBC 133.8 ± 2.69 (245.8) 208.04 ± 5.68 (360.22) 98.13 ± 1.5 (133.36) 123.1 ± 1.58 (113.63) 231.81 ± 8.41 (165.06) SPEBC 113.39 ± 2.83 (254.45) 108.65 ± 3.94 (279.73) 64.43 ± 2.14 (254.37) 50.37 ± 1.28 (96.59) 108.81 ± 6.53 (122.96)
SWMAG 381.89 ± 9.97 (908.42) 432.44 ± 24.05 (1688.23) 198.88 ± 5.32 (599.37) 256.09 ± 8.5 (628.02) 466.82 ± 40.4 (1001.82) SkPS 0.41 ± 0.01 (0.85) 0.48 ± 0.01 (0.7) 0.21 ± 0.01 (0.75) 0.39 ± 0.01 (0.71) 0.46 ± 0.03 (0.54) MePS 7368.35 ± 33.48 (2970.81) 6635.78 ± 47.77 (3315.34) 7303.94 ± 21.61 (1545.05) 6038.61 ± 29.03 (2342.52) 5701.38 ± 94.02 (1641.92) EqPS 168.97 ± 4.39 (343.25) 310.91 ± 10.08 (634.57) 111.54 ± 3.13 (266.61) 182.73 ± 4.12 (278.24) 388.77 ± 20.18 (423.27)
UPSWFR 0.45 ± 0.01 (0.78) 0.6 ± 0.01 (0.69) 0.72 ± 0.01 (0.58) 0.36 ± 0.01 (0.62) 0.54 ± 0.02 (0.42) UPSWM 35.54 ± 8.12 (740.08) 198.22 ± 16.47 (1329.19) 127.71 ± 4.38 (543.95) 59.61 ± 7.27 (446.66) 163.93 ± 18.7 (342.23)
*Abbreviation from Table 4.1 Values are median ± standard error (range)

76
Table 4.4 (Continued). Measurement* Grace's Warbler Hooded Warbler Magnolia Warbler Nashville Warbler Ovenbird
SkAFM 0.58 ± 0.01 (0.28) 0.64 ± 0.01 (0.62) 0.64 ± 0 (0.89) 0.61 ± 0 (0.52) 0.61 ± 0 (0.36) MeAFM 15.89 ± 0.29 (23.37) 18.44 ± 0.38 (28.91) 14.82 ± 0.3 (53.69) 16.62 ± 0.2 (35.88) 16.16 ± 0.12 (13.51) EqAFM 7.42 ± 0.17 (13.68) 9.47 ± 0.22 (16.21) 7.76 ± 0.11 (20.29) 8.82 ± 0.1 (14.63) 8.42 ± 0.08 (8.24)
SkENVM 0.57 ± 0 (0.25) 0.56 ± 0 (0.26) 0.59 ± 0 (0.85) 0.59 ± 0 (0.32) 0.59 ± 0.01 (0.44) MeENVM 15.47 ± 0.21 (14.97) 15.16 ± 0.2 (15.13) 12.99 ± 0.09 (44.45) 16.53 ± 0.13 (16.68) 15.46 ± 0.18 (24.08) EqENVM 7.19 ± 0.12 (7.19) 6.59 ± 0.1 (7.22) 6.41 ± 0.04 (13.11) 8.02 ± 0.07 (8.93) 7.23 ± 0.09 (8.27)
ATTACKFR 0.53 ± 0.01 (0.54) 0.4 ± 0.01 (0.66) 0.57 ± 0 (0.64) 0.58 ± 0.01 (0.55) 0.5 ± 0.01 (0.59) SkFCC 0.29 ± 0.02 (0.89) 0.47 ± 0.02 (0.87) 0.45 ± 0.01 (0.96) 0.43 ± 0.01 (0.85) 0.43 ± 0.01 (0.84) MeFCC 151.75 ± 3.95 (299.53) 272.93 ± 4.01 (266.42) 217.02 ± 1.25 (259.71) 210.53 ± 2.96 (479.67) 191.17 ± 2.07 (183.12) SpFCC 154.4 ± 10.73 (675.35) 95.41 ± 3.27 (285.96) 88.88 ± 1.32 (437.25) 115.2 ± 4.4 (578.98) 98.21 ± 2.59 (235.27) SkENV 0.07 ± 0.01 (0.43) 0.26 ± 0.01 (0.55) 0.13 ± 0 (0.54) 0 ± 0.01 (0.38) 0.17 ± 0.01 (0.66) MeENV 0.05 ± 0 (0.06) 0.04 ± 0 (0.07) 0.06 ± 0 (0.06) 0.05 ± 0 (0.05) 0.05 ± 0 (0.05) EqENV 0.02 ± 0 (0.01) 0.02 ± 0 (0.02) 0.02 ± 0 (0.02) 0.01 ± 0 (0.01) 0.02 ± 0 (0.02)
SkFSKEW 0.3 ± 0.02 (0.82) 0.51 ± 0.01 (0.82) 0.5 ± 0.01 (0.85) 0.49 ± 0.01 (0.9) 0.49 ± 0.01 (0.89) MeFSKEW 0.09 ± 0.01 (0.53) 0.4 ± 0.01 (0.45) 0.32 ± 0 (0.65) 0.27 ± 0.01 (0.56) 0.28 ± 0.01 (0.55) SpFSKEW 0.3 ± 0.02 (0.71) 0.24 ± 0.01 (0.44) 0.25 ± 0 (0.58) 0.3 ± 0.01 (0.63) 0.35 ± 0.01 (0.57) SkFMED 0.76 ± 0.02 (0.97) 0.42 ± 0.02 (0.91) 0.64 ± 0.01 (0.9) 0.62 ± 0.01 (0.92) 0.69 ± 0.02 (0.91) MeFMED 7394.29 ± 65.32 (3772) 5887.29 ± 24.14 (1644.98) 7093.78 ± 10.08 (2333.04) 7196.97 ± 23.35 (2214.21) 7384.82 ± 23.72 (2641.24) SPFMED 742.95 ± 69.43 (3062.92) 286.82 ± 18.76 (1319.91) 310.21 ± 11.14 (2828.45) 692.12 ± 46.17 (3448.17) 1048.67 ± 21.35 (2138.19) SkEBC 0.34 ± 0.01 (0.85) 0.43 ± 0.01 (0.79) 0.43 ± 0.01 (0.92) 0.47 ± 0.01 (0.93) 0.42 ± 0.01 (0.8) MeEBC 90.54 ± 2.47 (170.19) 153.75 ± 2.32 (139.94) 126.14 ± 0.76 (168.25) 132.41 ± 1.78 (256.01) 108.93 ± 1.28 (122.4) SPEBC 92.27 ± 5.32 (367.16) 61.75 ± 1.99 (128.25) 52.89 ± 0.8 (280.16) 70.6 ± 1.93 (236.7) 60.03 ± 1.46 (129.56)
SWMAG 397.59 ± 23.55 (1842.75) 304.05 ± 13.1 (955.93) 270.61 ± 3.74 (713.9) 350.19 ± 8.69 (914.7) 272.6 ± 5.34 (612.31) SkPS 0.04 ± 0.01 (0.64) 0.46 ± 0.01 (0.72) 0.39 ± 0.01 (0.81) 0.36 ± 0.01 (0.8) 0.34 ± 0.02 (0.85) MePS 7547.98 ± 46.91 (2425.52) 5912.5 ± 24.72 (1618.15) 7112.32 ± 10.72 (2793.39) 7367.12 ± 20.86 (1821.41) 7631.26 ± 23.49 (2373.23) EqPS 82.92 ± 2.54 (135.63) 213.38 ± 4.79 (293.81) 163.16 ± 1.57 (356.37) 191.69 ± 4.53 (423.24) 167.86 ± 4.04 (359.15)
UPSWFR 0.38 ± 0.02 (0.75) 0.38 ± 0.01 (0.67) 0.5 ± 0.01 (0.91) 0.78 ± 0.01 (0.49) 0.67 ± 0.01 (0.61) UPSWM 27.64 ± 13.01 (1148.45) 6.22 ± 10.37 (660.8) 122.34 ± 3.14 (825.69) 256.36 ± 7.89 (956.11) 197.48 ± 5.36 (553.52)

77
Table 4.4 (Continued). Measurement* Palm Warbler Tennessee Warbler Virginia's Warbler Yellow-rumped Warbler
SkAFM 0.56 ± 0 (0.24) 0.63 ± 0.01 (0.54) 0.59 ± 0.01 (0.35) 0.63 ± 0.01 (0.29) MeAFM 18.79 ± 0.18 (10.86) 18.08 ± 0.28 (29.17) 20.4 ± 0.55 (16.02) 16.71 ± 0.33 (15.47) EqAFM 9.51 ± 0.11 (8.42) 9.41 ± 0.17 (19.05) 10.77 ± 0.31 (7.67) 8.69 ± 0.2 (10.21)
SkENVM 0.58 ± 0.01 (0.46) 0.6 ± 0 (0.22) 0.56 ± 0.01 (0.12) 0.61 ± 0.01 (0.24) MeENVM 18.11 ± 0.22 (22.16) 17.39 ± 0.11 (11.01) 19.33 ± 0.47 (14.91) 14.97 ± 0.27 (12.37) EqENVM 9.54 ± 0.1 (5.72) 8.47 ± 0.07 (6.37) 9.56 ± 0.29 (9.46) 7.13 ± 0.14 (7.31)
ATTACKFR 0.67 ± 0.01 (0.44) 0.5 ± 0.01 (0.5) 0.6 ± 0.02 (0.48) 0.5 ± 0.01 (0.45) SkFCC 0.36 ± 0.02 (0.86) 0.35 ± 0.02 (0.9) 0.55 ± 0.04 (0.74) 0.42 ± 0.02 (0.77) MeFCC 213.56 ± 7.59 (430.16) 194.19 ± 3.37 (224.22) 312.7 ± 13.27 (309.49) 183.06 ± 3.95 (171.37) SpFCC 229.58 ± 10.36 (631.48) 127.52 ± 6.25 (484.41) 143.3 ± 9.96 (211.68) 90.5 ± 5.8 (238.11) SkENV 0 ± 0.01 (0.38) 0 ± 0.01 (0.41) 0 ± 0.01 (0.33) 0.09 ± 0.01 (0.43) MeENV 0.04 ± 0 (0.03) 0.05 ± 0 (0.05) 0.04 ± 0 (0.03) 0.05 ± 0 (0.06) EqENV 0.02 ± 0 (0.01) 0.01 ± 0 (0.01) 0.01 ± 0 (0.01) 0.01 ± 0 (0.01)
SkFSKEW 0.36 ± 0.02 (0.87) 0.5 ± 0.02 (0.92) 0.51 ± 0.03 (0.81) 0.44 ± 0.02 (0.88) MeFSKEW 0.14 ± 0.01 (0.48) 0.26 ± 0.01 (0.68) 0.34 ± 0.02 (0.46) 0.25 ± 0.02 (0.51) SpFSKEW 0.28 ± 0.01 (0.66) 0.35 ± 0.01 (0.71) 0.27 ± 0.02 (0.43) 0.33 ± 0.01 (0.58) SkFMED 0.84 ± 0.02 (0.67) 0.74 ± 0.02 (0.96) 0.54 ± 0.03 (0.9) 0.64 ± 0.02 (0.69) MeFMED 5891.36 ± 43.59 (2774.66) 6993.02 ± 23.34 (2845.1) 6983.62 ± 43.59 (1072.97) 6251.91 ± 30.94 (1809.87) SPFMED 1666.22 ± 129.53 (5163.41) 632.71 ± 55.47 (3253.72) 889.17 ± 66.03 (1413.79) 636.05 ± 31.04 (1420.14) SkEBC 0.43 ± 0.02 (0.8) 0.4 ± 0.01 (0.91) 0.49 ± 0.04 (0.79) 0.41 ± 0.02 (0.72) MeEBC 119.51 ± 4.19 (249.55) 116.66 ± 2.32 (153.72) 167.45 ± 6.17 (147.43) 110.62 ± 2.41 (111.15) SPEBC 120.44 ± 4.93 (372.67) 76.63 ± 2.74 (214.34) 77.68 ± 5.69 (130.7) 52.02 ± 2.8 (126.04)
SWMAG 765.8 ± 35.62 (1743.68) 328.03 ± 12.46 (1000.4) 421.56 ± 32.64 (793.85) 185.69 ± 6.55 (319.98) SkPS 0.13 ± 0.02 (0.91) 0.34 ± 0.02 (0.91) 0.5 ± 0.02 (0.63) 0.32 ± 0.02 (0.66) MePS 6028.45 ± 18.78 (1508.7) 7103.38 ± 26.89 (2333.66) 7396.35 ± 38.51 (1153.42) 6341.43 ± 30.68 (1916.75) EqPS 110.67 ± 4.69 (250.65) 149.28 ± 4.81 (398.81) 254.99 ± 13.71 (351.05) 147.5 ± 5.64 (242.84)
UPSWFR 0.6 ± 0.02 (0.72) 0.73 ± 0.01 (0.58) 0.69 ± 0.02 (0.39) 0.72 ± 0.01 (0.45) UPSWM 583.72 ± 35.82 (2142.11) 218.69 ± 8.91 (866.6) 304.79 ± 24.76 (724) 97.43 ± 4.9 (240.34)

78
Table 4.5. Ratios significantly greater than 1 for among species and among individual variance in flight-call measurements relative to among-call (residual) variance.
Species Individuals
Variable Variance Ratio P Variance
Ratio P
Median Frequency (MePS) 6.7804 0.0102 1.7918 <.0001 Median Frequency Contour Median
(MeFMED) 5.4274 0.0106 1.7011 <.0001
Frequency Concentration Contour Median (MeFCC)
3.4071 0.0105 *
Energy Envelope Median (EqENV) 2.5383 0.0102 * Equivalent Bandwidth Contour Median
(MeEBC) 2.2734 0.0111 *
Frequency Mode Width (EqPS) 2.0226 0.0106 * Amplitude Modulation Mode Width
(EqENVM) 1.9338 0.0099 *
Upsweep Fraction (UPSWFR) 1.583 0.0098 * Amplitude Modulation Median
(MeENVM) 1.2802 0.0115 *
Sweep Magnitude (SWMAG) 1.0377 0.0133 * *Variance ratio < 1 + No variance ratio for ages, sexes and age*sex classes were significantly greater than 1.

79
A)
B)
Figure 4.3. Box plots of variation in flight-call frequency characteristics among warbler species. A) Median frequency (MePS). B) Median frequency contour median (MeFMED).

80
Age, sex, and age-sex interaction accounted for no significant, additional
variance in sound measures. However, some subtle and significant differences existed
in the flight-call characteristics of these classes (Table 4.6, Figure 4.4). For example,
female Magnolia Warblers showed significantly lower frequencies in their flight-calls,
while AHY Magnolia Warblers had significantly higher frequencies. Additionally,
flight-calls of American Redstart (Setophaga ruticilla) and Yellow-rumped Warbler
(Dendroica coronata) females exhibited lower values than males for all measurements
that differed significantly between sexes, whereas the reverse was true for Nashville
Warbler (Table 4.6). Flight-calls of Black-throated Green Warbler (Dendroica virens)
showed higher values for two of the three measurements that differed significantly
between sexes, whereas female Chestnut-sided Warblers (Dendroica pennsylvanica)
showed higher values for one of the three measurements that differed significantly
between sexes. Between ages, AHY Black-throated Green Warbler, Nashville
Warbler, and Yellow-rumped Warbler flight-calls exhibited higher values than HY
birds for all measurements that differed significantly between ages, whereas AHY
American Redstart and Chestnut-sided Warbler flight-calls exhibited higher values
than HY birds for half (for both species, respectively) of the measurements that
differed significantly between ages (Table 4.6). Although means of 16 measurements
differed significantly for age*sex interaction classes within species, no measurements
differed significantly among values for all four age*sex interaction classes within
species (Table 4.7). In summary, we found no consistent and significant differences in
the four age*sex classes to describe each class uniquely.

81
Table 4.6. Differences between sexes and ages in least squares mean values by flight-call measurement and species. Species MeasurementA Age/Sex* Estimate Standard
Error Age/Sex* Estimate Standard Error Difference+ Standard
Error P
American Redstart EqAFM AHY 8.99 0.24 HY 9.97 0.20 -0.98 0.31 0.00 American Redstart SkFCC AHY 0.40 0.02 HY 0.48 0.02 -0.07 0.03 0.01 American Redstart SpEBC AHY 152.53 16.70 HY 95.03 13.75 57.50 21.63 0.01 American Redstart SpFCC AHY 219.37 22.16 HY 139.76 18.26 79.61 28.71 0.01 American Redstart EqENVM Female 7.05 0.27 Male 7.92 0.25 -0.87 0.37 0.02 American Redstart UPSWFR Female 0.39 0.02 Male 0.48 0.02 -0.09 0.03 0.01
Black-throated Green Warbler EqPS AHY 183.01 21.62 HY 117.21 8.77 65.80 23.33 0.01 Black-throated Green Warbler MeEBC Female 115.33 6.50 Male 96.17 4.05 19.16 7.66 0.01 Black-throated Green Warbler MeFCC Female 193.81 9.61 Male 165.34 5.99 28.46 11.32 0.01 Black-throated Green Warbler UPSWFR Female 0.64 0.03 Male 0.71 0.02 -0.07 0.03 0.03
Chestnut-sided Warbler ATTACKFR AHY 0.53 0.02 HY 0.47 0.02 0.06 0.03 0.03 Chestnut-sided Warbler EqAFM AHY 6.80 0.20 HY 6.15 0.17 0.65 0.26 0.02 Chestnut-sided Warbler EqPS AHY 173.68 6.71 HY 195.82 5.45 -22.14 8.64 0.01 Chestnut-sided Warbler MeAFM AHY 13.68 0.44 HY 12.53 0.35 1.15 0.56 0.04 Chestnut-sided Warbler MeFSKEW AHY 0.32 0.02 HY 0.36 0.01 -0.05 0.02 0.02 Chestnut-sided Warbler SpEBC AHY 49.03 2.08 HY 55.96 1.69 -6.93 2.68 0.01 Chestnut-sided Warbler SkEBC Female 0.47 0.01 Male 0.41 0.02 0.06 0.02 0.00 Chestnut-sided Warbler SkENVM Female 0.55 0.01 Male 0.58 0.01 -0.03 0.01 0.02 Chestnut-sided Warbler SpFSKEW Female 0.25 0.01 Male 0.31 0.01 -0.06 0.01 <0.0001
All estimates significant at P < 0.0001 A Abbreviations from Table 1 * AHY, after hatching year; HY, hatching year + Differences are relative to Female and AHY estimates.

82
Table 4.6 (Continued). Species MeasurementA Age/Sex* Estimate Standard
Error Age/Sex* Estimate Standard Error Difference+ Standard
Error P
Magnolia Warbler EqAFM AHY 8.58 0.35 HY 9.91 0.32 -1.33 0.47 0.00 Magnolia Warbler MeENV AHY 0.06 0.00 HY 0.06 0.00 0.00 0.00 0.01 Magnolia Warbler MeFMED AHY 7168.88 64.09 HY 6969.13 57.85 199.75 86.33 0.02 Magnolia Warbler MePS AHY 7199.32 63.38 HY 6985.92 57.21 213.40 85.38 0.01 Magnolia Warbler MeFMED Female 6967.96 59.21 Male 7160.45 62.62 -192.49 86.18 0.03 Magnolia Warbler MePS Female 6980.00 58.24 Male 7195.26 61.52 -215.26 84.71 0.01 Magnolia Warbler SWMAG Female 243.70 13.00 Male 283.27 13.30 -39.58 18.59 0.03 Magnolia Warbler UPSWFR Female 0.47 0.02 Male 0.53 0.02 -0.06 0.03 0.03 Magnolia Warbler UPSWM Female 90.12 10.26 Male 134.11 10.45 -43.99 14.65 0.00 Nashville Warbler EqENVM AHY 0.61 0.00 HY 0.60 0.00 0.01 0.01 0.04 Nashville Warbler MeFMED AHY 7217.86 142.67 HY 6862.30 87.56 355.56 167.39 0.03 Nashville Warbler MePS AHY 7413.27 131.48 HY 7069.27 80.30 344.00 154.06 0.03 Nashville Warbler SkENVM AHY 0.60 0.00 HY 0.58 0.00 0.02 0.01 0.00 Nashville Warbler EqENV Female 0.01 0.00 Male 0.01 0.00 0.00 0.00 0.01 Nashville Warbler MeEBC Female 150.29 7.07 Male 127.13 5.88 23.16 9.19 0.01 Nashville Warbler MeFCC Female 241.75 11.53 Male 208.77 9.60 32.98 15.00 0.03
Yellow-rumped Warbler MeFMED AHY 6402.81 65.12 HY 6185.34 54.17 217.47 84.70 0.01 Yellow-rumped Warbler MePS AHY 6488.44 62.18 HY 6307.34 52.65 181.10 81.48 0.03 Yellow-rumped Warbler SpFCC Female 84.87 11.44 Male 123.95 14.28 -39.09 18.29 0.04

83
-250
-200
-150
-100
-50
0
50
100
150
200
250
Med
ian
Freq
uenc
yC
onto
urM
edia
n
Med
ian
Freq
uenc
yDiff
eren
ce (H
z)
Female-Male DifferencesAHY-HY Differences
Figure 4.4. Difference in least squares mean values for median frequency (MePS) and median frequency contour median (MeFMED) between Magnolia Warbler sexes and ages.

84
Table 4.7. Significant differences in least squares mean values of flight-call characteristics between age-sex interaction classes.
Species Measurement* Age-Sex Interaction Comparison Difference Standard
Error P
American Redstart SpEBC AHY,F HY,F 102.92 34.87 0.02 American Redstart SpFCC AHY,F HY,F 144.26 43.72 0.01 American Redstart SpFCC AHY,M HY,F 81.76 29.59 0.03 American Redstart UPSWFR AHY,M HY,F 0.11 0.04 0.05
Black-throated Green Warbler EqPS AHY,F HY,M 108.71 34.94 0.01
Black-throated Green Warbler EqPS AHY,F HY,F 109.09 37.35 0.02
Black-throated Green Warbler SpFMED AHY,F HY,F 1492.15 429.97 <0.0001
Black-throated Green Warbler SpFMED AHY,F HY,M 1372.94 398.05 <0.0001
Black-throated Green Warbler SpFMED AHY,F AHY,M 1422.25 513.29 0.03
Black-throated Green Warbler UPSWFR AHY,M HY,F 0.16 0.05 0.01
Chestnut-sided Warbler EqPS AHY,M HY,F -27.53 10.38 0.04 Chestnut-sided Warbler SpFSKEW AHY,M HY,F 0.06 0.02 0.01 Chestnut-sided Warbler SpFSKEW AHY,F AHY,M -0.07 0.03 0.05
Magnolia Warbler EqAFM AHY,M HY,F -1.87 0.63 0.02 Magnolia Warbler MeENV AHY,F HY,F 0.01 0.00 0.03 Magnolia Warbler MeFMED AHY,M HY,F 337.82 111.88 0.01 Magnolia Warbler MePS AHY,M HY,F 371.26 109.34 <0.0001 Magnolia Warbler UPSWM AHY,M HY,F 61.60 19.48 0.01 Nashville Warbler EqENV AHY,M HY,F 0.00 0.00 0.05 Nashville Warbler MeEBC AHY,M HY,F -40.04 15.12 0.04 Nashville Warbler SkENV AHY,F AHY,M 0.07 0.02 0.01 Nashville Warbler SkENVM AHY,M HY,F 0.04 0.01 <0.0001 Nashville Warbler SkENVM AHY,M HY,M 0.03 0.01 <0.0001 Nashville Warbler SkENVM AHY,F HY,F 0.02 0.01 0.03
Yellow-rumped Warbler EqENVM AHY,F AHY,M 1.58 0.48 0.01 Yellow-rumped Warbler EqENVM AHY,F HY,F 1.19 0.43 0.03 Yellow-rumped Warbler MeEBC AHY,F HY,F -31.14 7.95 <0.0001 Yellow-rumped Warbler MeFMED AHY,F HY,F 300.83 75.25 <0.0001 Yellow-rumped Warbler MeFMED AHY,F HY,M 363.45 78.53 <0.0001 Yellow-rumped Warbler MePS AHY,F HY,F 267.50 96.76 0.03 Yellow-rumped Warbler SpFMED AHY,F AHY,M -302.80 77.17 <0.0001 Yellow-rumped Warbler SpFMED AHY,F HY,F -313.01 72.03 <0.0001 Yellow-rumped Warbler SpFMED AHY,F HY,M -426.02 75.17 <0.0001 Yellow-rumped Warbler SpFSKEW AHY,F HY,M -0.13 0.03 <0.0001 Yellow-rumped Warbler SpFSKEW HY,F HY,M -0.09 0.03 0.02 Yellow-rumped Warbler UPSWM AHY,F HY,M -37.74 13.56 0.03
*Abbreviation from Table 4.1

85
Discussion
The most important message from our findings is that flight-calls are most variable
among species, and most variation in the flight-call characteristics results from
differences among species. Variation among individuals, between sexes, and between
ages, though significant, is much more subtle and contributes little to the total variance
of the flight-call measurements. In a broader context that includes additional call
properties such as syllable structure (i.e., spectrographic shape, see Chapter 7), such
results imply that flight-call species-specificity may be even more apparent. Our
research provides the first quantitative assessment of the suite of flight-call
spectrographic measurements that are most variable and the levels at which these
measurements vary most significantly (i.e., among species rather than within
individuals or between ages or sexes).
Median frequency (MePS) and median frequency contour median (MeFMED)
were the most variable acoustic characteristics we measured. These measurements
showed higher variances both among species and among individuals than any other
measurements, with highest levels of variation at the species level rather than among
individuals or between ages or sexes. Frequency of bird vocalizations generally varies
as a function of vegetation structure in signals propagating through different
vegetation types (Wiley 1991). This may also be true for flight-call frequency, which
appears to co-vary with several different habitat characteristics (Chapter 7).
In addition to the median frequency characteristics, eight flight-call
measurements also exhibited significant among-species variation. This suite of
measurements may represent a group of features that could be useful for species
recognition, and therefore might be useful for researchers interested in classifying
warbler flight-calls by species. Furthermore, the potential utility of these
measurements may apply to among-individual recognition or classification,

86
particularly for the two median frequency (MePS, MeFMED) measurements with
significant among-individual variance.
Individual recognition based on vocal variation may be a widespread
phenomenon in avian social and vocal systems (e.g., Mammen and Nowicki 1981,
Beecher 1991, Robisson et al. 1993, Mathevon 1997, Lefebvre et al. 1998, Jouventin
et al. 1999, Baker et al. 2000, Charrier et al. 2001, Molles and Vehrencamp 2001,
Naguib et al. 2001, Wanker and Fischer 2001, Mathevon et al. 2003, Lovell and Lein
2005). However, while individual differences in call characteristics may allow a
human observer to identify individuals reliably, such differences do not imply
necessarily that individual recognition actually occurs among the birds themselves
(after Falls 1982). Furthermore, single measurements in isolation may not suffice for
representing or expressing individuality in bird vocalizations, and may not have
biological relevance (Morton and Young 1986, Robisson 1992, Farquhar 1993, Otter
et al. 1994, Otter 1996, Stoddard 1996). Individuality also depends on physiological
capabilities to produce and to detect variation. Flight-calls are short and high in
frequency relative to the limitations of hearing in birds (Dooling 1980, Dooling et al.
1987, Beecher 1988, 1989, Nelson 1989, Weary 1990, Medvin et al. 1993).
Furthermore, the propagation distance of these calls as well as the information
encoded in them are constrained by their short, high frequency, and narrow bandwidth
features (Farnsworth and Lovette 2005; but see Aubin et al. 2004).
A trait that functions to signal individual identity should be highly variable
with polymodal distributions, and should lack dependence on physical condition,
change in cost for production and maintenance (i.e. traits should be cheap to produce
and to maintain), or association with fitness differences (Dale et al. 2001). Flight-calls
of warblers are variable among individuals, but whether these calls are independent of
physical conditions and individual fitness is unknown. Additionally, warbler produce

87
flight-calls in a variety of contexts, most commonly during migratory flights (Chapter
3), but the cost of producing these calls while flying or of maintaining them relative to
other vocal abilities also is unknown. Therefore, we cannot currently determine
whether a biological function exists for the observed variation among individuals of
the same species.
Calls may also mediate social interactions not governed by song across a wide
diversity of behavioral contexts (Mundinger 1970, 1975, Marler and Mundinger 1971,
Dahlin et al. 2005, Sharp and Hatchwell 2006). Warblers produce flight-calls during
diurnal and nocturnal migration under a variety of atmospheric conditions and across a
wide range of geographic locations. Flight-calls are also staple vocalizations of many
species’ non-breeding repertoires, and these calls are associated with young birds
traveling in family-flocks with parents and siblings (Chapter 3). Some nocturnal
recordings of flight-calls also suggest the possibility that even greater variation may
exist than we detected in this study. Some species may even use several types of
flight-calls in different contexts (W. Evans, personal communication). Whether these
vocalizations evolved for specific contexts or whether a single vocalization type is
useful across multiple contexts, detailed studies of the ontogeny of flight-calls and the
onset of flight-calling behavior is needed to clarify these usage patterns and to
illuminate flight-call function.
Additional experimental study of the effects of age and sex variation in flight-
calls is also necessary to determine whether the any of the differences we recorded
have biological meaning. For example, AHY American Redstarts have less compact
flight-calls in frequency and duration than HY birds, while females have more
compact call durations and lower upsweep fractions than males (Table 4.6). In
contrast, AHY Chestnut-sided Warblers have more compact frequency bandwidths,
higher attack fractions, less symmetrically distributed frequencies, and less compact

88
durations than HY birds, while females have less symmetrical signal duration relative
to median, less symmetrical frequency distribution, and more asymmetrical frequency
concentrations than males (Table 4.6). Although such differences in flight-call
measurements may be relevant for communication, connections between these
differences, communication requirements, and warbler ecology are not known.
Additionally, whether the features of warbler flight-calls with greater among-species
variation represent important cues for species recognition is unknown.
Experiments may also clarify whether warblers elaborate the structure of their
flight-calls to facilitate individual recognition. Some birds elaborate vocalizations,
specifically calls, to contain more information (Medvin et al. 1993, Robisson et al.
1993, Searby et al. 2004, Searby and Jouventin 2005), an adaptation that may enhance
parent-offspring recognition. If recognizing kin during post-fledging, pre-migratory
period is an important part of an individual warbler’s life history, elaboration may be
important. A short, high-frequency call for communicating across short distances to
maintain family groups may contain enough information to identify individuals, but
not at the expense of disclosing the location of the group to a predator (Langemann et
al. 1998, Jurisevic and Sanderson 1998, Swanson and Sanderson 1999, Farnsworth
and Lovette 2005).
Our results have potentially important applications for conservation. Flight-
calls are useful for monitoring passing, vocal nocturnal migrants. Ideally, counting
calls would yield a count of individuals passing. However, variation in calling rates
across seasons, species, and meteorological conditions confounds the ideal. By
including information about individual differences among flight-call measurements in
existing monitoring methods, refining estimates of passing individuals and counting
individuals may be possible. Additional research focused on classifying individuals

89
using sound measurements is necessary, and a larger and more diverse sample of
flight-calls must be tested for individuality before applying such methodology.

90
Literature Cited Amagai, S., Dooling, R. J., Shamma, S., Kidd, T. L., and Lohr, B. 1999. Detection of modulation in spectral envelopes and linear-rippled noises by budgerigars (Melopsittacus undulatus). Journal of the Acoustical Society of America 105: 2029-2035.
Aubin, T., Mathevon, N., Da Silva, M. L., Vielliard, J. M. E., and Sebe, F. 2004. How a simple and stereotyped acoustic signal transmits individual information: the song of the White-browed Warbler Basileuterus leucoblepharus. Anais da Academia Brasileira de Ciencias 76: 335-344.
Baker, M. C., Howard, T. M., and Sweet, P. W. 2000. Microgeographic variation and sharing of the gargle vocalization and its component syllables in black-capped chickadee (Aves, Paridae, Poecile atricapillus) populations. Ethology 106: 819-838.
Baptista, L. F. and Gaunt, S. L. L. 1994. Advances in studies of avian sound communication. Condor 96: 817-830.
Barbraud, C., Mariani, A., and Jouventin, P. 2000. Variation in call properties of the snow petrel, Pagodroma nivea, in relation to sex and body size. Australian Journal of Zoology 48: 421-430.
Bard, S. C., Hau, M., Wikelski, M., and Wingfield, J. C. 2002. Vocal distinctiveness and response to conspecific playback in the Spotted Antbird, a Neotropical suboscine. Condor 104: 387-394.
Beecher, M. D., Medvin, M. B., Stoddard, P. K., and Loesche, P. 1986. Acoustic Adaptations for Parent-Offspring Recognition in Swallows. Experimental Biology 45: 179-193.
Beecher, M. D. 1989. Signaling Systems for Individual Recognition - An Information-Theory Approach. Animal Behaviour 38: 248-261.
Bretagnolle, V., and Robisson, P. 1991. Species-Specific Recognition in Birds - An Experimental Investigation of Wilson’s Storm-Petrel (Procellariiformes, Hydrobatidae) by Means of Digitalized Signals. Canadian Journal of Zoology-Revue Canadienne de Zoologie 69: 1669-1673.
Chaiken, M. 1992. Individual Recognition of Nestling Distress Screams by European Starlings (Sturnus vulgaris). Behaviour 120: 139-150.
Charif, R. A., C. W. Clark, and K. M. Fristrup. 2004. Raven 1.2 User’s Manual. Cornell Laboratory of Ornithology, Ithaca, NY.

91
Charrier, I., Jouventin, P., Mathevon, N., and Aubin, T. 2001. Individual identity coding depends on call type in the South Polar skua Catharacta maccormicki. Polar Biology 24: 378-382.
Dahlin, C. R., Balda, R. P., and Slobodchikoff, C. 2005. Food, audience and sex effects on Pinyon jay (Gymnorhinus cyanocephalus) communication. Behavioural Processes 68: 25-39.
Dale, J., Lank, D. B., and Reeve, H. K. 2001. Signaling individual identity versus quality: A model and case studies with ruffs, queleas, and house finches. American Naturalist 158: 75-86.
Dent, M. L., and Dooling, R. J. 2004. The precedence effect in three species of birds (Melopsittacus undulatus, Serinus canaria, and Taeniopygia guttata). Journal of Comparative Psychology 118: 325-331.
Dooling, R. J., Leek, M. R., Gleich, O., and Dent, M. L. 2002. Auditory temporal resolution in birds: Discrimination of harmonic complexes. Journal of the Acoustical Society of America 112: 748-759.
Farquhar, C. C. 1993. Individual and Intersexual Variation in Alarm Calls of the White-Tailed Hawk. Condor 95: 234-239.
Figueroa, H. 2002. Extensible Bioacoustic Tool. http://www.xbat.org.
Fristrup, K. M. and Watkins, W. A. 1992 Characterizing acoustic features of marine animal sounds. Woods Hole Oceanographic Institution Technical Report WHOI-92-04.
Fristrup, K. M. and Watkins, W. A. 1993 Marine animal sound classification. Woods Hole Oceanographic Institution Technical Report WHOI-94-13.
Galeotti, P., and Pavan, G. 1991. Individual Recognition of Male Tawny Owls (Strix aluco) Using Spectrograms of Their Territorial Calls. Ethology Ecology, and Evolution 3: 113-126.
Gammon, D. E., Baker, M. C., and Betancourt, L. 2002. Lack of discrimination of conspecific vocalizations by black-capped chickadees: Tests on hand-raised juveniles. Condor 104: 854-858.
Goodale, E., and Kotagama, S. W. 2006. Context-dependent vocal mimicry in a passerine bird. Proceedings of the Royal Society B-Biological Sciences 273: 875-880.
Hauber, M .E., Russo, S. A., and Sherman, P. W. 2001. A password for species recognition in a brood-parasitic bird. Proceedings of the Royal Society of London Series B-Biological Sciences 268: 1041-1048.

92
Hill, F. A. R., and Lill, A. 1998. Vocalizations of the Christmas Island Hawk-Owl Ninox natalis: Individual variation in advertisement calls. Emu 98: 221-226.
Horning, C. L., Beecher, M. D., Stoddard, P. K., and Campbell, S. E. 1993. Song Perception in the Song Sparrow - Importance of Different Parts of the Song in Song Type Classification. Ethology 94: 46-58.
Jouventin, P., and Aubin, T. 2002. Acoustic systems are adapted to breeding ecologies: individual recognition in nesting penguins. Animal Behaviour 64: 747-757.
Jurisevic, M.A., Sanderson, K.J. 1998 Acoustic discrimination of passerine anti-predator signals by Australian raptors. Australian Journal of Zoology 46: 369-379
Kramer, C.Y. 1956. Extension of Multiple Range Tests to Group Means with Unequal Numbers of Replications. Biometrics 12: 309-310.
Laiolo, P., Palestrini, C., and Rolando, A. 2000. A study of Choughs' vocal repertoire: variability related to individuals, sexes and ages. Journal fur Ornithologie 141: 168-179.
Langemann, U., Gauger, B., and Klump, G. M. 1998. Auditory sensitivity in the great tit: perception of signals in the presence and absence of noise. Animal Behaviour 56: 763-769.
Lanzone, M. and Farnsworth, A. In preparation. Documenting unknown and poorly known flight-calls using a novel recording method.
Lefebvre, G., and Poulin, B. 2003. Accuracy of bittern location by acoustic triangulation. Journal of Field Ornithology 74: 305-311.
Lefebvre., Montgomerie, R., and Gaston, A. J. 1998. Parent-offspring recognition in thick-billed murres (Aves : Alcidae). Animal Behaviour 55: 925-938.
Lefebvre., Gaston, A. J., and Montgomerie, R. 2001. Repertoire, structure, and individual distinctiveness of Thick-billed Murre calls. Condor 103: 134-142.
Legendre, P. 2000. Comparison of permutation methods for the partial correlation and partial Mantel tests. Journal of Statistical Computation and Simulation 67: 37-73.
Lengagne, T., Aubin, T., Jouventin, P., and Lauga, J. 2000. Perceptual salience of individually distinctive features in the calls of adult king penguins. Journal of the Acoustical Society of America 107: 508-516.
Lengagne, T., Harris, M. P., Wanless, S., and Slater, P. J. B. 2004. Finding your mate in a seabird colony: contrasting strategies of the Guillemot Uria aalge and King Penguin Aptenodytes patagonicus. Bird Study 51: 25-33.

93
Lind, H., Dabelsteen, T., and McGregor, P. K. 1996. Female great tits can identify mates by song. Animal Behaviour 52: 667-671.
Littell, R. C., Milliken, G. A., Stroup, W. W., and Wolfinger, R. D. 1996. SAS system for mixed models. Cary, North Carolina, USA: SAS Institute.
Lohr, B., and Dooling, R. J. 1998. Detection of changes in timbre and harmonicity in complex sounds by zebra finches (Taeniopygia guttata) and budgerigars (Melopsittacus undulatus). Journal of Comparative Psychology 112: 36-47.
Lohr, B., Wright, T. F., and Dooling, R. J. 2003. Detection and discrimination of natural calls in masking noise by birds: estimating the active space of a signal. Animal Behaviour 65: 763-777.
Lohr, B., Lauer, A., Newman, M. R., and Dooling, R. J. 2004. Hearing in the red-billed firefinch Lagonosticta senegala and the Spanish timbrado canary Serinus canaria: The influence of natural and artificial selection on auditory abilities and vocal structure. Bioacoustics 14: 83-98.
Longford, N. T. and Muthen, B. O. 1992. Factor analysis for clustered observations. Psychometrika 41: 581-597.
Lovell, S. F. and Lein, M. R. 2005. Individual recognition of neighbors by song in a suboscine bird, the alder, flycatcher Empidonax alnorum. Behavioral Ecology and Sociobiology 57: 623-630.
Marler, P. 1955. Characteristics of some animal calls. Nature 176: 6-8.
Marler, P. 2004. Bird calls - Their potential for behavioral neurobiology. Behavioral Neurobiology of Birdsong, 1016: 31-44.
Mathevon, N. 1996. What parameters can be used for individual acoustic recognition by the greater flamingo? Comptes Rendus de l Academie des Sciences Serie Iii-Sciences de la Vie-Life Sciences 319: 29-32.
Mathevon, N., Charrier, I., and Jouventin, P. 2003. Potential for individual recognition in acoustic signals: a comparative study of two gulls with different nesting patterns. Comptes Rendus Biologies 326: 329-337.
Medvin, M. B., and Beecher, M. D. 1986. Parent Offspring Recognition in the Barn Swallow (Hirundo rustica). Animal Behaviour 34: 1627-1639.
Medvin, M. B., Stoddard, P. K., and Beecher, M. D. 1992. Signals for Parent-Offspring Recognition - Strong Sib-Sib Call Similarity in Cliff Swallows but Not Barn Swallows. Ethology 90: 17-28.

94
Medvin, M. B., Stoddard, P. K., and Beecher, M. D. 1993. Signals for Parent Offspring Recognition - A Comparative-Analysis of the Begging Calls of Cliff Swallows and Barn Swallows. Animal Behaviour 45: 841-850.
Mills, H.G. and Figueroa, H.K. 2005. Extensible bioacoustical analysis software: Two examples. Journal of the Acoustical Society of America 117: 2525.
Molles, L. E., and Vehrencamp, S. L. 2001. Neighbour recognition by resident males in the banded wren, Thryothorus pleurostictus, a tropical songbird with high song type sharing. Animal Behaviour 61: 119-127.
Morton, E. S. 1975. Ecological sources of selection on avian sounds. American Naturalist 109: 17-34.
Morton, E. S. 1977. Occurrence and significance of motivational structural rules in some bird and mammal sounds. American Naturalist 111: 855-869.
Mosteller, F. and Tukey, J. W. 1977 Data analysis and regression, a second course in statistics. Addison-Wesley Publishing Company, Reading Massachusetts.
Mundinger, P.C. 1970. Vocal Imitation and Individual Recognition of Finch Calls. Science 168: 480.
Naguib, M., Hammerschmidt, K., and Wirth, J. 2001. Microgeographic variation, habitat effects and individual signature cues in calls of chiffchaffs Phylloscopus collybita canarensis. Ethology 107: 341-355.
Nelson, B. S., and Stoddard, P. K. 1998. Accuracy of auditory distance and azimuth perception by a passerine bird in natural habitat. Animal Behaviour 56: 467-477.
Nowicki, S., and Nelson, D. A. 1990. Defining Natural Categories in Acoustic-Signals - Comparison of 3 Methods Applied to Chick-A-Dee Call Notes. Ethology 86: 89-101.
Otter, K. 1996. Individual variation in the advertising call of male Northern Saw-whet Owls. Journal of Field Ornithology 67: 398-405.
Peake, T. M., McGregor, P. K., Smith, K. W., Tyler, G., Gilbert, G., and Green, R. E. 1998. Individuality in corncrake Crex crex vocalizations. Ibis 140: 120-127.
Phillmore, L. S., Sturdy, C. B., Turyk, M. R. M., and Weisman, R. G. 2002. Discrimination of individual vocalizations by black-capped chickadees (Poecile atricapilla). Animal Learning, and Behavior 30: 43-52.
Podos, J. 2001. Correlated evolution of morphology and vocal signal structure in Darwin's finches. Nature 409: 185-188.

95
Price, J. J. 1999. Recognition of family-specific calls in stripe-backed wrens. Animal Behaviour 57: 483-492.
Robertson, B. C. 1996. Vocal mate recognition in a monogamous, flock-forming bird, the silvereye, Zosterops lateralis. Animal Behaviour 51: 303-311.
Robisson, P., Aubin, T., and Bremond, J. C. 1993. Individuality in the Voice of the Emperor Penguin Aptenodytes forsteri - Adaptation to A Noisy Environment. Ethology 94: 279-290.
Robisson, P. 1993. The Adaptation of Individual Information-Transfer in a Colonial Environment - the Case of Penguins. Revue D Ecologie-la Terre et la Vie 48: 133-141.
Ryan, M. J. and Brenowitz, E. A. 1985. The role of body size, phylogeny, and ambient noise in the evolution of bird song. American Naturalist 126: 87-100
Searby, A., Jouventin, P., and Aubin, T. 2004. Acoustic recognition in macaroni penguins: an original signature system. Animal Behaviour 67: 615-625.
Searby, A., and Jouventin, P. 2005. The double vocal signature of crested penguins: is the identity coding system of rockhopper penguins Eudyptes chrysocome due to phylogeny or ecology? Journal of Avian Biology 36: 449-460.
Seddon, N., Tobias, J. A., and Alvarez, A. 2002. Vocal communication in the pale-winged trumpeter (Psophia leucoptera): Repertoire, context and functional reference. Behaviour 139: 1331-1359.
Sharp, S. P., and Hatchwell, B. J. 2005. Individuality in the contact calls of cooperatively breeding long-tailed tits (Aegithalos caudatus). Behaviour 142: 1559-1575.
Shieh, B. S. 2004. Song structure and microgeographic variation in a population of the Grey-cheeked Fulvetta (Alcippe morrisonia) at Shoushan Nature Park, southern Taiwan. Zoological Studies 43: 132-141.
Slabbekoorn, H., Ellers, J., and Smith, T. B. 2002. Birdsong and sound transmission: The benefits of reverberations. Condor 104: 564-573.
Slater, P. J. B. 2003. Fifty years of bird song research: a case study in animal behaviour. Animal Behaviour 65: 633-639.
Steinberg, D. and Colla, P. 1997. CART version 5.0, Classification and Regression Trees. San Diego, CA. Salford Systems, http://www.salford-systems.com/index.html.
Stoddard, P. K., Beecher, M. D., Horning, C. L., and Campbell, S. E. 1991. Recognition of Individual Neighbors by Song in the Song Sparrow, a Species with Song Repertoires. Behavioral Ecology and Sociobiology 29: 211-215.

96
Swanson, M., Sanderson, K.J. 1999 Preliminary observations on acoustic perception of alarm calls and natural sounds by Australian owls and frogmouths. South Australian Ornithologist 33: 51-55.
VanBuskirk, J. 1997. Independent evolution of song structure and note structure in American wood warblers. Proceedings of the Royal Society of London Series B - Biological Sciences 264: 755-761.
Volodin, I. A., Volodina, E. V., Klenova, A. V., and Filatova, O. A. 2005. Individual and sexual differences in the calls of the monomorphic White-faced Whistling Duck Dendrocygna viduata. Acta Ornithologica 40: 43-52.
Wanker, R., and Fischer, J. 2001. Intra- and interindividual variation in the contact calls of spectacled parrotlets (Forpus conspicillatus). Behaviour 138: 709-726.
Wanker, R., Sugama, Y., and Prinage, S. 2005. Vocal labeling of family members in spectacled parrotlets, Forpus conspicillatus. Animal Behaviour 70: 111-118.
Wiley, R. H. 1991. Associations of Song Properties with Habitats for Territorial Oscine Birds of Eastern North America. American Naturalist, 138: 973-993.
Wiley, R. H. 2005. Individuality in songs of Acadian flycatchers and recognition of neighbours. Animal Behaviour 70: 237-247.
Wood, S.A., Sanderson, K.J., Evans, C. 2000 Perception of terrestrial and aerial alarm calls by honeyeaters and falcons. Australian Journal of Zoology 48: 127-134.
Wright, T. F. 1996. Regional dialects in the contact call of a parrot. Proceedings of the Royal Society of London Series B-Biological Sciences 263: 867-872.
Wright, T. F., Cortopassi, K. A., Bradbury, J. W., and Dooling, R. J. 2003. Hearing and vocalizations in the orange-fronted conure (Aratinga canicularis). Journal of Comparative Psychology 117: 87-95.
Wright, T. F., Rodriguez, A. M., and Fleischer, R. C. 2005. Vocal dialects, sex-biased dispersal, and microsatellite population structure in the parrot Amazona auropalliata. Molecular Ecology 14: 1197-1205.

97
CHAPTER FIVE: A COMPARISON OF SOUND ANALYSIS METHODS USING
WARBLER FLIGHT-CALLS, A SIMPLE AVIAN VOCALIZATION*
Abstract
Recent studies using a number of different methods have demonstrated individual
distinctiveness in the calls of a wide variety of birds. However, whether or not
commonly used methods produce the same results qualitatively or quantitatively
remains unclear. We applied three common methods to analyze a simple type of
signal, flight-calls of New World warblers. We compared: 1) spectrographic cross-
correlation (SPCC) matrices ordinated by principal coordinate analysis; 2) energy-
distribution (ED) measurement matrices ordinated by principal coordinate analysis;
and 3) classification tree analysis (CTA) of multiple ED measurements. Sufficient
individuality in flight-call measurements exists to distinguish among individuals, and
we compared the ability of each method to assign calls correctly to known caller for
five warbler species using linear discriminant analysis. Results show that SPCC data
yielded the lowest misclassification rates, suggesting that this form of data is best for
representing individual differences in flight-calls. Additionally, SPCC and ED
measurements did not show concordant patterns of correlations with unordinated
spectral and temporal measurements of sound, indicating that these two approaches for
characterizing sounds do not represent common acoustic features.
Introduction
Warbler flight-calls are single-syllable, short, high frequency, and narrow-bandwidth
calls that are probably used for short distance communication. These simple calls may
* Andrew Farnsworth, Department of Ecology and Evolutionary Biology, Cornell Laboratory of Ornithology, Cornell University, Ithaca NY 14850; Michael Lanzone, Carnegie Museum of Natural History, Powdermill Avian Research Center, 1847 Route 381, Rector, PA 15677; Kathy Cortopassi, Bioacoustic Research Program, Cornell Laboratory of Ornithology, Cornell University, Ithaca NY 14850.

98
have several functions including maintaining flock structure, stimulating conspecifics,
coordinating movements, or some combination of these (Marler 1955, Hamilton 1962,
Griffin 1969, Evans and O’Brien 2002, Farnsworth and Lovette 2005). In addition,
these calls exhibit unique acoustic properties among species and individuals as well as
between ages and sexes (Chapter 4).
Numerous studies have demonstrated that individual differences exist in the
calls of a wide variety of birds (e.g. Robertson 1996, Price 1999, Dahlin et al. 2005,
Searby and Jouventin 2005, Sharp and Hatchwell 2006). A number of different
methods have been invoked to demonstrate individual distinctiveness, including visual
inspection, spectrographic cross-correlation (SPCC), and comparisons based on
objective statistical analyses of acoustic measurements. Despite several efforts to
compare methods (Nowicki and Nelson 1990, Baker and Logue 2003, Preatoni et al.
2005), it remains unclear whether commonly used methods will produce the same
answers qualitatively or quantitatively.
Here, we take advantage of recent studies of New World warblers’ (Parulidae)
flight-calls (Chapter 4), using this simple type of signal to compare three popular
methods of comparing sounds: a) SPCC matrices ordinated by principal coordinate
analysis (e.g. Cortopassi and Bradbury 2000, 2006); b) multiple measurements on
each sound reduced to similarity matrices and ordinated using principal coordinate or
principal component analysis (e.g. Baker and Logue 2003) and c) classification tree
analysis using multiple measurements on each sound (e.g. Van Opzeeland and Van
Parijs 2004, Preatoni et al. 2005). We compare the ability of each acoustic analysis
method to assign flight-calls correctly to individual caller for five warbler species.
Based on these results we discuss the degree to which these methods are concordant in
their rankings of different acoustic features.

99
Methods
The dataset consisted of 3405 warbler flight-calls from 171 individuals of 14 species
previously recorded from captive birds. All data were collected in a specially
designed recording device (Lanzone and Farnsworth in preparation) using a pressure
zone microphone with a Knowles EK3132 microphone element (see applications by
Evans and Mellinger 1999, Evans and Rosenberg 2000, Farnsworth et al. 2004) with a
flat (± 1 dB) frequency response in the 2000 - 10000 Hz range. Before analysis, all
digital files were filter-decimated to a 22,050 Hz sampling rate. We used Raven 1.2.1
(Charif et al. 2004) to edit flight-call spectrograms, and after editing flight-call
samples contained approximately 20-40 ms initial and terminal portions of ambient
noise that were not part of the call. We excluded any flight-calls if spectrograms
contained noise that interfered with the call signal.
Because species and individuals did not have uniform representation in this
dataset, we limited our analysis to species represented by at least four individuals: at
least one male, one female, one after-hatching-year (> 1 year-old) bird, and one
hatching-year (< 1 year-old) bird (Lanzone and Farnsworth in preparation). Five
species (American Redstart Setophaga ruticilla, Chestnut-sided Warbler Dendroica
pennsylvanica, Magnolia Warbler Dendroica magnolia, Nashville Warbler Vermivora
ruficapilla, and Yellow-rumped Warbler Dendroica coronata) met this criterion, and
we sampled randomly 10 flight-calls from each individual across these species (see
Figure 5.1 for flight-call examples). If the sample set for a species had more than one
individual for a given age or sex class, we sampled randomly to choose the individual.
This procedure yielded a new sample of 200 flight calls from five species, each
represented by four individuals with 10 flight-calls per individual.
We applied spectrogram cross-correlation and comparative analysis of call
features to compare quantitatively calls within and among individuals of the same

100
species. For both analyses, we used XBAT 0.6.3 (www.xbat.org; Figueroa 2002) to
compute spectrograms representing the time-varying distribution of sound intensity
level in a call. All spectrograms were computed with identical parameters (Hamming
window, 87.5% overlap, 256-point FFT, 256-point frame length) resulting in temporal
and frequency resolutions of 11.6 ms and 112 Hz. Spectrogram cross-correlation was
applied to comparatively measure the similarity between pairs of calls (SPCC, Clark et
al. 1987, Cortopassi and Bradbury 2000). This process returns a single value between
0 and 1, where 0 represents no similarity and 1 represents identical sounds.
Figure 5.1. Spectrograms of the flight-calls of five warbler species, with two flight-calls from each of three individuals per species. A) American Redstart, B) Chestnut-sided Warbler, C) Magnolia Warbler, D) Nashville Warbler, and E) Yellow-rumped Warbler. Note that the general pattern of the signal is often consistent within a species, whereas flight-calls vary in frequency and time within a species.
We implemented a feature extraction process to measure automatically
acoustic characteristics of flight-calls. This set of features was a subset of those based
on ACUSTAT (Fristrup and Watkins 1992, 1993), and XBAT provided the analytical
environment to implement a customized auto-feature-measurement routine.
Measuring acoustic properties involved selecting a signal of interest (in this case, a

101
flight-call) by drawing a box around a flight-call onscreen using the cursor. This box
represents the bounds within which the feature extraction process occurred, extracting
measurements automatically and logging these in a data file. For these analyses, each
spectrogram’s amplitude-time envelope (aggregate power as a function of time) and
power spectrum envelope (power as a function of frequency) were treated
conceptually as probability density functions in the time and frequency dimensions,
respectively (Figure 5.2).
Figure 5.2. Spectrogram representation (a) of a signal, generating an aggregate time envelope (b) and a frequency spectrum (c) by summing power values in each short- time spectrum or narrow-band envelope, respectively. The resulting aggregates (once normalized to have unit area) are treated like probability density functions with time and frequency as variates.

102
We used 50% of the total flight-call signal energy in the amplitude-time and
power spectrum envelopes to measure statistical quartiles and inter-quartile ranges,
where “median” (Me) is the 50th percentile, “initial” (P1) is the 25th percentile,
“terminal” (P2) is the 75th percentile, “inter-percentile range” (W) encompasses 50%
of the signal energy distribution, and “skewness” is (Me-P1)/W). We use the highest
and lowest values that bound the top 50% of the probability distribution of the
amplitude-time or power spectrum envelope to calculate the spread (highest minus
lowest) in the distribution, which is then used to calculate “skewness” in the
amplitude-time or power spectrum envelope. We also use equivalent width to
describe amplitude-time (equivalent-duration) and power spectrum (equivalent
bandwidth) data (Figure 5.3).
Figure 5.3. Equivalent-duration is the width of the rectangle whose height is the value of the median, centered on the median such that the area in the rectangle is equal to the total area under the amplitude-time envelope curve (see Table 5.1, measure 1; ENV). When the curve is the power spectrum (see Table 5.1, measure 2; PS), this width is referred to as equivalent-bandwidth. Note: when the curve is the FFT of the amplitude-time envelope curve (AM, AFM; Table 5.1, measures 3 and 4), then it is neither a “duration” or a “bandwidth” in an easy to understand sense (i.e., abstract); we refer to it as an “equivalent width.”

103
XBAT extracted measurements to quantify a signal’s compactness by sorting
the amplitude-time and power spectrum envelopes, referred to as concentration
measures (Figure 5.4). The value of concentration in relation to interpercentile range
reveals how densely or loosely the signal's energy is distributed. Detailed descriptions
of this procedure and these energy-distribution measurements are available from the
Cornell Laboratory of Ornithology Bioacoustic Research Program (Cortopassi,
www.birds.cornell.edu/brp/research/algorithms/RSM.html).
Figure 5.4. Sorted aggregate time envelope (a) and frequency spectrum (c) of a signal. Notice how the time and frequency indices are not sequential. The segment needed to accumulate a fraction P = 0.75 of the total signal energy is marked, and denoted as concentration (CTR). The concentration, interpercentile range (IPR), and lower-upper range (LUR) are shown together overlaid on the aggregate time envelope (b) and frequency spectrum (d).

104
There were 28 measurements taken: 16 from the amplitude-time and power
spectrum envelopes and 12 concentration measures derived from sorted probability
density functions of the time-varying features in the spectral frames, 9 from the
amplitude-time envelope and 3 from the power spectrum envelope. The following are
brief descriptions for each of these 28 ACUSTAT measurements. Table 5.1 is a look-
up table to match the terms given here with those in ACUSTAT as implemented in
XBAT.
1) Median, equivalent-duration and skewness of the amplitude-time envelope
(MeENV, EqENV, and SkENV, in seconds);
2) Median, equivalent-bandwidth and skewness of the power spectrum envelope
(MePS, EqPS, and SkPS, in Hz);
3) Median, equivalent-width and skewness of the discrete Fourier transform of
the amplitude-time envelope, computing the frequency spectrum of the
amplitude-time envelope and measuring from that (MeENVM, EqENVM, and
SkENVM, in Hz);
4) Median, equivalent-width and skewness of the discrete Fourier transform of
the median frequency contour from the amplitude-time envelope weighted by
¼ power of the amplitude-time envelope (MeAFM, EqAFM, and SkAFM in
Hz);
5) Attack fraction (ATTACKFR, unitless), fraction of data blocks that have
higher energy than the previous block, similar to the musical definition of a
crescendo;

105
6) Up-sweep fraction (UPSWFR, unitless), fraction of data blocks that have
higher frequency (based on the peak frequency contour) that the previous
block;
7) Up-sweep mean (UPSWM, in Hz), average slope of the peak frequency
contour;
8) Sweep magnitude (SWMAG, in Hz), sum of the absolute value of the
derivative of the peak frequency contour;
9) Median, spread and skewness of the median-frequency contour (MeFMED,
EqFMED, and SkFMED, in Hz), where FMED is the vector of the median-
frequency values in each spectral frame of the power spectrum (Figure 5.5);
10) Median, spread and skewness of the frequency-concentration contour
(MeFCC, EqFCC, and SkFCC, in Hz), where FCC is the vector of the number
of bins needed to accumulate 50% of the total energy in the sorted energy
distribution for each spectral frame;
11) Median, spread and skewness of the equivalent-bandwidth contour (MeEBC,
EqEBC, and SkEBC, in Hz), where EBC is the vector of equivalent-bandwidth
values for each spectral frame;
12) Median, spread and skewness of the frequency-skewness contour (MeFSKEW,
EqFSKEW, and SkFSKEW in Hz), where FSKEW is the vector of skewness
values for each spectral frame;

106
Table 5.1. XBAT energy-distribution measurements recorded from each flight call spectrogram. Measurement Analogous ACUSTAT
Measurement Description Estimates
1) Amplitude Time Envelope (ENV, in sec) Energy Envelope (ENV) Amplitude time envelope from the aggregate energy
envelope Median (Me), Equivalent Duration
(EQD), Skewness (Sk)
2) Power Spectrum Envelope (PS, in Hz) Frequency Bandwidth (TS) Power spectrum envelope from the aggregate power spectrum
Median (Me), Equivalent Bandwidth (EQB), Skewness (Sk)
3) Frequency Spectrum of Amplitude Time Envelope (ENVM, in Hz)
Amplitude Modulation (AM)
Discrete Fourier transform of the amplitude-time envelope, computing the frequency spectrum of the amplitude-time envelope and measuring from that
Median (Me), Equivalent Bandwidth (EQB), Skewness (Sk)
4) Median Frequency Contour Spectrum of Amplitude Time Envelope (AFM, in
Hz)
Amplitude-Frequency Modulation (AFM)
Discrete Fourier transform of the median frequency contour from the amplitude-time envelope weighted by
¼ power of the amplitude-time envelope
Median (Me), Equivalent Bandwidth (EQB), Skewness (Sk)
5) Attack Fraction (ATTACKFR, unitless)
Attack Fraction (ATTACKFR)
Fraction of data blocks that have higher energy than the previous block
6) Up-sweep Fraction (UPSWP, unitless) Up-sweep Fraction (UPSWFR)
Fraction of data blocks that have higher frequency (peak frequency contour) that the previous block
7) Up-sweep Mean (UPSWM, in Hz) Up-sweep Mean (UPSWM) Average slope of the peak frequency contour
8) Sweep Magnitude (SWMAG, in Hz) Sweep Magnitude (SWMAG)
Sum of the absolute value of the derivative of the peak frequency contour
9) Median Frequency Contour (FMED, in Hz)
Median Frequency Contour (FMED)
The vector of the median-frequency values in each spectral frame of the power spectrum
Median (Me), Spread (Sp), Skewness (Sk)
10) Frequency Concentration Contour (FCC, in Hz)
Frequency Concentration Contour (CONC)
The vector of the number of bins needed to accumulate 50% of the total energy in the sorted energy distribution
for each spectral frame
Median (Me), Spread (Sp), Skewness (Sk)
11) Equivalent Bandwidth Contour (EBC, in Hz)
Equivalent Bandwidth Contour (MODW)
The vector of equivalent-bandwidth values for each spectral frame
Median (Me), Spread (Sp), Skewness (Sk)
12) Frequency Skewness Contour (FSKEW, in Hz)
Frequency Asymmetry Contour (FASYM) The vector of skewness values for each spectral frame Median (Me), Spread (Sp),
Skewness (Sk)
Parenthetical notation represents the abbreviations used in XBAT. Estimates refer to order statistics used to describe measurements. Measures and estimates (for example FMED and ME = FMEDME) describe the acoustic characteristics of flight-calls measured

107
Figure 5.5. Spectrogram representation (a) of a signal with an overlay of the median frequency contour (FMED), which is based on the medians of the successive short-time spectra. The median (M), initial percentile (P1), terminal percentile (P2), and interpercentile range (IPR) values are shown for the aggregate time envelope (b) and frequency spectrum (c) for an energy fraction P = 0.75.
The SPCC algorithm (Cortopassi unpublished data; similar application,
Cortopassi and Bradbury 2000, 2006) calculates peak correlation coefficients for all
pair-wise correlations of flight-calls and generates a matrix of these values. The
algorithm convolves the two spectrogram matrices over each other in both time and
frequency to compute their fit (Clark et al. 1987, Cortopassi and Bradbury 2000; also
see ambiguity functions, Woodward 1953, Angelari 1970). As such, SPCC
incorporates spatial and temporal elements of spectrograms in a repeatable and
objective way to generate correlations rather than using a suite of more subjective
individual measures of time and frequency to characterize a signal (Clark et al. 1987,
Cortopassi and Bradbury 2000, Baker and Logue 2004). Whereas some previous
applications of SPCC convolved only on a single scale (e.g. time scale, Cortopassi and

108
Bradbury 2000), convolution on both scales was necessary in our analyses; flight-call
similarity across individuals and species may shift in both time and frequency (i.e., a
pair of flight-calls may show differences in their durations, differences in their
frequency distributions or differences in both duration and frequency distribution.)
Before computing the spectrograms for a pair of calls, the program adds data samples
of zero value to the length of the shorter call so as to have it match the duration of the
longer call, a process called zero-padding (Qi 1992, Cortopassi and Bradbury 2000,
Lucero and Koenig 2000). For all correlation calculations, we used the given
spectrographic frequency and filter resolution of the Hamming window and frequency
convolution of ± 1000 Hz for frequencies (based on previous visual inspection
confirming that calls did not vary in center and bandwidth frequency by more than this
amount). We cross-correlated 10 flight-calls from each of four individuals for each of
the five species, yielding five different, species-specific, symmetrical 40-by-40
correlation matrices, each containing 780 unique pair-wise values.
We extracted 5 principal coordinates (PCOs) from each species’ SPCC matrix
(generated using a PCO option in the SPCC algorithm, Cortopassi unpublished data)
and from each species’ ED matrix (SAS 9.1.3, PROC MDS based on Euclidean
distances between XBAT measurements, PROC DISTANCE, SAS Institute 2006).
PCOs explained 94-99% of the variance in the SPCC matrices and 93-99% of the
variance in the ED matrices (Table 5.2). Principal coordinate analysis of correlation
matrices reduces and ordinates sound data into independent measures (latent
orthogonal object measures; Gower 1966, Neff and Marcus 1980, Gower 1987,
Legendre and Legendre 1998, Everitt and Dunn 2001) useful for grouping sounds and
associating sounds with extrinsic variables (Cortopassi and Bradbury 2000, Baker
2004). In these analyses, negative eigenvalues represented less than 1% of the

109
cumulative variation explained by all eigenvalues, and none of the first five PCOs
extracted from our samples contained negative eigenvalues.
Table 5.2. Cumulative goodness of fit of five principal coordinate axes extracted from flight-call correlation matrices of spectrographic cross-correlation data (SPCC) and XBAT energy-distribution measurement data (ED).
Cumulative goodness of fit Species SPCC XBAT
American Redstart 99% 98% Chestnut-sided Warbler 98% 97%
Magnolia Warbler 98% 96% Nashville Warbler 94% 93%
Yellow-rumped Warbler 96% 99% Goodness of fit is represented in percentage of variance explained. None of the PCOs we extracted contained negative eigenvalues.
For each species we classified individuals using a linear discriminant analysis
(LDA) with cross-validation of PCO data extracted from SPCC and ED measurements
of spectrograms (PROC DISCRIM, SAS 9.1.3, SAS Institute 2006). We used
individuals as output variables and PCOs as input variables to generate
misclassification rates for misidentifying calls to known caller. By this procedure,
misclassification rates represent a common metric for assessing the abilities of the
LDA to discriminate among individuals.
We performed two separate series of stepwise regressions, one for the SPCC-
PCO and one for the ED-PCO datasets, against the 28 ED measurements (PROC
REG, SAS 9.1.3) to examine the relationships between the SPCC-PCO and ED-PCO
datasets and linear combinations of the acoustic ED measurements. The goal of this
analysis was two-fold: 1) to determine which, if any, acoustic measures correlated
significantly to the PCO data; and 2) to compare any such correlations of acoustic
measures between SPCC-PCO and ED-PCO datasets. We also used stepwise
regression to investigate relationships between cross-correlation and energy-
distribution representations of flight-calls and to search for significant linear

110
combinations of SPCC-PCO and ED-PCO datasets. In addition to this stepwise
regression for SPCC-PCO and ED-PCO datasets, we performed a canonical
correlation analysis (CCA) to correlate the linear combinations of these PCO data
(PROC CANCORR, SAS Institute 2006). We used Holm’s method for sequential
Bonferroni correction (Holm 1979, Rice 1989) with an adjusted critical value of p =
0.002. We designated any critical value of 0.002 < p < 0.05 as a near-significant
trend.
We performed classification tree analysis (CTA) using CART 5.0 (Salford
Systems; Steinberg and Colla 1997) to explore the misclassification rates and variable
importance among species for each individual. CTA is a statistical method for
partitioning categorical data by constructing decision rules for splitting groups
(Breiman et al. 1984, Clark and Pregibon 1992, Friedman 1989, Steinberg and Colla
1997, De’ath and Fabricius 2000, Perlich et al. 2003, Prasad et al. 2006). Binary splits
based on single predictor variables generate successively smaller group partitions, to a
point after which no smaller partitions are possible and to a point at which the largest
class representation within a partition defines the group (also called plurality,
Steinberg and Colla 1997). However, single trees may misrepresent data because of
variability in data sampling (Freund and Schapire 1996, Breiman 1996, Prasad et al.
2006). To reduce the effects of variable data sampling, we used a procedure of
resampling and combining trees based on the performance of prior trees (ARCing, or
adaptive resampling and combining; Breiman 1996, Freund and Schapire 1996,
Steinberg and Colla 1997). Successive samples are not random but skewed in favor of
classes with higher, prior misclassification rates (in contrast, see bootstrapping
aggregates: Steinberg and Colla 1997).
We combined 200 trees using ARCING in CART 5.0 with 50 redraws,
withholding 25% of the population sample, and using a power exponent of four (the

111
larger this exponent, the greater the weight on previously misclassified cases). We
used a Gini splitting rule to maximize the number of nodes with as few target classes
of individuals as possible. We cross-validated to produce a minimum cost - one
standard error tree (additional detail: Steinberg and Colla 1997), using
misclassification rate to assess the accuracy of tree models. We assessed variable
importance by examining the reductions in sum of squares based on all partitions
associated with a given sound measurement and its role as a primary and surrogate
splitter (details: Steinberg and Colla 1997). We do not present classification trees in
our results because we produced no single representative tree for each species, a result
of combining 200 trees for each analysis.
Results
Flight-call PCOs showed patterns of individual grouping within species in both the
SPCC and ED data (data shown for PCOs 1 and 2: Figure 5.6, SPCC; Figure 5.7, ED).
However, substantial variation exists in the degree of individual separation among the
five species, and substantial differences in individual separation exist between SPCC
and ED data for the same species. American Redstart flight-calls formed distinct
clusters of individuals, and this pattern is apparent in the scatterplot of SPCC-PCO 1
against SPCC-PCO 2 (Figure 5.6a). In contrast, Yellow-rumped Warbler flight-calls
formed indistinct and overlapping clusters of individuals (Figure 5.6e). The same
relationships for ED-PCOs exhibit much less distinct separation among individuals for
both species (Figures 5.7a and 5.7e, respectively).

112
A)
Figure 5.6. Scatterplot matrix of SPCC PCOs 1 and 2 of flight-calls of five species of warblers. A) American Redstart, B) Chestnut-sided Warbler, C) Magnolia Warbler, D) Nashville Warbler, E) Yellow-rumped Warbler. Each individual is labeled with a unique marker and color in the legend.

113
Figure 5.6 (Continued).
B)

114
Figure 5.6 (Continued).
C)

115
Figure 5.6 (Continued).
D)

116
Figure 5.6 (Continued).
E)
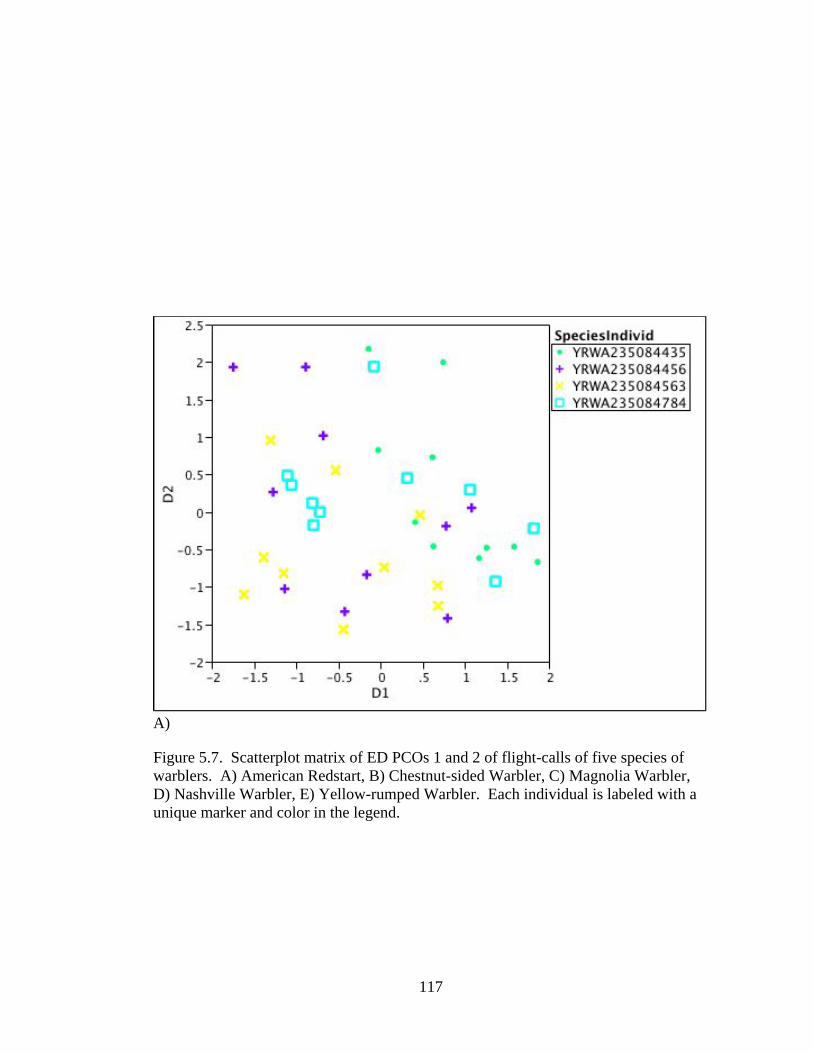
117
A)
Figure 5.7. Scatterplot matrix of ED PCOs 1 and 2 of flight-calls of five species of warblers. A) American Redstart, B) Chestnut-sided Warbler, C) Magnolia Warbler, D) Nashville Warbler, E) Yellow-rumped Warbler. Each individual is labeled with a unique marker and color in the legend.

118
Figure 5.7 (Continued).
B)

119
Figure 5.7 (Continued).
C)

120
Figure 5.7 (Continued).
D)

121
Figure 5.7 (Continued).
E)
SPCC-PCO data performed better at correctly classifying flight-calls than did
ED-PCO data for each species (Table 5.3). LDA classification of individuals using
PCO data as input variables yielded misclassification rates of individuals of 0-70% for
SPCC data and 10-100% for ED data. American Redstart and Chestnut-sided Warbler
were not misclassified for SPCC-PCO data, while Yellow-rumped Warbler showed
the highest misclassification rates up to 70% with these data. American Redstart and
Chestnut-sided Warbler were misclassified for ED-PCO DATA (10-70% and 40-70%
respectively). Nashville Warbler showed the highest misclassification rates using ED-
PCO data (60-100%).

122
Table 5.3. Misclassification rate means and ranges by species for misclassifying flight-calls to known flight-caller.
Species Classification Method Input Data Average
Misclassification Rate Range
ED 25.2% 15-35% SPCC 15.4% 5-45% CART
XBAT 16.2% 10-25% SPCC 0.0% 0%
American Redstart
LDA XBAT 35.2% 10-70%
ED 65.0% 50-85% SPCC 8.3% 0-25% CART
XBAT 43.2% 30-55% SPCC 0.0% 0%
Chestnut-sided Warbler
LDA XBAT 50.0% 40-70%
ED 45.3% 35-50% SPCC 21.7% 10-35% CART
XBAT 37.8% 30-40% SPCC 22.6% 0-50%
Magnolia Warbler
LDA XBAT 47.5% 10-60%
ED 35.0% 30-40% SPCC 35.0% 10-45% CART
XBAT 32.4% 25-40% SPCC 12.5% 0-30%
Nashville Warbler
LDA XBAT 77.3% 60-
100% ED 55.2% 30-65%
SPCC 40.0% 20-45% CART
XBAT 43.2% 35-50% SPCC 35.0% 0-70%
Yellow-rumped Warbler
LDA XBAT 52.5% 30-80%
CTA, classification tree analysis; LDA, linear discriminant analysis; ED, energy-distribution measurements prior to ordination by PCO; ED, PCO of XBAT energy-distribution measurements; SPCC, PCO of spectrographic cross-correlation data.
PCOs of both SPCC and ED data exhibited significant relationships with linear
combinations of ED measurements from XBAT (Table 5.4). In particular, SPCC-PCO
2 and ED-PCO 2 exhibited significant models with the linear combinations of the most
energy-distribution measurements: SPCC-PCO2 correlated significantly with a linear
combination of amplitude modulation median, total frequency spectrum mode width,

123
energy envelope mode width, median frequency contour median and skewness, and
frequency skewness contour skewness, this combination explaining 26% of the
variation in SPCC-PCO2; and ED-PCO2 correlated significantly with a liner
combination of weighted amplitude modulation median, median frequency, upsweep
fraction, upsweep mean, sweep magnitude, median frequency contour median and
spread, and frequency skewness contour spread, this combination explaining 54% of
the variation in ED-PCO2. We also found significant correlations between SPCC-
PCO and ED-PCOs (Table 5.4). While two of five PCOs showed no significant
relationships with any respective linear PCO combination (SPCC-PCOs 4 and 5; ED-
PCOs 3 and 5), the remaining three PCOs exhibited significant relationships with a
single PCO or a linear combination of PCOs. SPCC-PCO2 and ED-PCO2, in
particular, exhibited significant relationships with linear combinations of PCOs.
Canonical correlation analysis confirmed this result, indicating that the first SPCC and
ED canonical variables with high correlation loadings of SPCC-PCO2 and ED-PCO2
exhibited a significant correlation (r = 0.40, F = 1.86, P = 0.0007, Table 5.5).
Among the five species’ flight-calls we examined, CTA produced a broad
range of misclassification rates (Table 5.3). These rates were generally higher than
misclassification rates of LDA, especially for SPCC-PCO data. Additionally, with
only a single exception (Nashville Warbler), ED-PCO data generally yielded higher
misclassification rates than SPCC-PCO data in CTA (Table 5.3). The most important
variables for classifying individuals using CTA varied by species, especially for
classifications using unordinated ED measurements (Table 5.6).

124
Table 5.4. Stepwise regression of PCOs against each other and PCOs against energy-distribution measurements. Data for regression Response R2 F-value* Regressor
SPCC PCO 1 0.03 5.96 ED PCO 2 SPCC PCO 2 0.11 7.93 ED PCO 1, ED PCO 2, ED PCO 4 SPCC PCO 3 0.03 6.47 ED PCO 4 SPCC PCO 4 - - - SPCC PCO 5 - - -
ED PCO 1 0.06 11.77 SPCC PCO 2 ED PCO 2 0.07 7.1 SPCC PCO 1, SPCC PCO 2 ED PCO 3 - - - ED PCO 4 0.03 6.47 SPCC PCO 3
PCO Data
ED PCO 5 - - - SPCC PCO 1 0.11 8.26 AFMEQB, ENVME, EBCSP SPCC PCO 2 0.26 11.53 ENVMME, PSEQB, ENVEQD, FMEDME, FMEDSK, FSKEWSK SPCC PCO 3 0.05 4.72 FCCME, EBCSK SPCC PCO 4 0.09 6.32 ENVMEQB, ENVEQD, UPSWFR SPCC PCO 5 0.03 6.53 EBCME
ED PCO 1 0.25 16.01 ATTACKFR, SWMAG, FMEDSP, FSKEWME
ED PCO 2 0.51 24.53 AFMME, PSME, UPSWFR, UPSWM, SWMAG, FMEDME, FMEDSP, FSKEWSP
ED PCO 3 0.24 15.32 PSEQB, PSSK, UPSWFR, SWMAG ED PCO 4 0.02 4.92 ENVME
Energy Distribution (ED) Data
ED PCO 5 0.06 6.51 FMEDSP, EBCSK * P < 0.002 _ no significant variables entered the model Response is the PCO regressed on spectrogram cross correlation (SPCC) or energy-distribution (ED) measurements. R2 is the percentage of variation explained by the model, with its associated F-statistic. Regressor represent the SPCC or ED variables on which we stepwise-regressed the response. * denotes a significant correlation at P < 0.002; - denotes a PCO for which no significant variables entered the stepwise regression.

125
Table 5.5. Canonical correlations for first canonical variables extracted from SPCC and ED PCO data.
PCO Data Canonical Variable 1 for SPCC
Canonical Variable 1 for ED
SPCC PCO1 0.2993 0.1193 SPCC PCO2 0.8227 0.3281 SPCC PCO3 -0.4281 -0.1707 SPCC PCO4 0.2162 0.0862 SPCC PCO5 -0.0596 -0.0238
Canonical Variable 1 for ED Canonical Variable 1 for SPCC
ED PCO1 -0.4667 -0.1861 ED PCO2 -0.6623 -0.2641 ED PCO3 0.1289 0.0514 ED PCO4 0.2786 0.1111 ED PCO5 -0.2186 -0.0872
PCO Data come from spectrographic cross correlation (SPCC) or energy-distribution (ED) measurements. Second column from the left represents the patterns of PCO loadings for each canonical variable. Third column from the left represents the patterns of PCO loadings on the opposing canonical variable.
Table 5.6. Variable importance for classification tree analysis (CTA) of individual warblers by species.
Most Common Primary and Surrogate Splitter Species ED SPCC-PCO ED-PCO
American Redstart FCCSp PCO 1 PCO 1 Chestnut-sided Warbler ENVMEQB PCO 1 PCO 1
Magnolia Warbler UPSWFR PCO 1 PCO 2 Nashville Warbler PSMe PCO 3 PCO 4
Yellow-rumped Warbler AFMSk PCO 3 PCO 3 ED, the un-ordinated energy-distribution measurements; SPCC-PCO, ordinated spectrographic cross-correlation data; and ordinated ED-PCO, energy-distribution measurements. PCOs of SPCC and ED data correspond to ED measurements in Table 5.4.
Discussion
Both spectrographic cross-correlation and energy-distribution measurements of
warbler flight-call spectrograms grouped individuals significantly. Our results suggest
that both approaches to representing and comparing simple acoustic signals may be

126
useful for identifying subtle individual differences. Qualitative inspection of the PCO
scatter plots suggests that the SPCC-PCO analytical approach yielded more distinct
individual flight-call groups than the ED-PCO approach (e.g., American Redstart).
Moreover, LDA and CTA confirmed this quantitatively (Table 5.3). We conclude that
individuality in warbler flight-calls may be expressed more effectively with the linear
discriminant analysis LDA as applied to the SPCC-PCO approach to sound
measurement.
Although slight overlap exists in the two basic patterns of correlation for
energy-distribution measurements with SPCC-PCO and ED-PCO data (Table 5.4; for
example, SPCC-PCO2 versus ED-PCO1 and ED-PCO2), these patterns of correlations
with the PCO variables are largely different. Therefore, while there may be some
overlap in the representative abilities of the reduced and ordinated measures (PCOs)
from spectrographic cross-correlations and energy-distribution measurements, the two
analysis approaches depict different quantitative measures of sound. To our
knowledge this is the first report of a statistical association between ordinated, reduced
cross-correlation measurements and spectral-temporal measurements of sounds
(SPCC-PCO data versus ED measurements, Table 5.4) and between two sets of
different principal coordinate measurements (SPCC-PCO versus ED-PCO datasets,
Table 5.5). Without comparisons of PCO data with ED measurements, we would have
missed this important conclusion. As such, we believe this study represents an
important step forward: 1) for understanding the relationship between more traditional
sound measurements approaches and SPCC approaches; 2) for developing more
automated and objective techniques for processing and comparing sounds; and 3) for
highlighting the value of comparing multiple approaches to measuring sounds,
particularly in relation to interpreting variation in signals and to classifying signals.

127
No single spectral or temporal measurement was common to all species in
classification tree analysis that identified individuals by their flight-call measurements.
Five of the 28 ED measurements that we recorded were important for classifying
individuals by their flight-calls (Table 5.6). PCO data exhibited less variation and
greater redundancy of important variables, although all CTA based on PCOs included
at least two PCO variables (Table 5.6). While different patterns of important
classification variables (unordinated or ordinated and reduced) across species may
relate to classification and measurement methods, the patterns may also have
biological relevance. Individual recognition of vocalizations in birds is likely a
function of multiple parameters, rather than single, isolated acoustic features of
vocalizations. In addition, both sound production and perception abilities may differ
among individuals and among species (e.g. Beecher 1989, Stoddard 1996,
Slabbekoorn and Ten Cate 1998 a,b, Jouventin and Aubin 2002). Regardless of their
underlying cause, the patterns revealed by the analysis presented here emphasize the
importance of choosing multiple or ordinated variables to classify individuals by
measurements of their vocalizations as well as the importance of such choices and
comparing different approaches of representing sounds.
While any set of signal measures could miss important features associated with
particular biological or behavioral contexts (Cortopassi and Bradbury 2000, Baker and
Logue 2003), we chose an analysis approach to include measures that were robust to
human measurement error and as descriptive as possible.
SPCC does not have the constraints associated with subjective sound
measurement sets, and therefore may have the important advantage of incorporating
features into sound measurements that more subjective measures may not represent.
However, previous analyses using SPCC have highlighted drawbacks to this method,
especially related to interpreting results in terms consistent with more typical methods

128
for representing sound. Specifically, there is the difficulty in interpreting results
relative to more traditional measures of sound arises because 1) SPCC measurements
are not user-defined but data-defined (SPCC convolves entire spectrograms that can be
viewed as a n x m matrix of features with high local co-variance, in contrast to sets of
specific feature measurements from spectrograms); and 2) principal coordinate
analysis extracts new, reduced and ordinated axes that do not necessarily correspond
to intuitively salient time and frequency features (Cortopassi and Bradbury 2000,
Baker and Logue 2003). Additionally, shortcomings of spectrographic analysis with
regard to time standardization may be problematic, particularly when comparing two
entire sounds: 1) cross-correlating two sounds similar in frequency features but
different in lengths may produce inaccurate similarity values; and 2) frequency-
modulated signals may have artificially low cross-correlation values despite their
similarity in shape as a result of tiny differences in length (e.g. Deecke and Janik
2006). As such, SPCC analysis may not account for differences in signal stretching
and compression or frequency dilation and compression. However, flight-calls are
short vocalizations, and such differences in duration and frequency among individuals
or species are not as extreme as such differences present in bird songs. Finally,
separating a human’s ability to discriminate between acoustic objects and a bird’s
ability to discriminate between acoustic objects is critically important. To understand
a bird’s powers of discrimination requires much more knowledge of bird behavior,
signal production and content, and perceptive abilities in order to weight properly a
comparative map in spectrographic space.
Our approach indicates that there may be instances where interpreting SPCC-
PCO data may be possible, such that correlation and regression analyses of SPCC-
PCO data with spectral and temporal (ED) measurements yield interpretations in
accordance with more traditional and easy-to-interpret acoustic measurements.

129
Additionally, the increasing ease of processing digital data likely will facilitate more
extensive studies of the relationships between SPCC-PCO and ED-PCO data and lead
to further improvements in interpretive power and ability. Even using SPCC for
comparing more complex vocalizations such as songs, though a much greater
challenge than analysis of simple sounds, may prove within reach, facilitating analysis
of complex vocal behaviors in novel and powerful ways. Yet, for simple
vocalizations, particularly flight-calls, SPCC analysis may be even more powerful,
enhancing abilities to automate sound classification of species and individuals.
Monitoring flight-calls has wide applicability to various conservation goals (Evans
and Mellinger 1999, Evans and Rosenberg 2000, Larkin et al. 2002). Automatic
classification of flight-calls by SPCC could prove invaluable for speeding the
assessment process, especially assessing the magnitude, timing, and location of
species’ migration routes.
Separating a human’s ability to discriminate between acoustic objects and a
bird’s ability to discriminate between acoustic objects is critically important. To
understand a bird’s powers of discrimination requires much additional knowledge of
bird behavior, signal production and content, and perceptive abilities in order to
weight properly a comparative map of a vocalization in spectrographic space.
Furthermore, SPCC gives equal weight to each cell in a similarity matrix, when in
reality observer intuition and experience as well as experimental evidence suggest that
this is not always true; rather, that a flourish or subtle difference could make a
substantive difference in content or acoustic properties that SPCC would not reveal.
130
Literature Cited Altes, R.A. 1973. Some Invariance Properties of Wideband Ambiguity Function. Journal of the Acoustical Society of America 53: 1154-1160.
Amagai, S., Dooling, R. J., Shamma, S., Kidd, T. L. and Lohr, B. 1999. Detection of modulation in spectral envelopes and linear-rippled noises by budgerigars (Melopsittacus undulatus). Journal of the Acoustical Society of America 105: 2029-2035.
Anderson, M. J. and Willis, T. J. 2003. Canonical analysis of principal coordinates: A useful method of constrained ordination for ecology. Ecology 84: 511-525.
Angelari, R.D. 1970. Ambiguity Function Applied to Underwater Acoustic Signal Processing - A Review. Ocean Engineering 2: 13-and.
Aubin, T., Mathevon, N., Da Silva, M. L., Vielliard, J. M. E. and Sebe, F. 2004. How a simple and stereotyped acoustic signal transmits individual information: the song of the White-browed Warbler Basileuterus leucoblepharus. Anais da Academia Brasileira de Ciencias 76: 335-344.
Baker, M. C. and Logue, D. M. 2003. Population differentiation in a complex bird sound: A comparison of three bioacoustical analysis procedures. Ethology 109: 223-242.
Baker, M. C. 2004. The chorus song of cooperatively breeding laughing kookaburras (Coraciiformes, Halcyonidae: Dacelo novaeguineae): Characterization and comparison among groups. Ethology 110: 21-35.
Beecher, M. D., Medvin, M. B., Stoddard, P. K. and Loesche, P. 1986. Acoustic Adaptations for Parent-Offspring Recognition in Swallows. Experimental Biology 45: 179-193.
Beecher, M. D. 1989. Signaling Systems for Individual Recognition - An Information-Theory Approach. Animal Behaviour 38: 248-261.
Beecher, M. D. and Campbell, S. E. 2005. The role of unshared songs in singing interactions between neighbouring song sparrows. Animal Behaviour 70: 1297-1304.
Bradbury, J. W., Cortopassi, K. A. and Clemmons, J. R. 2001. Geographical variation in the contact calls of orange-fronted Parakeets. Auk 118: 958-972.
Charif, R. A., C. W. Clark, and K. M. Fristrup. 2004. Raven 1.2 User’s Manual. Cornell Laboratory of Ornithology, Ithaca, NY.

131
Charrier, I., Jouventin, P., Mathevon, N. and Aubin, T. 2001. Individual identity coding depends on call type in the South Polar skua Catharacta maccormicki. Polar Biology 24: 378-382.
Corbeil, R. R. and Searle, S. R. 1976. Restricted Maximum Likelihood (Reml) Estimation of Variance Components in Mixed Model. Technometrics 18: 31-38.
Cortopassi, K.A. and Bradbury, J. W. 2000. The comparison of harmonically related rich sounds using spectrographic cross-correlation and principal components analysis. Bioacoustics 11: 89-127.
Cortopassi, K. A. and Bradbury, J. W. 2006. Contact call diversity in wild orange-fronted parakeet pairs, Aratinga canicularis. Animal Behaviour 71: 1141-1154.
Dahlin, C. R., Balda, R. P. and Slobodchikoff, C. 2005. Food, audience and sex effects on Pinyon jay (Gymnorhinus cyanocephalus) communication. Behavioural Processes 68: 25-39.
Deecke, V. B. and Janik, V. M. 2006. Automated categorization of bioacoustic signals: Avoiding perceptual pitfalls. Journal of the Acoustical Society of America 119: 645-653.
Dent, M. L. and Dooling, R. J. 2004. The precedence effect in three species of birds (Melopsittacus undulatus, Serinus canaria, and Taeniopygia guttata). Journal of Comparative Psychology 118: 325-331.
Dooling, R. J., Leek, M. R., Gleich, O. and Dent, M. L. 2002. Auditory temporal resolution in birds: Discrimination of harmonic complexes. Journal of the Acoustical Society of America 112: 748-759.
Figueroa, H. 2002. Extensible Bioacoustic Tool. http://www.xbat.org.
Fristrup, K. M. and Watkins, W. A. 1992. Characterizing acoustic features of marine animal sounds. Woods Hole Oceanographic Institution Technical Report WHOI-92-04.
Fristrup, K. M. and Watkins, W. A. 1993. Marine animal sound classification. Woods Hole Oceanographic Institution Technical Report WHOI-94-13.
Galeotti, P. and Pavan, G. 1991. Individual Recognition of Male Tawny Owls (Strix-Aluco) Using Spectrograms of Their Territorial Calls. Ethology, Ecology, and Evolution 3: 113-126.
Gammon, D. E., Baker, M. C. and Betancourt, L. 2002. Lack of discrimination of conspecific vocalizations by black-capped chickadees: Tests on hand-raised juveniles. Condor 104: 854-858.

132
Goodale, E. and Kotagama, S. W. 2006. Context-dependent vocal mimicry in a passerine bird. Proceedings of the Royal Society B-Biological Sciences 273: 875-880.
Gower, J. C. 1966. Some Distance Properties of Latent Root and Vector Methods Used in Multivariate Analysis. Biometrika 53: 325-and.
Gower, J. C. and Legendre, P. 1986. Metric and Euclidean Properties of Dissimilarity Coefficients. Journal of Classification 3: 5-48.
Janik, V. M. and Slater, P. J. 1998. Context-specific use suggests that bottlenose dolphin signature whistles are cohesion calls. Animal Behaviour 56: 829-838.
Janik, V. M. 1999. Pitfalls in the categorization of behaviour: a comparison of dolphin whistle classification methods. Animal Behaviour 57: 133-143.
Janik, V. M., Sayigh, L. S. and Wells, R. S. 2006. Signature whistle shape conveys identity information to bottlenose dolphins. Proceedings of the National Academy of Sciences of the United States of America 103: 8293-8297.
Johnson, R.K., Harris, D. B. and Hedstrom, G. W. 1993. Efficient Evaluation of Narrow-Band Spatial Ambiguity Functions. Journal of the Acoustical Society of America 93: 1995-2004.
Jones, A. E., Ten Cate, C. and Bijleveld, C. J. H. 2001. The interobserver reliability of scoring sonograms by eye: a study on methods, illustrated on zebra finch songs. Animal Behaviour 62: 791-801.
Jouventin, P. and Aubin, T. 2002. Acoustic systems are adapted to breeding ecologies: individual recognition in nesting penguins. Animal Behaviour 64: 747-757.
Karels, T. J., Bryant, A. A. and Hik, D. S. 2004. Comparison of discriminant function and classification tree analyses for age classification of marmots. Oikos 105: 575-587.
Kent, M. 2006. Numerical classification and ordination methods in biogeography. Progress in Physical Geography 30: 399-408.
Krzanowski, W. J. 2004. Biplots for multifactorial analysis of distance. Biometrics 60: 517-524.
Langemann, U., Gauger, B. and Klump, G. M. 1998. Auditory sensitivity in the great tit: perception of signals in the presence and absence of noise. Animal Behaviour 56: 763-769.
Lanzone, M. and Farnsworth, A. In preparation. Documenting unknown and poorly known flight-calls using a novel recording method.

133
Lee, S.P. 1969. Ambiguity Function for Wide- and Narrow-Band Signals with Effect of Accelerating Point Target. Journal of the Acoustical Society of America 45: 301-and.
Lefebvre, K., Gaston, A. J. and Montgomerie, R. 2001. Repertoire, structure, and individual distinctiveness of Thick-billed Murre calls. Condor 103: 134-142.
Lengagne, T., Aubin, T., Jouventin, P. and Lauga, J. 2000. Perceptual salience of individually distinctive features in the calls of adult king penguins. Journal of the Acoustical Society of America 107: 508-516.
Lengagne, T., Harris, M. P., Wanless, S. and Slater, P. J. B. 2004. Finding your mate in a seabird colony: contrasting strategies of the Guillemot Uria aalge and King Penguin Aptenodytes patagonicus. Bird Study 51: 25-33.
Lin, Z.B. 1988. Wideband Ambiguity Function of Broad-Band Signals. Journal of the Acoustical Society of America 83: 2108-2116.
Lohr, B., Wright, T. F. and Dooling, R. J. 2003. Detection and discrimination of natural calls in masking noise by birds: estimating the active space of a signal. Animal Behaviour 65: 763-777.
Lohr, B., Lauer, A., Newman, M. R. and Dooling, R. J. 2004. Hearing in the red-billed firefinch Lagonosticta senegala and the Spanish timbrado canary Serinus canaria: The influence of natural and artificial selection on auditory abilities and vocal structure. Bioacoustics-the International Journal of Animal Sound and Its Recording 14: 83-98.
Lucero, J.C. and Koenig, L. L. 2000. Time normalization of voice signals using functional data analysis. Journal of the Acoustical Society of America 108: 1408-1420.
Marler, P. 2004. Bird calls - Their potential for behavioral neurobiology. Behavioral Neurobiology of Birdsong 1016: 31-44.
Matessi, G., Pilastro, A. and Marin, G. 2000. Variation in quantitative properties of song among European populations of reed bunting (Emberiza schoeniclus) with respect to bill morphology. Canadian Journal of Zoology-Revue Canadienne de Zoologie 78: 428-437.
Mathevon, N. 1996. What parameters can be used for individual acoustic recognition by the greater flamingo? Comptes Rendus de l Academie des Sciences Serie Iii-Sciences de la Vie-Life Sciences 319: 29-32.
Mathevon, N. 1997. Individuality of contact calls in the Greater Flamingo Phoenicopterus ruber and the problem of background noise in a colony. Ibis 139: 513-517.

134
Mathevon, N., Charrier, I. and Jouventin, P. 2003. Potential for individual recognition in acoustic signals: a comparative study of two gulls with different nesting patterns. Comptes Rendus Biologies 326: 329-337.
Medvin, M. B. and Beecher, M. D. 1986. Parent Offspring Recognition in the Barn Swallow (Hirundo-Rustica). Animal Behaviour 34: 1627-1639.
Medvin, M. B., Stoddard, P. K. and Beecher, M. D. 1992. Signals for Parent-Offspring Recognition - Strong Sib-Sib Call Similarity in Cliff Swallows but Not Barn Swallows. Ethology 90: 17-28.
Medvin, M. B., Stoddard, P. K. and Beecher, M. D. 1993. Signals for Parent Offspring Recognition - A Comparative-Analysis of the Begging Calls of Cliff Swallows and Barn Swallows. Animal Behaviour 45: 841-850.
Mills, H.G. and Figueroa, H.K. 2005. Extensible bioacoustical analysis software: Two examples. Journal of the Acoustical Society of America 117: 2525.
Mundinger, P.C. 1970. Vocal Imitation and Individual Recognition of Finch Calls. Science 168: 480.
Naguib, M., Hammerschmidt, K. and Wirth, J. 2001. Microgeographic variation, habitat effects and individual signature cues in calls of chiffchaffs Phylloscopus collybita canarensis. Ethology 107: 341-355.
Neal, E.H. 1969. Application of Ambiguity Function to Acoustic Signatures. Annals of the New York Academy of Sciences 163: 207.
Nelson, B. S. and Stoddard, P. K. 1998. Accuracy of auditory distance and azimuth perception by a passerine bird in natural habitat. Animal Behaviour 56: 467-477.
Nowicki, S. and Nelson, D. A. 1990. Defining Natural Categories in Acoustic-Signals - Comparison of 3 Methods Applied to Chick-A-Dee Call Notes. Ethology 86: 89-101.
Oswald, J. N., Barlow, J. and Norris, T. F. 2003. Acoustic identification of nine delphinid species in the eastern tropical Pacific Ocean. Marine Mammal Science 19: 20-37.
Pavoine, S., Dufour, A. B. and Chessel, D. 2004. From dissimilarities among species to dissimilarities among communities: a double principal coordinate analysis. Journal of Theoretical Biology 228: 523-537.
Phillmore, L. S., Sturdy, C. B., Turyk, M. R. M., and Weisman, R. G. 2002. Discrimination of individual vocalizations by black-capped chickadees (Poecile atricapilla). Animal Learning and Behavior 30: 43-52.

135
Prasad, A. M., Iverson, L. R. and Liaw, A. 2006. Newer classification and regression tree techniques: Bagging and random forests for ecological prediction. Ecosystems, 9: 181-199.
Preatoni, D. G., Nodari, M., Chirichella, R., Tosi, G., Wauters, L. A. and Martinoli, A. 2005. Identifying bats from time-expanded recordings of search calls: Comparing classification methods. Journal of Wildlife Management 69: 1601-1614.
Price, J. J. 1999. Recognition of family-specific calls in stripe-backed wrens. Animal Behaviour 57: 483-492.
Qi, Y. G. 1992. Time Normalization in Voice Analysis. Journal of the Acoustical Society of America 92: 2569-2576.
Rendell, L. E. and Whitehead, H. 2003. Comparing repertoires of sperm whale codas: A multiple methods approach. Bioacoustics-the International Journal of Animal Sound and Its Recording 14: 61-81.
Rich, T. D. 2002. The short song of Brewer's Sparrow individual and geographic variation in southern Idaho. Western North American Naturalist, 62: 288-299.
Robertson, B. C. 1996. Vocal mate recognition in a monogamous, flock-forming bird, the silvereye, Zosterops lateralis. Animal Behaviour 51: 303-311.
Robisson, P. 1993. The Adaptation of Individual Information-Transfer in a Colonial Environment - the Case of Penguins. Revue D Ecologie-la Terre et la Vie 48: 133-141.
Robisson, P., Aubin, T. and Bremond, J. C. 1993. Individuality in the Voice of the Emperor Penguin Aptenodytes-Forsteri - Adaptation to a Noisy Environment. Ethology 94: 279-290.
SAS Institute Inc. 2006. Base SAS 9.1.3 Procedures Guide, Second Edition, Volumes 1, 2, 3 and 4. Cary, NC. SAS Institute Inc.
Searby, A., Jouventin, P. and Aubin, T. 2004. Acoustic recognition in macaroni penguins: an original signature system. Animal Behaviour 67: 615-625.
Searby, A. and Jouventin, P. 2005. The double vocal signature of crested penguins: is the identity coding system of rockhopper penguins Eudyptes chrysocome due to phylogeny or ecology? Journal of Avian Biology 36: 449-460.
Searle, S. R. 1997. The matrix handling of BLUE and BLUP in the mixed linear model. Linear Algebra and Its Applications, 264: 291-311.
Sharp, S. P. and Hatchwell, B. J. 2005. Individuality in the contact calls of cooperatively breeding long-tailed tits (Aegithalos caudatus). Behaviour 142: 1559-1575.

136
Slabbekoorn, H. and Ten Cate, C. 1998a. Multiple parameters in the territorial coo of the collared dove: Interactions and meaning. Behaviour 135: 879-895.
Slabbekoorn, H. and Ten Cate, C. 1998b. Perceptual tuning to frequency characteristics of territorial signals in collared doves. Animal Behaviour 56: 847-857.
Stein, S. 1981. Algorithms for Ambiguity Function Processing. IEEE Transactions on Acoustics Speech and Signal Processing 29: 588-599.
Steinberg, D. and Colla, P. 1997. CART version 5.0, Classification and Regression Trees. San Diego, CA. Salford Systems, http://www.salford-systems.com/index.html.
Stoddard, P. K., Beecher, M. D., Horning, C. L. and Campbell, S. E. 1991. Recognition of Individual Neighbors by Song in the Song Sparrow, a Species with Song Repertoires. Behavioral Ecology and Sociobiology 29: 211-215.
Tabachnick, B. G., and Fidell, L. S. 2006. Using multivariate statistics, 5th ed. Boston: Allyn and Bacon.
Tchernichovski, O., Nottebohm, F., Ho, C. E., Pesaran, B. and Mitra, P. P. 2000. A procedure for an automated measurement of song similarity. Animal Behaviour 59: 1167-1176.
Tu, H. W. and Severinghaus, L. L. 2004. Geographic variation of the highly complex Hwamei (Garrulax canorus) songs. Zoological Studies 43: 629-640.
VanBuskirk, J. 1997. Independent evolution of song structure and note structure in American wood warblers. Proceedings of the Royal Society of London Series B - Biological Sciences 264: 755-761.
Van Opzeeland, I. C. and Van Parijs, S. M. 2004. Individuality in harp seal, Phoca groenlandica, pup vocalizations. Animal Behaviour 68: 1115-1123.
Vehrencamp, S. L., Ritter, A. F., Keever, M. and Bradbury, J. W. 2003. Responses to playback of local vs. distant contact calls in the orange-fronted conure, Aratinga canicularis. Ethology 109: 37-54.
Wanker, R., Apcin, J., Jennerjahn, B. and Waibel, B. 1998. Discrimination of different social companions in spectacled parrotlets (Forpus conspicillatus): evidence for individual vocal recognition. Behavioral Ecology and Sociobiology 43: 197-202.
Wanker, R. and Fischer, J. 2001. Intra- and interindividual variation in the contact calls of spectacled parrotlets (Forpus conspicillatus). Behaviour 138: 709-726.
Wright, T. F., Cortopassi, K. A., Bradbury, J. W. and Dooling, R. J. 2003. Hearing and vocalizations in the orange-fronted conure (Aratinga canicularis). Journal of Comparative Psychology, 117: 87-95.

137
CHAPTER SIX: EVOLUTION OF NOCTURNAL FLIGHT-CALLS IN
MIGRATING WOOD-WARBLERS: APPARENT LACK OF MORPHOLOGICAL
CONSTRAINTS*
Abstract
Many migratory songbirds produce flight-calls that vary, sometimes strikingly, among
species in duration, frequency, modulation, and pattern, and little is known about what
factors are responsible for this variation. Negative correlations between body mass or
bill length and song frequencies are well documented in birds, but no studies have
examined these associations for flight-calls. We explored relationships between
flight-call and song frequencies and body mass or bill length in 33 species of wood-
warblers. Phylogenetically controlled and uncontrolled analyses showed no
significant relationship between body mass or bill length and flight-call frequency;
however, we found significant differences between flight-call and song frequencies
and a significant relationship between maximum frequencies of flight-calls and songs.
Our findings suggest that factors other than body mass and bill length are responsible
for variation in flight-call frequencies in wood-warblers. We suggest that different
ecological and atmospheric properties might play important roles in selection for
flight-call frequencies.
Evans and O’Brien (2002) define flight-calls as the primary vocalization given during
sustained avian flight, particularly the long, sustained flight characteristic of
migration. Many birds produce these vocalizations, which are usually short in duration
(usually less than a second and frequently less than half a second) and high in
* Andrew Farnsworth, Department of Ecology and Evolutionary Biology, Cornell University, Ithaca, NY 14853 USA; Irby J. Lovette, Evolutionary Biology Program, Cornell Laboratory of Ornithology, 159 Sapsucker Woods Road, Ithaca, New York, 14850, USA. Dr. Roland Sandberg granted permission to reprint Journal of Avian Biology 36: 337-347.

138
frequency (in the 2-10 kHz range for most passerines), while migrating at night (Ball
1952; Graber and Cochran 1959; Evans and Mellinger 1999). Although some of these
vocalizations may appear similar, flight-calls are species-specific, varying especially
in their fine structure in frequency, duration, modulation, and pattern among taxa
(Figure 6.1). Little is known about the function of flight-calls, although they may
serve to maintain flocks and to communicate information among members of a flock
(Hamilton 1962, Thake 1981) and perhaps among flocks (Griffin 1969).
Negative relationships between body mass and song frequencies are well
documented in many avian groups (e.g., Greenewalt 1968, Wallschläger 1980, Ryan
and Brenowitz 1985, Tubaro and Mahler 1998, Palacios and Tubaro 2000, Laiolo and
Rolando 2003). Body mass and the mass of vibrating structures (such as syringeal
membranes) are often positively correlated (e.g., Greenewalt 1968; Bowman 1983).
Because frequency decreases as the mass of a vibrating structure increases, thicker
syringeal membranes associated with larger body mass allow larger birds to produce
lower frequency vocalizations. Additionally, larger birds are more likely to produce
longer wavelength (i.e., lower frequency) vocalizations, particularly given the
constraints that smaller birds face when attempting to produce vocalizations with
wavelengths exceeding their body size (i.e., acoustical short-circuiting; see Bradbury
and Vehrencamp 1998). Several studies have also reported that resonating properties
of the suprasyringeal vocal tract affect song frequency spectra (e.g., Nowicki 1987,
Nowicki and Marler 1988, Gaunt and Nowicki 1998). Changes in suprasyringeal
characteristics of the vocal tract such as changing bill gape correlate with changing
song frequencies – see e.g., Zonotrichia, Melospiza : Westneat et al. (1993);
Melospiza: Podos et al. (1995); Geospiza: Podos (2001), Podos et al (2004).
Additionally, several studies report negative correlations between bill length and
vocalization frequency (Palacios and Tubaro 2000, song frequencies in woodcreepers

139
– Dendrocolaptidae; Slabbekoorn and Smith 2000, song frequency in Pyrenestes
ostrinus); however, Laiolo and Rolando 2003 report that rattle call frequencies are
higher in larger-billed Corvus and Nucrifraga (i.e., the opposite relationship), although
rattle calls are non-tonal and appear not to fit the vocal tract-resonance model (Podos
et al 2004).
Despite the prevalence of flight-calls in the repertoire of many songbird taxa,
no published studies examine body mass or bill length relative to variation in flight-
call frequencies. We examined body mass and bill length as possible sources for the
variation in flight-call frequency among 33 species of wood-warblers (Parulidae). We
tested the null hypotheses that there are no relationships between body mass or bill
length and flight-call frequencies in wood-warblers. For comparison with the flight-
call data, we also tested similar hypotheses using songs in place of flight-calls. In
addition, we examined whether differences exist between flight-call and song
frequencies and whether flight-call and song frequencies are related. Warblers
provide a tractable group for studies of flight-call evolution because they exhibit a
diversity of patterns and frequencies in flight-calls, recordings of flight-calls are
available (Evans and O’Brien 2002), and a robust phylogenetic hypothesis for these
taxa is available (Lovette and Bermingham 2001, 2002). In testing relationships
among morphology and flight-call frequencies, we followed methodologies of several
similar studies that used phylogenetic data as a foundation for creating independent
contrasts between taxa (e.g., Tubaro and Mahler 1998, Palacios and Tubaro 2000).

140
Figure 6.1. Phylogenetic hypothesis with a Spindalis zena outgroup for 33 species of wood-warblers with associated spectrograms of flight-calls and songs. All flight-call spectrograms refer to a common time scale 200 ms on each x-axis and a common energy scale of 2 kHz increments on each y-axis with dark reference lines at 6 and 10 kHz. All song spectrograms refer to a common time scale 2500 ms on each x-axis and a common energy scale of 2 kHz increments on each y-axis with dark reference lines at 6 and 10 kHz.

141
Methods
We gathered body mass data from Dunning (1993) and the Birds of North America
series (BNA, see references for a full list) and bill (culmen) length data (BNA) for 33
species of wood-warblers that occur in the United States east of the Rocky Mountains.
These data represent averages of pooled males and females. We used recordings,
spectrograms and flight-call metrics (see Table 6.1) from Farnsworth (2001) and
Evans and O’Brien (2002) and recordings of songs (Type 1 songs; see following
reference) from Borror and Gunn (1985), the Borror Laboratory of Bioacoustics at The
Ohio State University, and the Macaulay Library of Natural Sounds at the Cornell
Laboratory of Ornithology. We digitized flight-calls and songs (22,050 Hz sampling
rate, 512 FFT, 87.5 % overlap) using the sound analysis package Raven (Charif 2003).
Because some flight-calls approach 11 kHz (i.e., the Nyquist frequency for our
sampling rate), we examined spectrograms of all recordings to confirm that no aliasing
occurred during digitization. The age and sex of the vocalizing individuals are not
known for any of our samples of flight-calls. The 33 species in our study represent
taxa for which genetic data and recordings of flight-calls of known identity are
available (Lovette and Bermingham 2001, 2002; Evans and O’Brien 2002). More
details about flight-call recordings, including the process of identification and
certainty of identification, are available in Evans (1994), Evans and Rosenberg (1999),
Farnsworth (2001), and Evans and O’Brien (2002); more details about song recordings
are available in Borror and Gunn (1985) and at the Borror Laboratory of Bioacoustics
(The Ohio State University) and the Macaulay Library of Natural Sounds (Cornell
University). We measured the following values in flight-calls and songs: maximum
frequency (CALLMAX, SONGMAX) measured at the top of the highest frequency
portion of a note, minimum frequency (CALLMIN, SONGMIN) measured at the

142
bottom of the lowest frequency portion of a note, and frequency bandwidth
(CALLBAND = MAX - MIN, SONGBAND).
We used the method of independent contrasts for nondirectional comparative
tests (Felsenstein 1985; also see Tubaro and Mahler 1998 for body size-song
frequency applications), generating standardized linear contrasts with CAIC software
version 2.6.9 (Purvis and Rumbaut 1995). We identified the evolution of ancestral
character states by invoking a model assuming that branch lengths define the timing
and occurrence of evolution in characters (Harvey and Purvis 1991, Pagel 1992,
Freckleton et al. 2002). The method of independent contrasts produces a new variable
(i.e., a contrast) based on differences in measurements of a chosen variable for pairs of
sister species. Contrasts are independent because divergences occur after the origin of
the species’ pair; additionally, dividing by the square root of branch lengths under
comparison standardizes these contrasts (Purvis and Rumbaut 1995, Tubaro and
Mahler 1998). Standard linear regression models forced through the origin detect any
associations between contrasts of different variables (Felsenstein 1985, Purvis and
Rumbaut 1995, Tubaro and Mahler 1998).

143
Table 6.1. Individual bill lengths, body masses, frequency data for flight-calls and songs and associated group means, standard deviations, maxima, minima, and ranges for 33 species of wood-warblers.
Species Bill
lengtha,d Body
massb,d Call
maximumc,e Call
minimumc,e Call
bandwidthc,e Song
maximumc,f Song
minimumc,f Song
bandwidthc,f
Blackpoll warbler 9.95 13.00 9.10 5.90 3.20 9.91 7.93 1.99
Cape May warbler 7.70 11.00 8.80 6.40 2.40 9.31 7.04 2.27
Pine warbler 10.75 11.90 8.50 4.80 3.70 5.60 3.31 2.29
Black-throated blue warbler 9.30 10.50 10.70 6.30 4.40 6.02 3.15 2.87
Black-and-white warbler 11.40 11.00 10.80 6.60 4.20 8.75 5.54 3.22
Kentucky warbler 8.50 14.30 7.10 5.60 1.50 5.42 2.10 3.32
Prairie warbler 9.95 8.00 8.70 5.20 3.50 7.10 3.63 3.47
Bay-breasted warbler 10.00 13.10 10.20 6.20 4.00 9.12 5.58 3.54
Yellow-rumped warbler 9.45 12.60 8.90 5.30 3.60 6.53 2.89 3.64
Black-throated green warbler 9.70 8.80 10.00 6.20 3.80 7.52 3.71 3.82
Magnolia warbler 8.98 8.90 9.10 5.70 3.40 7.00 3.05 3.96
a) mm. b) g. c) kHz. d) N = 33. e) N = 419. f) N = 211.

144
Table 6.1 (Continued).
Species Bill
lengtha,d Body
massb,d Call
maximumc,e Call
minimumc,e Call
bandwidthc,e Song
maximumc,f Song
minimumc,f Song
bandwidthc,f
Yellow-throated warbler 10.35 9.40 7.70 5.30 2.40 7.04 3.07 3.97
Hooded warbler 10.00 10.80 7.30 5.90 1.40 6.60 2.59 4.01
Orange-crowned warbler 11.20 9.00 10.00 5.60 4.40 7.62 3.58 4.04
Wilson's warbler 6.10 7.30 8.80 4.40 4.40 7.27 3.21 4.06
Northern parula 7.30 8.60 9.20 5.30 3.90 7.56 3.35 4.21
Common yellowthroat 10.60 10.30 9.50 3.40 6.10 7.15 2.93 4.22
Palm warbler 10.16 10.30 7.00 3.60 3.40 7.54 3.13 4.42
Worm-eating warbler 11.99 13.00 9.60 6.20 3.40 8.30 3.87 4.43
Mourning warbler 8.65 13.00 8.80 5.30 3.50 6.55 2.02 4.53
Nashville warbler 9.50 8.90 10.00 5.80 4.20 8.26 3.44 4.82
Yellow warbler 7.96 9.80 9.20 5.40 3.80 8.11 3.26 4.85
Northern waterthrush 10.40 17.80 9.40 4.90 4.50 7.36 2.45 4.91
Canada warbler 9.79 10.60 9.20 2.70 6.50 8.03 3.09 4.94
Cerulean warbler 9.59 9.50 8.30 6.00 2.30 7.84 2.84 5.00
Chestnut-sided warbler 9.65 9.80 8.00 5.00 3.00 8.05 3.04 5.01
Swainson's warbler 11.50 18.90 9.10 7.50 1.60 7.68 2.65 5.03
American redstart 8.65 8.50 10.00 5.40 4.60 8.89 3.59 5.30

145
Table 6.1 (Continued).
Species Bill
lengtha,d Body
massb,d Call
maximumc,e Call
minimumc,e Call
bandwidthc,e Song
maximumc,f Song
minimumc,f Song
bandwidthc,f
Louisiana Waterthrush 13.20 19.80 8.70 6.80 1.90 7.62 2.30 5.32
Blackburnian warbler 10.11 10.00 9.70 6.50 3.20 9.70 3.92 5.78
Prothonotary warbler 14.30 15.00 10.40 5.70 4.70 9.62 3.74 5.88
Ovenbird 11.80 19.40 9.40 6.20 3.20 9.02 2.88 6.14
Tennessee warbler 7.95 10.20 10.20 6.20 4.00 9.45 3.12 6.33
Mean 9.89 11.61 9.13 5.55 3.58 7.80 3.51 4.29
SD 1.65 3.33 0.97 0.98 1.15 1.17 1.28 1.08
Maximum 14.30 19.80 10.80 7.50 6.50 9.91 7.93 6.33
Minimum 6.10 7.30 7.00 2.70 1.40 5.42 2.02 1.99
Range 8.20 12.50 3.80 4.80 5.10 4.49 5.91 4.34

146
For comparative analyses, we used a phylogenetic hypothesis derived from the
mitochondrial sequences for 33 species of wood-warblers reported in Lovette and
Bermingham (1999, 2002). The sequence dataset included a total of 3639 nucleotides
of protein-coding mitochondrial DNA per taxon (see Lovette and Bermingham 2002
for details). We generated the phylogeny shown here (Figure 6.1) using the Bayesian
likelihood approach implemented in the program MRBAYES 2.01 (Huelsenbeck and
Ronquist 2001) under the general time-reversible model (nst=6), with site-specific rate
variation partitioned by codon. We ran searches for 10,000,000 generations, with
topologies and model parameters sampled every 10,000 generations; we discarded
samples from the first 2,500,000 generations as burn-in, and we used the remaining
750 topologies to estimate the posterior probabilities of branches.
We modeled the relationship between body mass and frequency characters of
flight-calls and songs using the linear contrasts and raw values (i.e., treating each
species as an independent data point) for call characters. We compared CALLMAX
and SONGMAX, CALLMIN and SONGMIN, and CALLBAND and SONGBAND
with body mass. We used the residuals of the frequency data generated by CAIC
(Purvis and Rambaut 1995) to remove the effects of body mass for the bill length and
frequency character comparisons (following Palacios and Tubaro 2000). We used
SAS (SAS Institute 1999) to test for differences between call and song frequencies and
to examine the relationships between song and call frequencies. We set our initial
significance level to α = 0.05 across all analyses; however, we corrected for multiple
comparisons in our body mass and bill length analyses using a typical Bonferroni
correction (e.g., Miller 1981) with a new critical value for 18 multiple comparisons
(adjusted α = 0.0028) and a less conservative sequential Bonferroni technique (Holm’s
Method: see Holm 1979, Rice 1989; assessments use the statement P1 ≤ α/(1 + k – i)

147
where k is the number of comparisons and i is the number of the sequential repetition
from 0 to k).
Results
For masses, bill lengths, and song and flight-call data for individual species, as well as
mean, standard deviation, maximum, minimum, and range across all species, see
Table 6.1.
Comparisons of raw body mass and flight-call frequency revealed no
significant relationships between body mass and CALLBAND, CALLMIN, or
CALLMAX for the 33 species of wood-warblers (Figure 6.2a, 6.2b, 6.2c; all P-values
> 0.0028 and Holm’s Method). Species with greater mass had no significant tendency
to exhibit larger bandwidths, lower minimum frequencies, or lower maximum
frequencies. Comparisons of raw body mass and song frequency data revealed no
significant relationships between body mass and SONGBAND, SONGMIN, or
SONGMAX for the 33 species of wood-warblers (Figure 6.2a, 6.2b, 6.2c; all P-values
> 0.0028 and Holm’s Method). Species with greater mass had no significant tendency
to exhibit larger bandwidths, lower minimum frequencies, or lower maximum
frequencies.
Controlling for phylogenetic effects, pairwise contrasts revealed no significant
relationships between body mass and CALLMAX, CALLMIN, or CALLBAND or
between body mass and SONGMAX, SONGMIN, or SONGBAND (Figure 6.3a, 6.3b,
6.3c; all P-values > 0.0028 and Holm’s Method). Within each comparison of paired
species or nodes, the species or nodes with the greater body mass did not necessarily
have a larger call or song bandwidth, lower call or song minimum frequency, or lower
call or song maximum frequency. We also found no significant relationship between
bill length and CALLMAX (r2 = 0.02; P = 0.5030), CALLMIN (r2 = 0.03; P =
0.4227), or CALLBAND (r2 = 0.00; P = 0.9604) for the independent pairwise

148
contrasts we performed after correcting for the effects of body mass. The species or
nodes with the greater bill length did not necessarily have a larger bandwidth, lower
minimum frequency, or lower maximum frequency within each pairwise comparison.
Furthermore, we found no significant relationship between bill length and
SONGMAX (r2 = 0.00; P = 0.8875), SONGMIN (r2 = 0.09; P = 0.1355), or
SONGBAND (r2 = 0.11; P = 0.0873) for the independent pairwise contrasts. Greater
bill length did not necessarily correspond to larger bandwidth, lower minimum
frequency, or lower maximum frequency within each pairwise comparison.
1
2
3
4
5
6
7
7 8 9 10 11 12 13 14 15 16 17 18 19 20Mass (g)
Band
wid
th F
requ
ency
(kHz
)
CallSongCallSong
A
Figure 6.2. Frequency (kHz) of flight-calls and songs on body mass (g) (A) Bandwidth. Flight-call Regression Line: y = -0.11x + 4.81; r2 = 0.09; P = 0.0825. Song Regression Line: y = 0.08x + 3.41; r2 = 0.06; P = 0.1890 (B) Minimum. Flight-call Regression Line: y = 0.10x + 4.36; r2 = 0.12; P = 0.0468. Song Regression Line: y = -0.05x + 4.31; r2 = 0.02; P = 0.4414 (C) Maximum. Flight-call Regression Line: y = -0.003x + 9.17; r2 = 0.00; P = 0.9507. Song Regression Line: y = 0.02x + 7.54; r2 = 0.00; P = 0.7188.

149
Figure 6.2 (Continued).
1
2
3
4
5
6
7
8
9
7 8 9 10 11 12 13 14 15 16 17 18 19 20Mass (g)
Min
imum
Fre
quen
cy (k
Hz)
CallSongCallSong
B
5
6
7
8
9
10
11
7 8 9 10 11 12 13 14 15 16 17 18 19 20Mass (g)
Max
imum
Fre
quen
cy (k
Hz)
CallSongCallSong
C

150
-0.03
-0.02
-0.01
0
0.01
0.02
0.03
0 0.01 0.02 0.03 0.04 0.05 0.06 0.07 0.08 0.09 0.1
Mass Contrast
Ban
dwid
th F
requ
ency
Con
tras
t
CallSongCallSong
A
-0.03
-0.02
-0.01
0
0.01
0.02
0.03
0 0.01 0.02 0.03 0.04 0.05 0.06 0.07 0.08 0.09 0.1
Mass Contrast
Min
imum
Fre
quen
cy C
ontra
st
CallSongCallSong
B
Figure 6.3. Frequency contrasts of flight-calls and songs on body mass contrasts (A) Bandwidth. Flight-call Regression Line: y = -0.12x - 0.001; r2 = 0.05; P = 0.3754. Song Regression Line: y = 0.10x - 0.003; r2 = 0.04; P = 0.5951 (B) Minimum. Flight-call Regression Line: y = 0.08x + 0.002; r2 = 0.03; P = 0.1380. Song Regression Line: y = -0.08x + 0.003; r2 = 0.02; P = 0.9757 (C) Maximum. Flight-call Regression Line: y = -0.05x + 0.0004; r2 = 0.0106; P = 0.7574. Song Regression Line: y = 0.02x - 0.00009; r2 = 0.00; P = 0.5984.

151
Figure 6.3 (Continued).
-0.03
-0.02
-0.01
0
0.01
0.02
0.03
0 0.01 0.02 0.03 0.04 0.05 0.06 0.07 0.08 0.09 0.1
Mass Contrast
Max
imum
Fre
quen
cy C
ontra
st
CallSongCallSong
C
Our analysis showed that flight-call frequencies are significantly different from
song frequencies. We found that CALLMAX (Mean, SD = 9.13 ± 0.97 kHz) and
CALLMIN (Mean, SD = 5.56 ± 0.98 kHz) are significantly higher in frequency than
SONGMAX (Mean, SD = 7.8 ± 1.17 kHz) and SONGMIN (Mean, SD = 3.51 ± 1.28
kHz) for 33 species of wood-warblers, respectively (P < 0.0001 for both analyses, see
Table 6.2). We also found a significant difference in bandwidth frequency between
songs and calls (P < 0.01, see Table 6.2), with CALLBAND (Mean, SD = 3.58 ± 1.15
kHz) significantly narrower than SONGBAND (Mean, SD = 4.29 ± 1.08 kHz).
Additionally, a significant positive relationship exists between CALLMAX and
SONGMAX (P < 0.01; Figure 6.4c); however, we found no significant relationships
between calls and songs for minimum frequency or bandwidth (Figure 6.4a, 6.4b).

152
Table 6.2. Means, standard deviations, and paired T-test results for maximum, minimum, and bandwidth frequencies (kHz) for flight-calls and songs of 33 species of wood-warblers.
Call Call SD Song Song SD t-statistic P-value
Maximum Frequency* 9.13 0.97 7.80 1.17 6.86 <0.0001 Minimum Frequency* 5.55 0.98 3.51 1.28 8.25 <0.0001 Bandwidth Frequency* 3.58 1.15 4.29 1.08 -2.72 0.0052
*kHz.
0
1
2
3
4
5
6
7
8
1.5 2 2.5 3 3.5 4 4.5 5 5.5 6 6.5Song Bandwidth Frequency (kHz)
Call
Band
wid
th F
requ
ency
(kHz
)
A
Figure 6.4. Flight-call frequency (kHz) on song frequency (kHz) (A) Bandwidth. Regression Line: y = -0.11x + 3.12; r2 = 0.01; P = 0.5786 (B) Minimum. Regression Line: y = 0.18x + 4.94; r2 = 0.05; P = 0.1993 (C) Maximum. Regression Line: y = 0.39x + 6.09; r2 = 0.22; P = 0.006.

153
Figure 6.4 (Continued).
2
3
4
5
6
7
8
9
10
2 3 4 5 6 7 8Song Minimum Frequency (kHz)
Call
Min
imum
Fre
quen
cy (k
Hz)
B
6
7
8
9
10
11
12
5 5.5 6 6.5 7 7.5 8 8.5 9 9.5 10Song Maximum Frequency (kHz)
Call
Max
imum
Fre
quen
cy (k
Hz)
C
Discussion
In both phylogenetically controlled and uncontrolled analyses we did not find
significant relationships between body mass and flight-call or song frequencies or bill

154
length and flight-call or song frequencies. Our results are surprising, because for
many avian groups changes in frequencies and changes in body mass or bill length are
correlated, such as negative relationships between body mass and song frequencies
(e.g., Wallschläger 1980) and between bill length and song frequencies (e.g., Palacios
and Tubaro 2000). Vocal tract features associated with the production and
transmission of a vocalization often are correlated positively with body size (e.g.,
thicker syringeal membranes associated with larger body mass allow larger birds to
produce lower frequency vocalizations). Furthermore, constraints imposed by
acoustical short-circuiting at longer wavelengths relax for larger- relative to smaller-
bodied birds (see Bradbury and Vehrencamp 1998). However, bird song could escape
the constraints of body mass in at least two ways. Ryan and Brenowitz (1985) suggest
that the mass of vibrating structures could increase independently of body size, as has
occurred in some species of anurans (Ryan 1988). Additionally, changes in
suprasyringeal characteristics of the vocal tract such as bill gape correlate with
changing song frequencies (Westneat et al. 1993; Podos et al. 1995; Podos 2001).
The 33 species of wood-warblers in this study exhibit small ranges, low
coefficients of variation, and low variances for morphological characters when
compared to similar studies of other avian taxa (Table 6.3). Previous studies that
found significant negative relationships between song frequency and body mass (e.g.,
Tubaro and Mahler 1998, Palacios and Tubaro 2000) have larger ranges (one order of
magnitude: see Table 6.3), higher coefficients of variation, and greater variance (two
orders of magnitude: see Table 6.3) for body mass. Additionally, negative
relationships between song frequency and bill length (Palacios and Tubaro 2000) that
are nearly significant also show greater variation for bill length (Table 6.3). This
evaluation suggests that the lack of significant correlation between morphology and
vocal (i.e., song and call) frequencies in wood-warblers relates to low morphological

155
variation in our sample. Including non-parulid relatives would incorporate a greater
range of morphological variation; however, the 33 species of wood-warblers in this
study represent almost all the variation within the parulid group for the characters we
analyzed (e.g., Dunning 1993, Birds of North America series). Furthermore,
maintaining the current scope of our analysis allows us to ask a biologically relevant
question when considering such low morphological variation. If body mass and bill
length do not strongly influence the frequencies of flight-calls in wood-warblers, what
factors do?

156
Table 6.3. Comparison of species groups, presence of significant relationship trends, sample sizes, means, minima, maxima, ranges, coefficients of variation and variances among four studies of relationships between morphology and vocal frequencies.
Study Species group Significant trends Nc Mean Minimum Maximum Range CV Variance
Tubaro and Mahler 1998a,d Doves Yes 44 159.01 30.00 320.00 290.00 0.52 6829.91
Palacios and Tubaro 2000a,d Woodcreepers Yes 39 54.05 14.30 155.00 140.70 0.60 1066.12
Palacios and Tubaro 2000b,d Woodcreepers No 39 35.14 12.00 76.00 64.00 0.42 213.02
Farnsworth and Lovettea,d,e Wood-warblers No 33 11.61 7.30 19.80 12.50 0.29 11.07
Farnsworth and Lovetteb,d,e Wood-warblers No 33 9.89 6.10 14.30 8.20 0.17 2.72
a) Body mass (g). b) Bill length (cm). c) Number of species. d) Song frequencies. e) Flight-call frequencies.

157
Major gaps exist in our understanding of flight-calling behavior. No studies
have examined the range of distances over which birds use flight-calls for
communication, the properties of the timing and control of the formative stages of
flight-calls, or the seasonal pattern of flight-call vocalizations. Furthermore, virtually
nothing is known about the constraints associated with production of different types of
sound during flight. However, although these basic biological, behavioral, and
evolutionary data are generally lacking, we can speculate about selection pressures for
optimal sound transmission. Optimal sound transmission could play a role in
determining species-specific flight-call frequencies. For example, ecological
properties of breeding or wintering habitats could cause divergence of flight-call
frequencies if warblers use flight-calls often during non-migratory periods. If flight-
calls originated as a means of communication near ground-level (i.e., from the ground
to tree canopy level), selection could drive divergence among habitats because
reverberation, amplitude modulation rate, and the consistency of transmission are
important sonic properties defining vocalizations; these properties have been shown to
vary with selection pressures among habitats in other taxa (Brown and Hanford 1996,
2000; Badyaev and Leaf 1997; Slabbekoorn and Smith 2002a; Bertelli and Tubaro
2002). Birds living in more open habitats tend to have higher song frequencies and
wider bandwidth than those living in more closed habitats (e.g., Morton 1975; Wiley
1991). Ryan and Brenowitz (1985) suggest that properties of ambient noise spectra in
different habitats (e.g., the frequencies of wind-generated or insect-generated noise)
could force selection for frequencies within specific frequency windows (i.e., quiet
regions of the spectra without much ambient noise). Furthermore, if flight-calls are
learned behaviors, the influence of vegetation structure and ambient noise spectra
could play an important role in the ontogeny of flight-calls (Hansen 1979, Nottebohm
1985). We found a significant relationship between maximum flight-call frequency

158
and maximum song frequency both in phylogenetically controlled and uncontrolled
analyses and in mass controlled and mass uncontrolled analyses. Therefore, it is
possible that limitations in the propagation of frequency maxima are similar for flight-
calls and songs.
Selection pressures based on properties of the atmosphere during migration
might similarly exist if communication by flight-calls primarily occurs aloft. Our
results suggest that a frequency window for communication that differs from song
frequency windows might exist for flight-call frequencies. Maximum, minimum, and
bandwidth frequencies of flight-calls differ significantly from those frequencies of
song, with higher maxima, higher minima, and narrower bandwidths. Additionally, in
phylogenetically uncontrolled analysis the slopes of the regression lines for flight-call
bandwidth and song bandwidth against body mass are significantly different (PROC
MIXED: F = 4.95, P = 0.03), although this relationship is not significant in
phylogenetically controlled analysis (PROC MIXED: F = 2.79, P = 0.10). It is also
possible that ambient noise spectra similar to those discussed by Morton (1975), Ryan
and Brenowitz (1985), and Slabbekoorn and Smith (2002b) occur in different
atmospheric strata (e.g., as a result of temperature inversions and humidity gradients)
and that different spectra require different solutions to communicating within certain
altitudinal strata (e.g., different frequency windows generate different frequency calls;
choosing optimal strata for communicating based on call frequencies). Flight-calls
and songs may also experience different selection pressures related to encoding
information in the respective signals: given constraints on production and
transmission, warblers may use larger bandwidths with lower maximum and minimum
frequencies in songs to encode more detailed information in songs.
Constraints for optimal in-flight communication toward certain frequencies
(i.e., higher frequencies in warbler flight-calls) could shape convergent vocalizations

159
that travel best in specific atmospheric and microclimatic strata or avoid specific
ambient noise spectra (e.g., Rundus and Hart 2002, Larom 2002, Slabbekoorn and
Smith 2002a, b, Slabbekoorn and Peet 2003). Because signals indicative of longer
range communication are lower in frequency (e.g., Larom 2002, Larom et al 1997,
Marten and Marler 1977), the pattern of higher frequencies in flight-calls relative to
songs suggests that flight-call vocalizations might be used primarily for short distance
communication. Additionally, flight-calls and songs differ dramatically in duration
(call mean ± SD: 50.88 ± 11.90 ms; song mean ± SD: 1612.73 ± 465.31 ms); such
short durations for flight-calls also suggest that strong constraints (e.g., physiological
or environmental) are operating on the evolution of flight-calls.
Testing the aforementioned functional hypotheses will require transmission
experiments and detailed atmospheric and microclimatic analyses both near ground-
level and above ground in flight strata. In addition to assessing what frequencies
travel best in ambient noise, understanding what frequencies are perceived best in
ambient noise is probably highly relevant in seeking a more complete understanding
of variation in flight-call frequencies. Recent studies show that different species of
birds have different detection thresholds for signals in ambient noise (Klump 1996,
Langemann et al 1998) as well as different hearing thresholds (e.g., Dooling 1982,
Dooling and Saunders 1975, Okanoya and Dooling 1987). Differences in the
perceptual abilities, detection thresholds, and hearing abilities among species could
play important roles in determining variation in flight-call frequencies.

160
References Ammon, E. M and Gilbert, W. M. 1999. Wilson's Warbler. – Poole, A. and Gill, F. (eds.). The Birds of North America, No. 478. The Academy of Natural Sciences, Philadelphia, and the American Ornithologists' Union, Washington, D.C. 28 pp.
Badyaev, A.V. and Leaf, E. S. 1997. Habitat associations of song characteristics in Phylloscopus and Hippolais warblers. – Auk 114:40–46.
Ball, S. C. 1952. Fall bird migration on the Gaspe Peninsula. – Bull. Peabody Mus. 7: 1–211.
Baltz, M.E., and Latta, S. C. 1998. Cape May Warbler. – Poole, A. and Gill, F. (eds.). The Birds of North America, No. 332. The Academy of Natural Sciences, Philadelphia, and the American Ornithologists' Union, Washington, D.C.
Bertelli, S. and Tubaro, P. L. 2002. Body mass and habitat correlates of song structure in a primitive group of birds. – Biol J Linn Soc 77:423–30.
Borror, D. J., and Gunn, W. W. H. 1985. Songs of the warblers of North America. – Cornell Laboratory of Ornithology, Library of Natural Sounds, Ithaca, NY.
Bouchie, J., Pitocchelli, J., and Jones, D. 1997. Connecticut Warbler. – Poole, A. and Gill, F. (eds.). The Birds of North America, No. 320. The Academy of Natural Sciences, Philadelphia, and the American Ornithologists' Union, Washington, D.C. 16 pp.
Bowman, B. 1983. The evolution of song in Darwin’s finches. – Bowman, R. I., Berson, M., and Leviton, A. E. (eds.). Patterns of Evolution in Galapagos organisms. American Association for the Advancement of Science, San Francisco. Pp. 237–537
Brown, E. R. and Dickson, J. G. 1994. Swainson's Warbler. – Poole, A. and Gill, F. (eds.). The Birds of North America, No. 126. The Academy of Natural Sciences, Philadelphia, and the American Ornithologists' Union, Washington, D.C. 20 pp.
Brown, T.J. and Handford, P. 1996 Acoustic signal amplitude patterns: a computer simulation investigation of the Acoustic Adaptation Hypothesis. – Condor 98: 608–623.
Brown, T.J. and Handford, P. 2000. Sound design for vocalizations: quality in the woods, consistency in the fields. – Condor 102: 81–92.
Charif, R. A. 2003. Raven 1.1 User's Manual. – Cornell Laboratory of Ornithology, Ithaca, NY.

161
Confer J. L. 1992. Golden–winged Warbler. – Poole, A. and Gill, F. (eds.). The Birds of North America, No. 20. The Academy of Natural Sciences, Philadelphia, and the American Ornithologists' Union, Washington, D.C. 16 pp.
Conway, C. J. 1999. Canada Warbler. – Poole, A. and Gill, F. (eds.). The Birds of North America, No. 421. The Academy of Natural Sciences, Philadelphia, and the American Ornithologists' Union, Washington, D.C. 24 pp.
Douglas, H. D. and Conner, W. E. 1999. Is there a sound reception window in coastal environments? Evidence from shorebird communication systems. – Naturwissenschaften 86(5):228–30.
Dooling, R. J. 1982. Auditory perception in birds. – Kroodsma, D. E., Miller, E. H. and Ouellet, H. (eds.). Acoustic communication in birds, Volume 1. New York. Academic Press. Pp 95–130.
Dooling, R. J. and Saunders, J. C. 1975. Hearing in the parakeet (Melopsittacus undulatus): absolute thresholds, critical ratios, frequency difference limits, and vocalizations. – J Comp Phys Psych 88: 1–20.
Dunning, J. B., Jr. 1993 CRC Handbook of Avian Body Masses. – CRC, Boca Raton, FL.
Eaton, S. W.1995. Northern Waterthrush. – Poole, A. and Gill, F. (eds.). The Birds of North America, No. 182. The Academy of Natural Sciences, Philadelphia, and the American Ornithologists' Union, Washington, D.C. 20 pp.
Evans O., L. J. and Stutchbury, B. J. 1994. Hooded Warbler. – Poole, A. and Gill, F. (eds.). The Birds of North America, No. 110. The Academy of Natural Sciences, Philadelphia, and the American Ornithologists' Union, Washington, D.C.
Evans, W. R. 1994. Nocturnal flight call of Bicknell's Thrush. – Wilson Bull. 106:55–61.
Evans, W. R. and Mellinger, D. K. 1999. Monitoring grassland birds in nocturnal migration. – Studies in Avian Biology No. 19: 219–229.
Evans. W. R. and O’Brien, M. 2002. Flight calls of migratory birds: Eastern North American landbirds. – CD-ROM. Oldbird, Inc., Ithaca NY.
Evans, W. R. and Rosenberg, K. V. 2000. Acoustic monitoring of night-migrating birds: a progress report. – Strategies for Bird Conservation: Creating the Partners in Flight Planning Process (Bonney, R. E., Jr.; D. N. Pashley and R. Cooper, Eds.). Proceedings of the 3rd Partners in Flight Workshop; 1995 October 1-5; Cape May, NJ. Proceedings RMRS-P-16. Ogden, UT: U.S. Department of Agriculture, Forest Service, Rocky Mountain Research Station.

162
Farnsworth, A. 2001. The density of nocturnal bird migration: a comparison between Doppler radar and acoustic measures. – M.S. thesis, Clemson University, South Carolina.
Felsenstein, J. 1985. Phylogenies and the comparative method. – Am Nat 125:1–15.
Freckleton, R. P., Harvey, P. H., and Pagel, M. 2002. Phylogenetic Analysis and Comparative Data: A Test and Review of Evidence. – Am Nat 160: 712–726.
Gaunt, A. S. and Nowicki, S. 1998. Birdsong: acoustics and physiology revisited. – Hopp, S. L., Owren, M. J., and Evans, C. S (eds.), Animal Acoustic Communication. Springer-Verlag, Heidelberg, pp. 291–321.
Gill, F. B., Canterbury, R. A., and Confer, J. L. 2001. Blue-winged Warbler. – Poole, A. and Gill, F. (eds.). The Birds of North America, No. 584. The Academy of Natural Sciences, Philadelphia, and the American Ornithologists' Union, Washington, D.C. 24 pp.
Griffin, D. R. 1969. The physiology and geophysics of bird navigation. – Quart. Rev. Biol. 44: 255–276.
Graber, R. R. and Cochran, W. W. 1959. An audio technique for the study of the nocturnal migration of birds. – Wilson Bulletin 71:220–236.
Greenwalt, C. H. 1968. Bird Song: Acoustics and Physiology. – Smithsonian Inst. Press, Washington, DC.
Guzy, M.J. and Ritchison, G. 1999. Common Yellowthroat. – Poole, A. and Gill, F. (eds.). The Birds of North America, No. 448. The Academy of Natural Sciences, Philadelphia, and the American Ornithologists' Union, Washington, D.C.
Hall, G. A. 1994. Magnolia Warbler. – Poole, A. and Gill, F. (eds.). The Birds of North America, No. 136. The Academy of Natural Sciences, Philadelphia, and the American Ornithologists' Union, Washington, D.C.
Hall, G. A. 1996. Yellow-throated Warbler. – Poole, A. and Gill, F. (eds.). The Birds of North America, No. 223. The Academy of Natural Sciences, Philadelphia, and the American Ornithologists' Union, Washington, D.C.
Hamel, P. B. 2000. Cerulean Warbler. – Poole, A. and Gill, F. (eds.). The Birds of North America, No. 511. The Academy of Natural Sciences, Philadelphia, and the American Ornithologists' Union, Washington, D.C.
Hamilton, W. J., III. 1962. Evidence concerning the function of nocturnal call notes of migratory birds. – Condor 64: 390–401.

163
Hanners, L. A. and Patton, S. R. 1998. Worm-eating Warbler. – Poole, A. and Gill, F. (eds.). The Birds of North America, No. 367. The Academy of Natural Sciences, Philadelphia, and the American Ornithologists' Union, Washington, D.C. 20 pp.
Harvey, P. H. and Purvis, A. Comparative methods for explaining adaptations. – Nature 351: 619–624.
Holm, S. 1979. A simple sequentially rejective multiple test procedure. – Scand J Stat 6: 65-70.
Holmes, R. T. 1994. Black-throated Blue Warbler. – Poole, A. and Gill, F. (eds.). The Birds of North America, No. 87. The Academy of Natural Sciences, Philadelphia, and the American Ornithologists' Union, Washington, D.C.
Huelsenbeck, J. P and Ronquist, F. 2001. MrBayes: Bayesian inference of phylogeny. – Bioinformatics 17:754–755.
Hunt, P. D. and Eliason, B.C. 1999. Blackpoll Warbler. – Poole, A. and Gill, F. (eds.). The Birds of North America, No. 431. The Academy of Natural Sciences, Philadelphia, and the American Ornithologists' Union, Washington, D.C.
Hunt, P.D. and Flaspohler, D. J. 1998. Yellow-rumped Warbler. – Poole, A. and Gill, F. (eds.). The Birds of North America, No. 376. The Academy of Natural Sciences, Philadelphia, and the American Ornithologists' Union, Washington, D.C.
Klump, G. M. 1996. Bird communication in the noisy world. – Kroodsma, D. E. and Miller, E. H. (eds.). Ecology and Evolution of Acoustic Communication in Birds. Ithaca, New York. Cornell University Press. Pp 321–338.
Kricher, J. C. 1995. Black-and-white Warbler. – Poole, A. and Gill, F. (eds.). The Birds of North America, No. 158. The Academy of Natural Sciences, Philadelphia, and the American Ornithologists' Union, Washington, D.C. 20 pp.
Ladd, C and Gadd, L. 1999. Golden-cheeked Warbler. – Poole, A. and Gill, F. (eds.). The Birds of North America, No. 420. The Academy of Natural Sciences, Philadelphia, and the American Ornithologists' Union, Washington, D.C. 24 pp.
Laiolo, P and Rolando, A. 2003. Comparative analysis of the rattle calls in Corvus and Nucrifraga: the effect of body size, bill size, and phylogeny. – Condor 105: 139–144.
Langemann, U., Gauger, B., and Klump, G. M. 1998. Auditory sensitivity in the great tit: perception of signals in the presence and absence of noise. – Anim Beh 56: 763–769.
Larom, D. 2002. Auditory communication, meteorology, and the Umwelt. – J Comp Psych 116: 133–136.

164
Larom, D., Garstang, M., Payne, D., Raspet, R., and Lindeque, M. 1997. The influence of surface atmospheric conditions on the range and area reached by animal vocalizations. – J Exp Biol 200: 421-431.
Lovette, I. J. and Bermingham, E. 1999. Explosive speciation in the New World Dendroica warblers. – Proc Royal Soc London: Biol Sci 266: 1629–1636.
Lovette, I. J. and Bermingham, E. 2001. Mitochondrial perspective on the phylogenetic relationships of the Parula wood-warblers. – Auk 118: 211-215.
Lovette, I. J. and Bermingham, E. 2002. What is a wood-warbler? Molecular characterization of a monophyletic parulidae. – Auk 119: 695-714.
Lowther, P. E., Celada, C., Klein, N. K., Rimmer, C. C., and Spector, D. A. 1999. Yellow warbler. – Poole, A. and Gill, F. (eds.). The Birds of North America, No. 454. The Academy of Natural Sciences, Philadelphia, and the American Ornithologists' Union, Washington, D.C.
Marten, K. and Marler, P. 1977. Sound transmission and its significance for animal vocalization: I. Temperate habitats. – Beh Ecol Soc 2: 271-290.
Mayfield, H. F. 1992. Kirtland's Warbler. – Poole, A. and Gill, F. (eds.). The Birds of North America, No. 19. The Academy of Natural Sciences, Philadelphia, and the American Ornithologists' Union, Washington, D.C. 16 pp.
McDonald, M. V. 1998. Kentucky Warbler. – Poole, A. and Gill, F. (eds.). The Birds of North America, No. 324. The Academy of Natural Sciences, Philadelphia, and the American Ornithologists' Union, Washington, D.C. 20 pp.
Miller, R. G., Jr. 1981. Simultaneous Statistical Inference. – McGraw Hill, NY.
Moldenhauer, R.R. and Regelski, D. J. 1996. Northern Parula. – Poole, A. and Gill, F. (eds.). The Birds of North America, No. 215. The Academy of Natural Sciences, Philadelphia, and the American Ornithologists' Union, Washington, D.C.
Morse, D.H. 1993. Black-throated Green Warbler. – Poole, A. and Gill, F. (eds.). The Birds of North America, No. 55. The Academy of Natural Sciences, Philadelphia, and the American Ornithologists' Union, Washington, D.C.
Morse, D.H. 1994. Blackburnian Warbler. – Poole, A. and Gill, F. (eds.). The Birds of North America, No. 102. The Academy of Natural Sciences, Philadelphia, and the American Ornithologists' Union, Washington, D.C.
Morton, E. S. 1975. Ecological sources of selection on avian sounds. – Am Nat 109: 17-34.

165
Nolan, V., Jr., Ketterson, E. D., and Buerkle, C. A. 1999. Prairie Warbler. – Poole, A. and Gill, F. (eds.). The Birds of North America, No. 455. The Academy of Natural Sciences, Philadelphia, and the American Ornithologists' Union, Washington, D.C.
Nowicki, S. 1987. Vocal tract resonances in oscine bird sound production: evidence from bird songs in a helium atmosphere. – Nature 325: 53-55.
Nowicki, S. and Marler, P. 1988. How do birds sing? Music Percep 5: 391-426.
Okanoya, K. and Dooling, R. J. 1987. Hearing in passerine and psittacine birds: a comparative study of absolute and masked auditory thresholds. – J Comp Psych 101: 7-15.
Pagel, M. 1992. A method for analysis of comparative data. – J Theo Biol 156:431-442.
Palacios, M. G. and Tubaro, P. L. 2000. Does beak size affect acoustic frequencies in woodcreepers? – Condor 102: 553-560.
Petit, L. J.1999. Prothonotary Warbler. – Poole, A. and Gill, F. (eds.). The Birds of North America, No. 408. The Academy of Natural Sciences, Philadelphia, and the American Ornithologists' Union, Washington, D.C. 24 pp.
Pitocchelli, J. 1993. Mourning Warbler. – Poole, A. and Gill, F. (eds.). The Birds of North America, No. 72. The Academy of Natural Sciences, Philadelphia, and the American Ornithologists' Union, Washington, D.C. 16 pp.
Podos J. 2001. Correlated evolution of morphology and vocal signal structure in Darwin's finches. – Nature 409: 185-188.
Podos, J., Sherer, J. K., Peters, S., and Nowicki, S. 1995. Ontogeny of vocal-tract movements during song production in Song Sparrows. – Anim Beh 50: 1287-1296.
Podos, J., Southall, J. A., and Rossi-Santos, M. R., 2004. Vocal mechanics in Darwin’s finches: correlation of beak gape and song frequency. – J Exp Biol 207: 607-610.
Purvis, A. and Rambaut, A. 1995. Comparative analysis by independent contrasts (CAIC): an Apple Macintosh application for analyzing comparative data. – CABIOS 11 (3): 247-251.
Rice, W. R. 1989. Analyzing tables of statistical tests. – Evolution 43: 223-225.
Richardson, M. and Brauning, D. W. 1995. Chestnut-sided Warbler. – Poole, A. and Gill, F. (eds.). The Birds of North America, No. 190. The Academy of Natural Sciences, Philadelphia, and the American Ornithologists' Union, Washington, D.C.

166
Rimmer, C. C. and McFarland, K. P. 1998. Tennessee Warbler. – Poole, A. and Gill, F. (eds.). The Birds of North America, No. 350. The Academy of Natural Sciences, Philadelphia, and the American Ornithologists' Union, Washington, D.C. 24 pp.
Robinson, W. D. 1995. Louisiana Waterthrush. – Poole, A. and Gill, F. (eds.). The Birds of North America, No. 151. The Academy of Natural Sciences, Philadelphia, and the American Ornithologists' Union, Washington, D.C. 20 pp.
Rodewald, P. G., Withgott, J. and Smith, K. G. 1999. Pine Warbler. – Poole, A. and Gill, F. (eds.). The Birds of North America, No. 438. The Academy of Natural Sciences, Philadelphia, and the American Ornithologists' Union, Washington, D.C.
Rundus, A. S. and Hart, L. A. 2002. Overview: Animal acoustic communication and the role of the physical environment. – J Comp Psych 116: 120-122.
Ryan, M. J. 1988. Constraints and patterns in the evolution of anuran acoustic communication, p. 637– 678. – B. Fritzsch, B., Ryan, M. J., Wilcznski, W., Hetherington, T. E., and Walkoviak, W. B. (eds). The evolution of the amphibian auditory system. John Wiley and Sons, Inc, New York.
Ryan, M. J. and Brenowitz, E. A. 1985. The role of body size, phylogeny, and ambient noise in the evolution of bird song. – Am Nat 126: 87-100.
SAS Institute. 1999. SAS for PC, version 8. – SAS Institute, Cary, NC.
Sherry, T.W., and Holmes, R. T. 1997. American Redstart. – Poole, A. and Gill, F. (eds.). The Birds of North America, No. 277. The Academy of Natural Sciences, Philadelphia, and the American Ornithologists' Union, Washington, D.C.
Slabbekoorn, H. and Smith, T. B. 2000. Does bill size polymorphism affect courtship song characteristics in the African finch Pyrenestes ostrinus? – Biol J Linn Soc 71 (4): 737-753.
Slabbekoorn, H. and Smith, T. B. 2002a. Habitat-dependent song divergence in the little greenbul: An analysis of environmental selection pressures on acoustic signals. – Evolution 56:1849-58.
Slabbekoorn, H. and Smith, T. B. 2002b. Birdsong, ecology, and speciation. – Phil Trans. Roy. Soc. 357: 493-503.
Slabbekoorn, H., Eller, J., and Smith, T. B. 2002. Birdsong and sound transmission: The benefits of reverberations. – Condor 104: 564–573.
Slabbekoorn, H. and Peet, M. 2003. Birds sing at a higher pitch in urban noise. – Nature 424, 267.

167
Sogge, K.M., Gilbert, W. M., and Van Riper, C., III. 1994. Orange-crowned Warbler. – Poole, A. and Gill, F. (eds.). The Birds of North America, No. 101. The Academy of Natural Sciences, Philadelphia, and the American Ornithologists' Union, Washington, D.C. 20 pp.
Thake, M. A. 1981. Calling by nocturnal migrants: A device for improving orientation? – Die Vogelwarte 31: 111.
Tubaro, P. L. and Mahler, B. 1998. Acoustic frequencies and body mass in new world doves. – Condor 100: 54-61.
Van Horin, M. A. and Donovan, T. M. 1994. Ovenbird. – Poole, A. and Gill, F. (eds.). The Birds of North America, No. 88. The Academy of Natural Sciences, Philadelphia, and the American Ornithologists' Union, Washington, D.C. 24 pp.
Wallschläger, D. 1980. Correlation of song frequency and body-weight in passerine birds. – Experientia 36 (4): 412.
Westneat, M. W., Long, J. H., Hoese, W., and Nowicki, S. 1993. Kinematics of birdsong: functional correlation of cranial movements and acoustic features in sparrows. – J Exp Biol 182: 147-171
Wiley, R. H. 1991. Associations of song properties with habitats for territorial oscine birds of Eastern North America. – Am Nat 138: 973-93.
Williams, J. M. 1996. Bay-breasted Warbler. – Poole, A. and Gill, F. (eds.). The Birds of North America, No. 206. The Academy of Natural Sciences, Philadelphia, and the American Ornithologists' Union, Washington, D.C.
Williams, J, M. 1996. Nashville Warbler. – Poole, A. and Gill, F. (eds.). The Birds of North America, No. 205. The Academy of Natural Sciences, Philadelphia, and the American Ornithologists' Union, Washington, D.C. 20 pp.
Wilson, Jr., W. H. 1996. Palm Warbler. – Poole, A. and Gill, F. (eds.). The Birds of North America, No. 235. The Academy of Natural Sciences, Philadelphia, and the American Ornithologists' Union, Washington, D.C.


174
We recorded flight-calls at 22,050 kHz, as 16-bit .wav files using a pressure
zone microphone for recording captive birds (Evans and Mellinger 1999, Evans and
Rosenberg 2000, Farnsworth et al. 2004) and a shotgun microphone for recording
free-flying birds (Sennheiser MKH-70, www.sennheiser.com). We used only those
published vocalizations with sampling rates and accuracies consistent with those of
our own field recordings (see Evans and O’Brien 2002 for rate and accuracy data).
We computed all spectrograms with identical parameters (Hamming window, 87.5%
overlap, 256-point FFT, 256-point frame length) using Raven 1.2.1 (Charif et al. 2004)
and editing flight-call spectrograms such that flight-call samples contained
approximately 20-40 ms initial and terminal portions of ambient noise that were not
part of the call. We filtered frequencies below 1 kHz and excluded any flight-calls if
spectrograms contained noise that interfered with the call signal. We measured
acoustic features of flight-calls using a spectrographic cross-correlation algorithm
(SPCC, Cortopassi unpublished) and XBAT 0.6.3 (www.xbat.org; Figueroa 2002).
Analysis of spectrographic properties of flight-calls
We required single values from each species to compare the typical flight-call
parameters with ecological and genetic characters. However, each species was
represented by a set of flight-calls that differed slightly from one another, owing to
differences in the recording environment and inter-individual call variation.
Therefore, we used correlation matrices to identify a typical “template” flight-call that
best captured the variation in the intraspecific samples for each species. This
approach allowed us to select the single flight-call per species that was most
representative of our entire sample of that species’ flight-calls.
We identified these template flight-calls by using an SPCC algorithm
(Cortopassi unpublished data; for a similar program application, see Cortopassi and
Bradbury 2000, 2006) that calculates peak correlation coefficients for all pair-wise

175
correlations of flight-calls and generates a matrix of these values. The algorithm
convolves the two spectrogram matrices over each other in both time and frequency to
compute their fit (Clark et al. 1987, Cortopassi and Bradbury 2000; also see ambiguity
functions, Woodward 1953, Angelari 1970). As such, SPCC incorporates spatial and
temporal elements of spectrograms in a repeatable and objective way to generate a
matrix of similarity values (correlations) for each pair of signals in an ensemble, rather
than using a suite of more subjective individual measures of time and frequency to
characterize a signal (Clark et al. 1987, Cortopassi and Bradbury 2000, Baker and
Logue 2004). Whereas some previous applications of SPCC convolved only on a
single scale (e.g. time scale, Cortopassi and Bradbury 2000), convolution on both
scales was necessary in our analyses because flight-call similarity across individuals
and species may shift in both time and frequency (i.e., a pair of flight-calls may show
displacement on the time axis and the frequency axis or differences in both of these
dimensions).
The SPCC program checks that all samples have the same sampling rate.
Before computing the spectrograms for a pair of samples, the program equalizes the
length of the shorter sample duration sample to match the longer sample duration, a
process called zero-padding (Qi 1992, Cortopassi and Bradbury 2000, Lucero and
Koenig 2000). For all correlation calculations, we used the given spectrographic
frequency and filter resolution of the Hamming window and frequency convolution of
± 1000 Hz for frequencies (based on previous visual inspection confirming that calls
did not vary in center and bandwidth frequency by more than this amount). These
settings account for variation in the duration and frequency of a flight-call signal, and
they are necessary to align the time-frequency spectrograms of two sounds. SPCC of
each species’ flight-calls yielded 47 different species-specific matrices from which the
algorithm extracted the peak pair-wise correlation coefficients for each flight-call. We

176
chose the flight-call for each species with the highest correlation coefficient, or the
flight-call that correlated most highly with other calls. Using these methods, we
generated a sample of 47 flight-call recordings, one flight-call “template” for each of
the 47 species.
We also recorded measurements from the spectrograms of the 47 flight-calls
we chose in the aforementioned analysis with an automatic feature extraction process
implemented in XBAT (www.xbat.org; Figueroa 2002) that used the given
spectrographic frequency and filter resolution of the Hamming window. This set of
measurements was a subset of and based upon those available in ACUSTAT (Fristrup
and Watkins 1992, 1993). The measurement process is a simple procedure that
involves selecting a signal of interest (in this case, a flight-call) by drawing a box
around a flight-call onscreen using the cursor. This box represents the bounds within
which the feature extraction process occurred, extracting measurements automatically
and logging these in a data file. For these analyses, each spectrogram’s amplitude-
time envelope (aggregate power as a function of time) and power spectrum envelope
(power as a function of frequency) were treated conceptually as probability density
functions in the time and frequency dimensions, respectively (see Chapter 5).
We used 50% of the total flight-call signal energy in the amplitude-time and
power spectrum envelopes to measure statistical quartiles and inter-quartile ranges,
where “median” (Me) is the 50th percentile, “initial” (P1) is the 25th percentile,
“terminal” (P2) is the 75th percentile, “inter-percentile range” (W) encompasses 50%
of the signal energy distribution, and “skewness” is (Me-P1)/W). We use the highest
and lowest values that bound the top 50% of the probability distribution of the
amplitude-time or power spectrum envelope to calculate the spread (highest minus
lowest) in the distribution, which is then used to calculate “skewness” in the
amplitude-time or power spectrum envelope. We also use equivalent width to

177
describe amplitude-time (equivalent-duration) and power spectrum (equivalent
bandwidth) data (see Chapter 5).
XBAT extracted measurements to quantify a signal’s compactness by sorting
the amplitude-time and power spectrum envelopes, referred to as concentration
measures (see Chapter 5). The value of concentration in relation to interpercentile
range reveals how densely or loosely the signal's energy is distributed. Details of this
procedure are available from the Cornell Laboratory of Ornithology Bioacoustic
Research Program (Cortopassi,
www.birds.cornell.edu/brp/research/algorithms/RSM.html.)
There were 28 measurements taken: 16 from the amplitude-time and power
spectrum envelopes and 12 concentration measures derived from sorted probability
density functions of the time-varying features in the spectral frames, 9 from the
amplitude-time envelope and 3 from the power spectrum envelope. The following are
brief descriptions for each of these 28 ACUSTAT measurements (see also Table 7.1)..
1) Median, equivalent-duration and skewness of the amplitude-time envelope
(MeENV, EqENV, and SkENV, in seconds);
2) Median, equivalent-bandwidth and skewness of the power spectrum envelope
(MePS, EqPS, and SkPS, in Hz);
3) Median, equivalent-width and skewness of the discrete Fourier transform of
the amplitude-time envelope, computing the frequency spectrum of the
amplitude-time envelope and measuring from that (MeENVM, EqENVM, and
SkENVM, in Hz);

183
Additional measurements of flight-call spectrograms
We also recorded some traditional temporal and spectral measurements from flight-
call spectrograms using visual inspection. Many studies using spectrograms as a basis
for assessing differences in sounds record duration and frequency measurements based
on visual inspection. Despite an inherent subjectivity to visual inspection, convergent
patterns in the ways that observers classify similarity suggest that some consistency
may exist in visual methods (Cortopassi and Bradbury, Jones et al. 2001, Rendell and
Whitehead 2003). For 33 species, we used previously published data on maximum,
minimum and bandwidth frequencies and duration (Farnsworth and Lovette 2005).
We recorded these measurements for the additional 14 species in our sample that were
not available from this study by inspecting spectrograms visually and recording the
measurements following a previous published methodology (methods: p. 338,
Farnsworth and Lovette 2005).
In addition to the suite of aforementioned continuous measurements from
visual inspection, we recorded discrete, qualitative measurements of flight-call
spectrograms to describe additional features that continuous, energy distribution
measurements may not have captured. Although SPCC uses many discernible
structural elements, it is not clear whether SPCC assesses all possible elements for
discerning differences in flight-calls. The visual approach using discrete
measurements may better approximate the SPCC approach than it approximates the
energy-distribution approach. As such, these measurements are more similar to
syllable structure of flight-calls (spectrographic “shape” from SPCC) than they are
similar to spectral and temporal properties. However, SPCC does not identify what
features compose the measurements that correlate among calls; nor do energy-
distribution measurements capture this variation in syllables. We defined four
characters to describe syllable structure (Table 7.3). Sweep describes in five

184
categories the slope of the frequency energy as depicted by spectrogram (for example,
is the call rising or falling in pitch?). Modulation describes in three basic categories
the oscillation of the frequency track (for example, is the call buzzy or pure tone?).
Inflection describes a similar measurement to modulation only in terms of three
categories of number of inflection points (for example, does the call have many
inflection points or few?). Finally, type describes the basic shape of the call (for
example, is it v-shaped or is it m-shaped?).
Ecological Data
We compiled ancillary information on ecological characteristics that may be related to
variation in flight-call acoustic properties. These characteristics included previously
published data, supplemented where necessary with additional observations of the
authors (Table 7.3). We converted all ecological characteristics into continuous,
quantitative measures. We used five variables derived by Van Buskirk (1997) that
describe vegetation and moisture levels in preferred or most frequent warbler breeding
habitats (supplemental information: Curson et al. 1994, Dunn and Garrett 1997, Gill
and Poole 2004). The variables describing vegetation density, height, and type are:
canopy density and canopy height, describing the thickness and height of tree canopy;
understory density, describing the thickness of undergrowth and near-ground
vegetation; and tree type, describing the primary leaf type of trees in warbler breeding
habitat. The variable moisture describes the wetness of the habitat, including habitats
with standing water (streams, bogs).

185
Table 7.3. Categories and coding for additional qualitative flight-call measurements and ecological characters. Coding Sweep Modulation Inflection Moisture Understory
Density Canopy Density
Canopy Height
Tree Type Migration System
Migration Strategy
Winter Distribution
0 Both Fine Many Dry Dense Dense Low Deciduous East All Primarily Central American
1 Ascending Coarse Intermediate Intermediate Intermediate Intermediate Intermediate Mixed West Florida-West Indies
Primarily Caribbean
2 Descending Heavy Few Moist Open Open Tall Coniferous Both Trans-gulf South America
3 Flat n/a n/a Stream/Bog n/a n/a n/a n/a n/a Circum-gulf North American north of Isthmus of
Tehuantepec
4 Variable n/a n/a n/a n/a n/a n/a n/a n/a n/a All
Flight-call measurements: sweep, the slope of the frequency of the flight-call defined in the broad manner one would describe the slope of a regression line (e.g. is the call rising in pitch?); modulation, the general degree of frequency modulation visible in the flight-call spectrogram (e.g. is the call buzzy?); inflection, the number of apparent slope changes (e.g. does the call have many inflection points?); type classifies each flight-call by its strident characters into shape categories (e.g. what is the overall pattern of the flight-call spectrogram?).
Ecological characters: habitat – moisture is a description of the wetness of a given habitat; understory density is the thickness of vegetation in the understory; canopy density is the thickness of vegetation at the highest parts of the canopy; canopy height is the height of the tallest parts of the canopy; tree type is a description of the leaf-fall tendencies of the primary trees in the preferred habitat; migratory traits: migration system is the basic geographic distribution pattern of the species migration routes; migration strategy is the choice of migration route and a general proxy for geographic location of movements; winter distribution is the center of abundance for species’ non-breeding distributions.

186
We used four variables to describe preferred migration routes, based on current
range maps (Gill and Poole 2004) and personal observations (AF). We defined these
variables for warblers as follows: species migrating through Florida and the West
Indies, species crossing the Gulf of Mexico, species migrating around the Gulf of
Mexico, and species using all these routes. We also used three variables to describe
the continental distribution of primary migratory movements of warblers (i.e., in what
part of the continent does this species occur; Sibley 2000, Gill and Poole 2004): east
of the Rocky Mountains, west of the Rocky Mountains, and both sides of the Rocky
Mountains. Finally, we used five variables to describe primary wintering areas based
on centers of abundance (Christmas Bird Count data: www.audubon.org/bird/cbc) and
current distributions (Hilty and Brown 1986, Ridgely and Tudor 1994, Howell and
Webb 1995, AOU 1998, Raffaele et al. 1998, Ridgely and Greenfield 2001, Hilty
2004). We defined these wintering areas as Central American, Caribbean, South
American, North American (north of the Isthmus of Tehuantepec), and a distribution
encompassing all of the above areas.
Phylogenetic Hypotheses and Comparative Methods
We generated a matrix of pairwise genetic distances for 47 species of wood-warbler
species based on complete sequences of five mitochondrial genes (4116 nucleotides/
taxa): cytochrome oxidase I and II, NAH dehydrogenase II, and ATPase 6 and 8
(GenBank AY650182-AY650224; Lovette and Bermingham 2002, Lovette and
Hochachka 2006). We assumed that mitochondrial DNA is accurate for representing
relationships among warbler species and that introgression has not biased this
representation. Evidence supports these assumptions, namely long species-specific
mitochondrial lineages (Lovette and Bermingham 1999, 2002) and high congruence
between mitochondrial gene trees and tree generated independently using nuclear
genes (Lovette unpublished data). The distance matrix represents a large and

187
comprehensive compilation of mitochondrial genes that is significantly longer than
mitochondrial alignments used in many species-level phylogenies among birds (see
additional details, for example, in Lovette 2004, Lovette and Hochachka 2006).
Although maximum likelihood methods are suitable for generating pair-wise
distances for wood-warbler genetic data, we chose the more conservative method of
generating distances using an ultrametric tree (accounting for possible non-constant
mitochondrial divergence; Lovette and Hochachka 2006). By summing the branch
lengths connecting each pair of termini (taxa), such a tree satisfies the following
assumptions: all distances are positive; a distance between two points can be zero only
if the points are the same; distances are symmetrical; no shortcuts exist in the tree (for
example, the distance between points a-c cannot be longer than the sum of distances
between points a-b and points b-c); and distance a-b cannot be larger than their
distance to a third point (for example, the maximum of distances a-c and b-c). We
derived the ultrametric tree using the following steps: importing a Bayesian topology
as a constraint tree in PAUP* 4.0 (Swofford 2002); using an heuristic search algorithm
to produce a clocklike topology; and conducting a maximum likelihood analysis using
mean general time reversible (GTR)-g+I parameters derived from the Bayesian
Markov chain Monte Carlo (MCMC) analysis (Lovette and Hochachka 2006). With
the same long mitochondrial sequences we also reconstructed phylogenetic
relationships, using MrBayes 3.0b4 (Huelsenbeck and Ronquist 2001) to generate
analyses with a Bayesian MCMC approach under the GTR-g+I model of sequence
evolution. We ran this approach for 5 x 10⁶ generations, sampling every 2500
generations; we discarded the initial 1000 samples as burn-in (Huelsenbeck and
Ronquist 2001).

188
Phylogenetic analysis using linear contrasts and quantile regression
The primary rationale for the use of phylogenetically based statistical methods is that
phylogenetic signal, the tendency of genetically related organisms to resemble each
other, is nearly ubiquitous (Felsenstein 1985, Pagel 1992, Jones and Purvis 1997,
Blomberg et al. 2003, Hansen and Orzack 2005). As such, testing and subsequently
controlling for phylogenetic signal is crucial to the outcome of a comparative study
(Abouheif 1999, Blomberg et al. 2003, Rheindt et al. 2004). We imported a set of
2006 Bayesian phylogenies into Mesquite 1.11 (Maddison and Maddison 2006). We
tested for phylogenetic signal in discrete characters against a null model in which the
analysis software shuffled these characters randomly among taxa while holding the
tree topology constant and then comparing the distribution of the number of state
changes for observed versus randomized trees (Maddison and Slatkin 1991; after
Farris 1970, Fitch 1971). In this approach, the smaller the actual number of changes
relative to the number of changes expected in a random distribution, the more likely is
a trait to be constrained by its phylogenetic history (Maddison and Slatkin 1991). We
used Mesquite 1.11 (Maddison and Maddison 2006) to generate distributions of this
difference by running 10000 iterations of the randomization. We also tested for
phylogenetic signal (phylogenetic non-independence) by performing tests for serial
independence (continuous characters; TFSI) and runs tests (discrete characters; RT)
using the software package Phylogenetic Independence (PI, Abouheif 1999, Reeve
and Abouheif 2003; also see Rheindt et al. 2004). TFSI and RT generate data to test
the null hypothesis that a trait is not significantly associated with its phylogenetic
history.
We performed independent contrasts for all characters that showed significant
phylogenetic signal, using raw, non-contrasted data for characters that did not exhibit
significant signal (Felsenstein 1985, Hansen and Orzack 2005). We used Mesquite

189
1.11 (Maddison and Maddison 2006) to generate linear contrasts. However, this
approach allowed straightforward comparisons between pairs of traits that both
showed either phylogenetic autocorrelation or lack thereof. Comparisons between one
phylogenetically autocorrelated trait and one non-phylogenetically autocorrelated trait
were more complex (Blomberg et al. 2003, Rheindt et al. 2004), requiring
comparisons of linear contrasts using the resolved phylogenetic hypothesis for
characters with phylogenetic signal and linear contrasts using a star phylogeny
(completely unresolved tree) for characters that did not exhibit phylogenetic signal
(Blomberg et al. 2003). We performed such comparisons of contrasts in Mesquite, but
we used a MATLAB algorithm (PHYSIG; Blomberg et al. 2003) to generate the
contrasts from the star phylogeny and then imported these into Mesquite.
We used several diagnostic plots to confirm that our analyses met the statistical
assumptions inherent in performing evolutionary pairwise contrasts. These tests
indicate whether the pattern of change is consistent with the Brownian-motion model
of Felsenstein (1985), or if the approximate branch lengths are systematically biased
(Diaz-Uriate & Garland 1996). We regressed absolute values of contrasts on the
estimated nodal values to test for slopes significantly different from zero, indicative of
a need to transform data. We also regressed the absolute values of standardized
contrasts on age of the node and square root of the expected variance. In addition,
because predicted values of the dependent variable are directly proportional to
contrasts in the predictor variable, we regressed absolute values of the residuals
against standardized contrasts in the independent variable. For all contrasts, we found
no significant relationships across all diagnostic tests, suggesting that our data met
statistical assumptions for pair-wise contrasts and did not require additional
transformation.

190
We also explored the relationships between genetic distance and acoustic
distance using linear quantile regression that describe the entire distribution of
response variables at all predictor variable values (Koenker and Bassett 1978, Cade
and Noon 2003, Lovette and Hochachka 2006). Standard linear regressions describing
changes only in mean responses with a single, best-fit line may miss some
relationships involving only a subset of taxon pairs (Cade and Noon 2003, Lovette and
Hochachka 2006), and the mean relationship between acoustic and genetic
dissimilarity could vary little even if some of the most dissimilar species pairs show
strongly non-random correlations. We examined changes in the 5%, 50% (median)
and 95% quantiles of acoustic measures as a function of genetic distance. The 5%
quantile refers to the 95th percentile of acoustic dissimilarity, while the 95% quantile
refers to the 5th percentile of acoustic dissimilarity – thus the 5% quantile examines
the most acoustically dissimilar species-pairs and the 95% quantile examines the least
acoustically dissimilar species-pairs. The 50% quantile (median) examines whether
pervasive changes in acoustic dissimilarity exist along the entire distribution of genetic
distances. Changes in each quantile represent changes across the entire distribution of
genetic distance. These changes, however, do not imply that only 5% and 95% of the
species-pairs varied with genetic distance. Rather, species-pairs that are most and
least acoustically similar are more likely to exhibit such a relationship.
Relating acoustic dissimilarity to local ecological overlap and genetic distance
In addition to the previously described analysis of specific acoustic, genetic, and
ecological characters, we also explored relationships that are more general between
ecological overlap and acoustic dissimilarity. For these analyses, we used a slightly
different method for quantifying acoustic dissimilarity. We counted the number of
least squares mean energy-distribution measurements (generated in PROC MIXED,
SAS Institute 2006) that differed significantly between flight-calls of 13 regionally

191
sympatric species-pairs (data from a previous analysis, Chapter 4). We chose only 13
species-pairs because we wanted to explore the species-pairs representing sister-taxa
(two tips on the phylogeny connected by a single node). We tabulated the number of
significantly different mean values from 28 energy-distribution measurements for each
species-pair, and this sum became our measure of acoustic dissimilarity (Table 7.4).
A larger number represents a higher number of significantly different measures
between two members of a species-pair, indicating that the two species have flight-
calls that are more dissimilar. We related this number to a measure of ecological
overlap defined by probability of local co-occurrence. We used probability
dissimilarity data from a previous study that examined the relationship between
phylogeny and current species co-occurrences (see Lovette and Hochachka 200x for
additional and extensive detail). These data were generated from Breeding Bird
Survey (BBS) transects (Sauer et al. 2003) for quantifying co-occurrence in local
sympatry at a fine spatial scale (transects are approximately 40 km in length). Two
species co-occur if they are detected at the same BBS transect point. Probabilities
ranged from 0 to 1, 0 representing complete co-occurrence and 1 representing no co-
occurrence (Table 7.4). We plotted probability of local co-occurrence against acoustic
dissimilarity as defined by the number of significantly different measurements
between members of a species-pair. We also plotted genetic dissimilarity (as defined
in the previous section) against this new measure of acoustic dissimilarity.
Critical values for multiple comparisons
We corrected for multiple comparisons using two different methods. A typical
Bonferroni correction for 41 dependent variables across 8 independent variables
would result in a critical value of P = 0.0002. However, Bonferroni correction may be
overly conservative (Westfall and Young 1993, Benjamini and Hochberg 1995,
Benjamini and Yekeulti 2001), so we used a less conservative method for multiple

192
comparison correction (after Holm 1979; applied in Farnsworth and Lovette 2005),
resulting in a critical value of P = 0.002 after accounting for sequential replications.
Any critical value 0.002 < P < 0.05 we consider a non-significant trend.
Table 7.4. Genetic distances and probabilities of local co-occurrence for 13 regionally sympatric species of warblers.
Species Pair Genetic Distance Probability of Local Co-Occurrence Differences
MGWA-MOWA 0.024 1 0
HEWA-TOWA 0.01 1 1
BWWA-GWWA 0.044 0.82609 3
BTYW-GRWA 0.014 0.95082 4
COYE-KEWA 0.092 0.94134 4
PIWA-YTWA 0.074 0.91304 5
LOWA-NOWA 0.078 1 5
PROW-SWWA 0.156 0.93711 5
BLPW-YEWA 0.052 0.76254 12
BBWA-BLBW 0.08 0.89944 15
LUWA-VIWA 0.016 0.97297 16
BTBW-MAWA 0.098 0.77702 18
CMWA-NOPA 0.1 0.83893 18
Correcting for morphology
We examined relationships between flight-call variables and body mass and bill length
to determine whether any corrections for these morphological measurements were
necessary. Although such correction is often important for song (body mass and song
frequencies often show negative correlations (Wallschläger 1980), we previously
showed this correction was not necessary for warbler flight-calls. However, this
species sample is larger, and we needed to determine whether the additional species
affected the need for correction. We used previously published data on body mass and
bill length from 33 species (Farnsworth and Lovette 2005 for data and sources) and we
gathered information for the additional 14 species from Dunning (1993) and the Birds

193
of North America series (Gill and Poole 2004). Although body mass exhibited
significant phylogenetic autocorrelation (P < 0.0001), indicating a need to correct for
phylogeny in all analyses considering body mass, bill length exhibited only a trend
toward phylogenetic autocorrelation, suggesting that correcting for phylogeny might
be necessary (P = 0.04). However, all relationships between morphological and
acoustic measurements showed only trends (all positive except PC4). Therefore, we
present results uncorrected for body mass and bill length.
Results
We tested whether flight-call, habitat, and migration behavior variables were non-
randomly distributed across the phylogeny of these 47 wood-warbler species.
Although many flight-call variables showed no apparent phylogenetic association, a
subset of these measures contained phylogenetic signal, as 4 of 5 PCAs and 7 of 28
measurements from the flight-call energy distributions correlated significantly with
phylogeny; likewise, 2 of 4 measurements derived from visual inspection and an
additional 7 energy-distribution measurements exhibited trends toward phylogenetic
autocorrelation (Table 7.5). All categorical descriptors of flight-calls exhibited
significant phylogenetic correlation in runs tests (Table 7.5). Additionally, we found
support for phylogenetic autocorrelation in runs tests for two of five habitat
associations and two of three migration-related characters (Table 7.5). These results
suggest that correcting for phylogeny is necessary for all of these flight-call
measurements with significant phylogenetic correlations as well as for analyses
modeling tree type, understory density, migration system, and migration strategy.

194
Table 7.5. Significant and near-significant phylogenetic autocorrelation between acoustic and ecological characters. Acoustic measurements are abbreviation consistent with Tables 1 and 2.
Acoustic Measurement Phylogeny Tree TypeB
Understory DensityB
Canopy Density
Canopy Height Moisture Migration
SystemA Migration
RouteA Winter
Distribution Body MassA
Bill LengthB
SkAFM No No No No No No No No No No No
MeAFM No No No No No No No No No No No
EqAFM No No No No No No No No No No No
SkENVM No No No Trend (-) No No No No No Trend (+) No
MeENVM Trend No No No No Trend (-) No No No No No
EqENVM Trend No No No No No No No No No No
ATTACKFR No No No No No No No No No No No
SkFCC Trend No No No No No No No No No No
MeFCC Trend No No No No No No No No No No
SpFCC No No No No No No No No No No No
SkENV No No No No No No No No No No No
MeENV No No No No No No No No No No No
EqENV Trend No No No No No No No No No No
SkFSKEW Yes No No No No No No No No Trend (+) No
MeFSKEW Yes No No No No No No No No No No
SpFSKEW Yes No No No No No No No No No No
SkFMED No No No No No No No No No No No
MeFMED Trend No Trend (+) No Yes Trend (+) No No No No No
SpFMED No No No No No Trend (+) No No No No No
* Signficant, A significant with phylogeny, P<=0.002 ^ Trend, B trend with phylogeny, 0.002 < P < 0.05 C P<=0.002, but not an ordinal or interval character

195
Table 7.5 (Continued).
Acoustic Measurement Phylogeny Tree TypeB
Understory DensityB
Canopy Density
Canopy Height Moisture Migration
SystemA Migration
RouteA Winter
Distribution Body MassA
Bill LengthB
SkEBC No No No No No No No No Yes No No
MeEBC Yes No No No No No No No No No No
SpEBC No No No No No No No No No No No
SWMAG Yes No No No Trend (+) No No No No No No
SkPS Yes No No Trend (-) No No No No No No No
MePS Trend No Trend (+) No Yes Trend (+) No No No Trend (+) No
EqPS Yes No No No Trend (+) No No No No No No
UPSWFR Trend No Trend (-) No No No No No No Trend (+) No
UPSWM No No No No No No No No No No No
F1* Yes No No Trend (-) No No No No No No No
F2* Yes No Trend (+) No Yes No No No No No Trend (+)
F3* Yes No No No No No No No No No No
F4* Yes No No No No No No No No Trend (-) No
F5 No No No No No No No No No No No
Minimum Frequency* Yes No Trend (+) Trend (-) Trend (+) No No No No Trend (+) No
Maximum Frequency^ Trend No No No No No No No No No No
Bandwidth Frequency^ Trend No No No No No No No No No No
Duration* Yes No No No No No No No No No No
TypeC Yes No No No No No No No No No No
Sweep* Yes No No No No No No No No No No
Modulation* Yes No No No No No No No No No No
Inflection* Yes No No No Trend (-) No No No No No No

196
Phylogenetically controlled analyses
We compared linear contrasts of flight-call spectrographic properties with contrasts of
habitat or migration characters when both sets of characters showed evidence of
phylogenetic effects. Linear contrasts of several measurements of flight-call
frequency and duration showed near-significant correlations with linear contrasts of
understory density (Table 7.5). Minimum frequency exhibited a positive trend with
understory density (r = 0.3, P = 0.04), suggesting higher minimum frequencies
associated with more open habitats. Median frequency (MePS, r = 0.4, P = 0.007) and
median frequency contour (MeFMED, r = 0.35, P = 0.013) also exhibited near-
significant positive trends with understory density, suggesting that higher median
frequency might be associated with more open habitat. Similarly, PC2 (“peak and
median frequencies”) exhibited a positive trend (r = 0.3, P = 0.03), supporting the
apparent association between median frequency and understory density. Upsweep
fraction showed a negative trend with understory density (UPSWFR, r = -0.4, P =
0.005), suggesting that flight-calls with less frequency sweep (a lower fraction of
increasing frequencies across the duration of the call) may be related to less open
habitat. We found no significant correlations between any flight-call measurements
and tree type, or between contrasts of migration characters and acoustic characters
(Table 7.5).
Phylogenetically uncontrolled analysis
We used uncontrasted approaches for comparing flight-call variables with habitat or
migration characters when both sets of characters showed no evidence of phylogenetic
effects. We found only one highly significant correlations among this set of acoustic
and ecological characters between skewness of equivalent bandwidth contour – a
measure how much the compactness of a flight-call’s frequency is skewed toward
median frequency – and winter distribution (SkEBC, r = 0.6, P < 0.0001). However,

197
two of four ecological characters exhibited near-significant trends. Canopy density
and skewness of amplitude time envelope frequency spectrum showed a negative trend
(SkENVM, r = -0.33, P = 0.02) as did canopy density and skewness of power
spectrum (SkPS, r = -0.31, P = 0.04). Flight-calls that have more energy distributed
earlier in the duration of the signal may be associated with thicker canopy. Moisture
and spread of median frequency contour showed a positive trend (SpFMED, r = 0.37,
P = 0.01). Flight-calls that have wider median frequency contours may be associated
with more moist habitats.
Phylogenetically mixed analysis
We used linear contrasts from the resolved phylogeny for characters with phylogenetic
signal and linear contrasts from the unresolved phylogeny for characters that did not
exhibit phylogenetic signal when comparing flight-call variables with habitat or
migration characters when one character showed evidence of phylogenetic effects and
one character showed no evidence of phylogenetic effects. Among mixed
phylogenetically correlated and uncorrelated characters, three relationships are
significant and 10 trends are near significant. We found significant positive
correlations between canopy height and PC2 (“peak and median frequency” axis, r =
0.44, P = 0.0002), median frequency (MePS, r = 0.46, P = 0.001) and median
frequency contour (MeFMED, r = 0.44, P = 0.002). We found positive trends between
canopy height and sweep magnitude (SWMAG, r = 0.31, P = 0.03), equivalent
bandwidth of the power spectrum (EqbPS, r = 0.32, P = 0.03), and minimum
frequency (r = 0.38, P = 0.009), as well as a negative trend canopy height and
inflection (r = -0.38, P = 0.03). Canopy density exhibited negative trends with PC1
(“signal compactness and sweep magnitude” axis, P = 0.04) and with minimum
frequency (r = -0.4, P = 0.006). Moisture exhibited positive trends with median
frequency (MePS, r = 0.34, P = 0.02) and median frequency contour (MeFMED, r =

198
0.29, P = 0.047) and a negative trend with PC4 (“amplitude modulation/duration”
axis; r = -0.36, P = 0.05) and with median of amplitude time envelope frequency
spectrum (MeENVM, r = -0.34, P = 0.02).
Ecological and genetic relationships and significant acoustic differences
We tested whether 13 sympatric warbler species-pairs (26 sympatric species out of 47
total species) showed significant correlations between similarities in flight-call
characteristics and genetic and ecological similarities. We used probability of local
co-occurrence as a measure of ecological similarity and number of significantly
different energy-distribution measurements of flight-calls between species-pairs as a
measure of acoustic similarity. We found a negative trend between ecological overlap
and total number of significantly different flight-call measurements among species-
pairs (Table 7.4, Figure 7.1; y = -0.01x + 0.99; r = -0.57, P = 0.04). Species-pairs with
higher probabilities of local co-occurrence tended to have more significantly different
flight-call properties (i.e. a larger number). We did not find a relationship between
genetic distance and number of different measurements (y = 0.004x + 0.04; r = 0.37, P
> 0.05. The number of significantly different flight-call properties between members
of a species-pair therefore does not depend on how closely related are the two
members of the pair. However, the slope of this non-significant relationship is
positive suggesting that less closely related species might have more differences in
flight-call measurements.

199
0 1 3 4 4 5 5 5 12 15 16 18 18
Number of Signficantly Different Flight-call Measurements
Gen
etic
Rel
atio
nshi
p
Prob
abili
ty o
f Co-
occu
rren
ce
Genetic Distance
Probability of LocalCo-OccurrenceProbability of LocalCo-OccurrenceGenetic Distance
Low
High
Distant
Close
Figure 7.1. Relationships between the number of significantly different measurements and ecological overlap and genetic distance among species-pairs.
Quantile regression
We explored whether genetic distance and acoustic distance are significantly related
using linear quantile regression. The quantile regressions of PCO and PCA acoustic
distances on genetic distance supported a pattern of concordant dissimilarity in these
flight-calls properties and genetic distances, with less closely related species-pairs
being less similar in their flight-calls. Median quantiles for actual PCO and actual
PCA distributions indicated that these significant relationships were pervasive across
the entire distribution (PCO: y = 0.47x + 0.21, r = 0.13, P < 0.0001; PCA: y = 3.64x +
2.38, r = 0.12, P < 0.0001), whereas random PCO and random PCA distributions
indicated a relationship no different than one expected by chance (PCO: y = 0.08x +
0.36, r = 0.01, P > 0.05; PCA: y = 1.51x + 3.23, r = 0.03, P > 0.05). However, we

200
found that the slopes of these relationships, in particular their strength in terms of
significance and their direction, varied across genetic distances (Figure 7.2a, 7.2c).
The highest PCO values for the slope estimates of these genetic and acoustic
relationships occurred above the 70th (below the 30% quantile) and below the 5th
(above the 95% quantile) percentiles of the acoustic distance distributions (Figure
7.2a; P < 0.0001). These patterns suggest that species-pairs with flight-calls that are
either highly similar or highly dissimilar show stronger relationships with genetic
distance. The same pattern is apparent for PCA distributions, particularly for highly
dissimilar flight-calls (Figure 7.2c). However, a slope value significantly less than
zero is apparent below the 5th percentile (above the 95% quantile). This suggests that
the species-pairs that are least dissimilar acoustically exhibit a relationship with
genetic distance that is opposite of the aforementioned patterns: species-pairs with
more similar flight-calls are less closely related. Random distributions of acoustic
dissimilarity (PCO and PCA) against genetic distance produced no significant
relationships (Figure 7.2b, d; all P > 0.5), suggesting that the pattern we found in
actual acoustic dissimilarity data did not occur by chance. Regression lines fitting
actual distributions of PCO and PCA dissimilarities against genetic distances have
significantly smaller intercepts (P < 0.0001) than regression lines for random
distributions of PCO and PCA dissimilarities (Figures 7.3, 7.4 respectively). This
pattern supports our results from the analysis of phylogenetic signal in flight-calls,
suggesting that across all genetic distances flight-call measurements are generally
more similar than expected by chance.

201
A) B)
Figure 7.2. Quantile regression plots of quantile intervals from 5% to 95% in 5% intervals for acoustic distance (Ordinate axis) against genetic distance (Abscissa axis). A) Actual principal coordinate (PCO) distribution. B) Random PCO distribution. C) Actual principal component (PCA) distribution. D). Random PCA distribution.

202
Figure 7.2 (Continued).
C) D)

203
0
0.15
0.3
0.45
0.6
0.75
0 0.07 0.14 0.21
Genetic distance
Aco
ustic
dis
tanc
e
PCORPCO
Figure 7.3. Quantile regression plots of the median (50% quantile) values for actual (solid line) and random (dashed line) distributions of PCOs against genetic distance.

204
0
1.5
3
4.5
6
7.5
0 0.07 0.14 0.21
Genetic distance
Aco
ustic
dis
tanc
e
PCARPCA
Figure 7.4. Quantile regression plots of the median (50% quantile) values for actual (solid line) and random (dashed line) distributions of PCAs against genetic distance.
Discussion
Cross-taxon comparisons of acoustic signals
Although the diversity and complexity of avian vocalizations is remarkable, several
fundamental patterns likely govern the evolution of this diversity. Divergence in
signals may occur via several processes including as a by-product of adaptation (either
morphological or environmental) and as a means to facilitate species recognition. Bird
song generally diversifies as a product of selection against hybridization (species
recognition; e.g. Emlen 1972, Sorenson et al. 2003, Qvarnstrom et al. 2006) or in
different foraging niches and habitats as a product of selection for optimal morphology
and efficient sound transmission (acoustic adaptation; e.g. Wiley 1991, Slabbekoorn
and Smith 2002, Podos et al. 2004). However, there is much less evidence to support
the pathways by which more simple vocalizations such as calls diverge. We

205
investigated the roles of ecology and phylogeny in shaping such a simple type of
vocalization, warbler flight-calls. Because these calls are much simpler than songs,
we applied two distinct approaches to capture interspecific variation in flight-calls. By
cross-correlating flight-call spectrograms, we assessed similarities in syllable structure
(focusing on the role of phylogeny), whereas by recording energy-distribution
measurements, we assessed the spectral and temporal properties of these sounds
(focusing on the role of evolution). Based on our results we suggest that warbler
flight-calls follow a path to divergence that is slightly different from the path songs
follow.
Phylogenetic effects on flight-call vocalizations
Phylogenetic effects are widespread in avian vocalizations (e.g. Lanyon 1969, Payne
1986, Spector 1992, Irwin 1996, Martens 1996, McCracken and Sheldon 1997, Price
and Lanyon 2002, Packert et al. 2003), but some rapidly evolving vocal traits may
diverge so quickly that phylogenetic effects are minimal in comparisons among
species or more ancient lineages (Rheindt et al. 2004). This is particularly true for
vocalizations that have a large learned component, such as the many local and regional
song dialects of Zonotrichia sparrows (family Emberizidae: Nottebohm 1969, Baker
1975, Baptista 1977, Trainer 1983, Tubaro and Segura 1994, Nelson 1998, Soha et al.
2004), blackbirds (family Icteridae: Avery 1977, Trainer 1989, Ologhlen 1995), and
finches (family Fringillidae: Mundinger 1975). In contrast, warbler flight-calls
exhibited substantial phylogenetic signal both in syllable structure and, more
surprisingly, in some energy distribution measurements (Table 7.5). Several studies
have identified syllable structure as likely to show phylogenetic signal, informative of
evolutionary patterns and processes as well as taxonomic relationships (Helbig et al.
1996, McCracken and Sheldon 1997, Price and Lanyon 2002, Packert et al. 2004, Lei

206
et al. 2005). However, this study is one of first to identify explicit phylogenetic
effects in spectral and temporal properties.
All syllable structure measurements showed highly significant phylogenetic
autocorrelation. These measurements describe qualities of the shape of flight-call
spectrograms, including their frequency slope, modulation, number of inflection
points, and overall syllable type. Many spectral and temporal measurements of flight-
call spectrograms also showed highly significant relationships with phylogeny. These
measurements describe the energy distribution of flight-calls using repeatable and
robust statistics, and they include compactness of frequency bandwidth (EqbPS,
MeEBC), skewness of frequency (MeFSKEW, SpFSKEW, SkFSKEW, SkPS) and
frequency sweep (SWMAG). In addition, several spectral and temporal measurements
showed trends towards phylogenetic autocorrelation, including additional measures of
frequency concentration (MeFCC, SkFCC), duration compactness (MeENVM,
EqbENVM, EqdENV), median frequency (MePS, MeFMED), and upsweep fraction
(UPSWFR). The principal component scores that are a composite of these variables
showed similar patterns, as four of the five PCs showed highly significant correlations
with phylogeny. The only non-significant PC (PC5) represented the only suite of
measurements for which we found no phylogenetic autocorrelation (AFM). We also
found highly significant phylogenetic autocorrelation in minimum frequency and
duration, more traditional measurements of sound made by visual inspection and
employed in many studies before the advent of more advanced digital analysis
techniques.
Phylogenetic signal in flight-call syllable structure may stem from similar
adaptations among related taxa or the effects of phylogenetic inertia, a tendency to
resist current or past adaptive pressures (Derricksen and Ricklefs 1988, Hansen and
Orzack 2005). Some properties of calls with significant phylogenetic autocorrelation

207
may reflect the similar behaviors or syringeal structure of related warbler species as
opposed to their shared environmental and habitat affinities, whereas vocal characters
that do not exhibit significant phylogenetic autocorrelation may be evolving more
rapidly than syllable structure, potentially obscuring some of the patterns of
phylogenetic signal (Rheindt et al. 2004). Although syringeal structure probably does
not differ substantially among these warblers, the need to recognize conspecifics is
likely strong. Syllabic characters may represent an evolutionarily conserved
mechanism for such recognition. However, the reason that some spectral and
temporal properties of flight-calls show phylogenetic effects is less clear. Such
characters do not correlate generally with phylogeny (but see Rheindt et al. 2004);
rather, these properties are often subject to ecological convergence and more
dependent on vegetation structure (McCracken and Sheldon 1997). In fact, sound
penetration through vegetation is largely a frequency dependent feature (Morton 1975,
Wiley 1991, Brown and Hanford 1996, 2000). Yet, we found several phylogenetically
autocorrelated frequency measurements and several phylogenetically-non-
autocorrelated non-frequency measurements (for example, ENVM, ENV, duration; see
Table 7.5). Given these findings, we agree with Rheindt et al. (2004) that
relationships between spectral and temporal properties and phylogeny may need to be
reevaluated.
The relationships between genetic distance and acoustic distance using linear
quantile regression show general agreement with our results from phylogenetic signal
analysis. Acoustic distances are smaller than expected by chance across the entire
distribution of genetic distances, indicating that general measures of acoustic
relatedness, whether syllabic (PCO data) or spectral and temporal (PCA data), show
significant phylogenetic signal. Quantile regression plots suggest that species-pairs
that are more closely related (smaller genetic distances) are more similar acoustically

208
(Figure 7.2a, 7.2c), despite a single instance where the opposite may be true (Figure
7.2c). However, these relationships leave a substantial percentage of variance
between acoustic and genetic distances unexplained (Figures 7.3, 7.4).
Associations between flight-calls and non-acoustic traits
Numerous near-significant trends and several highly significant correlations between
spectrographic measurements of warbler flight-calls and habitat suggest that ecology
plays a role in shaping flight-calls of warblers (Table 7.5, Figure 7.1). Moreover,
flight-calls exhibit patterns of habitat-related transmission properties similar to the
patterns exhibited by songs. These results, taken in concert, provide support for the
acoustic adaptation hypothesis as one factor in the diversification of flight-calls and in
the diversification of bird vocalizations generally.
Higher median frequencies showed near-significant associations with taller and
more open canopies and more moist habitats. These spectral properties of flight-calls,
therefore, exhibit some patterns of environmental correlations similar to those
correlations found for song properties suggesting higher frequency and more
modulated signals associate with habitats that are more open (Morton 1975, Ryan and
Brenowitz 1985, Wiley 1991, Brown and Hanford 1996, 2000, Seddon 2005, Tubaro
and Litjmaer 2006). Near-significant trends also suggest such concordance between
song and call relationships with their environment. PC1 (signal compactness and
sweep magnitude axis) showed a negative trend with canopy density, suggesting that
longer duration flight-calls with fewer changes in frequency sweep tended to associate
with denser canopy. Again, following the pattern apparent in songs, flight-calls with
longer duration and narrower bandwidth correlated with denser forest. Furthermore,
increased inflection values, indicating more frequency modulated signals, tended to
associate with more open canopy. This pattern, too, mirrors the correlation between
more modulated and buzzy vocalizations and open habitats exhibited by bird songs

209
(Wiley 1991, Brown and Hanford 1996, 2000). These patterns of acoustic and
environmental correlation have important implications for signal propagation and
differences in propagation among habitats. Although highly significant relationships
between flight-calls and ecological characters were not universal, the similarity of
these patterns to those seen in previous studies of songs suggests that broad patterns
between spectral and temporal properties of sounds and environment exist. Migration
strategies such as route traveled and geographic distribution of migration did not show
any significant or near-significant relationships with acoustic characteristics. Although
both of these ecological characters showed significant phylogenetic autocorrelations,
there are no meaningful relationships apparent with vocal behaviors. Although winter
distribution did not show any phylogenetic autocorrelation, the same pattern of no
significant relationships generally applied to analyses comparing winter distribution
with the exception of one highly significant positive correlation (SkEBC, measuring
the degree of skew in the compactness of a flight-call’s frequency toward median
frequency). High values for SkEBC, indicative of flight-calls with bandwidths skewed
toward higher frequencies, correlated significantly with winter distributions in North
America. This correlation may represent a relationship between signal frequency
bandwidth and vegetation structure indirectly, perhaps a function of more open habitat
types found in these temperate distributions.
Because warblers use flight-calls extensively during migratory periods and to a
lesser extent during non-breeding wintering periods (Farnsworth 200_), association
between acoustic properties and these geographic behavioral strategies is plausible.
Therefore, the lack of correlations between flight-calls and these characteristics is
somewhat surprising, considering current hypotheses about the function of flight-calls
(Thake 1981, 1983). Migratory traits for which we did not account may play a more
important role in communication than simply the strategies and geographic patterns of

210
migration, particularly flocking preferences (for example, during migratory stopover)
and migration timing (for example, early migrants versus late migrants).
Acoustic Character Displacement
Character displacement generally refers to a pattern among similar species with
partially overlapping distributions of higher trait divergence in areas of high local co-
occurrence and more intense competition for a resource, and of trait convergence in
areas of low or no local co-occurrence and less intense or no competition for
resources. We found intriguing possible evidence for character displacement in
warbler flight calls: among sympatric warbler species-pairs, those pairs with higher
probability of local co-occurrence exhibited a trend toward less similar flight-calls
(higher number of significantly different properties). Locally sympatric species may
have more different flight-calls than those of species that are not locally sympatric.
These results suggest weak support for character displacement in flight-calls. Species
in direct contact (local sympatry) may require divergent flight-calls to communicate in
an otherwise similar active space. These results may also support the species
recognition hypothesis, suggesting that flight-calls may be an important means of
species-recognitions in certain contexts outside the typical breeding season and
territorial context.
We cannot confirm this hypothesis, because we have only a single allopatric
species-pair for which we have acoustic and ecological overlap data (Mourning and
MacGillivray’s Warblers) and an additional allopatric species-pair for which we have
only acoustic data (Red-faced Warbler, Canada Warbler). Interestingly, the
Mourning-MacGillivray’s species-pair shows no significant differences in flight-call
characteristics. However, a much larger sample of flight-calls in allopatry is required
to understand whether regionally sympatric species in local sympatry are more
different from the same pair in allopatry. Additionally, much more information about

211
the resource, communication space, and its limits and characteristics over time and
space is needed. Additional information about the genetic basis for this variation is
required to confirm that variation is not simply a result of phenotypic plasticity.
Unlike some other vocalizations (for example, territorial song: Packert et al.
2004), the number of differences in vocal characters did not correlate significantly
with genetic distances among species-pairs for warbler flight-calls (Figure 7.1).
However, a positive relationship between genetic distance and degree of difference in
vocalization may exist, suggested by the near-significant positive trend for more
closely related species-pairs (smaller genetic distances) to have fewer significant
differences in flight-calls.
A phylogenetic perspective on flight-call function
A suite of phylogenetic, ecological, and atmospheric factors probably shapes warbler
flight-call properties, and these relationships may provide insight into the function of
these simple vocalizations. Hamilton (1962) proposed that flight-calls might function
to stimulate conspecifics to continue flying or to maintain flock organizations, an idea
met with general agreement in subsequent studies (Graber 1968, Griffin 1969).
Additional hypotheses of function include that calls may be useful for spacing (Graber
1968) or echolocation (Griffin 1969). Furthermore, Thake (1981, 1983) theorized that
these calls might improve orientation abilities, by allowing a bird with knowledge of
flight-call properties to identify the position and direction of movement of
conspecifics during nocturnal flights. However, these interpretations considered
flight-calls only in the migratory context. Recent studies have shown that flight-calls
occur in other contexts of warblers’ annual cycles, with migratory periods simply
representing the highest instances of the behavior (Farnsworth 200_). Any discussion
of function, therefore, likely requires consideration of these additional contexts.

212
Relationships with ecological characters highlight the primary importance of
spectral and temporal properties of flight-calls. That these significant and near-
significant relationships exist, and relationships between flight-calls and migration
strategies do not, implies a role for ecology not previously defined for flight-call
function. Communicating during family foraging or while traveling with intra- and
interspecific flocks is probably related to these ecological factors. However, because
flight-calls are high in frequency and short in duration, they may be useful only over
limited distances. If this were true, flight-calls would be limited to certain types of
communication. This assumes that high frequency, short duration sounds degrade
quickly under many conditions and that information transmitted by such signals may
not be intelligible over any substantial distance (Bradbury and Vehrencamp 1998).
Given ecologic and propagation constraints as well as diverse behavioral contexts,
flight-calls may function as a short-distance communication signal that aids species
recognition and flock cohesion. Whether these calls are localizable and therefore
representative of some orientation, location, or spatial-relation function is unknown.
High frequency, narrow bandwidth calls generally do not make useful beacons to
identify a bird’s location (Marler 1955). However, signals with frequency modulation
sweeps may provide substantial information necessary for localizing a sound source.
Many bat vocalizations exhibit such frequency sweeps, and flight-calls of many of the
species in our study exhibit such patterns (after Griffin 1969).
In the context of diverse breeding ecology, phylogenetically informative
properties of flight-calls may best communicate information. Yet in the context of
offspring traveling with and attempting to locate parents, different properties for
recognizing correctly species and individual may be important for juveniles
communicating with parents. Flight-calls exhibit clear differences among species and
enough differences among individuals to suggest that individual recognition is

213
possible (at least for some frequency properties; Chapter 4, Chapter 5). Individuality
may be an important attribute in contexts as varied as parent-offspring foraging flocks,
nocturnal migration, and intra- and interspecific winter foraging. Frequency and
amplitude modulations may themselves encode species- or individual-specific
information about a vocal warbler. Furthermore, communication outside of certain
spectral and temporal resolutions, with flight-calls being higher in frequency and
shorter than certain predators can detect, may prove useful for avoiding predation
(Klump et al. 1996, Langemann et al. 1998, Gill and Sealy 2004). As such, features
that relate directly and indirectly to warbler life history may constrain both
phylogenetically- and individually-informative properties of flight-calls.
Clearly, a substantial gap remains in our knowledge of the types of information
that flight-calls might transmit. If syllable structure is constrained by phylogeny,
flight-calls may be constrained to evolve in a limited number of ways dependent on
their function, environmental selection pressures, and the information they encode.
Whereas detailed examination of syllable structure hints that such patterns exist,
understanding patterns of syringeal usage may clarify the existence of such avenues
for evolution. The fact that these calls are so short yet have substantial rapid
frequency and probably amplitude modulation is a distinctive feature among avian
calls. Studies of the mechanisms for producing rapid amplitude and frequency
modulations are necessary, particularly in relation to the energetic costs of flight-call
production, the mechanisms by which warblers produce such sounds, and potential
variation in fitness associated with flight-call production and reception.
Both phylogenetic and ecological characters correlate to warbler flight-call
syllable structure and spectral and temporal properties, these patterns supporting
hypotheses of diversification as a function of species recognition and acoustic
adaptation, respectively. Additionally, morphological characters do not constrain

214
warbler flight-call frequencies and duration (for example, body mass and bill size) in
phylogenetically controlled and uncontrolled analysis (Farnsworth and Lovette 2005),
these patterns not supporting the hypothesis of diversification as a function of
selection for optimal morphology. Both of our approaches to sound analysis (cross-
correlation and multiple objective measurements) show concordant patterns of
phylogenetic autocorrelation. However, energy-distribution measurements exhibit
more relationships with ecological characters, suggesting a closer relationship among
ecological, spectral, and temporal properties than between ecological and syllable
structure properties. Understanding the true role of ecological factors in shaping
flight-calls requires ontogenetic information. If flight-calls are learned, additional
variation across populations may exist that relate to habitat-dependent acoustic
environments. Such divergence based on learning may account for some unexplained
variation in acoustic and genetic relationships in flight-calls. In addition, heritability
of variation in syllabic, spectral and temporal properties is a crucial but presently
unknown feature important to understanding flight-call acoustic and genetic
relationships. A learned vocalization that exhibits substantial phylogenetic signal may
provide insight into the mechanisms of vocal evolution, species recognition, and the
roles of ontogeny and phylogeny in shaping these short vocalizations.

215
Literature Cited Abouheif, E. 1999. A method for testing the assumption of phylogenetic independence in comparative data. Evolutionary Ecology Research 1:895-909.
Allen, E. S., and K. E. Omland. 2003. Novel intron phylogeny supports plumage convergence in orioles (Icterus). Auk 120:961-970.
Altes, R. A. 1973. Some Invariance Properties of Wideband Ambiguity Function. Journal of the Acoustical Society of America 53:1154-1160.
Ames, P. L. 1971. The morphology of the syrinx in passerine birds. Peabody Museum of Natural History Bulletin, Yale University, New Haven, CT.
American Ornithologists' Union (AOU). 1998. Check-list of North American birds. Seventh edition. American Ornithologists' Union, Washington, DC. 829 pp.
Anderson, M. E. and R. N. Conner. 1985. Northern Cardinal song in three forest habitats in eastern Texas. Wilson Bulletin 97: 436–449.
Angelari, R. D. 1970. Ambiguity Function Applied to Underwater Acoustic Signal Processing – A Review. Ocean Engineering 2:13-&.
Avery, M. and L. W. Oring. 1977. Song Dialects in Bobolink (Dolichonyx-Oryzivorus). Condor 79: 113-118.
Badyaev, A. V., and E. S. Leaf. 1997. Habitat associations of song characteristics in Phylloscopus and Hippolais warblers. Auk 114:40-46.
Badyaev, A. V., and G. E. Hill. 2003. Avian sexual dichromatism in relation to phylogeny and ecology. Annual Review of Ecology Evolution and Systematics 34:27-49.
Baker, M. C. 1975. Song dialects and genetic differences in White-crowned Sparrowswith different song dialects. Evolution 29: 226-241
Baker, M. C. 2004. The chorus song of cooperatively breeding laughing kookaburras (Coraciiformes, Halcyonidae: Dacelo novaeguineae): Characterization and comparison among groups. Ethology 110:21-35.
Baker, M. C., and D. M. Logue. 2003. Population differentiation in a complex bird sound: A comparison of three bioacoustical analysis procedures. Ethology 109:223-242.
Baptista, L. F. 1977. Geographic Variation in Song and Dialects of Puget Sound White-crowned Sparrow. Condor 79: 356-370.

216
Baptista, L. F. and M. L. Morton. 1982. Song Dialects and Mate Selection in Montane White-crowned Sparrows. Auk 99: 537-547.
Barker, F. K., A. Cibois, P. Schikler, J. Feinstein and J. Cracraft. 2004. Phylogeny and diversification of the largest avian radiation. Proceedings of the National Academy of Sciences of the United States of America 101: 11040-11045.
Benjamini, Y. and Y. Hochberg. 1995. Controlling the False Discovery Rate: a Practical and Powerful Approach to Multiple Testing. Journal of the Royal Statistical Society B, 57, 289 -300.
Benjamini, Y. and D. Yekutieli. 2001. The control of the false discovery rate in multiple testing under dependency. Annals of Statistics 29: 1165-1188.
Bertelli, S., and P. L. Tubaro. 2002. Body mass and habitat correlates of song structure in a primitive group of birds. Biological Journal of the Linnaean Society 77:423-430.
Blomberg, S. P., T. Garland, and A. R. Ives. 2003. Testing for phylogenetic signal in comparative data: Behavioral traits are more labile. Evolution 57:717-745.
Bradbury, J.W. and S.L. Vehrencamp. 1998. Principles of Animal Communication. Sinauer Associates: Sunderland, MA.
Bradbury, J. W., K. A. Cortopassi, and J. R. Clemmons. 2001. Geographical variation in the contact calls of orange-fronted Parakeets. Auk 118:958-972.
Bridge, E. S., A. W. Jones, and A. J. Baker. 2005. A phylogenetic framework for the terns (Sternini) inferred from mtDNA sequences: implications for taxonomy and plumage evolution. Molecular Phylogenetics and Evolution 35:459-469.
Briskie, J. V., P. R. Martin, and T. E. Martin. 1999. Nest predation and the evolution of nestling begging calls. Proceedings of the Royal Society of London Series B-Biological Sciences 266:2153-2159.
Brown, T. J., and P. Handford. 1996. Acoustic signal amplitude patterns: A computer simulation investigation of the acoustic adaptation hypothesis. Condor 98:608-623.
Brown, T. J., and P. Handford. 2000. Sound design for vocalizations: Quality in the woods, consistency in the fields. Condor 102:81-92.
Burt, D. B. 2004. Plumage-based phylogenetic analyses of the Merops bee-eaters. Ibis 146:481-492.
Cade, B. S. and B. R. Noon. 2003. A gentle introduction to quantile regression for ecologists. Frontiers in Ecology and the Environment 1: 412-420.
Chapman, F. M. 1907. The warblers of North America. Appleton & Co., NY.

217
Charif, R. A., C. W. Clark, and K. M. Fristrup. 2004. Raven 1.2 User’s Manual. Cornell Laboratory of Ornithology, Ithaca, NY.
Clark, C. W., P. Marler, and K. Beeman. 1987. Quantitative-Analysis of Animal Vocal Phonology - An Application to Swamp Sparrow Song. Ethology 76:101-115. Cliff, N. 1988. The Eigenvalues-Greater-Than-One Rule and the Reliability of Components. Psychological Bulletin 103: 276-279.
Cortopassi, K. A. and J. W. Bradbury. 2000. The comparison of harmonically rich sounds using spectrographic cross-correlation and principal coordinates analysis. Bioacoustics 11:89-127.
Cortopassi, K. A., and J. W. Bradbury. 2006. Contact call diversity in wild orange-fronted parakeet pairs, Aratinga canicularis. Animal Behaviour 71:1141-1154.
Curson, J., D. Quinn, D. Beadle. 1994. Warblers of the Americas: An identification guide. Houghton Mifflin Co., New York.
Deecke, V. B., and V. M. Janik. 2006. Automated categorization of bioacoustic signals: Avoiding perceptual pitfalls. Journal of the Acoustical Society of America 119:645-653.
Dequeiroz, A., and P. H. Wimberger. 1993. The Usefulness of Behavior for Phylogeny Estimation - Levels of Homoplasy in Behavioral and Morphological Characters. Evolution 47:46-60.
Derricksen E. M. and R. E. Ricklefs. 1988. Taxon-dependent diversification of life-history traits and the perception of phylogenetic constraints. Functional Ecology 2:417-423.
Diaz-Uriarte, R., and T. Garland. 1998. Effects of branch length errors on the performance of phylogenetically independent contrasts. Systematic Biology 47:654-672.
Dunn, J. L., K. L. Garrett. 1997. A field guide to warblers of North America. Houghton Mifflin Co., Boston.
Dunning, J. B., Jr. 1993. CRC Handbook of Avian Body Masses. CRC, Boca Raton, FL.
Dyson, M. L., G. M. Klump, and B. Gauger. 1998. Absolute hearing thresholds and critical masking ratios in the European barn owl: a comparison with other owls. Journal of Comparative Physiology A-Neuroethology Sensory Neural and Behavioral Physiology 182:695-702.

218
Eaton, M. D. 2006. A phylogenetic perspective on the evolution of chromatic ultraviolet plumage coloration in grackles and allies (Icteridae). Auk 123:211-234.
Emlen, S. T. 1972. Experimental Analysis of Parameters of Bird Song Eliciting Species Recognition. Behaviour 41:130-&.
Evans, W. R. and D. K. Mellinger. 1999. Monitoring grassland birds in nocturnal migration. Studies in Avian Biology No. 19: 219-229.
Evans, W. R. and M. O’Brien. 2002. Flight calls of migratory birds: Eastern North American landbirds. CD-ROM. Oldbird, Inc., Ithaca NY.
Evans, W. R. and K. V. Rosenberg. 2000. Acoustic monitoring of night-migrating birds: a progress report. In Strategies for Bird Conservation: Creating the Partners in Flight Planning Process (Bonney, R. E., Jr.; D. N. Pashley and R. Cooper, Eds.). Proceedings of the 3rd Partners in Flight Workshop; 1995 October 1-5; Cape May, NJ. Proceedings RMRS-P-16. Ogden, UT: U.S. Department of Agriculture, Forest Service, Rocky Mountain Research Station.
Everitt, B. S. & Dunn, G. 2001. Applied Multivariate Data Analysis, 2nd Edition. Edward Arnold, London, UK.
Farnsworth, A. 2005. Flight-calls and their value for future ornithological studies and conservation research. Auk 122:733-746.
Farnsworth, A. and I. J. Lovette. 2005. Evolution of nocturnal flight-calls in migrating wood-warblers, apparent lack of morphological constraints. Journal of Avian Biology 36: 1-11.
Farnsworth, A., S. A. Gauthreaux, Jr., and D. Van Blaricom. 2004. A comparison of nocturnal call counts of migrating birds and reflectivity measurements on Doppler radar (WSR-88D). Journal of Avian Biology 35: 365-369.
Farris, J. S. 1970. Methods for Computing Wagner Trees. Systematic Zoology 19: 83.
Fava, J. L., and W. F. Velicer. 1992. The Effects of Overextraction on Factor and Component Analysis. Multivariate Behavioral Research 27:387-415.
Felsenstein, J. 1985. Phylogenies and the Comparative Method. American Naturalist 125: 1-15.
Figueroa, H. 2002. Extensible Bioacoustic Tool. http://www.xbat.org.
Fitch, W. M. 1971. Toward Defining Course of Evolution - Minimum Change for A Specific Tree Topology. Systematic Zoology 20: 406.

219
Fristrup, K. M. and Watkins, W. A. 1992. Characterizing acoustic features of marine animal sounds. Woods Hole Oceanographic Institution Technical Report WHOI-92-04.
Fristrup, K. M. and Watkins, W. A. 1993. Marine animal sound classification. Woods Hole Oceanographic Institution Technical Report WHOI-94-13.
Gauch, H. G. 1982. Noise-Reduction by Eigenvector Ordinations. Ecology 63:1643-1649.
Gaunt, S. L. L., L. F. Baptista, J. E. Sanchez and D. Hernandez. 1994. Song Learning As Evidenced from Song Sharing in 2 Hummingbird Species (Colibri-Coruscans and C-Thalassinus). Auk 111: 87-103.
Gill, S. A., and S. G. Sealy. 2003. Tests of two functions of alarm calls given by yellow warblers during nest defence. Canadian Journal of Zoology-Revue Canadienne de Zoologie 81:1685-1690.
Godard, R., and R. H. Wiley. 1995. Individual Recognition of Song Repertoires in 2 Wood Warblers. Behavioral Ecology and Sociobiology 37:119-123.
Gower, J. C. 1966. Some Distance Properties of Latent Root and Vector Methods Used in Multivariate Analysis. Biometrika 53: 325.
Gower, J. C. and P. Legendre. 1986. Metric and Euclidean Properties of Dissimilarity Coefficients. Journal of Classification 3: 5-48.
Graber, R. R. 1968. Nocturnal migration in Illinois - different points of view. Wilson Bulletin 80: 36-71.
Griffin, D. R. 1969. The physiology and geophysics of bird navigation. Quarterly Review of Biology 44: 255-276.
Hamilton, W. J., III. 1962. Evidence concerning the function of nocturnal call notes of migratory birds. Condor 64: 390-401.
Hansen, T. F. and S. H. Orzack. 2005. Assessing current adaptation and phylogenetic inertia as explanations of trait evolution: The need for controlled comparisons. Evolution 59: 2063-2072.
Helbig, A. J., J. Martens, I. Seibold, F. Henning, B. Schottler and M. Wink. 1996. Phylogeny and species limits in the Palaearctic chiffchaff Phylloscopus collybita complex: Mitochondrial genetic differentiation and bioacoustic evidence. Ibis 138: 650-666.
Hilty, S. 2003. Birds of Venezuela. Princeton University Press, Princeton, NJ.

220
Hilty, S. and W. Brown 1986. Birds of Colombia. Princeton University Press, Princeton, NJ.
Holm, S. 1979. A Simple Sequentially Rejective Bonferroni Test Procedure. Scandinavian Journal of Statistics, 6, 65 -70.
Howell, S. N. G., S. Webb. 1995. A guide to the birds of Mexico and northern Central America. Oxford Univ. Press, New York.
Huelsenbeck, J. P. and F. Ronquist. 2001. MRBAYES: Bayesian inference of phylogenetic trees. Bioinformatics 17: 754-755.
Irwin, R. E. 1988. The evolutionary significance of behavioral development: The ontogeny and phylogeny of bird song. Animal Behaviour 36: 814-824.
Irwin, R. E. 1996. The phylogenetic content of avian courtship display and song evolution. Pages 234-252 in Phylogenies and the Comparative Method in Animal Behavior (E. P. Martins, Ed.). Oxford University Press, New York.
Irwin, D. E., P. Alstrom, U. Olsson, and Z. Mowitz-Fredericks. 2001. Cryptic species in the genus Phylloscopus (Old World leaf warblers). Ibis 143:233-247.
Jackson, D. A. 1993. Stopping Rules in Principal Components-Analysis - A Comparison of Heuristic and Statistical Approaches. Ecology 74:2204-2214.
Jones, A. E., C. Ten Cate, and C. J. H. Bijleveld. 2001. The interobserver reliability of scoring sonagrams by eye: a study on methods, illustrated on zebra finch songs. Animal Behaviour 62:791-801.
Jurisevic, M. A., and K. J. Sanderson. 1998. Acoustic discrimination of passerine anti-predator signals by Australian raptors. Australian Journal of Zoology 46:369-379.
Klump, G. M. 1996. Bird communication in the noisy world. Pages 321-338 In Ecology and Evolution of Acoustic Communication in Birds (ed. D. E. Kroodsma and E. H. Miller). Cornell University Press, Ithaca, NY.
Kroodsma, D. E., and R. A. Canady. 1985. Differences in Repertoire Size, Singing Behavior, and Associated Neuroanatomy Among Marsh Wren Populations Have A Genetic-Basis. Auk 102:439-446.
Kroodsma, D. E., and J. Verner. 1987. Use of Song Repertoires Among Marsh Wren Populations. Auk 104:63-72.
Koenker, R. and G. Bassett. 1978. Regression Quantiles. Econometrica 46: 33-50.
Laiolo, P., and A. Rolando. 2003a. Comparative analysis of the rattle calls in Corvus and Nucifraga: The effect of body size, bill size, and phylogeny. Condor 105:139-144.

221
Laiolo, P., and A. Rolando. 2003b. The evolution of vocalisations in the genus Corvus: effects of phylogeny, morphology and habitat. Evolutionary Ecology 17:111-123.
Lambrechts, M. M., and A. A. Dhondt. 1990. A Relationship Between the Composition and Size of Great Tit Song Repertoires. Animal Behaviour 39:213-218.
Langemann, U., B. Gauger, and G. M. Klump. 1998. Auditory sensitivity in the great tit: perception of signals in the presence and absence of noise. Animal Behaviour 56:763-769.
Lanyon, W. E. 1969. Vocal characters and avian systematics. Pages 291-310 in Bird Vocalizations (R. A. Hinde, Ed.). Cambridge University Press, Cambridge, United Kingdom.
Lanzone, M. and Farnsworth, A. In preparation. Documenting unknown and poorly known flight-calls using a novel recording method.
Larkin, R. P., W. R. Evans, and R. H. Diehl. 2002. Nocturnal flight calls of Dickcissels and Doppler radar echoes over south Texas in spring. Journal of Field Ornithology 73:2-8.
Legendre, P. & L. Legendre. 1998. Numerical ecology. 2nd English edition. Elsevier Science BV, Amsterdam. 853 pp.
Lei, F. M., A. Z. Wang, G. Wang, and Z. H. Yin. 2005. Vocalizations of red-necked snow finch, Pyrgilauda ruficollis on the Tibetan Plateau, China - a syllable taxonomic signal?. Folia Zoologica 54:135-146.
Lovette, I. J. 2004. Molecular phylogeny and plumage signal evolution in a trans Andean and circum Amazonian avian species complex. Molecular Phylogenetics and Evolution 32:512-523.
Lovette, I. J. and E. Bermingham. 2002. What is a wood-warbler? Molecular characterization of a monophyletic parulidae. Auk 119: 695-714.
Lovette, I. J. and W. M. Hochachka. 2006. Simultaneous effects of phylogenetic niche conservatism and competition on avian community structure. Ecology 87: S14-S28.
Lucero, J. C., and L. L. Koenig. 2000. Time normalization of voice signals using functional data analysis. Journal of the Acoustical Society of America 108:1408-1420.
MacArthur, R. H. 1958. Population ecology of some warblers of northeastern coniferous forests. Ecology 39:599-619
Macnally, R. C., D. M. Weary, R. E. Lemon, and L. Lefebvre. 1986. Species Recognition by Song in the Veery (Catharus-Fuscescens Aves). Ethology 71:125-139.

222
Maddison, W. P., and M. Slatkin. 1991. Null Models for the Number of Evolutionary Steps in A Character on A Phylogenetic Tree. Evolution 45:1184-1197.
Maddison, W. P. and D.R. Maddison. 2006. Mesquite: a modular system for evolutionary analysis. Version 1.12. URL: http://mesquiteproject.org
Mahler, B., and P. L. Tubaro. 2001. Relationship between song characters and morphology in New World pigeons. Biological Journal of the Linnaean Society 74:533-539.
Marler, P. 1955. Characteristics of Some Animal Calls. Nature 176:6-8.
Marler, P. 2004. Bird calls - Their potential for behavioral neurobiology. Behavioral Neurobiology of Birdsong 1016:31-44.
Marler, P. and R. Pickert. 1984. Species-Universal Microstructure in the Learned Song of the Swamp Sparrow (Melospiza-Georgiana). Animal Behaviour 32: 673-689.
Marten, K., and P. Marler. 1977. Sound-Transmission and Its Significance for Animal Vocalization .1. Temperate Habitats. Behavioral Ecology and Sociobiology 2:271-290.
Martens, J. 1996. Vocalizations and speciation in Palearctic birds. Pages 221-240 in Ecology and Evolution of Acoustic Communication in Birds (D. E. Kroodsma and E. H. Miller, Eds.). Cornell University Press, Ithaca, New York.
McCracken, K. G., and F. H. Sheldon. 1997. Avian vocalizations and phylogenetic signal. Proceedings of the National Academy of Sciences of the United States of America 94:3833-3836.
Molles, L. E., and S. L. Vehrencamp. 1999. Repertoire size, repertoire overlap, and singing modes in the Banded Wren (Thryothorus pleurostictus). Auk 116:677-689.
Monroe Jr., B.L. and C. G. Sibley. 1993. A World Checklist of Birds. Yale University Press, New Haven, CT.
Morton, E. S. 1975. Ecological Sources of Selection on Avian Sounds. American Naturalist 109: 17-34.
Mundinger, P. 1975. Song Dialects and Colonization in House Finch, Carpodacus-Mexicanus, on East Coast. Condor 77: 407-422.
Neff, N. A. and L. F. Marcus. 1980. A survey of multivariate. methods for systematics. Privately published, New York. 243 pp.
Nelson, D. A. 1999. Ecological influences on vocal development in the white-crowned sparrow. Animal Behaviour 58:21-36.

223
Nelson, D. A., K. I. Hallberg, and J. A. Soha. 2004. Cultural evolution of puget sound white-crowned sparrow song dialects. Ethology 110:879-908.
Nicholls, J. A., J. J. Austin, C. Moritz and A. W. Goldizen. 2006. Genetic population structure and call variation in a passerine bird, the satin bowerbird Ptilorhynchus violaceus. Evolution 60:1279-1290
Nottebohm, F. 1969. Song of Chingolo, Zonotrichia Capensis, in Argentina – Description and Evaluation of A System of Dialects. Condor 71: 299.
Nowicki, S., and D. A. Nelson. 1990. Defining Natural Categories in Acoustic-Signals – Comparison of 3 Methods Applied to Chick-A-Dee Call Notes. Ethology 86:89-101.
Ologhlen, A. L. and S. I. Rothstein. 1995. Culturally correct song dialects are correlated with male age and female song preferences in wild populations of brown-headed cowbirds. Behavioral Ecology and Sociobiology 36:251-259.
Olson, V. A., and I. P. F. Owens. 2005. Interspecific variation in the use of carotenoid-based coloration in birds: diet, life history and phylogeny. Journal of Evolutionary Biology 18:1534-1546.
Packert, M., J. Martens, J. Kosuch, A. A. Nazarenko, and M. Veith. 2003. Phylogenetic signal in the song of crests and kinglets (Aves: Regulus). Evolution 57:616-629.
Packert, M., J. Martens, Y. H. Sun, and M. Veith. 2004. The radiation of the Seicercus burkii complex and its congeners (Aves: Sylviidae): molecular genetics and bioacoustics. Organisms Diversity & Evolution 4:341-364.
Palacios, M. G., and P. L. Tubaro. 2000. Does beak size affect acoustic frequencies in woodcreepers? Condor 102:553-560.
Payne, R. B. 1986. Bird songs and avian systematics. Current Ornithology 3:87-126.
Peres-Neto, P. R., D. A. Jackson, and K. M. Somers. 2003. Giving meaningful interpretation to ordination axes: Assessing loading significance in principal component analysis. Ecology 84:2347-2363.
Peres-Neto, P. R., D. A. Jackson, and K. M. Somers. 2005. How many principal components? Stopping rules for determining the number of non-trivial axes revisited. Computational Statistics & Data Analysis 49:974-997.
Peters, S. S., W. A. Searcy and P. Marler. 1980. Species Song Discrimination in Choice Experiments with Territorial-Male Swamp and Song Sparrows. Animal Behaviour 28: 393-404.

224
Placer, J., and C. N. Slobodchikoff. 2001. Developing new metrics for the investigation of animal vocalizations. Intelligent Automation and Soft Computing 7:249-258.
Placer, J., and C. N. Slobodchikoff. 2004. A method for identifying sounds used in the classification of alarm calls. Behavioural Processes 67:87-98.
Podos, J. 1997. A performance constraint on the evolution of trilled vocalizations in a songbird family (Passeriformes: Emberizidae). Evolution 51:537-551.
Podos, J., and S. Nowicki. 2004. Beaks, adaptation, and vocal evolution in Darwin's finches. Bioscience 54:501-510.
Podos, J., S. K. Huber, and B. Taft. 2004. Bird song: The interface of evolution and mechanism. Annual Review of Ecology Evolution and Systematics 35:55-87.
Poole, A. (Editor). 2005. The Birds of North American Online: http://bna.birds.cornell.edu/BNA/. Cornell Laboratory of Ornithology, Ithaca, NY.
Portelli, D. J. 2004. The singing behaviour of the Noisy Scrub-bird, Atrichornis clamosus: congeneric comparisons and the feasibility of using individual variation in song as a census tool. Emu 104:273-281.
Price, J. J., and S. M. Lanyon. 2002. Reconstructing the evolution of complex bird song in the oropendolas. Evolution 56:1514-1529.
Qvarnstrom, A., J. Haavie, S. A. Saether, D. Eriksson and T. Part. 2006. Song similarity predicts hybridization in flycatchers. Journal of Evolutionary Biology 19: 1202-1209.
Qi, Y. G. 1992. Time Normalization in Voice Analysis. Journal of the Acoustical Society of America 92:2569-2576.
Raffaele, H., J. Wiley, O. Garrido, A. Keith, J. Raffaele. 1998. A guide to the birds of the West Indies. Princeton Univ. Press, Princeton, NJ.
Raikow, R. J. 1982. Monophyly of the Passeriformes - Test of A Phylogenetic Hypothesis. Auk 99: 431-445.
Reeve, J. and E. Abouheif. 2003 Phylogenetic Independence, v. 2.0. Department of Biology, McGill University. Montreal, Quebec, Canada. http://www2.mcgill.ca/biology/faculty/abouheif/programs.html
Rendell, L. E. and H. Whitehead. 2003. Comparing repertoires of sperm whale codas: A multiple methods approach. Bioacoustics 14: 61-81.

225
Rheindt, F. E., T. U. Grafe, and E. Abouheif. 2004. Rapidly evolving traits and the comparative method: how important is testing for phylogenetic signal?. Evolutionary Ecology Research 6:377-396.
Rich, T. D. 2002. The short song of Brewer's Sparrow individual and geographic variation in southern Idaho. Western North American Naturalist 62:288-299.
Ridgely, R. S. and P. Greenfield. 2001. The Birds of Ecuador. Christopher Helm.
Ridgely, R. S. and G. Tudor. 1994. The Birds of South America, Volume 2. Oxford University Press, Oxford, UK.
Ryan, M. J., and E. A. Brenowitz. 1985. The Role of Body Size, Phylogeny, and Ambient Noise in the Evolution of Bird Song. American Naturalist 126:87-100.
Searby, A., and P. Jouventin. 2004. How to measure information carried by a modulated vocal signature? Journal of the Acoustical Society of America 116:3192-3198.
Searby, A., and P. Jouventin. 2005. The double vocal signature of crested penguins: is the identity coding system of rockhopper penguins Eudyptes chrysocome due to phylogeny or ecology? Journal of Avian Biology 36:449-460.
Searby, A., P. Jouventin, and T. Aubin. 2004. Acoustic recognition in macaroni penguins: an original signature system. Animal Behaviour 67:615-625.
Seddon, N. 2005. Ecological adaptation and species recognition drives vocal evolution in neotropical suboscine birds. Evolution 59:200-215.
Sibley, D. A. 2000. The Sibley Guide to Birds. Alfred A. Knopf, NY.
Slabbekoorn, H., and T. B. Smith. 2002a. Habitat-dependent song divergence in the little greenbul: An analysis of environmental selection pressures on acoustic signals. Evolution 56:1849-1858.
Slabbekoorn, H., and T. B. Smith. 2002b. Bird song, ecology and speciation. Philosophical Transactions of the Royal Society of London Series B-Biological Sciences 357:493-503.
Slabbekoorn, H., J. Ellers, and T. B. Smith. 2002. Birdsong and sound transmission: The benefits of reverberations. Condor 104:564-573.
Soha, J. A., D. A. Nelson, and P. G. Parker. 2004. Genetic analysis of song dialect populations in Puget Sound white-crowned sparrows. Behavioral Ecology 15:636-646.
Sorenson, M. D., K. M. Sefc and R. B. Payne. 2003. Speciation by host switch in brood parasitic indigobirds. Nature 424: 928-931.

226
Spector, D. A. 1992. Wood-warbler song systems: A review of Paruline singing behaviors. Current Ornithology 9:199-238.
Symmes, D., J. D. Newman, G. Talmageriggs and A. K. Lieblich. 1979. Individuality and Stability of Isolation Peeps in Squirrel-Monkeys. Animal Behaviour 27: 1142-1152.
Tack, E. J., D. A. Putland, T. E. Robson, and A. W. Goldizen. 2005. Geographic variation in vocalisations of Satin Bowerbirds, Ptilonorynchus violaceus, in south-eastern Queensland. Emu 105:27-31.
Tchernichovski, O., F. Nottebohm, C. E. Ho, B. Pesaran, and P. P. Mitra. 2000. A procedure for an automated measurement of song similarity. Animal Behaviour 59:1167-1176.
Thake, M. A. 1981. Calling by nocturnal migrants: A device for improving orientation? Die Vogelwarte 31: 111.
Thake, M. A. 1983. A simple model for use of Doppler shifted vocalizations by migrating birds. Die Vogelwarte 32: 33-39
Trainer, J. M. 1983. Changes in Song Dialect Distributions and Microgeographic Variation in Song of White-Crowned Sparrows (Zonotrichia-Leucophrys-Nuttalli). Auk 100: 568-582.
Trainer, J. M. 1989. Cultural-Evolution in Song Dialects of Yellow-Rumped Caciques in Panama. Ethology 80: 190-204.
Tubaro, P. L., and D. A. Lijtmaer. 2006. Environmental correlates of song structure in forest grosbeaks and saltators. Condor 108:120-129.
Tubaro, P. L., and B. Mahler. 1998. Acoustic frequencies and body mass in new world doves. Condor 100:54-61.
Tubaro, P. L. and E. T. Segura. 1994. Dialect Differences in the Song of Zonotrichia-Capensis in the Southern Pampas - A Test of the Acoustic Adaptation
Hypothesis. Condor 96: 1084-1088.
VanBuskirk, J. 1997. Independent evolution of song structure and note structure in American wood warblers. Proceedings of the Royal Society of London Series B-Biological Sciences 264:755-761.
Wallschläger, D. 1980. Correlation of Song Frequency and Body-Weight in Passerine Birds. Experientia 36:412.

227
Weckstein, J. D. 2005. Molecular phylogenetics of the Ramphastos toucans: Implications for the evolution of morphology, vocalizations, and coloration. Auk 122:1191-1209.
Westfall, P. H. and S. S. Young. 1993. Resampling-based Multiple Testing. Wiley, New York.
Wiley, R. H. 1991. Associations of Song Properties with Habitats for Territorial Oscine Birds of Eastern North-America. American Naturalist 138:973-993.
Wright, T. F., and G. S. Wilkinson. 2001. Population genetic structure and vocal dialects in an amazon parrot. Proceedings of the Royal Society of London Series B-Biological Sciences 268:609-616.
Wright, T. F., A. M. Rodriguez, and R. C. Fleischer. 2005. Vocal dialects, sex-biased dispersal, and microsatellite population structure in the parrot Amazona auropalliata. Molecular Ecology 14:1197-1205.