ecolab ecolab_financial_discuss
TRANSCRIPT

20 • GO • Ecolab
2004GO FinancialDiscussion
Overview for 2004 21
Critical Accounting Policies and Estimates 21
Operating Results 23
Operating Segment Performance 24
Financial Position 28
Cash Flows 28
Liquidity and Capital Resources 29
Market Risk 29
Subsequent Events 30
Forward-Looking Statements and Risk Factors 30
Consolidated Statement of Income 31
Consolidated Balance Sheet 32
Consolidated Statement of Cash Flows 33
Consolidated Statement of Comprehensive 34Income and Shareholders’ Equity
Notes to Consolidated Financial Statements 35
Reports of Management and Independent Registered Public Accounting Firm 51
Summary Operating and Financial Data 52
Contents
Ecolab • GO • 21
OVERVIEW FOR 2004This Financial Discussion should be read in conjunction with the information onForward-Looking Statements and Risk Factors found at the end of the FinancialDiscussion.
The year ended December 31, 2004 was another year of double-digitincome growth and record net sales of $4.2 billion. During 2004, we expandedour sales coverage by entering new markets and geographies. We found waysto reduce costs and improve processes. Strong earnings growth during the firsthalf of 2004 and improving travel and hospitality markets allowed us toaccelerate investments during the second half of the year to improve long-termgrowth.
Operating HighlightsWe drove our Circle the Customer growth strategy with our new field
referral program, which gives ownership to our field sales team to advance thiscritical strategy.
We grew business with independent accounts through targeted programsand our food distributor partnerships in the United States, Latin America andEurope. We are committed to furthering our impact with street customers byassigning dedicated resources to build an even more effective model for thestreet segment.
We bolstered our sales-and-service force, adding associates to our salesteam and making key investments in their training and productivity.
We introduced new products such as our Wash ‘n Walk no-rinse floorcleaner and the Grease Exxpress high-temp grill degreaser that have led thecharge for one of the strongest new slates of products in our recent history.
We increased our market specialization with the separation ofProfessional Products and Healthcare in the United States. These twobusinesses now have the ability to focus more aggressively on their respectivecore markets, which positions them for better growth.
We increased market penetration in the agri, meat and poultry marketsand expanded our product technology with the acquisition of AlcideCorporation; broadened our product lines and distribution channels in the foodsafety market with the acquisition of Daydots International; and enhanced ourofferings in the floor care market with the acquisition of certain business linesof VIC International. These businesses had annual sales of approximately $51million prior to acquisition.
We expanded our geographic coverage and global presence as well, withthe pest elimination acquisitions of Nigiko in France and Elimco in SouthAfrica. These businesses had annual sales of approximately $59 million prior toacquisition.
We continued to add to our management team. We successfullytransitioned CEO responsibilities and bolstered our management group throughexternal hires and internal development.
Financial PerformanceOur consolidated net sales reached $4.2 billion for 2004, an increase of
11 percent over net sales of $3.8 billion in 2003. Excluding acquisitions anddivestitures, consolidated net sales increased 9 percent.
Our operating income for 2004 increased 11 percent over 2003. Excludingacquisitions and divestitures, operating income increased 7 percent.
Diluted net income per share was $1.19 for 2004, up 12 percent from$1.06 in 2003. Included in 2003 net income is a gain of $11.1 million, or $6.7million net of tax, from the sale of an equity investment. This item was of anon-recurring nature.
Currency translation continued to have a positive impact on our financialresults in 2004, adding approximately $11 million to net income following a$12 million benefit in 2003.
A reduction in our annualeffective income tax rate from 38.1percent in 2003 to 36.5 percent in2004 added approximately $8million to net income. Theimprovement was driven by taxsavings programs and the impact ofa one-time tax credit.
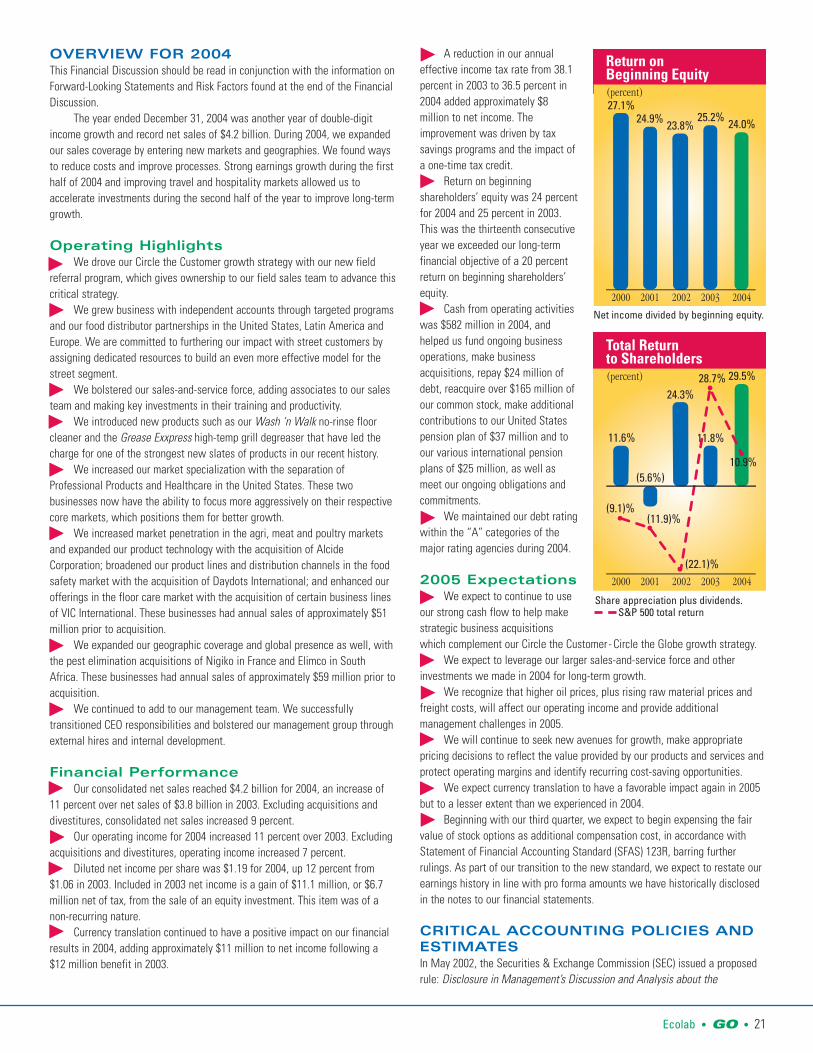
Return on beginningshareholders’ equity was 24 percentfor 2004 and 25 percent in 2003.This was the thirteenth consecutiveyear we exceeded our long-termfinancial objective of a 20 percentreturn on beginning shareholders’equity.
Cash from operating activitieswas $582 million in 2004, andhelped us fund ongoing businessoperations, make businessacquisitions, repay $24 million ofdebt, reacquire over $165 million ofour common stock, make additionalcontributions to our United Statespension plan of $37 million and toour various international pensionplans of $25 million, as well asmeet our ongoing obligations andcommitments.
We maintained our debt ratingwithin the “A” categories of themajor rating agencies during 2004.
2005 ExpectationsWe expect to continue to use
our strong cash flow to help makestrategic business acquisitionswhich complement our Circle the Customer- Circle the Globe growth strategy.
We expect to leverage our larger sales-and-service force and otherinvestments we made in 2004 for long-term growth.
We recognize that higher oil prices, plus rising raw material prices andfreight costs, will affect our operating income and provide additionalmanagement challenges in 2005.
We will continue to seek new avenues for growth, make appropriatepricing decisions to reflect the value provided by our products and services andprotect operating margins and identify recurring cost-saving opportunities.
We expect currency translation to have a favorable impact again in 2005but to a lesser extent than we experienced in 2004.
Beginning with our third quarter, we expect to begin expensing the fairvalue of stock options as additional compensation cost, in accordance withStatement of Financial Accounting Standard (SFAS) 123R, barring furtherrulings. As part of our transition to the new standard, we expect to restate ourearnings history in line with pro forma amounts we have historically disclosedin the notes to our financial statements.
CRITICAL ACCOUNTING POLICIES ANDESTIMATESIn May 2002, the Securities & Exchange Commission (SEC) issued a proposedrule: Disclosure in Management’s Discussion and Analysis about the
þ
þ
þ
þ
þ
þ
þ
þ
þ
þ
þ
þ
þ
þ
þ
þ
þ
þ
þ
þ
2000 2001 2002 2003 2004
29.5%
11.6%
(5.6%)
24.3%
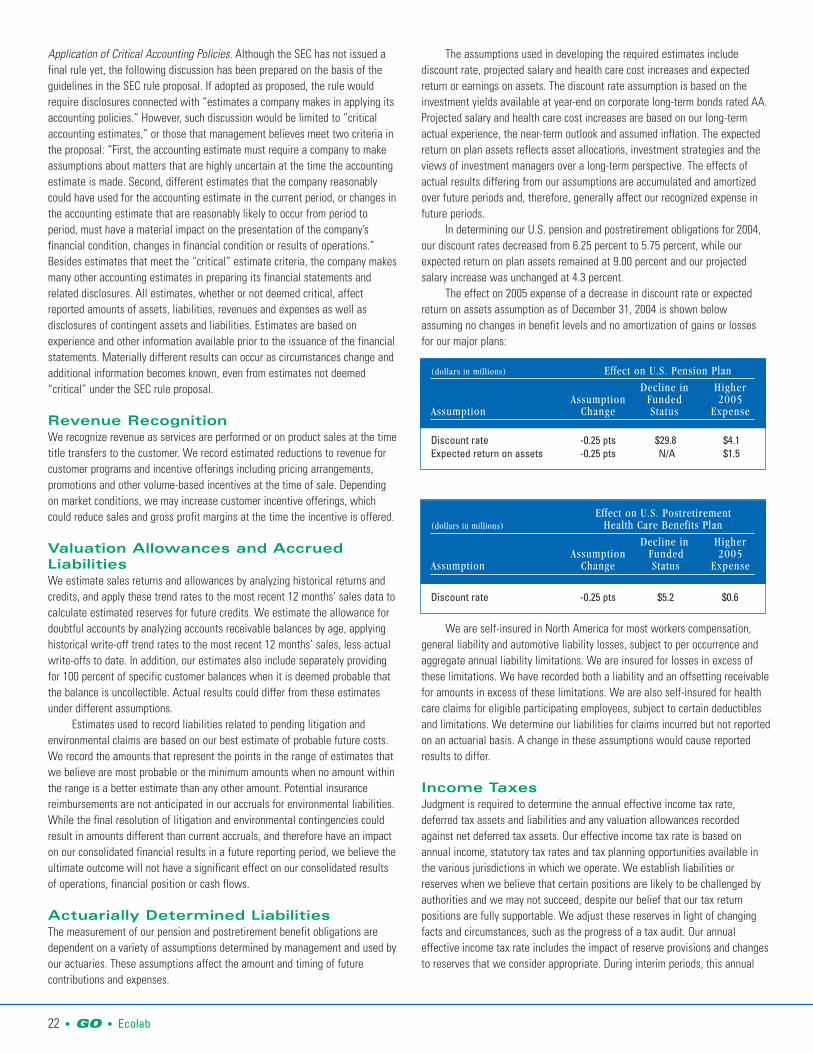
Total Return to Shareholders(percent)
11.8%
(9.1)%(11.9)%
(22.1)%
28.7%
10.9%
∑ ∑
∑
∑
∑
Net income divided by beginning equity.
2000 2001 2002 2003 2004
24.0%
27.1%24.9% 23.8%
25.2%
Return onBeginning Equity(percent)
Share appreciation plus dividends.S&P 500 total return
þ
þ
22 • GO • Ecolab
Application of Critical Accounting Policies. Although the SEC has not issued afinal rule yet, the following discussion has been prepared on the basis of theguidelines in the SEC rule proposal. If adopted as proposed, the rule wouldrequire disclosures connected with “estimates a company makes in applying itsaccounting policies.” However, such discussion would be limited to “criticalaccounting estimates,” or those that management believes meet two criteria inthe proposal: “First, the accounting estimate must require a company to makeassumptions about matters that are highly uncertain at the time the accountingestimate is made. Second, different estimates that the company reasonablycould have used for the accounting estimate in the current period, or changes inthe accounting estimate that are reasonably likely to occur from period toperiod, must have a material impact on the presentation of the company’sfinancial condition, changes in financial condition or results of operations.”Besides estimates that meet the “critical” estimate criteria, the company makesmany other accounting estimates in preparing its financial statements andrelated disclosures. All estimates, whether or not deemed critical, affectreported amounts of assets, liabilities, revenues and expenses as well asdisclosures of contingent assets and liabilities. Estimates are based onexperience and other information available prior to the issuance of the financialstatements. Materially different results can occur as circumstances change andadditional information becomes known, even from estimates not deemed“critical” under the SEC rule proposal.
Revenue RecognitionWe recognize revenue as services are performed or on product sales at the timetitle transfers to the customer. We record estimated reductions to revenue forcustomer programs and incentive offerings including pricing arrangements,promotions and other volume-based incentives at the time of sale. Dependingon market conditions, we may increase customer incentive offerings, whichcould reduce sales and gross profit margins at the time the incentive is offered.
Valuation Allowances and AccruedLiabilitiesWe estimate sales returns and allowances by analyzing historical returns andcredits, and apply these trend rates to the most recent 12 months’ sales data tocalculate estimated reserves for future credits. We estimate the allowance fordoubtful accounts by analyzing accounts receivable balances by age, applyinghistorical write-off trend rates to the most recent 12 months’ sales, less actualwrite-offs to date. In addition, our estimates also include separately providingfor 100 percent of specific customer balances when it is deemed probable thatthe balance is uncollectible. Actual results could differ from these estimatesunder different assumptions.
Estimates used to record liabilities related to pending litigation andenvironmental claims are based on our best estimate of probable future costs.We record the amounts that represent the points in the range of estimates thatwe believe are most probable or the minimum amounts when no amount withinthe range is a better estimate than any other amount. Potential insurancereimbursements are not anticipated in our accruals for environmental liabilities.While the final resolution of litigation and environmental contingencies couldresult in amounts different than current accruals, and therefore have an impacton our consolidated financial results in a future reporting period, we believe theultimate outcome will not have a significant effect on our consolidated resultsof operations, financial position or cash flows.
Actuarially Determined LiabilitiesThe measurement of our pension and postretirement benefit obligations aredependent on a variety of assumptions determined by management and used byour actuaries. These assumptions affect the amount and timing of futurecontributions and expenses.
The assumptions used in developing the required estimates includediscount rate, projected salary and health care cost increases and expectedreturn or earnings on assets. The discount rate assumption is based on theinvestment yields available at year-end on corporate long-term bonds rated AA.Projected salary and health care cost increases are based on our long-termactual experience, the near-term outlook and assumed inflation. The expectedreturn on plan assets reflects asset allocations, investment strategies and theviews of investment managers over a long-term perspective. The effects ofactual results differing from our assumptions are accumulated and amortizedover future periods and, therefore, generally affect our recognized expense infuture periods.
In determining our U.S. pension and postretirement obligations for 2004,our discount rates decreased from 6.25 percent to 5.75 percent, while ourexpected return on plan assets remained at 9.00 percent and our projectedsalary increase was unchanged at 4.3 percent.
The effect on 2005 expense of a decrease in discount rate or expectedreturn on assets assumption as of December 31, 2004 is shown belowassuming no changes in benefit levels and no amortization of gains or lossesfor our major plans:
We are self-insured in North America for most workers compensation,general liability and automotive liability losses, subject to per occurrence andaggregate annual liability limitations. We are insured for losses in excess ofthese limitations. We have recorded both a liability and an offsetting receivablefor amounts in excess of these limitations. We are also self-insured for healthcare claims for eligible participating employees, subject to certain deductiblesand limitations. We determine our liabilities for claims incurred but not reportedon an actuarial basis. A change in these assumptions would cause reportedresults to differ.
Income TaxesJudgment is required to determine the annual effective income tax rate,deferred tax assets and liabilities and any valuation allowances recordedagainst net deferred tax assets. Our effective income tax rate is based onannual income, statutory tax rates and tax planning opportunities available inthe various jurisdictions in which we operate. We establish liabilities orreserves when we believe that certain positions are likely to be challenged byauthorities and we may not succeed, despite our belief that our tax returnpositions are fully supportable. We adjust these reserves in light of changingfacts and circumstances, such as the progress of a tax audit. Our annualeffective income tax rate includes the impact of reserve provisions and changesto reserves that we consider appropriate. During interim periods, this annual
(dollars in millions) Effect on U.S. Pension Plan
Decline in HigherAssumption Funded 2005
Assumption Change Status Expense
Discount rate -0.25 pts $29.8 $4.1Expected return on assets -0.25 pts N/A $1.5
Effect on U.S. Postretirement (dollars in millions) Health Care Benefits Plan
Decline in HigherAssumption Funded 2005
Assumption Change Status Expense
Discount rate -0.25 pts $5.2 $0.6
Ecolab • GO • 23
rate is then applied to our quarterly operating results. In the event that there isa significant one-time item recognized in our interim operating results, the taxattributable to that item would be separately calculated and recorded in thesame period as the one-time item.
Tax regulations require items to be included in our tax returns at differenttimes than the items are reflected in our financial statements. As a result, theeffective income tax rate reflected in our financial statements differs from thatreported in our tax returns. Some of these differences are permanent, such asexpenses that are not deductible on our tax return, and some are temporarydifferences, such as depreciation expense. Temporary differences createdeferred tax assets and liabilities. Deferred tax assets generally representitems that can be used as a tax deduction or credit in our tax return in futureyears for which we have already recorded the tax benefit in our incomestatement. We establish valuation allowances for our deferred tax assets whenthe amount of expected future taxable income is not likely to support theutilization of the deduction or credit. Deferred tax liabilities generally representitems for which we have already taken a deduction in our tax return, but havenot yet recognized that tax benefit in our financial statements. Undistributedearnings of foreign subsidiaries are considered to have been reinvestedindefinitely or available for distribution with foreign tax credits available tooffset the amount of applicable income tax and foreign withholding taxes thatmight be payable on earnings. It is impractical to determine the amount ofincremental taxes that might arise if all undistributed earnings weredistributed.
A number of years may elapse before a particular tax matter, for whichwe have established a reserve, is audited and finally resolved. The number oftax years with open tax audits varies depending on the tax jurisdiction. In theUnited States during 2004, the Internal Revenue Service completed theirexamination of our tax returns for 1999 through 2001. While it is often difficultto predict the final outcome or the timing of resolution of any tax matter, webelieve that our reserves reflect the probable outcome of known taxcontingencies. Unfavorable settlement of any particular issue would require theuse of cash. Favorable resolution could result in reduced income tax expensereported in the financial statements in the future. Our tax reserves aregenerally presented in the balance sheet within other non-current liabilities.
Long-Lived and Intangible AssetsWe periodically review our long-lived and intangible assets for impairment andassess whether significant events or changes in business circumstancesindicate that the carrying value of the assets may not be recoverable. Thiscould occur when the carrying amount of an asset exceeds the anticipatedfuture undiscounted cash flows expected to result from the use of the assetand its eventual disposition. The amount of the impairment loss to be recorded,if any, is calculated as the excess of the asset’s carrying value over itsestimated fair value. We also periodically reassess the estimated remaininguseful lives of our long-lived assets. Changes to estimated useful lives wouldimpact the amount of depreciation and amortization expense recorded inearnings. We have experienced no significant changes in the carrying value ofour long-lived assets.
Statement of Financial Accounting Standards (SFAS) No. 142, Goodwilland Other Intangible Assets, requires that goodwill and certain intangibleassets be assessed for impairment using fair value measurement techniques.Specifically, goodwill impairment is determined using a two-step process. Boththe first step of determining the fair value of a reporting unit and the secondstep of determining the fair value of individual assets and liabilities of areporting unit (including unrecognized intangible assets) are judgmental innature and often involve the use of significant estimates and assumptions.Estimates of fair value are primarily determined using discounted cash flows,
market comparisons and recent transactions. These valuation methodologiesuse significant estimates and assumptions, which include projected future cashflows (including timing), discount rate reflecting the risk inherent in future cashflows, perpetual growth rate, and determination of appropriate marketcomparables. Of the total goodwill included in our consolidated balance sheet,18 percent is recorded in our United States Cleaning & Sanitizing reportablesegment, 5 percent in our United States Other Services segment and 77 percentin our International segment.
In 2002, SFAS No. 142 became effective and as a result, we ceased toamortize goodwill in 2002. We were required to perform an initial impairmentreview of our goodwill at the beginning of 2002 under the guidelines of SFASNo. 142. The result of testing goodwill for impairment was a non-cash chargeof $4.0 million after-tax ($0.02 per share). All of the impairment charge wasrelated to our Africa/Export operations due to the difficult economicenvironment in that region. We have continued to review our goodwill forimpairment on an annual basis for all reporting units, including businessesreporting losses such as GCS Service, under the guidelines of SFAS No. 142. Ifcircumstances change significantly within a reporting unit, the company wouldtest for impairment prior to the annual test.
Functional CurrenciesIn preparing the consolidated financial statements, we are required to translatethe financial statements of our foreign subsidiaries from the currency in whichthey keep their accounting records, generally the local currency, into UnitedStates dollars. Assets and liabilities of these operations are translated at theexchange rates in effect at each fiscal year end. The translation adjustmentsrelated to assets and liabilities that arise from the use of differing exchangerates from period to period are included in accumulated other comprehensiveincome (loss) in shareholders’ equity. Income statement accounts are translatedat the average rates of exchange prevailing during the year. We evaluate ourInternational operations based on fixed rates of exchange; however, thedifferent exchange rates from period to period impact the amount of reportedincome from our consolidated operations.
OPERATING RESULTSConsolidated
Our consolidated net sales reached $4.2 billion for 2004, an increase of 11percent over net sales of $3.8 billion in 2003. Excluding acquisitions anddivestitures, consolidated net sales increased 9 percent. Changes in currencytranslation positively impacted the consolidated sales growth rate by 4.5percentage points, primarily due to the strength of the euro against the U.S.
(thousands, except per share) 2004 2003 2002
Net sales $4,184,933 $3,761,819 $3,403,585
Operating income $ 534,122 $ 482,658 $ 395,866
Income Continuing operations before
change in accounting $ 310,488 $ 277,348 $ 211,890Change in accounting (4,002)Discontinued operations 1,882
Net income $ 310,488 $ 277,348 $ 209,770
Diluted income per common share Continuing operations before
change in accounting $ 1.19 $ 1.06 $ 0.81Change in accounting (0.02)Discontinued operations 0.01
Net income $ 1.19 $ 1.06 $ 0.80
24 • GO • Ecolab
dollar. Sales also benefited from aggressive new account sales, new productand service offerings and providing more solutions for existing customers.
Our consolidated gross profit margin for 2004 increased over 2003. Theincrease is principally due to the benefits of cost savings initiatives,acquisitions and favorable raw material prices, especially in Europe.
Selling, general and administrative expenses for 2004 increased as apercentage of sales over 2003. The increase in the 2004 expense ratio isprimarily due to investments in the sales-and-service force, informationtechnology, research and development, acquisitions and higher incentive-basedcompensation costs.
Operating income for 2004 increased 11 percent over 2003. As a percentof sales, operating income remained the same as 2003. The increase inoperating income in 2004 is due to the favorable sales volume increases andcost reduction initiatives, partially offset by investments in technology, researchand development and the sales-and-service force.
Our net income was $310 million in 2004 as compared to $277 million in2003, an increase of 12 percent. Net income in both years included items of anon-recurring nature that are not necessarily indicative of future operatingresults. Net income in 2004 included benefits from a reduction in previouslyrecorded restructuring expenses of $0.6 million after tax and a gain on the saleof a small international business of $0.2 million after tax. Income tax expenseand net income in 2004 also included a tax benefit of $1.9 million related toprior years. These benefits were more than offset by a charge of $1.6 millionfor in-process research and development as part of the acquisition of AlcideCorporation and a charge of $2.4 million after tax related to the disposal of agrease management product line. Net income in 2003 included a gain on thesale of an equity investment of $6.7 million after tax and a reduction inpreviously recorded restructuring expenses of $0.8 million after tax, partiallyoffset by a write-off of $1.7 million of goodwill related to an internationalbusiness sold in 2003. If these items are excluded from both 2004 and 2003,net income increased 15 percent for 2004. This net income improvementreflects improving operating income growth across most of our divisions. Our2004 net income also benefited when compared to 2003 due to a lowereffective income tax rate which was the result of a lower international rate, taxsavings efforts and the favorable tax benefit related to prior years that wasrecorded in 2004. Excluding the items of a non-recurring nature previouslymentioned, net income for 2004 was 7.5 percent of net sales versus 7.2 percentin 2003.
2003 compared with 2002Our consolidated net sales reached $3.8 billion for 2003, an increase of 11percent over net sales of $3.4 billion in 2002. Excluding acquisitions anddivestitures, consolidated net sales increased 10 percent. Changes in currencytranslation positively impacted the consolidated sales growth rate by 7
percentage points. Sales benefited from aggressive new account sales, newproducts and selling more solutions to existing customers.
Our consolidated gross profit margin in 2003 increased over 2002. In2002, cost of sales included $9.0 million of restructuring costs. If these costswere excluded, the gross profit margin for 2002 would have been 50.7 percent.The increase in the margin for 2003 also benefited from business mix and costreduction actions, partially offset by poor results in GCS Service during 2003.
Selling, general and administrative expenses for 2003 increased as apercentage of sales over 2002. The increase in the 2003 expense ratio isprimarily due to an increase in sales-and-service investments, rising insurancecosts, increased headcount and health care costs and start-up expenses relatedto legal entity restructuring, partially offset by cost savings initiatives.
In the first quarter of 2002, we approved plans to undertake restructuringcost-saving actions. Restructuring savings were approximately $31 million and$16 million in 2003 and 2002, respectively. Most of these savings werereinvested in the business.
Operating income for 2003 increased 22 percent over 2002. Excludingspecial charges in 2002 of $46 million, operating income in 2003 increased 9percent over 2002. Adjusting for special charges, operating income in 2002would have been 13.0 percent of net sales. The decline in 2003 operatingincome margins from this level reflects increased headcount and benefit costsand investments in the sales force, partially offset by favorable sales volumeincreases and cost reduction initiatives.
Our net income was $277 million in 2003 as compared to $210 million in2002, an increase of 32 percent. Net income in 2003 included a gain on thesale of an equity investment of $6.7 million after tax and a reduction ofpreviously recorded restructuring expenses of $0.8 million after tax, offset by awrite-off of $1.7 million of goodwill related to an international business sold in2003. Net income in 2002 included a gain from discontinued operations of $1.9million after tax, offset by special charges of $28.9 million after tax and a SFASNo. 142 transitional impairment charge of $4.0 million after tax. These itemsare of a non-recurring nature and are not necessarily indicative of futureoperating results. If these items are excluded from both 2003 and 2002, netincome increased 13 percent for 2003. This improvement in net incomereflected good fixed-rate operating income growth in our Internationalsegment, particularly in Europe. Currency translation also positively impactednet income by approximately $12 million due primarily to the strength of theeuro against the U.S. dollar. The comparison of net income benefited from alower effective income tax rate in 2003 which was the result of cost savingsinitiatives, a lower overall international rate and improved international mix.Excluding the items of a non-recurring nature previously mentioned, net incomefor 2003 was 7.2 percent of net sales, up slightly from 7.1 percent in 2002.
OPERATING SEGMENT PERFORMANCEOur operating segments have similar products and services and we areorganized to manage our operations geographically. Our operating segmentshave been aggregated into three reportable segments: United States Cleaning& Sanitizing, United States Other Services and International. We evaluate theperformance of our International operations based on fixed management ratesof currency exchange. Therefore, International sales and operating incometotals, as well as the International financial information included in thisfinancial discussion, are based on translation into U.S. dollars at the fixedcurrency exchange rates used by management for 2004. All other accountingpolicies of the reportable segments are consistent with accounting principlesgenerally accepted in the United States of America and the accounting policiesof the company described in Note 2 of the notes to consolidated financialstatements. Additional information about our reportable segments is includedin Note 16 of the notes to consolidated financial statements.
2004 2003 2002
Gross profit as a percent ofnet sales 51.5% 50.9% 50.4%
Selling, general & administrative expenses as a percent of net sales 38.6% 38.1% 37.7%
(thousands) 2004 2003 2002
Operating income $534,122 $482,658 $395,866
Operating income as a percent of net sales 12.8% 12.8% 11.6%
Ecolab • GO • 25
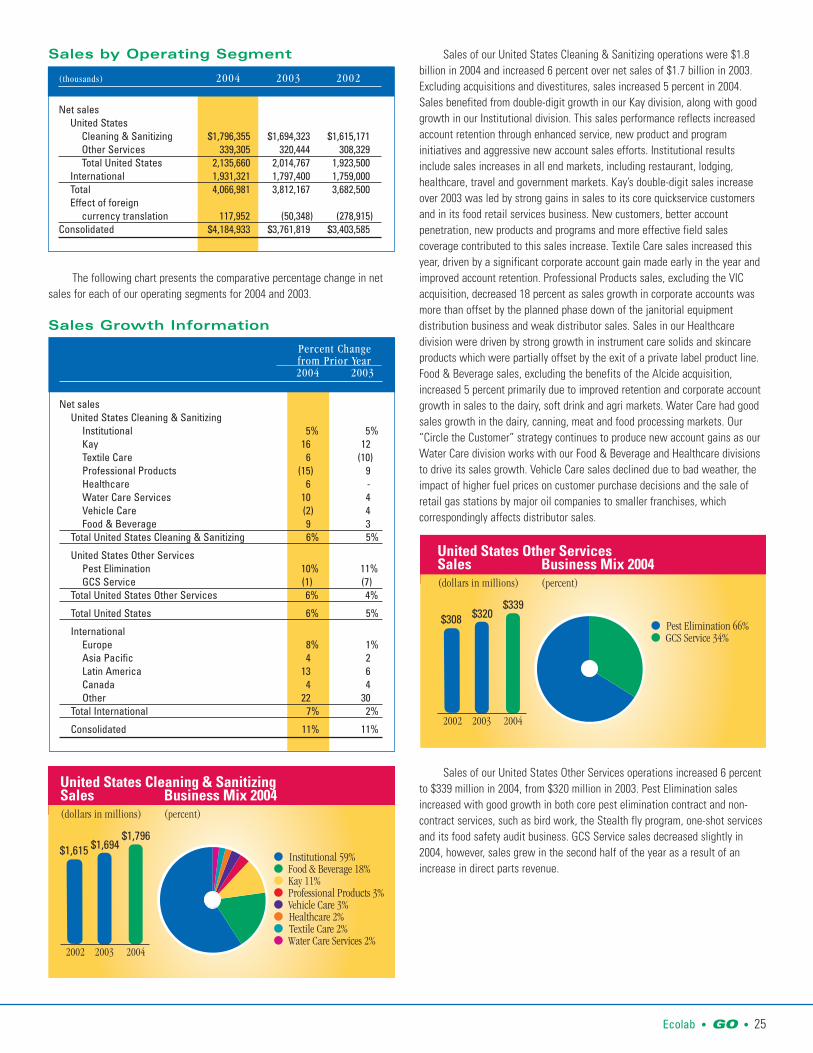
Sales by Operating Segment
The following chart presents the comparative percentage change in netsales for each of our operating segments for 2004 and 2003.
Sales Growth Information
Sales of our United States Cleaning & Sanitizing operations were $1.8billion in 2004 and increased 6 percent over net sales of $1.7 billion in 2003.Excluding acquisitions and divestitures, sales increased 5 percent in 2004.Sales benefited from double-digit growth in our Kay division, along with goodgrowth in our Institutional division. This sales performance reflects increasedaccount retention through enhanced service, new product and programinitiatives and aggressive new account sales efforts. Institutional resultsinclude sales increases in all end markets, including restaurant, lodging,healthcare, travel and government markets. Kay’s double-digit sales increaseover 2003 was led by strong gains in sales to its core quickservice customersand in its food retail services business. New customers, better accountpenetration, new products and programs and more effective field salescoverage contributed to this sales increase. Textile Care sales increased thisyear, driven by a significant corporate account gain made early in the year andimproved account retention. Professional Products sales, excluding the VICacquisition, decreased 18 percent as sales growth in corporate accounts wasmore than offset by the planned phase down of the janitorial equipmentdistribution business and weak distributor sales. Sales in our Healthcaredivision were driven by strong growth in instrument care solids and skincareproducts which were partially offset by the exit of a private label product line.Food & Beverage sales, excluding the benefits of the Alcide acquisition,increased 5 percent primarily due to improved retention and corporate accountgrowth in sales to the dairy, soft drink and agri markets. Water Care had goodsales growth in the dairy, canning, meat and food processing markets. Our“Circle the Customer” strategy continues to produce new account gains as ourWater Care division works with our Food & Beverage and Healthcare divisionsto drive its sales growth. Vehicle Care sales declined due to bad weather, theimpact of higher fuel prices on customer purchase decisions and the sale ofretail gas stations by major oil companies to smaller franchises, whichcorrespondingly affects distributor sales.
Sales of our United States Other Services operations increased 6 percentto $339 million in 2004, from $320 million in 2003. Pest Elimination salesincreased with good growth in both core pest elimination contract and non-contract services, such as bird work, the Stealth fly program, one-shot servicesand its food safety audit business. GCS Service sales decreased slightly in2004, however, sales grew in the second half of the year as a result of anincrease in direct parts revenue.
Percent Change from Prior Year 2004 2003
Net salesUnited States Cleaning & Sanitizing
Institutional 5% 5%Kay 16 12Textile Care 6 (10)Professional Products (15) 9Healthcare 6 -Water Care Services 10 4Vehicle Care (2) 4Food & Beverage 9 3
Total United States Cleaning & Sanitizing 6% 5%
United States Other ServicesPest Elimination 10% 11%GCS Service (1) (7)
Total United States Other Services 6% 4%
Total United States 6% 5%
InternationalEurope 8% 1%Asia Pacific 4 2Latin America 13 6Canada 4 4Other 22 30
Total International 7% 2%
Consolidated 11% 11%
United States Cleaning & SanitizingSales Business Mix 2004
● Institutional 59%● Food & Beverage 18%● Kay 11%● Professional Products 3%● Vehicle Care 3%● Healthcare 2%● Textile Care 2%● Water Care Services 2%
(dollars in millions) (percent)
2002 2003 2004
$1,796$1,615 $1,694
United States Other ServicesSales Business Mix 2004
● Pest Elimination 66%● GCS Service 34%
(dollars in millions) (percent)
2002 2003 2004
$339$308 $320
(thousands) 2004 2003 2002
Net salesUnited States
Cleaning & Sanitizing $1,796,355 $1,694,323 $1,615,171Other Services 339,305 320,444 308,329Total United States 2,135,660 2,014,767 1,923,500
International 1,931,321 1,797,400 1,759,000Total 4,066,981 3,812,167 3,682,500Effect of foreign
currency translation 117,952 (50,348) (278,915)Consolidated $4,184,933 $3,761,819 $3,403,585

26 • GO • Ecolab
Management rate sales of our International operations reached $1.9billion in 2004, an increase of 7 percent over sales of $1.8 billion in 2003.Excluding acquisitions and divestitures, sales increased 4 percent for 2004.Sales in Europe, excluding acquisitions and divestitures, were up 3 percentprimarily due to successful new product launches, increased marketing andadded sales-and-service headcount that was partially offset by the effects of aweak European economy. Europe’s Institutional division made significantimprovement over their 2003 trend, and strength in their Healthcare and TextileCare businesses helped overcome Germany’s poor economic climate andreduced European tourism and beverage consumption. Sales in Asia Pacific,excluding divestitures, increased 5 percent, led by good results in East Asia andNew Zealand. In Northeast Asia, China and Hong Kong led the sales increasewith strong results in both Institutional and Food & Beverage. New Zealandsales increased over last year primarily due to growth in the Food & Beveragebusiness. Sales in Japan and Australia were flat versus 2003. Sales growth inLatin America reflected good growth in all countries and was driven by thesuccess in new business gains in global/regional accounts, continuing toimplement the Circle the Customer growth strategy and the successful launchof new programs such as MarketGuard and LaunderCare. Sales in Canadaincreased, reflecting an improved hospitality industry and recovery from theimpact of the Severe Acute Respiratory Syndrome (SARS) outbreak in Canada in2003.
Operating Income by Operating Segment
Operating income of our United States Cleaning & Sanitizing operationswas $290 million in 2004, an increase of 2 percent from operating income of$285 million in 2003. As a percentage of net sales, operating income decreasedfrom 16.8 percent in 2003 to 16.2 percent in 2004. Excluding acquisitions anddivestitures, operating income declined 1 percent from 2003 and the operatingincome margin also declined from 17.2 percent in 2003 to 16.2 percent in 2004.This decline is primarily due to investments in the sales-and-service force,research and development, information technology, higher incentive-basedcompensation costs and higher delivered product cost. This was partially offsetby favorable business mix and cost efficiency improvements. The number ofsales-and service associates in our United States Cleaning & Sanitizingoperations declined by 60 people in 2004, as the addition of 190 newassociates was offset by a decrease of 250 people due to the divestiture of ourgrease management product line.
Operating income of United States Other Services operations increased 16percent to $24 million in 2004. The operating income margin for United StatesOther Services increased to 7.2 percent in 2004 from 6.6 percent in 2003. PestElimination had strong operating income growth, while GCS Service resultsreflected a slightly higher operating loss. The increase in operating income forPest Elimination was driven by increased sales volume, lower product cost andgeneral expense controls. GCS Service results reflected an operating loss due toa decline in sales, increased marketing expenses and higher than expectedcosts resulting from centralizing the parts and administration activities. During2004, we added 15 sales-and-service associates to our United States OtherServices operations. This is net of a decrease in GCS Service technicians.
Management-rate based operating income of International operations rose12 percent to $211 million in 2004 from operating income of $188 million in2003. The International operating income margin increased from 10.5 percent in2003 to 10.9 percent in 2004. Excluding the impact of acquisitions anddivestitures occurring in 2004 and 2003, operating income increased 8 percentover 2003, and the International operating income margin increased from 10.4percent in 2003 to 10.8 percent in 2004. This result was due to good operatingincome growth and margin improvement across all of our international regions.Both higher sales and careful cost management drove this achievement. Weadded 640 sales-and-service associates to our International operations during2004, reflecting our investment in our core business and the impact ofacquisitions.
Operating income margins of our International operations are less thanthose realized for our U.S. operations. The lower International margins are dueto (i) the additional costs caused by the difference in scale of Internationaloperations where many operating locations are smaller in size, (ii) the additionalcost of operating in numerous and diverse foreign jurisdictions and (iii) highercosts of importing raw materials and finished goods. Proportionately largerinvestments in sales, technical support and administrative personnel are alsonecessary in order to facilitate the growth of our International operations.
2003 compared with 2002Sales of our United States Cleaning & Sanitizing operations were $1.7 billion in2003 and increased 5 percent over net sales of $1.6 billion in 2002. Businessacquisitions had no effect on the growth in sales for 2003. Sales benefited fromgood growth in our Kay and Professional Products operations, partially offset bylower sales in Textile Care. The increase in our Institutional division reflectedour continued efforts to generate new accounts, the successful introduction ofnew products and improved customer service. Trends in the foodservice,hospitality and healthcare industries were challenging in early 2003 but showedsigns of improvement late in the year. Kay’s sales increase reflected solidgrowth in its food retail services business and to quickservice restaurants aswell as through the introduction of new products and programs. Textile Care
InternationalSales Business Mix 2004
● Europe 70%● Asia Pacific 16%● Latin America 6%● Canada 6%● Other 2%
(dollars in millions) (percent)
2002 2003 2004
$1,931$1,759 $1,797
(thousands) 2004 2003 2002
Operating incomeUnited States
Cleaning & Sanitizing $ 290,366 $ 285,212 $ 271,838Other Services 24,432 21,031 33,051Total United States 314,798 306,243 304,889
International 210,595 187,864 165,182Total 525,393 494,107 470,071Corporate (4,361) (4,834) (46,008)Effect of foreign
currency translation 13,090 (6,615) (28,197)Consolidated $ 534,122 $ 482,658 $ 395,866
Operating income as apercent of net sales United States
Cleaning & Sanitizing 16.2% 16.8% 16.8%Other Services 7.2 6.6 10.7Total 14.7 15.2 15.9
International 10.9 10.5 9.4Consolidated 12.8% 12.8% 11.6%
Ecolab • GO • 27
sales decreased, particularly to distributors, due to soft industry demand andstrong competition within the industry. Textile Care focused on improving itsservice and reestablishing its relationships with distributors in an effort toincrease sales growth. Textile Care also continued to take a selective approachto new business to ensure it meets our profit guidelines. Sales of ProfessionalProducts increased due to strong gains in the healthcare market offsetting thecontinuing phase-out of the specialty business. Our introduction of the firstsolid-based product offering to the acute care market in the second quarter of2003 helped drive the sales growth in the healthcare market. ProfessionalProducts’ janitorial sales were also positively impacted in 2003 by a long-termsupply agreement that began in December 2002. Effective January 2004, ourProfessional Products division was reorganized to better serve janitorial andhealthcare customers by splitting the Professional Products division into twodivisions, Professional Products and Healthcare. Our Food & Beverage saleswere driven by improved retention and corporate account growth in the dairy,soft drink, meat and poultry and food markets. This increase was partiallyoffset by a decrease in agricultural sales due to overall market weakness.Water Care Services had good growth in sales to the food and beverage,hospitality, healthcare and commercial accounts due to solid gains in newcustomer accounts. Vehicle Care sales were driven by new business with majoroil companies and successful new product introductions.
Sales of our United States Other Services operations increased 4 percentto $320 million in 2003, from $308 million in 2002. Business acquisitions hadno effect on the growth in sales for 2003. Pest Elimination’s sales in 2003reflected strong growth in both contract sales, due to the addition of new largeaccounts, and non-contract services, due to the aggressive efforts of the salesforce. GCS Service sales decreased in 2003 due to service interruptions causedby the restructuring of field operations and the transition to a new centralizedadministration center, which began operation in 2003. In an effort to increasesales going forward, GCS Service implemented productivity improvementmeasures in the fourth quarter of 2003.
Management rate sales for our International segment were $1.8 billionfor 2003, an increase of 2 percent over sales in 2002. Excluding the effects ofacquisitions and divestitures, sales increased 1 percent. Sales in Europe,excluding the effects of acquisitions and divestitures, decreased 1 percent.Successful new housekeeping and Ecotemp programs were offset by a weakEuropean economy and strong competition. We focused on expanding our PestElimination business in Europe through acquisitions such as the Terminixoperations in the United Kingdom, which was purchased in December 2002,and Nigiko with operations in France, acquired in January 2004. We expect toleverage the success of this business in the United States to become a globalprovider of pest elimination services. The increase in Asia Pacific was driven byJapan, New Zealand and Northeast Asia. In Japan, sales to chain restaurantsand resort hotel customers improved and New Zealand showed strong growthin its pest elimination services business. In Northeast Asia, Korea’s growth waspropelled by strong Institutional sales while China experienced excellentgrowth in its Food & Beverage sales. Good growth in these areas was partiallyoffset by a sales decline in Australia due to soft Food & Beverage and WaterCare business. Sales in Latin America, excluding acquisitions, grew 6 percent in2003 and most Latin America countries experienced good growth exceptVenezuela, where a country-wide strike at the beginning of 2003 resulted invirtually no sales for the first two fiscal months of 2003. Mexico, the Caribbeanand Central America all had double-digit sales growth in 2003. Growth in LatinAmerica was fueled by good growth in food retail programs, a demand forimproved sanitation and expansion of pest elimination services. Sales inCanada increased due to continued focus on obtaining new customers andselling additional solutions to existing customers, partially offset by the impactof the Severe Acute Respiratory Syndrome (SARS) outbreak in Canada.
Operating income of our United States Cleaning & Sanitizing operations
increased 5 percent in 2003. Operating income as a percent of sales remainedthe same in 2003 as 2002 due to the investments in developing the sales forceand higher operating costs being offset by cost savings initiatives. We added100 sales-and-service associates to our United States Cleaning & Sanitizingoperations during 2003.
Operating income of United States Other Services operations decreased36 percent. As a percentage of net sales, operating income decreasedsignificantly as well. Pest Elimination had strong operating income growth,while GCS Service results reflected an operating loss. Strong growth in bothcontract and non-contract services, coupled with tight expense control, hashelped fuel Pest Elimination’s growth. GCS Service results reflected anoperating loss due to a decrease in sales resulting from operational issuesencountered with a transition to a centralized administration center and therelated costs invested in this initiative. This lost revenue adversely impactedoperating income due to the relatively fixed nature of GCS Service’s expenses.During 2003, we added 95 sales-and-service associates to our United StatesOther Services operations.
Operating income of our International operations rose 14 percent in 2003at management rates. Excluding the effects of acquisitions and divestitures,operating income increased 12 percent. Our International operating incomemargin also increased in 2003 over 2002. Operating income as a percent of netsales excluding acquisitions and divestitures that occurred in 2003 and 2002was 10.8 in 2003 versus 9.8 in 2002. This result was due to good operatingincome growth and margin improvement in our European, Asia Pacific andCanadian businesses. Operating income growth was also good in LatinAmerica. The primary reason for these significant improvements was thesuccessful introduction of new products and programs as well as careful costmanagement. We added 80 sales-and-service associates to our Internationaloperations during 2003.
CorporateOur corporate operating expenses totaled $4.4 million in 2004, compared with$4.8 million in 2003 and $46.0 million in 2002. In 2004, corporate operatingexpense included a charge of $1.6 million for in-process research anddevelopment as part of the acquisition of Alcide Corporation and a charge of$4.0 million related to the disposal of a grease management product line,which were partially offset by $0.9 million of income for reductions inrestructuring accruals and a $0.3 million gain on the sale of a smallinternational business. Corporate operating expense in 2003 included a write-off of $1.7 million of goodwill related to an international business sold in 2003,$1.4 million of income for reductions in restructuring accruals and $4.5 millionof expense for postretirement death benefits for retired executives. In 2002,corporate operating expense included restructuring and merger integrationcosts of $51.8 million, which were partially offset by a curtailment gain of $5.8million related to benefit plan changes.
Interest and Income TaxesNet interest expense of $45 million was flat when compared to interestexpense in 2003 with a slight decrease in interest expense being offset by asimilar decrease in interest income. Higher interest expense on our eurodenominated debt due to the stronger euro was offset by lower interestexpense on other notes payable.
Net interest expense for 2003 was $45 million, an increase of 3 percentover net interest expense of $44 million in 2002. The increase was primarilydue to our euro-denominated debt and the strength of the euro against the U.S.dollar partially offset by lower debt levels.
Our effective income tax rate was 36.5 percent for 2004, compared witheffective income tax rates of 38.1 percent and 39.8 percent in 2003 and 2002,respectively. Excluding the effects of special charges mentioned above in the

28 • GO • Ecolab
corporate section and a $1.9 million tax benefit related to prior years, theestimated annual effective income tax rate was 36.8 percent for 2004.Excluding the effects of the gain on the sale of an equity investment and theeffect of special charges, the effective income tax rate was 38.0 percent for2003. Excluding the effects of special charges in 2002, the estimated annualeffective income tax rate was 39.5 percent. Reductions in our effective incometax rates over the last two years have primarily been due to a lower overallinternational rate, favorable international mix and tax savings efforts. Thecompany’s acquisition of its European operations at the end of 2001 resulted inadditional tax saving opportunities.
FINANCIAL POSITIONOur debt continued to be rated within the “A” categories by the major ratingagencies during 2004. Significant changes in our financial position during 2004and 2003 included the following:
During 2004, total assets increased 15 percent to $3.7 billion from $3.2billion at year-end 2003. Acquisitions added approximately $233 million inassets to the balance sheet. Also, assets increased by approximately $181million related to the strengthening of foreign currencies, primarily the euro. Ofthe increase in accounts receivable, 53 percent is due to acquisitions andcurrency. The increase in goodwill is 65 percent due to acquisitions and 35percent due to currency. The increase in other assets is primarily due to the $37million voluntary contribution made in 2004 to fund the U.S. pension plan.
Total liabilities increased approximately $220 million in 2004. Again,acquisitions and currency accounted for a large portion of this increase,approximately 71 percent.
Total assets reached $3.2 billion at December 31, 2003, an increase of 13percent over total assets of $2.9 billion at year-end 2002. Approximately $290million of this increase was related to the strengthening of foreign currencies,primarily the euro. For example, 87 percent of the increase in accountsreceivable was related to currency. The increase in goodwill in 2003 over 2002was almost entirely related to currency. Other assets also increasedsignificantly in 2003 due to a $75 million contribution to fund our U.S. pensionplan.
In the liability section of the balance sheet, short-term debt decreasedsignificantly in 2003 from 2002 due to strong operating cash flow, whichallowed us to pay down approximately $94 million of our short-term debt.Income taxes payable increased in 2003 over 2002 due to higher current incometax expense for 2003 as compared to 2002 and lower income tax paymentsmade during the year compared to the prior year. Long-term debt also increasedin 2003 due to currency as a large portion of our debt is denominated in euros.
Total debt was $702 million at December 31, 2004 and increased fromtotal debt of $675 million at year-end 2003. This increase in total debt during2004 was principally due to an increase in our euronotes due to the
strengthening of the euro being partially offset by repayments of notes payablemade during 2004. As of December 31, 2004 the ratio of total debt tocapitalization was 31 percent, down from 34 percent at year-end 2003 and 39percent at year-end 2002. The lower debt to capitalization ratio in 2004 and2003 was due to debt repayments made during those years and increasingshareholders’ equity levels.
CASH FLOWSCash provided by operatingactivities reached a record high of$582 million for 2004, an increasefrom $529 million in 2003 and$423 million in 2002. Theincrease in operating cash flowfor 2004 over 2003 is due toincreasing net income and asmaller contribution to the U.S.pension plan compared to 2003.The increase was partially offsetby an increase in U.S. income taxpayments in 2004 over 2003. Theoperating cash flow for 2003increased over 2002 also due tohigher net income in 2003 and alower contribution to the pensionplan compared to 2002. Operatingcash flows for 2003 were alsohigher than 2002 due to reduced payments on restructuring liabilities and lowerestimated tax payments due to tax benefits on options exercised during 2003.Historically, we have had strong operating cash flows and we anticipate thiswill continue. We expect to continue to use this cash flow to acquire newbusinesses, repurchase our common stock, invest in merchandising equipmentand other capital assets and pay down debt.
Cash flows used for investing activities included capital expenditures of$276 million in 2004, $212 million in 2003 and $213 million in 2002. Worldwideadditions of merchandising equipment, primarily cleaning and sanitizing productdispensers, accounted for approximately 58 percent, 69 percent and 63 percentof each year’s capital expenditures in 2004, 2003 and 2002, respectively.Merchandising equipment is depreciated over 3 to 7 year lives. Cash used forbusinesses acquired included Nigiko, Daydots International, Elimco and certainbusiness lines for VIC International in 2004, Adams Healthcare in 2003 andTerminix Ltd., Kleencare Hygiene and Audits International in 2002.
Financing cash flow activity included cash used to reacquire shares of ourcommon stock and pay dividends as well as cash provided and used through ourdebt arrangements. Share repurchases totaled $165 million in 2004, $227million in 2003 and $9 million in 2002. These repurchases were funded withoperating cash flows and cash from the exercise of employee stock options. InOctober 2003 and December 2004, we announced authorizations to repurchaseup to an aggregate of 20 million additional shares of Ecolab common stock forthe purpose of offsetting the dilutive effect of shares issued for stock optionexercises and incentives and for general corporate purposes.
Total Debt to Capitalization
● Shareholders’ Equity 69%● Total Debt 31%
(percent) (percent)
2002 2003 2004
31%
39%34%
2000 2001 2002 2003 2004
$582
$315$364
$423
$529
Cash Provided byOperating Activities(dollars in millions)

Ecolab • GO • 29
In 2004, we increased our annual dividend rate for the thirteenthconsecutive year. We have paid dividends on our common stock for 68consecutive years. Cash dividends declared per share of common stock, byquarter, for each of the last three years were as follows:
LIQUIDITY AND CAPITAL RESOURCESWe currently expect to fund all of the requirements which are reasonablyforeseeable for 2005, including new program investments, scheduled debtrepayments, dividend payments, possible business acquisitions, pensioncontributions and share repurchases from operating activities, cash reservesand short-term borrowings. In the event of a significant acquisition, fundingmay occur through additional long-term borrowings. Cash provided by operatingactivities reached an all time high of $582 million in 2004. While cash flowscould be negatively affected by a decrease in revenues, we do not believe thatour revenues are highly susceptible, over the short run, to rapid changes intechnology within our industry. We have a $450 million U.S. commercial paperprogram and a $200 million European commercial paper program. Bothprograms are rated A-1 by Standard & Poor’s and P-1 by Moody’s. To supportour commercial paper programs and other general business funding needs, wemaintain a $450 million multi-year committed credit agreement which expiresin August 2009 and under certain circumstances can be increased by $150million for a total of $600 million. We can draw directly on the credit facility ona revolving credit basis. As of December 31, 2004, approximately $9 million ofthis credit facility was committed to support outstanding commercial paper,leaving $441 million available for other uses. In addition, we have othercommitted and uncommitted credit lines of approximately $209 million withmajor international banks and financial institutions to support our generalglobal funding needs. Additional details on our credit facilities are included inNote 7 of the notes to consolidated financial statements.
During 2004, we voluntarily contributed $37 million to our U.S. pensionplan. In making this contribution, we considered the normal growth in accruedplan benefits, the impact of lower year-end discount rates on the plan liability,the 10 percent actual asset return on our pension plan in 2004 and the taxdeductibility of the contribution. Our contributions to the pension plan did nothave a material effect on our consolidated results of operations, financialcondition or liquidity. We expect our U.S. pension plan expense to increase to$35 million in 2005 from $21 million in 2004 primarily due to the decrease inour discount rate from 6.25 percent to 5.75 percent and the decrease in ourexpected long-term return on plan assets from 9.00 percent to 8.75 percent.
We do not have relationships with unconsolidated entities or financialpartnerships, such as entities often referred to as “structured finance” or“special purposes entities”, which are sometimes established for the purposeof facilitating off-balance sheet financial arrangements or other contractuallynarrow or limited purposes. As such, we are not exposed to any financing,liquidity, market or credit risk that could arise if we had engaged in suchrelationships.
A schedule of our obligations under various notes payable, long-term debtagreements, operating leases with noncancelable termsin excess of one year,interest obligations and benefit payments are summarized in the followingtable:
We are not required to make any contributions to our U.S. pension andpostretirement health care benefit plans in 2005. The maximum tax deductiblecontribution for 2005 is $45 million for our U.S. pension plan. Our best estimateof contributions to be made to our international plans is $17 million in 2005.These amounts have been excluded from the schedule of contractualobligations.
We lease sales and administrative office facilities, distribution centerfacilities, computers and other equipment under longer-term operating leases.Vehicle leases are generally shorter in duration. The U.S. vehicle leases haveguaranteed residual value requirements that have historically been satisfied bythe proceeds on the sale of the vehicles. No amounts have been recorded forthese guarantees in the table above as we believe that the potential recoveryof value from the vehicles when sold will be greater than the residual valueguarantee.
Except for approximately $48 million of letters of credit supportingdomestic and international commercial relationships and transactions and asdescribed in Note 7 of the notes to the consolidated financial statements, wedo not have significant unconditional purchase obligations, or significant othercommercial commitments, such as commitments under lines of credit, standbyletters of credit, guarantees, standby repurchase obligations or othercommercial commitments.
As of year-end 2004, we are in compliance with all covenants and otherrequirements of our credit agreements and indentures. Additionally, we do nothave any rating triggers that would accelerate the maturity dates of our debt.
A downgrade in our credit rating could limit or preclude our ability toissue commercial paper under our current programs. A credit rating downgradecould also adversely affect our ability to renew existing, or negotiate newcredit facilities in the future and could increase the cost of these facilities.Should this occur, we could seek additional sources of funding, includingissuing term notes or bonds. In addition, we have the ability at our option todraw upon our $450 million committed credit facilities prior to their terminationand, under certain conditions, can increase this amount to $600 million.
MARKET RISKWe enter into contractual arrangements (derivatives) in the ordinary course ofbusiness to manage foreign currency exposure and interest rate risks. We donot enter into derivatives for trading purposes. Our use of derivatives is subjectto internal policies that provide guidelines for control, counterparty risk andongoing monitoring and reporting and is designed to reduce the volatility
(thousands) Payments due by Period
Less MoreContractual than 1-3 3-5 than
obligations Total 1 Year Years Years 5 Years
Notes payable $ 50,980 $ 50,980 $ - $ - $ -Long-term debt 650,597 5,152 487,972 2,695 154,778Operating leases 153,089 40,709 58,154 32,255 21,971Interest* 121,384 38,529 47,988 22,013 12,854Benefit payments** 526,000 39,000 83,000 96,000 308,000Total contractual
cash obligations $ 1,502,050 $ 174,370 $ 677,114 $ 152,963 $ 497,603
* Interest on variable rate debt was calculated using the interest rate at year-end 2004.** Benefit payments are paid out of the company’s pension and post retirementhealthcare benefit plans.
First Second Third FourthQuarter Quarter Quarter Quarter Year
2004 $ 0.0800 $ 0.0800 $ 0.0800 $ 0.0875 $ 0.32752003 0.0725 0.0725 0.0725 0.0800 0.29752002 0.0675 0.0675 0.0675 0.0725 0.2750

30 • GO • Ecolab
associated with movements in foreign exchange and interest rates on ourincome statement.
We enter into forward contracts, swaps and foreign currency options tohedge certain intercompany financial arrangements, and to hedge against theeffect of exchange rate fluctuations on transactions related to cash flows andnet investments denominated in currencies other than U.S. dollars. AtDecember 31, 2004, we had approximately $239 million of foreign currencyforward exchange contracts with face amounts denominated primarily in euros.
We manage interest expense using a mix of fixed and floating rate debt.To help manage borrowing costs, we may enter into interest rate swapagreements. Under these arrangements, we agree to exchange, at specifiedintervals, the difference between fixed and floating interest amountscalculated by reference to an agreed-upon notional principal amount. At year-end 2004, we had an interest rate swap that converts approximately euro 78million (approximately $104 million U.S. dollars) of our Euronote debt from afixed interest rate to a floating or variable interest rate. This swap agreementis effective until February 2007. In September 2003, we entered into an interestrate swap agreement that converts $30 million of the 7.19% senior notes froma fixed interest rate to a floating or variable interest rate. This agreement iseffective until January 2006.
Based on a sensitivity analysis (assuming a 10 percent adverse change inmarket rates) of our foreign exchange and interest rate derivatives and otherfinancial instruments, changes in exchange rates or interest rates would notmaterially affect our financial position and liquidity. The effect on our results ofoperations would be substantially offset by the impact of the hedged items.
SUBSEQUENT EVENTSIn January 2005, we acquired Associated Chemicals & Services, Inc. (akaMidland Research Laboratories), a Kansas-based provider of water treatmentproducts, process chemicals and services serving the commercial, institutional,industrial, food and sugar processing markets. Midland has annual sales ofapproximately $16 million. These operations will become part of the company’sU.S. Cleaning & Sanitizing operations in 2005.
FORWARD-LOOKING STATEMENTS AND RISK FACTORSThis financial discussion and other portions of this Annual Report toShareholders contain various “Forward-Looking Statements” within themeaning of the Private Securities Litigation Reform Act of 1995. These includeexpectations concerning business progress and expansion, businessacquisitions, currency translation, cash flows, debt repayments, sharerepurchases, susceptibility to changes in technology, global economicconditions and liquidity requirements. These statements, which represent ourexpectations or beliefs concerning various future events, are based on currentexpectations. Therefore, they involve a number of risks and uncertainties thatcould cause actual results to differ materially from those of such Forward-Looking Statements. These risks and uncertainties include the vitality of thefoodservice, hospitality, travel, health care and food processing industries;restraints on pricing flexibility due to competitive factors, customer or vendorconsolidations, and existing contractual obligations; changes in oil or rawmaterial prices or unavailability of adequate and reasonably priced rawmaterials or substitutes therefor; the occurrence of capacity constraints or theloss of a key supplier or the inability to obtain or renew supply agreements onfavorable terms; the effect of future acquisitions or divestitures or othercorporate transactions; our ability to achieve plans for past acquisitions; thecosts and effects of complying with: (i) laws and regulations relating to theenvironment and to the manufacture, storage, distribution, efficacy andlabeling of our products, and (ii) changes in tax, fiscal, governmental and other
regulatory policies; economic factors such as the worldwide economy, interestrates and currency movements, including, in particular, our exposure to foreigncurrency risk; the occurrence of (a) litigation or claims, (b) the loss or insolvencyof a major customer or distributor, (c) war (including acts of terrorism orhostilities which impact our markets), (d) natural or manmade disasters, or (e)severe weather conditions or public health epidemics affecting the foodservice,hospitality and travel industries; loss of, or changes in, executive management;our ability to continue product introductions or reformulations andtechnological innovations; and other uncertainties or risks reported from timeto time in our reports to the Securities and Exchange Commission. In addition,we note that our stock price can be affected by fluctuations in quarterlyearnings. There can be no assurances that our earnings levels will meetinvestors’ expectations. We undertake no duty to update our Forward-LookingStatements.

Ecolab • GO • 31
Year ended December 31 (thousands, except per share) 2004 2003 2002
Net sales $4,184,933 $3,761,819 $3,403,585
Operating expenses Cost of sales (including special charges (income) of ($106) in 2004,
($76) in 2003 and $8,977 in 2002) 2,031,280 1,845,202 1,687,597Selling, general and administrative expenses 1,615,064 1,433,551 1,283,091Special charges 4,467 408 37,031
Operating income 534,122 482,658 395,866Gain on sale of equity investment 11,105 Interest expense, net 45,344 45,345 43,895
Income from continuing operations before income taxes 488,778 448,418 351,971Provision for income taxes 178,290 171,070 140,081
Income from continuing operations before cumulative effect of change in accounting 310,488 277,348 211,890Cumulative effect of change in accounting (4,002)Gain from discontinued operations 1,882
Net income $ 310,488 $ 277,348 $ 209,770
Basic income per common shareIncome from continuing operations before change in accounting $ 1.21 $ 1.07 $ 0.82Change in accounting (0.02)Gain from discontinued operations 0.01Net income $ 1.21 $ 1.07 $ 0.81
Diluted income per common shareIncome from continuing operations before change in accounting $ 1.19 $ 1.06 $ 0.81Change in accounting (0.02)Gain from discontinued operations 0.01Net income $ 1.19 $ 1.06 $ 0.80
Weighted-average common shares outstandingBasic 257,575 259,454 258,147Diluted 261,776 262,737 261,574
Consolidated Statement of Income
The accompanying notes are an integral part of the consolidated financial statements.

32 • GO • Ecolab
December 31 (thousands, except per share) 2004 2003 2002
ASSETSCurrent assets
Cash and cash equivalents $ 71,231 $ 85,626 $ 49,205Accounts receivable, net 738,266 626,002 553,154Inventories 338,603 309,959 291,506Deferred income taxes 76,038 75,820 71,147Other current assets 54,928 52,933 50,925
Total current assets 1,279,066 1,150,340 1,015,937
Property, plant and equipment, net 834,730 736,797 680,265
Goodwill 991,811 797,211 695,700
Other intangible assets, net 229,095 203,859 188,670
Other assets, net 381,472 340,711 285,335
Total assets $3,716,174 $3,228,918 $2,865,907
LIABILITIES AND SHAREHOLDERS’ EQUITYCurrent liabilities
Short-term debt $ 56,132 $ 70,203 $ 160,099Accounts payable 269,561 212,287 205,665Compensation and benefits 231,856 190,386 184,239Income taxes 22,709 59,829 12,632Other current liabilities 359,289 319,237 291,193
Total current liabilities 939,547 851,942 853,828
Long-term debt 645,445 604,441 539,743
Postretirement health care and pension benefits 270,930 249,906 207,596
Other liabilities 297,733 227,203 164,989
Shareholders’ equity (common stock, par value $1.00 per share; shares outstanding: 2004 – 257,542; 2003 – 257,417 and 2002 – 129,940) 1,562,519 1,295,426 1,099,751
Total liabilities and shareholders’ equity $3,716,174 $3,228,918 $2,865,907
Consolidated Balance Sheet
The accompanying notes are an integral part of the consolidated financial statements.

Ecolab • GO • 33
Year ended December 31 (thousands) 2004 2003 2002
OPERATING ACTIVITIESNet income $310,488 $277,348 $209,770Cumulative effect of change in accounting 4,002Gain from discontinued operations (1,882)Income from continuing operations 310,488 277,348 211,890
Adjustments to reconcile income from continuing operations to cash providedby operating activities:
Depreciation 213,523 201,512 194,840Amortization 33,859 28,144 28,588Deferred income taxes 24,309 42,455 49,923Gain on sale of equity investment (11,105)Disposal loss, net 3,691Charge for in-process research and development 1,600Special charges – asset disposals 1,684 6,180Other, net (2,507) 1,837 1,835Changes in operating assets and liabilities:
Accounts receivable (47,217) (5,547) 78Inventories (5,481) (2,902) (3,567)Other assets (31,723) (39,224) (141,926)Accounts payable 34,841 (13,329) (8,860)Other liabilities 47,081 48,326 84,345
Cash provided by operating activities 582,464 529,199 423,326
INVESTING ACTIVITIESCapital expenditures (275,871) (212,035) (212,757)Property disposals 18,373 8,502 6,788Capitalized software expenditures (9,688) (8,951) (4,490)Businesses acquired and investments in affiliates, net of cash acquired (129,822) (31,726) (62,825)Sale of businesses and assets 3,417 27,130Cash used for investing activities (393,591) (217,080) (273,284)
FINANCING ACTIVITIESNet repayments of notes payable (17,474) (94,412) (368,834)Long-term debt borrowings 7,325 5,959 261,039Long-term debt repayments (6,632) (13,270) (1,257)Reacquired shares (165,414) (227,145) (8,894)Cash dividends on common stock (82,419) (75,413) (69,583)Exercise of employee stock options 59,989 126,615 45,531Other, net (800) (313) (1,746)Cash used for financing activities (205,425) (277,979) (143,744)
Effect of exchange rate changes on cash 2,157 2,281 1,114
INCREASE (DECREASE) IN CASH AND CASH EQUIVALENTS (14,395) 36,421 7,412Cash and cash equivalents, beginning of year 85,626 49,205 41,793Cash and cash equivalents, end of year $ 71,231 $ 85,626 $ 49,205
Consolidated Statement of Cash Flows
The accompanying notes are an integral part of the consolidated financial statements.
34 • GO • Ecolab
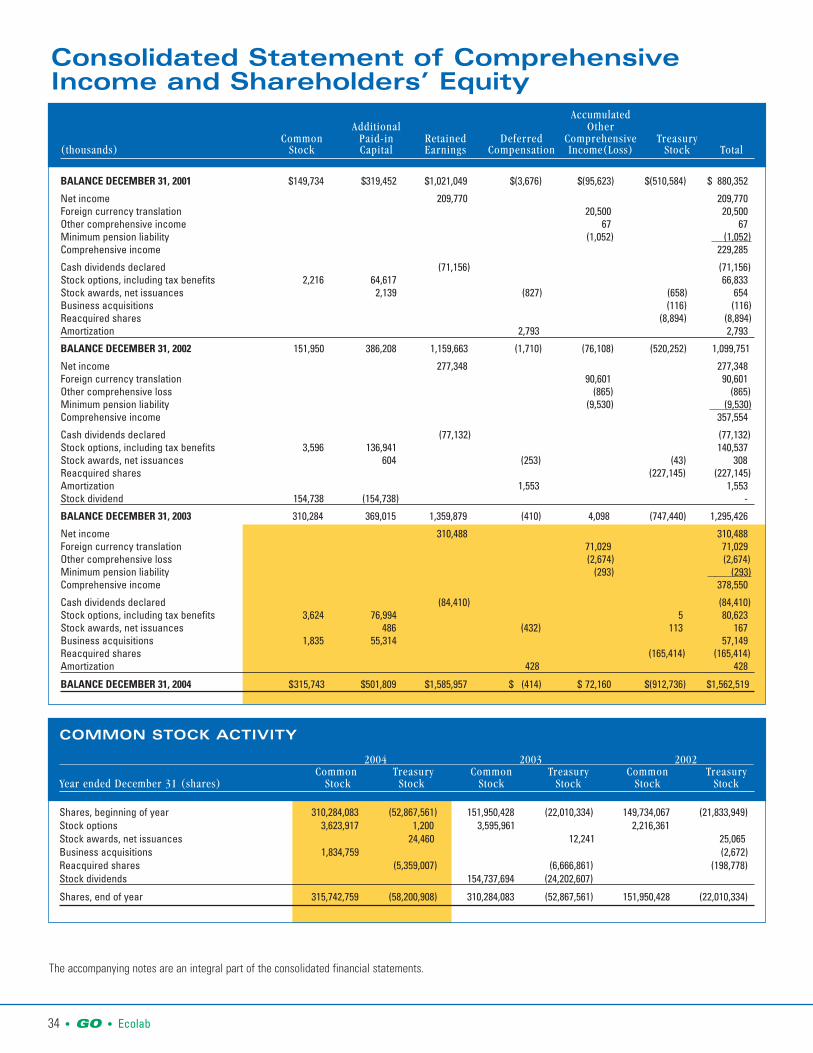
AccumulatedAdditional Other
Common Paid-in Retained Deferred Comprehensive Treasury(thousands) Stock Capital Earnings Compensation Income(Loss) Stock Total
BALANCE DECEMBER 31, 2001 $149,734 $319,452 $1,021,049 $(3,676) $(95,623) $(510,584) $ 880,352
Net income 209,770 209,770Foreign currency translation 20,500 20,500Other comprehensive income 67 67Minimum pension liability (1,052) (1,052)Comprehensive income 229,285
Cash dividends declared (71,156) (71,156)Stock options, including tax benefits 2,216 64,617 66,833Stock awards, net issuances 2,139 (827) (658) 654Business acquisitions (116) (116)Reacquired shares (8,894) (8,894)Amortization 2,793 2,793
BALANCE DECEMBER 31, 2002 151,950 386,208 1,159,663 (1,710) (76,108) (520,252) 1,099,751
Net income 277,348 277,348Foreign currency translation 90,601 90,601Other comprehensive loss (865) (865)Minimum pension liability (9,530) (9,530)Comprehensive income 357,554
Cash dividends declared (77,132) (77,132)Stock options, including tax benefits 3,596 136,941 140,537Stock awards, net issuances 604 (253) (43) 308Reacquired shares (227,145) (227,145)Amortization 1,553 1,553Stock dividend 154,738 (154,738) -
BALANCE DECEMBER 31, 2003 310,284 369,015 1,359,879 (410) 4,098 (747,440) 1,295,426
Net income 310,488 310,488Foreign currency translation 71,029 71,029Other comprehensive loss (2,674) (2,674) Minimum pension liability (293) (293)Comprehensive income 378,550
Cash dividends declared (84,410) (84,410)Stock options, including tax benefits 3,624 76,994 5 80,623Stock awards, net issuances 486 (432) 113 167Business acquisitions 1,835 55,314 57,149Reacquired shares (165,414) (165,414)Amortization 428 428
BALANCE DECEMBER 31, 2004 $315,743 $501,809 $1,585,957 $ (414) $ 72,160 $(912,736) $1,562,519
Consolidated Statement of ComprehensiveIncome and Shareholders’ Equity
The accompanying notes are an integral part of the consolidated financial statements.
COMMON STOCK ACTIVITY
2004 2003 2002 Common Treasury Common Treasury Common Treasury
Year ended December 31 (shares) Stock Stock Stock Stock Stock Stock
Shares, beginning of year 310,284,083 (52,867,561) 151,950,428 (22,010,334) 149,734,067 (21,833,949)Stock options 3,623,917 1,200 3,595,961 2,216,361Stock awards, net issuances 24,460 12,241 25,065Business acquisitions 1,834,759 (2,672)Reacquired shares (5,359,007) (6,666,861) (198,778)Stock dividends 154,737,694 (24,202,607)
Shares, end of year 315,742,759 (58,200,908) 310,284,083 (52,867,561) 151,950,428 (22,010,334)
Ecolab • GO • 35
NOTE 1. NATURE OF BUSINESS
Ecolab Inc. (the “company”) develops and markets premium products andservices for the hospitality, foodservice, institutional and industrial markets.The company provides cleaning, sanitizing, pest elimination, maintenance andrepair products, systems and services primarily to hotels and restaurants;healthcare and educational facilities; quickservice (fast-food and conveniencestores) units; grocery stores; commercial and institutional laundries; lightindustry; dairy plants and farms; food and beverage processors; pharmaceuticaland cosmetic facilities; and the vehicle wash industry.
NOTE 2. SUMMARY OF SIGNIFICANTACCOUNTING POLICIES
Principles of ConsolidationThe consolidated financial statements include the accounts of the company andall majority-owned subsidiaries. International subsidiaries are included in thefinancial statements on the basis of their November 30 fiscal year-ends tofacilitate the timely inclusion of such entities in the company’s consolidatedfinancial reporting. All intercompany transactions and profits are eliminated inconsolidation.
Foreign Currency Translation Financial position and results of operations of the company’s internationalsubsidiaries generally are measured using local currencies as the functional currency. Assets and liabilities of these operations are translated at theexchange rates in effect at each fiscal year end. The translation adjustmentsrelated to assets and liabilities that arise from the use of differing exchangerates from period to period are included in accumulated other comprehensiveincome (loss) in shareholders’ equity. The cumulative translation gain as ofyear-end 2004 and 2003 was $87,093,000 and $16,064,000, respectively. Thecumulative translation loss as of year-end 2002 was $74,537,000. Incomestatement accounts are translated at the average rates of exchange prevailingduring the year. The different exchange rates from period to period impact theamount of reported income from the company’s international operations.
Cash and Cash EquivalentsCash equivalents include highly-liquid investments with a maturity of threemonths or less when purchased.
Allowance for Doubtful AccountsThe company estimates the balance of allowance for doubtful accounts byanalyzing accounts receivable balances by age and applying historical write-offtrend rates to the most recent 12 months’ sales, less actual write-offs to date.The company estimates include separately providing for specific customerbalances when it is deemed probable that the balance is uncollectible.Account balances are charged off against the allowance when it is probablethe receivable will not be recovered.
The company’s allowance for doubtful accounts balance includes anallowance of approximately $6 million for the expected return of productsshipped, credits related to pricing or quantities shipped. All of this returns andcredits activity is recorded directly to accounts receivable or sales.
The following table summarizes the activity in the allowance for doubtfulaccounts:
Inventory Valuations Inventories are valued at the lower of cost or market. Domestic chemicalinventory costs are determined on a last-in, first-out (lifo) basis. Lifo inventoriesrepresented 30 percent, 29 percent and 30 percent of consolidated inventoriesat year-end 2004, 2003 and 2002, respectively. All other inventory costs aredetermined on a first-in, first-out (fifo) basis.
Property, Plant and Equipment Property, plant and equipment are stated at cost. Merchandising equipmentconsists principally of various systems that dispense the company’s cleaningand sanitizing products and dishwashing machines. The dispensing systems areaccounted for on a mass asset basis, whereby equipment is capitalized anddepreciated as a group and written off when fully depreciated. Depreciation ischarged to operations using the straight-line method over the assets’ estimateduseful lives ranging from 5 to 50 years for buildings, 3 to 7 years formerchandising equipment, and 3 to 11 years for machinery and equipment.
Expenditures for repairs and maintenance are charged to expense asincurred. Expenditures for major renewals and betterments, which significantlyextend the useful lives of existing plant and equipment, are capitalized anddepreciated. Upon retirement or disposition of plant and equipment, the costand related accumulated depreciation are removed from the accounts and anyresulting gain or loss is recognized in income.
Goodwill and Other Intangible Assets Goodwill and other intangible assets arise principally from businessacquisitions. Goodwill represents the excess of the purchase price over the fairvalue of identifiable net assets acquired. Other intangible assets includeprimarily customer relationships, trademarks, patents and other technology. Thefair value of identifiable intangible assets is estimated based upon discountedfuture cash flow projections. Other intangible assets are amortized on astraight-line basis over their estimated economic lives. The weighted-averageuseful life of other intangible assets was 13 years, 12 years and 15 years as ofDecember 31, 2004, 2003 and 2002, respectively.
The weighted-average useful life by class at December 31, 2004 is asfollows:
The straight-line method of amortization reflects an appropriate allocationof the cost of the intangible assets to earnings in proportion to the amount of
Notes to Consolidated Financial Statements
(thousands) 2004 2003 2002
Beginning balance $44,011 $35,995 $30,297Bad debt expense 14,278 18,403 17,220Write-offs (16,504) (14,056) (13,754)Other* 2,414 3,669 2,232
Ending balance $44,199 $44,011 $35,995
* Other amounts are primarily the effects of changes in currency.
Number of Years
Customer relationships 11Intellectual property 15Trademarks 20Other 5
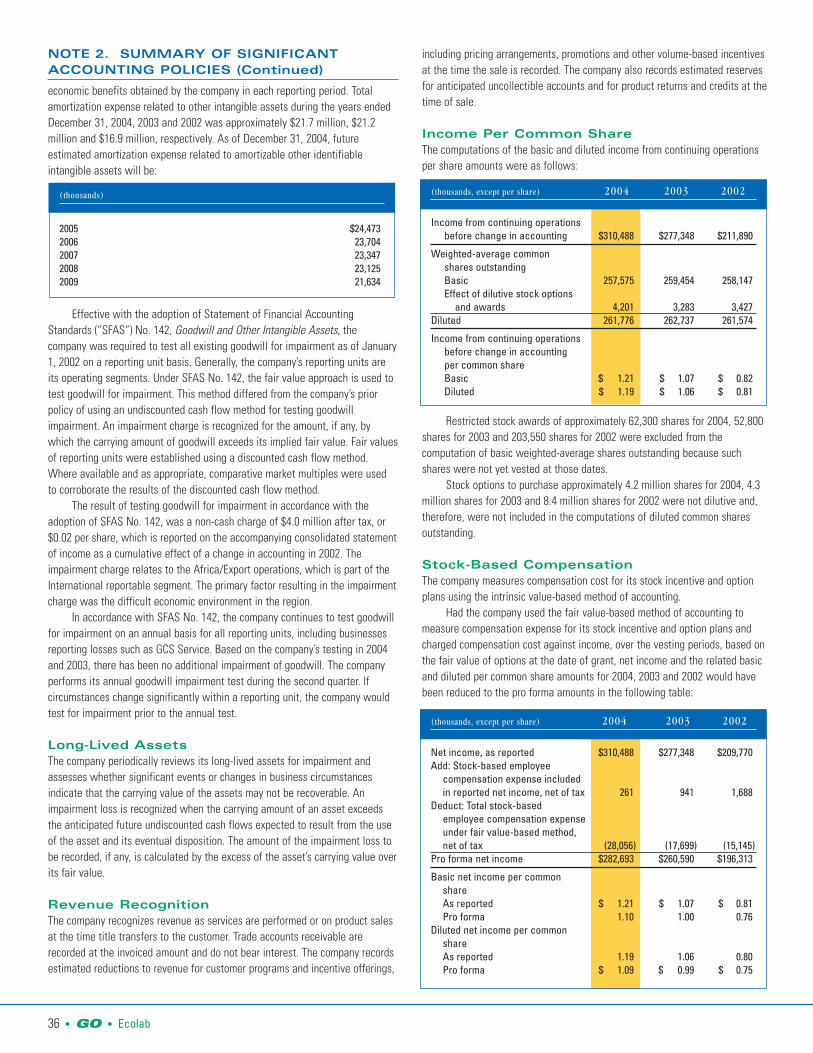
36 • GO • Ecolab
NOTE 2. SUMMARY OF SIGNIFICANTACCOUNTING POLICIES (Continued)
economic benefits obtained by the company in each reporting period. Totalamortization expense related to other intangible assets during the years endedDecember 31, 2004, 2003 and 2002 was approximately $21.7 million, $21.2million and $16.9 million, respectively. As of December 31, 2004, futureestimated amortization expense related to amortizable other identifiableintangible assets will be:
Effective with the adoption of Statement of Financial AccountingStandards (“SFAS”) No. 142, Goodwill and Other Intangible Assets, thecompany was required to test all existing goodwill for impairment as of January1, 2002 on a reporting unit basis. Generally, the company’s reporting units areits operating segments. Under SFAS No. 142, the fair value approach is used totest goodwill for impairment. This method differed from the company’s priorpolicy of using an undiscounted cash flow method for testing goodwillimpairment. An impairment charge is recognized for the amount, if any, bywhich the carrying amount of goodwill exceeds its implied fair value. Fair valuesof reporting units were established using a discounted cash flow method.Where available and as appropriate, comparative market multiples were usedto corroborate the results of the discounted cash flow method.
The result of testing goodwill for impairment in accordance with theadoption of SFAS No. 142, was a non-cash charge of $4.0 million after tax, or$0.02 per share, which is reported on the accompanying consolidated statementof income as a cumulative effect of a change in accounting in 2002. Theimpairment charge relates to the Africa/Export operations, which is part of theInternational reportable segment. The primary factor resulting in the impairmentcharge was the difficult economic environment in the region.
In accordance with SFAS No. 142, the company continues to test goodwillfor impairment on an annual basis for all reporting units, including businessesreporting losses such as GCS Service. Based on the company’s testing in 2004and 2003, there has been no additional impairment of goodwill. The companyperforms its annual goodwill impairment test during the second quarter. Ifcircumstances change significantly within a reporting unit, the company wouldtest for impairment prior to the annual test.
Long-Lived AssetsThe company periodically reviews its long-lived assets for impairment andassesses whether significant events or changes in business circumstancesindicate that the carrying value of the assets may not be recoverable. Animpairment loss is recognized when the carrying amount of an asset exceedsthe anticipated future undiscounted cash flows expected to result from the useof the asset and its eventual disposition. The amount of the impairment loss tobe recorded, if any, is calculated by the excess of the asset’s carrying value overits fair value.
Revenue RecognitionThe company recognizes revenue as services are performed or on product salesat the time title transfers to the customer. Trade accounts receivable arerecorded at the invoiced amount and do not bear interest. The company recordsestimated reductions to revenue for customer programs and incentive offerings,
including pricing arrangements, promotions and other volume-based incentivesat the time the sale is recorded. The company also records estimated reservesfor anticipated uncollectible accounts and for product returns and credits at thetime of sale.
Income Per Common ShareThe computations of the basic and diluted income from continuing operationsper share amounts were as follows:
Restricted stock awards of approximately 62,300 shares for 2004, 52,800shares for 2003 and 203,550 shares for 2002 were excluded from thecomputation of basic weighted-average shares outstanding because suchshares were not yet vested at those dates.
Stock options to purchase approximately 4.2 million shares for 2004, 4.3million shares for 2003 and 8.4 million shares for 2002 were not dilutive and,therefore, were not included in the computations of diluted common sharesoutstanding.
Stock-Based Compensation The company measures compensation cost for its stock incentive and optionplans using the intrinsic value-based method of accounting.
Had the company used the fair value-based method of accounting tomeasure compensation expense for its stock incentive and option plans andcharged compensation cost against income, over the vesting periods, based onthe fair value of options at the date of grant, net income and the related basicand diluted per common share amounts for 2004, 2003 and 2002 would havebeen reduced to the pro forma amounts in the following table:
(thousands)
2005 $24,4732006 23,7042007 23,3472008 23,1252009 21,634
(thousands, except per share) 2004 2003 2002
Income from continuing operations before change in accounting $310,488 $277,348 $211,890
Weighted-average commonshares outstanding Basic 257,575 259,454 258,147Effect of dilutive stock options
and awards 4,201 3,283 3,427 Diluted 261,776 262,737 261,574
Income from continuing operations before change in accounting per common shareBasic $ 1.21 $ 1.07 $ 0.82Diluted $ 1.19 $ 1.06 $ 0.81
(thousands, except per share) 2004 2003 2002
Net income, as reported $310,488 $277,348 $209,770Add: Stock-based employee
compensation expense included in reported net income, net of tax 261 941 1,688
Deduct: Total stock-based employee compensation expense under fair value-based method, net of tax (28,056) (17,699) (15,145)
Pro forma net income $282,693 $260,590 $196,313
Basic net income per common shareAs reported $ 1.21 $ 1.07 $ 0.81Pro forma 1.10 1.00 0.76
Diluted net income per common shareAs reported 1.19 1.06 0.80Pro forma $ 1.09 $ 0.99 $ 0.75

Ecolab • GO • 37
Pro forma net income for 2004 includes approximately $0.03 per share ofafter-tax expense related to the acceleration of vesting and issuance of optionsunder a reload feature associated with executive retirements.
Note 10 to the consolidated financial statements contains the significantassumptions used in determining the underlying fair value of options.
Comprehensive IncomeComprehensive income includes net income, foreign currency translationadjustments, minimum pension liabilities, gains and losses on derivativeinstruments designated and effective as cash flow hedges and nonderivativeinstruments designated and effective as foreign currency net investmenthedges that are charged or credited to the accumulated other comprehensiveincome (loss) account in shareholders’ equity.
Derivative Instruments and HedgingActivitiesThe company uses foreign currency forward contracts, interest rate swaps andforeign currency debt to manage risks generally associated with foreignexchange rates, interest rates and net investments in foreign operations. Thecompany does not hold derivative financial instruments of a speculative nature.On the date that the company enters into a derivative contract, it designatesthe derivative as (1) a hedge of (a) the fair value of a recognized asset orliability or (b) an unrecognized firm commitment (a “fair value” hedge), (2) ahedge of (a) a forecasted transaction or (b) the variability of cash flows that areto be received or paid in connection with a recognized asset or liability (a “cashflow” hedge); or (3) a foreign-currency fair-value or cash flow hedge (a “foreigncurrency” hedge). The company formally documents all relationships betweenhedging instruments and hedged items, as well as its risk-managementobjective and strategy for undertaking various hedge transactions. Thecompany also formally assesses (both at the hedge’s inception and on anongoing basis) whether the derivatives that are used in hedging transactionshave been highly effective in offsetting changes in the fair value or cash flowsof hedged items and whether those derivatives may be expected to remainhighly effective in future periods. When it is determined that a derivative is not(or has ceased to be) highly effective as a hedge, the company will discontinuehedge accounting prospectively. The company believes that on an ongoingbasis its portfolio of derivative instruments will generally be highly effective ashedges. Hedge ineffectiveness during the years ended December 31, 2004,2003 and 2002 was not significant.
All of the company’s derivatives are recognized on the balance sheet attheir fair value. The earnings impact resulting from the change in fair value ofthe derivative instruments is recorded in the same line item in the consolidatedstatement of income as the underlying exposure being hedged.
Use of EstimatesThe preparation of the company’s financial statements requires management tomake certain estimates and assumptions that affect the reported amounts ofassets and liabilities as of the date of the financial statements and thereported amounts of revenues and expenses during the reporting periods.Actual results could differ from these estimates.
New Accounting PronouncementsIn December 2003, The Financial Accounting Standards Board (“FASB”) issueda revision to SFAS No. 132, Employers’ Disclosures about Pensions and OtherPost Retirement Benefits, which requires additional disclosures about theassets, obligations, cash flows and period benefit costs of defined benefitpension plans and other defined benefit post retirement plans. The companyadopted these provisions for domestic plans in 2003 and, as permitted underthe standard, for international plans in 2004. Note 15 presents the new
disclosure requirements.In March 2004, the FASB issued Emerging Issues Task Force (EITF) No. 03-
01, The Meaning of Other-Than-Temporary Impairment and its Application toCertain Investments, which provides new guidance for assessing impairmentlosses on debt and equity investments. The new impairment model applies toinvestments accounted for under the cost or equity method and investmentsaccounted for under SFAS No. 115, Accounting for Certain Investments in Debtand Equity Securities. EITF No. 03-01 also includes new disclosurerequirements for cost method investments and for all investments that are inan unrealized loss position. In September 2004, the FASB delayed theaccounting provisions of EITF No. 03-01; however the disclosure requirementsremain effective and the applicable ones have been adopted for the company’syear-end 2004. The company does not expect this guidance to have asignificant impact on its consolidated financial statements.
In December 2004, the FASB issued SFAS No. 123 (Revised 2004) Share-Based Payments (“SFAS No. 123R”). SFAS No. 123R addresses all forms ofshare-based payment awards, including shares issued under employee stockpurchase plans, stock options, restricted stock and stock appreciation rights.SFAS No. 123R will require the company to expense share-based paymentawards with compensation cost measured at the fair value of the award. SFASNo. 123R requires the company to adopt the new accounting provisionsbeginning in the third quarter of 2005. The company expects to restate priorperiod results as part of its transition to the new standard in line with to thepro forma amounts shown in Note 2 under Stock-Based Compensation.
In May 2004, the FASB issued a FASB Staff Position (“FSP”) regardingSFAS No. 106, Employers’ Accounting for Postretirement Benefits Other thanPensions. FSP No. 106-2, Accounting and Disclosure Requirements Related tothe Medicare Prescription Drug, Improvement and Modernization Act of 2003,discusses the effect of the Medicare Prescription Drug, Improvement andModernization Act (the “Act”) enacted in April 2004 and supersedes FSP No.106-1, which was issued in January 2004. FSP No. 106-2 considers the effectof the two new features introduced in the Act in determining our accumulatedpostretirement benefit obligation (“APBO”) and net periodic postretirementbenefit cost. The effect on the APBO will be accounted for as an actuarialexperience gain to be amortized into income over the average remainingservice period of plan participants. The company’s adoption of FSP No. 106-2 inthe third quarter of 2004 resulted in an after-tax reduction of the net periodicpension cost of approximately $1.0 million and a reduction of the benefitobligation of $15.5 million during 2004.
In November 2004, the FASB issued SFAS No. 151, Inventory Costs – anamendment of ARB No. 43 (“SFAS No. 151”), which is the result of its effortsto converge U.S. accounting standards for inventories with InternationalAccounting Standards. SFAS No. 151 requires idle facility expenses, freight,handling costs, and wasted material (spoilage) costs to be recognized ascurrent-periodic charges. It also requires that allocation of fixed productionoverheads to the costs of conversion be based on the normal capacity of theproduction facilities. SFAS No. 151 will be effective for inventory costs incurredduring fiscal years beginning after June 15, 2005. The company is evaluatingthe impact of this standard and currently does not expect it to have asignificant impact on its consolidated financial statements.
In December 2004, the FASB issued SFAS No. 153, Exchanges ofNonmonetary Assets – an Amendment of APB Opinion No. 29, (“SFAS No.153”). SFAS No. 153 amends APB Opinion No. 29 to eliminate the exception fornonmonetary exchanges of similar productive assets and replaces it with ageneral exception for exchanges of nonmonetary assets that do not havecommercial substance. A nonmonetary exchange has commercial substance ifthe future cash flows of the entity are expected to change significantly as aresult of the exchange. SFAS No. 153 will be effective for nonmonetary assetexchanges occurring in fiscal periods beginning after June 15, 2005. The

38 • GO • Ecolab
NOTE 2. SUMMARY OF SIGNIFICANTACCOUNTING POLICIES (Continued)
company is currently evaluating the impact of this standard and does not expectit to have a significant impact on its consolidated financial statements.
In December 2004, the FASB issued an FSP regarding Application of FASBStatement No. 109, Accounting for Income Taxes, to the Tax Deduction onQualified Production Activities Provided by the American Jobs Creation Act of2004, SFAS 109-1. Under the guidance in SFAS No. 109-1, the deduction will betreated as a “special deduction” as described in SFAS No. 109. As such, thespecial deduction has no effect on deferred tax assets and liabilities existing atthe enactment date. Rather, the impact of this deduction will be reported in theperiod in which the deduction is claimed on the company’s tax return. Thecompany expects to benefit from this deduction with a modest benefit beginningin 2005.
In December 2004, the FASB issued an FSP regarding Accounting andDisclosure Guidance for the Foreign Earnings Repatriation Provision within theAmerican Jobs Creation Act of 2004 (“AJCA”), SFAS No. 109-2. SFAS No. 109-2allows the company time beyond the fourth quarter of 2004, the period ofenactment, to evaluate the effect of the AJCA on its plans for reinvestment orrepatriation of foreign earnings for purposes of applying SFAS No. 109,Accounting for Income Taxes. The AJCA includes a deduction for 85 percent ofcertain foreign earnings that are repatriated, as defined in the AJCA, at aneffective tax cost of 5.25 percent on any such repatriated foreign earnings.Companies may elect to apply this provision to qualifying earnings repatriationsin fiscal 2005. The company has begun an evaluation of the effects of therepatriation provisions; however, the company does not expect to be able tocomplete this evaluation until Congress or the Treasury Department providesadditional clarifying language on key elements of the provision. The companyexpects to complete its evaluation of the effects of the repatriation provisionwithin a reasonable period of time following the publication of the additionalclarifying language.
NOTE 3. SPECIAL CHARGES
In the first quarter of 2002, management approved plans to undertakerestructuring and cost saving actions during 2002, including costs related to theintegration of the company’s European operations. These actions included globalworkforce reductions, facility closings and product line discontinuations. As aresult, the company recorded restructuring expense of $47,767,000 ($29,867,000after tax) for the year ended December 31, 2002. This includes $36,366,000 foremployee termination benefits, $6,180,000 for asset disposals and $5,221,000for other charges. The company also incurred merger integration costs of$4,032,000 ($2,521,000 after tax) related to European and other operations.Restructuring and merger integration costs have been included as “specialcharges” on the consolidated statement of income with a portion of restructuring expenses included as a component of “cost of sales”. Amountsincluded as a component of “cost of sales” include asset disposals of$6,180,000 and manufacturing related severance of $2,797,000 for the yearended December 31, 2002.
Also included in “special charges” on the consolidated statement ofincome for the year ended December 31, 2002 is a one-time curtailment gain of$5,791,000 ($3,501,000 after tax), related to changes to postretirementhealthcare benefits made in the first quarter of 2002.
Restructuring liabilities are classified as a component of other currentliabilities.
Employee termination benefit expenses in 2002 included 695 net personnelreductions through voluntary and involuntary terminations, with the possibilitythat some of these people may be replaced. Individuals were affected throughfacility closures and consolidation primarily within the corporate administrative,
operations and research and development functions. Asset disposals include inventory and property, plant, and equipment
charges. Inventory charges for the year ended December 31, 2002 were$2,391,000 and reflect the discontinuance of product lines which are notconsistent with the company’s long-term strategies. Property, plant andequipment charges during the year ended December 31, 2002 were $3,789,000and reflect the downsizing and closure of production facilities as well as globalchanges to manufacturing and distribution operations in connection with theintegration of European operations.
Other charges of $5,221,000 for the year ended December 31, 2002,include lease termination costs and other miscellaneous exit costs.
The company recorded restructuring and merger integration chargesthroughout 2002 and completed these activities by December 31, 2002.
During 2004 and 2003, restructuring activity includes the reversal of$927,000 and $1,359,000, respectively, of previously accrued severance andother costs as project expenses were favorable to previous estimates. Of thisamount, for 2004 and 2003, $106,000 and $76,000, respectively, is included as acomponent of cost of sales and $821,000 and $1,283,000, respectively, isincluded as a component of “special charges”.
Also included in “special charges” for 2004 is a charge $1.6 million of in-process research and development related to the Alcide acquisition, a loss of$4.0 million ($2.4 million after tax) on the disposal of a grease managementproduct line and a gain of $0.3 million ($0.2 million after tax) on the disposal ofa small international business. For 2003, “special charges” also includes awrite-off of $1.7 million of goodwill related to an international business.
For segment reporting purposes, each of these items has been included inthe company’s corporate segment, which is consistent with the company’sinternal management reporting. Changes to the restructuring liability accountsincluded the following:
NOTE 4. GAIN FROM DISCONTINUEDOPERATION
During the first quarter of 2002, the company resolved a legal issue related tothe disposal of its ChemLawn business in 1992. This resulted in the recognitionof a gain from discontinued operations of $1,882,000 (net of income tax benefitof $1,079,000), or $0.01 per diluted share during the year ended December 31,2002.
EmployeeTermination Asset
(thousands) Benefits Disposals Other Total
Restructuring liability,December 31, 2001 $ 0 $ 0 $ 0 $ 0
Initial expense and accrual 36,366 6,180 5,221 47,767Cash payments (16,033) (1,711) (17,744)Non-cash charges (6,180) (6,180)Restructuring liability,
December 31, 2002 20,333 0 3,510 23,843
Cash payments (16,770) (2,471) (19,241)Non-cash credits 7 7Revisions to prior estimates (1,352) (7) (1,359)Effect of foreign currency
translation 1,222 670 1,892Restructuring liability,
December 31, 2003 3,433 0 1,709 5,142
Cash payments (3,130) (1,374) (4,504)Revisions to prior estimates (490) (437) (927)Effect of foreign currency
translation 187 102 289Restructuring liability,
December 31, 2004 $ 0 $ 0 $ 0 $ 0

Ecolab • GO • 39
NOTE 5. RELATED PARTY TRANSACTIONS
Henkel KGaA (“Henkel”) beneficially owned 72.7 million shares, orapproximately 28.2 percent, of the company’s outstanding common stock onDecember 31, 2004. Under a stockholders’ agreement between the companyand Henkel, Henkel is permitted ownership in the company of up to 35 percentof the company’s outstanding common stock. Henkel is also entitled toproportionate representation on the company’s board of directors.
In 2004, 2003 and 2002, the company and its affiliates sold products andservices in the aggregate amounts of $3,222,000, $3,426,000 and $6,986,000,respectively, to Henkel or its affiliates, and purchased products and services inthe amounts of $70,946,000, $71,265,000 and $74,192,000, respectively, fromHenkel or its affiliates. The transactions with Henkel and its affiliates arenegotiated at arm’s length.
NOTE 6. BUSINESS ACQUISITIONS ANDDISPOSITIONS
Business AcquisitionsBusiness acquisitions made by the company during 2004, 2003 and 2002 wereas follows:
The total cash consideration paid by the company for acquisitions andinvestments in affiliates was approximately $130 million, $32 million and $63million for 2004, 2003 and 2002, respectively. In addition, 1,834,759 shares ofcommon stock were issued with a market value of $57 million in the Alcideacquisition, plus $23,000 of cash in lieu of fractional shares. Total cash paidalso includes payments of restructuring costs related to the acquisition of theremaining 50 percent interest of the former Henkel-Ecolab joint venture thatwere accrued in 2002. The aggregate purchase price has been reduced for anycash or cash equivalents acquired with the acquisitions.
These acquisitions have been accounted for as purchases and,accordingly, the results of their operations have been included in the financialstatements of the company from the dates of acquisition. Net sales andoperating income of these businesses were not significant to the company’sconsolidated results of operations, financial position and cash flows.
Based upon purchase price allocations, the components of the aggregatepurchase prices of the acquisitions made, the allocation of the purchase priceswere as follows:
The allocation of purchase price includes adjustments to preliminaryallocations from prior periods, if any. During 2004, the company recorded acharge of $1.6 million for in-process research and development (“IPR&D”) aspart of the allocation of purchase price in the Alcide acquisition. The valueassigned to IPR&D is based on an independent appraiser’s valuation and wasdetermined by identifying research projects in areas for which technologicalfeasibility had not been established and no alternative uses for the technologyexisted. The values were determined by estimating the discounted amount ofafter-tax cash flows attributable to these projects. The future cash flows werediscounted to present value utilizing a risk-adjusted rate of return thatconsidered the uncertainty surrounding the successful development of theIPR&D.
In January 2005, the company acquired Associated Chemicals & Services,Inc. (aka Midland Research Laboratories), a Kansas-based provider of watertreatment products, process chemicals and services serving the commercial,institutional, industrial, food and sugar processing markets. Midland hasannual sales of approximately $16 million. These operations will become partof the company’s United States Cleaning & Sanitizing operations in 2005.
EstimatedEcolab Annual Sales
Operating Prior toBusiness Date of Segment – Type AcquisitionAcquired Acquisition of Business (millions)
(unaudited)2004Nigiko Jan. 2004 Europe (Pest $55
Elimination)
Daydots International Feb. 2004 Institutional 22
Elimco May 2004 Europe (Pest 4Elimination)
Restoration and Maintenance unit of VIC International June 2004 Professional 5
Products
Alcide Corporation July 2004 Food & Beverage 24
2003Adams Healthcare Dec. 2002 Europe 19
(Healthcare)
2002Kleencare Hygiene Jan. 2002 Europe (Food 30
& Beverage)
Audits International Jan. 2002 Pest 3Elimination
Terminix Ltd. Sept. 2002 Europe (Pest 65Elimination)
(millions) 2004 2003
Net tangible assets acquired $ 14 $18Identifiable intangible assets 44 13In-process research and development 2Goodwill 127 1Purchase price $187 $32

40 • GO • Ecolab
NOTE 6. BUSINESS ACQUISITIONS ANDDISPOSITIONS (Continued)
The changes in the carrying amount of goodwill for each of the company’sreportable segments for the years ended December 31, 2004, 2003 and 2002are as follows:
Business DispositionsIn April 2004, the company sold its grease management product line toNational Fire Services of Gurnee, Illinois. This sale resulted in a loss ofapproximately $4.0 million ($2.4 million after tax). Sales of the greasemanagement product line totaled approximately $20 million in 2003 and wereincluded in the company’s U.S. Cleaning & Sanitizing operations. The companyalso recognized a gain of $0.3 million ($0.2 million after tax) on the sale of asmall Hygiene Services business in its International operations.
In December 2002, the company sold its Darenas janitorial productsdistribution business based in Birmingham, United Kingdom. This sale resultedin a loss of approximately $1.7 million principally due to the amount of goodwillallocated to the disposed business. The annualized sales of this entity wereapproximately $30 million. In June 2003, the company sold its minority interestinvestment in Comac S.p.A., a floor care machine manufacturing companybased in Verona, Italy, for a gain of approximately $11.1 million ($6.7 millionafter tax). The company accounted for this investment under the equity methodof accounting. In September 2003, the company sold the consumer dermatologybusiness of the Adams Healthcare business at a nominal gain. Goodwillallocated to the sale of the dermatology business was approximately $1.0
million. The annualized sales of the dermatology business that was sold wereapproximately $2.5 million. These operations and investment were a part of thecompany’s International segment.
NOTE 7. BALANCE SHEET INFORMATION
__ United States _ Cleaning & Other Total
(thousands) Sanitizing Services United States International Consolidated
Balance December 31, 2001 $121,046 $44,796 $165,842 $431,083 $596,925Goodwill acquired
during year* 3,532 4,510 8,042 58,862 66,904Foreign currency
translation 38,472 38,472Impairment losses
upon adoptionof SFAS No. 142 on January 1, 2002 (4,002) (4,002)
Impairment losses during 2002 (2,599) (2,599) (2,599)
Balance December 31, 2002 121,979 49,306 171,285 524,415 695,700 Goodwill acquired
during year* 367 (377) (10) 825 815Goodwill allocated
to businessdispositions (2,708) (2,708)
Foreign currency translation 103,404 103,404
Balance December 31, 2003 122,346 48,929 171,275 625,936 797,211Goodwill acquired
during year* 54,936 54,936 72,270 127,206Goodwill allocated
to businessdispositions (69) (69) (25) (94)
Foreign currency translation 67,488 67,488
Balance December 31, 2004 $177,213 $48,929 $226,142 $765,669 $991,811
* For 2004, all of the goodwill except approximately $34.4 million is expected to be tax deductible.All of the goodwill related to businesses acquired in 2003 and 2002 is expected to be tax deductible.Goodwill acquired in 2004, 2003 and 2002 also includes adjustments to prior year acquisitions. UnitedStates Other Services goodwill acquired during 2003 includes a reduction of $0.4 million for anadjustment related to the Audits International acquisition. International goodwill acquired during 2003includes a reduction of $4.7 million for the Terminix acquisition primarily related to a finalization ofthe pension valuation at the date of acquisition.
December 31 (thousands) 2004 2003 2002
Accounts Receivable, NetAccounts receivable $ 782,465 $ 670,013 $ 589,149Allowance for doubtful accounts (44,199) (44,011) (35,995)Total $ 738,266 $ 626,002 $ 553,154
Inventories Finished goods $ 167,787 $ 159,633 $ 136,721Raw materials and parts 176,336 152,127 156,628Excess of fifo cost over lifo cost (5,520) (1,801) (1,843)Total $ 338,603 $ 309,959 $ 291,506
Property, Plant and Equipment, Net
Land $ 34,469 $ 26,921 $ 21,914Buildings and leaseholds 272,931 243,795 231,119Machinery and equipment 639,046 589,620 525,359Merchandising equipment 1,065,482 949,553 821,109Construction in progress 37,106 21,488 18,830
2,049,034 1,831,377 1,618,331Accumulated depreciation
and amortization (1,214,304) (1,094,580) (938,066)Total $ 834,730 $ 736,797 $ 680,265
Other Intangible Assets, NetCost
Customer relationships $ 189,572 $ 153,479 $ 120,324Intellectual property 38,130 77,793 71,104Trademarks 62,874 52,283 50,308Other intangibles 17,104 16,012 13,502
307,680 299,567 255,238Accumulated amortization
Customer relationships (43,798) (27,565) (9,238)Intellectual property (7,726) (45,809) (39,641)Trademarks (12,764) (9,313) (5,947)Other intangibles (14,297) (13,021) (11,742)
Total $ 229,095 $ 203,859 $ 188,670
Other Assets, NetDeferred income taxes $ 49,478 $ 43,168 $ 36,797Pension 170,625 161,098 106,314Other 161,369 136,445 142,224Total $ 381,472 $ 340,711 $ 285,335
Short-Term DebtNotes payable $ 50,980 $ 66,250 $ 146,947Long-term debt,
current maturities 5,152 3,953 13,152Total $ 56,132 $ 70,203 $ 160,099
Other Current LiabilitiesDiscounts and rebates $ 154,797 $ 145,508 $ 127,418Other 204,492 173,729 163,775Total $ 359,289 $ 319,237 $ 291,193
Long-Term Debt6.875% notes, due 2011 $ 149,228 $ 149,101 $ 148,9745.375% Euronotes, due 2007 404,716 364,399 299,7777.19% senior notes, due 2006 74,715 75,017 75,000Other 21,938 19,877 29,144
650,597 608,394 552,895Long-term debt,
current maturities (5,152) (3,953) (13,152)Total $ 645,445 $ 604,441 $ 539,743
Ecolab • GO • 41
The company has a $450 million multicurrency credit agreement with aconsortium of banks that has a term through August 2009. Under certaincircumstances, this credit agreement can be increased by $150 million for atotal of $600 million. Prior to October 2004, the company had two similaragreements in place which provided $450 million of available credit. Thecompany may borrow varying amounts in different currencies from time to timeon a revolving credit basis. The company has the option of borrowing based onvarious short-term interest rates. This agreement includes a covenant regardingthe ratio of total debt to capitalization. No amounts were outstanding underthese agreements at year-end 2004, 2003 and 2002.
This credit agreement supports the company’s $450 million U.S.commercial paper program and its $200 million European commercial paperprogram. The company had $8.8 million and $64.1 million in outstanding U.S.commercial paper at December 31, 2004 and 2002, respectively, with averageannual interest rates of 1.2 percent and 1.4 percent, respectively. There was noU.S. commercial paper outstanding at December 31, 2003. The company had nocommercial paper outstanding under its European commercial paper program atDecember 31, 2004 and 2003. Both programs were rated A-1 by Standard &Poor’s and P-1 by Moody’s as of December 31, 2004.
In December 2004, the company terminated a third commercial paperprogram, its 200 million Australian dollar commercial paper program. Thecompany had 50.0 million of Australian dollar denominated commercial paperoutstanding at December 31, 2003 and 2002 (in U.S. dollars, approximately $36million and $28 million, respectively), with average annual interest rates of 5.1percent and 4.8 percent, respectively.
In February 2002, the company issued euro 300 million ($265.9 million atrates prevailing at that time) of 5.375 percent Euronotes, due February 2007.As described further in Note 8, the company accounts for the transaction gainsand losses related to the Euronotes as a component of the cumulativetranslation account within accumulated other comprehensive income (loss).
As of December 31, the weighted-average interest rate on notes payablewas 5.7 percent in 2004, 6.3 percent in 2003 and 4.6 percent in 2002.
As of December 31, 2004, the aggregate annual maturities of long-termdebt for the next five years were: 2005 - $5,152,000; 2006 - $79,708,000; 2007 - $408,264,000; 2008 - $1,906,000 and 2009 - $789,000.
Interest expense was $48,479,000 in 2004, $49,342,000 in 2003 and$47,210,000 in 2002. Interest income was $3,135,000 in 2004, $3,997,000 in2003 and $3,315,000 in 2002. Total interest paid was $47,014,000 in 2004,$47,428,000 in 2003 and $45,056,000 in 2002.
NOTE 8. FINANCIAL INSTRUMENTS
Foreign Currency Forward ContractsThe company has entered into foreign currency forward contracts to hedgetransactions related to intercompany debt, subsidiary royalties, productpurchases, firm commitments and other intercompany transactions. Thecompany uses these contracts to hedge against the effect of foreign currencyexchange rate fluctuations on forecasted cash flows. These contracts generallyrelate to the company’s European operations and are denominated in euros.The company had foreign currency forward exchange contracts that totaledapproximately $239 million at December 31, 2004, $239 million at December31, 2003 and $199 million at December 31, 2002. These contracts generallyexpire within one year. The gains and losses related to these contracts wereincluded as a component of other comprehensive income until the hedged itemis reflected in earnings. As of December 31, 2004, other comprehensive incomeincludes a cumulative loss of $4.1 million related to these contracts.
Interest Rate Swap AgreementsThe company enters into interest rate swap agreements to manage interestrate exposures and to achieve a desired proportion of variable and fixed ratedebt.
In 2003, the company entered into an interest rate swap agreement thatconverts $30 million of the 7.19% senior notes from a fixed interest rate to afloating or variable interest rate. This agreement is effective until January2006. The interest rate swap was designated as a fair value hedge and had aninsignificant value as of December 31, 2004. The mark to market gain on thisagreement has been recorded as part of interest expense and has been offsetby the market to market on this portion of the 7.19% senior notes.
During 2002, the company entered into an interest rate swap agreementin connection with the issuance of its Euronotes. This agreement convertsapproximately euro 78 million (approximately $104 million at year-end 2004) ofthe Euronote debt from a fixed interest rate to a floating or variable interestrate and is effective until February 2007. This interest rate swap wasdesignated as a fair value hedge and had a value of $7.0 million, $6.4 millionand $3.5 million as of December 31, 2004, 2003 and 2002, respectively. Themark to market gain on this agreement has been recorded as part of interestexpense and has been offset by the loss recorded in interest expense on themark to market on this portion of the Euronotes. There is no hedgeineffectiveness on this interest rate swap.
The company also had an interest rate swap agreement to provide for afixed rate of interest on the first 50 million Australian dollars of Australianfloating-rate debt. This agreement expired in November 2004 and had a fixedannual pay rate of approximately 6 percent. This interest rate swap agreementwas designated as, and effective as, a cash flow hedge of the outstandingdebt. The change in fair value of the interest rate swap was recorded in othercomprehensive income and recognized in earnings as part of interest expenseto offset the forecasted hedged transactions as they occurred.
Net Investment HedgesIn February 2002, the company issued euro 300 million of 5.375 percentEuronotes, due 2007. The company designated a portion (approximately euro300 million at year-end 2004, euro 290 million at year-end 2003 and euro 200million at year-end 2002) of this Euronote debt as a hedge of existing foreigncurrency exposures related to net investments the company has in certainEuropean subsidiaries. Accordingly, the transaction gains and losses on thisportion of the Euronotes that are designated and effective as hedges of thecompany’s net investments have been included as a component of thecumulative translation account within accumulated other comprehensiveincome (loss). Total transaction losses related to the Euronotes and charged tothis shareholders’ equity account were $39.6 million, $52.5 million and $26.0million for the years ended December 31, 2004, 2003 and 2002, respectively.Transaction gains and losses on the remaining portion of the Euronotes havebeen included in earnings and were offset by transaction gains and lossesrelated to other euro denominated assets held by the company’s U.S.operations.
Credit RiskThe company is exposed to credit loss in the event of nonperformance ofcounterparties for foreign currency forward exchange contracts and interestrate swap agreements. The company monitors its exposure to credit risk byusing credit approvals and credit limits and selecting major international banksand financial institutions as counterparties. The company does not anticipatenonperformance by any of these counterparties.

42 • GO • Ecolab
NOTE 8. FINANCIAL INSTRUMENTS(Continued)
Fair Value of Other Financial InstrumentsThe carrying amount and the estimated fair value of other financial instrumentsheld by the company were:
The carrying amounts of cash equivalents, accounts receivable, notespayable and commercial paper approximate fair value because of their shortmaturities.
The fair value of long-term debt is based on quoted market prices for thesame or similar debt instruments.
NOTE 9. SHAREHOLDERS’ EQUITY
The company’s common stock was split two-for-one in the form of a 100percent stock dividend paid June 6, 2003 to shareholders of record on May 23,2003. All per share data have been adjusted to reflect the stock split, exceptfor prior year data in the Consolidated Balance Sheet and the ConsolidatedStatement of Comprehensive Income and Shareholders’ Equity.
Authorized common stock, par value $1.00 per share, was 400 millionshares in 2004 and 2003 and 200 million shares in 2002. Treasury stock isstated at cost. Dividends declared per share of common stock were $0.3275 for2004, $0.2975 for 2003 and $0.275 for 2002.
The company has 15 million shares, without par value, of authorized butunissued preferred stock. Of these 15 million shares, 1 million shares aredesignated as Series A Junior Participating Preferred Stock and 14 millionshares are undesignated.
Each share of outstanding common stock entitles the holder to one-fourthof a preferred stock purchase right. A right entitles the holder, upon occurrenceof certain events, to buy one one-hundredth of a share of Series A JuniorParticipating Preferred Stock at a purchase price of $115, subject toadjustment. The rights, however, will not become exercisable unless and until,among other things, any person or group acquires 15 percent or more of theoutstanding common stock of the company, or the company’s board of directorsdeclares a holder of 10 percent or more of the outstanding common stock to bean “adverse person” as defined in the rights plan. Upon the occurrence ofeither of these events, the rights will become exercisable for common stock ofthe company (or in certain cases common stock of an acquiring company)having a market value of twice the exercise price of a right. The rights providethat the holdings by Henkel or its affiliates, subject to compliance by Henkelwith certain conditions, will not cause the rights to become exercisable norcause Henkel to be an “adverse person.” The rights are redeemable undercertain circumstances at one cent per right and, unless redeemed earlier, willexpire on March 11, 2006.
The company reacquired 4,581,400 shares of its common stock in 2004,6,218,000 shares in 2003 and 165,000 shares in 2002 through open and privatemarket purchases. The equivalent number of shares reacquired on a post stock-split basis was 8,014,500 in 2003 and 330,000 shares in 2002. In October 2003
and December 2004, the company approved authorizations to repurchase up toan aggregate of 20 million additional shares of Ecolab common stock for thepurpose of offsetting the dilutive effect of shares issued for stock optionexercises and incentives and for general corporate purposes. As of December31, 2004, 15,775,700 shares remained to be purchased under the company’srepurchase authority. The company also reacquired 777,607 shares of itscommon stock in 2004 related to the exercise of stock options and the vestingof stock awards. On a pre-split basis, the company reacquired 448,861 sharesof its common stock in 2003 and 33,778 shares in 2002 related to the exerciseof stock options and the vesting of stock awards.
NOTE 10. STOCK INCENTIVE AND OPTIONPLANS
The company’s stock incentive and option plans provide for grants of stockoptions, stock awards and other incentives. Common shares available for grantas of December 31 were 4,216,012 for 2004, 8,674,459 for 2003 and12,305,052 for 2002. Common shares available for grant reflect 12 millionshares approved by shareholders during 2002 for issuance under the plans.
Options may be granted to purchase shares of the company’s stock at notless than fair market value at the date of grant. Options granted in 2004, 2003and 2002 generally become exercisable over three years from date of grant andexpire within ten years from date of grant. A summary of stock option activityand average exercise prices is as follows:
Information related to stock options outstanding and stock optionsexercisable as of December 31, 2004, is as follows:
December 31 (thousands) 2004 2003 2002
Carrying amountCash and cash equivalents $ 71,231 $ 85,626 $ 49,205Accounts receivable 738,266 626,002 553,154Notes payable 42,180 30,050 54,847Commercial paper 8,800 36,200 92,100Long-term debt
(including current maturities) 650,597 608,394 552,895Fair value
Long-term debt (including current maturities) $690,066 $656,576 $588,003
Shares 2004 2003 2002
Granted 4,876,408 4,765,823 4,912,674Exercised (3,625,117) (6,383,227) (4,432,722)Canceled (386,512) (379,634) (1,473,670)December 31:
Outstanding 22,732,505 21,867,726 23,864,764
Exercisable 15,332,623 12,823,743 14,444,562
Average exercise price per share 2004 2003 2002
Granted $33.49 $27.18 $24.24Exercised 16.55 19.84 10.27Canceled 24.81 21.87 21.08
December 31:Outstanding 24.20 20.87 19.35Exercisable $21.31 $17.96 $17.77
Options Outstanding
Weighted-Range of Weighted-Average AverageExercise Options Remaining ExercisePrices Outstanding Contractual Life Price
$ 5.80 - $10.95 1,175,852 1.8 years $ 9.15 $13.45 - $18.96 3,683,114 6.3 years 18.35$19.27 - $23.90 4,352,780 5.4 years 19.83$24.04 - $24.90* 4,295,281 7.9 years 24.35$25.21 - $27.39* 4,729,364 9.0 years 27.31$28.70 - $35.07* 4,493,892 9.9 years 34.03$37.07 - $93.42* 2,222 4.1 years $53.36
*Includes 15,872 shares of Ecolab’s common stock subject to stock options which Ecolab assumed inconnection with the acquisition of Alcide Corporation in June 2004.

Ecolab • GO • 43
The weighted-average grant-date fair value of options granted in 2004,2003 and 2002, and the significant assumptions used in determining theunderlying fair value of each option grant, on the date of grant, utilizing theBlack-Scholes option-pricing model, were as follows:
The expense associated with shares of restricted stock issued under thecompany’s stock incentive plan is based on the market price of the company’sstock at the date of grant and is amortized on a straight-line basis over theperiods during which the restrictions lapse. The company currently hasrestricted stock outstanding that vests over periods between 18 and 48 months.Stock awards are not performance based and vest with continued employment.Stock awards are subject to forfeiture in the event of termination ofemployment. The company granted 13,550 shares in 2004, 10,500 shares in2003 and 67,200 shares in 2002 under its restricted stock award program.
The company uses the intrinsic value-based method of accounting tomeasure compensation expense for its stock incentive and option plans. SeeNote 2 to the consolidated financial statements for the pro forma net incomeand related basic and diluted per common share amounts had the companyused the fair value-based method of accounting to measure compensationexpense. Effective with third quarter 2005, the company expects to adopt SFASNo. 123R and its requirements to expense the fair value of its stock options,barring further rulings.
NOTE 11. INCOME TAXES
Income from continuing operations before income taxes consisted of:
The provision for income taxes consisted of:
The company’s overall net deferred tax assets and deferred tax liabilitieswere comprised of the following:
A reconciliation of the statutory U.S. federal income tax rate to thecompany’s effective income tax rate was:
Cash paid for income taxes was approximately $163 million in 2004, $90million in 2003 and $95 million in 2002.
As of December 31, 2004, the company had undistributed earnings ofinternational affiliates of approximately $525 million. These earnings areconsidered to be reinvested indefinitely or available for distribution withforeign tax credits available to offset the amount of applicable income tax andforeign withholding taxes that might be payable on earnings. It is impractical todetermine the amount of incremental taxes that might arise if all undistributedearnings were distributed.
On October 22, 2004, the President signed the American Jobs CreationAct of 2004 (the “Act”). The Act provides a deduction for income from qualifieddomestic production activities, which will be phased in from 2005 through2010. In return, the Act also provides for a two-year phase-out of the existingextra-territorial income exclusion (ETI) for foreign sales that was viewed to beinconsistent with international trade protocols by the European Union.
Under the guidance in FASB Staff Position No. FAS 109-1, Application ofFASB Statement No. 109, Accounting for Income Taxes, to the Tax Deduction
2004 2003 2002
Weighted-average grant-date fair value of options granted atmarket prices $9.45 $7.85 $7.10
AssumptionsRisk-free interest rate 3.8% 3.5% 3.6%Expected life 6 years** 6 years 6 yearsExpected volatility 25.5% 26.8% 26.5%Expected dividend yield 1.0% 1.2% 1.1%
**Reload options were also granted during 2004 with a weighted-average expected life of 3.5 years.
*Includes 15,872 shares of Ecolab’s common stock subject to stock options which Ecolab assumed inconnection with the acquisition of Alcide Corporation in June 2004.
Options Exercisable
Weighted-Range of AverageExercise Options ExercisePrices Exercisable Price
$ 5.80 - $10.95 1,175,852 $ 9.15$13.45 - $18.96 3,683,114 18.35$19.27 - $23.90 4,294,623 19.78$24.04 - $24.90* 3,078,127 24.36$25.21 - $27.39* 2,255,193 27.33 $28.70 - $35.07* 843,492 33.00$37.07 - $93.42* 2,222 $53.36
(thousands) 2004 2003 2002
Federal and state $ 86,300 $ 78,928 $ 59,601Foreign 67,681 49,687 30,557Currently payable 153,981 128,615 90,158
Federal and state 22,966 33,178 43,974Foreign 1,343 9,277 5,949Deferred 24,309 42,455 49,923
Provision for income taxes $178,290 $171,070 $140,081
(thousands) 2004 2003 2002
Domestic $278,841 $286,003 $258,779Foreign 209,937 162,415 93,192Total $488,778 $448,418 $351,971
December 31 (thousands) 2004 2003 2002
Deferred tax assets Postretirement health care
and pension benefits $ 827 $ 1,008 $ 19,249Other accrued liabilities 57,316 53,924 52,399Loss carryforwards 11,709 11,756 13,932Other, net 27,250 27,856 28,090Valuation allowance (2,847) (2,719) (1,462)Total 94,255 91,825 112,208
Deferred tax liabilitiesProperty, plant and equipment
basis differences 72,204 61,062 53,320Intangible assets 74,064 49,465 38,696Other, net 4,055 4,714 3,273Total 150,323 115,241 95,289
Net deferred tax assets (liabilities) $(56,068) $(23,416) $ 16,919
2004 2003 2002
Statutory U.S. rate 35.0% 35.0% 35.0%State income taxes, net
of federal benefit 2.5 2.7 3.2Foreign operations (1.0) 0.5 1.0Other, net 0.0 (0.1) 0.6
Effective income tax rate 36.5% 38.1% 39.8%
44 • GO • Ecolab
NOTE 11. INCOME TAXES (Continued)
on Qualified Production Activities Provided by the American Jobs Creation Actof 2004, the deduction will be treated as a “special deduction” as described inSFAS No. 109. As such, the special deduction has no effect on deferred taxassets and liabilities existing at the enactment date. Rather, the impact of thisdeduction will be reported in the period in which the deduction is claimed onthe company’s tax return. The company expects to benefit from this deductionwith a modest benefit beginning in 2005.
The Act also creates a temporary incentive for U.S. corporations torepatriate accumulated income earned abroad by providing an 85 percentdividends received deduction for certain dividends from controlled foreigncorporations. The deduction is subject to a number of limitations and, as oftoday, uncertainty remains as to how to interpret numerous provisions in theAct. As such, we are not yet in a position to decide on whether, and to whatextent, we might repatriate foreign earnings that have not yet been remitted tothe U.S. The company does not expect to be able to complete its evaluationuntil after Congress or the Treasury Department provides clarifying language onkey elements of the provision. The company expects to complete its evaluationof the effects of the repatriation provision within a reasonable period of timefollowing the publication of the additional clarifying language.
NOTE 12. RENTALS AND LEASES
The company leases sales and administrative office facilities, distributioncenter facilities, automobiles, computers and other equipment under operatingleases. Rental expense under all operating leases was $86,626,000 in 2004,$81,781,000 in 2003 and $77,593,000 in 2002. As of December 31, 2004, futureminimum payments under operating leases with noncancelable terms in excessof one year were:
The company enters into operating leases in the U.S. for vehicles whosenoncancellable terms are one year or less in duration with month-to-monthrenewal options. These leases have been excluded from the table above. Thecompany estimates payments under such leases will approximate $39,000,000in 2005. These automobile leases have guaranteed residual values that havehistorically been satisfied primarily by the proceeds on the sale of the vehicles.No estimated losses have been recorded for these guarantees as the companybelieves, based upon the results of previous leasing arrangements, that thepotential recovery of value from the vehicles when sold will be greater than theresidual value guarantee.
NOTE 13. RESEARCH EXPENDITURES
Research expenditures that related to the development of new products andprocesses, including significant improvements and refinements to existingproducts are expensed as incurred. Such costs were $61,471,000 in 2004,$53,171,000 in 2003 and $49,860,000 in 2002.
NOTE 14. COMMITMENTS ANDCONTINGENCIES
The company and certain subsidiaries are party to various environmentalactions that have arisen in the ordinary course of business. These includepossible obligations to investigate and mitigate the effects on the environmentof the disposal or release of certain chemical substances at various sites, suchas Superfund sites and other operating or closed facilities. The effect of theseactions on the company’s financial position, results of operations and cashflows to date has not been material. The company is currently participating inenvironmental assessments and remediation at a number of locations andenvironmental liabilities have been accrued reflecting management’s bestestimate of future costs. At December 31, 2004, the accrual for environmentalremediation costs was approximately $4.1 million. Potential insurancereimbursements are not anticipated in the company’s accruals forenvironmental liabilities.
The company is self-insured in North America for most workerscompensation, general liability and automotive liability losses subject to peroccurrence and aggregate annual liability limitations. The company is insuredfor losses in excess of these limitations. The company has recorded both aliability and an offsetting receivable for amounts in excess of these limitations.The company is self-insured for health care claims for eligible participatingemployees subject to certain deductibles and limitations. The companydetermines its liability for claims incurred but not reported on an actuarialbasis.
While the final resolution of these contingencies could result in expensesdifferent than current accruals, and therefore have an impact on the company’sconsolidated financial results in a future reporting period, managementbelieves the ultimate outcome will not have a significant effect on thecompany’s consolidated results of operations, financial position or cash flows.
NOTE 15. RETIREMENT PLANS
Pension and Postretirement Health CareBenefits PlansThe company has a noncontributory defined benefit pension plan covering mostof its U.S. employees. Effective January 1, 2003, the U.S. pension plan wasamended to provide a cash balance type pension benefit to employees hired onor after the effective date. For participants enrolled prior to January 1, 2003,plan benefits are based on years of service and highest average compensationfor five consecutive years of employment. For participants enrolled afterDecember 31, 2002, plan benefits are based on contribution credits equal to afixed percentage of their current salary and interest credits. The measurementdate used for determining the U.S. pension plan assets and obligations isDecember 31. Various international subsidiaries also have defined benefitpension plans. The measurement date used for determining the internationalpension plan assets and obligations is November 30. The information followingincludes all of the company’s significant international defined benefit pensionplans.
The company provides postretirement health care benefits to certain U.S.employees. The plan is contributory based on years of service and familystatus, with retiree contributions adjusted annually. The measurement dateused to determine the U.S. postretirement healthcare plan assets andobligations was December 31. Certain employees outside the U.S. werecovered under government-sponsored programs, which are not required to befully funded. The expense and obligation for providing internationalpostretirement healthcare benefits was not significant.
(thousands)
2005 $ 40,7092006 33,4072007 24,7472008 17,4282009 14,827Thereafter 21,971Total $153,089

Ecolab • GO • 45
A reconciliation of changes in the benefits obligations and fair value of assets of the company’s plans is as follows:
A reconciliation of the funded status for the pension and postretirement plans is as follows:
International U.S. Postretirement Health Care U.S. Pension Benefits Pension Benefits Benefits
(thousands) 2004 2003 2002 2004 2003 2002 2004 2003 2002
Benefit obligation, beginning of year $556,076 $485,155 $396,827 $321,906 $245,876 $172,328 $155,030 $131,206 $134,116
Service cost 31,453 26,442 21,635 13,409 11,997 9,412 3,188 7,447 2,814
Interest cost 34,192 32,208 29,237 17,830 14,633 10,973 9,041 8,597 7,651
Company contributions 137
Participant contributions 2,503 1,515 68 2,267 1,856 1,214
Acquisitions 1,441 1,086 43,135
Divestitures (611)
Plan amendments, settlements
and curtailments 473 (948) 1,522 288 (1,930) (40,760)
Changes in assumptions 52,728 33,397 53,467 10,046 8,675 24,588
Actuarial loss (gain)* 10,801 (5,232) (1,889) 2,335 13,007 (2,554) (11,257) 7,828 8,659
Benefits paid (17,314) (15,894) (14,122) (13,961) (11,892) (8,913) (10,573) (8,649) (7,076)
Foreign currency translation 26,720 46,632 19,768
Benefit obligation, end of year $667,936 $556,076 $485,155 $372,045 $321,906 $245,876 $158,030 $155,030 $131,206
Fair value of plan assets,beginning of year $544,802 $378,504 $311,164 $170,975 $134,089 $108,485 $ 21,979 $ 18,911 $ 23,811
Actual gains (losses) on plan assets 53,645 107,192 (43,112) 7,006 9,400 (9,438) 2,018 5,054 (2,866)
Acquisitions 263 23,331
Company contributions 37,000 75,000 124,574 25,124 12,743 7,794 6,049 4,807 3,828
Participant contributions 2,503 1,407 1,052 2,267 1,856 1,214
Settlements (547)
Benefits paid (17,314) (15,894) (14,122) (13,961) (11,892) (7,800) (10,573) (8,649) (7,076)
Foreign currency translation 9,835 25,512 10,665
Fair value of plan assets, end of year $618,133 $544,802 $378,504 $201,482 $170,975 $134,089 $ 21,740 $ 21,979 $ 18,911
* The actuarial gain in 2004 for the U.S. Postretirement Health Care Benefits plan includes a gain of $15.5 million resulting from the enactment of the Medicare Prescription Drug, Improvement and ModernizationAct of 2003.
International U.S. Postretirement Health Care U.S. Pension Benefits Pension Benefits Benefits
(thousands) 2004 2003 2002 2004 2003 2002 2004 2003 2002
Funded status $(49,803) $ (11,274) $(106,651) $(170,563) $(150,931) $(111,787) $(136,290) $(133,051) $(112,295)
Unrecognized actuarial loss 215,466 160,939 201,006 55,746 44,123 25,881 56,467 63,559 56,823
Unrecognized prior servicecost (benefit) 5,664 7,400 9,329 1,589 2,265 (55) (28,075) (34,059) (37,431)
Unrecognized net transition (asset) obligation (702) (2,105) (3,508) 357 627 833
Net amount recognized $170,625 $154,960 $ 100,176 $(112,871) $(103,916) $ (85,128) $(107,898) $(103,551) $ (92,903)

For certain international pension plans, the accumulated benefitobligations exceeded the fair value of plan assets. Therefore, the companyrecognized an addition to the minimum pension liability in other comprehensiveincome of $0.4 million pre-tax ($0.3 million net of deferred tax asset) during2004, $14.5 million pre-tax ($9.5 million net of deferred tax asset) during 2003and $1.1 million during 2002. As of December 31, 2004, other comprehensiveincome includes minimum pension liability adjustments of $16.0 million pre-tax($10.9 million net of deferred tax asset).
The aggregate projected benefit obligation, accumulated benefitobligation and fair value of plan assets for those plans with accumulatedbenefit obligations in excess of plan assets were as follows:
These plans relate to various international subsidiaries and are fundedconsistent with local practices and requirements. As of December 31, 2004,there were approximately $4.3 million of future postretirement benefitscovered by insurance contracts.
Plan AssetsUnited StatesThe company’s plan asset allocations for its U.S. defined benefit pension andpostretirement health care benefits plans at December 31, 2004, 2003 and2002, and target allocation for 2005 are as follows:
The company’s U.S. investment strategy and policies are designed tomaximize the possibility of having sufficient funds to meet the long-termliabilities of the pension fund, while achieving a balance between the goals of
asset growth of the plan and keeping risk at a reasonable level. Current incomeis not a key goal of the plan. The pension and health care plans’ demographiccharacteristics generally reflect a younger workforce relative to an averagepension plan. Therefore, the asset allocation position reflects the ability andwillingness to accept relatively more short-term variability in the performanceof the pension plan portfolio in exchange for the expectation of a better fundedstatus, better long-term returns and lower pension costs in the long run.
Since diversification is widely recognized as important to reduceunnecessary risk, the pension fund is diversified across several asset classesand securities. Selected individual portfolios may be undiversified whilemaintaining the diversified nature of total plan assets.
The plan prohibits investing in letter stock, warrants and options, andengaging in short sales, margin transactions, or other specialized investmentactivities. The use of derivatives is also prohibited for the purpose ofspeculation or introducing leverage in the portfolio, circumventing theinvestment guidelines or taking risks that are inconsistent with the fund’sguidelines. Selected derivatives may only be used for hedging andtransactional efficiency.
InternationalThe company’s plan asset allocations for its international defined benefitpension plans at December 31, 2004, 2003 and 2002, and target allocation for2005 are as follows:
Assets of funded retirement plans outside the U.S. are managed in eachlocal jurisdiction and asset allocation strategy is set in accordance with localrules, regulations and practice. The funds are invested in a variety of stocks,fixed income and real estate investments; in some cases, the assets aremanaged by insurance companies which may offer a guaranteed rate of return.Total non-U.S. pension plan assets represent 25% of total Ecolab pension planassets worldwide.
During 2004, the American Jobs Creation Act of 2004 (the “Act”) added anew Section 409A to the Internal Revenue Code (“the Code”) which
46 • GO • Ecolab
International U.S. Postretirement Health Care U.S. Pension Benefits Pension Benefits Benefits
(thousands) 2004 2003 2002 2004 2003 2002 2004 2003 2002
Prepaid benefit cost $170,625 $154,960 $100,176 $ 28,986 $ 26,533 $ 13,175 $ - $ - $ -
Accrued benefit cost (162,730) (146,180) (99,355) (107,898) (103,551) (92,903)
Intangible asset 2,202
Accumulated othercomprehensive loss 18,671 15,731 1,052
Net amount recognized $170,625 $154,960 $100,176 $(112,871) $(103,916) $ (85,128) $(107,898) $(103,551) $ (92,903)
Accumulated benefit obligation $522,214 $441,488 $375,406 $ 335,628 $ 283,464 $208,732 $ 158,030 $ 155,030 $131,206
December 31 (thousands) 2004 2003 2002
Aggregate projected benefitobligation $316,609 $261,138 $103,063
Accumulated benefit obligation 286,165 238,819 90,428
Fair value of plan assets 126,453 95,655 14,163
NOTE 15. RETIREMENT PLANS (Continued)
The net amount recognized in the balance sheet and the accumulated benefit obligation is as follows:
2005 Target AssetAsset Allocation Percentage of Plan AssetsCategory Percentage 2004 2003 2002
Large cap equity 43% 44% 46% 43%Small cap equity 12 13 13 12International equity 15 16 15 15Fixed income 25 23 22 25 Real estate 5 4 4 5 Total 100% 100% 100% 100%
2005 Target AssetAsset Allocation Percentage of Plan AssetsCategory Percentage 2004 2003 2002
Stocks 37% 37% 43% 41%Fixed income 50 50 43 44International equity 3 3 5 6Insurance contracts 5 5 2 2Real estate 4 4 5 5Other 1 1 2 2 Total 100% 100% 100% 100%

Ecolab • GO • 47
significantly changed the federal tax law applicable to amounts deferred afterDecember 31, 2004 under nonqualified deferred compensation plans. Inresponse to this, the company amended the Non-Employee Director StockOption and Deferred Compensation Plan (“Director Plan”) and the MirrorSavings Plan in December 2004. The amendments (1) allow compensation thatwas “deferred” (as defined by the Act) prior to January 1, 2005 to qualify for“grandfathered” status and to continue to be governed by the law applicable tononqualified deferred compensation prior to the addition of Internal RevenueCode Section 409A by the Act, and (2) cause deferred compensation that isdeferred after December 31, 2004 to be in compliance with the requirements ofCode Section 409A. For amounts deferred after December 31, 2004, theamendments generally (1) require that such amounts be distributed as a singlelump sum payment as soon as practicable after the participant has had aseparation of service, with the exception of payments to “key employees” (asdefined by the Act) which lump sum payments are required to be held for 6months after their separation from service, and (2) prohibit the acceleration ofdistribution of such amounts except for an unforseeable emergency (as definedby the Act).
Additionally, in December 2004 the company amended the SupplementalExecutive Retirement Plan (“SERP”) and the Mirror Pension Plan to (1) allowamounts deferred prior to January 1, 2005 to qualify for “grandfathered” statusand to coninue to be governed by the law applicable to nonqualified deferredcompensation prior to the Act, and (2) temporarily freeze the accrual of benefitsas of December 31, 2004 due to the uncertainty regarding the effect of the Acton such benefits. The Secretary of Treasury and the Internal Revenue Serviceare expected to issue regulations and/or other guidance with respect to theprovisions of the new Act throughout 2005 and final amendments to complywith the Act are required by the end of 2005. The company currently intends torescind the freeze, following issuance of regulations to ensure compliance forpost-2004 benefit accruals.
Cash FlowsAs of year-end 2004, the company’s estimate of benefits expected to be paid ineach of the next five fiscal years, and in the aggregate for the five fiscal yearsthereafter for the company’s pension and postretirement health care benefitplans are as follows:
The company’s funding policy for the U.S. pension plan is to achieve andmaintain a return on assets that meets the long-term funding requirementsidentified by the projections of the pension plan’s actuaries whilesimultaneously satisfying the fiduciary responsibilities prescribed in ERISA. Thecompany also takes into consideration the tax deductibility of contributions tothe benefit plans. The company is not required to make any contributions to theU.S. pension and postretirement health care benefit plans in 2005. Themaximum tax deductible contribution for 2005 is $45 million for the U.S.pension plan. The company’s best estimate of contributions to be made to theinternational plans is $17 million in 2005.
Net Periodic Benefit CostsPension and postretirement health care benefits expense for the company’soperations was:
(thousands)
2005 $ 39,0002006 40,0002007 43,0002008 47,0002009 49,0002010-2014 308,000
International U.S. Postretirement Health Care U.S. Pension Benefits Pension Benefits Benefits
(thousands) 2004 2003 2002 2004 2003 2002 2004 2003 2002
Service cost – employee benefits earned during the year $31,453 $26,442 $21,635 $13,409 $11,997 $ 9,412 $ 3,188 $ 2,945 $ 2,814
Interest cost on benefit obligation 34,192 32,208 29,237 17,830 14,633 10,973 9,041 8,597 7,651Adjustments for death benefits
for retired executives 4,502Expected return on plan assets (50,161) (42,411) (32,675) (11,403) (9,908) (8,556) (1,843) (1,580) (2,071)Recognition of net actuarial
loss (gain) 5,518 3,451 1,458 932 394 5,706 6,293 2,005Amortization of prior service
cost (benefit) 1,736 1,929 1,929 426 41 204 (5,696) (5,302) (4,431)Amortization of net transition
(asset) obligation (1,403) (1,403) (1,403) 333 493 272Curtailment (gain) loss (51) 1,522 (5,791)Total expense $21,335 $20,216 $18,723 $22,002 $18,188 $14,221 $10,396 $15,455 $ 177
The company also has U.S. noncontributory non-qualified defined benefit plans, which provide for benefits to employees in excess of limits permitted under itsU.S. pension plan. The recorded obligation for these plans was approximately $23 million at December 31, 2004. The annual expense for these plans wasapproximately $5 million in 2004, $4 million in 2003 and $3 million in 2002.

48 • GO • Ecolab
The expected long-term rate of return is generally based on the pensionplan’s asset mix, assumptions of equity returns based on historical long-termreturns on asset categories, expectations for inflation, and estimates of theimpact of active management of the assets.
For postretirement benefit measurement purposes as of December 31,2004, 8.0 percent (for pre-age 65 retirees) and 10.0 percent (for post-age 65retirees) annual rates of increase in the per capita cost of covered health carewere assumed. The rates were assumed to decrease by 1 percent each yearuntil they reach 5 percent in 2008 for pre-age 65 retirees and 5 percent in 2010for post-age 65 retirees and remain at those levels thereafter. Health care costswhich are eligible for subsidy by the company are limited to a 4 percent annualincrease beginning in 1996 for certain employees.
Assumed health care cost trend rates have a significant effect on theamounts reported for the company’s U.S. postretirement health care benefitsplan. A one-percentage point change in the assumed health care cost trendrates would have the following effects:
Effective March 2002, the company changed its postretirement health carebenefits plan to discontinue the employer subsidy for postretirement healthcare benefits for most active employees. These subsidized benefits willcontinue to be provided to certain defined active employees and all retireeswho were participating at the time of the change. As a result of these actions,the company recorded a curtailment gain of approximately $6 million in the firstquarter of 2002.
The Medicare Prescription Drug, Improvement and Modernization Act of2003 (the Act) introduces a prescription drug benefit under Medicare as well asa federal subsidy to sponsors of retiree health care benefit plans. Thecompany’s U.S. postretirement health care benefits plan offers prescription drugbenefits. The company does not anticipate that its plan will need to beamended to obtain the benefits provided under the Act. In accordance with FSPNo. 106-2 Accounting and Disclosure Requirements Related to the MedicarePrescription Drug, Improvement and Modernization Act of 2003, the companybegan recording favorable benefits of the Act in the third quarter of 2004, usingthe prospective transition method consistent with this guidance. The annual
after-tax benefit for 2004 is approximately $1.0 million. The companyrecognized an actuarial gain and a reduction in its postretirement benefitobligation of $15.5 million at July 1, 2004 related to the Act.
Savings Plan and ESOPThe company provides a 401(k) savings plan for substantially all U.S.employees. Prior to March 2002, employee contributions of up to 6 percent ofeligible compensation were matched 50 percent by the company. In March2002, the company changed its 401(k) savings plan and added an employeestock ownership plan (ESOP) feature to the existing plan. Employee before-taxcontributions of up to 3 percent of eligible compensation are matched 100percent by the company and employee before-tax contributions between 3percent and 5 percent of eligible compensation are matched 50 percent by thecompany. The match is 100 percent vested immediately. Effective January 2003,the plan was amended to provide that all employee contributions which areinvested in Ecolab stock will be part of the employee’s ESOP account while soinvested. The company’s contributions are invested in Ecolab common stock andamounted to $15,822,000 in 2004, $14,854,000 in 2003 and $12,905,000 in2002.
NOTE 16. OPERATING SEGMENTS
The company’s operating segments have generally similar products and servicesand the company is organized to manage its operations geographically. Thecompany’s operating segments have been aggregated into three reportablesegments.
The “United States Cleaning & Sanitizing” segment provides cleaning andsanitizing products and services to United States markets through itsInstitutional, Kay, Textile Care, Professional Products, Healthcare, Vehicle Care,Water Care Services and Food & Beverage operations.
The “United States Other Services” segment includes all other U.S.operations of the company. This segment provides pest elimination and kitchenequipment repair and maintenance through its Pest Elimination and GCSService operations.
The company’s “International” segment provides cleaning and sanitizingproduct and service offerings as well as pest elimination services tointernational markets in Europe, Asia Pacific, Latin America and Canada.
Information on the types of products and services of each of thecompany’s operating segments is included on the inside front cover under“Services/Products Provided” of the Ecolab Overview section of this Annual Report.
International U.S. Postretirement Health Care U.S. Pension Benefits Pension Benefits Benefits
2004 2003 2002 2004 2003 2002 2004 2003 2002
Weighted-average actuarial assumptions used to determine benefit obligations as of December 31:
Discount rate 5.75% 6.25% 6.75% 5.22% 5.39% 5.42% 5.75% 6.25% 6.75% Projected salary increase 4.30 4.30 4.80 3.13 3.31 3.40
Weighted-average actuarial assumptions used to determinenet cost:
Discount rate 6.25 6.75 7.50 5.37 5.11 5.37 6.25 6.75 7.50 Expected return on plan assets 9.00 9.00 9.00 5.75 5.97 5.26 9.00% 9.00% 9.00% Projected salary increase 4.30% 4.80% 4.80% 3.07% 3.25% 3.36%
1-Percentage Point (thousands) Increase Decrease
Effect on total of service and interestcost components $ 523 $ (466)
Effect on postretirement benefit obligation 9,008 (8,023)
NOTE 15. RETIREMENT PLANS (Continued)
Plan Assumptions
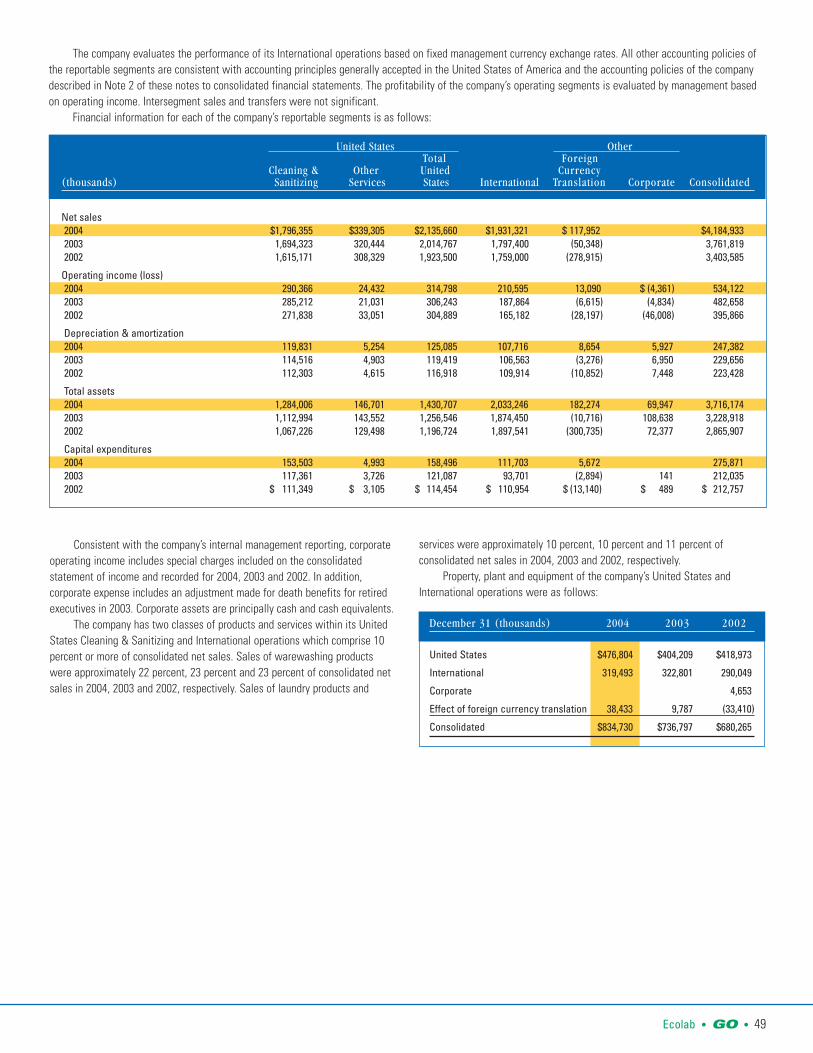
Ecolab • GO • 49
Consistent with the company’s internal management reporting, corporateoperating income includes special charges included on the consolidatedstatement of income and recorded for 2004, 2003 and 2002. In addition,corporate expense includes an adjustment made for death benefits for retiredexecutives in 2003. Corporate assets are principally cash and cash equivalents.
The company has two classes of products and services within its UnitedStates Cleaning & Sanitizing and International operations which comprise 10percent or more of consolidated net sales. Sales of warewashing productswere approximately 22 percent, 23 percent and 23 percent of consolidated netsales in 2004, 2003 and 2002, respectively. Sales of laundry products and
United States Other Total Foreign
Cleaning & Other United Currency(thousands) Sanitizing Services States International Translation Corporate Consolidated
Net sales2004 $1,796,355 $339,305 $2,135,660 $1,931,321 $ 117,952 $4,184,9332003 1,694,323 320,444 2,014,767 1,797,400 (50,348) 3,761,8192002 1,615,171 308,329 1,923,500 1,759,000 (278,915) 3,403,585
Operating income (loss)2004 290,366 24,432 314,798 210,595 13,090 $ (4,361) 534,1222003 285,212 21,031 306,243 187,864 (6,615) (4,834) 482,6582002 271,838 33,051 304,889 165,182 (28,197) (46,008) 395,866
Depreciation & amortization2004 119,831 5,254 125,085 107,716 8,654 5,927 247,3822003 114,516 4,903 119,419 106,563 (3,276) 6,950 229,6562002 112,303 4,615 116,918 109,914 (10,852) 7,448 223,428
Total assets2004 1,284,006 146,701 1,430,707 2,033,246 182,274 69,947 3,716,1742003 1,112,994 143,552 1,256,546 1,874,450 (10,716) 108,638 3,228,9182002 1,067,226 129,498 1,196,724 1,897,541 (300,735) 72,377 2,865,907
Capital expenditures2004 153,503 4,993 158,496 111,703 5,672 275,8712003 117,361 3,726 121,087 93,701 (2,894) 141 212,0352002 $ 111,349 $ 3,105 $ 114,454 $ 110,954 $ (13,140) $ 489 $ 212,757
The company evaluates the performance of its International operations based on fixed management currency exchange rates. All other accounting policies ofthe reportable segments are consistent with accounting principles generally accepted in the United States of America and the accounting policies of the companydescribed in Note 2 of these notes to consolidated financial statements. The profitability of the company’s operating segments is evaluated by management basedon operating income. Intersegment sales and transfers were not significant.
Financial information for each of the company’s reportable segments is as follows:
December 31 (thousands) 2004 2003 2002
United States $476,804 $404,209 $418,973
International 319,493 322,801 290,049
Corporate 4,653
Effect of foreign currency translation 38,433 9,787 (33,410)
Consolidated $834,730 $736,797 $680,265
services were approximately 10 percent, 10 percent and 11 percent ofconsolidated net sales in 2004, 2003 and 2002, respectively.
Property, plant and equipment of the company’s United States andInternational operations were as follows:

50 • GO • Ecolab
NOTE 17. QUARTERLY FINANCIAL DATA (UNAUDITED)
First Second Third Fourth(thousands, except per share) Quarter Quarter Quarter Quarter Year
2004Net sales
United States Cleaning & Sanitizing $430,734 $ 450,625 $ 478,464 $ 436,532 $1,796,355United States Other Services 77,775 85,875 89,157 86,498 339,305International 439,174 485,819 497,717 508,611 1,931,321 Effect of foreign currency translation 31,688 20,392 24,978 40,894 117,952Total 979,371 1,042,711 1,090,316 1,072,535 4,184,933
Cost of sales (including special charges (income) of $(50), $(16) and $(40) in the first, second and fourth quarters, respectively) 474,094 504,609 519,669 532,908 2,031,280
Selling, general and administrative expenses 385,333 402,487 410,360 416,884 1,615,064Special charges (income) 3,805 (254) 1,345 (429) 4,467Operating income
United States Cleaning & Sanitizing 77,290 75,297 86,443 51,336 290,366United States Other Services 5,198 8,123 6,697 4,414 24,432International 34,949 50,049 64,020 61,577 210,595Corporate (3,755) 270 (1,345) 469 (4,361)Effect of foreign currency translation 2,457 2,130 3,127 5,376 13,090 Total 116,139 135,869 158,942 123,172 534,122
Interest expense, net 11,173 11,217 11,566 11,388 45,344Income before income taxes 104,966 124,652 147,376 111,784 488,778Provision for income taxes 38,960 46,359 52,429 40,542 178,290Net income $ 66,006 $ 78,293 $ 94,947 $ 71,242 $ 310,488
Basic net income per common share $ 0.26 $ 0.30 $ 0.37 $ 0.28 $ 1.21Diluted net income per common share $ 0.25 $ 0.30 $ 0.36 $ 0.27 $ 1.19Weighted-average common shares outstanding
Basic 257,025 257,135 258,368 257,774 257,575Diluted 260,227 260,905 262,252 262,282 261,776
2003Net sales
United States Cleaning & Sanitizing $417,299 $ 430,901 $ 444,791 $ 401,332 $1,694,323United States Other Services 73,329 82,963 83,497 80,655 320,444International 415,723 448,744 460,371 472,562 1,797,400Effect of foreign currency translation (30,499) (15,873) (5,893) 1,917 (50,348)Total 875,852 946,735 982,766 956,466 3,761,819
Cost of sales (including special charges (income) of $(45) and $(31) in first and fourth quarters) 430,482 466,734 478,163 469,823 1,845,202
Selling, general and administrative expenses 344,033 358,783 357,923 372,812 1,433,551Special charges (income) (197) (147) 1,224 (472) 408Operating income
United States Cleaning & Sanitizing 69,906 71,943 82,472 60,891 285,212United States Other Services 3,647 6,785 8,755 1,844 21,031International 30,580 44,524 56,772 55,988 187,864Corporate 242 106 (1,184) (3,998) (4,834)Effect of foreign currency translation (2,841) (1,993) (1,359) (422) (6,615)Total 101,534 121,365 145,456 114,303 482,658
Gain on sale of equity investment 10,877 228 11,105Interest expense, net 10,703 11,752 12,051 10,839 45,345Income before income taxes 90,831 109,613 144,282 103,692 448,418Provision for income taxes 35,513 42,458 56,843 36,256 171,070Net income $ 55,318 $ 67,155 $ 87,439 $ 67,436 $ 277,348
Basic net income per common share $ 0.21 $ 0.26 $ 0.34 $ 0.26 $ 1.07Diluted net income per common share $ 0.21 $ 0.25 $ 0.33 $ 0.26 $ 1.06Weighted-average common shares outstanding
Basic 260,448 261,246 258,694 257,428 259,454Diluted 263,637 264,553 261,609 260,628 262,737
Special charges are included in corporate operating income. Per share amounts do not necessarily sum due to changes in the calculation of shares outstanding for each discrete period androunding.
REPORTS OF MANAGEMENTTo the Shareholders:Management’s Responsibility for FinancialStatementsManagement is responsible for the integrity and objectivity of the consolidatedfinancial statements. The statements have been prepared in accordance withaccounting principles generally accepted in the United States of America and,accordingly, include certain amounts based on management’s best estimatesand judgments.
The Board of Directors, acting through its Audit Committee composedsolely of independent directors, is responsible for determining that managementfulfills its responsibilities in the preparation of financial statements andmaintains financial control of operations. The Audit Committee recommends tothe Board of Directors the appointment of the company’s independent registeredpublic accounting firm, subject to ratification by the shareholders. It meetsregularly with management, the internal auditors and the independent auditors.
The independent registered public accounting firm has audited theconsolidated financial statements included in this annual report and haveexpressed their opinion regarding whether these consolidated financial state-ments present fairly in all material respects our financial position and results ofoperation and cash flows as stated in their report presented separately herein.
Management’s Report on Internal ControlOver Financial ReportingManagement is responsible for establishing and maintaining adequate internalcontrol over financial reporting, as such term is defined in Exchange Act Rule13a-15(f). Under the supervision and with the participation of management,including the principal executive officer and principal financial officer, anevaluation of the design and operating effectiveness of internal control overfinancial reporting was conducted based on the framework in Internal Control-Integrated Framework issued by the Committee of Sponsoring Organizations ofthe Treadway Commission. Based on the evaluation under the framework inInternal Control Integrated Framework, management concluded that internalcontrol over financial reporting was effective as of December 31, 2004.
Management’s assessment of the effectiveness of the company’s internalcontrol over financial reporting as of December 31, 2004 has been audited byPricwaterhouseCoopers LLP, an independent registered public accounting firm,as stated in their report which is included herein.
Douglas M. Baker, Jr. Steven L. FritzePresident and Chief Executive Officer Executive Vice President and
Chief Financial Officer
REPORT OF INDEPENDENT REGISTEREDPUBLIC ACCOUNTING FIRM To the Shareholders and Directors of Ecolab Inc.:We have completed an integrated audit of Ecolab Inc.’s 2004 consolidatedfinancial statements and of its internal control over financial reporting as ofDecember 31, 2004 and audits of its 2003 and 2002 consolidated financialstatements in accordance with the standards of the Public Company AccountingOversight Board (United States). Our opinions, based on our audits, arepresented below.
Consolidated Financial StatementsIn our opinion, the accompanying consolidated balance sheets and the relatedconsolidated statements of income, of cash flows, of comprehensive incomeand shareholders’ equity present fairly, in all material respects, the financialposition of Ecolab Inc. and its subsidiaries at December 31, 2004, 2003, and2002, and the results of their operations and their cash flows for each of thethree years in the period ended December 31, 2004 in conformity withaccounting principles generally accepted in the United States of America. These
financial statements are the responsibility of Ecolab Inc.’s management. Ourresponsibility is to express an opinion on these financial statements based onour audits. We conducted our audits of these statements in accordance with thestandards of the Public Company Accounting Oversight Board (United States).Those standards require that we plan and perform the audit to obtain reason-able assurance about whether the financial statements are free of materialmisstatement. An audit of financial statements includes examining, on a testbasis, evidence supporting the amounts and disclosures in the financial state-ments, assessing the accounting principles used and significant estimates madeby management, and evaluating the overall financial statement presentation.We believe that our audits provide a reasonable basis for our opinion.
As discussed in Note 2 to the consolidated financial statements, EcolabInc. changed the manner in which it accounts for goodwill and other intangibleassets as of January 1, 2002.
Internal Control Over Financial ReportingAlso, in our opinion, management’s assessment, included in the accompanyingManagement’s Report on Internal Control Over Financial Reporting, that theCompany maintained effective internal control over financial reporting as ofDecember 31, 2004 based on criteria established in Internal Control - IntegratedFramework issued by the Committee of Sponsoring Organizations of theTreadway Commission (COSO), is fairly stated, in all material respects, based onthose criteria. Furthermore, in our opinion, Ecolab Inc. maintained, in all materialrespects, effective internal control over financial reporting as of December 31,2004, based on criteria established in Internal Control - Integrated Frameworkissued by the COSO. Ecolab Inc.’s management is responsible for maintainingeffective internal control over financial reporting and for its assessment of theeffectiveness of internal control over financial reporting. Our responsibility is toexpress opinions on management’s assessment and on the effectiveness ofEcolab Inc.’s internal control over financial reporting based on our audit. Weconducted our audit of internal control over financial reporting in accordancewith the standards of the Public Company Accounting Oversight Board (UnitedStates). Those standards require that we plan and perform the audit to obtainreasonable assurance about whether effective internal control over financialreporting was maintained in all material respects. An audit of internal controlover financial reporting includes obtaining an understanding of internal controlover financial reporting, evaluating management’s assessment, testing andevaluating the design and operating effectiveness of internal control, andperforming such other procedures as we consider necessary in the circum-stances. We believe that our audit provides a reasonable basis for our opinions.
A company’s internal control over financial reporting is a process designedto provide reasonable assurance regarding the reliability of financial reportingand the preparation of financial statements for external purposes in accordancewith generally accepted accounting principles. A company’s internal control overfinancial reporting includes those policies and procedures that (i) pertain to themaintenance of records that, in reasonable detail, accurately and fairly reflectthe transactions and dispositions of the assets of the company; (ii) providereasonable assurance that transactions are recorded as necessary to permitpreparation of financial statements in accordance with generally acceptedaccounting principles, and that receipts and expenditures of the company arebeing made only in accordance with authorizations of management and direc-tors of the company; and (iii) provide reasonable assurance regarding preventionor timely detection of unauthorized acquisition, use, or disposition of thecompany’s assets that could have a material effect on the financial statements.
Because of its inherent limitations, internal control over financial reportingmay not prevent or detect misstatements. Also, projections of any evaluation ofeffectiveness to future periods are subject to the risk that controls may becomeinadequate because of changes in conditions, or that the degree of compliancewith the policies or procedures may deteriorate.
PricewaterhouseCoopers LLPMinneapolis, MinnesotaFebruary 24, 2005
Ecolab • GO • 51
REPORTS OF MANAGEMENT AND INDEPENDENT REGISTERED PUBLIC ACCOUNTING FIRM
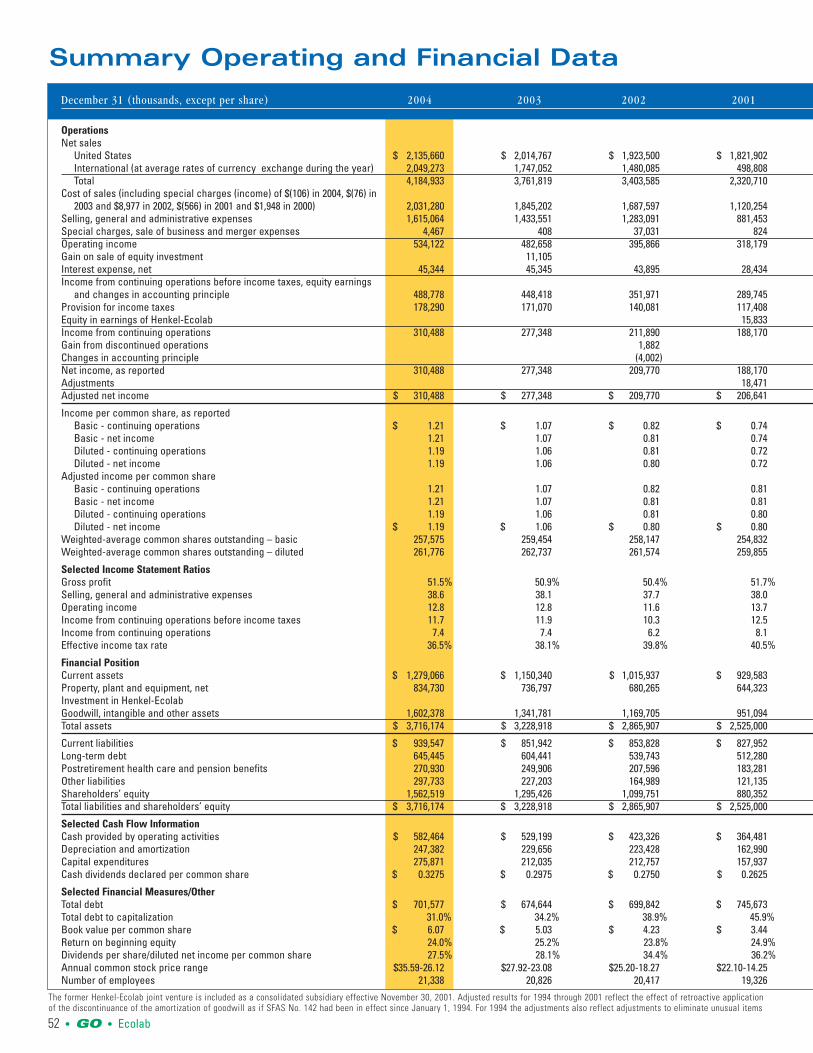
52 • GO • Ecolab
Summary Operating and Financial Data
December 31 (thousands, except per share) 2004 2003 2002 2001
OperationsNet sales
United States $ 2,135,660 $ 2,014,767 $ 1,923,500 $ 1,821,902International (at average rates of currency exchange during the year) 2,049,273 1,747,052 1,480,085 498,808Total 4,184,933 3,761,819 3,403,585 2,320,710
Cost of sales (including special charges (income) of $(106) in 2004, $(76) in 2003 and $8,977 in 2002, $(566) in 2001 and $1,948 in 2000) 2,031,280 1,845,202 1,687,597 1,120,254
Selling, general and administrative expenses 1,615,064 1,433,551 1,283,091 881,453Special charges, sale of business and merger expenses 4,467 408 37,031 824Operating income 534,122 482,658 395,866 318,179Gain on sale of equity investment 11,105Interest expense, net 45,344 45,345 43,895 28,434Income from continuing operations before income taxes, equity earnings
and changes in accounting principle 488,778 448,418 351,971 289,745Provision for income taxes 178,290 171,070 140,081 117,408Equity in earnings of Henkel-Ecolab 15,833Income from continuing operations 310,488 277,348 211,890 188,170Gain from discontinued operations 1,882Changes in accounting principle (4,002)Net income, as reported 310,488 277,348 209,770 188,170Adjustments 18,471Adjusted net income $ 310,488 $ 277,348 $ 209,770 $ 206,641
Income per common share, as reported Basic - continuing operations $ 1.21 $ 1.07 $ 0.82 $ 0.74Basic - net income 1.21 1.07 0.81 0.74Diluted - continuing operations 1.19 1.06 0.81 0.72Diluted - net income 1.19 1.06 0.80 0.72
Adjusted income per common shareBasic - continuing operations 1.21 1.07 0.82 0.81Basic - net income 1.21 1.07 0.81 0.81Diluted - continuing operations 1.19 1.06 0.81 0.80Diluted - net income $ 1.19 $ 1.06 $ 0.80 $ 0.80
Weighted-average common shares outstanding – basic 257,575 259,454 258,147 254,832Weighted-average common shares outstanding – diluted 261,776 262,737 261,574 259,855
Selected Income Statement RatiosGross profit 51.5% 50.9% 50.4% 51.7%Selling, general and administrative expenses 38.6 38.1 37.7 38.0Operating income 12.8 12.8 11.6 13.7Income from continuing operations before income taxes 11.7 11.9 10.3 12.5Income from continuing operations 7.4 7.4 6.2 8.1Effective income tax rate 36.5% 38.1% 39.8% 40.5%
Financial PositionCurrent assets $ 1,279,066 $ 1,150,340 $ 1,015,937 $ 929,583Property, plant and equipment, net 834,730 736,797 680,265 644,323Investment in Henkel-EcolabGoodwill, intangible and other assets 1,602,378 1,341,781 1,169,705 951,094Total assets $ 3,716,174 $ 3,228,918 $ 2,865,907 $ 2,525,000
Current liabilities $ 939,547 $ 851,942 $ 853,828 $ 827,952Long-term debt 645,445 604,441 539,743 512,280Postretirement health care and pension benefits 270,930 249,906 207,596 183,281Other liabilities 297,733 227,203 164,989 121,135Shareholders’ equity 1,562,519 1,295,426 1,099,751 880,352Total liabilities and shareholders’ equity $ 3,716,174 $ 3,228,918 $ 2,865,907 $ 2,525,000
Selected Cash Flow InformationCash provided by operating activities $ 582,464 $ 529,199 $ 423,326 $ 364,481Depreciation and amortization 247,382 229,656 223,428 162,990Capital expenditures 275,871 212,035 212,757 157,937Cash dividends declared per common share $ 0.3275 $ 0.2975 $ 0.2750 $ 0.2625
Selected Financial Measures/OtherTotal debt $ 701,577 $ 674,644 $ 699,842 $ 745,673Total debt to capitalization 31.0% 34.2% 38.9% 45.9%Book value per common share $ 6.07 $ 5.03 $ 4.23 $ 3.44Return on beginning equity 24.0% 25.2% 23.8% 24.9%Dividends per share/diluted net income per common share 27.5% 28.1% 34.4% 36.2%Annual common stock price range $35.59-26.12 $27.92-23.08 $25.20-18.27 $22.10-14.25Number of employees 21,338 20,826 20,417 19,326
The former Henkel-Ecolab joint venture is included as a consolidated subsidiary effective November 30, 2001. Adjusted results for 1994 through 2001 reflect the effect of retroactive applicationof the discontinuance of the amortization of goodwill as if SFAS No. 142 had been in effect since January 1, 1994. For 1994 the adjustments also reflect adjustments to eliminate unusual items

Ecolab • GO • 53
2000 1999 1998 1997 1996 1995 1994
$ 1,746,698 $ 1,605,385 $ 1,429,711 $ 1,251,517 $1,127,281 $1,008,910 $ 923,667483,963 444,413 431,366 364,524 341,231 310,755 265,544
2,230,661 2,049,798 1,861,077 1,616,041 1,468,512 1,319,665 1,189,211
1,056,263 963,476 874,793 745,256 694,791 622,342 550,308851,995 796,371 724,304 652,281 588,404 534,637 493,939(20,736) 8,000343,139 289,951 261,980 218,504 185,317 162,686 136,964
24,605 22,713 21,742 12,637 14,372 11,505 12,909
318,534 267,238 240,238 205,867 170,945 151,181 124,055129,495 109,769 101,782 85,345 70,771 59,694 50,44419,516 18,317 16,050 13,433 13,011 7,702 10,951
208,555 175,786 154,506 133,955 113,185 99,189 84,56238,000
(2,428)206,127 175,786 192,506 133,955 113,185 99,189 84,56217,762 16,631 14,934 11,195 10,683 8,096 12,757
$ 223,889 $ 192,417 $ 207,440 $ 145,150 $ 123,868 $ 107,285 $ 97,319
$ 0.82 $ 0.68 $ 0.60 $ 0.52 $ 0.44 $ 0.38 $ 0.310.81 0.68 0.75 0.52 0.44 0.38 0.310.79 0.65 0.58 0.50 0.43 0.37 0.310.78 0.65 0.72 0.50 0.43 0.37 0.31
0.89 0.74 0.66 0.56 0.48 0.41 0.360.88 0.74 0.80 0.56 0.48 0.41 0.360.86 0.72 0.63 0.54 0.47 0.40 0.35
$ 0.85 $ 0.72 $ 0.77 $ 0.54 $ 0.47 $ 0.40 $ 0.35255,505 259,099 258,314 258,891 257,983 264,387 270,200263,892 268,837 268,095 267,643 265,634 269,912 274,612
52.6% 53.0% 53.0% 53.9% 52.7% 52.8% 53.7%38.2 38.9 38.9 40.4 40.1 40.5 41.515.4 14.1 14.1 13.5 12.6 12.3 11.514.3 13.0 12.9 12.7 11.6 11.5 10.49.3 8.6 8.3 8.3 7.7 7.5 7.1
40.7% 41.1% 42.4% 41.5% 41.4% 39.5% 40.7%
$ 600,568 $ 577,321 $ 503,514 $ 509,501 $ 435,507 $ 358,072 $ 401,179501,640 448,116 420,205 395,562 332,314 292,937 246,191199,642 219,003 253,646 239,879 285,237 302,298 284,570412,161 341,506 293,630 271,357 155,351 107,573 88,416
$ 1,714,011 $ 1,585,946 $ 1,470,995 $ 1,416,299 $1,208,409 $1,060,880 $1,020,356
$ 532,034 $ 470,674 $ 399,791 $ 404,464 $ 327,771 $ 310,538 $ 253,665234,377 169,014 227,041 259,384 148,683 89,402 105,393117,790 97,527 85,793 76,109 73,577 70,666 70,88272,803 86,715 67,829 124,641 138,415 133,616 128,608
757,007 762,016 690,541 551,701 519,963 456,658 461,808$ 1,714,011 $ 1,585,946 $ 1,470,995 $ 1,416,299 $1,208,409 $1,060,880 $1,020,356
$ 315,486 $ 293,494 $ 235,642 $ 235,098 $ 254,269 $ 166,463 $ 169,346148,436 134,530 121,971 100,879 89,523 76,279 66,869150,009 145,622 147,631 121,667 111,518 109,894 88,457
$ 0.2450 $ 0.2175 $ 0.1950 $ 0.1675 $ 0.1450 $ 0.1288 $ 0.1138
$ 370,969 $ 281,074 $ 295,032 $ 308,268 $ 176,292 $ 161,049 $ 147,21332.9% 26.9% 29.9% 35.8% 25.3% 26.1% 24.2%
$ 2.98 $ 2.94 $ 2.67 $ 2.14 $ 2.01 $ 1.76 $ 1.7127.1% 25.5% 34.9% 25.8% 24.8% 21.5% 21.6%31.4% 33.2% 27.1% 33.5% 34.1% 35.3% 36.7%
$22.85-14.00 $22.22-15.85 $19.00-13.07 $ 14.00-9.07 $9.88-7.28 $7.94-5.00 $5.88-4.8214,250 12,870 12,007 10,210 9,573 9,026 8,206
associated with Ecolab’s acquisition of Kay Chemical Company in December 1994. All per share, shares outstanding and market price data reflect the two-for-one stock splits declared in 2003and 1997. Return on beginning equity is net income divided by beginning shareholders’ equity.