ecolab 2002financialdiscuss
TRANSCRIPT

TU
RN
IT
UP
20
EC
OL
AB
The following discussion and analysis provides information that manage-ment believes is useful in understanding Ecolab’s operating results, cashflows and financial position. The discussion should be read in conjunctionwith the consolidated financial statements and related notes.
Forward-Looking StatementsThis financial discussion and other portions of this Annual Report toShareholders contain various “Forward-Looking Statements” within themeaning of the Private Securities Litigation Reform Act of 1995. Theseinclude expectations concerning business progress and expansion, businessacquisitions, debt repayments, susceptibility to changes in technology,global economic conditions and liquidity requirements. These statements,which represent Ecolab’s expectations or beliefs concerning various futureevents, are based on current expectations. Therefore, they involve a numberof risks and uncertainties that could cause actual results to differ materiallyfrom those of such Forward-Looking Statements. These risks and uncertain-ties include the vitality of the hospitality, foodservice and travel industries;restraints on pricing flexibility due to competitive factors and customer andvendor consolidations; changes in oil or raw material prices or unavailabilityof adequate and reasonably priced raw materials; the occurrence of capacityconstraints or the loss of a key supplier; the effect of future acquisitions or divestitures or other corporate transactions; the company’s ability toachieve plans for past acquisitions; the costs and effects of complying with:(i) laws and regulations relating to the environment and to the manufacture,storage, distribution, efficacy and labeling of the company’s products and (ii)changes in tax, fiscal, governmental and other regulatory policies; economicfactors such as the worldwide economy, interest rates and currency move-ments, including, in particular, the company’s exposure to foreign currencyrisk; the occurrence of (a) litigation or claims, (b) the loss or insolvency of a major customer or distributor, (c) war, (d) natural or manmade disasters(including material acts of terrorism or other hostilities which impact thecompany’s markets) and, (e) severe weather conditions affecting the food-service, hospitality and travel industries; loss of, or changes in, executivemanagement; the company’s ability to continue product introductions andtechnological innovations; and other uncertainties or risks reported fromtime-to-time in the company’s reports to the Securities and ExchangeCommission. In addition, the company notes that its stock price can beaffected by fluctuations in quarterly earnings. There can be no assurancesthat the company’s earnings levels will meet investors’ expectations.
2002 OverviewIn 2002, Ecolab achieved a strong financial performance, posting double-digit net income growth, strong cash flow increases, a healthy return oninvestment and an improved balance sheet. Moreover, the company didthis against a challenging global economic environment, utilizing aggres-sive actions, new product and service introductions and the effectiveimplementation of its successful Circle the Customer – Circle the Globegrowth strategy to expand its market potential. The following discussesthese actions and others in more detail:■ Diluted net income per share was $1.60 for 2002, up 10 percent from$1.45 in 2001. Several unusual items affect the comparability in 2002 and2001 net income and earnings per share. For 2002, these items include
(i) a transitional impairment charge from the adoption of Statement ofFinancial Accounting Standards (SFAS) No. 142 of $4.0 million after tax($0.03 per diluted share), (ii) a one-time gain from benefit plan changes of$3.5 million after tax ($0.03 per diluted share), (iii) special charges relatedto restructuring and the integration of European operations of $32.4 millionafter tax ($0.25 per diluted share) and (iv) a gain from discontinued opera-tions of $1.9 million after tax ($0.01 per diluted share). Comparison ofresults with those of 2001 is also affected by the adoption of SFAS No.142(the elimination of goodwill amortization) and the acquisition and consolida-tion of the former European joint venture at the end of 2001. If the Europeanoperations had been consolidated with Ecolab for 2001, the effect wouldhave been an increase in diluted income per share of $0.03 for 2001. Inaddition, if SFAS No. 142 had been applied to 2001 operating results,including the joint venture on a consolidated basis, diluted income percommon share would have increased by $0.15 for 2001. Excluding theitems previously mentioned from both 2002 and 2001, diluted income pershare from ongoing operations on a pro forma basis increased 13 percentto $1.84 in 2002 from $1.63 in 2001.■ Return on beginning shareholders’ equity was 24 percent for 2002 compared with 25 percent in 2001. Adjusting for the unusual items in2002, return on beginning shareholders’ equity was 27 percent. This was the eleventh consecutive year the company exceeded its long-termfinancial objective of a 20 percent return on beginning shareholders’ equity.■ The company maintained its debt rating within the “A” categories of themajor rating agencies during 2002.■ For the third consecutive year, as well as for the past ten out of twelveyears, the company’s stock price out performed the Standard & Poor’s 500index. Ecolab’s stock price increased 23 percent during 2002 compared witha decrease of 23 percent in the Standard & Poor’s 500 index. Including cashdividends, Ecolab’s total return to shareholders was 24 percent for 2002.■ Net sales for 2002 reached an all-time high of $3.4 billion and increased47 percent over 2001. Net sales for 2002 include sales of $0.9 billion forEuropean operations, which was acquired as of year-end 2001. Net salesfor 2002 increased 7 percent compared with pro forma sales for 2001,including the European joint venture.
Financial discussion
Return on Beginning Equity
(Percent)
23.8%24.9%27.1%
25.5%
34.9%
20022001200019991998
Net income divided by beginning equity. Share appreciation plus dividends
S&P 500 Total Return
Total Return to Shareholders
(Percent)
24.3%
(23.4)%
(5.6)%
(11.9)%
11.6%
(9.1)%
21.0%
31.9%
28.6%
20022001200019991998
9.3%

EC
OL
AB
21
■ Operating income was $396 million for 2002, an increase of 24 percentfrom $318 million in 2001. This includes operating income of $84 millionfor European operations. Operating income represented 11.6 percent of netsales, down from last year’s 13.7 percent. Excluding unusual items (specialcharges in 2002 and elimination of goodwill amortization and consolidationof the European joint venture in 2001), pro forma operating income for2002 increased 9 percent over 2001. Pro forma operating income was 13.0 percent of net sales in 2002 compared with 12.7 percent in 2001.■ The company increased its annual cash dividend rate for the eleventhconsecutive year. The cash dividend was increased 7 percent in December2002 to an annual rate of $0.58 per common share.■ During 2002, the company completed the plans announced in early2002 to undertake restructuring and cost saving actions and activities to integrate the newly acquired European operations. The company’s 2002results also include the impact of acquisitions completed during the year,including Audits International, Kleencare Hygiene and Terminix, Ltd., inorder to continue to broaden its product and service offerings in line withits Circle the Customer – Circle the Globe strategy.
Critical Accounting Policies and EstimatesManagement’s discussion and analysis of its financial condition and resultsof operations are based upon the company’s consolidated financial state-ments, which have been prepared in accordance with accounting principlesgenerally accepted in the United States of America. The preparation of thesefinancial statements requires management to make certain estimates andassumptions that affect the reported amounts of assets and liabilities as of the date of the financial statements and the reported revenues andexpenses during the reporting period. Management bases these estimateson historical experience and various other evidence and assumptions thatare believed to be reasonable under the circumstances, the results of whichform the basis for making judgments about the recorded values of certainassets and liabilities. Actual results could differ from these estimates.
Management believes the company’s critical accounting policies andareas that require more significant judgments and estimates used in thepreparation of its consolidated financial statements to be:■ revenue recognition, including the effects of customer based programsand incentives;■ estimating valuation allowances and accrued liabilities, specifically salesreturns and allowances, the allowance for doubtful accounts and litigationand environmental accruals;■ the determination of actuarially determined liabilities related to pensionplans, other postretirement benefit obligations and self-insurance reserves;■ accounting for income taxes;■ valuation and useful lives of long-lived and intangible assets; and■ determining functional currencies for the purpose of consolidating ourInternational operations.
The company recognizes revenue on product sales at the time titletransfers to the customer. The company records estimated reductions torevenue for customer programs and incentive offerings including pricingarrangements, promotions and other volume-based incentives. If marketconditions were to decline, the company may take actions to increase
customer incentive offerings, possibly resulting in a reduction of grossprofit margins at the time the incentive is offered.
Management estimates sales returns and allowances by analyzing his-torical returns and credits, and applies these trend rates to the most recent12 months’ sales data to calculate estimated reserves for future credits.Management estimates the allowance for doubtful accounts by analyzingaccounts receivable balances by age, applying historical trend rates to themost recent 12 months’ sales, less actual write-offs to date. In addition,management’s estimates also include separately providing for 100 percentof specific customer balances when it is deemed probable that the balanceis uncollectible. Actual results could differ from these estimates under dif-ferent assumptions.
Management’s current estimated ranges of liabilities related to pendinglitigation and environmental claims are based on management’s best esti-mate of probable future costs. The company has recorded the amounts that represent the points in the ranges that management believes are mostprobable or the minimum amounts when no amount within the range is abetter estimate than any other amount. Potential insurance reimbursementsare not anticipated in the company’s accruals for environmental liabilities.While the final resolution of litigation and environmental contingenciescould result in amounts different than current accruals, and therefore have an impact on the company’s consolidated financial results in a futurereporting period, management believes the ultimate outcome will not havea significant effect on the company’s consolidated results of operations,financial position or cash flows.
Pension and other postretirement benefit obligations are actuariallydetermined. These calculations include assumptions related to the discountrate, projected salary and health care increases and the expected return on assets. The company is self-insured in North America for most workerscompensation, general liability and automotive liability losses subject to per occurrence and aggregate annual liability limitations. The company isinsured for losses in excess of these limitations. The company is also self-insured for health care claims for eligible participating employees subjectto certain deductibles and limitations. The company determines its liabili-ties for claims incurred but not reported on an actuarial basis. A change inthese assumptions could cause actual results to differ from those reported.
Management judgment is required in determining the provision forincome taxes, deferred tax assets and liabilities and any valuation allowancerecorded against net deferred tax assets. As part of the process of preparingthe company’s consolidated financial statements, management is requiredto estimate income taxes in each of the jurisdictions in which the companyoperates. This process involves estimating actual current tax exposuretogether with assessing temporary differences resulting from differing treat-ment of items for tax and book accounting purposes. These differencesresult in deferred tax assets and liabilities, which are included within thecompany’s consolidated balance sheet. Management must then assess the likelihood that deferred tax assets will be recovered from future taxableincome and to the extent management believes that recovery is not likely,a valuation allowance must be established. To the extent that a valuationallowance is established or increased, an expense within the tax provisionis included in the statement of operations.
TU
RN
IT
UP

22
EC
OL
AB
Management periodically reviews its long-lived and intangible assets forimpairment and assesses whether significant events or changes in businesscircumstances indicate that the carrying value of the assets may not berecoverable. An impairment loss is recognized when the carrying amount ofan asset exceeds the anticipated future undiscounted cash flows expectedto result from the use of the asset and its eventual disposition. The amountof the impairment loss to be recorded, if any, is calculated by the excess ofthe asset’s carrying value over its estimated fair value. Management alsoperiodically reassesses the estimated remaining useful lives of its long-livedassets. Changes to estimated useful lives would impact the amount ofdepreciation and amortization expense recorded in earnings.
In 2002, SFAS No. 142, “Goodwill and Other Intangible Assets” becameeffective and as a result, the company ceased to amortize goodwill in2002. The company estimates the impact of discontinuing the amortizationof goodwill to have increased net income by approximately $28.8 million,or $0.22 per diluted share for the year ended December 31, 2002. Thecompany was required to perform an initial impairment review of its good-will in 2002 under the guidelines of SFAS 142. The result of testing good-will for impairment was a non-cash charge of $4.0 million ($0.03 pershare). All of the impairment charge relates to the Africa/Export reportingunit due to the difficult economic environment in that region. Managementhas continued to review its goodwill for impairment on a reporting unitbasis under the guidelines of SFAS No. 142 on an annual basis.
In preparing the consolidated financial statements, the company isrequired to translate the financial statements of its foreign subsidiaries fromthe currency in which they keep their accounting records, generally the localcurrency, into United States dollars. Assets and liabilities of these operationsare translated at the exchange rates in effect at each fiscal year end. Thetranslation adjustments related to assets and liabilities that arise from theuse of differing exchange rates from period to period are included in accu-mulated other comprehensive loss in shareholders’ equity. Income statementaccounts are translated at the average rates of exchange prevailing duringthe year. The different exchange rates from period to period impact theamount of reported income from the company’s International operations.
Operating Results
Consolidated
(thousands, except per share) 2002 2001 2000
Net sales $3,403,585 $2,320,710 $2,230,661
Operating income $ 395,866 $ 318,179 $ 343,139
Income
Continuing operations before change in accounting $ 211,890 $ 188,170 $ 208,555
Change in accounting (4,002) (2,428)
Discontinued operations 1,882
Net income $ 209,770 $ 188,170 $ 206,127
Diluted income per common share
Continuing operations before change in accounting $ 1.62 $ 1.45 $ 1.58
Change in accounting (0.03) (0.02)
Discontinued operations 0.01
Net income $ 1.60 $ 1.45 $ 1.56
Financial results for 2002 include several unusual items, most notably (i) a transitional impairment charge from the adoption of SFAS No. 142,(ii) a one-time gain from benefit plan changes, (iii) special charges relatedto restructuring and the integration of European operations and (iv) a gainfrom discontinued operations. Comparison of results with those of 2001 isalso affected by the adoption of SFAS No. 142 (the elimination of goodwillamortization) and the acquisition and consolidation of the former Europeanjoint venture at the end of 2001. The company has published certain histor-ical unaudited pro forma financial information for 2001 to assist investorsin understanding the pro forma effects of the adoption of SFAS No. 142,and the acquisition of the former European joint venture, as well as theeffects of certain reclassifying adjustments.
In connection with adopting Emerging Issues Task Force (EITF) 01-09,Accounting for Consideration Given by a Vendor to a Customer, the companyreclassified certain customer incentive costs from selling, general andadministrative expenses to a component of revenue at the beginning of2002. Prior year results have been reclassified for consistency purposes,the impact of which decreased previously reported revenue by approximately$34 million for each of the years ended December 31, 2001 and 2000. Also,at the beginning of 2002, the company reclassified repair part costs fromselling, general and administrative expenses to cost of sales. Prior yearcosts have been reclassified to increase cost of sales by $31 million for2001 and $30 million for 2000. These reclassifications had no impact onpreviously reported net income or shareholders’ equity. The following man-agement discussion reflects these reclassifications.
The non-GAAP financial measures included in the following tables arenot presented pursuant to Article 11 (pro forma financial information) ofRegulation S-X and should be read in conjunction with the reported resultsdetermined in accordance with accounting principles generally accepted in the United States of America. They are provided to assist in the reader’sunderstanding of the impact of unusual items on the comparability of thecompany’s operations for the years ended December 31, 2002 and 2001.The tables below reconcile as reported amounts (U.S. GAAP amounts) to proforma amounts as adjusted for special charges related to the restructuringand integration of European operations, a one-time gain from benefit planchanges, a transitional impairment charge from the adoption of SFAS No.142and a gain from discontinued operations.
Supplemental 2002 Pro Forma Consolidated Operating Results Information
ExcludingYear Ended December 31, 2002 Unusual Unusual(thousands, except per share) Total Items* Items
Operating income $ 395,866 $ 46,008 $ 441,874
Interest expense, net (43,895) (43,895)
Income before income taxes 351,971 46,008 397,979
Provision for income taxes (140,081) (17,121) (157,202)
Change in accounting (4,002) 4,002
Discontinued operations 1,882 (1,882)
Net income $ 209,770 $ 31,007 $ 240,777
Diluted net income per common share $ 1.60 $ 0.24 $ 1.84
* Unusual items include special charges related to restructuring activities and the integrationof European operations of $51.8 million, a one-time gain from benefit plan changes of $5.8million, a change in accounting for the transitional impairment charge from the adoption ofSFAS No. 142 of $4.0 million and a gain from discontinued operations of $1.9 million.
TU
RN
IT
UP
Financial discussion

EC
OL
AB
23
Supplemental Diluted Earnings Per Share Information
(Diluted earnings per share) 2002 2001
Pro forma income from ongoing operations $ 1.84 $ 1.63
Pro forma adjustments:
Acquisition of European joint venture (0.03)
Adoption of SFAS No. 142 – to eliminate goodwill amortization (0.15)
Special charges (0.25)
One-time gain from benefit plan changes 0.03
Adoption of SFAS No. 142 – transitional impairment charge (0.03)
Discontinued operations 0.01
Net income, as reported $ 1.60 $ 1.45
Consolidated net sales reached $3.4 billion for 2002, an increase of 47 percent over net sales of $2.3 billion in 2001. Business acquisitions,primarily the acquisition of the European joint venture, contributed to theoverall sales growth for 2002. Excluding acquisitions, primarily the Europeanjoint venture, consolidated net sales increased 4 percent in 2002. Salesgrowth was experienced in most of the company’s divisions. Changes incurrency translation negatively impacted the consolidated sales growth rate by approximately 1 percentage point for 2002. Sales results reflectedaggressive selling efforts, the benefits of investments in sales force trainingand productivity tools, and new products, which were partially offset by thepoor economic environment.
The company’s consolidated gross profit margin was 50.4 percent of netsales for 2002, which decreased from a gross profit margin of 51.7 percentin 2001. Cost of sales included restructuring costs of $9.0 million for theyear ended December 31, 2002. Excluding these restructuring charges, thegross profit margin was 50.7 percent for 2002. The gross profit margin wasalso negatively affected by the acquisition and consolidation of the Europeanjoint venture. The gross profit margin for 2001 on a pro forma basis (reflect-ing the European joint venture on a consolidated basis) was 50.2 percent.Ecolab’s gross profit margin benefited from product mix improvements andcost reduction actions.
Selling, general and administrative expenses for 2002 were 37.7 per-cent of net sales, a decrease from total selling, general and administrativeexpenses of 38.0 percent of net sales in 2001. The selling, general andadministrative expense margin on a pro forma basis (reflecting the consoli-dation of the European joint venture and the elimination of goodwill amortiza-tion) for 2001 was 37.5 percent. This increase in 2002 over the prior year ispartially due to stronger sales and income, which resulted in higher commis-sions and incentive-based compensation. This increase was partially offsetby tight cost controls and savings related to restructuring activities in 2002.
During the first quarter of 2002, management approved various restruc-turing and other cost-saving actions, including costs to integrate the company’s European operations, in order to streamline and improve thecompany’s global operations. These actions resulted in pre-tax charges of$51.8 million ($32.4 million after tax, or $0.25 per diluted share) in 2002.These charges were partially offset by a curtailment gain of $5.8 million($3.5 million after tax, or $0.03 per diluted share) attributable to certainbenefit plan changes. The restructuring included a reduction of the company’s
global workforce during 2002, the closing of several facilities, the discontin-uance of selected product lines and other actions. The expected cost savingsrelated to restructuring activities began in 2002 and are expected to havetheir full impact beginning in 2003. Restructuring savings were approx-imately $16 million ($10 million after tax, or $0.08 per diluted share) in 2002.Beginning in 2003, the company expects annual pretax savings of $25 mil-lion to $30 million ($15 million to $18 million after tax). The company expectsto reinvest some of these savings in the business. Further details related tothese restructuring expenses are included in Note 3 of the notes to consoli-dated financial statements.
Operating income for 2002 was $396 million and increased by 24 per-cent over operating income of $318 million in 2001. As a percentage of netsales, operating income was 11.6 percent compared with 2001 operatingincome of 13.7 percent on an as reported basis. Excluding special charges,operating income for 2002 was $442 million, or 13.0 percent of net sales.This compared to 2001 pro forma operating income (reflecting the consolida-tion of the European joint venture and elimination of goodwill amortization)of $404 million, or 12.7 percent of net sales. This comparison of operatingincome margins reflects tight cost controls, savings from cost reductioninitiatives, and the sale of new products.
In addition to continuing operations, a legal issue related to the disposalof a business in 1992 was resolved during 2002, resulting in the recogni-tion of a gain from discontinued operations of approximately $1.9 million(net of income tax benefit of $1.1 million) or $0.01 per diluted share.
The company’s net income for 2002 was $210 million. Net incomeincluded restructuring charges of $32.4 million after tax, a curtailment gainof $3.5 million after tax, a gain from discontinued operations of $1.9 millionafter tax and a SFAS No. 142 transitional impairment charge of $4.0 millionafter tax. Excluding these items, after-tax income for 2002 was $241 mil-lion, an increase of 28 percent over net income of $188 million in 2001.This improvement reflected good operating income growth in most of thedivisions, the additional operating income generated by the acquisition ofthe European joint venture and the elimination of goodwill amortization. Thiswas partially offset by higher net interest expense due to increased borrow-ings primarily to finance the company’s acquisition of the European joint ven-ture. Currency translation benefited diluted net income by $0.02 per share for2002. As a percentage of net sales, after-tax income for 2002 was 6.2 per-cent. Excluding the unusual items previously mentioned, after-tax incomefor 2002 was 7.1 percent of net sales, down from 8.1 percent in 2001 dueto the addition of Europe.
2001 compared with 2000The non-GAAP financial measures included in the following table are not presented pursuant to Article 11 (pro forma financial information) ofRegulation S-X and should be read in conjunction with the reported resultsdetermined in accordance with accounting principles generally accepted in the United States of America. It is provided to assist in the reader’s under-standing of the impact of unusual items on the comparability of the com-pany’s operations for the year ended December 31, 2000. The table belowreconciles as reported amounts (U.S. GAAP amounts) to pro forma amounts as adjusted for the gain on the sale of Jackson, special charges and thecumulative effect of a change in accounting for revenue recognition.
TU
RN
IT
UP
24
EC
OL
AB
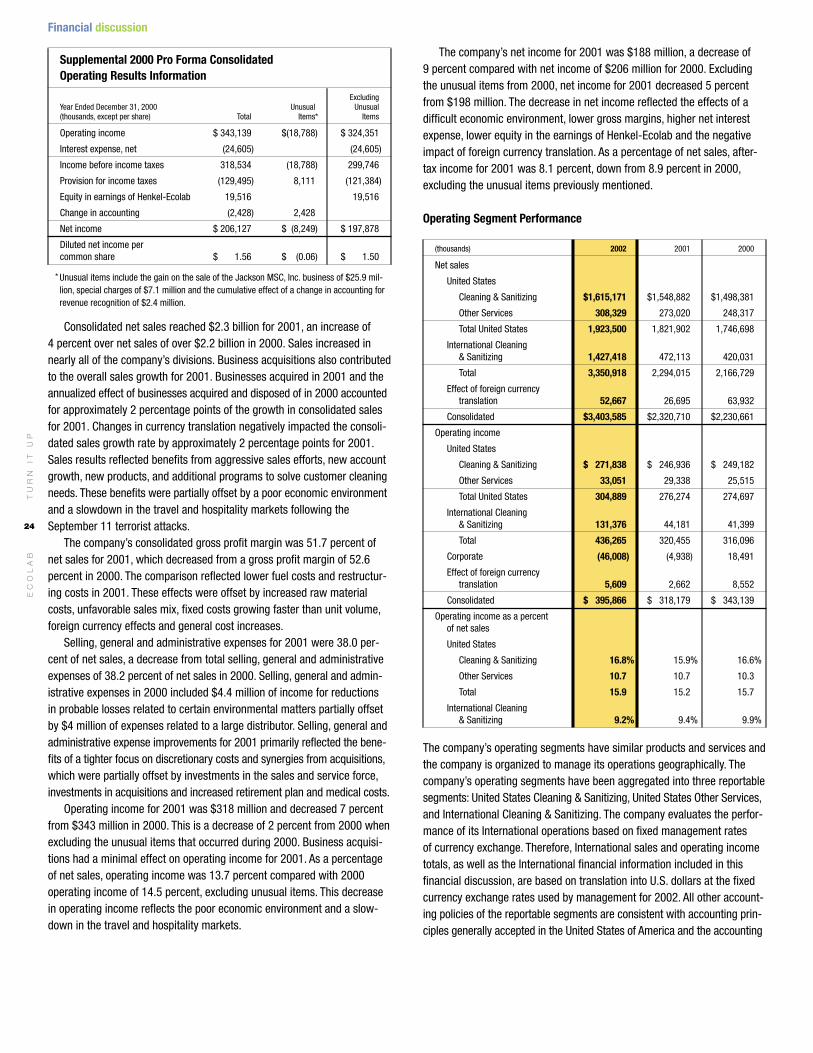
Supplemental 2000 Pro Forma Consolidated Operating Results Information
ExcludingYear Ended December 31, 2000 Unusual Unusual(thousands, except per share) Total Items* Items
Operating income $ 343,139 $(18,788) $ 324,351
Interest expense, net (24,605) (24,605)
Income before income taxes 318,534 (18,788) 299,746
Provision for income taxes (129,495) 8,111 (121,384)
Equity in earnings of Henkel-Ecolab 19,516 19,516
Change in accounting (2,428) 2,428
Net income $ 206,127 $ (8,249) $ 197,878
Diluted net income per common share $ 1.56 $ (0.06) $ 1.50
* Unusual items include the gain on the sale of the Jackson MSC, Inc. business of $25.9 mil-lion, special charges of $7.1 million and the cumulative effect of a change in accounting forrevenue recognition of $2.4 million.
Consolidated net sales reached $2.3 billion for 2001, an increase of 4 percent over net sales of over $2.2 billion in 2000. Sales increased innearly all of the company’s divisions. Business acquisitions also contributedto the overall sales growth for 2001. Businesses acquired in 2001 and theannualized effect of businesses acquired and disposed of in 2000 accountedfor approximately 2 percentage points of the growth in consolidated salesfor 2001. Changes in currency translation negatively impacted the consoli-dated sales growth rate by approximately 2 percentage points for 2001.Sales results reflected benefits from aggressive sales efforts, new accountgrowth, new products, and additional programs to solve customer cleaningneeds. These benefits were partially offset by a poor economic environmentand a slowdown in the travel and hospitality markets following theSeptember 11 terrorist attacks.
The company’s consolidated gross profit margin was 51.7 percent ofnet sales for 2001, which decreased from a gross profit margin of 52.6percent in 2000. The comparison reflected lower fuel costs and restructur-ing costs in 2001. These effects were offset by increased raw materialcosts, unfavorable sales mix, fixed costs growing faster than unit volume,foreign currency effects and general cost increases.
Selling, general and administrative expenses for 2001 were 38.0 per-cent of net sales, a decrease from total selling, general and administrativeexpenses of 38.2 percent of net sales in 2000. Selling, general and admin-istrative expenses in 2000 included $4.4 million of income for reductions in probable losses related to certain environmental matters partially offset by $4 million of expenses related to a large distributor. Selling, general andadministrative expense improvements for 2001 primarily reflected the bene-fits of a tighter focus on discretionary costs and synergies from acquisitions,which were partially offset by investments in the sales and service force,investments in acquisitions and increased retirement plan and medical costs.
Operating income for 2001 was $318 million and decreased 7 percentfrom $343 million in 2000. This is a decrease of 2 percent from 2000 whenexcluding the unusual items that occurred during 2000. Business acquisi-tions had a minimal effect on operating income for 2001. As a percentageof net sales, operating income was 13.7 percent compared with 2000operating income of 14.5 percent, excluding unusual items. This decreasein operating income reflects the poor economic environment and a slow-down in the travel and hospitality markets.
TU
RN
IT
UP
Financial discussion
The company’s net income for 2001 was $188 million, a decrease of 9 percent compared with net income of $206 million for 2000. Excludingthe unusual items from 2000, net income for 2001 decreased 5 percentfrom $198 million. The decrease in net income reflected the effects of adifficult economic environment, lower gross margins, higher net interestexpense, lower equity in the earnings of Henkel-Ecolab and the negativeimpact of foreign currency translation. As a percentage of net sales, after-tax income for 2001 was 8.1 percent, down from 8.9 percent in 2000,excluding the unusual items previously mentioned.
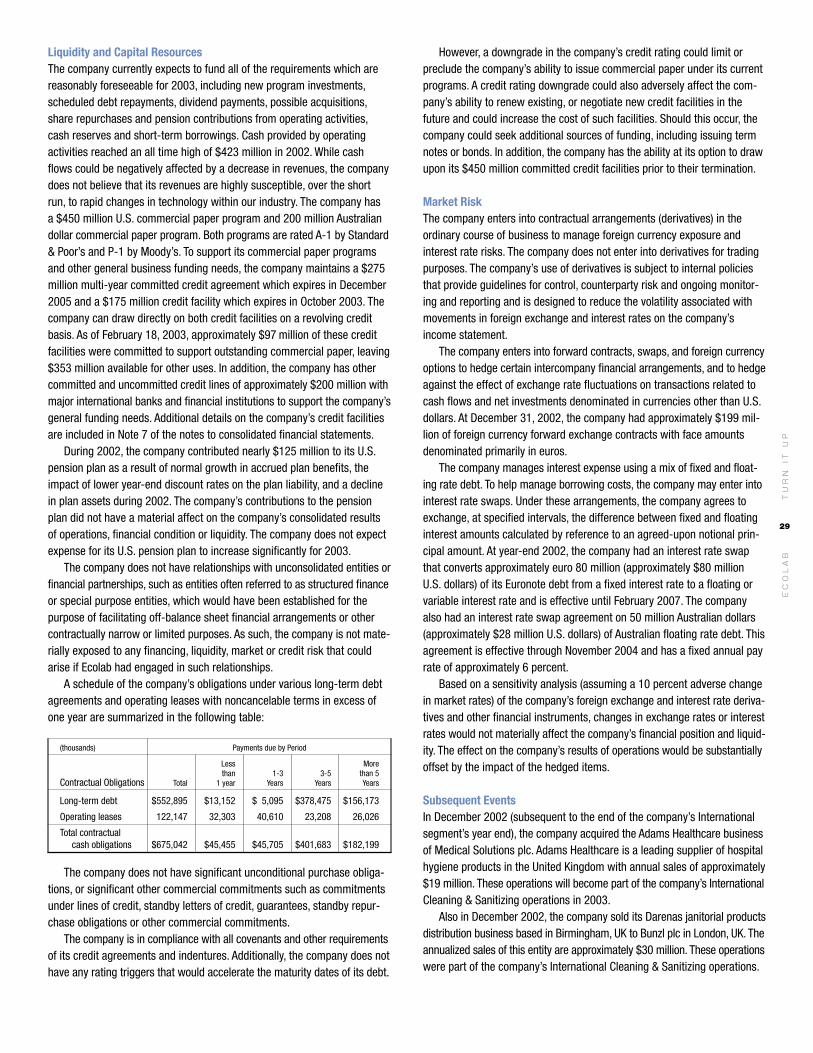
Operating Segment Performance
(thousands) 2002 2001 2000
Net sales
United States
Cleaning & Sanitizing $1,615,171 $1,548,882 $1,498,381
Other Services 308,329 273,020 248,317
Total United States 1,923,500 1,821,902 1,746,698
International Cleaning & Sanitizing 1,427,418 472,113 420,031
Total 3,350,918 2,294,015 2,166,729
Effect of foreign currency translation 52,667 26,695 63,932
Consolidated $3,403,585 $2,320,710 $2,230,661
Operating income
United States
Cleaning & Sanitizing $ 271,838 $ 246,936 $ 249,182
Other Services 33,051 29,338 25,515
Total United States 304,889 276,274 274,697
International Cleaning & Sanitizing 131,376 44,181 41,399
Total 436,265 320,455 316,096
Corporate (46,008) (4,938) 18,491
Effect of foreign currency translation 5,609 2,662 8,552
Consolidated $ 395,866 $ 318,179 $ 343,139
Operating income as a percent of net sales
United States
Cleaning & Sanitizing 16.8% 15.9% 16.6%
Other Services 10.7 10.7 10.3
Total 15.9 15.2 15.7
International Cleaning & Sanitizing 9.2% 9.4% 9.9%
The company’s operating segments have similar products and services andthe company is organized to manage its operations geographically. Thecompany’s operating segments have been aggregated into three reportablesegments: United States Cleaning & Sanitizing, United States Other Services,and International Cleaning & Sanitizing. The company evaluates the perfor-mance of its International operations based on fixed management rates of currency exchange. Therefore, International sales and operating incometotals, as well as the International financial information included in thisfinancial discussion, are based on translation into U.S. dollars at the fixedcurrency exchange rates used by management for 2002. All other account-ing policies of the reportable segments are consistent with accounting prin-ciples generally accepted in the United States of America and the accounting

25
reflected good growth driven primarily by the non-travel portion of thebusiness. Trends in sales to the travel related business showed improve-ment over the course of 2002. Sales of Kay’s U.S. operations increasedover the prior year with strong growth in both its food retail business andsales to the quickservice market. Textile Care sales increased from theprior year due to increased sales to existing customers as well as sales to new customers. Professional Products sales decreased in 2002 due toboth a decline in the core sales of the Janitorial market and a decrease inthe non-core specialty business reflecting a planned restructuring of theJaniSource business. Professional Products’ sales, however, were positivelyimpacted at the end of 2002 due to a long-term supply agreement thatbecame effective in December 2002. Water Care Services sales decreasedfrom the prior year due to customer cost cutting and consolidations. WaterCare also continues to exit non-core markets. Vehicle Care sales growth for2002 was primarily due to new business with major oil companies as wellas new product introductions. Food & Beverage sales increased slightlyfrom the prior year with good growth in sales to the dairy, beverage andmeat and poultry markets which were offset by weak Agri sales.
Sales of United States Other Services operations increased 13 percentto $308 million in 2002, from $273 million in 2001. Excluding the effects ofbusiness acquisitions, sales increased 4 percent for 2002. Pest Elimination’ssales in 2002 included strong growth in non-contract services, which waspartially offset by a slowdown in the growth of contract services. GCSService sales growth increased over the prior year, reflecting the continuedexpansion of its operations through acquisitions and a focus on integratingpast acquisitions. Excluding the effects of businesses acquired, GCS salesdecreased 1 percent for 2002. The results reflected the division’s focus onstandardizing operating procedures and the impact of the hospitality slow-down on the GCS business. United States Other Services also includesmodest sales from the addition of EcoSure operations in January 2002.
Management rate-based sales of the company’s International Cleaning& Sanitizing operations reached $1.4 billion for 2002, an increase of 202percent over sales of $0.5 billion in 2001. International Cleaning & Sanitizingincludes European sales of $0.9 billion for 2002. Prior to 2002, the companyincluded the results of the former European joint venture operations in itsfinancial statements using the equity method of accounting. ExcludingEurope’s sales, International Cleaning & Sanitizing sales growth was 5 percentfor 2002. Excluding all business acquisitions and divestitures, sales alsoincreased 5 percent in 2002. European sales, although not consolidated prior
TU
RN
IT
UP
United States Other Services
Sales (Dollars in millions) Business Mix (Percent)
$308$273
$248
2002 200220012000
■ Pest Elimination 60%■ GCS Service 40%
policies of the company described in Note 2 of the notes to consolidatedfinancial statements. Additional information about the company’s reportablesegments is included in Note 16 of the notes to consolidated financial state-ments. The following chart presents the comparative percentage change innet sales for each of the company’s operating segments (excluding Europe)for 2002 and 2001. European operations have been excluded since theywere consolidated for the first time in 2002, making percentage compar-isons not applicable.
Percent Change Sales Growth Information From Prior Year
2002 2001
Net sales
United States Cleaning & Sanitizing
Institutional 6% 3%
Kay 9 8
Textile Care 3 (5)
Professional Products (4) 7
Water Care Services (3) 5
Vehicle Care 3 9
Food & Beverage 1 1
Total United States Cleaning & Sanitizing 4% 3%
United States Other Services
Pest Elimination 7% 8%
GCS Service 19 33
Total United States Other Services 13% 10%
Total United States 6% 4%
International Cleaning & Sanitizing
Asia Pacific 2% 9%
Latin America 10 13
Canada 5 7
Africa/Export and Other 5 32
Total International
Cleaning & Sanitizing (excluding Europe) 5% 12%
Consolidated (excluding Europe) 5% 4%
Sales of the company’s United States Cleaning & Sanitizing operationswere $1.6 billion in 2002 and increased 4 percent over net sales of $1.5billion in 2001. Business acquisitions had no effect on the growth in salesfor 2002. Sales benefited from good growth in sales of U.S. Institutionaland Kay operations. U.S. Institutional operations sales growth during 2002
United States Cleaning & Sanitizing
Sales (Dollars in millions) Business Mix (Percent)
$1,615$1,549$1,498
2002 200220012000
■ Institutional 60%■ Food & Beverage 17%■ Kay 9%■ Professional Products 6%■ Textile Care 3% ■ Vehicle Care 3%■ Water Care Services 2%
EC
OL
AB

26
EC
OL
AB
to 2002, increased 8 percent over 2001 due to good growth in sales to thefood and beverage markets and European acquisitions. For the Asia Pacificregion, Japan, New Zealand and China showed good sales growth for theyear while Australia’s sales declined due to the sale of its Hygiene Servicesbusiness. Asia Pacific sales increased 3 percent in 2002, excluding businessacquisitions and divestitures. The increase in Asia Pacific sales was primar-ily from the institutional and food and beverage markets. Latin Americasales increased 8 percent in 2002, excluding business acquisitions, withgood growth in all countries except Venezuela due to the economic impactof the devaluation of its currency. Sales in Canada increased over the prioryear due to good growth in sales to the institutional market. Sales of theAfrica/Export and Other region increased in 2002 reflecting weakness inIsrael offset by good growth in South Africa and other operations.
Operating income of the company’s United States Cleaning & Sanitizingoperations was $272 million in 2002, an increase of 10 percent from oper-ating income of $247 million in 2001. As a percentage of net sales, operat-ing income increased from 15.9 percent in 2001 to 16.8 percent in 2002.The improvement in reported operating income margins reflected tight costcontrols, savings from cost reduction initiatives, the sale of new productsand the impact of adopting SFAS No.142. Operating income in 2001 does not reflect the effect of SFAS No.142, and thus includes amortizationexpenses related to goodwill of $10.6 million. If the provisions of SFAS No.142 had been applied retroactively to January 1, 2001, operating incomefor the United States Cleaning & Sanitizing operations would have increased6 percent and the operating income margin for the U.S. Cleaning & Sanitizingoperations would have been 16.6 percent for 2001. The company added115 sales-and-service associates to its United States Cleaning & Sanitizingoperations during 2002.
Operating income of United States Other Services operations increased13 percent to $33 million in 2002. The operating income margin for UnitedStates Other Services was 10.7 percent for both 2002 and 2001. Operatingincome in 2001 does not reflect the effect of SFAS No. 142 and includes$1.9 million of amortization expense related to goodwill. Excluding acquisi-tions and the effects of SFAS No. 142, operating income increased 3 per-cent over 2001. Excluding acquisitions and including the pro forma effectsof SFAS No. 142 on the prior year, the operating income margin for UnitedStates Other Services was 11.4 percent for both 2002 and 2001. PestElimination had strong operating income growth due to increased produc-tivity and cost controls. Operating income for GCS declined due to continuedinvestments in the division’s infrastructure and systems. During 2002, thecompany added 75 sales-and-service associates to its United States OtherServices operations.
Operating income of International Cleaning & Sanitizing operations rose197 percent to $131 million in 2002 from operating income of $44 millionin 2001. The International operating income margin decreased from 9.4percent in 2001 to 9.2 percent in 2002. Operating income in 2001 does notreflect the effect of SFAS No.142 and includes $5.3 million of amortizationexpense related to goodwill. Excluding acquisitions and including the proforma effects of SFAS No.142 on 2001, operating income for 2002 increased10 percent over the prior year. Excluding acquisitions (primarily Europe) andincluding the pro forma effects of SFAS No.142 on last year, the operatingincome margin for International increased to 11.1 percent of net sales from10.5 percent in 2001. Significant operating income growth and marginimprovement from Asia Pacific, Latin America and Canada contributed tothe increase. The company added 510 sales-and-service associates to itsInternational Cleaning & Sanitizing operations, including Europe, during 2002.
Operating income margins of the company’s International operationsare less than the operating income margins realized for the company’s U.S. operations. The lower International margins are due to higher costs of importing raw materials and finished goods, increased investments indispensing equipment and the additional costs caused by the difference in scale of International operations where several operating locations aresmaller in size, as well as to the additional cost of operating in numerousand diverse foreign jurisdictions. Proportionately larger investments in sales,technical support and administrative personnel are also necessary in orderto facilitate growth of International operations.
2001 compared with 2000Sales of the company’s United States Cleaning & Sanitizing operationswere $1.5 billion in 2001 and increased 3 percent over net sales in 2000.Business acquisitions accounted for approximately 1 percentage point ofthe growth in sales for 2001. Sales reflected solid growth in the company’sKay, Professional Products and Vehicle Care operations. The sales improve-ment also reflected benefits from new products and services, as well asaggressive sales efforts and programs. Net selling price increases during2001 were not significant. U.S. Institutional operations sales growth during2001 reflected modest growth in its specialty, housekeeping and Ecotempprograms, which were partially offset by the continuing slow down in theeconomy and the weaker demand in the lodging and restaurant marketsdue to the events of September 11, 2001. Excluding the acquisition ofFacilitec, Institutional’s sales increased 2 percent for 2001. Sales of Kay’sU.S. operations increased over 2000 with significant growth in its food retailbusiness and good growth in sales to the quickservice market. Excludingthe acquisition of Southwest Sanitary Distributing Company (SSDC) inFebruary 2000, Kay’s sales for 2001 increased 5 percent over 2000. TextileCare sales decreased in 2001 due to exiting selected businesses and a verycompetitive market. Professional Products’ sales increased in 2001 withgood growth in its healthcare and janitorial sales. Professional Products’sales have been positively impacted by long-term supply agreements in its janitorial business. Water Care Services’ sales increased over 2000 withgood growth in sales to the food and beverage and hospitality markets.Vehicle Care sales growth for 2001 was primarily due to new products and additional business with major oil company chains. Food & BeverageU.S. sales increased in 2001 with good growth in the beverage market.
Sales of the United States Other Services operations increased 10 per-cent to $273 million in 2001, from $248 million in 2000. Excluding theeffects of businesses acquired and disposed of, sales increased 7 percentfor 2001. Pest Elimination’s sales in 2001 included solid growth in contractservices, slightly offset by a slowdown in non-contract services due to
TU
RN
IT
UP
Financial discussion
International Cleaning & Sanitizing
Sales (Dollars in millions) Business Mix (Percent)
$1,427
$472$420
2002 200220012000
■ Europe 65%■ Asia Pacific 17%■ Latin America 7%■ Canada 6%■ Africa/Export and Other 5%

EC
OL
AB
27
economic conditions. GCS Service sales growth increased over last yearreflecting the continued expansion of its operations through acquisitions.Excluding the effects of businesses acquired, GCS sales increased 4 percentfor 2001. In the fourth quarter of 2000, the company sold its Jackson dish-machine manufacturing business.
Management rate-based sales of the company’s International Cleaning &Sanitizing operations reached $472 million for 2001, an increase of 12 per-cent over sales of $420 million in 2000. Business acquisitions accountedfor approximately 5 percentage points of the sales increase in 2001 forInternational Cleaning & Sanitizing operations. Excluding business acquisi-tions, Asia Pacific sales increased 8 percent with double-digit sales growthin New Zealand and East Asia and good growth in Japan. The increase inAsia Pacific sales was primarily from the food and beverage and institutionalmarkets. Latin America sales increased 7 percent in 2001, excluding busi-ness acquisitions, with good growth in almost all countries. Sales in Canadaincreased in 2001 due to strong growth in sales to the institutional and foodand beverage markets. Sales of the Africa/Export region increased sharplyin 2001 due to strong results in South Africa and the full-year sales effectof a business, which was acquired in September 2000.
Operating income of the company’s United States Cleaning & Sanitizingoperations was $247 million in 2001, a decrease of 1 percent from operatingincome of $249 million in 2000. Business acquisitions had little effect onoperating income for 2001. Operating income included strong growth forProfessional Products and Water Care Services with moderate growth inKay and Vehicle Care operations. Operating income of Institutional, Food &Beverage and Textile Care was lower than the prior year. As a percentage ofnet sales, operating income decreased from 16.6 percent in 2000 to 15.9percent in 2001. Operating income margins declined due to lower salesvolume, unfavorable sales mix, increased storage and handling costs andincreased raw material costs. The company added 50 sales-and-serviceassociates to its United States Cleaning & Sanitizing operations during 2001.
Operating income of United States Other Services operations increased15 percent to $29 million in 2001. Excluding operating income of businessesacquired in 2001 and the annualized effect of businesses acquired and disposed of in 2000, operating income for 2001 increased 20 percent.Both Pest Elimination and GCS reported double-digit increases in operatingincome. The operating income margin of United States Other Servicesoperations was 10.7 percent, which is up from 10.3 percent of net sales in 2000. This increase reflected GCS’ efforts to improve income by focusingon operational efficiencies, as well as Pest Elimination’s increased produc-tivity, more efficient use of products and cost controls. During 2001, thecompany added 120 sales-and-service associates to its United StatesOther Services operations.
Operating income of International Cleaning & Sanitizing operations rose 7 percent to $44 million in 2001 from operating income of $41 millionin 2000. The effects of businesses acquired accounted for approximately 1 percentage point of the growth in operating income for 2001. TheInternational operating income margin decreased from 9.9 percent in 2000to 9.4 percent in 2001. While the Latin America and Africa/Export regionsshowed operating income margin improvement, the margins for Asia Pacificand Canada declined due to higher raw material costs. Excluding associatesadded by Henkel-Ecolab, the company added 160 sales-and-service asso-ciates to its International Cleaning & Sanitizing operations during 2001.
Henkel-EcolabPrior to November 30, 2001, the company operated cleaning and sanitizingbusinesses in Europe through a 50 percent economic interest in the
Henkel-Ecolab joint venture. On November 30, 2001, Ecolab purchased the remaining 50 percent interest of Henkel-Ecolab it did not previouslyown from Henkel KGaA. Additional details related to this purchase areincluded in Note 5 of the notes to consolidated financial statements.
Ecolab consolidated Henkel-Ecolab’s operations effective with theNovember 30, 2001 acquisition date and end of Henkel-Ecolab’s fiscal yearfor 2001. Because the company consolidates its International operations onthe basis of their November 30 fiscal year ends, Henkel-Ecolab’s balancesheet was consolidated with Ecolab’s balance sheet as of year-end 2001.The income statement for the European operations was consolidated withEcolab’s operations beginning in 2002.
2001 compared with 2000The company included the results of Henkel-Ecolab operations in its financialstatements using the equity method of accounting through November 30,2001. The company’s equity in earnings of Henkel-Ecolab, which includedroyalty income and goodwill amortization, was $16 million in 2001, adecrease of 19 percent when compared to $20 million in 2000. When measured in euros, net income of Henkel-Ecolab for 2001 decreased 13percent and reflected lower sales volumes driven by slowing economiesand increasing raw material, energy and other costs, which were partiallyoffset by price increases.
Henkel-Ecolab sales, although not consolidated in Ecolab’s financialstatements, increased 4 percent in 2001 when measured in euros. Salesreflected the impact of Europe’s slowing economies and reduced ordersfrom distributors as they lowered inventory levels. When measured in U.S.dollars, Henkel-Ecolab sales were flat when compared to 2000 due to thenegative effects of a stronger U.S. dollar.
CorporateCorporate operating expense totaled $46.0 million in 2002, compared withcorporate operating expense of $4.9 million in 2001 and corporate operat-ing income of $18.5 million in 2000. Prior to 2002, corporate operatingexpense included overhead costs directly related to the former Europeanjoint venture. In 2002, these expenses were included in the InternationalCleaning & Sanitizing operating segment. The amount remaining in corporateoperating expense in 2002 included restructuring and merger integrationcosts of $51.8 million, which were partially offset by a curtailment gain of$5.8 million related to benefit plan changes. In 2000, corporate operatingincome also included the $25.9 million gain on the sale of the Jacksonbusiness, special charges of $7.1 million and income of $4.4 million for net reductions in probable losses related to certain environmental matters.
Interest and Income TaxesNet interest expense of $44 million for 2002 increased 54 percent over netinterest expense of $28 million in 2001. This increase is primarily due tohigher debt levels incurred at year-end 2001 to finance the acquisition ofthe remaining 50 percent interest of Henkel-Ecolab which Ecolab did notpreviously own.
Net interest expense for 2001 was $28 million, an increase of 16 percentover net interest expense of $25 million in 2000. This increase reflectedhigher debt levels during the year, including the additional debt incurredlate in the year to purchase the remaining 50 percent of Henkel-Ecolab.
The company’s effective income tax rate was 39.8 percent for 2002,compared with effective income tax rates in 2001 and 2000 of 40.5 percentand 40.7 percent, respectively. Excluding the effects of special charges in2002, the estimated annual effective income tax rate related to ongoing
TU
RN
IT
UP

28
EC
OL
AB
operations was 39.5 percent. This decrease from prior years was principallydue to the adoption of SFAS No. 142 at the beginning of 2002, which elimi-nated the amortization of goodwill and related income tax effects. Overalleffective rates on International operations were higher in 2002, principallydue to the addition of the European joint venture. This was partially offsetby lower state income tax rates in 2002. Excluding the effects of the sale of Jackson and restructuring expenses in 2000, the effective income taxrate was 40.5 percent in 2000.
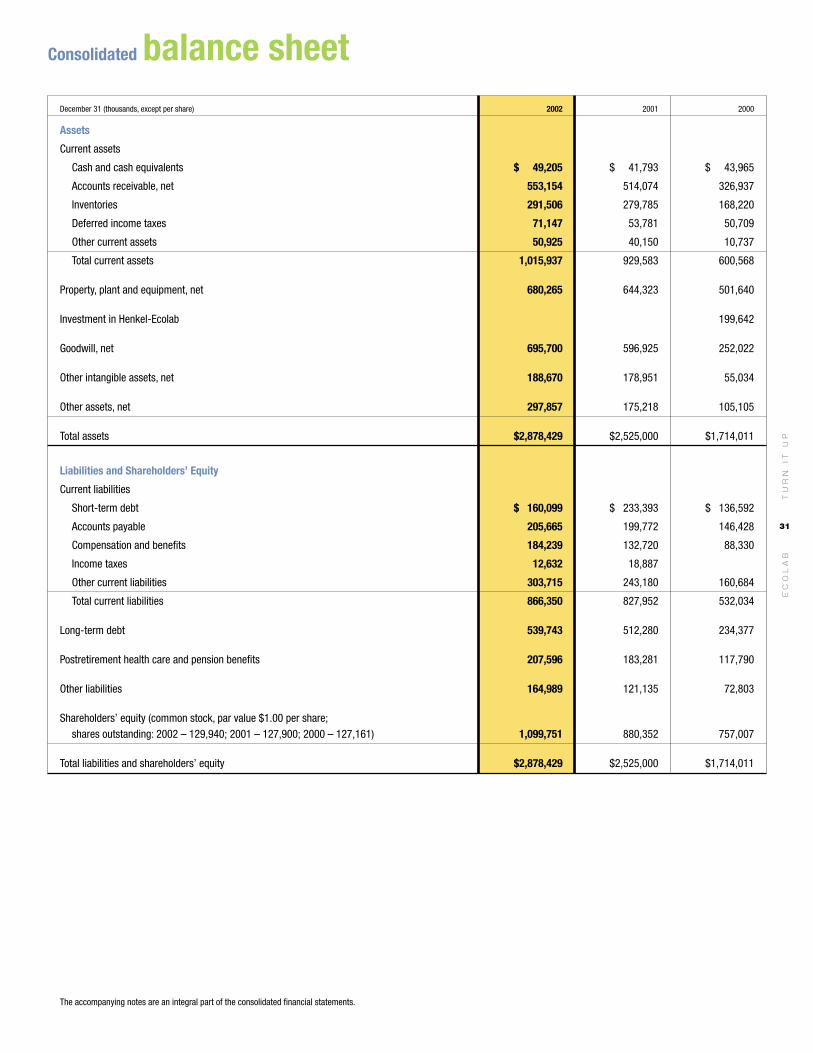
Financial PositionThe company’s debt continued to be rated within the “A” categories by themajor rating agencies during 2002. Significant changes in the company’sfinancial position during 2002 and 2001 included the following:■ Total assets reached nearly $2.9 billion at December 31, 2002, anincrease of 14 percent over total assets of $2.5 billion at year-end 2001.Accounts receivable have increased 8 percent since year-end 2001, primarilydue to the effect of business acquisitions during the year as well as due tothe effect of exchange rates. Other assets have increased significantlysince year-end 2001 due to payments totaling approximately $125 millionto fund the company’s U.S. pension plan during 2002. Other current liabili-ties have increased since year-end 2001 primarily due to an increase inrestructuring accruals and due to the effect of exchange rates.
During 2001 total assets increased to $2.5 billion at year-end 2001from $1.7 billion at year-end 2000. At year-end 2001, the balance sheet ofHenkel-Ecolab was consolidated with the company’s balance sheet due tothe acquisition of the remaining 50 percent of Henkel-Ecolab from HenkelKGaA. Total assets as of November 30, 2001 increased approximately $0.7billion as a result of this acquisition and the consolidation of Henkel-Ecolab.■ Working capital levels increased to $150 million at December 31, 2002from $102 million at year-end 2001 reflecting a significant decrease inshort-term debt from the prior year. Working capital levels at year-end 2001of $102 million were up from $69 million at year-end 2000 reflecting lowerlevels of current liabilities prior to the Henkel-Ecolab acquisition, as well asincreases in accounts receivable and inventory due to the consolidation ofEurope’s balance sheet for the first time as of year-end 2001. During 2001,short-term debt increased approximately $97 million due to the issuance of commercial paper to finance the acquisition of Henkel-Ecolab.■ Total debt was $700 million at December 31, 2002 and decreased fromtotal debt of $746 million at year-end 2001. This decrease in total debt during 2002 is principally due to debt repayments made during the year.Total debt at year-end 2000 was $371 million. During 2001, commercialpaper borrowings were incurred to fund the acquisition of the remaining 50 percent of the Henkel-Ecolab joint venture. At December 31, 2001,the company classified $266 million of commercial paper borrowings as
long-term debt. In February2002, the company refinanced$266 million of commercialpaper borrowings through theissuance of euro 300 million ofEuronotes. As of December 31,2002 the ratio of total debt tocapitalization was 39 percent,down from 46 percent at year-end 2001 and compared with 33 percent at year-end 2000.The lower debt to capitalizationrate in 2002 is due to repay-
ments made during the year while the higher debt to capitalization ratio for2001 compared to 2000 was due to funding for the company’s acquisitionof the Henkel-Ecolab joint venture.
Cash FlowsCash provided by operating activities reached a new high of $423 millionfor 2002, an increase from $364 million in 2001 and $315 million in 2000.Operating cash flows for 2002 reflected the additional cash flows frombusinesses acquired, primarily the European joint venture, as well as theimprovement in accounts receivable and days sales outstanding. The operating cash flow for 2001 increased over 2000 due to a reduction inyear-end accounts receivable and the additional cash flows generated by business acquisitions. Changes in net operating asset levels negativelyaffected the operating cash flow by approximately $70 million in 2002,positively impacted it by $10 million in 2001 and negatively affected it byapproximately $2 million in 2000.
Cash flows used for investing activities included capital expenditures of $213 million in 2002, $158 million in 2001 and $150 million in 2000.Worldwide additions of merchandising equipment, primarily cleaning andsanitizing product dispensers, accounted for approximately 70 percent ofeach year’s capital expenditures. Merchandising equipment is depreciatedover 3 to 7 year lives. Cash used for businesses acquired included TerminixLtd. and Kleencare Hygiene in 2002, Henkel-Ecolab in 2001 and Spartanand Facilitec in 2000. Investing cash flow activity also included the proceedsfrom the sale of the Jackson business in 2000.
Financing cash flow activity included cash used to reacquire shares andpay dividends and cash provided and used through the company’s debtarrangements. In May 2000, the company announced a program to repur-chase up to $200 million of its common stock. Share repurchases totaled$9 million in 2002, $32 million in 2001 and $187 million in 2000. Theserepurchases were funded with operating cash flows and additional debt. InDecember 2000, the company announced an authorization to repurchaseup to 5 million additional shares of common stock.
In 2002, the company increased its annual dividend rate for theeleventh consecutive year. The company has paid dividends on its commonstock for 66 consecutive years. Cash dividends declared per share of com-mon stock, by quarter, for each of the last three years were as follows:
Cash Dividends Declared
First Second Third FourthQuarter Quarter Quarter Quarter Year
2002 $0.135 $0.135 $0.135 $0.145 $0.55
2001 0.13 0.13 0.13 0.135 0.525
2000 0.12 0.12 0.12 0.13 0.49
TU
RN
IT
UP
Financial discussion
Total Debt to Capitalization
(Percent) (Percent)
39%
46%
33%
2002 200220012000
■ Shareholders’ Equity 61%■ Total Debt 39%
Cash Provided by Operating Activities
(Dollars in millions)
$423
$364$315
$293
$236
20022001200019991998
EC
OL
AB
29
Liquidity and Capital ResourcesThe company currently expects to fund all of the requirements which arereasonably foreseeable for 2003, including new program investments,scheduled debt repayments, dividend payments, possible acquisitions,share repurchases and pension contributions from operating activities,cash reserves and short-term borrowings. Cash provided by operatingactivities reached an all time high of $423 million in 2002. While cashflows could be negatively affected by a decrease in revenues, the companydoes not believe that its revenues are highly susceptible, over the shortrun, to rapid changes in technology within our industry. The company has a $450 million U.S. commercial paper program and 200 million Australiandollar commercial paper program. Both programs are rated A-1 by Standard& Poor’s and P-1 by Moody’s. To support its commercial paper programsand other general business funding needs, the company maintains a $275million multi-year committed credit agreement which expires in December2005 and a $175 million credit facility which expires in October 2003. Thecompany can draw directly on both credit facilities on a revolving creditbasis. As of February 18, 2003, approximately $97 million of these creditfacilities were committed to support outstanding commercial paper, leaving$353 million available for other uses. In addition, the company has othercommitted and uncommitted credit lines of approximately $200 million withmajor international banks and financial institutions to support the company’sgeneral funding needs. Additional details on the company’s credit facilitiesare included in Note 7 of the notes to consolidated financial statements.
During 2002, the company contributed nearly $125 million to its U.S.pension plan as a result of normal growth in accrued plan benefits, theimpact of lower year-end discount rates on the plan liability, and a decline in plan assets during 2002. The company’s contributions to the pensionplan did not have a material affect on the company’s consolidated resultsof operations, financial condition or liquidity. The company does not expectexpense for its U.S. pension plan to increase significantly for 2003.
The company does not have relationships with unconsolidated entities orfinancial partnerships, such as entities often referred to as structured financeor special purpose entities, which would have been established for the purpose of facilitating off-balance sheet financial arrangements or othercontractually narrow or limited purposes. As such, the company is not mate-rially exposed to any financing, liquidity, market or credit risk that couldarise if Ecolab had engaged in such relationships.
A schedule of the company’s obligations under various long-term debtagreements and operating leases with noncancelable terms in excess ofone year are summarized in the following table:
(thousands) Payments due by Period
Less Morethan 1-3 3-5 than 5
Contractual Obligations Total 1 year Years Years Years
Long-term debt $552,895 $13,152 $ 5,095 $378,475 $156,173
Operating leases 122,147 32,303 40,610 23,208 26,026
Total contractual cash obligations $675,042 $45,455 $45,705 $401,683 $182,199
The company does not have significant unconditional purchase obliga-tions, or significant other commercial commitments such as commitmentsunder lines of credit, standby letters of credit, guarantees, standby repur-chase obligations or other commercial commitments.
The company is in compliance with all covenants and other requirementsof its credit agreements and indentures. Additionally, the company does nothave any rating triggers that would accelerate the maturity dates of its debt.
However, a downgrade in the company’s credit rating could limit or preclude the company’s ability to issue commercial paper under its currentprograms. A credit rating downgrade could also adversely affect the com-pany’s ability to renew existing, or negotiate new credit facilities in thefuture and could increase the cost of such facilities. Should this occur, thecompany could seek additional sources of funding, including issuing termnotes or bonds. In addition, the company has the ability at its option to drawupon its $450 million committed credit facilities prior to their termination.
Market RiskThe company enters into contractual arrangements (derivatives) in theordinary course of business to manage foreign currency exposure andinterest rate risks. The company does not enter into derivatives for tradingpurposes. The company’s use of derivatives is subject to internal policiesthat provide guidelines for control, counterparty risk and ongoing monitor-ing and reporting and is designed to reduce the volatility associated withmovements in foreign exchange and interest rates on the company’sincome statement.
The company enters into forward contracts, swaps, and foreign currencyoptions to hedge certain intercompany financial arrangements, and to hedgeagainst the effect of exchange rate fluctuations on transactions related tocash flows and net investments denominated in currencies other than U.S.dollars. At December 31, 2002, the company had approximately $199 mil-lion of foreign currency forward exchange contracts with face amountsdenominated primarily in euros.
The company manages interest expense using a mix of fixed and float-ing rate debt. To help manage borrowing costs, the company may enter intointerest rate swaps. Under these arrangements, the company agrees toexchange, at specified intervals, the difference between fixed and floatinginterest amounts calculated by reference to an agreed-upon notional prin-cipal amount. At year-end 2002, the company had an interest rate swapthat converts approximately euro 80 million (approximately $80 million U.S. dollars) of its Euronote debt from a fixed interest rate to a floating orvariable interest rate and is effective until February 2007. The companyalso had an interest rate swap agreement on 50 million Australian dollars(approximately $28 million U.S. dollars) of Australian floating rate debt. Thisagreement is effective through November 2004 and has a fixed annual payrate of approximately 6 percent.
Based on a sensitivity analysis (assuming a 10 percent adverse changein market rates) of the company’s foreign exchange and interest rate deriva-tives and other financial instruments, changes in exchange rates or interestrates would not materially affect the company’s financial position and liquid-ity. The effect on the company’s results of operations would be substantiallyoffset by the impact of the hedged items.
Subsequent EventsIn December 2002 (subsequent to the end of the company’s Internationalsegment’s year end), the company acquired the Adams Healthcare businessof Medical Solutions plc. Adams Healthcare is a leading supplier of hospitalhygiene products in the United Kingdom with annual sales of approximately$19 million. These operations will become part of the company’s InternationalCleaning & Sanitizing operations in 2003.
Also in December 2002, the company sold its Darenas janitorial productsdistribution business based in Birmingham, UK to Bunzl plc in London, UK. Theannualized sales of this entity are approximately $30 million. These operationswere part of the company’s International Cleaning & Sanitizing operations.
TU
RN
IT
UP

30
EC
OL
AB
TU
RN
IT
UP
Consolidated statement of incomeYear ended December 31 (thousands, except per share) 2002 2001 2000
Net sales $3,403,585 $2,320,710 $2,230,661
Operating expenses (income)
Cost of sales (including special charges (income) of $8,977 in 2002, ($566) in 2001 and $1,948 in 2000) 1,687,597 1,120,254 1,056,263
Selling, general and administrative expenses 1,283,091 881,453 851,995
Gain on sale of Jackson business (25,925)
Special charges 37,031 824 5,189
Operating income 395,866 318,179 343,139
Interest expense, net 43,895 28,434 24,605
Income from continuing operations before income taxes and equity in earnings of Henkel-Ecolab 351,971 289,745 318,534
Provision for income taxes 140,081 117,408 129,495
Equity in earnings of Henkel-Ecolab 15,833 19,516
Income from continuing operations before cumulative effect of change in accounting 211,890 188,170 208,555
Cumulative effect of change in accounting (4,002) (2,428)
Gain from discontinued operations 1,882
Net income $ 209,770 $ 188,170 $ 206,127
Basic income per common share
Income from continuing operations before change in accounting $ 1.64 $ 1.48 $ 1.63
Change in accounting (0.03) (0.02)
Gain from discontinued operations 0.01
Net income $ 1.63 $ 1.48 $ 1.61
Diluted income per common share
Income from continuing operations before change in accounting $ 1.62 $ 1.45 $ 1.58
Change in accounting (0.03) (0.02)
Gain from discontinued operations 0.01
Net income $ 1.60 $ 1.45 $ 1.56
Weighted-average common shares outstanding
Basic 129,073 127,416 127,753
Diluted 130,787 129,928 131,946
Per share amounts do not necessarily sum due to rounding.
The accompanying notes are an integral part of the consolidated financial statements.
EC
OL
AB
31
TU
RN
IT
UP
Consolidated balance sheetDecember 31 (thousands, except per share) 2002 2001 2000
Assets
Current assets
Cash and cash equivalents $ 49,205 $ 41,793 $ 43,965
Accounts receivable, net 553,154 514,074 326,937
Inventories 291,506 279,785 168,220
Deferred income taxes 71,147 53,781 50,709
Other current assets 50,925 40,150 10,737
Total current assets 1,015,937 929,583 600,568
Property, plant and equipment, net 680,265 644,323 501,640
Investment in Henkel-Ecolab 199,642
Goodwill, net 695,700 596,925 252,022
Other intangible assets, net 188,670 178,951 55,034
Other assets, net 297,857 175,218 105,105
Total assets $2,878,429 $2,525,000 $1,714,011
Liabilities and Shareholders’ Equity
Current liabilities
Short-term debt $ 160,099 $ 233,393 $ 136,592
Accounts payable 205,665 199,772 146,428
Compensation and benefits 184,239 132,720 88,330
Income taxes 12,632 18,887
Other current liabilities 303,715 243,180 160,684
Total current liabilities 866,350 827,952 532,034
Long-term debt 539,743 512,280 234,377
Postretirement health care and pension benefits 207,596 183,281 117,790
Other liabilities 164,989 121,135 72,803
Shareholders’ equity (common stock, par value $1.00 per share; shares outstanding: 2002 – 129,940; 2001 – 127,900; 2000 – 127,161) 1,099,751 880,352 757,007
Total liabilities and shareholders’ equity $2,878,429 $2,525,000 $1,714,011
The accompanying notes are an integral part of the consolidated financial statements.

32
EC
OL
AB
TU
RN
IT
UP
Consolidated statement of cash flowsYear ended December 31 (thousands) 2002 2001 2000
Operating Activities
Net income $ 209,770 $ 188,170 $ 206,127
Cumulative effect of change in accounting 4,002 2,428
Gain from discontinued operations (1,882)
Income from continuing operations 211,890 188,170 208,555
Adjustments to reconcile income from continuing operations to cash provided by operating activities:
Depreciation 194,840 128,020 119,072
Amortization 28,588 34,970 29,364
Deferred income taxes 49,923 (2,950) (11,604)
Equity in earnings of Henkel-Ecolab (15,833) (19,516)
Henkel-Ecolab royalties and dividends 23,928 15,914
Special charges – asset disposals 6,180 (566) 2,786
Gain on sale of Jackson business (25,925)
Other, net 1,835 (1,373) (913)
Changes in operating assets and liabilities:
Accounts receivable 78 20,570 (30,635)
Inventories (3,567) (8,014) (22,585)
Other assets (141,926) (26,049) (7,332)
Accounts payable (8,860) (7,451) 16,626
Other liabilities 84,345 31,059 41,679
Cash provided by operating activities 423,326 364,481 315,486
Investing Activities
Capital expenditures (212,757) (157,937) (150,009)
Property disposals 6,788 3,027 2,092
Capitalized software expenditures (4,490)
Businesses acquired and investments in affiliates (62,825) (469,804) (90,603)
Sale of businesses and assets 35,803
Cash used for investing activities (273,284) (624,714) (202,717)
Financing Activities
Net issuances (repayments) of notes payable (368,834) 204,218 124,080
Long-term debt borrowings 261,039 149,817
Long-term debt repayments (1,257) (16,283) (21,777)
Reacquired shares (8,894) (32,164) (186,516)
Cash dividends on common stock (69,583) (66,456) (61,644)
Exercise of employee stock options 45,531 19,356 23,112
Other, net (1,746) (975) 7,510
Cash provided by (used for) financing activities (143,744) 257,513 (115,235)
Effect of exchange rate changes on cash 1,114 548 (1,317)
Increase (Decrease) in Cash and Cash Equivalents 7,412 (2,172) (3,783)
Cash and cash equivalents, beginning of year 41,793 43,965 47,748
Cash and cash equivalents, end of year $ 49,205 $ 41,793 $ 43,965
The accompanying notes are an integral part of the consolidated financial statements.
EC
OL
AB
33
TU
RN
IT
UP
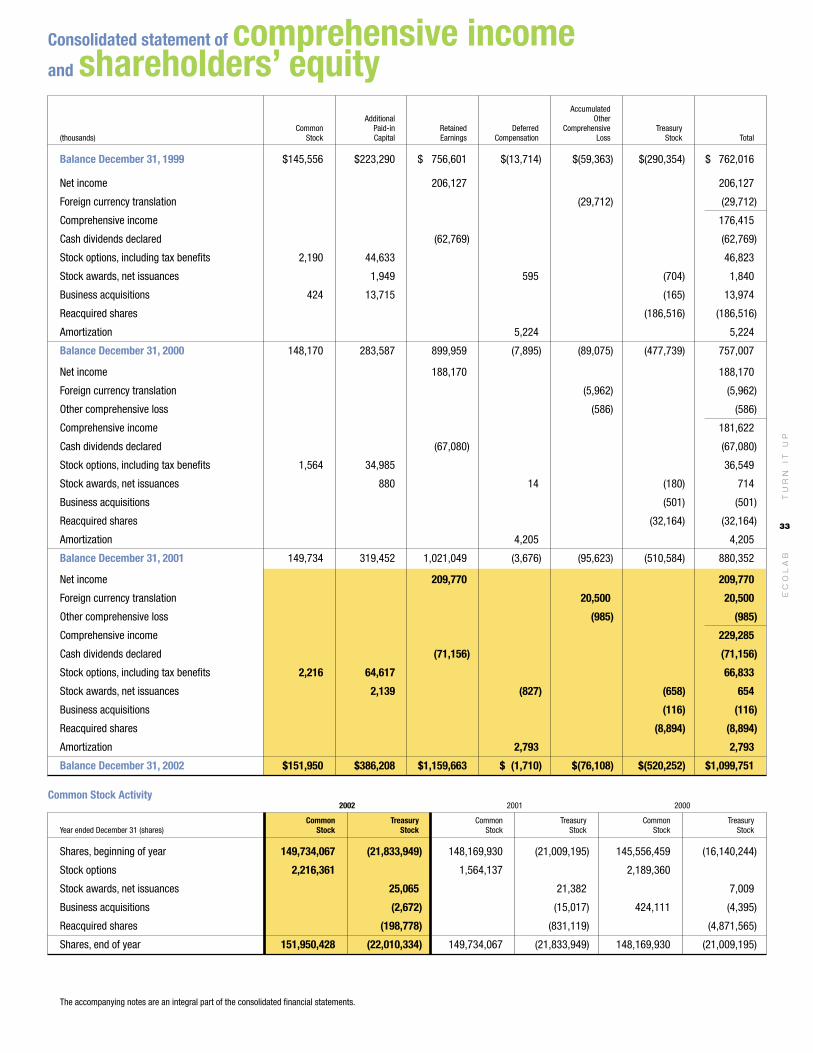
Consolidated statement of comprehensive incomeand shareholders’ equity
Accumulated Additional Other
Common Paid-in Retained Deferred Comprehensive Treasury(thousands) Stock Capital Earnings Compensation Loss Stock Total
Balance December 31, 1999 $145,556 $223,290 $ 756,601 $(13,714) $(59,363) $(290,354) $ 762,016
Net income 206,127 206,127
Foreign currency translation (29,712) (29,712)
Comprehensive income 176,415
Cash dividends declared (62,769) (62,769)
Stock options, including tax benefits 2,190 44,633 46,823
Stock awards, net issuances 1,949 595 (704) 1,840
Business acquisitions 424 13,715 (165) 13,974
Reacquired shares (186,516) (186,516)
Amortization 5,224 5,224
Balance December 31, 2000 148,170 283,587 899,959 (7,895) (89,075) (477,739) 757,007
Net income 188,170 188,170
Foreign currency translation (5,962) (5,962)
Other comprehensive loss (586) (586)
Comprehensive income 181,622
Cash dividends declared (67,080) (67,080)
Stock options, including tax benefits 1,564 34,985 36,549
Stock awards, net issuances 880 14 (180) 714
Business acquisitions (501) (501)
Reacquired shares (32,164) (32,164)
Amortization 4,205 4,205
Balance December 31, 2001 149,734 319,452 1,021,049 (3,676) (95,623) (510,584) 880,352
Net income 209,770 209,770
Foreign currency translation 20,500 20,500
Other comprehensive loss (985) (985)
Comprehensive income 229,285
Cash dividends declared (71,156) (71,156)
Stock options, including tax benefits 2,216 64,617 66,833
Stock awards, net issuances 2,139 (827) (658) 654
Business acquisitions (116) (116)
Reacquired shares (8,894) (8,894)
Amortization 2,793 2,793
Balance December 31, 2002 $151,950 $386,208 $1,159,663 $ (1,710) $(76,108) $(520,252) $1,099,751
Common Stock Activity2002 2001 2000
Common Treasury Common Treasury Common TreasuryYear ended December 31 (shares) Stock Stock Stock Stock Stock Stock
Shares, beginning of year 149,734,067 (21,833,949) 148,169,930 (21,009,195) 145,556,459 (16,140,244)
Stock options 2,216,361 1,564,137 2,189,360
Stock awards, net issuances 25,065 21,382 7,009
Business acquisitions (2,672) (15,017) 424,111 (4,395)
Reacquired shares (198,778) (831,119) (4,871,565)
Shares, end of year 151,950,428 (22,010,334) 149,734,067 (21,833,949) 148,169,930 (21,009,195)
The accompanying notes are an integral part of the consolidated financial statements.
TU
RN
IT
UP
34
EC
OL
AB
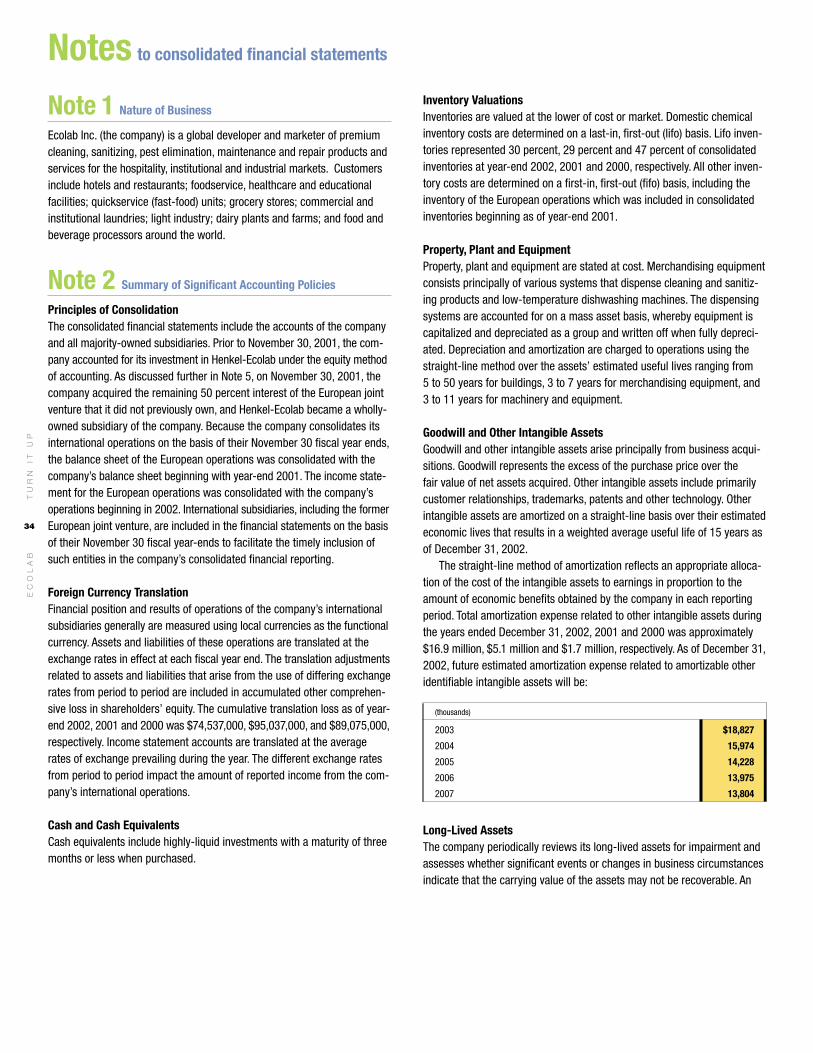
Note 1 Nature of Business
Ecolab Inc. (the company) is a global developer and marketer of premiumcleaning, sanitizing, pest elimination, maintenance and repair products andservices for the hospitality, institutional and industrial markets. Customersinclude hotels and restaurants; foodservice, healthcare and educationalfacilities; quickservice (fast-food) units; grocery stores; commercial andinstitutional laundries; light industry; dairy plants and farms; and food andbeverage processors around the world.
Note 2 Summary of Significant Accounting Policies
Principles of ConsolidationThe consolidated financial statements include the accounts of the companyand all majority-owned subsidiaries. Prior to November 30, 2001, the com-pany accounted for its investment in Henkel-Ecolab under the equity methodof accounting. As discussed further in Note 5, on November 30, 2001, thecompany acquired the remaining 50 percent interest of the European jointventure that it did not previously own, and Henkel-Ecolab became a wholly-owned subsidiary of the company. Because the company consolidates itsinternational operations on the basis of their November 30 fiscal year ends,the balance sheet of the European operations was consolidated with thecompany’s balance sheet beginning with year-end 2001. The income state-ment for the European operations was consolidated with the company’soperations beginning in 2002. International subsidiaries, including the formerEuropean joint venture, are included in the financial statements on the basisof their November 30 fiscal year-ends to facilitate the timely inclusion ofsuch entities in the company’s consolidated financial reporting.
Foreign Currency Translation Financial position and results of operations of the company’s internationalsubsidiaries generally are measured using local currencies as the functionalcurrency. Assets and liabilities of these operations are translated at theexchange rates in effect at each fiscal year end. The translation adjustmentsrelated to assets and liabilities that arise from the use of differing exchangerates from period to period are included in accumulated other comprehen-sive loss in shareholders’ equity. The cumulative translation loss as of year-end 2002, 2001 and 2000 was $74,537,000, $95,037,000, and $89,075,000,respectively. Income statement accounts are translated at the averagerates of exchange prevailing during the year. The different exchange ratesfrom period to period impact the amount of reported income from the com-pany’s international operations.
Cash and Cash EquivalentsCash equivalents include highly-liquid investments with a maturity of threemonths or less when purchased.
Inventory Valuations Inventories are valued at the lower of cost or market. Domestic chemicalinventory costs are determined on a last-in, first-out (lifo) basis. Lifo inven-tories represented 30 percent, 29 percent and 47 percent of consolidatedinventories at year-end 2002, 2001 and 2000, respectively. All other inven-tory costs are determined on a first-in, first-out (fifo) basis, including theinventory of the European operations which was included in consolidatedinventories beginning as of year-end 2001.
Property, Plant and Equipment Property, plant and equipment are stated at cost. Merchandising equipmentconsists principally of various systems that dispense cleaning and sanitiz-ing products and low-temperature dishwashing machines. The dispensingsystems are accounted for on a mass asset basis, whereby equipment iscapitalized and depreciated as a group and written off when fully depreci-ated. Depreciation and amortization are charged to operations using thestraight-line method over the assets’ estimated useful lives ranging from 5 to 50 years for buildings, 3 to 7 years for merchandising equipment, and3 to 11 years for machinery and equipment.
Goodwill and Other Intangible Assets Goodwill and other intangible assets arise principally from business acqui-sitions. Goodwill represents the excess of the purchase price over the fair value of net assets acquired. Other intangible assets include primarily customer relationships, trademarks, patents and other technology. Otherintangible assets are amortized on a straight-line basis over their estimatedeconomic lives that results in a weighted average useful life of 15 years asof December 31, 2002.
The straight-line method of amortization reflects an appropriate alloca-tion of the cost of the intangible assets to earnings in proportion to theamount of economic benefits obtained by the company in each reportingperiod. Total amortization expense related to other intangible assets duringthe years ended December 31, 2002, 2001 and 2000 was approximately$16.9 million, $5.1 million and $1.7 million, respectively. As of December 31,2002, future estimated amortization expense related to amortizable otheridentifiable intangible assets will be:
(thousands)
2003 $18,827
2004 15,974
2005 14,228
2006 13,975
2007 13,804
Long-Lived AssetsThe company periodically reviews its long-lived assets for impairment andassesses whether significant events or changes in business circumstancesindicate that the carrying value of the assets may not be recoverable. An
Notes to consolidated financial statements
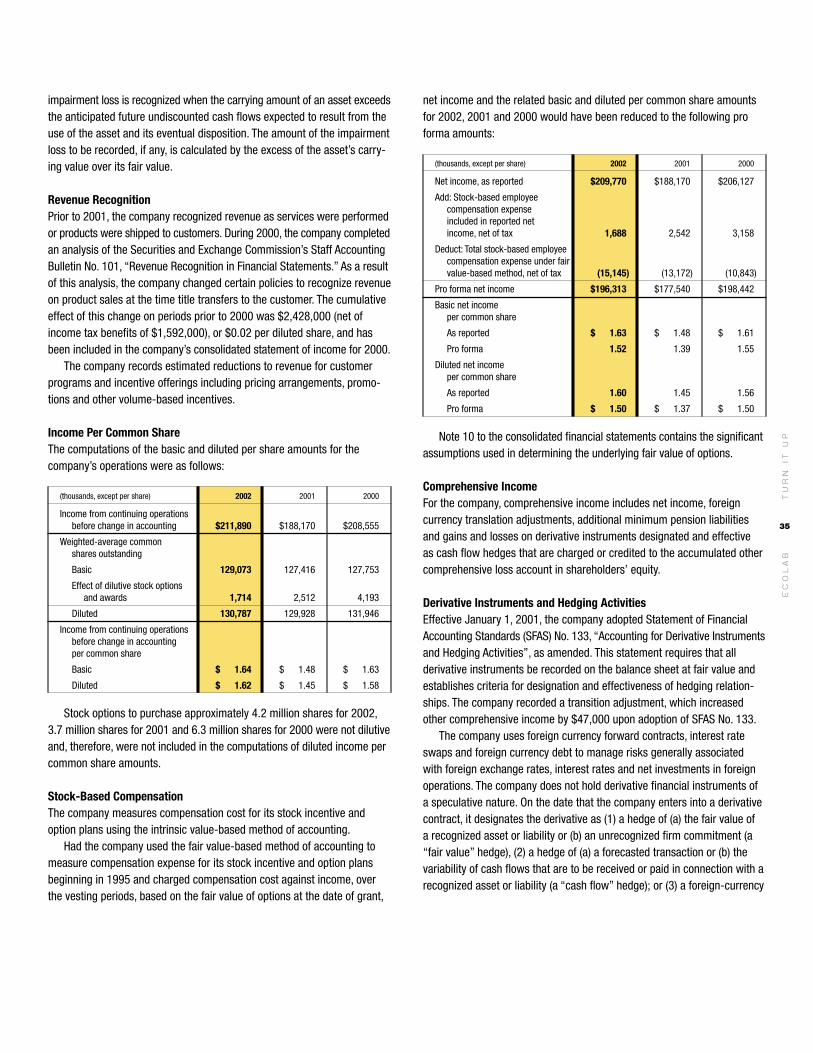
EC
OL
AB
35
impairment loss is recognized when the carrying amount of an asset exceedsthe anticipated future undiscounted cash flows expected to result from theuse of the asset and its eventual disposition. The amount of the impairmentloss to be recorded, if any, is calculated by the excess of the asset’s carry-ing value over its fair value.
Revenue RecognitionPrior to 2001, the company recognized revenue as services were performedor products were shipped to customers. During 2000, the company completedan analysis of the Securities and Exchange Commission’s Staff AccountingBulletin No. 101, “Revenue Recognition in Financial Statements.” As a resultof this analysis, the company changed certain policies to recognize revenueon product sales at the time title transfers to the customer. The cumulativeeffect of this change on periods prior to 2000 was $2,428,000 (net ofincome tax benefits of $1,592,000), or $0.02 per diluted share, and hasbeen included in the company’s consolidated statement of income for 2000.
The company records estimated reductions to revenue for customerprograms and incentive offerings including pricing arrangements, promo-tions and other volume-based incentives.
Income Per Common ShareThe computations of the basic and diluted per share amounts for the company’s operations were as follows:
(thousands, except per share) 2002 2001 2000
Income from continuing operationsbefore change in accounting $211,890 $188,170 $208,555
Weighted-average common shares outstanding
Basic 129,073 127,416 127,753
Effect of dilutive stock options and awards 1,714 2,512 4,193
Diluted 130,787 129,928 131,946
Income from continuing operations before change in accounting per common share
Basic $ 1.64 $ 1.48 $ 1.63
Diluted $ 1.62 $ 1.45 $ 1.58
Stock options to purchase approximately 4.2 million shares for 2002,3.7 million shares for 2001 and 6.3 million shares for 2000 were not dilutiveand, therefore, were not included in the computations of diluted income percommon share amounts.
Stock-Based CompensationThe company measures compensation cost for its stock incentive andoption plans using the intrinsic value-based method of accounting.
Had the company used the fair value-based method of accounting tomeasure compensation expense for its stock incentive and option plansbeginning in 1995 and charged compensation cost against income, overthe vesting periods, based on the fair value of options at the date of grant,
net income and the related basic and diluted per common share amountsfor 2002, 2001 and 2000 would have been reduced to the following proforma amounts:
(thousands, except per share) 2002 2001 2000
Net income, as reported $209,770 $188,170 $206,127
Add: Stock-based employee compensation expense included in reported net income, net of tax 1,688 2,542 3,158
Deduct: Total stock-based employeecompensation expense under fair value-based method, net of tax (15,145) (13,172) (10,843)
Pro forma net income $196,313 $177,540 $198,442
Basic net income per common share
As reported $ 1.63 $ 1.48 $ 1.61
Pro forma 1.52 1.39 1.55
Diluted net incomeper common share
As reported 1.60 1.45 1.56
Pro forma $ 1.50 $ 1.37 $ 1.50
Note 10 to the consolidated financial statements contains the significantassumptions used in determining the underlying fair value of options.
Comprehensive IncomeFor the company, comprehensive income includes net income, foreign currency translation adjustments, additional minimum pension liabilitiesand gains and losses on derivative instruments designated and effective as cash flow hedges that are charged or credited to the accumulated othercomprehensive loss account in shareholders’ equity.
Derivative Instruments and Hedging ActivitiesEffective January 1, 2001, the company adopted Statement of FinancialAccounting Standards (SFAS) No. 133, “Accounting for Derivative Instrumentsand Hedging Activities”, as amended. This statement requires that allderivative instruments be recorded on the balance sheet at fair value andestablishes criteria for designation and effectiveness of hedging relation-ships. The company recorded a transition adjustment, which increasedother comprehensive income by $47,000 upon adoption of SFAS No. 133.
The company uses foreign currency forward contracts, interest rateswaps and foreign currency debt to manage risks generally associatedwith foreign exchange rates, interest rates and net investments in foreignoperations. The company does not hold derivative financial instruments ofa speculative nature. On the date that the company enters into a derivativecontract, it designates the derivative as (1) a hedge of (a) the fair value of a recognized asset or liability or (b) an unrecognized firm commitment (a“fair value” hedge), (2) a hedge of (a) a forecasted transaction or (b) thevariability of cash flows that are to be received or paid in connection with arecognized asset or liability (a “cash flow” hedge); or (3) a foreign-currency
TU
RN
IT
UP

36
EC
OL
AB
fair-value or cash flow hedge (a “foreign currency” hedge). The companyformally documents all relationships between hedging instruments andhedged items, as well as its risk-management objective and strategy forundertaking various hedge transactions. The company also formally assesses(both at the hedge’s inception and on an ongoing basis) whether the deriva-tives that are used in hedging transactions have been highly effective inoffsetting changes in the fair value or cash flows of hedged items andwhether those derivatives may be expected to remain highly effective infuture periods. When it is determined that a derivative is not (or has ceasedto be) highly effective as a hedge, the company will discontinue hedgeaccounting prospectively. The company believes that on an ongoing basisits portfolio of derivative instruments will generally be highly effective ashedges. Hedge ineffectiveness during the years ended December 31, 2002and 2001 was not significant.
All of the company’s derivatives are recognized on the balance sheet attheir fair value. The earnings impact resulting from the change in fair valueof the derivative instruments is recorded in the same line item in the con-solidated statement of income as the underlying exposure being hedged.
Use of EstimatesThe preparation of the company’s financial statements requires manage-ment to make certain estimates and assumptions that affect the reportedamounts of assets and liabilities as of the date of the financial statementsand the reported amounts of revenues and expenses during the reportingperiods. Actual results could differ from these estimates.
New Accounting PronouncementsIn June 2001, the Financial Accounting Standards Board (FASB) issued SFASNo. 143, “Accounting for Asset Retirement Obligations”, which addressesfinancial accounting and reporting for obligations associated with theretirement of tangible long-lived assets and the associated asset retirementcosts. In June 2002, the FASB issued SFAS No. 146, “Accounting for CostsAssociated with Exit or Disposal Activities”, which requires that a liability forcosts associated with exit or disposal activities be recognized and measuredinitially at fair value when the liability is incurred. In November 2002, theFASB issued FASB Interpretation No. 45 (FIN 45), “Guarantor’s Accountingand Disclosure Requirements for Guarantees, Including Indirect Guarantees of Indebtedness of Others”. FIN 45 clarifies the requirements of FASBStatement No. 5, “Accounting for Contingencies”, relating to a guarantor’saccounting for, and disclosure of, the issuance of certain types of guaran-tees. The company expects the provisions of SFAS 143, SFAS 146 and FIN45 will not have a material impact on its consolidated results of operations,cash flows and financial position.
In December, 2002, the FASB issued SFAS No. 148, “Accounting forStock-Based Compensation – Transition and Disclosure, an Amendment of FASB No. 123.” SFAS No. 148 provides alternative methods of transitionfor a voluntary change to the fair value-based method of accounting forstock-based employee compensation. In addition, the statement amendsthe disclosure requirements of SFAS No. 123 to require prominent disclosuresin both annual and interim financial statements describing the method ofaccounting for stock-based employee compensation and the effect of themethod used on reported results. The amendments are effective for fiscalyears ending after December 15, 2002. The company adopted SFAS No.148
for its year-end 2002 and has enhanced its stock-based employee compen-sation disclosures. The company has no immediate plans to change to thefair value-based method of accounting for stock-based compensation.
ReclassificationsIn connection with adopting Emerging Issues Task Force (EITF) Issue No. 01-09 “Accounting for Consideration Given by a Vendor to a Customer ”,the company reclassified certain customer incentive costs from selling,general and administrative expenses to a component of revenue at thebeginning of 2002. Prior year amounts have been reclassified for consis-tency purposes. The reclassification decreased previously reported revenueby approximately $34 million for each of the years ended December 31,2001 and 2000. Also, at the beginning of 2002, the company reclassifiedrepair part costs from selling, general and administrative expense to cost of sales. Prior year amounts have also been reclassified for consistencypurposes. The impact of this reclassification increased previously reportedcost of sales by approximately $31 million and $30 million for the yearsended December 31, 2001 and 2000, respectively. These reclassificationshad no impact on previously reported net income or shareholders’ equity.
Note 3 Special Charges
In the first quarter of 2002, management approved plans to undertakerestructuring and cost saving actions during 2002, including costs relatedto the integration of the company’s European operations. These actionsincluded global workforce reductions, facility closings, and product line discontinuations. As a result, the company recorded restructuring expenseof $47,767,000 ($29,867,000 after tax) for the year ended December 31,2002. The company also incurred merger integration costs of $4,032,000($2,521,000 after tax) related to European and other operations. Restructuringand merger integration costs have been included as “special charges”on the consolidated statement of income with a portion of restructuringexpenses included as a component of “cost of sales”. Amounts included as a component of “cost of sales” include asset disposals of $6,180,000 in 2002 and $1,948,000 in 2000 and manufacturing related severance of$2,797,000 for the year ended December 31, 2002.
Also included in “special charges” on the consolidated statement ofincome for the year ended December 31, 2002 is a one-time curtailmentgain of $5,791,000 ($3,501,000 after tax), related to changes to postretire-ment healthcare benefits made in the first quarter of 2002.
During the fourth quarter of 2001, the company incurred $940,000 inspecial charges to facilitate the acquisition of Henkel-Ecolab and to beginthe integration process following the acquisition.
Management also approved various actions during the fourth quarter of 2000 to improve the long-term efficiency and competitiveness of thecompany and to reduce costs. These actions included personnel reductions,discontinuance of certain product lines, changes to certain manufacturingand distribution operations and the closing of selected sales and administra-tive offices. As a result of these actions the company recorded restructuringexpenses of $7,137,000 ($4,311,000 after tax). These expenses have alsobeen reported as “special charges” on the consolidated statement of income.
For segment reporting purposes, each of these items has been includedin the company’s corporate segment, which is consistent with the company’s
TU
RN
IT
UP
Notes to consolidated financial statements
Note 2 Summary of Significant Accounting Policies (continued)
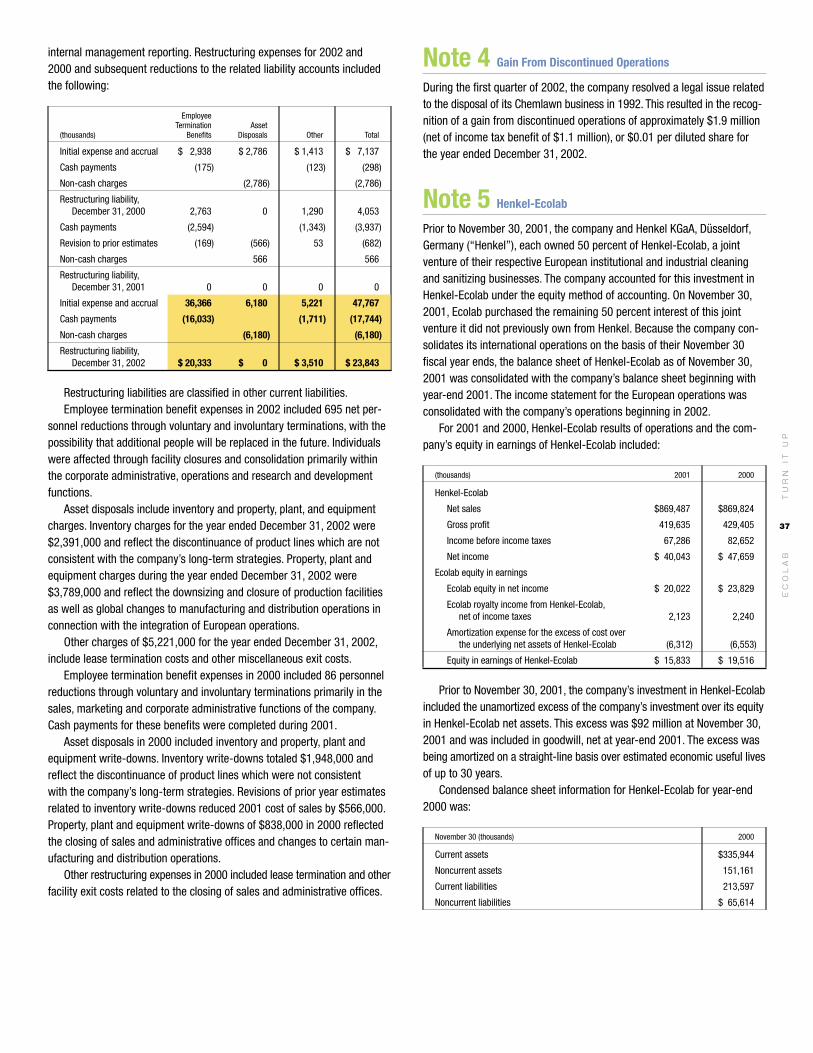
EC
OL
AB
37
internal management reporting. Restructuring expenses for 2002 and 2000 and subsequent reductions to the related liability accounts includedthe following:
EmployeeTermination Asset
(thousands) Benefits Disposals Other Total
Initial expense and accrual $ 2,938 $ 2,786 $ 1,413 $ 7,137
Cash payments (175) (123) (298)
Non-cash charges (2,786) (2,786)
Restructuring liability,December 31, 2000 2,763 0 1,290 4,053
Cash payments (2,594) (1,343) (3,937)
Revision to prior estimates (169) (566) 53 (682)
Non-cash charges 566 566
Restructuring liability,December 31, 2001 0 0 0 0
Initial expense and accrual 36,366 6,180 5,221 47,767
Cash payments (16,033) (1,711) (17,744)
Non-cash charges (6,180) (6,180)
Restructuring liability,December 31, 2002 $ 20,333 $ 0 $ 3,510 $ 23,843
Restructuring liabilities are classified in other current liabilities.Employee termination benefit expenses in 2002 included 695 net per-
sonnel reductions through voluntary and involuntary terminations, with thepossibility that additional people will be replaced in the future. Individualswere affected through facility closures and consolidation primarily withinthe corporate administrative, operations and research and developmentfunctions.
Asset disposals include inventory and property, plant, and equipmentcharges. Inventory charges for the year ended December 31, 2002 were$2,391,000 and reflect the discontinuance of product lines which are notconsistent with the company’s long-term strategies. Property, plant andequipment charges during the year ended December 31, 2002 were$3,789,000 and reflect the downsizing and closure of production facilitiesas well as global changes to manufacturing and distribution operations inconnection with the integration of European operations.
Other charges of $5,221,000 for the year ended December 31, 2002,include lease termination costs and other miscellaneous exit costs.
Employee termination benefit expenses in 2000 included 86 personnelreductions through voluntary and involuntary terminations primarily in thesales, marketing and corporate administrative functions of the company.Cash payments for these benefits were completed during 2001.
Asset disposals in 2000 included inventory and property, plant andequipment write-downs. Inventory write-downs totaled $1,948,000 andreflect the discontinuance of product lines which were not consistent with the company’s long-term strategies. Revisions of prior year estimatesrelated to inventory write-downs reduced 2001 cost of sales by $566,000.Property, plant and equipment write-downs of $838,000 in 2000 reflectedthe closing of sales and administrative offices and changes to certain man-ufacturing and distribution operations.
Other restructuring expenses in 2000 included lease termination and otherfacility exit costs related to the closing of sales and administrative offices.
Note 4 Gain From Discontinued Operations
During the first quarter of 2002, the company resolved a legal issue relatedto the disposal of its Chemlawn business in 1992. This resulted in the recog-nition of a gain from discontinued operations of approximately $1.9 million(net of income tax benefit of $1.1 million), or $0.01 per diluted share forthe year ended December 31, 2002.
Note 5 Henkel-Ecolab
Prior to November 30, 2001, the company and Henkel KGaA, Düsseldorf,Germany (“Henkel”), each owned 50 percent of Henkel-Ecolab, a joint venture of their respective European institutional and industrial cleaningand sanitizing businesses. The company accounted for this investment inHenkel-Ecolab under the equity method of accounting. On November 30,2001, Ecolab purchased the remaining 50 percent interest of this joint venture it did not previously own from Henkel. Because the company con-solidates its international operations on the basis of their November 30 fiscal year ends, the balance sheet of Henkel-Ecolab as of November 30,2001 was consolidated with the company’s balance sheet beginning withyear-end 2001. The income statement for the European operations wasconsolidated with the company’s operations beginning in 2002.
For 2001 and 2000, Henkel-Ecolab results of operations and the com-pany’s equity in earnings of Henkel-Ecolab included:
(thousands) 2001 2000
Henkel-Ecolab
Net sales $869,487 $869,824
Gross profit 419,635 429,405
Income before income taxes 67,286 82,652
Net income $ 40,043 $ 47,659
Ecolab equity in earnings
Ecolab equity in net income $ 20,022 $ 23,829
Ecolab royalty income from Henkel-Ecolab,net of income taxes 2,123 2,240
Amortization expense for the excess of cost overthe underlying net assets of Henkel-Ecolab (6,312) (6,553)
Equity in earnings of Henkel-Ecolab $ 15,833 $ 19,516
Prior to November 30, 2001, the company’s investment in Henkel-Ecolabincluded the unamortized excess of the company’s investment over its equityin Henkel-Ecolab net assets. This excess was $92 million at November 30,2001 and was included in goodwill, net at year-end 2001. The excess wasbeing amortized on a straight-line basis over estimated economic useful livesof up to 30 years.
Condensed balance sheet information for Henkel-Ecolab for year-end2000 was:
November 30 (thousands) 2000
Current assets $335,944
Noncurrent assets 151,161
Current liabilities 213,597
Noncurrent liabilities $ 65,614
TU
RN
IT
UP

38
EC
OL
AB
The company acquired the remaining 50 percent of Henkel-Ecolab forapproximately 483.5 million euros, equal to approximately $432.7 millionat rates of exchange prevailing at November 30, 2001 plus approximately$6.5 million of direct transaction related expenses.
The acquisition of Henkel-Ecolab was accounted for under the purchasemethod of accounting as a step-acquisition. Accordingly, the purchase pricewas applied to the 50 percent interest of Henkel-Ecolab being acquired.
The following table summarizes the estimated fair value of assetsacquired and liabilities assumed at the date of acquisition and the finalallocation made during 2002.
Initial FinalNovember 30, 2001 (thousands) Allocation Allocation
Current assets $178,705 $178,201
Property, plant and equipment 66,538 67,966
Identifiable intangible assets 119,257 119,203
Goodwill 239,737 252,017
Other assets 9,185 29,678
Total assets acquired 613,422 647,065
Current liabilities 115,559 130,199
Postretirement health care and pension benefits 38,614 38,219
Other liabilities 19,860 39,423
Total liabilities assumed 174,033 207,841
Purchase price $439,389 $439,224
Identifiable intangible assets have a weighted-average useful life ofapproximately 14 years. Included as a component of identifiable intangibleassets are customer relationships of $83 million and intellectual property of$31 million. Goodwill was assigned to the International Cleaning & Sanitizingreportable segment. Approximately 30 percent of the goodwill will bedeductible for income tax purposes.
Subsequent to the initial allocation of the purchase price, approximately$28.0 million of restructuring charges were incurred in connection with theacquisition of Henkel-Ecolab. These costs consisted of $24.1 million foremployee termination benefits, $0.4 million for asset disposals, includinginventory and property, plant and equipment, and $3.5 million for lease ter-mination and other costs. Because the company acquired only 50 percentof Henkel-Ecolab, $14.0 million of these costs were treated as a liabilityassumed at the date of acquisition and have been treated as additionalgoodwill in 2002. The remaining $14.0 million, along with $1.9 million ofmerger integration costs, were treated as operating expenses during 2002and are included in the “special charges” discussed in Note 3 to the con-solidated financial statements.
The following unaudited pro forma financial information reflects theconsolidated results of the company and Henkel-Ecolab assuming theacquisition had occurred at the beginning of 2000.
(thousands, except per share) 2001 2000
(unaudited) (unaudited)
Net sales $3,182,271 $3,092,985
Income from continuing operations before cumulative effect of change in accounting 192,009 215,651
Diluted income from continuing operations before change in accounting per common share $ 1.48 $ 1.63
These unaudited pro forma results are presented for information pur-poses only. These unaudited pro forma results also do not include the benefits of improvements from synergies the company anticipates it will
realize. The results are not necessarily indicative of results that would haveoccurred had the acquisition been completed at the beginning of 2000, norare they necessarily indicative of future operating results.
As part of the transaction, the stockholder agreement between the com-pany and Henkel was amended and extended. The amended stockholderagreement provides, among other things, that Henkel is permitted to increaseits ownership in the company to 35 percent of the company’s outstandingcommon stock. Henkel remains entitled to proportionate representation onthe company’s board of directors.
Henkel owned 36.3 million shares, or approximately 28.0 percent, ofthe company’s outstanding common stock on December 31, 2002.
In 2002, 2001 and 2000, the company and its affiliates sold productsand services in the amount of $6,986,000, $507,000 and $625,000 toHenkel or its affiliates, and purchased products and services in the amountof $82,743,000, $4,628,000 and $5,183,000 from Henkel or its affiliates.Transactions between Henkel and Ecolab’s recently acquired Europeanoperations are reflected in these numbers beginning in 2002. Prior to 2002,Henkel-Ecolab also acquired and sold products to Henkel. The companyalso acquired access to certain technology of Henkel during 2000 in returnfor a payment of approximately $1,700,000. The transactions were madeat prices comparable to prices charged to unrelated third parties.
Note 6 Other Business Acquisitions and Divestitures
Business AcquisitionsSignificant business acquisitions made by the company during 2002, 2001and 2000, excluding the acquisition of Henkel-Ecolab, were as follows:
Estimated Ecolab Annual Sales
Operating Prior toDate of Segment – Type Acquisition
Business Acquired Acquisition of Business (millions)
(unaudited)
2002
Kleencare Hygiene Jan. 2002 Europe $30
Audits International Jan. 2002 Pest 3Elimination
Terminix Ltd. Sept. 2002 Europe 65
2001
Ecolab S.A. – 23.5% interest inaddition to prior 51% interest Dec. 2000 Latin America $ 8
Randall International LLC –25% interest Jan. 2001 Institutional 8
Envirocare Service Pte. Ltd. March 2001 Asia Pacific 1
Microbiotecnica July 2001 Latin America 3
Commercial Parts & Services, Inc. Oct. 2001 GCS 28
2000
Southwest Sanitary Distributing Co.(SSDC) Feb. 2000 Kay $24
Spartan Feb. 2000 Latin America 20
ARR/CRS June 2000 GCS 4
Dong Woo Deterpan Co., Ltd. June 2000 Asia Pacific 6
Stove Parts Supply Co. Aug. 2000 GCS 19
Facilitec Corp. Sept. 2000 Institutional 14
Zohar-Dalia Soap and Detergent Factory (Israel) –51% interest Sept. 2000 Africa/Export 15
Peterson’s Commercial Parts & Service Nov. 2000 GCS 4
TU
RN
IT
UP
Notes to consolidated financial statements
Note 5 Henkel-Ecolab (continued)

EC
OL
AB
39
The total consideration paid by the company for the 2002 acquisitionswas approximately $63 million. The purchase price of certain acquisitionsis subject to post-closing adjustments.
The total consideration paid by the company for the 2001 acquisitions,excluding Henkel-Ecolab, was approximately $30 million, of which approxi-mately $18 million was allocated to goodwill.
The total consideration paid by the company for the 2000 acquisitionsincluded cash of approximately $90 million and 424,111 shares of commonstock with a market value of approximately $14 million issued in the SSDCacquisition, of which approximately $88 million was allocated to goodwill.
These acquisitions have been accounted for as purchases and, accord-ingly, the results of their operations have been included in the financialstatements of the company from the dates of acquisition. Net sales andoperating income of these businesses were not significant to the company’sconsolidated results of operations, financial position and cash flows.
The changes in the carrying amount of goodwill for each of the company’sreportable segments for the year ended December 31, 2002 are as follows:
United States
Total InternationalCleaning & Other United Cleaning &
(thousands) Sanitizing Services States Sanitizing Consolidated
Balance as of December 31, 2001 $121,046 $ 44,796 $165,842 $431,083 $596,925
Goodwill acquired during year* 3,532 4,510 8,042 58,862 66,904
Foreign currency translation 38,472 38,472
Impairment losses upon adoption ofSFAS No. 142 onJanuary 1, 2002 (4,002) (4,002)
Impairment losses during 2002 (2,599) (2,599) (2,599)
Balance as of December 31, 2002 $121,979 $ 49,306 $171,285 $524,415 $695,700
*All of the goodwill related to businesses acquired in 2002 is expected to be tax deductible.Goodwill acquired also includes adjustments to prior year acquisitions including the restruc-turing activities discussed in Note 5.
Gain on Sale of Jackson Business In November 2000, the company sold its Jackson dishmachine manufactur-ing business for cash proceeds of approximately $36 million. The companyrealized a gain of $25,925,000 ($14,988,000 after tax). The gain has beenincluded in corporate operating income for segment reporting purposes.Jackson’s total annual sales were approximately $40 million, including inter-company sales to Ecolab. Jackson has continued to supply dishmachines tothe company under a long-term supply agreement.
Net sales, excluding intercompany sales, for the business were $13.7million for 2000. Operating income, excluding intercompany profit, for thebusiness was $1.4 million for 2000. The consolidated financial statementsand accompanying notes reflect the operating results of the Jackson dishma-chine manufacturing business as a continuing operation in the United StatesOther Services segment through the date of disposal (November 9, 2000).
TU
RN
IT
UP
Note 7 Balance Sheet Information
December 31 (thousands) 2002 2001 2000
Accounts Receivable, Net
Accounts receivable $ 589,149 $ 544,371 $ 342,267
Allowance for doubtful accounts (35,995) (30,297) (15,330)
Total $ 553,154 $ 514,074 $ 326,937
Inventories
Finished goods $ 136,721 $ 124,657 $ 74,392
Raw materials and parts 156,628 156,754 96,430
Excess of fifo cost over lifo cost (1,843) (1,626) (2,602)
Total $ 291,506 $ 279,785 $ 168,220
Property, Plant and Equipment,Net
Land $ 21,914 $ 20,349 $ 12,436
Buildings and leaseholds 231,119 221,054 174,651
Machinery and equipment 525,359 452,611 290,017
Merchandising equipment 821,109 743,404 556,205
Construction in progress 18,830 22,217 22,235
1,618,331 1,459,635 1,055,544
Accumulated depreciation and amortization (938,066) (815,312) (553,904)
Total $ 680,265 $ 644,323 $ 501,640
Goodwill, Net
Goodwill $ 871,208 $ 763,211 $ 311,401
Accumulated amortization (175,508) (166,286) (59,379)
Total $ 695,700 $ 596,925 $ 252,022
Other Intangible Assets, Net
Customer relationships $ 120,324 $ 104,277 $ 18,521
Intellectual property 71,104 66,418 1,610
Trademarks 50,308 48,540 38,262
Other intangibles 13,502 16,292 17,615
255,238 235,527 76,008
Accumulated amortization (66,568) (56,576) (20,974)
Total $ 188,670 $ 178,951 $ 55,034
Other Assets, Net
Deferred income taxes $ 36,797 $ 56,952 $ 26,768
Pension 106,314
Other 154,746 118,266 78,337
Total $ 297,857 $ 175,218 $ 105,105
Short-Term Debt
Notes payable $ 146,947 $ 230,306 $ 68,644
Long-term debt, current maturities 13,152 3,087 67,948
Total $ 160,099 $ 233,393 $ 136,592
Other Current Liabilities
Discounts and rebates $ 140,354 $ 125,123 $ 89,041
Other 163,361 118,057 71,643
Total $ 303,715 $ 243,180 $ 160,684
Long-Term Debt
6.875% notes, due 2011 $ 148,974 $ 148,847
5.375% Euronotes, due 2007 299,777
Commercial paper 265,860 $ 145,800
7.19% senior notes, due 2006 75,000 75,000 75,000
9.68% senior notes, due 1995-2001 14,286
6.00% medium-term notes, due 2001 52,800
Other 29,144 25,660 14,439
552,895 515,367 302,325
Long-term debt, current maturities (13,152) (3,087) (67,948)
Total $ 539,743 $ 512,280 $ 234,377
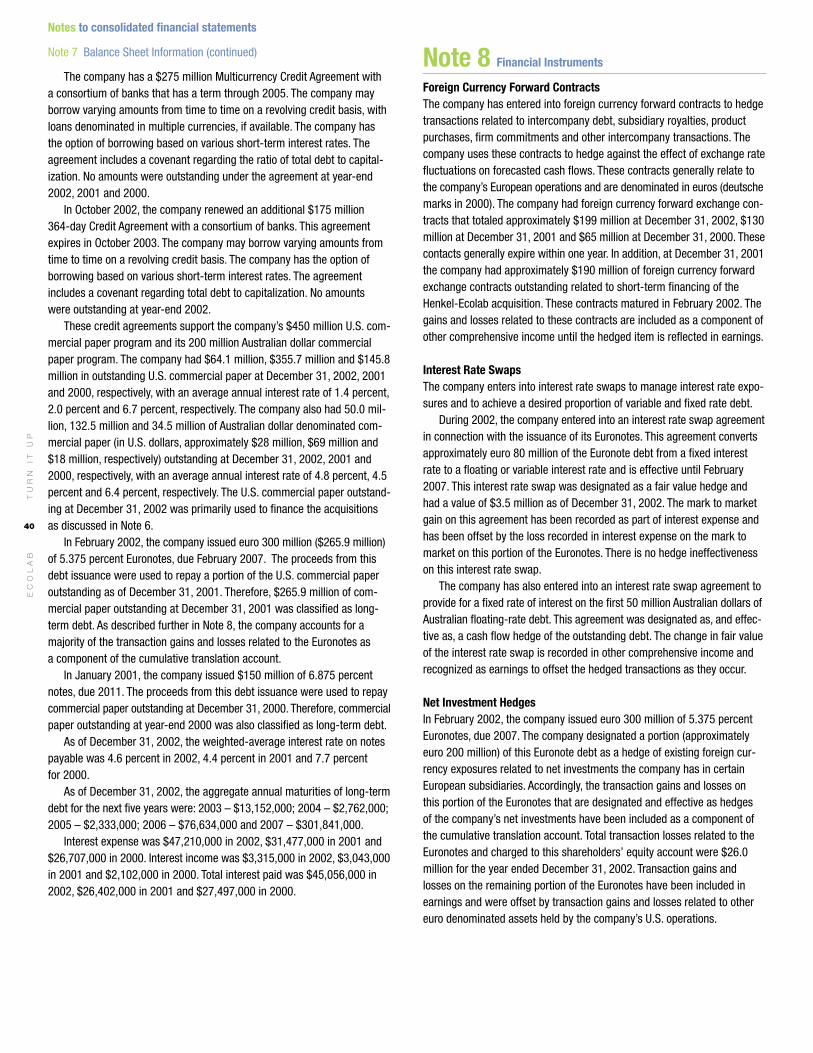
40
EC
OL
AB
The company has a $275 million Multicurrency Credit Agreement with a consortium of banks that has a term through 2005. The company mayborrow varying amounts from time to time on a revolving credit basis, withloans denominated in multiple currencies, if available. The company hasthe option of borrowing based on various short-term interest rates. Theagreement includes a covenant regarding the ratio of total debt to capital-ization. No amounts were outstanding under the agreement at year-end2002, 2001 and 2000.
In October 2002, the company renewed an additional $175 million 364-day Credit Agreement with a consortium of banks. This agreementexpires in October 2003. The company may borrow varying amounts fromtime to time on a revolving credit basis. The company has the option ofborrowing based on various short-term interest rates. The agreementincludes a covenant regarding total debt to capitalization. No amounts were outstanding at year-end 2002.
These credit agreements support the company’s $450 million U.S. com-mercial paper program and its 200 million Australian dollar commercialpaper program. The company had $64.1 million, $355.7 million and $145.8million in outstanding U.S. commercial paper at December 31, 2002, 2001and 2000, respectively, with an average annual interest rate of 1.4 percent,2.0 percent and 6.7 percent, respectively. The company also had 50.0 mil-lion, 132.5 million and 34.5 million of Australian dollar denominated com-mercial paper (in U.S. dollars, approximately $28 million, $69 million and$18 million, respectively) outstanding at December 31, 2002, 2001 and2000, respectively, with an average annual interest rate of 4.8 percent, 4.5percent and 6.4 percent, respectively. The U.S. commercial paper outstand-ing at December 31, 2002 was primarily used to finance the acquisitionsas discussed in Note 6.
In February 2002, the company issued euro 300 million ($265.9 million)of 5.375 percent Euronotes, due February 2007. The proceeds from thisdebt issuance were used to repay a portion of the U.S. commercial paperoutstanding as of December 31, 2001. Therefore, $265.9 million of com-mercial paper outstanding at December 31, 2001 was classified as long-term debt. As described further in Note 8, the company accounts for amajority of the transaction gains and losses related to the Euronotes as a component of the cumulative translation account.
In January 2001, the company issued $150 million of 6.875 percentnotes, due 2011. The proceeds from this debt issuance were used to repaycommercial paper outstanding at December 31, 2000. Therefore, commercialpaper outstanding at year-end 2000 was also classified as long-term debt.
As of December 31, 2002, the weighted-average interest rate on notespayable was 4.6 percent in 2002, 4.4 percent in 2001 and 7.7 percent for 2000.
As of December 31, 2002, the aggregate annual maturities of long-termdebt for the next five years were: 2003 – $13,152,000; 2004 – $2,762,000;2005 – $2,333,000; 2006 – $76,634,000 and 2007 – $301,841,000.
Interest expense was $47,210,000 in 2002, $31,477,000 in 2001 and$26,707,000 in 2000. Interest income was $3,315,000 in 2002, $3,043,000in 2001 and $2,102,000 in 2000. Total interest paid was $45,056,000 in2002, $26,402,000 in 2001 and $27,497,000 in 2000.
Note 8 Financial Instruments
Foreign Currency Forward ContractsThe company has entered into foreign currency forward contracts to hedgetransactions related to intercompany debt, subsidiary royalties, productpurchases, firm commitments and other intercompany transactions. Thecompany uses these contracts to hedge against the effect of exchange ratefluctuations on forecasted cash flows. These contracts generally relate tothe company’s European operations and are denominated in euros (deutschemarks in 2000). The company had foreign currency forward exchange con-tracts that totaled approximately $199 million at December 31, 2002, $130million at December 31, 2001 and $65 million at December 31, 2000. Thesecontacts generally expire within one year. In addition, at December 31, 2001the company had approximately $190 million of foreign currency forwardexchange contracts outstanding related to short-term financing of theHenkel-Ecolab acquisition. These contracts matured in February 2002. Thegains and losses related to these contracts are included as a component ofother comprehensive income until the hedged item is reflected in earnings.
Interest Rate SwapsThe company enters into interest rate swaps to manage interest rate expo-sures and to achieve a desired proportion of variable and fixed rate debt.
During 2002, the company entered into an interest rate swap agreementin connection with the issuance of its Euronotes. This agreement convertsapproximately euro 80 million of the Euronote debt from a fixed interestrate to a floating or variable interest rate and is effective until February2007. This interest rate swap was designated as a fair value hedge andhad a value of $3.5 million as of December 31, 2002. The mark to marketgain on this agreement has been recorded as part of interest expense andhas been offset by the loss recorded in interest expense on the mark tomarket on this portion of the Euronotes. There is no hedge ineffectivenesson this interest rate swap.
The company has also entered into an interest rate swap agreement toprovide for a fixed rate of interest on the first 50 million Australian dollars ofAustralian floating-rate debt. This agreement was designated as, and effec-tive as, a cash flow hedge of the outstanding debt. The change in fair valueof the interest rate swap is recorded in other comprehensive income andrecognized as earnings to offset the hedged transactions as they occur.
Net Investment HedgesIn February 2002, the company issued euro 300 million of 5.375 percentEuronotes, due 2007. The company designated a portion (approximatelyeuro 200 million) of this Euronote debt as a hedge of existing foreign cur-rency exposures related to net investments the company has in certainEuropean subsidiaries. Accordingly, the transaction gains and losses on this portion of the Euronotes that are designated and effective as hedges of the company’s net investments have been included as a component ofthe cumulative translation account. Total transaction losses related to theEuronotes and charged to this shareholders’ equity account were $26.0million for the year ended December 31, 2002. Transaction gains andlosses on the remaining portion of the Euronotes have been included inearnings and were offset by transaction gains and losses related to othereuro denominated assets held by the company’s U.S. operations.
TU
RN
IT
UP
Notes to consolidated financial statements
Note 7 Balance Sheet Information (continued)
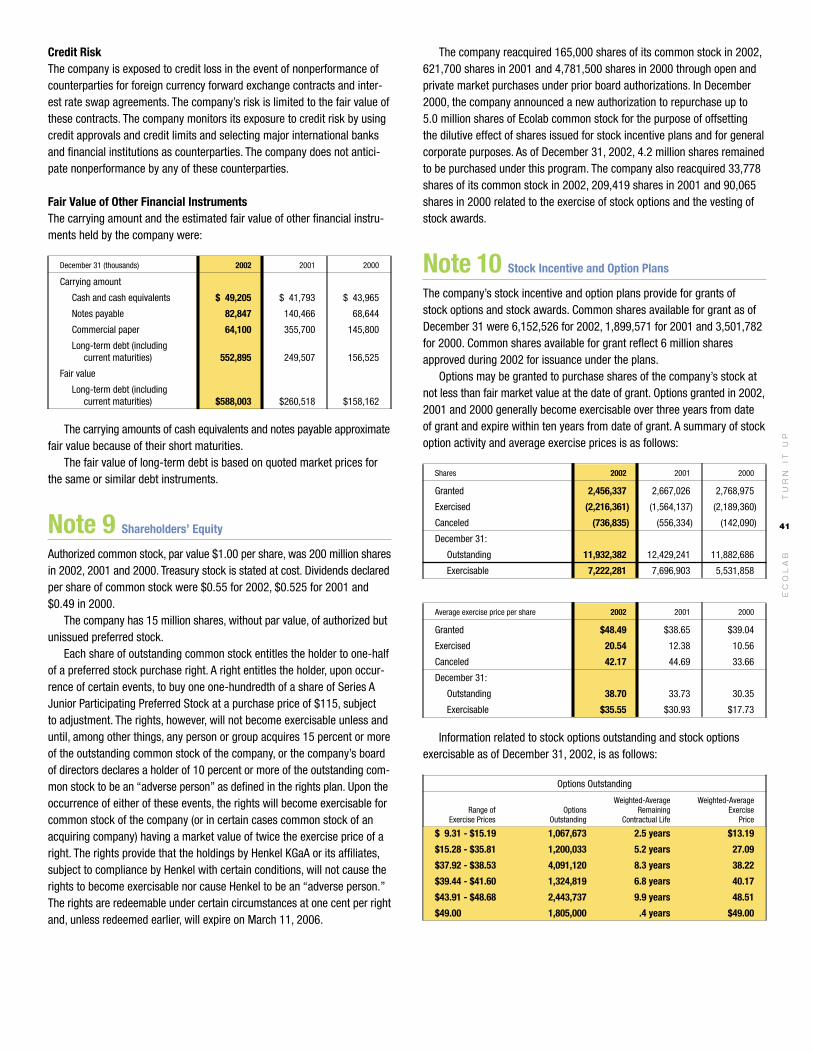
EC
OL
AB
41
Credit RiskThe company is exposed to credit loss in the event of nonperformance ofcounterparties for foreign currency forward exchange contracts and inter-est rate swap agreements. The company’s risk is limited to the fair value ofthese contracts. The company monitors its exposure to credit risk by usingcredit approvals and credit limits and selecting major international banksand financial institutions as counterparties. The company does not antici-pate nonperformance by any of these counterparties.
Fair Value of Other Financial InstrumentsThe carrying amount and the estimated fair value of other financial instru-ments held by the company were:
December 31 (thousands) 2002 2001 2000
Carrying amount
Cash and cash equivalents $ 49,205 $ 41,793 $ 43,965
Notes payable 82,847 140,466 68,644
Commercial paper 64,100 355,700 145,800
Long-term debt (including current maturities) 552,895 249,507 156,525
Fair value
Long-term debt (includingcurrent maturities) $588,003 $260,518 $158,162
The carrying amounts of cash equivalents and notes payable approximatefair value because of their short maturities.
The fair value of long-term debt is based on quoted market prices forthe same or similar debt instruments.
Note 9 Shareholders’ Equity
Authorized common stock, par value $1.00 per share, was 200 million sharesin 2002, 2001 and 2000. Treasury stock is stated at cost. Dividends declaredper share of common stock were $0.55 for 2002, $0.525 for 2001 and$0.49 in 2000.
The company has 15 million shares, without par value, of authorized butunissued preferred stock.
Each share of outstanding common stock entitles the holder to one-halfof a preferred stock purchase right. A right entitles the holder, upon occur-rence of certain events, to buy one one-hundredth of a share of Series AJunior Participating Preferred Stock at a purchase price of $115, subject to adjustment. The rights, however, will not become exercisable unless anduntil, among other things, any person or group acquires 15 percent or moreof the outstanding common stock of the company, or the company’s boardof directors declares a holder of 10 percent or more of the outstanding com-mon stock to be an “adverse person” as defined in the rights plan. Upon theoccurrence of either of these events, the rights will become exercisable forcommon stock of the company (or in certain cases common stock of anacquiring company) having a market value of twice the exercise price of aright. The rights provide that the holdings by Henkel KGaA or its affiliates,subject to compliance by Henkel with certain conditions, will not cause therights to become exercisable nor cause Henkel to be an “adverse person.”The rights are redeemable under certain circumstances at one cent per rightand, unless redeemed earlier, will expire on March 11, 2006.
The company reacquired 165,000 shares of its common stock in 2002,621,700 shares in 2001 and 4,781,500 shares in 2000 through open andprivate market purchases under prior board authorizations. In December2000, the company announced a new authorization to repurchase up to 5.0 million shares of Ecolab common stock for the purpose of offsetting the dilutive effect of shares issued for stock incentive plans and for generalcorporate purposes. As of December 31, 2002, 4.2 million shares remainedto be purchased under this program. The company also reacquired 33,778shares of its common stock in 2002, 209,419 shares in 2001 and 90,065shares in 2000 related to the exercise of stock options and the vesting ofstock awards.
Note 10 Stock Incentive and Option Plans
The company’s stock incentive and option plans provide for grants of stock options and stock awards. Common shares available for grant as ofDecember 31 were 6,152,526 for 2002, 1,899,571 for 2001 and 3,501,782for 2000. Common shares available for grant reflect 6 million sharesapproved during 2002 for issuance under the plans.
Options may be granted to purchase shares of the company’s stock atnot less than fair market value at the date of grant. Options granted in 2002,2001 and 2000 generally become exercisable over three years from date of grant and expire within ten years from date of grant. A summary of stockoption activity and average exercise prices is as follows:
Shares 2002 2001 2000
Granted 2,456,337 2,667,026 2,768,975
Exercised (2,216,361) (1,564,137) (2,189,360)
Canceled (736,835) (556,334) (142,090)
December 31:
Outstanding 11,932,382 12,429,241 11,882,686
Exercisable 7,222,281 7,696,903 5,531,858
Average exercise price per share 2002 2001 2000
Granted $48.49 $38.65 $39.04
Exercised 20.54 12.38 10.56
Canceled 42.17 44.69 33.66
December 31:
Outstanding 38.70 33.73 30.35
Exercisable $35.55 $30.93 $17.73
Information related to stock options outstanding and stock optionsexercisable as of December 31, 2002, is as follows:
Options Outstanding
Weighted-Average Weighted-AverageRange of Options Remaining Exercise
Exercise Prices Outstanding Contractual Life Price
$ 9.31 - $15.19 1,067,673 2.5 years $13.19
$15.28 - $35.81 1,200,033 5.2 years 27.09
$37.92 - $38.53 4,091,120 8.3 years 38.22
$39.44 - $41.60 1,324,819 6.8 years 40.17
$43.91 - $48.68 2,443,737 9.9 years 48.51
$49.00 1,805,000 .4 years $49.00
TU
RN
IT
UP
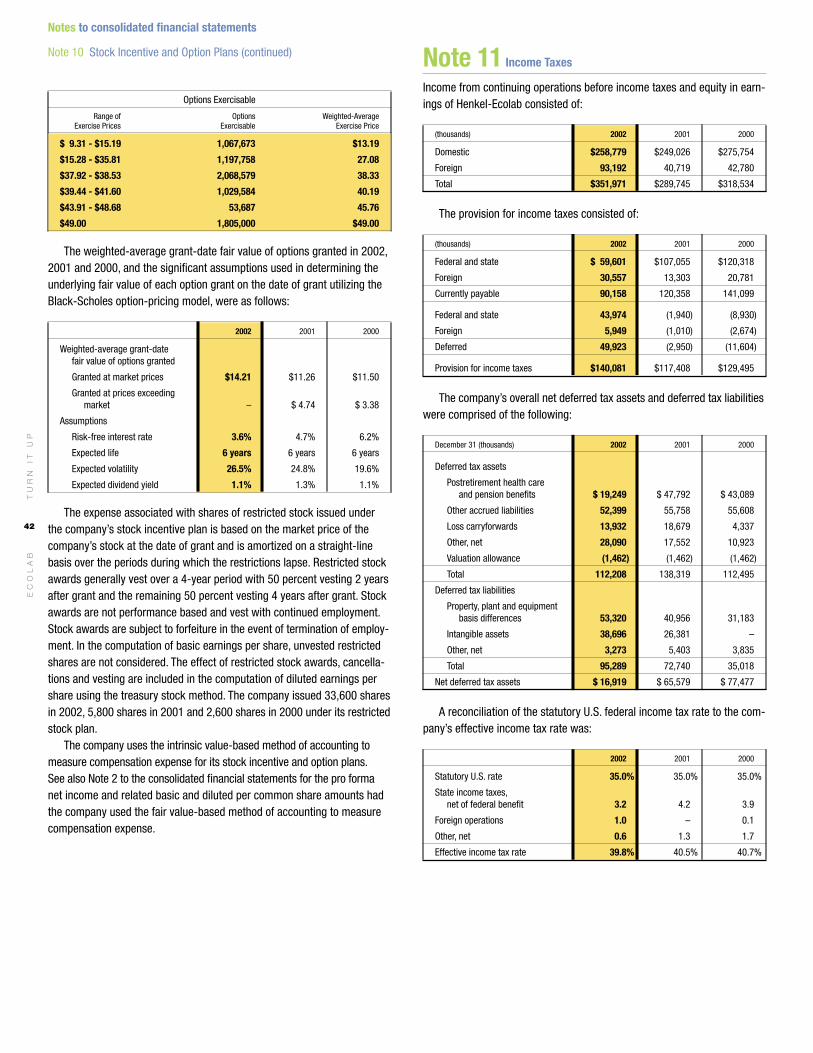
42
EC
OL
AB
Options Exercisable
Range of Options Weighted-AverageExercise Prices Exercisable Exercise Price
$ 9.31 - $15.19 1,067,673 $13.19
$15.28 - $35.81 1,197,758 27.08
$37.92 - $38.53 2,068,579 38.33
$39.44 - $41.60 1,029,584 40.19
$43.91 - $48.68 53,687 45.76
$49.00 1,805,000 $49.00
The weighted-average grant-date fair value of options granted in 2002,2001 and 2000, and the significant assumptions used in determining theunderlying fair value of each option grant on the date of grant utilizing theBlack-Scholes option-pricing model, were as follows:
2002 2001 2000
Weighted-average grant-date fair value of options granted
Granted at market prices $14.21 $11.26 $11.50
Granted at prices exceeding market – $ 4.74 $ 3.38
Assumptions
Risk-free interest rate 3.6% 4.7% 6.2%
Expected life 6 years 6 years 6 years
Expected volatility 26.5% 24.8% 19.6%
Expected dividend yield 1.1% 1.3% 1.1%
The expense associated with shares of restricted stock issued underthe company’s stock incentive plan is based on the market price of thecompany’s stock at the date of grant and is amortized on a straight-linebasis over the periods during which the restrictions lapse. Restricted stockawards generally vest over a 4-year period with 50 percent vesting 2 yearsafter grant and the remaining 50 percent vesting 4 years after grant. Stockawards are not performance based and vest with continued employment.Stock awards are subject to forfeiture in the event of termination of employ-ment. In the computation of basic earnings per share, unvested restrictedshares are not considered. The effect of restricted stock awards, cancella-tions and vesting are included in the computation of diluted earnings pershare using the treasury stock method. The company issued 33,600 sharesin 2002, 5,800 shares in 2001 and 2,600 shares in 2000 under its restrictedstock plan.
The company uses the intrinsic value-based method of accounting tomeasure compensation expense for its stock incentive and option plans.See also Note 2 to the consolidated financial statements for the pro formanet income and related basic and diluted per common share amounts hadthe company used the fair value-based method of accounting to measure compensation expense.
Note 11 Income Taxes
Income from continuing operations before income taxes and equity in earn-ings of Henkel-Ecolab consisted of:
(thousands) 2002 2001 2000
Domestic $258,779 $249,026 $275,754
Foreign 93,192 40,719 42,780
Total $351,971 $289,745 $318,534
The provision for income taxes consisted of:
(thousands) 2002 2001 2000
Federal and state $ 59,601 $107,055 $120,318
Foreign 30,557 13,303 20,781
Currently payable 90,158 120,358 141,099
Federal and state 43,974 (1,940) (8,930)
Foreign 5,949 (1,010) (2,674)
Deferred 49,923 (2,950) (11,604)
Provision for income taxes $140,081 $117,408 $129,495
The company’s overall net deferred tax assets and deferred tax liabilitieswere comprised of the following:
December 31 (thousands) 2002 2001 2000
Deferred tax assets
Postretirement health care and pension benefits $ 19,249 $ 47,792 $ 43,089
Other accrued liabilities 52,399 55,758 55,608
Loss carryforwards 13,932 18,679 4,337
Other, net 28,090 17,552 10,923
Valuation allowance (1,462) (1,462) (1,462)
Total 112,208 138,319 112,495
Deferred tax liabilities
Property, plant and equipment basis differences 53,320 40,956 31,183
Intangible assets 38,696 26,381 –
Other, net 3,273 5,403 3,835
Total 95,289 72,740 35,018
Net deferred tax assets $ 16,919 $ 65,579 $ 77,477
A reconciliation of the statutory U.S. federal income tax rate to the com-pany’s effective income tax rate was:
2002 2001 2000
Statutory U.S. rate 35.0% 35.0% 35.0%
State income taxes,net of federal benefit 3.2 4.2 3.9
Foreign operations 1.0 – 0.1
Other, net 0.6 1.3 1.7
Effective income tax rate 39.8% 40.5% 40.7%
TU
RN
IT
UP
Notes to consolidated financial statements
Note 10 Stock Incentive and Option Plans (continued)

EC
OL
AB
43
Cash paid for income taxes was approximately $95 million in 2002,$99 million in 2001 and $128 million in 2000.
As of December 31, 2002, undistributed earnings of international sub-sidiaries of approximately $210 million, were considered to have been reinvested indefinitely and, accordingly, the company has not provided U.S. income taxes on such earnings. If those earnings were remitted to the company, applicable income taxes would be substantially offset byavailable foreign tax credits.
Note 12 Rentals and Leases
The company leases sales and administrative office facilities, distributioncenter facilities, automobiles and computers and other equipment underoperating leases. Rental expense under all operating leases was $77,593,000in 2002, $60,365,000 in 2001 and $55,910,000 in 2000. As of December 31,2002, future minimum payments under operating leases with noncancelableterms in excess of one year were:
(thousands)
2003 $ 32,303
2004 23,567
2005 17,043
2006 12,548
2007 10,660
Thereafter 26,026
Total $122,147
Note 13 Research Expenditures
Research expenditures that related to the development of new productsand processes, including significant improvements and refinements toexisting products, were $49,860,000 in 2002, $33,103,000 in 2001 and$35,504,000 in 2000.
Note 14 Commitments and Contingencies
The company and certain subsidiaries are party to various environmentalactions that have arisen in the ordinary course of business. These includepossible obligations to investigate and mitigate the effects on the environ-ment of the disposal or release of certain chemical substances at various
TU
RN
IT
UP
sites, such as Superfund sites and other operating or closed facilities. Theeffect of these actions on the company’s financial position, results of oper-ations and cash flows to date has not been significant. The company iscurrently participating in environmental assessments and remediation at a number of locations and environmental liabilities have been accruedreflecting management’s best estimate of future costs. At December 31,2002, the accrual for environmental remediation costs was approximately$3.8 million. Potential insurance reimbursements are not anticipated in thecompany’s accruals for environmental liabilities.
The company is self-insured in North America for most workers compen-sation, general liability and automotive liability losses subject to per occur-rence and aggregate annual liability limitations. The company is insured forlosses in excess of these limitations. The company is also self-insured forhealth care claims for eligible participating employees subject to certaindeductibles and limitations. The company determines its liability for claimsincurred but not reported on an actuarial basis.
While the final resolution of these contingencies could result inexpenses different than current accruals, and therefore have an impact onthe company’s consolidated financial results in a future reporting period,management believes the ultimate outcome will not have a significanteffect on the company’s consolidated results of operations, financial posi-tion or cash flows.
Note 15 Retirement Plans
Pension and Postretirement Health Care Benefits PlansThe company has a noncontributory defined benefit pension plan coveringmost of its U.S. employees. Plan benefits are based on years of service and highest average compensation for five consecutive years of employment.Various international subsidiaries also have defined benefit pension plans.Prior to year-end 2001, the international plans were not significant. Theinformation below includes condensed information for the European pen-sion plans associated with the Henkel-Ecolab acquisition as of year-end2001. Beginning in 2002, the information below includes all of the company’ssignificant international defined benefit pension plans.
The company provides postretirement health care benefits to certainU.S. employees. The plan is contributory based on years of service andfamily status, with retiree contributions adjusted annually. Employees outsideof the U.S. are generally covered under government-sponsored programs,and the expense and obligation for providing benefits under company planswas not significant.
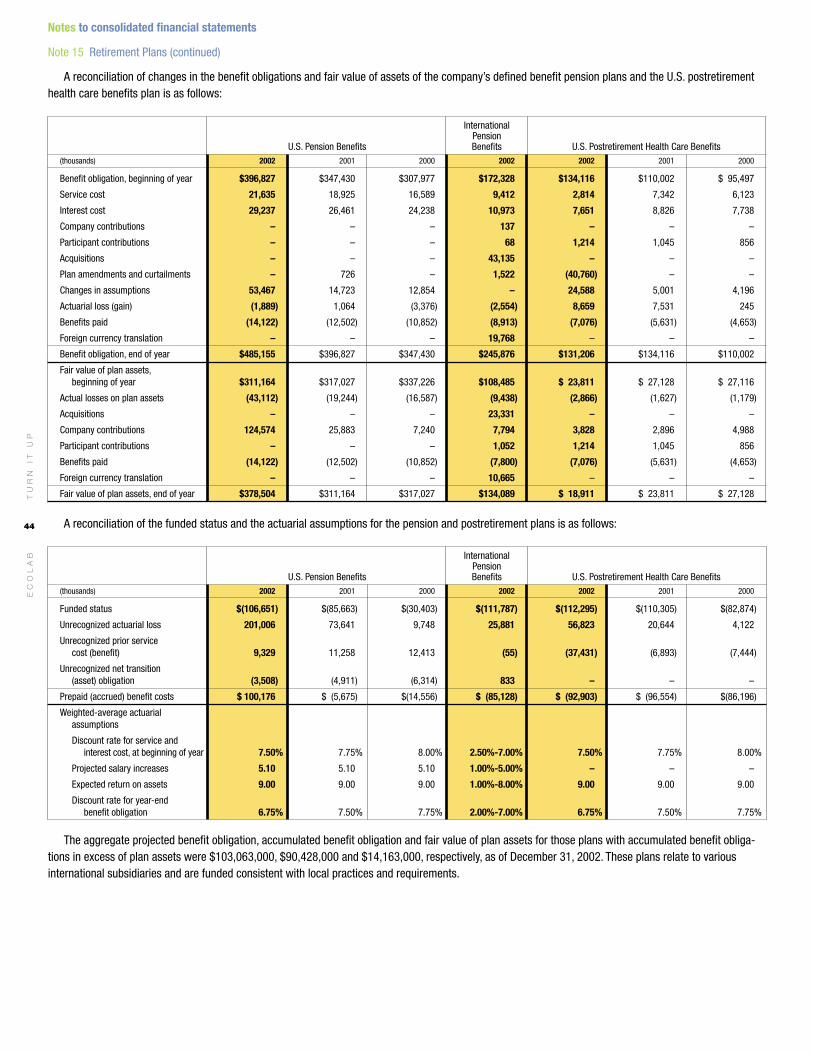
TU
RN
IT
UP
44
EC
OL
AB
Notes to consolidated financial statements
A reconciliation of changes in the benefit obligations and fair value of assets of the company’s defined benefit pension plans and the U.S. postretirementhealth care benefits plan is as follows:
InternationalPension
U.S. Pension Benefits Benefits U.S. Postretirement Health Care Benefits(thousands) 2002 2001 2000 2002 2002 2001 2000
Benefit obligation, beginning of year $396,827 $347,430 $307,977 $172,328 $134,116 $110,002 $ 95,497
Service cost 21,635 18,925 16,589 9,412 2,814 7,342 6,123
Interest cost 29,237 26,461 24,238 10,973 7,651 8,826 7,738
Company contributions – – – 137 – – –
Participant contributions – – – 68 1,214 1,045 856
Acquisitions – – – 43,135 – – –
Plan amendments and curtailments – 726 – 1,522 (40,760) – –
Changes in assumptions 53,467 14,723 12,854 – 24,588 5,001 4,196
Actuarial loss (gain) (1,889) 1,064 (3,376) (2,554) 8,659 7,531 245
Benefits paid (14,122) (12,502) (10,852) (8,913) (7,076) (5,631) (4,653)
Foreign currency translation – – – 19,768 – – –
Benefit obligation, end of year $485,155 $396,827 $347,430 $245,876 $131,206 $134,116 $110,002
Fair value of plan assets,beginning of year $311,164 $317,027 $337,226 $108,485 $ 23,811 $ 27,128 $ 27,116
Actual losses on plan assets (43,112) (19,244) (16,587) (9,438) (2,866) (1,627) (1,179)
Acquisitions – – – 23,331 – – –
Company contributions 124,574 25,883 7,240 7,794 3,828 2,896 4,988
Participant contributions – – – 1,052 1,214 1,045 856
Benefits paid (14,122) (12,502) (10,852) (7,800) (7,076) (5,631) (4,653)
Foreign currency translation – – – 10,665 – – –
Fair value of plan assets, end of year $378,504 $311,164 $317,027 $134,089 $ 18,911 $ 23,811 $ 27,128
A reconciliation of the funded status and the actuarial assumptions for the pension and postretirement plans is as follows:
InternationalPension
U.S. Pension Benefits Benefits U.S. Postretirement Health Care Benefits(thousands) 2002 2001 2000 2002 2002 2001 2000
Funded status $(106,651) $(85,663) $(30,403) $(111,787) $(112,295) $(110,305) $(82,874)
Unrecognized actuarial loss 201,006 73,641 9,748 25,881 56,823 20,644 4,122
Unrecognized prior service cost (benefit) 9,329 11,258 12,413 (55) (37,431) (6,893) (7,444)
Unrecognized net transition (asset) obligation (3,508) (4,911) (6,314) 833 – – –
Prepaid (accrued) benefit costs $ 100,176 $ (5,675) $(14,556) $ (85,128) $ (92,903) $ (96,554) $(86,196)
Weighted-average actuarial assumptions
Discount rate for service and interest cost, at beginning of year 7.50% 7.75% 8.00% 2.50%-7.00% 7.50% 7.75% 8.00%
Projected salary increases 5.10 5.10 5.10 1.00%-5.00% – – –
Expected return on assets 9.00 9.00 9.00 1.00%-8.00% 9.00 9.00 9.00
Discount rate for year-end benefit obligation 6.75% 7.50% 7.75% 2.00%-7.00% 6.75% 7.50% 7.75%
The aggregate projected benefit obligation, accumulated benefit obligation and fair value of plan assets for those plans with accumulated benefit obliga-tions in excess of plan assets were $103,063,000, $90,428,000 and $14,163,000, respectively, as of December 31, 2002. These plans relate to various international subsidiaries and are funded consistent with local practices and requirements.
Note 15 Retirement Plans (continued)

EC
OL
AB
45
TU
RN
IT
UP
Pension and postretirement health care benefits expense for the company’s operations was:
InternationalPension
U.S. Pension Benefits Benefits U.S. Postretirement Health Care Benefits(thousands) 2002 2001 2000 2002 2002 2001 2000
Service cost – employee benefits earned during the year $ 21,635 $ 18,925 $ 16,589 $ 9,412 $ 2,814 $ 7,342 $ 6,123
Interest cost on benefit obligation 29,237 26,461 24,238 10,973 7,651 8,826 7,738
Expected return on plan assets (32,675) (28,862) (26,655) (8,556) (2,071) (2,363) (2,366)
Recognition of net actuarial loss (gain) – – – 394 2,005 – (2)
Amortization of prior service cost (benefit) 1,929 1,881 1,881 204 (4,431) (551) (551)
Amortization of net transition (asset) obligation (1,403) (1,403) (1,403) 272 – – –
Curtailment (gain) loss – – – 1,522 (5,791) – –
Total expense $ 18,723 $17,002 $ 14,650 $14,221 $ 177 $13,254 $10,942
Total international pension expense, excluding Henkel-Ecolab, was$1,641,000 and $909,000 in 2001 and 2000, respectively.
The company also has U.S. noncontributory non-qualified defined bene-fit plans which provide for benefits to employees in excess of limits permit-ted under its U.S. pension plan. The recorded obligation for these plans wasapproximately $16 million at December 31, 2002. The annual expense forthese plans was approximately $3 million in 2002, $3 million in 2001 and$4 million in 2000.
As of November 30, 2001, the accrued benefit obligation, fair value of plan assets and funded status of the Henkel-Ecolab pension plans were as follows:
(thousands) 2001
Benefit obligation, end of year $142,654
Fair value of plan assets, end of year 72,550
Funded status (70,104)
Unrecognized net loss 3,628
Unrecognized prior service cost (154)
Unrecognized net transition obligation 1,181
Net amount recognized $ (65,449)
Discount rate for year-end benefit obligation 4.00% - 6.25%
Projected salary increases 4.00% - 8.00%
Expected return on assets 1.75% - 5.00%
Effective January 2003, the U.S. Pension Plan was amended to providea cash balance type pension benefit to employees hired on or after theJanuary 2003 effective date.
For postretirement health care benefit measurement purposes, 10.0percent (for pre-age 65 retirees) and 12.0 percent (for post-age 65 retirees)annual rates of increase in the per capita cost of covered health care wereassumed for 2002. The rates were assumed to decrease by 1 percent eachyear until they reach 5 percent in 2008 for pre-age 65 retirees and 5 per-cent in 2010 for post-age 65 retirees and remain at those levels thereafter.Health care costs which are eligible for subsidy by the company are limitedto a 4 percent annual increase beginning in 1996 for certain employees.
Assumed health care cost trend rates have a significant effect on theamounts reported for the company’s U.S. postretirement health care bene-fits plan. A one-percentage point change in the assumed health care costtrend rates would have the following effects:
1 Percentage Point
(thousands) Increase Decrease
Effect on total of postretirement service and interest cost components $ 548 $ (517)
Effect on postretirement benefit obligation 9,003 (8,509)
Effective March 2002, the company changed its postretirement healthcare benefits plan to discontinue the employer subsidy for postretirementhealth care benefits for most active employees. These subsidized benefitswill continue to be provided to certain defined active employees and allexisting retirees. As a result of these actions, the company recorded a curtailment gain of approximately $6 million in the first quarter of 2002.
Savings PlanThe company provides a 401(k) savings plan for substantially all U.S.employees. Prior to March 2002, employee contributions of up to 6 percentof eligible compensation were matched 50 percent by the company. InMarch 2002, the company changed its 401(k) savings plan and added anemployee stock ownership plan (ESOP). Employee before-tax contributionsof up to 3 percent of eligible compensation are matched 100 percent bythe company and employee before-tax contributions between 3 percentand 5 percent of eligible compensation are matched 50 percent by thecompany. The match is 100 percent vested immediately. The company’scontributions are invested in Ecolab common stock and amounted to$12,905,000 in 2002, $9,491,000 in 2001 and $9,036,000 in 2000.
Effective January 2003, the Ecolab Savings Plan was amended to pro-vide that all employee contributions which are invested in the Ecolab StockFund will be part of the employee’s ESOP account while so invested.
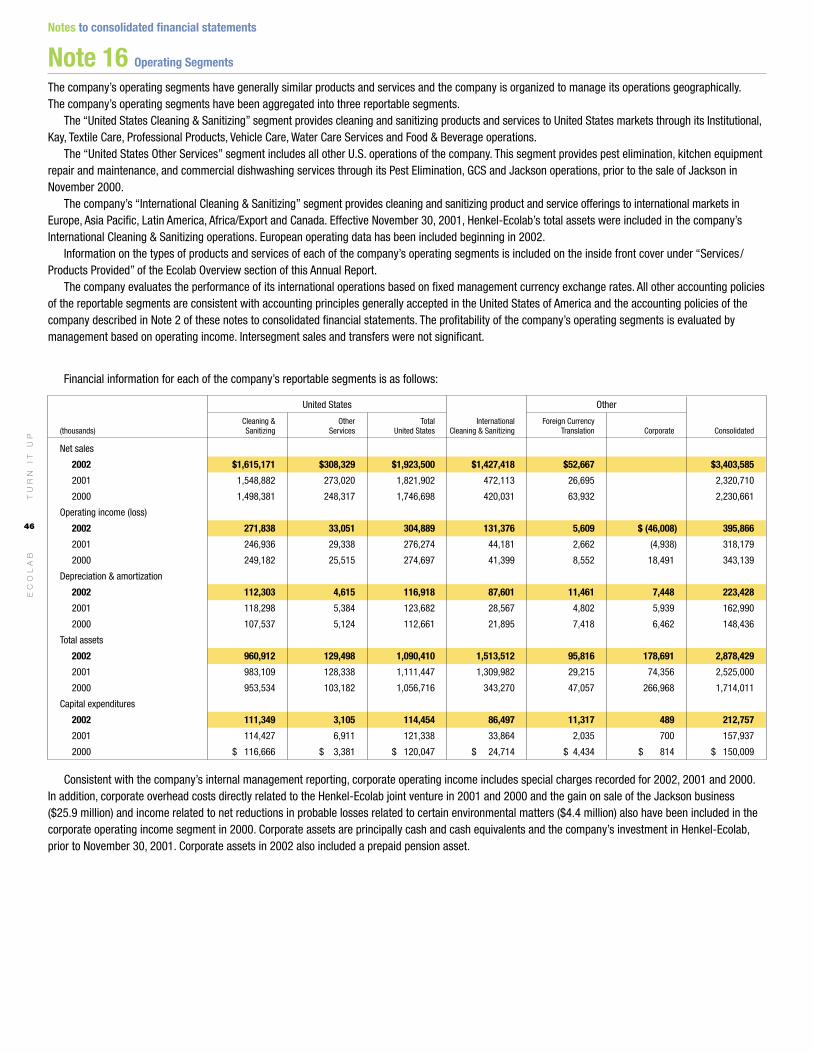
TU
RN
IT
UP
46
EC
OL
AB
Note 16 Operating Segments
The company’s operating segments have generally similar products and services and the company is organized to manage its operations geographically.The company’s operating segments have been aggregated into three reportable segments.
The “United States Cleaning & Sanitizing” segment provides cleaning and sanitizing products and services to United States markets through its Institutional,Kay, Textile Care, Professional Products, Vehicle Care, Water Care Services and Food & Beverage operations.
The “United States Other Services” segment includes all other U.S. operations of the company. This segment provides pest elimination, kitchen equipmentrepair and maintenance, and commercial dishwashing services through its Pest Elimination, GCS and Jackson operations, prior to the sale of Jackson inNovember 2000.
The company’s “International Cleaning & Sanitizing” segment provides cleaning and sanitizing product and service offerings to international markets inEurope, Asia Pacific, Latin America, Africa/Export and Canada. Effective November 30, 2001, Henkel-Ecolab’s total assets were included in the company’sInternational Cleaning & Sanitizing operations. European operating data has been included beginning in 2002.
Information on the types of products and services of each of the company’s operating segments is included on the inside front cover under “Services/Products Provided” of the Ecolab Overview section of this Annual Report.
The company evaluates the performance of its international operations based on fixed management currency exchange rates. All other accounting policiesof the reportable segments are consistent with accounting principles generally accepted in the United States of America and the accounting policies of thecompany described in Note 2 of these notes to consolidated financial statements. The profitability of the company’s operating segments is evaluated by management based on operating income. Intersegment sales and transfers were not significant.
Notes to consolidated financial statements
Financial information for each of the company’s reportable segments is as follows:
United States Other
Cleaning & Other Total International Foreign Currency(thousands) Sanitizing Services United States Cleaning & Sanitizing Translation Corporate Consolidated
Net sales
2002 $1,615,171 $308,329 $1,923,500 $1,427,418 $52,667 $3,403,585
2001 1,548,882 273,020 1,821,902 472,113 26,695 2,320,710
2000 1,498,381 248,317 1,746,698 420,031 63,932 2,230,661
Operating income (loss)
2002 271,838 33,051 304,889 131,376 5,609 $ (46,008) 395,866
2001 246,936 29,338 276,274 44,181 2,662 (4,938) 318,179
2000 249,182 25,515 274,697 41,399 8,552 18,491 343,139
Depreciation & amortization
2002 112,303 4,615 116,918 87,601 11,461 7,448 223,428
2001 118,298 5,384 123,682 28,567 4,802 5,939 162,990
2000 107,537 5,124 112,661 21,895 7,418 6,462 148,436
Total assets
2002 960,912 129,498 1,090,410 1,513,512 95,816 178,691 2,878,429
2001 983,109 128,338 1,111,447 1,309,982 29,215 74,356 2,525,000
2000 953,534 103,182 1,056,716 343,270 47,057 266,968 1,714,011
Capital expenditures
2002 111,349 3,105 114,454 86,497 11,317 489 212,757
2001 114,427 6,911 121,338 33,864 2,035 700 157,937
2000 $ 116,666 $ 3,381 $ 120,047 $ 24,714 $ 4,434 $ 814 $ 150,009
Consistent with the company’s internal management reporting, corporate operating income includes special charges recorded for 2002, 2001 and 2000.In addition, corporate overhead costs directly related to the Henkel-Ecolab joint venture in 2001 and 2000 and the gain on sale of the Jackson business($25.9 million) and income related to net reductions in probable losses related to certain environmental matters ($4.4 million) also have been included in thecorporate operating income segment in 2000. Corporate assets are principally cash and cash equivalents and the company’s investment in Henkel-Ecolab,prior to November 30, 2001. Corporate assets in 2002 also included a prepaid pension asset.
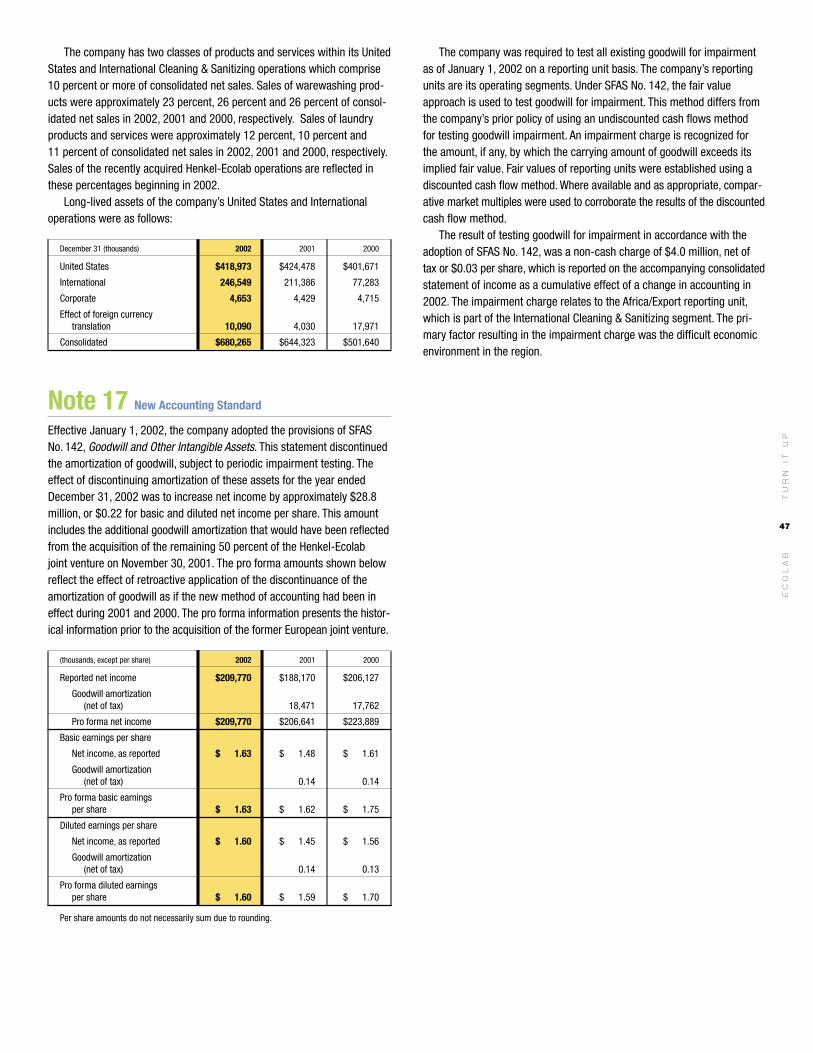
EC
OL
AB
47
The company has two classes of products and services within its UnitedStates and International Cleaning & Sanitizing operations which comprise10 percent or more of consolidated net sales. Sales of warewashing prod-ucts were approximately 23 percent, 26 percent and 26 percent of consol-idated net sales in 2002, 2001 and 2000, respectively. Sales of laundryproducts and services were approximately 12 percent, 10 percent and 11 percent of consolidated net sales in 2002, 2001 and 2000, respectively.Sales of the recently acquired Henkel-Ecolab operations are reflected inthese percentages beginning in 2002.
Long-lived assets of the company’s United States and Internationaloperations were as follows:
December 31 (thousands) 2002 2001 2000
United States $418,973 $424,478 $401,671
International 246,549 211,386 77,283
Corporate 4,653 4,429 4,715
Effect of foreign currency translation 10,090 4,030 17,971
Consolidated $680,265 $644,323 $501,640
Note 17 New Accounting Standard
Effective January 1, 2002, the company adopted the provisions of SFAS No. 142, Goodwill and Other Intangible Assets. This statement discontinuedthe amortization of goodwill, subject to periodic impairment testing. Theeffect of discontinuing amortization of these assets for the year endedDecember 31, 2002 was to increase net income by approximately $28.8million, or $0.22 for basic and diluted net income per share. This amountincludes the additional goodwill amortization that would have been reflectedfrom the acquisition of the remaining 50 percent of the Henkel-Ecolab joint venture on November 30, 2001. The pro forma amounts shown belowreflect the effect of retroactive application of the discontinuance of theamortization of goodwill as if the new method of accounting had been ineffect during 2001 and 2000. The pro forma information presents the histor-ical information prior to the acquisition of the former European joint venture.
(thousands, except per share) 2002 2001 2000
Reported net income $209,770 $188,170 $206,127
Goodwill amortization (net of tax) 18,471 17,762
Pro forma net income $209,770 $206,641 $223,889
Basic earnings per share
Net income, as reported $ 1.63 $ 1.48 $ 1.61
Goodwill amortization (net of tax) 0.14 0.14
Pro forma basic earnings per share $ 1.63 $ 1.62 $ 1.75
Diluted earnings per share
Net income, as reported $ 1.60 $ 1.45 $ 1.56
Goodwill amortization (net of tax) 0.14 0.13
Pro forma diluted earningsper share $ 1.60 $ 1.59 $ 1.70
Per share amounts do not necessarily sum due to rounding.
The company was required to test all existing goodwill for impairmentas of January 1, 2002 on a reporting unit basis. The company’s reportingunits are its operating segments. Under SFAS No. 142, the fair valueapproach is used to test goodwill for impairment. This method differs fromthe company’s prior policy of using an undiscounted cash flows method for testing goodwill impairment. An impairment charge is recognized for the amount, if any, by which the carrying amount of goodwill exceeds itsimplied fair value. Fair values of reporting units were established using adiscounted cash flow method. Where available and as appropriate, compar-ative market multiples were used to corroborate the results of the discountedcash flow method.
The result of testing goodwill for impairment in accordance with theadoption of SFAS No. 142, was a non-cash charge of $4.0 million, net oftax or $0.03 per share, which is reported on the accompanying consolidatedstatement of income as a cumulative effect of a change in accounting in2002. The impairment charge relates to the Africa/Export reporting unit,which is part of the International Cleaning & Sanitizing segment. The pri-mary factor resulting in the impairment charge was the difficult economicenvironment in the region.
TU
RN
IT
UP
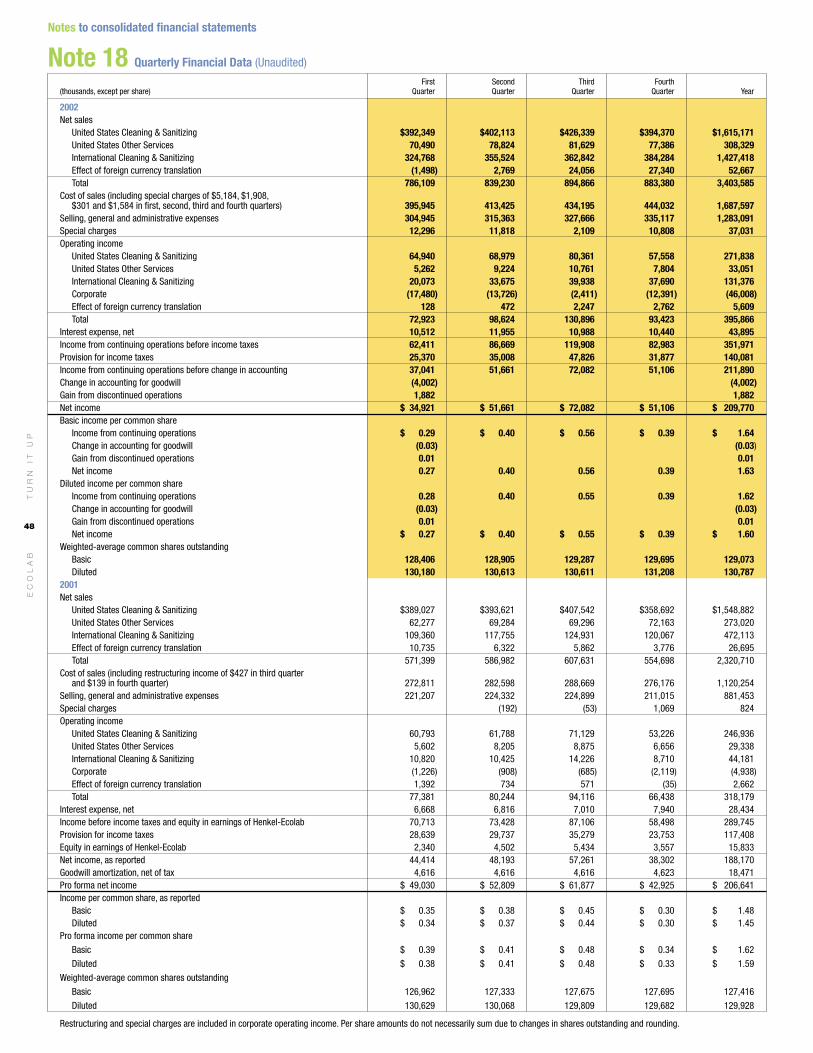
TU
RN
IT
UP
48
EC
OL
AB
Notes to consolidated financial statements
Note 18 Quarterly Financial Data (Unaudited)
First Second Third Fourth(thousands, except per share) Quarter Quarter Quarter Quarter Year
2002Net sales
United States Cleaning & Sanitizing $392,349 $402,113 $426,339 $394,370 $1,615,171United States Other Services 70,490 78,824 81,629 77,386 308,329International Cleaning & Sanitizing 324,768 355,524 362,842 384,284 1,427,418Effect of foreign currency translation (1,498) 2,769 24,056 27,340 52,667Total 786,109 839,230 894,866 883,380 3,403,585
Cost of sales (including special charges of $5,184, $1,908,$301 and $1,584 in first, second, third and fourth quarters) 395,945 413,425 434,195 444,032 1,687,597
Selling, general and administrative expenses 304,945 315,363 327,666 335,117 1,283,091Special charges 12,296 11,818 2,109 10,808 37,031Operating income
United States Cleaning & Sanitizing 64,940 68,979 80,361 57,558 271,838United States Other Services 5,262 9,224 10,761 7,804 33,051International Cleaning & Sanitizing 20,073 33,675 39,938 37,690 131,376Corporate (17,480) (13,726) (2,411) (12,391) (46,008)Effect of foreign currency translation 128 472 2,247 2,762 5,609Total 72,923 98,624 130,896 93,423 395,866
Interest expense, net 10,512 11,955 10,988 10,440 43,895Income from continuing operations before income taxes 62,411 86,669 119,908 82,983 351,971Provision for income taxes 25,370 35,008 47,826 31,877 140,081Income from continuing operations before change in accounting 37,041 51,661 72,082 51,106 211,890Change in accounting for goodwill (4,002) (4,002)Gain from discontinued operations 1,882 1,882 Net income $ 34,921 $ 51,661 $ 72,082 $ 51,106 $ 209,770Basic income per common share
Income from continuing operations $ 0.29 $ 0.40 $ 0.56 $ 0.39 $ 1.64Change in accounting for goodwill (0.03) (0.03)Gain from discontinued operations 0.01 0.01Net income 0.27 0.40 0.56 0.39 1.63
Diluted income per common shareIncome from continuing operations 0.28 0.40 0.55 0.39 1.62Change in accounting for goodwill (0.03) (0.03)Gain from discontinued operations 0.01 0.01Net income $ 0.27 $ 0.40 $ 0.55 $ 0.39 $ 1.60
Weighted-average common shares outstandingBasic 128,406 128,905 129,287 129,695 129,073Diluted 130,180 130,613 130,611 131,208 130,787
2001Net sales
United States Cleaning & Sanitizing $389,027 $393,621 $407,542 $358,692 $1,548,882United States Other Services 62,277 69,284 69,296 72,163 273,020International Cleaning & Sanitizing 109,360 117,755 124,931 120,067 472,113Effect of foreign currency translation 10,735 6,322 5,862 3,776 26,695 Total 571,399 586,982 607,631 554,698 2,320,710
Cost of sales (including restructuring income of $427 in third quarter and $139 in fourth quarter) 272,811 282,598 288,669 276,176 1,120,254
Selling, general and administrative expenses 221,207 224,332 224,899 211,015 881,453Special charges (192) (53) 1,069 824Operating income
United States Cleaning & Sanitizing 60,793 61,788 71,129 53,226 246,936United States Other Services 5,602 8,205 8,875 6,656 29,338International Cleaning & Sanitizing 10,820 10,425 14,226 8,710 44,181Corporate (1,226) (908) (685) (2,119) (4,938)Effect of foreign currency translation 1,392 734 571 (35) 2,662Total 77,381 80,244 94,116 66,438 318,179
Interest expense, net 6,668 6,816 7,010 7,940 28,434 Income before income taxes and equity in earnings of Henkel-Ecolab 70,713 73,428 87,106 58,498 289,745Provision for income taxes 28,639 29,737 35,279 23,753 117,408 Equity in earnings of Henkel-Ecolab 2,340 4,502 5,434 3,557 15,833 Net income, as reported 44,414 48,193 57,261 38,302 188,170Goodwill amortization, net of tax 4,616 4,616 4,616 4,623 18,471Pro forma net income $ 49,030 $ 52,809 $ 61,877 $ 42,925 $ 206,641Income per common share, as reported
Basic $ 0.35 $ 0.38 $ 0.45 $ 0.30 $ 1.48Diluted $ 0.34 $ 0.37 $ 0.44 $ 0.30 $ 1.45
Pro forma income per common share
Basic $ 0.39 $ 0.41 $ 0.48 $ 0.34 $ 1.62
Diluted $ 0.38 $ 0.41 $ 0.48 $ 0.33 $ 1.59
Weighted-average common shares outstanding
Basic 126,962 127,333 127,675 127,695 127,416
Diluted 130,629 130,068 129,809 129,682 129,928
Restructuring and special charges are included in corporate operating income. Per share amounts do not necessarily sum due to changes in shares outstanding and rounding.

EC
OL
AB
49
Report of Management
Management is responsible for the integrity and objectivity of the consoli-dated financial statements. The statements have been prepared in accor-dance with accounting principles generally accepted in the United States ofAmerica and, accordingly, include certain amounts based on management’sbest estimates and judgments.
To meet its responsibility, management has established and maintains a system of internal controls that provides reasonable assurance regardingthe integrity and reliability of the financial statements and the protection ofassets from unauthorized use or disposition. These systems are supportedby qualified personnel, by an appropriate division of responsibilities and byan internal audit function. There are limits inherent in any system of internalcontrols since the cost of monitoring such systems should not exceed thedesired benefit. Management believes that the company’s system of internalcontrols is effective and provides an appropriate cost/benefit balance.
The Board of Directors, acting through its Audit Committee composedsolely of outside directors, is responsible for determining that managementfulfills its responsibilities in the preparation of financial statements andmaintains financial control of operations. The Audit Committee recommendsto the Board of Directors the appointment of the company’s independentaccountants, subject to ratification by the shareholders. It meets regularlywith management, the internal auditors and the independent accountants.
The independent accountants provide an objective, independent reviewas to management’s discharge of its responsibilities insofar as they relateto the fair presentation of the consolidated financial statements. Theirreport is presented separately.
Allan L. SchumanChairman of the Board and Chief Executive Officer
Steven L. FritzeSenior Vice President andChief Financial Officer
Report of Independent Accountants
To the Shareholders and DirectorsEcolab Inc.
In our opinion, the accompanying consolidated balance sheet and therelated consolidated statements of income, of comprehensive income andshareholders’ equity and of cash flows present fairly, in all material respects,the consolidated financial position of Ecolab Inc. as of December 31, 2002,2001 and 2000, and the consolidated results of its operations and its cashflows for each of the three years in the period ended December 31, 2002,in conformity with accounting principles generally accepted in the UnitedStates of America. These financial statements are the responsibility ofEcolab Inc.’s management; our responsibility is to express an opinion onthese financial statements based on our audits. We conducted our audits of these statements in accordance with auditing standards generallyaccepted in the United States of America which require that we plan andperform the audit to obtain reasonable assurance about whether the financialstatements are free of material misstatement. An audit includes examining,on a test basis, evidence supporting the amounts and disclosures in thefinancial statements, assessing the accounting principles used and signifi-cant estimates made by management, and evaluating the overall financialstatement presentation. We believe that our audits provide a reasonablebasis for our opinion.
As discussed in Note 17 to the consolidated financial statements, in 2002Ecolab Inc. adopted the provisions of Statement of Financial AccountingStandards No. 142, “Goodwill and Other Intangible Assets.”
Minneapolis, MinnesotaFebruary 18, 2003
TU
RN
IT
UP
Management’s and Accountants’ reports

50
EC
OL
AB
TU
RN
IT
UP
December 31 (thousands, except per share) 2002 2001 2000
OperationsNet sales
United States $ 1,923,500 $ 1,821,902 $ 1,746,698
International (at average rates of currency exchange during the year) 1,480,085 498,808 483,963
Total 3,403,585 2,320,710 2,230,661
Cost of sales (including special charges of $8,977 in 2002, income of $566 in 2001 and expenses of $1,948 in 2000) 1,687,597 1,120,254 1,056,263
Selling, general and administrative expenses 1,283,091 881,453 851,995
Special charges, sale of business and merger expenses 37,031 824 (20,736)
Operating income 395,866 318,179 343,139
Interest expense, net 43,895 28,434 24,605
Income from continuing operations before income taxes, equity earnings and changes in accounting principle 351,971 289,745 318,534
Provision for income taxes 140,081 117,408 129,495
Equity in earnings of Henkel-Ecolab 15,833 19,516
Income from continuing operations 211,890 188,170 208,555
Gain from discontinued operations 1,882Changes in accounting principles (4,002) (2,428)
Net income, as reported 209,770 188,170 206,127
Pro forma adjustments 18,471 17,762
Pro forma net income $ 209,770 $ 206,641 $ 223,889
Income per common share, as reported
Basic – continuing operations $ 1.64 $ 1.48 $ 1.63
Basic – net income 1.63 1.48 1.61
Diluted – continuing operations 1.62 1.45 1.58
Diluted – net income 1.60 1.45 1.56
Pro forma income per common share
Basic – continuing operations 1.64 1.62 1.77
Basic – net income 1.63 1.62 1.75
Diluted – continuing operations 1.62 1.59 1.72
Diluted – net income $ 1.60 $ 1.59 $ 1.70
Weighted-average common shares outstanding – basic 129,073 127,416 127,753
Weighted-average common shares outstanding – diluted 130,787 129,928 131,946
Selected Income Statement RatiosGross profit 50.4% 51.7% 52.6%
Selling, general and administrative expenses 37.7 38.0 38.2
Operating income 11.6 13.7 15.4
Income from continuing operations before income taxes 10.3 12.5 14.3
Income from continuing operations 6.2 8.1 9.3
Effective income tax rate 39.8% 40.5% 40.7%
Financial PositionCurrent assets $ 1,015,937 $ 929,583 $ 600,568
Property, plant and equipment, net 680,265 644,323 501,640
Investment in Henkel-Ecolab 199,642
Goodwill, intangible and other assets 1,182,227 951,094 412,161
Total assets $ 2,878,429 $ 2,525,000 $ 1,714,011
Current liabilities $ 866,350 $ 827,952 $ 532,034
Long-term debt 539,743 512,280 234,377
Postretirement health care and pension benefits 207,596 183,281 117,790
Other liabilities 164,989 121,135 72,803
Shareholders’ equity 1,099,751 880,352 757,007
Total liabilities and shareholders’ equity $ 2,878,429 $ 2,525,000 $ 1,714,011
Selected Cash Flow InformationCash provided by operating activities $ 423,326 $ 364,481 $ 315,486
Depreciation and amortization 223,428 162,990 148,436
Capital expenditures 212,757 157,937 150,009
Adjusted EBITDA from continuing operations 619,294 481,169 491,575
Cash dividends declared per common share $ 0.55 $ 0.525 $ 0.49
Selected Financial Measures/OtherTotal debt $ 699,842 $ 745,673 $ 370,969
Total debt to capitalization 38.9% 45.9% 32.9%
Book value per common share $ 8.46 $ 6.88 $ 5.95
Return on beginning equity 23.8% 24.9% 27.1%
Dividends per share/diluted net income per common share 34.4% 36.2% 31.4%
Annual common stock price range $50.40-36.53 $44.19-28.50 $45.69-28.00
Number of employees 20,417 19,326 14,250
Summary operating and financial data
The former Henkel-Ecolab is included as a consolidated subsidiary effective November 30, 2001. Pro forma results for 1992 through 2001 reflect the effect of retroactive application of the discontinuance of the amortization of goodwill as if SFAS No. 142 had been in effect since January 1, 1992. For 1992 through 1994 the pro forma adjustments also reflect adjustments to eliminate unusual items associated
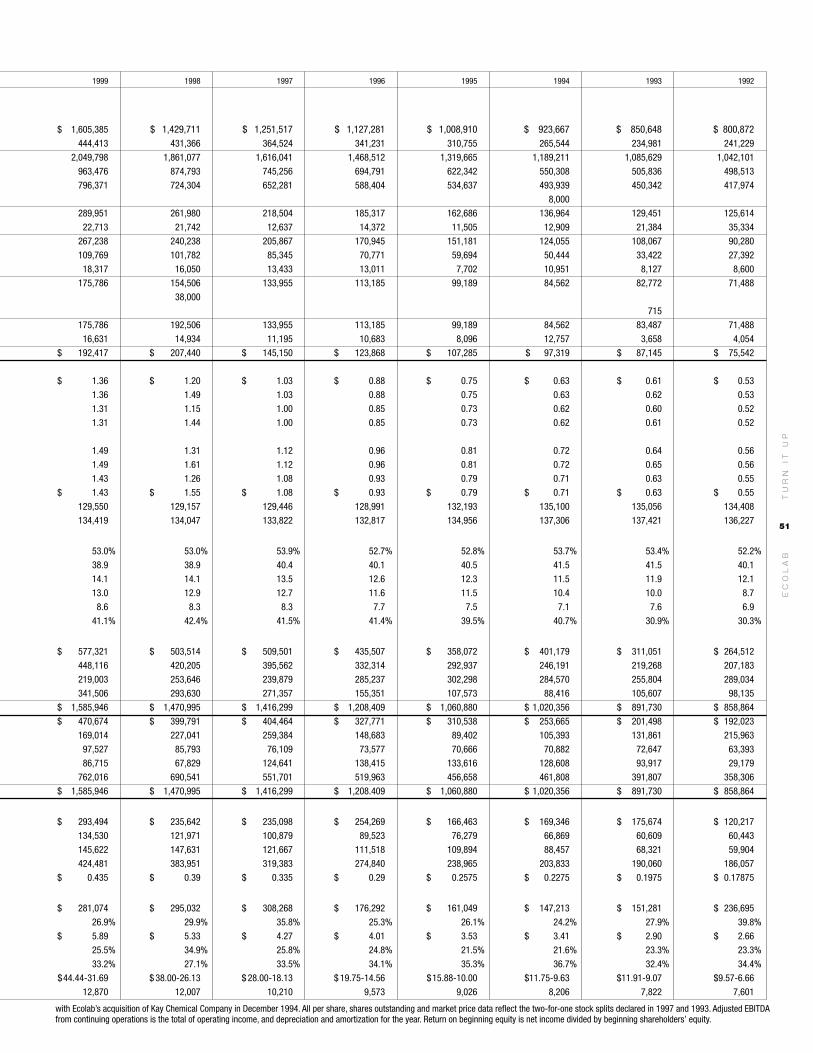
EC
OL
AB
51
TU
RN
IT
UP
1999 1998 1997 1996 1995 1994 1993 1992
$ 1,605,385 $ 1,429,711 $ 1,251,517 $ 1,127,281 $ 1,008,910 $ 923,667 $ 850,648 $ 800,872444,413 431,366 364,524 341,231 310,755 265,544 234,981 241,229
2,049,798 1,861,077 1,616,041 1,468,512 1,319,665 1,189,211 1,085,629 1,042,101
963,476 874,793 745,256 694,791 622,342 550,308 505,836 498,513
796,371 724,304 652,281 588,404 534,637 493,939 450,342 417,974
8,000
289,951 261,980 218,504 185,317 162,686 136,964 129,451 125,614
22,713 21,742 12,637 14,372 11,505 12,909 21,384 35,334
267,238 240,238 205,867 170,945 151,181 124,055 108,067 90,280
109,769 101,782 85,345 70,771 59,694 50,444 33,422 27,392
18,317 16,050 13,433 13,011 7,702 10,951 8,127 8,600
175,786 154,506 133,955 113,185 99,189 84,562 82,772 71,488
38,000
715
175,786 192,506 133,955 113,185 99,189 84,562 83,487 71,488
16,631 14,934 11,195 10,683 8,096 12,757 3,658 4,054
$ 192,417 $ 207,440 $ 145,150 $ 123,868 $ 107,285 $ 97,319 $ 87,145 $ 75,542
$ 1.36 $ 1.20 $ 1.03 $ 0.88 $ 0.75 $ 0.63 $ 0.61 $ 0.53
1.36 1.49 1.03 0.88 0.75 0.63 0.62 0.53
1.31 1.15 1.00 0.85 0.73 0.62 0.60 0.52
1.31 1.44 1.00 0.85 0.73 0.62 0.61 0.52
1.49 1.31 1.12 0.96 0.81 0.72 0.64 0.56
1.49 1.61 1.12 0.96 0.81 0.72 0.65 0.56
1.43 1.26 1.08 0.93 0.79 0.71 0.63 0.55
$ 1.43 $ 1.55 $ 1.08 $ 0.93 $ 0.79 $ 0.71 $ 0.63 $ 0.55
129,550 129,157 129,446 128,991 132,193 135,100 135,056 134,408
134,419 134,047 133,822 132,817 134,956 137,306 137,421 136,227
53.0% 53.0% 53.9% 52.7% 52.8% 53.7% 53.4% 52.2%
38.9 38.9 40.4 40.1 40.5 41.5 41.5 40.1
14.1 14.1 13.5 12.6 12.3 11.5 11.9 12.1
13.0 12.9 12.7 11.6 11.5 10.4 10.0 8.7
8.6 8.3 8.3 7.7 7.5 7.1 7.6 6.9
41.1% 42.4% 41.5% 41.4% 39.5% 40.7% 30.9% 30.3%
$ 577,321 $ 503,514 $ 509,501 $ 435,507 $ 358,072 $ 401,179 $ 311,051 $ 264,512
448,116 420,205 395,562 332,314 292,937 246,191 219,268 207,183
219,003 253,646 239,879 285,237 302,298 284,570 255,804 289,034
341,506 293,630 271,357 155,351 107,573 88,416 105,607 98,135
$ 1,585,946 $ 1,470,995 $ 1,416,299 $ 1,208,409 $ 1,060,880 $ 1,020,356 $ 891,730 $ 858,864
$ 470,674 $ 399,791 $ 404,464 $ 327,771 $ 310,538 $ 253,665 $ 201,498 $ 192,023
169,014 227,041 259,384 148,683 89,402 105,393 131,861 215,963
97,527 85,793 76,109 73,577 70,666 70,882 72,647 63,393
86,715 67,829 124,641 138,415 133,616 128,608 93,917 29,179
762,016 690,541 551,701 519,963 456,658 461,808 391,807 358,306
$ 1,585,946 $ 1,470,995 $ 1,416,299 $ 1,208.409 $ 1,060,880 $ 1,020,356 $ 891,730 $ 858,864
$ 293,494 $ 235,642 $ 235,098 $ 254,269 $ 166,463 $ 169,346 $ 175,674 $ 120,217
134,530 121,971 100,879 89,523 76,279 66,869 60,609 60,443
145,622 147,631 121,667 111,518 109,894 88,457 68,321 59,904
424,481 383,951 319,383 274,840 238,965 203,833 190,060 186,057
$ 0.435 $ 0.39 $ 0.335 $ 0.29 $ 0.2575 $ 0.2275 $ 0.1975 $ 0.17875
$ 281,074 $ 295,032 $ 308,268 $ 176,292 $ 161,049 $ 147,213 $ 151,281 $ 236,695
26.9% 29.9% 35.8% 25.3% 26.1% 24.2% 27.9% 39.8%
$ 5.89 $ 5.33 $ 4.27 $ 4.01 $ 3.53 $ 3.41 $ 2.90 $ 2.66
25.5% 34.9% 25.8% 24.8% 21.5% 21.6% 23.3% 23.3%
33.2% 27.1% 33.5% 34.1% 35.3% 36.7% 32.4% 34.4%
$44.44-31.69 $ 38.00-26.13 $ 28.00-18.13 $ 19.75-14.56 $15.88-10.00 $11.75-9.63 $11.91-9.07 $9.57-6.66
12,870 12,007 10,210 9,573 9,026 8,206 7,822 7,601
with Ecolab’s acquisition of Kay Chemical Company in December 1994. All per share, shares outstanding and market price data reflect the two-for-one stock splits declared in 1997 and 1993. Adjusted EBITDAfrom continuing operations is the total of operating income, and depreciation and amortization for the year. Return on beginning equity is net income divided by beginning shareholders’ equity.