eco-efficiency in recycling systems evaluation … · eco-efficiency in recycling systems and ii)...
TRANSCRIPT

Arne EikSolveig SteinmoHåvard SolemHelge BrattebøBernt Saugen
ECO-EFFICIENCY IN RECYCLING SYSTEMS
Evaluation Methods & Case Studies for Plastic Packaging
NTNU Program for industriell økologi
Rapport nr: 1/2002

Reports and Communications from
Norwegian University of Science and Technology (NTNU) Industrial Ecology Programme (IndEcol)
Report no.1/2002 ISSN 1501-6153 ISBN 82-7948-027-7
Editor: Professor Helge Brattebø, Programme Leader (IndEcol)
Design and layout: Elin Mathiassen, Coordinator (IndEcol)
Reports and Communications may be ordered from:
Industrial Ecology Programme (IndEcol) NTNU NO-7491 Trondheim, Norway
Tel.: + 47 73598940 Fax.: + 47 73598943 E-mail: [email protected] Web: www.indecol.ntnu.no
Price: NOK 100,-
Eco-efficiency in Recycling Systems
Evaluation Methods &
Case Studies for Plastic Packaging
Arne Eik Solveig Steinmo Håvard Solem Helge Brattebø Bernt Saugen
Industrial Ecology Programme Report no: 1/2002


i
FOREWORD
This report is a result of the work in Case 04 “Eco-efficiency in recycling systems” funded through the research program P2005 Industrial ecology (Brattebø and Hanssen 2000).
Case 04 is part of the core project “Eco-efficient recycling system and producer responsibility”, which is particularly focused how to establish and maintain efficient end-of-life systems for products and materials.
The aim of the project has been to i) develop methods for evaluation of eco-efficiency in recycling systems and ii) apply these methods to evaluate the eco-efficiency of current recycling systems for used plastic packaging from households, identify the improvement potential in these systems, and suggest alternative eco-efficient solutions.
This has been a joint-venture project between Tomra Systems ASA, where Solveig Steinmo and Bernt Saugen have been involved, and NTNU's Industrial Ecology Programme, with participation from Helge Brattebø, Håvard Solem and Arne Eik.
This work has in part been based on interviews and conversations with the actors within or connected to the recycling systems. We would therefore like to express our appreciation to: Ellen Hambro at the Ministry of Environment, Kristin Dagenborg and Rune Opheim at the Norwegian Pollution Control Authority, Peter Sundt, Frode Syvertsen and Geir Schefte at Plastretur, Knut J.Bakkejord and Geir Hanssen at Avfallsseksjonen in the municipality of Trondheim, Lars Volden and Astrid Solheim at Trondheim Renholdsverk, Berit Øren Follo at Romsdalshalvøens Interkommunale Renholdsverk, Lars Rune Skeide at Søre Sunnmøre Reinhaldsverk, Torgrim Aaalmo at Norsk Gjenvinning Trøndelag, Steffen Rogstad at Heimdal Resirk, Jens Arne Kvello at Plastgjenvinning i Tydal, Torbjørn Rogstad at Folldal Gjenvinning, Leif Andersson at Plaståtervinning, Lasse Andersson at Plaståtervinning in Töckfors, Bente Storeng at Trondheim Energiverk, Jarle Grytli at Norsk Resirk, Terje Hanserud at Tomra Systems ASA, Kaj Strand at Strandplast, Ole Petter Trovaag at Orkla Foods
Finally we would also like to thank our colleagues: Kjetil Røine at NTNU's Industrial Ecology Programme, Ole Jørgen Hanssen and Hanne Lerche Raadal at Stiftelsen Østfoldforskning, Jan Tore Solstad at Sør Trøndelag University College and Jon Olaf Olaussen at the Department of Economics at NTNU, for participating in discussions and sharing valuable insights with us.


iii
SUMMARY
Focus on the so-called waste hierarchy, which claims that the prevention of waste is the most environmental friendly option, followed by reuse, re-manufacturing, mechanical recycling, feedstock recycling, energy recovery, incineration and landfill, is considered to be an important strategy towards sustainable development. Increased use of plastic packaging for various products and the corresponding increase in waste generated are important challenges that must be dealt with from a waste-hierarchy point of view.
Many studies, using various methods, have tried to ascertain the extent to which plastic packaging should be recycled into new products, or whether it rather should be incinerated or sent to landfill. However, scientific consensus on this issue has yet to be reached, neither on the use of plastic packaging nor on what method is the most appropriate for answering questions on recycling issues.
The objectives of this study have been to: 1) Develop methods for evaluation of eco-efficiency in recycling
systems. 2) Apply these methods to evaluate the eco-efficiency of today’s
recycling systems for used plastic packaging from households, identify the improvement potential in these systems, and suggest alternative eco-efficient solutions.
To reach these objectives we have examined the following recycling case
studies:
• Source separation system for mixed plastic packaging generated in households in the city of Trondheim, Norway
• Deposit system for one-way PET bottles from inhabitants in Trondheim We have developed a static and a more dynamic method for evaluation of
eco-efficiency in recycling systems, and thereafter applied these methods to the case studies.
The static eco-efficiency method has been developed through an extension of the work done by the World Business Council on Sustainable Development (WBCSD) on eco-efficiency, using the life-cycle method and literature on indicator development. The method is carried out in six steps where the first four focus on evaluating the eco-efficiency of a defined recycling system, while the focus of the last two steps is on identifying the improvement potentials within the recycling systems. Development and implementation of indicators for the various companies in the recycling chain are important parts of this model.

Summary
iv
In the dynamic method, two of the developed indicators (% recycling and cost) in the static method are applied in an evaluation of the eco-efficiency of existing and future plastic -packaging recycling systems with a special focus on the production processes and the accompanying cost structure. As the amount of available data is too limited to carry out a valid regression analysis, we have combined the data at hand with theoretical knowledge in order to estimate the relationship between economic costs and various recycling rates.
The eco-efficiency analysis of today’s recycling system of household plastic packaging from Trondheim shows that a great deal of work remains to be done if we are to reduce the costs to a level that will justify the systems, even though we have shown that increased recycling rates give improved environmental performance. If the identified improvement potential is not realized, then incineration with energy recovery, rather than material recovery, may very well be a preferable option for the analyzed system. However, our analysis of possible future recycling systems has shown that recycling of relative large amounts of the plastic packaging generated in households is preferable from an eco-efficiency point of view. To improve the efficiency of recycling systems we have found that efforts should be applied as early as possible in the life cycle of plastic -packaging material. Improved labeling and standardization of packaging, incentives and technology for improved source separation, and production of high-quality recycled products are decisive elements for the eco-efficiency outcome of the future recycling systems.
Further work should be undertaken to refine the applied methods and to test the usefulness of developing and implementing indicators for the activities in the recycling chain aimed at improving the eco-efficiency of the recycling system. Due to the law of mass conservation, it is also important to extend the work on barriers and the improvement potential within the decisive household phase. Since the output in the early stages of the life cycle constrains the end-of-life output, it is important to focus on what kind of incentive and technology is needed to obtain sufficient household sorting rates. To find an answer to this and other issues pointed out in this report, the methodology needs to be developed and is hence a starting point for further studies of eco-efficiency improvements.

v
CONTENTS
Foreword................................................................................................ i
Summary.............................................................................................. iii
Contents ................................................................................................v
1 Introduction.......................................................................................1 1.1 Background..................................................................................1
1.2 Methods for evaluating recycling systems ......................................2 1.3 The recycling challenges of plastic packaging.................................4
1.4 Objectives, research methodology and content................................7
2 A method for eco-efficiency evaluation of recycling systems ...............9 2.1 Introduction .................................................................................9
2.2 Presentation of eco-efficiency........................................................9
2.3 Use of life-cycle assessment to evaluate recycling systems ............ 11
2.4 Use and development of indicators .............................................. 12
2.5 A method for both evaluation and improvements .......................... 14
2.6 The steps in the eco-efficiency analysis method............................ 18
2.7 Summary of eco-efficiency indicators and company specific indicators.............................................................................................. 27
3 Production, costs and efficiency – expanding the static approach.....29 3.1 Introduction ............................................................................... 29 3.2 Costs ......................................................................................... 30
3.3 Production.................................................................................. 31
3.4 Inclusion of the mass balance...................................................... 32
3.5 Optimization .............................................................................. 35
4 Description of the recycling systems for plastic packaging................37 4.1 Introduction ............................................................................... 37
4.2 Source separation system for mixed plastic packaging................... 38
4.3 Deposit system for one-way PET bottles ...................................... 43
Contents
vi
4.4 Future systems............................................................................ 46 4.5 System borders, functional unit and assumptions .......................... 47
5 Evaluation of eco-efficiency for plastic-packaging recycling system.51 5.1 Introduction ............................................................................... 51
5.2 Eco-efficiency evaluation of the recycling system for mixed plastic pac kaging.................................................................................. 52
5.3 Deposit system for one-way PET bottles (2000/ 2001) .................. 57
5.4 Comparison of solutions.............................................................. 59
5.5 Sensitivity analysis ..................................................................... 62
6 Development of company-specific indicators ....................................69 6.1 Introduction ............................................................................... 69
6.2 Identification of company-specific indicators................................ 70
6.3 Development of more company-specific indicators ....................... 77
7 Eco-efficiency evaluations of possible future systems ........................81 7.1 Introduction ............................................................................... 81
7.2 Improving eco-efficiency in recycling systems ............................. 81 7.3 Eco-efficiency evaluation of possible future recycling chains ........ 95
8 Discussion....................................................................................... 103 8.1 A static eco-efficiency approach................................................ 103
8.2 Who can apply the static method? .............................................. 105
8.3 A more dynamic approach......................................................... 106
8.4 What are the differences between the methods?.......................... 106
8.5 Findings ................................................................................... 107
9 Conclusion...................................................................................... 109
10 References .................................................................................... 111
11 Appendix ...................................................................................... 115
Appendix 1 ........................................................................................ 116
Appendix 2 ........................................................................................ 117
Appendix 3 a) .................................................................................... 121

Contents
vii
Appendix 3 b).................................................................................... 122
Appendix 3 c) .................................................................................... 122
Appendix 3 d).................................................................................... 122
Appendix 3 e) .................................................................................... 122
Appendix 3 f)..................................................................................... 122
Appendix 4 a) .................................................................................... 122
Appendix 4 b).................................................................................... 122

1
1 INTRODUCTION
1.1 Background
The aim of this study has been to develop a static method and a semi-dynamic method for evaluation of eco-efficiency (environmental and economical efficiency) in recycling systems. These methods are applied to evaluate current and future systems for recycling of plastic packaging generated in households.
The efficient use of material and energy flows in societies and the avoidance of the depletion of non-renewable resources are important goals within industrial ecology (Ehrenfeld 1994) and are also significant in our attempts to approach sustainable development (World Commission on Environment and Development 1987). However, even though to some extent there has been a de-coupling between economic and resource throughput on a per capita and per unit gross domestic product (GDP) basis, overall resource use and waste flows into the environment are growing in Western countries (Matthews et al. 2000). Focus on the so-called waste hierarchy, which claims that preventing waste is the most environmentally friendly option, followed by reuse, re-manufacturing, mechanical recycling, feedstock recycling, energy recovery, incineration and landfill (Wollrad and Scmied 2000), is believed to be one important step we can take to reverse this negative trend. The increase in use of plastic packaging for various purposes and the corresponding increase in waste generation of these materials is an important challenge to deal with from a waste -hierarchy point of view.
The empirical focus in this report is on improving the eco-efficiency of recycling systems for plastic packaging. It should, however, be mentioned that from a broader perspective, a focus on increasing the value added and also on reducing the environmental impacts from production and distribution of the product that is packed, is perhaps even more important. Some may argue that plastic packaging is not a sustainable material since it is made from non-renewable resources, and that it thus should not be used as packaging material in the first place. In a long-term perspective the best policy may be to avoid producing plastic packaging from fossil resources, as well as to avoid long-distance transport of packed goods. Nevertheless, the steadily increasing use of plastic packaging requires a focus on solving today’s challenges related to the use of packaging. In Norway around 8 mass% of the municipal waste is plastic packaging. Recycling of this fraction into new plastic products to avoid extraction of alternative virgin material and to avoid alternative emissions from incineration and landfill is thus an important challenge.

Introduction
2
To increase the economic and environmental efficiency of collection, sorting and recovery of packaging and other products, extended producer responsibility (EPR) has been implemented as a main strategy in many Western countries (OECD 2001). EPR can minimize environmental impact over the life cycle of a product (as for example plastic packaging) by providing producers with incentives to design products with less material input and which are also easier and more economical to reuse, recycle and recover. For plastic packaging, the EPR ensures that producers, users and importers of the packaging are physically or economically responsible for ensuring that a certain amount of the generated packaging waste is recycled or energy recovered. At the moment new agreements on, for example appropriate recycling rates for packaging, are under negotiations in the EU, as well as in Norway. However, even though studies have shown that high recycling rates of plastic packaging are preferable from an environmental point of view (Raadal et al. 1999, Wollrad and Scmied 2000), other studies have shown that collection, sorting and recycling of municipal plastic packaging are very costly processes and thus that incineration and landfill may be better solutions (Bruvoll 1998, Eggels et al. 2000). This discrepancy in recommendations is very much a result of disagreements on what the preferred method for evaluation of recycling issues should be. In order to include and quantify both the environmental and economic cost and benefits of a defined recycling system, we will develop the concept of eco-efficiency as an alternative to the existing methods of evaluation.
1.2 Methods for evaluating recycling systems
From an ecological point of view all materials and products should be reused, remanufactured and recycled, and in this way remain in the economical system as long as possible before being incinerated or placed in landfills. However, several studies have concluded that due to high economic costs in the collecting and sorting phase, a high degree of recycling is not necessarily a better solution then energy recovery, incineration and landfill, e.g. Bruvoll (1999), GUA (1999) and Eggels et al 2000). However, other studies have arrived at a different conclusion (Raadal et al 1999, Wollrad and Schmied 2000, Eriksson and Ölund 1999). This discrepancy may be caused by the presence of “human values” when developing, choosing and applying the methodology used to carry out such analyses (Hertwich 2000). Another reason for the discrepancy is the fact that various methods are applied to analyze the recycling systems identified for evaluation. In the following we will take a brief look at some of the most common evaluation methods for recycling systems. In a cost-benefit analysis, all environmental and economic costs of a project or activity are summarized and calculated in monetary terms (Wrisberg et al 2000). Cost-benefit analyses of recycling systems have been carried out by, for example,

Introduction
3
Bruvoll (1999) and GUA (1999). Value-chain analysis is a tool used to assess the cost and benefit of any process and has proved to be very useful for analyzing value chains for recovery and recycling of materials and products. It identifies cost drivers and allows simulation to ascertain how these drivers might vary and consequently modify the cost-benefit profile of that process (ERRA 2000). In the life-cycle assessment method, all environmental issues connected with the function of a process, product or activity, within an identified system border, are identified and analyzed in terms of various potential environmental impacts (ISO 1998). A function of a recycling system may be, for instance, to produce 1000 kg re-granulate from used plastic foil. Ølund et al (1999), Raadal et al (1999) and Song and Hyun (1999) are examples of recycling studies using the life-cycle assessment method. Both LCA and the cost-benefit analysis can be combined with an input-output analysis to expand (narrow) system boundaries. By doing this we can encompass the complete supply chain of economic activity needed to manufacture any good or service in an economy. One of the highest volume tools combining LCA and environmental input-output has been developed at Carnegie Mellon University and is available free on the Internet (Matthews and Small, 2000). Certain problems related to combining a tool at the micro level (LCA) with a technique developed for a higher aggregated level (input-output) is discussed in Joshi (2000).
Wrisberg et al. (2000) have provided an excellent study of the strengths and weaknesses of the methods discussed above and others. We have not carried out a thorough study of the strengths and weaknesses of the methods when applied to recycling systems and to a large extent we base our statements on the work of Wrisberg et al. Life-cycle assessment is a systematized and ISO-standardized method, which gives a comprehensive insight into the environmental impact of the function of the process or system analyzed (ISO 1998). The problem with life-cycle assessment is that it does not provide information on economic issues, often the most valuable information from a decision maker's point of view. Value-chain analysis, on the other hand, only provides information on economic, not environmental, issues. When applying a cost-benefit analysis, all results are given in monetary values and decisions based on comparisons of different projects or activities can easily be made. However, the (economic) valuation of environmental impact is difficult as in some way it must be based on human preferences, which varies within and between generations and within and between societies and cultures.
In the input-output models, the inputs and discharges are proportional to output. Changes in economies of scale and in the mix of input factors are not accounted for. Technological development, changes in preferences, etc. are important factors that affect the environmental as well as the economic performance of the economy, thus making the analysis too static to offer solutions for current environmental problems.
Introduction
4
For all methods, the resource requirements increase as the size and complexity of the analyzed system increase. All methods are also static because they do not include and combine the effects of changes in preferences, productivity, technology and market conditions. Evaluations of situations that differ from the present are therefore constrained with respect to offering solutions to present problems in a world which is constantly changing. With the exception of the value-chain analysis, all the methods only provide evaluations of the whole analyzed recycling system, while the involved companies’ ability to improve the performance of their activities and thus the system as a whole is absent. If current recycling systems are to be improved, an environmental and/or economic analysis of the (academically) identified system is not sufficient. The changes must occur within the companies in the recycling system, therefore an evaluation of their performance and improvement potential is also necessary. Eco-efficiency evaluations, on the other hand, are often carried out by means of indicators that only measure “what is under direct management control” of the company, and not the performance of the whole product or recycling system. It is important to provide decision makers on both the company and system level with suitable information on the environmental and economic advantages and disadvantages of recycling compared to other treatment options or to improve already established recycling systems. Eco-efficiency strategies and eco-efficiency indicators are well established in some parts of the industry (WBCSD 2000), and it is now time to extend this focus to recycling and product systems. The challenges in this project are to develop an eco-efficiency method for the evaluation of current and future recycling systems and identification of the improvement potential and corresponding indicators for the involved companies in the system. In the eco-efficiency method there are no standards for which environmental and economic performance indicators should be included. The development of indicators is thus an important challenge within the eco-efficiency analysis method.
1.3 The recycling challenges of plastic packaging
The first synthetic plastic was created in 1907, but it was not until after the Second World War that production took off with new products and applications in a variety of fields, such as packaging, building & construction, electricity & electronics, automotive, medical, sports and space exploration (APME, internet). Plastic packaging is mainly made of thermoplastics, the other main category of plastics, the thermosets, is used in other plastic products. Today 40% of all plastics produced are used for packaging, and 50% of all food packaging is made from plastics (APME, internet). I 1998 around 12 million tons of plastic packaging were produced in Western Europe. Of this, 33% was LDPE, 22% was HDPE, 19% was PP, 10% was PET, 8 % was PS, 6% was PVC and 2% of the plastic packaging
Introduction
5
produced was EPS (APME, internet). The use of plastic packaging is steadily increasing and according to APME a major reason for this is the strengths, transparency, and low weight of plastic packaging.
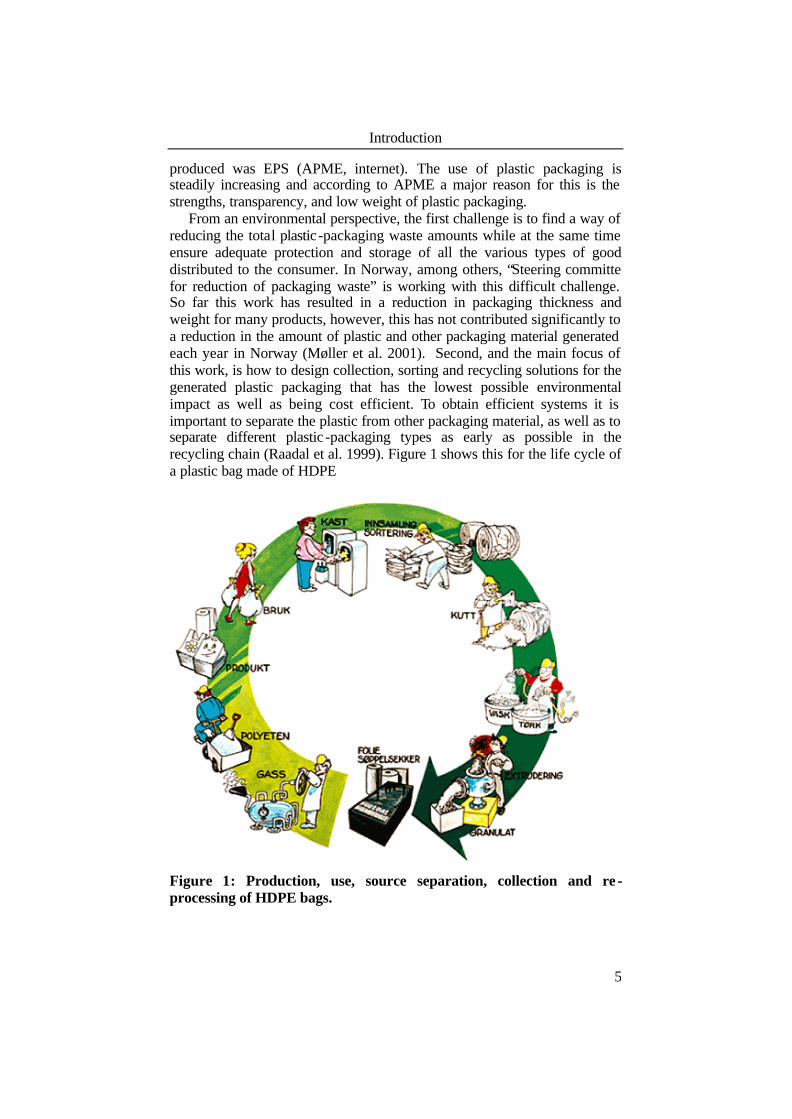
From an environmental perspective, the first challenge is to find a way of reducing the total plastic-packaging waste amounts while at the same time ensure adequate protection and storage of all the various types of good distributed to the consumer. In Norway, among others, “Steering committe for reduction of packaging waste” is working with this difficult challenge. So far this work has resulted in a reduction in packaging thickness and weight for many products, however, this has not contributed significantly to a reduction in the amount of plastic and other packaging material generated each year in Norway (Møller et al. 2001). Second, and the main focus of this work, is how to design collection, sorting and recycling solutions for the generated plastic packaging that has the lowest possible environmental impact as well as being cost efficient. To obtain efficient systems it is important to separate the plastic from other packaging material, as well as to separate different plastic -packaging types as early as possible in the recycling chain (Raadal et al. 1999). Figure 1 shows this for the life cycle of a plastic bag made of HDPE
Figure 1: Production, use, source separation, collection and re -processing of HDPE bags.
Introduction
6
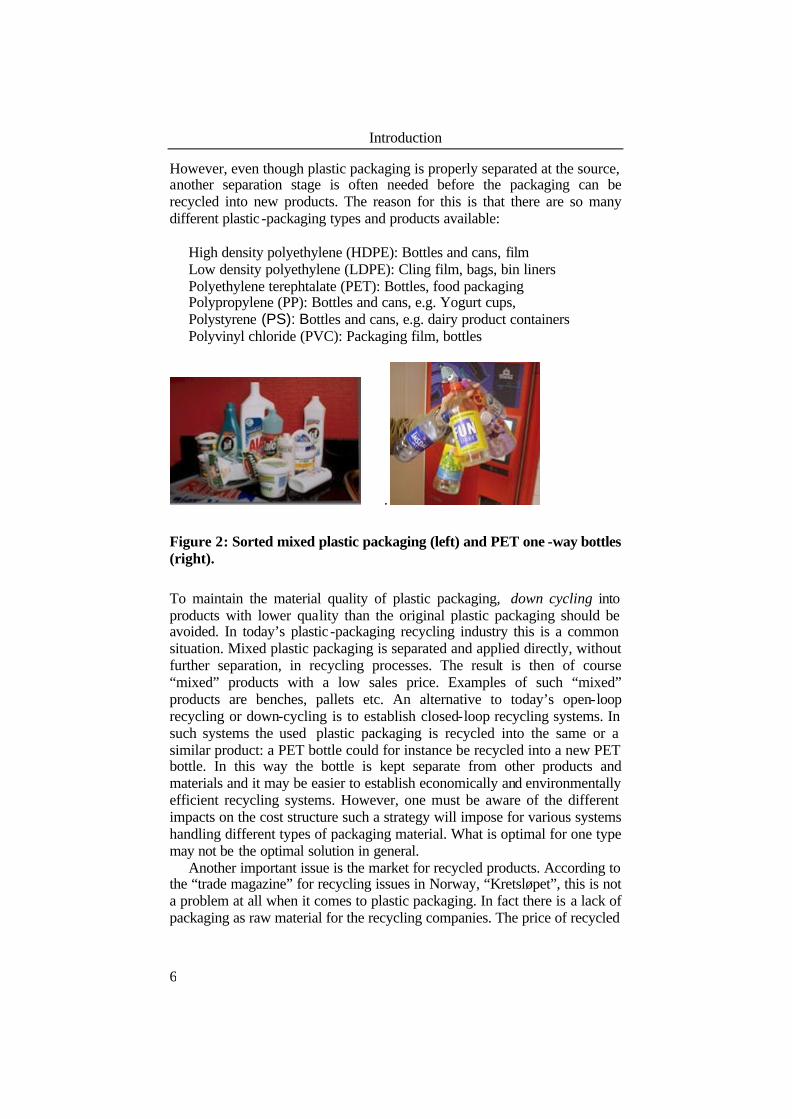
However, even though plastic packaging is properly separated at the source, another separation stage is often needed before the packaging can be recycled into new products. The reason for this is that there are so many different plastic -packaging types and products available:
High density polyethylene (HDPE): Bottles and cans, film Low density polyethylene (LDPE): Cling film, bags, bin liners Polyethylene terephtalate (PET): Bottles, food packaging Polypropylene (PP): Bottles and cans, e.g. Yogurt cups, Polystyrene (PS): Bottles and cans, e.g. dairy product containers Polyvinyl chloride (PVC): Packaging film, bottles
.
Figure 2: Sorted mixed plastic packaging (left) and PET one -way bottles (right).
To maintain the material quality of plastic packaging, down cycling into products with lower quality than the original plastic packaging should be avoided. In today’s plastic -packaging recycling industry this is a common situation. Mixed plastic packaging is separated and applied directly, without further separation, in recycling processes. The result is then of course “mixed” products with a low sales price. Examples of such “mixed” products are benches, pallets etc. An alternative to today’s open-loop recycling or down-cycling is to establish closed-loop recycling systems. In such systems the used plastic packaging is recycled into the same or a similar product: a PET bottle could for instance be recycled into a new PET bottle. In this way the bottle is kept separate from other products and materials and it may be easier to establish economically and environmentally efficient recycling systems. However, one must be aware of the different impacts on the cost structure such a strategy will impose for various systems handling different types of packaging material. What is optimal for one type may not be the optimal solution in general.
Another important issue is the market for recycled products. According to the “trade magazine” for recycling issues in Norway, “Kretsløpet”, this is not a problem at all when it comes to plastic packaging. In fact there is a lack of packaging as raw material for the recycling companies. The price of recycled

Introduction
7
material is today around 60 –70% of the price for virgin material. Higher plastic prices will make it more attractive to recycle used plastic packaging.
In addition to source separation and a market for recycled material, efficient collection and transport of the packaging is an important challenge. To increase transport efficiency, a high degree of compression of the packaging and reduction of transport distance is necessary.
Before moving on, another challenge for the recycling business that should be mentioned is the need to overcome the barrier of treating used products and materials as waste. If we must change our thinking from “how to get rid of the waste in the best way“ to “how to make good and attractive products from used material,” the latter strategy may introduce greater efficiency of recycling systems. In this connection, the fields of value-chain optimization (Harvard Business Review 2000) may be an inspiration.
In this project we will evaluate the eco-efficiency of the recycling systems for plastic packaging from households in Trondheim. An important part of the evaluation is to identify challenges to increase the eco-efficiency of these systems.
1.4 Objectives, research methodology and content
As we have seen, there is a need for a method of evaluating the economic and environmental impact from recycling systems that can transform the knowledge gained from the evaluation of the recycling system (as a whole ) into operational knowledge for the companies within the recycling systems.
The objectives of this study are to: 3) Develop methods for evaluation of eco-efficiency in recycling
systems. 4) Apply these methods to evaluate the eco-efficiency of today’s
recycling systems for used plastic packaging from households, identify the improvement potential in these systems, and suggest alternative eco-efficient solutions.
To reach these objectives, we have examined the following recycling
case studies:
• Source separation system for mixed plastic packaging generated in households in the city of Trondheim, Norway
• Deposit system for one-way PET bottles from inhabitants in Trondheim Within these case studies we have applied both qualitative and
quantitative methods. A literature study has been carried out to obtain an overview of the state-of-the-art in the fields of plastic -packaging recycling
Introduction
8
and evaluation methods. To obtain the opinions of actors and stakeholders on current recycling systems and on indicators for measuring eco-efficiency performance, we have carried out qualitative research interviews. To collect, structure and analyze materials and cash flows, the f life-cycle assessment method has been used.
Chapter 1 provides an introduction to common evaluation methods for recycling systems, in addition to the state-of-the-art on recycling challenges for plastic packaging. Chapter 2 examines the theoretical basis of the concept of eco-efficiency and indicators for measurement along with an outline of our method for the development and use of eco-efficiency indicators. In Chapter 3 an alternative semi-dynamic method for evaluation of eco-efficiency is shown. Chapter 4 describes the empirical basis of the recycling systems in Trondheim. In Chapter 5 we quantify the eco-efficiency of the existing systems in Trondheim while Chapter 6 makes proposals on company-specific indicators as contributors to the improvement of the recycling systems. In Chapter 7 we evaluate the eco-efficiency of possible future recycling systems for household plastic packaging. A discussion on the developed methods and the results is found in Chapter 8, before we summarize our findings in Chapter 9.

9
2 A METHOD FOR ECO-EFFICIENCY EVALUATION OF RECYCLING SYSTEMS
2.1 Introduction
As mentioned in Chapter 1, there is a need for an evaluation method for recycling systems that includes both economic an environmental indicators on the recycling system level and on the company level. Being aware of the success of measurement and implementation of eco-efficiency in industry, it is interesting to examine whether the flexible and open eco-efficiency approach of the World Business Council on Sustainable Development can be successfully transferred to recycling systems. To develop our method we will use the WBCSD's work on eco-efficiency as a starting point. Since the development of indicators is an important part of an eco-efficiency evaluation method, we will have a brief look at the use, characteristics and development of indicators. Thereafter the basic idea of combining life-cycle assessment and eco-efficiency in order to develop indicators on both the system and company level will be presented. Finally, the steps in our developed analysis method will be shown
2.2 Presentation of eco-efficiency
Eco-efficiency was popula rized in 1992 in Stephan Schmidheiny’s book Changing Course (Schmidheiny 1992). Since then the concept has been developed further and applied by such institutions as the World Business Council of Sustainable Development (WBCSD 2000), Fussler (1996), the Organization for Economic Co-operation and Development (OECD 1998), the Global Reporting Initiative (1998) and the Norwegian Research Council (NFR 2000). Eco-efficiency offers an open and flexible approach, focusing on giving needed information for decision making by taking both economic and environmental issues into account (WBSCD 2000). Eco-efficiency can be understood as (i) a concept or strategy to improve the environmental and economic performance of a company or a nation and (ii) as a way of measuring the performance by means of indicators (NFR 2000).
The World Business Council for Sustainable Development (WBCSD) has developed a set of eco-efficiency indicators to help measure progress towards economic and environmental sustainability in companies. Eco-efficiency indicators primarily serve as a decision-making tool for internal management to evaluate performance, set targets and initiate improvement measures (WBCSD 2000). The intent of eco-efficiency is, according to the
A method for eco-efficiency evaluation of recycling systems
10
WBCSD, to maximize economical value while minimizing adverse environmental impact, i.e. use of resources and impacts from emissions.
Before proceeding we shall take a brief look at some of the critiques of the concept of eco-efficiency. McDonough & Braungart (1998) call eco-efficiency the current industrial buzzword which will neither save the environment nor foster ingenuity or productivity. They claim that "doing more with less" is nothing more than what Henry Ford did when he started recycling and minimizing the use of packaging and so on. McDonough & Braungart think that eco-efficiency is well meant but it does not reach deep enough because it works within the same system that caused the problem in the first place. The result will be the opposite of increased environmental performance because through its recycling, industry will use less material and energy, releasing fewer dangerous materials into nature and will use other defensive strategies, thus avoiding the challenge for necessary changes. Today's products are seldom designed for recycling, leading to excessive costs and poor quality of the recycled product. McDonough & Braungart are looking for the “Next Industrial Revolution”, where industry will be reshaped and where focus is on sustainable design, which they claim is not the case in the eco-efficiency concept. The alternative is, according to the authors, eco-effectiveness, where technical and natural metabolism are not mixed and where the use of material (such as organic material in packaging) that can enter and be transformed in the biological metabolism will be increased. The traditional eco-efficiency approach first of all reflects the technical efficiency and the production value of a given system (Hanssen 2001). To become a more sustainable society, it is necessary to focus more on the functional efficiency and the functional utilities of a system, and on the value of the product for the user in the consumption phase. In economic terms this means moving towards eco-effectiveness as a measure for the environmental performance of a system (Hanssen 2001).
To calculate eco-efficiency, the WBCSD has developed the following equation which combines value and ecological aspects into an efficiency ratio:
Eco-efficiency = product or service value/environmental influence
The WBCSD has then developed the following “generally applicable
indicators”, which it claims are “applicable to virtually all businesses” (WBCSD 2000):
Product or service value • Quantity of product/service produced or sold • Net sales
Environmental influence • Energy consumption
A method for eco-efficiency evaluation of recycling systems
11
• Water consumption • Material consumption • Greenhouse gas emissions • Ozone depleting substance emissions
In addition to the “generally applicable indicators”, the WBCSD also
proposes that “business specific indicators” should be developed if more information on environmental and/or economic performance is needed. These indicators should be developed to describe all relevant and meaningful aspects for a company, and will be dependent on the sector and type of business (WBCSD 2000).
How then should eco-efficiency be calculated, by stand-alone indicators or by combinations of indicators for products/service value and environmental influence? In contrast to its prescription of describing all relevant aspects, the WBCSD claims that companies should be aware of producing excessive information. Only the most meaningful combinations, providing the most useful information for decision making, should be used to measure eco-efficiency ratios (WBCSD 2000). It is therefore not clear as to how companies should carry out their reporting. A prescription easier to live with is to report on the environmental and economic profile separately because this will often provide a better basis of information for decision making.
The WBCSD has developed “generally applicable” indicators to measure what is “under direct management control” of a company. The question we will be examining is to what extent are these indicators also appropriate for evaluations of recycling systems, and to what extent are more indicators needed for this purpose. However, we shall first take a brief look at indicators more generally.
2.3 Use of life-cycle assessment to evaluate recycling systems
Life-cycle assessment (LCA) has developed rapidly since it was established early in the 1990s and has reached a certain level of harmonization and standardization. An ISO standard (the ISO 14040 series) has been developed for this as along with a number of guidelines (ISO 1998, Guineé 2001). LCA has mainly been developed to analyze material products, but according to Finnveden (1999) Ekvall and Tillmann (1997) and others, it can also be applied to evaluate waste -management systems and recycling systems. An LCA studies the environmental (and in some cases the economic) aspects and potential impact throughout a ‘product’s’ life cycle (i.e. cradle to grave) from raw material acquisition through production, use and recycling/recovery/disposal. In the definition of LCA, the term ‘product’
A method for eco-efficiency evaluation of recycling systems
12
includes not only product systems but can also include waste-management systems and recycling systems.
Normally when carrying out an LCA for a recycling system, the system borders include all flows from the waste source, e.g. from households (upstream-system border) to where the material is recovered into new products or energy (downstream-system border) (Finnveden 1999). When undertaking an LCA, the functional unit of a system that involves end-of-life products may vary from treatment of a particular amount of waste generated to production of a given amount of a new recycled product. For more information on how to define the functional unit see the ISO 14040 series (ISO 14040). Since a demarcation of system borders in an LCA always implies difficult decisions on which flows and how much of each flow to include within the system borders, the issue of allocation procedures is a hotly debated issue, see for instance Finnveden (1999), Ekvall and Tillmann (1997), Ekvall and Finnveden 2001.
2.4 Use and development of indicators
Intuitively we all use indicators to monitor complex systems we generally are interested in or need to control. We measure, for instance, the temperature in Celsius, economic activity in the US with the Dow Jones Index and present emissions of climate gases using CO2 equivalents. The Balaton group has produced two excellent reports on indicators and information systems for sustainable development (Meadows 1998, Bossel 1999). According to Meadows (1998), indicators both arise from values (we measure what we care about) and create values (we care about what we measure). Furthermore, they state that some values are place or culture specific, while others are common to all humanity. According to Hertwich (2000) there is no such thing as a value-free objective indicator. Hertwich claims that an indicator is good if it supports the purpose of the analysis carried out and at the same time gives desired information for decision making.
To develop indicators that ensure relevant and meaningful information for the stakeholders connected to the system which is potentially going to be changed, the method of stakeholder assessment may be considered, see Økstad and Grøm (2000) for a description of the six steps in the method. The international standardization organization, ISO, has developed an environmental performance evaluation standard for organizations (ISO 14031). This is a process guide to measure, analyze, assess, and describe an organization’s environmental policy and contains a number of generic environmental performance indicators divided into management performance indicators, operational performance indicators and environmental indicators. The ISO 14031 standard also contains guidance on the process of developing indicators. Here, however, we will just take a brief

A method for eco-efficiency evaluation of recycling systems
13
look at the methodological approach for defining environmental performance indicators (EPIs) as developed in the NORDEPE project within in the Nordic Industrial Fund (NORDEPE 2001).
Figure 3 shows the general flow chart of the development and implementation of indicators. For more information about this methodology, and each step, see NORDEPE (2001).
A. Method for Development ofSustainability Performance Indicatorsfor Strategic Decision Making
B. Method for Development ofSustainability PerformanceIndicators for Reporting purposes
1. Goal, scope and organization
2. Definition of sustainability concerns
3. Identification of significantsustainability aspects and their causes
4a. Review of strategic decisionsituations and decision makers’information needs
4b. Review of relevant reportingsituations and identification of relevantstakeholders groups and needs
5. Development of a set of EPIs
6b. Testing the EPIs by introductioninto communication processes
7. Gathering of experience andsubsequent adjustment of the EPIs
8. Implementation in the organization
9. Reporting
6a. Testing the EPIs by introductioninto decision and planning processes
Figure 3: General flow of the development and implementation of EPIs to be used for A) Strategic decision making and B) Reporting issues
Before leaving the subject of indicators in general we would like to briefly focus on desired characteristics of ideal indicators. According to the WBCSD, indicators should be based on a basic set of principles that define how they will be selected and used (WBCSD 2000). The indicators should:

A method for eco-efficiency evaluation of recycling systems
14
• be relevant and meaningful with respect to protecting the environment
and human health and/or improving the quality of life • inform decision making to improve the performance of the organization • recognize the inherent diversity of business • support benchmarking and monitoring over time • be clearly defined, measurable, transparent and verifiable • be understandable and meaningful to identified stakeholders • be based on an overall evaluation of a company’s operations, products
and services, especially focusing on all those areas that are of direct management control
• also recognize relevant and meaningful issues related to upstream (e.g. suppliers) and downstream (e.g. use) aspects of a company’s activities
Meadows (1998) and Bossel (1999) point out that it is easy enough to list
the characteristics of ideal indicators, but it is not so easy to find indicators that actually meet these ideal characteristics. Nevertheless, they have made a list of what the indicators should be: Clear in value, clear in content, compelling, policy relevant, feasible, sufficient, timely, appropriate in scale, democratic, supplementing, participatory, hierarchical, physical, leading and tentative. A quick look at this list leaves one thinking that this does not appear to be making life easier compared to the suggestions from the WBCSD. Nevertheless, we have now gained a brief insight by presenting some examples on the use and development of indicators. The next challenge and the main approach in this chapter is to extend the WBCSD's work on eco-efficiency in such a way that it can also be useful for the evaluation of recycling systems.
2.5 A method for both evaluation and improvements
2.5.1 Introduction
Here we will present the basic idea of our suggested method for evaluation of recycling systems. The method combines the WBCSD's eco-efficiency approach with LCA and the field of indicator development. A description of this six-step method is presented in Chapter 2.6. The method is then applied to the evaluation of a recycling system in Chapters 5, 6 and 7.
As mentioned several times above, efforts within the concept of eco-efficiency often focus on improving environmental and economic performance at the production site, or what is under “direct management control” of a company. Less emphasis is put on the life-cycle stages of the extraction of raw materials, use, and end-of-life (recycling/recovery/disposal).
A method for eco-efficiency evaluation of recycling systems
15
A recycling chain consists of many individual companies and actors (in transport, processing, recycling and production), and to analyze this we need to focus on the life cycle of the material, i.e. we analyze each of the companies in the recycling chain. Hence economic and environmental considerations should be taken into account, thus increasing the “value added” and reducing the “environmental influence” of the sorting, transportation and recycling processes. Moreover, the fact that use of recycled material often saves an equivalent amount of virgin material should be included in such an analysis. An important obstacle, however, is that normally many independent actors are involved in a recycling chain, and each of them is concerned about their own business and to a lesser extent with the life-cycle faith of the material or product. On the other hand, there is a connection between the system and company level, as the different companies in a recycling chain have influence on the overall eco-efficiency performance of the system, and as each company is dependent on and limited by the other companies and the system as a whole. To obtain changes on the system level, changes must therefore occur at the technical and organizational level in the life-cycle stages. In our method we therefore suggest to first use a simplified economic and environmental LCA to evaluate existing or possible future recycling systems. This analysis should serve as a basis for the development of indicators on the company level that work as a decision-support tool to improve the company’s performance in such a way that it also improves the eco-efficiency of the overall recycling system.
2.5.2 Indicators at the system and company levels
Improving the eco-efficiency for the entire recycling system requires a focus on the potential for change within each stage, or each company, within the recycling chain. Therefore indicators serving as an information platform for decision makers connected to the recycling system should be developed on both the system and company level. This means that economic and environmental performance (eco-efficiency) should be evaluated for the recycling system as a whole. In our evaluation of the recycling system we apply generally applicable indicators that are valid for all recycling systems (Step 2 in Chapter 2.6), and system-specific indicators that should be developed for the actual recycling systems evaluated (Step 3). These two sets of indicators are applied to quantify the eco-efficiency of the recycling system analyzed (Step 4). Thereafter these indicators should be operationalized into indicators for the companies that are contributing most to the environmental and economic performance of the overall recycling system (Step 5). In Step 6, the final stage, these indicators should be applied within the companies.
A method for eco-efficiency evaluation of recycling systems
16
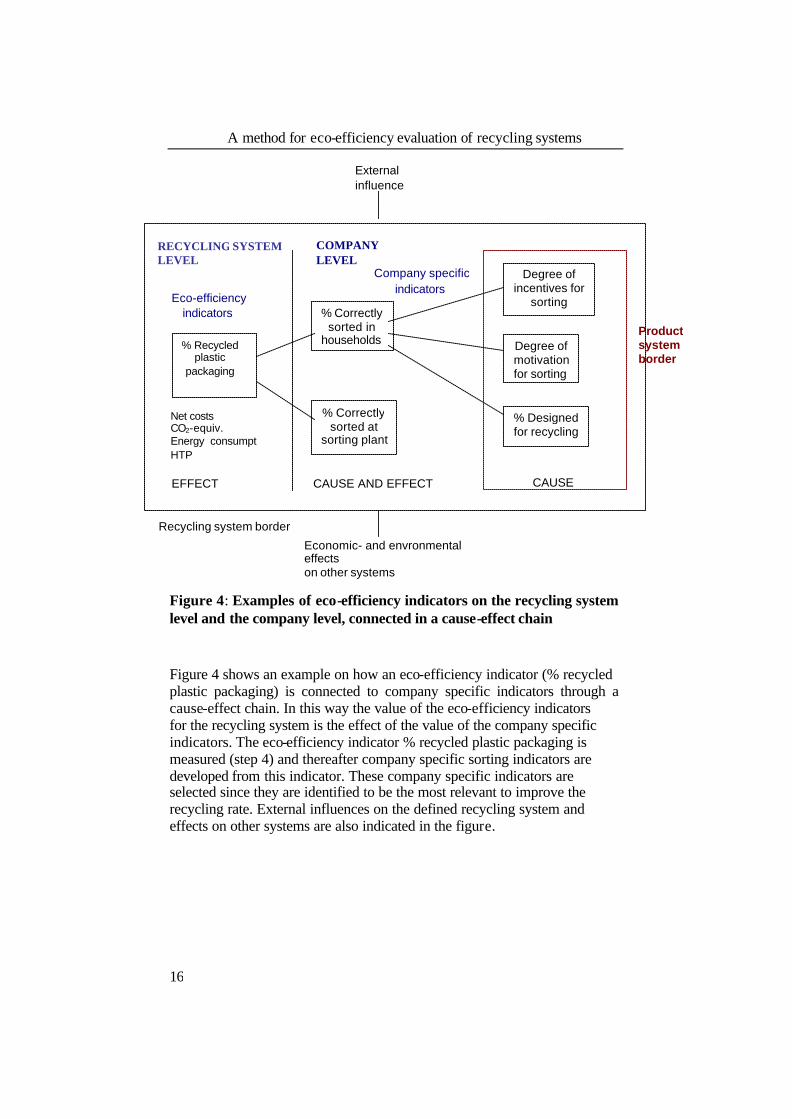
Figure 4: Examples of eco-efficiency indicators on the recycling system level and the company level, connected in a cause-effect chain
Figure 4 shows an example on how an eco-efficiency indicator (% recycled plastic packaging) is connected to company specific indicators through a cause-effect chain. In this way the value of the eco-efficiency indicators for the recycling system is the effect of the value of the company specific indicators. The eco-efficiency indicator % recycled plastic packaging is measured (step 4) and thereafter company specific sorting indicators are developed from this indicator. These company specific indicators are selected since they are identified to be the most relevant to improve the recycling rate. External influences on the defined recycling system and effects on other systems are also indicated in the figure.
CAUSE
Recycling system border
Product system border
External influence
% Correctly sorted at
sorting plant
% Correctly sorted in
households
Eco-efficiency indicators
Company specific indicators
EFFECT CAUSE AND EFFECT
COMPANY LEVEL
RECYCLING SYSTEM LEVEL
Degree of motivation for sorting
Degree of incentives for
sorting
% Designed for recycling
Economic- and envronmental effects on other systems
% Recycled plastic
packaging
Net costs CO2-equiv. Energy consumpt HTP
A method for eco-efficiency evaluation of recycling systems
17
2.5.3 Applicability of the method and indicators
Normally evaluations of current or possible new recycling systems do not lead to any actions in themselves. One of the main reasons for this is undoubtedly that the researchers carrying out the study do not involve the various decision makers in the recycling system to a large enough extent, with the subsequent outcome that the recommendations from a system analysis are often not implemented. In our method we recommend that the most important actors and stakeholders (the public, authorities, companies, employees etc.) in the recycling system must be included throughout the entire analysis, from defining the recycling challenge to using the indicators in the various companies’ organizations. When applying this method to evaluate the eco-efficiency of recycling systems it is important to ensure that the indicator and analysis provide the actors in the recycling system with sufficient information on which to base their decisions. To initiate and steer the analysis method, an “expert” on recycling issues on the system and company level, as well as on life-cycle assessment and eco-efficiency levels is needed. This expert, who may be a researcher, consultant or a skilled representative from the government, must also ensure that the communication and information system between the actors in the system is well established throughout the entire analysis. Additionally, every activity in the system must have at least one person contributing to the development of company-specific indicators, as well as the implementation and reporting of these indicators. Local and national authorities and other actors dealing with the eco-efficiency of the entire recycling system are particularly important for development and use of system indicators, while actors such as transporters and recyclers are important for development, use and implementation of company-specific indicators. In this manner the actors representing the entire recycling chain mainly contribute when evaluating the recycling system. However, since the changes must occur within each of the life-cycle stages of the product chain, each of the companies is a crucial factor for improving the performance of the company and hence the system.
As mentioned above, there is no standard set of indicators that can be used for all product or recycling systems. Indicators should support decision making and give sufficient information for this purpose (Hertwich 2000). In this report we focus on the development of eco-efficiency indicators for a recycling system, however, this method may also be transferable to the development of other types of indicators, for other recycling and product chains. This should be tested in a later project. It is worth mentioning here that we have applied the empir ical basis from the research interviews and the experiences from the systems described in Chapter 4 to help us develop the method. Literature from other studies has also been applied where needed. We will present the method step by step and mention briefly how some of the steps have been carried out in our eco-efficiency study of the plastic -packaging systems in Chapters 6 and 7.
A method for eco-efficiency evaluation of recycling systems
18
Before proceeding we should repeat that the definition of an eco-efficiency indicator is normally given as the ratio of various “value added” and “environmental influence” indicators (see Chapter 2.1). However, when calculating the developed indicators as ratios, one should guard against producing excessive information. Only the most meaningful combinations, providing the most useful information for decision making, should be used to measure eco-efficiency ratios (WBCSD 2000). Reporting the environmental and economic profile separately will often provide a better information base for decision making. In this project we mainly apply stand-alone indicators when quantifying eco-efficiency.
2.6 The steps in the eco-efficiency analysis method
2.6.1 Short presentation of the six steps
Before going into more detail on each step in the analysis method, we will briefly present the steps we suggest should be carried out in an eco-efficiency analysis. The first four steps deal with evaluation of the recycling system, while the last two focus on development and implementation of company-specific indicators to release the potential for improvement of the eco-efficiency of the recycling system.
1. Definition of the recycling system 2. Development of generally applicable indicators for the recycling
system 3. Development of system-specific indicators for the recycling system 4. Use of the indicators to quantify the eco-efficiency of the recycling
system 5. Development of company-specific indicators as a basis for
improvement of the eco-efficiency in the recycling system 6. Testing, implementation, measurement, reporting and action within
the companies
2.6.2 Step 1: Definition of the recycling system
To analyse an existing or possible future recycling system, it must be clearly defined. In the same way as in the methodology of life-cycle assessment, appropriate system borders and functional units must be defined. This should be done, for example, by discussing and taking into account:
- What is the function and performance of the recycling system should be

A method for eco-efficiency evaluation of recycling systems
19
- The relation between the system levels for material, product, activities and recycling in the analyzed chain
- How different product, material and recycling chains are connected to each other in the society
- Whether the whole product chain or only the recycling phase should be included in the analysis
- Whether the functional unit should be based on waste management or production of new material (or energy) and whether it should be based on recycling, recovery or other technical options
- Whether allocation between material and money flows should be carried on the basis of mass, volume, monetary value or others
- If and how avoided emissions and costs due to production of recycled material (and energy) should be included
Step 1 in the case studies:
In this project the definition of the recycling system is given in Chapter 4.
2.6.3 Step 2: Development of generally applicable indicators
The generally applicable indicators can be applied to quantify the eco-efficiency of all kinds of recycling systems. We have combined the WBCSD's principles for generally applicable indicators (for what is under “direct management control”) with experiences from the case studies in this report, as well as literature on LCA, indicators and industrial ecology, as presented in preceding sections. Bearing all this in mind, we suggest that the generally applicable indicators for a recycling system should as far as possible be based on the following characteristics:
1. Indicators should reflect the industrial ecological ambition of closing
material and energy loops. 2. Indicators should reflect the function and the performance of the system. 3. Indicators should be based on the most important environmental and/or
economic impacts (eco-efficiency) in the whole life cycle of the recycle chain, from end-of-life product or material to the new recycled material.
4. Indicators should reflect global environmental concern or business value.
5. Indicators should be relevant, understandable, meaningful and useful for decision makers.
6. Indicators should support system-oriented decision makers (e.g. local, national and regional authorities, proactive firms, ”material companies”).
7. Definitions, data and methods for measurement must be established and accepted globally as scientifically valid.
A method for eco-efficiency evaluation of recycling systems
20
Product or service value
Quantity of product/service sold
The WBCSD expresses and measures this indicator as a physical measure or counting of the product or service produced, delivered or sold to producers (WBCSD 2000). In a recycling system, which in principal can be defined as a production system, only what is actually sold should be included. Since one of the objectives of a recycling system is to move as much as possible of an end-of-life fraction through the recycling systems, the quantity of the recycled and sold product from a given start fraction will be given as % recycled. It should be mentioned that each defined recycling system has its limitation where further growth in the amount of recycled material is not preferable from an environmental and/or economic point of view. Therefore, more than this indicator is needed to evaluate eco-efficiency in recycling systems.
We recommend using % recycled instead of quantity of product/service sold as a generally applicable indicator for recycling systems
Net sales
According to the definition from the WBCSD, the net sales are the total recorded sales less sales discounts and sales returns and allowance (WBCSD 2000). This indicator is not appropriate as a generally applicable indicator for recycling systems as the focus in such systems should be on the life-cycle stages from the end-of-life fraction to a new product, not the net sale from, for instance, one recycling factory. However, the net sales for a recycling system, given as average sales price of the recycled products multiplied by kg recycled and sold material, provides important information on the overall economic efficiency of the recycling system. It also reflects the quality of the material and what the market is willing to pay for the recycled material, even though the sales price for recycled products will depend on the market price of virgin material and also the price of any alternative products. However, rather then having one specific indicator for the net sales or the sales price, it is more appropriate to include the revenues from the sale of recycled material in a net costs indicator, see below.
We do not recommend using net sales as a generally applicable indicator for recycling systems.
Net costs in the system
The WBCSD has not proposed costs as one of the generally applicable indicators for companies. However, "costs" has been given as an example of
A method for eco-efficiency evaluation of recycling systems
21
a possible additional indicator for product or service value (WBCSD 2000). The cost of recycling is a very widely analyzed and debated issue within recycling systems and should be included as an important parameter to be able to justify or disqualify recycling as a reasonable option (Bruvoll 1999, GUA 1999, Eggels 2000).
Wollrad and Schmied (2000) mention cost-benefit analysis and prevention costs as possible approaches for estimating costs in recycling systems. APME (2000), use an eco-efficiency model developed by BASF to calculate the cost balance. Credits achieved through substituting virgin material with recycled material are included in this cost balance. The cost methodology in Weitz (1999) calculates annual construction and equipment capital costs and operating costs per ton processed at the facilities in the recycling chain. A value-chain analysis used to evaluate recycling costs and benefits ERRA (2000) will evaluate the cost of each activity according to generally accepted accounting principles to establish net costs, where the sales price of recycled material is included.
We recommend applying net costs as it is defined by ERRA (2000) as a generally applicable indicator for recycling systems.
Environmental influence in product/service creation
Net energy consumption
Energy consumption is a global issue and relevant to all businesses across sectors. The WBCSD expresses this generally applicable indicator as the total sum of energy consumed (equals energy purchased minus energy sold to others for their use). It includes electricity and district heating, fossil fuels, other fuel-based energy (e.g. biomass, waste fuel) and non-fuel base energy (e.g. solar, wind), calculated, for instance in joule (WBCSD 2000).
Energy consumption is a very important parameter when evaluating recycling system since great amounts of energy often are involved in processes as transport, sorting and recycling. Additionally, a large amount of energy are saved when the recycled material from the defined system substitute virgin material which are normally very energy demanding to extract. Correspondingly if incineration is a part of the treatment, the energy produced can substitute other energy sources. We recommend using net energy consumption through the recycling chain as a generally applicable indicator for recycling systems.
We recommend using net energy consumption as a generally applicable indicator recycling systems.
Material consumption In the framework of WBCSD material consumption is total weight of all materials the company purchases or obtains from other sources, including raw materials for conversion, other process material and pre- or semi-

A method for eco-efficiency evaluation of recycling systems
22
manufactured goods and parts (WBCSD 2000). For a production site, this may very well be a relevant indicator even though such an indicator does not distinguish between the use of different kinds of material. For a recycling system, however, such an indicator would not be very useful since the end-of-life fraction is the raw material to be converted into a new product. This fraction is normally not a limited factor that should be saved. The aim is rather to use as much as possible of the end-of-life fraction, and this use is already included in the % recycled indicator.
We do not recommend to use material consumption as a generally applicable indicator for recycling systems
Water consumption This generally applicable indicator quantifies the sum of all water purchased from public supply, or obtained from surface or ground water sources (WBCSD 2000). Use of water may be a problem in recycling processes that are water consuming and in area where there is a scarcity of water to use for such purposes. However, this is probably not a problem in general and in those cases it is, water consumption may rather be chosen as a system specific indicator.
We do not recommend to use water consumption as a generally applicable indicator for recycling systems
Ozone depleting substance (ODS) emissions ODS are a global concern, defined in the Montreal Protocol which lists the group of gases to air from processes and losses/replacement from contaminants. Even though the effect of earlier emissions of ODS have lead to ozone depletion and will be visible in the stratospheric ozone layer over many decades, the indicator is less important since the emissions of ODS have been reduced strongly due to the possibility of using other materials. For treatment of end-of-life products as white goods this may still be a problem, but in general emissions ODS are probably not a problem in recycling systems.
We do not recommend using ozone-depleting substance emissions as a generally applicable indicator for recycling systems. Greenhouse gas (GHG) emissions This generally applicable indicator from the WBCSD includes the amount of GHG emissions into the air from fuel combustion, process reactions and treatment processes. It includes CO2, CH4, N2O, HFCs, PFCs and SF6, and is given in metric tons of CO2 equivalents (WBCSD 2000). The climate changes caused by the increasing concentrations of greenhouse gases are very important and are perhaps the most discussed environmental issue. Due to the ratification of the Kyoto protocol on the reduction of climate gases, climate challenges will probably be very much in focus in the next decade. Recycling systems will have GHG emissions, particularly from the
A method for eco-efficiency evaluation of recycling systems
23
collection and the recycling process. However, as in the case of net energy consumption, GHG emissions will be reduced when substituting virgin materials, other products or energy sources. GHG emissions will be dependent on the use of fossil fuels, which also will be an important contribution to the net greenhouse gas emissions. The reason why we suggest that both these indicators should be included among the generally applicable indicators is because energy consumption reflects the total energy account, while GHG emissions indicate the use of non-renewable fossil fuels. To make a more sustainable recycling system it is important to both reduce the use of energy in total and to shift from fossil fuels to renewable energy sources. These two indicators together focus on both aspects.
We recommend using greenhouse emissions as a generally applicable indicator for recycling systems.
To summarise, we suggest that the following indicators should be applied to quantify the eco-efficiency of recycling systems in general:
Value added - Total net costs
Environmental influence - % recycled - Emission of CO2 equivalents - Energy consumption
2.6.4 Step 3: Development of system-specific indicators
In some cases we need more information about environmental and economic challenges than the generally applicable indicators can give us. . In such case it is necessary to develop system-specific indicators for the defined recycling chain. To identify these indicators both the economic (value added) and environmental (impact) conditions of the system must be used. Using the WBCSD's (2000) work and experiences from the case studies described in Chapter 4, we suggest that the system-specific indicators for recycling systems should be: relevant, understandable, meaningful and useful for system oriented-oriented decision makers.
Additional system-specific indicators may be needed to evaluate the economic conditions of a recycling system:
- If the net cost indicator does not give full justification for the economic
efficiency of the system (e.g. alternative treatment cost is higher) - If a decision maker needs an alternative overview of the economic
picture in the system (e.g. subsidies, net profit, net turnover)

A method for eco-efficiency evaluation of recycling systems
24
Additional indicators on environmental influence may be needed:
- If there are other significant local, regional or global emissions into the air, water and ground from processes in the recycling chain (e.g. particles from transport)
- If the decision maker needs information on controversial or much debated aspects (e.g. emission of dioxin from incineration plant)
To develop the system-specific indicators, a thorough study of the
defined recycling system is needed. Important flows and emissions must be identified and analysed and conversations and research interviews with the actors in the recycling system should be carried out.
2.6.5 Step 3 in the case studies
Examination of the material flows and the opinions of actors and stakeholders have shown that there is a concern about toxic emissions from transport and particularly from the incineration plant in the system. We have therefore decided that an indicator should be developed for these aspects. We have chosen to apply the Human Toxicity Potential (HTP) indicator, which among other things includes emissions of heavy metals and dioxin (Hertwich 2001)
2.6.6 Step 4: Use of the indicators to quantify the eco-efficiency
In this step all the generally applicable and system-specific indicators should be used to quantify the eco-efficiency of current or possible future recycling systems.
As discussed in Chapter 2.2, eco-efficiency indicators can both be quantified as stand-alone economic and environmental indicators or as combination ratios of some of these indicators. At any rate, some kind of valuation between the indicators may have to be carried out to be able to make a decision based on the analysis. There is a debate going on in the LCA community as to the extent to which valuation between impact categories (indicators) should be included in the analysis (Hertwich 2000). The same problem emerges when quantifying the eco-efficiency of the recycling chain by means of the indicators developed. How should total net costs be valuated compared to emissions of CO2 equivalents? Or % recycling compared to emission of toxic emissions (HTP)? However, as a general rule, we propose that valuation between indicators into one single indicator should be avoided when carrying out an eco-efficiency analysis. By developing stand-alone or eco-efficiency ratio indicators the various eco-efficiency aspects are transparent for the decision maker who can hence
A method for eco-efficiency evaluation of recycling systems
25
make her own valuation dependent on what she considers to be the most important issue in each case. However, every indicator calculated should be taken into account. It should also be noted that the way results are summarized and presented may be crucial for the final decision. Results or figures from the eco-efficiency analysis of a recycling system can be presented in many ways, including tables, diagrams or compasses, see Chapter 5.
If the aim with the analysis is to compare or give an overview of current or possible future recycling systems, to choose the most preferable option, only Steps 1 to 4 are necessary. An example could be to carry out an analysis to agree upon the future recycling rate for plastic packaging within the European Union or within a municipality. If the goal, however, is to scrutinize a functioning system that you want to improve, then it is highly advisable to carry out the other steps as well.
Step 4 in the case studies:
See Chapter 5
2.6.7 Step 5: Development of company-specific indicators
In Steps 1-4 we have defined the recycling system and developed and applied indicators to evaluate the eco-efficiency of the entire recycling chain. Such an evaluation is important to give information to system-oriented decision makers, such as authorities and companies that are responsible for or concerned about larger parts of the recycling chains. Usually, however, a recycling chain consists of several actors/companies with various interests that do not necessarily have a system perspective. Since these actors are the prime movers of change in the recycling system, it is necessary to transfer results from the eco-efficiency evaluation of the recycling system to understandable company-specific indicators at the company level. These indicators should be:
• Related to activities in the recycling chain that have the highest
contributions to the overall eco-efficiency of the recycling system, and at the same time
• have potential for a significant improvement As in the ISO 14031 standard for environmental performance evaluation
(REFISO), we suggest that the company-specific indicators could be both operational and management indicators.
To make the indicators as appropriate as possible for supporting decision making by actors/companies, such as designers, municipalities, sorting plants and recycling companies, we see it as an absolute necessity that the

A method for eco-efficiency evaluation of recycling systems
26
indicators are developed and tested in close collaboration with the current actors. Change potentials from both a short-term and long-term perspective will form the basis for developing the indicators. The following characteristics of the company-specific indicators are desired:
• Based on a technical, organizational or economic aspects within
the activities • Connected to one or more of the eco-efficiency indicators, see
the cause-effect chain in Chapter 2.5 • Understandable, relevant and meaningful for various decision
makers in the activities or organizations • Appropriate for both internal communication and decision
making and external reporting • Based as far as possible on information which is easily available
Step 5 in the case studies:
See Chapter 6
2.6.8 Step 6: Testing, implementation, measurement, reporting and action within the companies
This step has not be carried out or properly developed in this report. In its place we therefore present a similar work on sustainability performance indicators (SPIs) within the NORDEPE project (NORDEPE 2001):
Testing of the initial set of indicators is intended to reveal:
- how the SPIs have been perceived and understood - whether they have been useful for intended purposes - if they have provided the necessary information to the selected decision
makers To test the strategic indicators, an internal company workshop or
meeting with the relevant decision makers is suggested. Regarding the indicators for external communication, a dialogue with the external stakeholders is needed.
To collect results and experience from the testing period, formalised interviews may be used. Based on the original set of SPIs and experience gathered, a final set of SPIs is defined for use in the relevant decision and communication situations. Note that a set of SPIs may not be defined once and for all, but should be revised according to changing needs from strategic decision makers and external stakeholders or according to changing situations. SPIs may be used both within companies and for external benchmarking.

A method for eco-efficiency evaluation of recycling systems
27
A plan for implementation and modification procedures should be established by the project group. Full implementation should then be left to internal decision makers and the personnel responsible for reporting/communication.
Step 6 in the case studies:
This step has not been carried out.
2.7 Summary of eco-efficiency indicators and company specific indicators
In the table below we have summarized the various kinds of indicator that should be developed and applied when applying the eco-efficiency method.
Table 1: Summary of eco-efficiency indicators for recycling system and company-specific indicators
Indicator category
Measures/ indicates
Decision makers Characteristics of a good indicator
Indicator
Generally applicable eco-efficiency indicators for recycling system
Useful for measuring eco-efficiency of all recycling systems
System-oriented decision makers: local, national and regional govern-ments, “material companies”, pro-active companies
Based on industrial ecology and eco-efficiency, scienti-fically valid, relevant, under-standable and meaningful for decision makers
Total net costs, Emission of CO2 equivalents, Use of energy, % Recycled product or material
System-specific eco-efficiency indicators for recycling systems
Eco-efficiency of the particular recycling system analyzed
System-oriented decision makers: local, national and regional governments, pro-active companies
Give additional system information, understandable and meaningful for decision makers
Example: Human toxicity potential (HTP)
Company-specific indicators
Operational and management conditions within companies in the product or material system
Company and/or system-oriented decision makers: Activities, companies, actors within the particular recycling system analyzed
Related to the eco-efficiency indicators, under-standable and relevant for decision making
Examples: energy consumption at recycling company, % satisfied with source-separate facilities, degree of motivation at sorting plant etc.

29
3 PRODUCTION, COSTS AND EFFICIENCY – EXPANDING THE STATIC APPROACH
3.1 Introduction
The previous chapter presented the method for development and use of eco-efficiency indicators. In this chapter a different approach is outlined. We will now focus on one eco-efficiency indicator, namely the relationship between costs and the recycling rate. But since various stakeholders often seek information about financial and environmental issues that are related to recycling rates being higher or lower than the present time, we propose an alternative approach to the purely static method that was used in Chapter 2. An additional element is that in many cases we see that the data needed to construct the required information is absent. There is a lack of both cross-section and time-series data necessary for an estimation of the costs of a recycling system for other recycling rates than what has been observed up until now. Thus, if we want to investigate future systems we have to use the limited information at hand and combine it with theoretical knowledge.
As an approximation to a study of factors able to improve the eco-efficiency of recycling systems we want to examine what characterizes a cost-efficient recycling system. The grounds for analyzing the system with this methodology are based on two elements. First, the mix of input factors in the production processes changes when the technology, input of raw material (plastic packaging waste) or market conditions change. Such changes in the flow of energy and material can also be caused by the move from an atomized to a holistic industrial ecology approach to recycling systems, i.e. changing the objective functions in each process. Second, the marginal costs (both financially and environmentally) will change whenever there are changes in one or more of the upstream processes. So when assessing the environmental and economic impacts one should be aware of how the combinations of input factors, and hence the cost structure, are affected by both economic and physical changes inside and outside the system. This is especially important when analyzing different scenarios, as this often means major changes in the characteristics of the system.
An investigation of the cost efficiency associated with the production within a non-observed recycling system necessitates information about production functions, cost functions and optimization procedures. Costs and production can be defined both in a broad or narrow perspective, which allows a cost-efficient solution to comprise efficiency at both the micro and macro level, and allows for a range of different impacts. Inclusion of externalities in general and environmental externalities especially will

Production, costs and efficiency – expanding the static approach
30
therefore result in a cost function relevant for society rather than just the production facilities1.
3.2 Costs
Costs should reflect the foregone utility, or profit, of using scarce resources in a certain process, which can be fixed or variable, i.e. they can be independent or they can be a function of the production level. This dependency is related to the time horizon of the decision-making problem. In the long run, even the building of factory plants represents variable costs, whereas in a very short time perspective, even labor costs are fixed due to labor contracts. A cost function expresses the relationship between costs and the amount and prices of input factors used in a process. For a production plant i, the typical cost function, is given as
iii rKwLc +=
where w is the wage rate, r is the capital cost, and Li and Ki are the amount of labor and capital employed in the production process2. Pollution caused by the production process is a cost for society, which often appears to be ignored by the producers. These kinds of external costs should be included in the cost function in order to express all costs associated with the production of a given product:
iiii ErKwLc τ++=
where Ei can be emissions from factory i and τ a vector reflecting the damage per unit from different types of emissions. By including damage in monetary terms based on various cost-assessment methods, one is able to compare the utility from the economic activity to the costs for society associated with production and consumption of the good (Econ, 2000). Subsidizing a recycling system can hence be justified as long as the market mechanisms fail to include the societal net gain from this kind of activity.
In this report no attempts have been made to assess the total environmental costs in monetary terms. We only include costs associated directly with the processes, which of course can be taken as a shortcoming in
1 An externality is present when a person (or a firm) unintentionally affects another
person’s level of utility and where the affected party is neither compensated for this effect nor has any influence on the behavior of the person causing the externality. The external effect can be positive as well as negative.
2 Costs associated with transport are left out of the model since evidence indicates that it is relatively easy to optimize this activity within a reasonably sized system (Avfallsseksjonen, 2001).
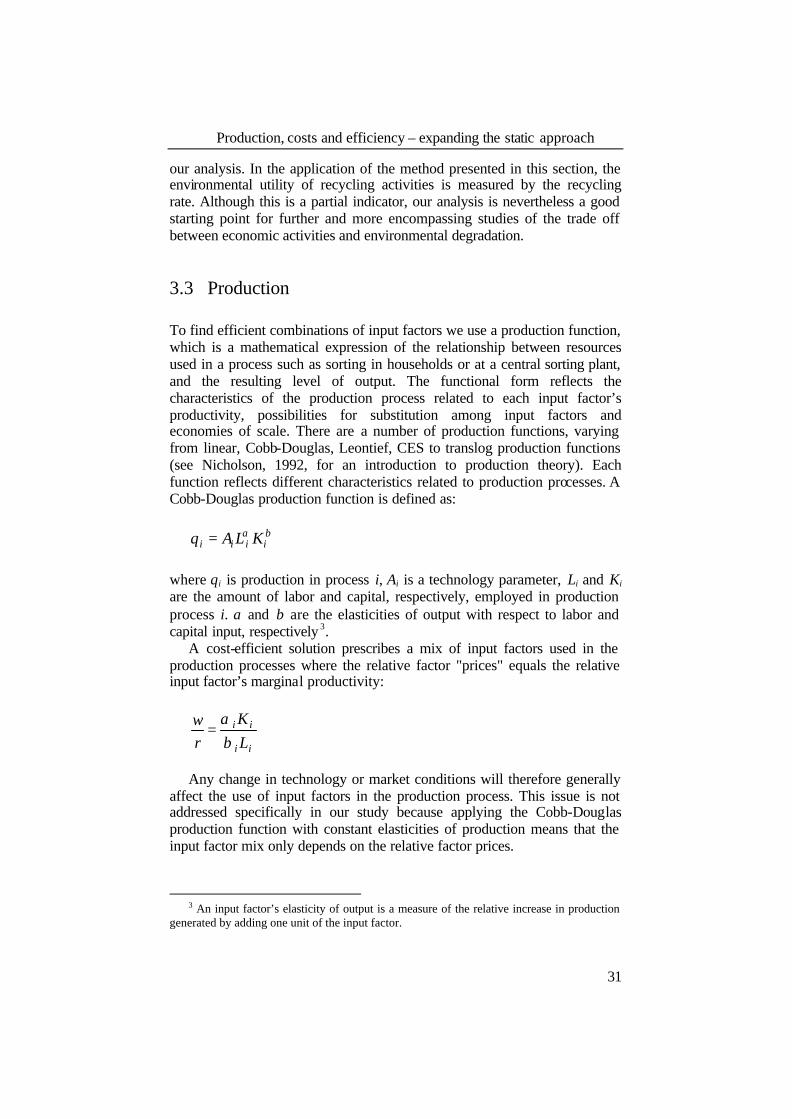
Production, costs and efficiency – expanding the static approach
31
our analysis. In the application of the method presented in this section, the environmental utility of recycling activities is measured by the recycling rate. Although this is a partial indicator, our analysis is nevertheless a good starting point for further and more encompassing studies of the trade off between economic activities and environmental degradation.
3.3 Production
To find efficient combinations of input factors we use a production function, which is a mathematical expression of the relationship between resources used in a process such as sorting in households or at a central sorting plant, and the resulting level of output. The functional form reflects the characteristics of the production process related to each input factor’s productivity, possibilities for substitution among input factors and economies of scale. There are a number of production functions, varying from linear, Cobb-Douglas, Leontief, CES to translog production functions (see Nicholson, 1992, for an introduction to production theory). Each function reflects different characteristics related to production processes. A Cobb-Douglas production function is defined as:
βαiiii KLAq =
where qi is production in process i, Ai is a technology parameter, Li and Ki are the amount of labor and capital, respectively, employed in production process i. α and β are the elasticities of output with respect to labor and capital input, respectively 3.
A cost-efficient solution prescribes a mix of input factors used in the production processes where the relative factor "prices" equals the relative input factor’s marginal productivity:
ii
ii
LK
rw
βα
=
Any change in technology or market conditions will therefore generally
affect the use of input factors in the production process. This issue is not addressed specifically in our study because applying the Cobb-Douglas production function with constant elasticities of production means that the input factor mix only depends on the relative factor prices.
3 An input factor’s elasticity of output is a measure of the relative increase in production
generated by adding one unit of the input factor.

Production, costs and efficiency – expanding the static approach
32
3.4 Inclusion of the mass balance
By combining production functions with cost functions we are able to express how the level of production affects the level of costs in a certain production process. Together with an objective function and an optimizing procedure we can derive conditions for efficiency. Note, however, that when using a systems perspective we must be aware of the law of mass conservation that interlinks each of the processes. The amount of a product leaving the system can never exceed the outflow of the first process, and the cost curves of each process are therefore endogenously determined4. If we let q1, q2, q3 represent the output from household sorting, central sorting and the material recycler, respectively, while we let q0 represent the amount of potentially recyclable waste, and I0, I1, I2 represent the residual from each process that goes to incineration, a simple system can be illustrated as:
Figure 5 Material flow in a simplified system
In this system the following must hold:
1cb,a,0 ,cqq ,bqq ,aqq 231201 ≤<===
The recycling rate in the system is hence given as
abcq
abcqqq
R0
0
0
3 ===
The link between production and efficiency in each process works
through the marginal cost, which rises when the level of (material) production comes close to the level of material input. In other words, it
4 Endogenously determined means determined within the model.
Householdsorting
Central sorting
Materialrecycler
Incineration
Potentiallyrecyclable waste
q1q0 q2 q3
I1 I2
I0
0aq= 1bq= 2cq=
0)1( qa−= 1)1( qb−=

Production, costs and efficiency – expanding the static approach
33
becomes increasingly more costly to produce the next unit as we move closer to the upper limit for the production level, which is given from the upstream processes5. But since the upper limit is given outside the process, we must let the production function in each process be dependent on the material input from the upstream process. In this way we are able to include the mass balance aspect within our model:
0m ,qmM where,KLMAq i1iiiiiiii >== −γβα
Specifying the production function like this makes the marginal costs a function of the production level in the upstream process, which consequently influences the recycling rate of the system:
( )
=
∂∂
−
−αβγ
α
α /1
i1iii
1/1i
ii
i
KqmA
wq
1qC
An increase in the upstream production level reduces the marginal cost of
the downstream process for any given level of production:
01
<
∂∂
∂∂
− i
i
i qC
q
This is illustrated in Figure 6 where there are two alternative production
levels in process number 1 (A and B), which determine two different cost curves in process number 2. Next we see that the production decision in process number 2 influences the efficient level of production in the last process, and hence the system’s recycling rate6.
5 The characteristics of the cost function will also depend on the time perspective. A
longer time horizon makes it easier to adjust to the material constraint. 6 Assumes constant marginal costs in the incineration sector.

Production, costs and efficiency – expanding the static approach
34
Figure 6 Illustration of the relationship between costs and mass balance
Illustration of system-internal externalities. A and B are different (exogenous) levels of production in process number 1 (household sorting). The maximum obtainable output in the downstream process (central sorting) must therefore equal the output in the upstream process. The efficiency in process number 2 is hence affected by the quantity and quality of the material input. Given a certain optimization procedure in each process we see that the total output in the system is increased for higher output levels in the first process. The main finding is therefore that
Unit or marginal cost
°
°
A
°
aAbAq0=q2A q0
Unit or marginal cost
Unit or marginal cost
°
°
°
Process no. 2(central sorting)
Process no. 3(material recycler)
q0q
q
q
Process no. 1(household sorting)
aAq0=q1A
aAbAcAq0=q3A
A2
A3
Unit or marginal cost
°
°
B
B2
°
Unit or marginal cost
Unit or marginal cost
°
°
Process no. 2(central sorting)
Process no. 3(material recycler)
B3
q0 q
Process no. 1(household sorting)
qaBq0=q1B
aBbBq0=q2B q0
° qaBbBcBq0=q3
B
Production, costs and efficiency – expanding the static approach
35
the efficiency of the system depends on the mass balance conditions throughout the system.
The production levels leading to efficiency for the individual processes
and for the whole system may differ. The production level that maximizes the efficiency of the whole system is found where the marginal cost of moving away from the individually optimal level in one process equals the marginal gain from this adjustment elsewhere in the system. Unless there are side payments, the willingness of the decision makers in each process to act to the best of the system depends negatively on the magnitude of this difference.
The ability to adjust to the material input from upstream processes improves as the available time to adjust increases. So modeling short- and long-run scenarios differs not only with respect to the extent of adjusting fixed input factors, but also to the degree of internalizing the law of mass conservation.
We have hence demonstrated that the efficiency of the system is closely connected to the material flow through the same system. Note that not only the financial efficiency depends on the mass balance constraints, the environmental profile of the system also does. As the manager of a process experiences changes in prices or the material input, she would change the level of production. Generally this means that the mix of input factors will also change, which implies a different flow of material and energy through the system and thus influences the overall recycling rate in the system. The finding is therefore that without certain qualifications, a static analysis such as LCA and a cost-benefit analysis will not be able to analyze recycling rates other than rates that have been observed empirically.
3.5 Optimization
Finding the efficient solution necessitates optimization. The optimizing procedure consists of minimizing or maximizing an objective function, for instance average costs, subject to mass balance constraints and calibrated parameters. The objective function as well as the mass balance conditions must reflect the system boundaries, and include important variables and parameters that have impact on the outcome of the optimizing procedure.
According to the law of mass conserva tion, we have shown that a cost curve for the total system will consist of one curve for all possible sorting rates in the household sector combined with different production levels in the downstream processes. Estimation of the cost curve for the total system for varying degrees of the household sorting level must therefore be based on the following procedure:
First, the proper production functions must be chosen.
Production, costs and efficiency – expanding the static approach
36
Second, we must model the links between each process based on the mass balance constraints, which can be expressed by the combination of an efficiency parameter and a variable reflecting the level of material input. This is done simultaneously with the calibration of the other parameters in each process that is not determined by data, and Third, the level of production must be determined by some production rule based on optimization of an objective function (individual or for the system).
The method outlined in this section uses well-known tools that we
combine and apply to solve a “new” problem: recycling systems. As will be demonstrated later, the two alternative ways of modeling the role of the first sector reveal interesting, but to some degree different, mechanisms.
37
4 DESCRIPTION OF THE RECYCLING SYSTEMS FOR PLASTIC PACKAGING
4.1 Introduction
In this chapter we will present the case studies applied to develop the methods for environmental and economic evaluation of recycling systems shown in Chapters 2 and 3. Furthermore, the results from the analyzed case studies, given as quantification of eco-efficiency in Chapters 5 and 6, is important as an input for the greater understanding of the different collection and recycling options. This again will provide knowledge on how to create better recycling systems for the future. Step 1 in the method from Chapter 2.5 is carried out in this chapter.
We choose to look at recycling of plastic packaging from households because this is considered a difficult and complex fraction. An increasing amount of household packaging is plastic, and the choice of treatment options for this fraction has been controversial (see Chapter 1.3). It is regarded as important to have a comprehensive foundation of data and to test various types of collection systems, thus the following two recycling systems will be examined:
1) The deposit system for one-way PET bottles, collected mainly through
reverse vending machines in stores. 2) Source separation system for mixed plastic packaging. Plastic packaging
in this system is collected in two different ways: through an igloo bring scheme and curbside.
Norway’s third largest city, Trondheim, with a population of 147,000,
will serve as the empirical basis for quantification of eco-efficiency. By choosing one geographical urban area we obtain more specific input data and an understanding which nonetheless is still considered representative for larger populated areas in Norway. Figure 7 shows the flow of all generated plastic packaging from households in Trondheim. The thickness of the arrows indicates the volume of each flow, in addition to indicating transport between each process. Each branch of the figure is more closely described in the following sub-chapters. Incineration is the alternative waste management option in Trondheim, and will therefore be part of all solutions described below. We will also show what the system looked like before source separation was introduced in 1999. At that time a mix of all household waste was incinerated.
According to Plastretur, the amount of plastic packaging generated in households is 12.5kg/ person per year (Raadal et al. 1999). Of this amount,
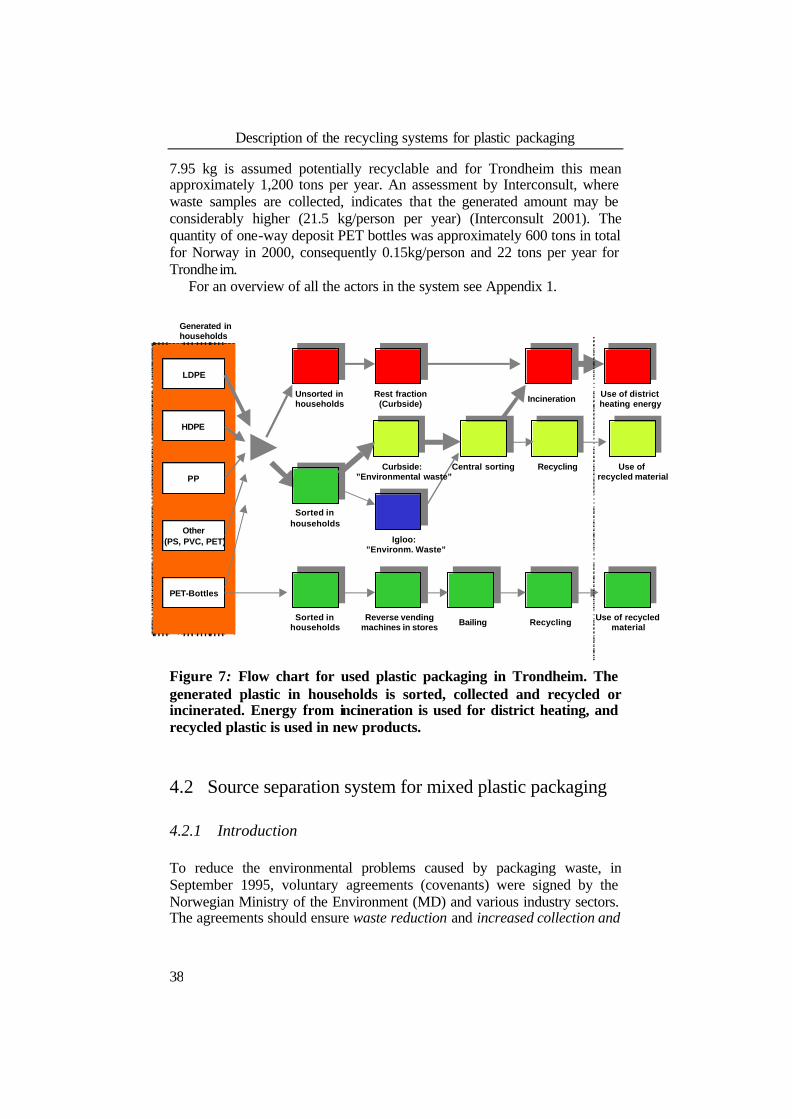
Description of the recycling systems for plastic packaging
38
7.95 kg is assumed potentially recyclable and for Trondheim this mean approximately 1,200 tons per year. An assessment by Interconsult, where waste samples are collected, indicates that the generated amount may be considerably higher (21.5 kg/person per year) (Interconsult 2001). The quantity of one-way deposit PET bottles was approximately 600 tons in total for Norway in 2000, consequently 0.15kg/person and 22 tons per year for Trondheim.
For an overview of all the actors in the system see Appendix 1.
Figure 7: Flow chart for used plastic packaging in Trondheim. The generated plastic in households is sorted, collected and recycled or incinerated. Energy from incineration is used for district heating, and recycled plastic is used in new products.
4.2 Source separation system for mixed plastic packaging
4.2.1 Introduction
To reduce the environmental problems caused by packaging waste, in September 1995, voluntary agreements (covenants) were signed by the Norwegian Ministry of the Environment (MD) and various industry sectors. The agreements should ensure waste reduction and increased collection and
LDPE
PET-Bottles
PP
HDPE
Reverse vendingmachines in stores Bailing Recycling
Igloo: ”Environm. Waste”
Rest fraction (Curbside) Incineration
Curbside: ”Environmental waste”
Central sorting Recycling
Other (PS, PVC, PET)
Generated inhouseholds
Unsorted in households
Sorted in households
Sorted in households
Use of recycled material
Use of district heating energy
Use of recycled material

Description of the recycling systems for plastic packaging
39
recovery in the packaging chains. The agreement between MD and the plastic-packaging industry states that 80% of the plastic -packaging waste shall be recovered, with a minimum of 30% going to material recovery (MD 1995).
Plastretur AS, the material company for plastic packaging, is responsible for the development and organization of collection and recovery to reach the goal in the covenant. According to the agreement, Plastretur is responsible for finding the solutions that reach the goals with the lowest possible costs. Collection and recovery are financed through compensation from importers and “fillers and packers” (companies that use plastic packaging). The compensation in 2001 stands at NOK 1.70 per kg. In 2000 78% of the plastic was recovered, of this, 19% was recycled to new products and 59% was energy recovered. Note, however, that this includes other sources than household packaging. Industry packaging, such as agricultural plastic and reusable beverage crates, is easier to collect and recycle, and has higher recycling rates (www.plastretur.no).
The support from Plastretur to the actors for source separation, collection and recycling is (Schefte 2001):
• Operation of appropriate plastic -packaging source separation systems:
1100 NOK/ton potentially recyclable plastic packaging in households • Sorting of bottles and cans (sorted into fractions of HDPE, PP and PS):
3500 NOK/ton accepted for recycling • Sorting of bottles and cans (not sorted into material fractions): 2500
NOK/ton accepted for recycling • Sorting of foil (LDPE): 1600 NOK/ton accepted for recycling • Sorting for energy recovery: 500 NOK/ton accepted for energy recovery
(with high energy utilization) • Recycling: 1450 NOK/ton for sold product made of foil, 0 NOK/ton for
recycled products from bottles and cans Even though the actual costs of covering necessary waste management
might be more than 1700 NOK/ton, Plastretur has no plans at the moment to increase the fee.
Different solutions for the collection of plastic packaging in households have been introduced to fulfill this agreement, and each municipality in Norway may choose their own collection system.
4.2.2 Rest fraction going to incineration
Until 1999 all municipal waste in Trondheim, including plastic packaging, was collected in one curbside “rest-fraction” bin, and then incinerated, see Figure 8. Even though curbside bins for paper and environmental waste have now been introduced, a quite high percentage of potentially recyclable
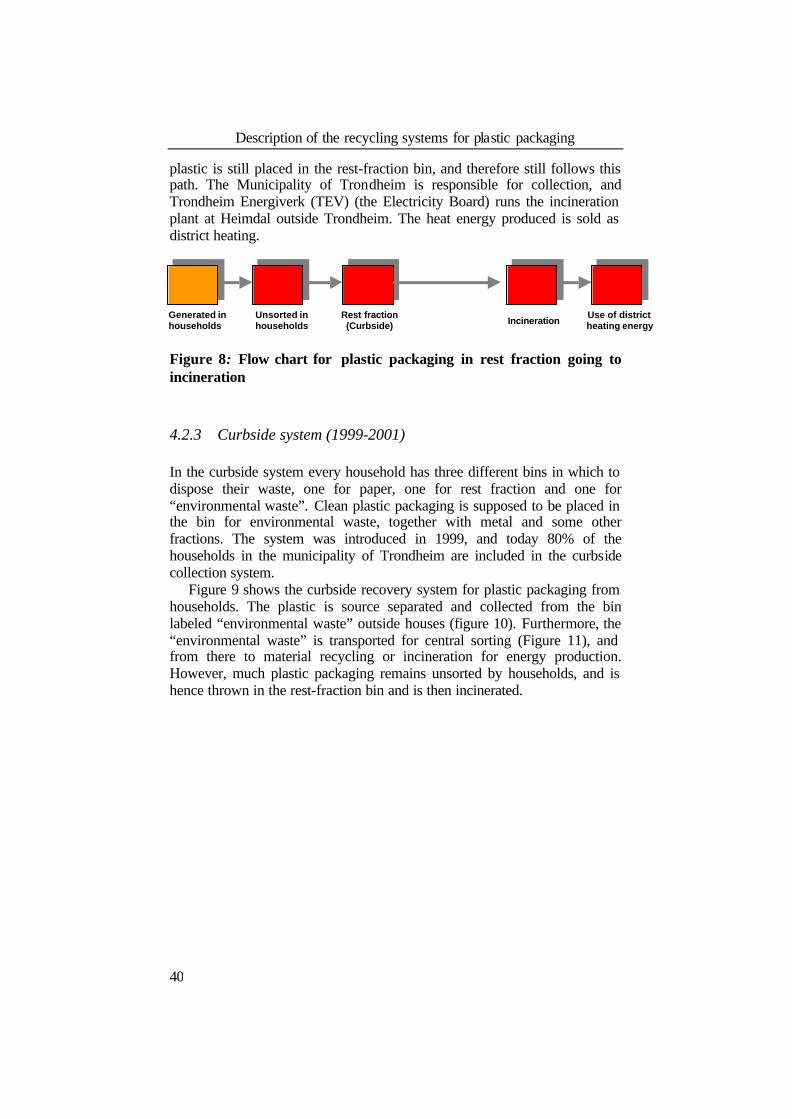
Description of the recycling systems for plastic packaging
40
plastic is still placed in the rest-fraction bin, and therefore still follows this path. The Municipality of Trondheim is responsible for collection, and Trondheim Energiverk (TEV) (the Electricity Board) runs the incineration plant at Heimdal outside Trondheim. The heat energy produced is sold as district heating.
Figure 8: Flow chart for plastic packaging in rest fraction going to incineration
4.2.3 Curbside system (1999-2001)
In the curbside system every household has three different bins in which to dispose their waste, one for paper, one for rest fraction and one for “environmental waste”. Clean plastic packaging is supposed to be placed in the bin for environmental waste, together with metal and some other fractions. The system was introduced in 1999, and today 80% of the households in the municipality of Trondheim are included in the curbside collection system.
Figure 9 shows the curbside recovery system for plastic packaging from households. The plastic is source separated and collected from the bin labeled “environmental waste” outside houses (figure 10). Furthermore, the “environmental waste” is transported for central sorting (Figure 11), and from there to material recycling or incineration for energy production. However, much plastic packaging remains unsorted by households, and is hence thrown in the rest-fraction bin and is then incinerated.
Rest fraction (Curbside) Incineration
Generated inhouseholds
Unsorted in households
Use of district heating energy

Description of the recycling systems for plastic packaging
41
Figure 9: Curbside flow chart for plastic packaging
Characteristics of the system: Part of the plastic packaging is not source separated in the proper way. This means not cleaned and placed in plastic bags before being placed in the bin,
or placed in the wrong bin. Nevertheless, the collection rate has increased from 36% in 1999 to 83% in 2001 (based on 7.95 kg potentially recyclable generated per household per year).
Figure 10: Curbside bins in Trondheim
Partly due to poor sorting in households, and at central sorting station, only minor amounts are actually recycled (5-15%). However, the market for the recycled products in the system is good. LDPE is mixed with paper and made into pallet blocks. PP and HDPE is sorted and recycled through a process of shredding, washing and extruding and made into granulate (pellets). The pellets can be used in a variety of products. See igloo bring scheme Chapter 4.2.4, for pic tures of recycled products. The system is strongly subsidized by the national material company, “Plastretur”.
Generated inhouseholds
Rest fraction (Curbside) Incineration Unsorted in
households
Sorted in households
Use of district heating energy
Curbside: ”Environmental waste”
Central sorting Recycling Use of recycled material

Description of the recycling systems for plastic packaging
42
Figure 11: Central sorting
4.2.4 Igloo bring scheme (2001)
The igloo bring scheme was introduced in 2000 for the most densely populated area in the inner city of Trondheim. The only difference between this option and the curbside system is that the inhabitants have to bring the plastic packaging at a distance of a maximum of 200m at an igloo point, where containers for environmental waste and paper are situated. The reason for selecting two different collection solutions in Trondheim is the lack of space for placing curbside containers outside each household in the city center. See Figure 12 and Figure 13 for flow chart and picture.
Figure 12: Igloo flow chart for plastic packaging
In this solution, the same characteristics are present as for the curbside solution, even though the system is quite new. However, it appears that people bring less (collection rate of 26%) but better quality plastic at the igloos compared to the curbside system. Moreover, less other waste is put
Generated inhouseholds
Rest fraction (Curbside)
Incineration Unsorted in households
Sorted in households
Use of district heating energy
Central sorting Recycling Use of recycled material
Igloo: ”Environm. Waste”

Description of the recycling systems for plastic packaging
43
into the “environmental container”. The recycling rate for 2001 is approximately 5%.
Figure 13: Igloos for “environmental waste” and paper in Trondheim
Figure 14: Recycled products: Pallets blocks made of plastic film/foil and paper, and HÅG chair made of PP granulate
4.3 Deposit system for one-way PET bottles
4.3.1 Introduction
Beverage packaging comes under regulations laid down by the Norwegian Ministry of the Environment. The Norwegian Pollution Control Authority (SFT) is the executive body and can approve the establishment of deposit
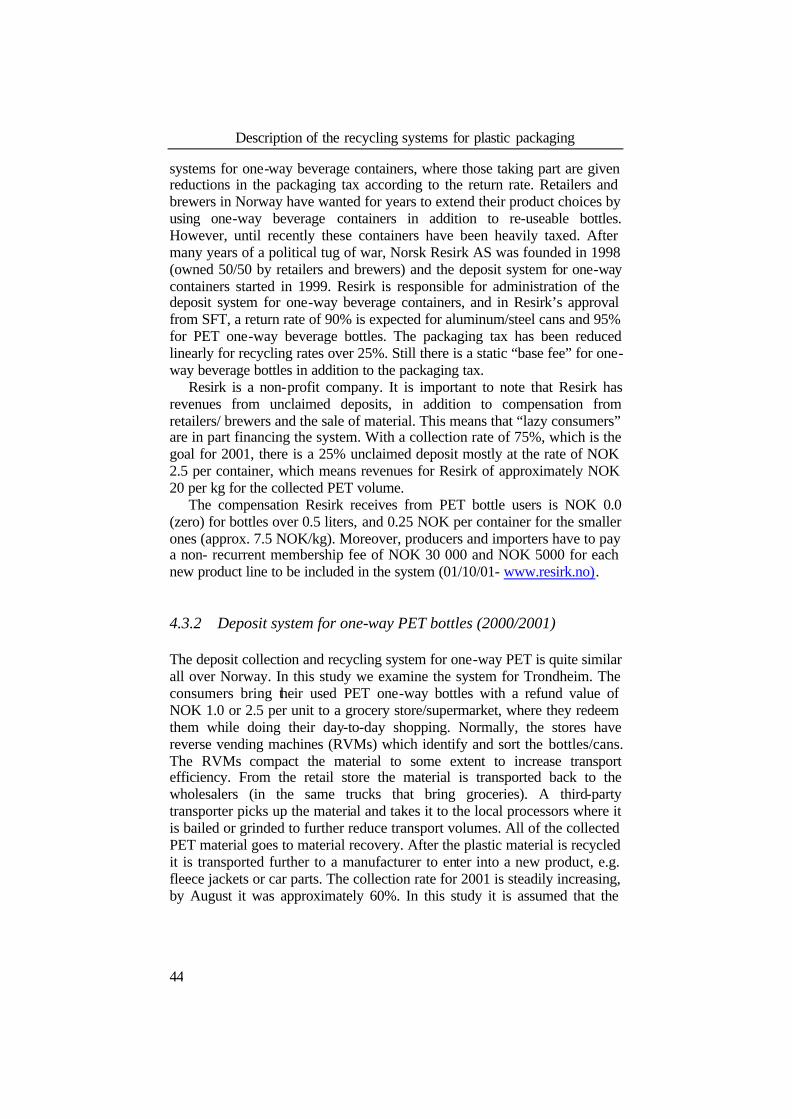
Description of the recycling systems for plastic packaging
44
systems for one-way beverage containers, where those taking part are given reductions in the packaging tax according to the return rate. Retailers and brewers in Norway have wanted for years to extend their product choices by using one-way beverage containers in addition to re-useable bottles. However, until recently these containers have been heavily taxed. After many years of a political tug of war, Norsk Resirk AS was founded in 1998 (owned 50/50 by retailers and brewers) and the deposit system for one-way containers started in 1999. Resirk is responsible for administration of the deposit system for one-way beverage containers, and in Resirk’s approval from SFT, a return rate of 90% is expected for aluminum/steel cans and 95% for PET one-way beverage bottles. The packaging tax has been reduced linearly for recycling rates over 25%. Still there is a static “base fee” for one-way beverage bottles in addition to the packaging tax.
Resirk is a non-profit company. It is important to note that Resirk has revenues from unclaimed deposits, in addition to compensation from retailers/ brewers and the sale of material. This means that “lazy consumers” are in part financing the system. With a collection rate of 75%, which is the goal for 2001, there is a 25% unclaimed deposit mostly at the rate of NOK 2.5 per container, which means revenues for Resirk of approximately NOK 20 per kg for the collected PET volume.
The compensation Resirk receives from PET bottle users is NOK 0.0 (zero) for bottles over 0.5 liters, and 0.25 NOK per container for the smaller ones (approx. 7.5 NOK/kg). Moreover, producers and importers have to pay a non- recurrent membership fee of NOK 30 000 and NOK 5000 for each new product line to be included in the system (01/10/01- www.resirk.no).
4.3.2 Deposit system for one-way PET bottles (2000/2001)
The deposit collection and recycling system for one-way PET is quite similar all over Norway. In this study we examine the system for Trondheim. The consumers bring their used PET one-way bottles with a refund value of NOK 1.0 or 2.5 per unit to a grocery store/supermarket, where they redeem them while doing their day-to-day shopping. Normally, the stores have reverse vending machines (RVMs) which identify and sort the bottles/cans. The RVMs compact the material to some extent to increase transport efficiency. From the retail store the material is transported back to the wholesalers (in the same trucks that bring groceries). A third-party transporter picks up the material and takes it to the local processors where it is bailed or grinded to further reduce transport volumes. All of the collected PET material goes to material recovery. After the plastic material is recycled it is transported further to a manufacturer to enter into a new product, e.g. fleece jackets or car parts. The collection rate for 2001 is steadily increasing, by August it was approximately 60%. In this study it is assumed that the

Description of the recycling systems for plastic packaging
45
remaining part goes into rest fraction at households and is thereafter incinerated.
Figure 15: Reverse vending machine in supermarket
Two important characteristics of the system are high recycling rate and high quality material output. The system is new and thus the total volume of PET is very low. This leads to high administration costs.
GeneratedPET inhouseholds
Rest fraction (Curbside) Incineration
Unsorted in households
Use of district heating energy
Reverse vendingmachines in stores Bailing Recycling
Sorted in households
Use of recycled material
Figure 16: Flow chart for deposit system for PET bottles

Description of the recycling systems for plastic packaging
46
4.4 Future systems
4.4.1 Introduction
In Chapter 5, we have found that the plastic recycling systems of today are far from good enough. This relates especially to recycling rates and cost. In Chapter 5.5, the importance of consumer participation and high sorting rates in the early phases is emphasized. In this sub-chapter we will present two collection-system “scenarios“ which will be analyzed further in Chapter 7. The first, “Plastic Bag”, is based on a collection solution that is successfully running in municipalities in the Molde region of Norway today, and the other, “Intelligent Igloo”, is more of a future solution. Intelligent igloo is based on today’s igloo collection, combined with an innovative recognition, sorting and compacting technology from reverse vending machines (“Pantemaskiner”). This solution can include different incentive programs to increase participation.
4.4.2 Plastic bag
Plastic bag is a curbside collection solution, where consumers sort their plastic waste into a transparent plastic bag set up on a rack, see picture. The difference between this and the environmental-waste bin in Trondheim is that only plastic is sorted into it (e.g. metal has to go with glass in Igloos). It is probably easier to understand for the consumer, which is important for achieving high participation. The transparent bag and rack also help to prevent throwing other waste in the bag. This system is running in the Molde
region today, with a relatively high recycling rate, approximately 37%. Since this has been one of the more successful solutions in Norway, we have chosen to look more closely at it. In the “scenario” we replace the environmental-waste bin in Trondheim with the Molde plastic -bag solution, using the relatively high Molde collection and sorting rates. In addition to this, the data from the curbside 2001 system is applied in the quantification of eco-efficiency. The flow chart of the system will be similar to the Curbside 2001 flow chart (in Chapter 4.2.4).
Figure 17: Plastic-bag collection rack

Description of the recycling systems for plastic packaging
47
4.4.3 Intelligent igloo
Intelligent Igloo refers to a collection solution where the traditional sorting igloo is replaced by a more technology intensive Igloo with the ability to communicate with the consumer, recognize materials and colors, sort them,
and compact them to reduce transport need. These are features we know from reverse vending machines in stores, but the technology has to be developed much further and be more cost effective. This solution has been chosen due to the most important findings in Chapter 5: the importance of incentives for consumers and the possibility of early sorting.
Figure 18: Intelligent-igloo test center
Data is based on input from Tomra regarding the technology, and there is relatively high uncertainty connected to it. The administration and marketing costs of running consumer incentive programs are especially difficult to project. As for other solutions, this will probably require high information costs in the beginning, here assuming a more mature system.
We have assumed that HDPE and PP are sorted and compacted (grinded) with a volume reduction of a 1:10 factor, and LDPE compaction (not intelligent recognition) of a 1:2 factor. This means that only the LDPE fraction requires manual sorting. LDPE is reclaimed into granulate instead of “pallet blocks”. We have assumed a collection rate of 90%, which gives a recycling rate of 71.3%. The flow chart for the system will be similar to the Igloo 2001 (Chapter 4.2.4).
4.5 System borders, functional unit and assumptions
The system borders describe what is included in the study, and are together with the functional unit, which describes the performance or function of the system, important characteristics of the assessment. These should be noted if comparisons with other similar studies are to be carried out.
System borders in the assessment go from generated plastic in households to incineration or recycling with granulate/product output. The virgin material and energy that potentially can be replaced by recycled material, or recovered energy from plastic incineration, are included.

Description of the recycling systems for plastic packaging
48
This means, for instance, that production of virgin raw material for making the plastic packaging is not included in this study. It is important to note as well that we include only one cycle of recovery/recycling. When plastic is incinerated, the calorific value of the material is lost forever, but if recycled, the material can be energy recovered at the end of its next cycle.
Functional unit The selected functional unit for the recycling systems is: Handling and recycling/recovery of 1000 kg potentially recyclable used plastic packaging (HDPE/ LDPE/ PP and PET) generated in households.
This functional unit is chosen to give the full picture of the treatment of plastic packaging from households. We could, for example, have chosen production of one ton of recycled material as the functional unit, but in some of the systems only 5-10% is actually recycled. In such a case, there would be the danger that the functional unit would give a very narrow view, particularly, if it does not include what happens to the remaining 95%.
The selected functional unit implies that all the results are normalized and related to the1000 kg generated in households. If, for example, 90% of this plastic is incinerated and 10% is recycled, the result will reflect this distribution, and emissions/cost of incineration will have major impact on the result. Hence if the recycling includes a very high cost, as it only constitutes 10%, it still may not increase the total cost to any large extent.
According to Plastretur, the amount of plastic packaging generated in households is 12.5kg/ person per year (STØ REf). Of this amount 7.95 kg is assumed to be potentially recyclable (STØref). The non-recyclable plastic may be too dirty, made of composite material or too small pieces to handle. We use 7.95 kg as the basis for the functional unit in this assessment. The corresponding number for one-way deposit PET bottles is approximately 600 tons generated in total for Norway in 2000, consequently 0.15kg/ person per year.
The mix of household plastic is assumed to be 60% LDPE (film/foil), 25% HDPE and 15% PP (rigid containers), based on a sorting analysis (Interconsult, 2001) and figures on sold plastic (APME). This is a simplification, since there are other plastic materials in use as well. However, we assume that the other fractions are relatively small and hence can be included in the non-recyclable fraction, which means that this simplification will have minor consequences.
Tools, databases and data used The LCA Inventory Tool, version 3.0, developed by Chalmers Industriteknik, is used along with Excel to structure and analyze the collected data. Some data, such as emission for energy production, is taken from the database of LCAit. However, most data regarding volumes, pickup, sorting and recycling is collected from the source (1998-2001). Other data is

Description of the recycling systems for plastic packaging
49
taken from literature, for example for incineration (SFT-96). Detailed data tables, with assumptions and sources, are found in Appendix 3.
Important assumptions Ø We only look at the plastic material flow, which can lead to sub-
optimization in relation to other materials. In the curbside/igloo solution, plastic is collected in the same “environmental-waste” bin as metal, shoes and electronics. This implies that changes in plastic volumes and the way of collection may impact on other fractions (rest fraction, metal etc.)
Ø In relation to other fractions, allocations are based on mass – both for cost and environmental impact.
Ø In the sorting process, cost is related to the input mass (Note different in Chapter 7.2).
Ø For incineration of plastic, we use emissions for plastic separately (not average municipal waste), the same is done for heat value which gives the potential avoided energy.
Ø The avoided energy from energy-recovered plastic is assumed to be 75% light oil and 25% electricity from Hydropower. This is the mix that is actually used to supplement the recovered energy output in Trondheim. Since the heat values of plastic are based on its oil origin, it is considered appropriate that the main replacement is oil, although it could be argued that average Norwegian electricity would be the alternative for heating in most Norwegian homes.
Ø Regarding the avoidance of using virgin material by instead using recycled material, it is assumed that LDPE replaces wood when made into “pallet blocks”. For recycled PET, PP and HDPE granulate, we assume that it replaces 90% of the virgin material for PET, PP and HDPE. The 90% is supposed to reflect quality loss.
Ø For the PET deposit system, the collection rate (in 2000) was approximately 60%, and for this assessment it is assumed that the remaining 40% goes to rest fraction and to incineration.


51
5 EVALUATION OF ECO-EFFICIENCY FOR PLASTIC-PACKAGING RECYCLING SYSTEM
5.1 Introduction
In this chapter we will apply the analysis method shown in Chapter 2.6 (Step 4), and examine the eco-efficiency of the Trondheim source separation system for mixed plastic packaging and the deposit system for one-way PET bottles. See Chapter 4 for a description of both systems, including the different collection solutions, and a discussion of important assumptions about the assessment.
First, in Chapter 5.2, we will quantify the eco-efficiency of incineration, curbside 1999, 2000, 2001 and the igloo bring scheme 2001 for mixed plastic packaging from households. In Chapter 5.3 the eco-efficiency of the deposit system for one-way PET bottles will be quantified. Eco-efficiency is expressed by applying the following developed generally applicable and system-specific eco-efficiency indicators:
• Recycling rate (%) • Cost (NOK) • Energy consumption (MJ) • Global warming potential (kg CO2-eqv.) • Human toxicity potential (kg benzene eqv. and kg toluene eqv.)
In order to compare various life-cycle stages and solutions we will
present the results in a life-cycle diagram (only CO2 and net cost indicators), in tables and in eco-efficiency compasses (all indicators). A comparison of the different systems and solutions is shown in Chapter 5.4. Here we show the calculated eco-efficiency indicators for all the options in a table. The results in the table are given as both gross (e.g. cost) and net (e.g. net cost) values. The reason for showing both values is that there are normally two ways of evaluating the system, depending on where the system borders are placed:
• Gross: Cost and emissions from all processes from households to
recycling/recovery
• Net: Costs and emissions from all processes from households for use of recycled product and produced energy, where sale of/avoided energy and raw material production are included as economic and

Evaluation of eco-efficiency for plastic-packaging recycling system
52
environmental savings respectively . It is assumed that the products and energy from the recycling system are substitutes for the use of alternative virgin material and energy
To show the benefits of recovery and recycling we have chosen to use the
net values in the diagrams and compasses. One might argue that we also should have included the production of plastic -packaging material in the analysis, however, since this phase is similar in all options (except for PET), and since we are focusing on the recycling phase of the life cycle , we have omitted it here.
The significance of assumptions and variations of parameters for the curbside plastic -packaging system in 2001 is evaluated in a sensitivity analysis in Chapter 5.5.
5.2 Eco-efficiency evaluation of the recycling system for mixed plastic packaging
5.2.1 Incineration
Before source separation at households was established in 1999, the plastic packaging was sent directly together with other household waste to the incineration plant for energy recovery. As we can see from Figure 19, almost all emissions of CO2 equivalents, when converting used plastic packaging from households to energy, arise from the incineration plant. However, a large part of these emissions are equalized due to the substitution of avoided alternative energy production from 75% oil and 25% hydro power (see Chapter 4.5).
-2000
-1500
-1000
-500
0
500
1000
1500
2000
kg C
O2
eqv.
/to
nn
pla
stic
g
ener
ated
in h
ou
seh
old
s
Household Totaltransport
Sorting Recycling Avoidedraw
mat.prod.
Incineration Avoidedenergyprod.
Total
Global warming potential - Incineration, Curbside and Igloo
Incinerationbefore 1999Curbside 1999
Curbside 2000
Curbside 2001
Igloo 2001
Figure 19: Emission of CO2 equivalents for mixed plastic packaging solutions
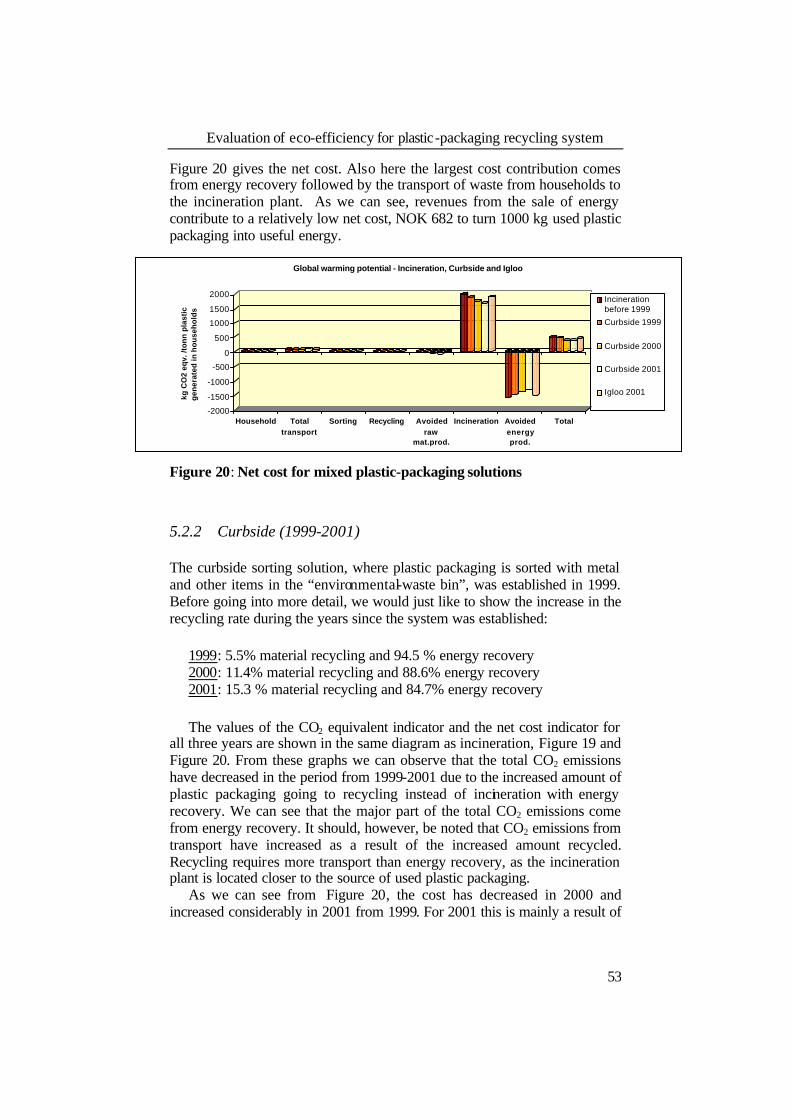
Evaluation of eco-efficiency for plastic-packaging recycling system
53
Figure 20 gives the net cost. Also here the largest cost contribution comes from energy recovery followed by the transport of waste from households to the incineration plant. As we can see, revenues from the sale of energy contribute to a relatively low net cost, NOK 682 to turn 1000 kg used plastic packaging into useful energy.
-2000
-1500
-1000
-500
0
500
1000
1500
2000
kg C
O2
eqv.
/to
nn
pla
stic
g
ener
ated
in h
ou
seh
old
s
Household Totaltransport
Sorting Recycling Avoidedraw
mat.prod.
Incineration Avoidedenergyprod.
Total
Global warming potential - Incineration, Curbside and Igloo
Incinerationbefore 1999
Curbside 1999
Curbside 2000
Curbside 2001
Igloo 2001
Figure 20: Net cost for mixed plastic-packaging solutions
5.2.2 Curbside (1999-2001)
The curbside sorting solution, where plastic packaging is sorted with metal and other items in the “environmental-waste bin”, was established in 1999. Before going into more detail, we would just like to show the increase in the recycling rate during the years since the system was established:
1999: 5.5% material recycling and 94.5 % energy recovery 2000: 11.4% material recycling and 88.6% energy recovery 2001: 15.3 % material recycling and 84.7% energy recovery
The values of the CO2 equivalent indicator and the net cost indicator for
all three years are shown in the same diagram as incineration, Figure 19 and Figure 20. From these graphs we can observe that the total CO2 emissions have decreased in the period from 1999-2001 due to the increased amount of plastic packaging going to recycling instead of incineration with energy recovery. We can see that the major part of the total CO2 emissions come from energy recovery. It should, however, be noted that CO2 emissions from transport have increased as a result of the increased amount recycled. Recycling requires more transport than energy recovery, as the incineration plant is located closer to the source of used plastic packaging.
As we can see from Figure 20, the cost has decreased in 2000 and increased considerably in 2001 from 1999. For 2001 this is mainly a result of

Evaluation of eco-efficiency for plastic-packaging recycling system
54
the introduction of an extra sorting step at a central sorting plant and the fact that more material is sorted due to higher collection rates. Increased costs in the recycling stage but also higher revenues from sale of material are a result of growing recycling rates.
In the following, each step in the graphs will be explained in more detail:
Household: The environmental load here is low due to the assumption that no hot water is used to clean the packaging (see Chapter 5.5 for sensitivity on this). Household related costs are low as well due to the relatively low investment cost for outside collection bins.
Administration and marketing: The information needed and other overhead costs at the municipality of Trondheim (Trondheim Kommune) make a considerable contribution to the total cost of the system.
Total transport: Includes pick up at houses, transport to sorting, energy recovery and recycling. This contributes to some extent to environmental load, but more to the cost picture. The high collection cost is especially important here.
Sorting: Low environmental load due to the small amount of energy needed. Sorting costs are high, however, as a large volume is sorted directly to rest fraction by households (which goes directly to energy recovery), thus the sorting cost does not contribute so much to the total cost. The exception is curbside 2001, with two sorting steps, which makes it very expensive.
Recycling: LDPE is mixed with paper and ”pallet blocks” are produced, HDPE and PP are sorted, shredded, washed and melted/extruded to pellet raw material. These processes have a relatively high cost and energy use, but as for sorting, they do not contribute so much to the total result.
Energy recovery: High CO2 emissions, toxic heavy metals and dioxins contribute to HTP. High volume and medium cost give a high cost contribution.
Avoided raw material production and sale of recycled material: Since only a small fraction of the plastic is actually recycled, the avoided raw material production does not give a very high environmental gain. However, as the recycling rate increases we see that sale of material can become an important source of revenue.
Avoided energy production/sale of recovered energy: We see that both avoided energy production and sale of energy are important contributors for the result on CO2 and cost respectively.
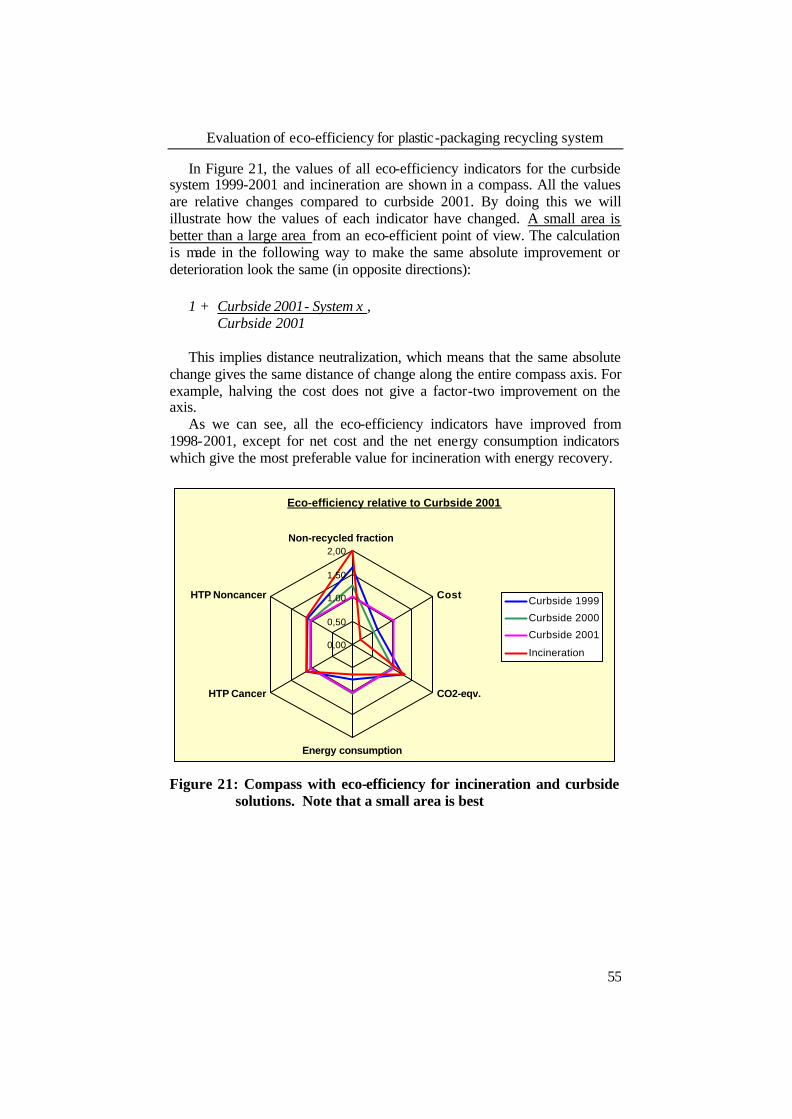
Evaluation of eco-efficiency for plastic-packaging recycling system
55
In Figure 21, the values of all eco-efficiency indicators for the curbside system 1999-2001 and incineration are shown in a compass. All the values are relative changes compared to curbside 2001. By doing this we will illustrate how the values of each indicator have changed. A small area is better than a large area from an eco-efficient point of view. The calculation is made in the following way to make the same absolute improvement or deterioration look the same (in opposite directions):
1 + Curbside 2001- System x , Curbside 2001 This implies distance neutralization, which means that the same absolute
change gives the same distance of change along the entire compass axis. For example, halving the cost does not give a factor-two improvement on the axis.
As we can see, all the eco-efficiency indicators have improved from 1998-2001, except for net cost and the net energy consumption indicators which give the most preferable value for incineration with energy recovery.
Eco-efficiency relative to Curbside 2001
0,00
0,50
1,00
1,50
2,00Non-recycled fraction
Cost
CO2-eqv.
Energy consumption
HTP Cancer
HTP Noncancer Curbside 1999
Curbside 2000
Curbside 2001
Incineration
Figure 21: Compass with eco-efficiency for incineration and curbside
solutions. Note that a small area is best
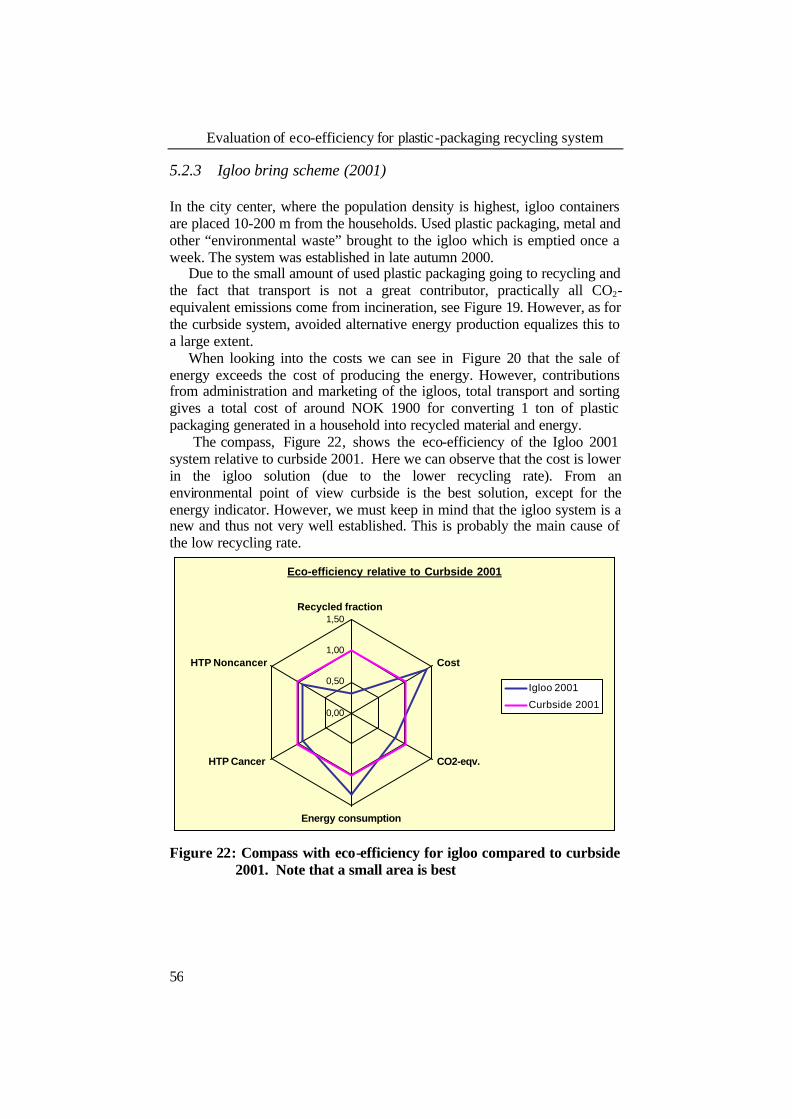
Evaluation of eco-efficiency for plastic-packaging recycling system
56
5.2.3 Igloo bring scheme (2001)
In the city center, where the population density is highest, igloo containers are placed 10-200 m from the households. Used plastic packaging, metal and other “environmental waste” brought to the igloo which is emptied once a week. The system was established in late autumn 2000.
Due to the small amount of used plastic packaging going to recycling and the fact that transport is not a great contributor, practically all CO2-equivalent emissions come from incineration, see Figure 19. However, as for the curbside system, avoided alternative energy production equalizes this to a large extent.
When looking into the costs we can see in Figure 20 that the sale of energy exceeds the cost of producing the energy. However, contributions from administration and marketing of the igloos, total transport and sorting gives a total cost of around NOK 1900 for converting 1 ton of plastic packaging generated in a household into recycled material and energy.
The compass, Figure 22, shows the eco-efficiency of the Igloo 2001 system relative to curbside 2001. Here we can observe that the cost is lower in the igloo solution (due to the lower recycling rate). From an environmental point of view curbside is the best solution, except for the energy indicator. However, we must keep in mind that the igloo system is a new and thus not very well established. This is probably the main cause of the low recycling rate.
Eco-efficiency relative to Curbside 2001
0,00
0,50
1,00
1,50Recycled fraction
Cost
CO2-eqv.
Energy consumption
HTP Cancer
HTP Noncancer
Igloo 2001
Curbside 2001
Figure 22: Compass with eco-efficiency for igloo compared to curbside
2001. Note that a small area is best

Evaluation of eco-efficiency for plastic-packaging recycling system
57
5.3 Deposit system for one-way PET bottles (2000/ 2001)
In Chapters 5.2.2 to 5.2.4 we examined different source separation solutions for used plastic packaging generated in households. Here we will take a closer look at the deposit system for PET bottles (see Chapter 4.3 for more information). Compared to the curbside/igloo solution, this system gives a high recycling rate. Fifty-four percent of the one-way PET bottles was recycled in 2000. Still this figure is expected to increase due to the fact that this system was only established early in 2000.
In Figure 23 below, we can see that due to the substitution of alternative virgin materials and energy, the system gives negative CO2-equivalent emissions, which gives an environmental benefit. It can also be observed that the 46% going to incineration leads to high emissions.
-1500
-1000
-500
0
500
1000
kg C
O2
eqv.
/to
nn
pla
stic
g
ener
ated
in h
ou
seh
old
s
Household T o t a ltransport
Processing,Bailing
Recycling Incineration AvoidedRaw
materialprod.
AvoidedEnergyprod.
Tota l
Global Warming potential - Deposit (PET) 2000/2001
Figure 23: Emission of CO2 equivalents for PET deposit system
Figure 24 gives the costs through the recycling chain. Note the high cost for administration and marketing of the system as well as for pick up/ transport. This can be explained by the low amount of one-way deposit bottles in the market and the fact that the system is quite new. Reduced pick up cost could be obtained by better compaction of the bottles in the reverse vending machines in stores.
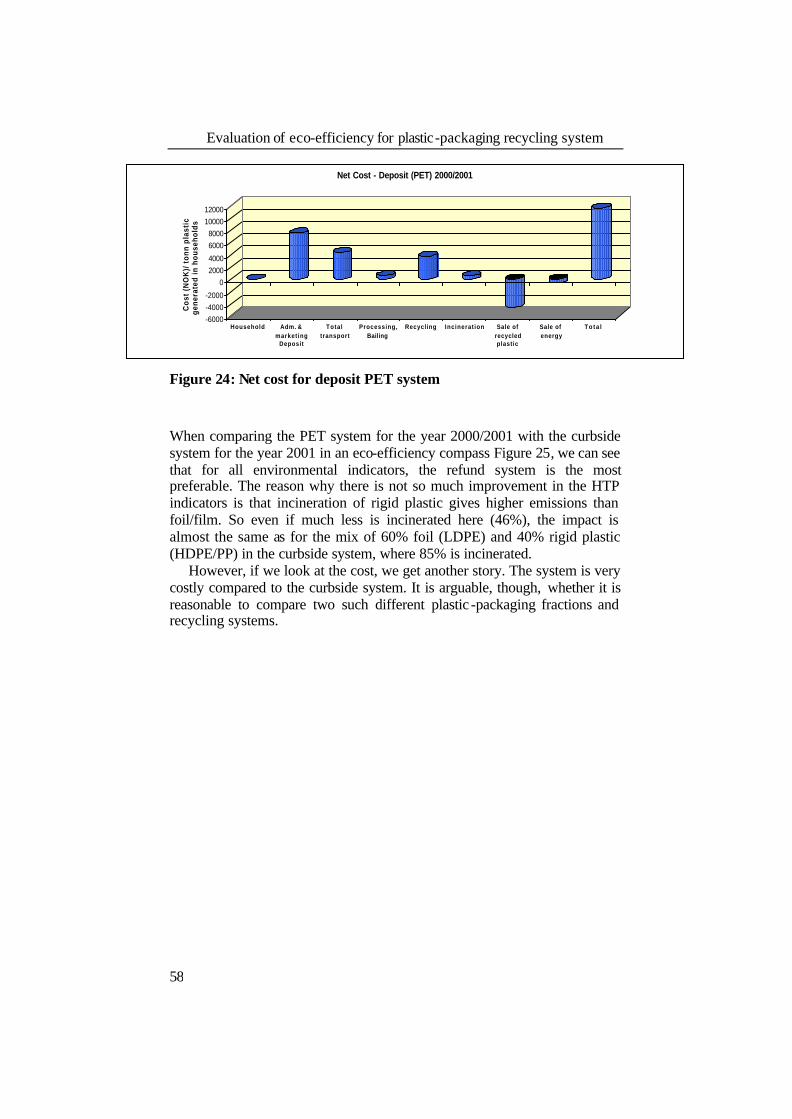
Evaluation of eco-efficiency for plastic-packaging recycling system
58
-6000-4000-2000
020004000
60008000
1000012000
Cos
t (N
OK
)/ t
onn
plas
tic
gene
rate
d in
hou
seho
lds
Household Adm. &marketing
Deposit
Totaltransport
Processing,Bailing
Recycling Incinerat ion Sale ofrecycledplastic
Sale ofenergy
T o t a l
Net Cost - Deposit (PET) 2000/2001
Figure 24: Net cost for deposit PET system
When comparing the PET system for the year 2000/2001 with the curbside system for the year 2001 in an eco-efficiency compass Figure 25, we can see that for all environmental indicators, the refund system is the most preferable. The reason why there is not so much improvement in the HTP indicators is that incineration of rigid plastic gives higher emissions than foil/film. So even if much less is incinerated here (46%), the impact is almost the same as for the mix of 60% foil (LDPE) and 40% rigid plastic (HDPE/PP) in the curbside system, where 85% is incinerated.
However, if we look at the cost, we get another story. The system is very costly compared to the curbside system. It is arguable, though, whether it is reasonable to compare two such different plastic -packaging fractions and recycling systems.

Evaluation of eco-efficiency for plastic-packaging recycling system
59
Eco-efficiency relative to Curbside 2001
-3-2-101234
Non-recycled fraction
Cost
CO2-eqv.
Energy consumption
HTP Cancer
HTP Noncancer
Curbside 2001
Deposit PET
Figure 25: Compass with eco-efficiency for PET-deposit system
compared to curbside 2001. Note that a small area is best
5.4 Comparison of solutions
Now we will summarize the eco-efficiency evaluations of current solutions and systems for recycling of used plastic packaging from households. Figure 26 shows the net cost and CO2-equivalent emissions for all solutions. For the solutions and systems we have been investigating there appears to be a linear relation between the recycling rate and net cost. The increased recycling rate leads to increased cost. A challenge is to break this trend for future recycling solutions. The situation is completely the opposite if we look at CO2-equivalent emissions. Here there is also a linear relation between the recycling rate and CO2 emissions; the increase in recycling rate gives a corresponding reduction in emissions. It is not easy to pick out the most eco-efficient solutions and systems from the ones examined, as this will depend on what is most important, environmental or cost issues. However, whether we like it or not, cost is naturally very much on the agenda when deciding the extent to which recycling should be prioritized. From this perspective, we would argue that unless cost reduction is obtained in today’s system, the future for used plastic packaging from households might very well be in energy recovery.
However, there is no doubt that there is room for a great deal of eco-efficiency improvements in today’s system. With the curbside and igloo system for 2001 as a reference, in Chapter 6 we will identify the main causes
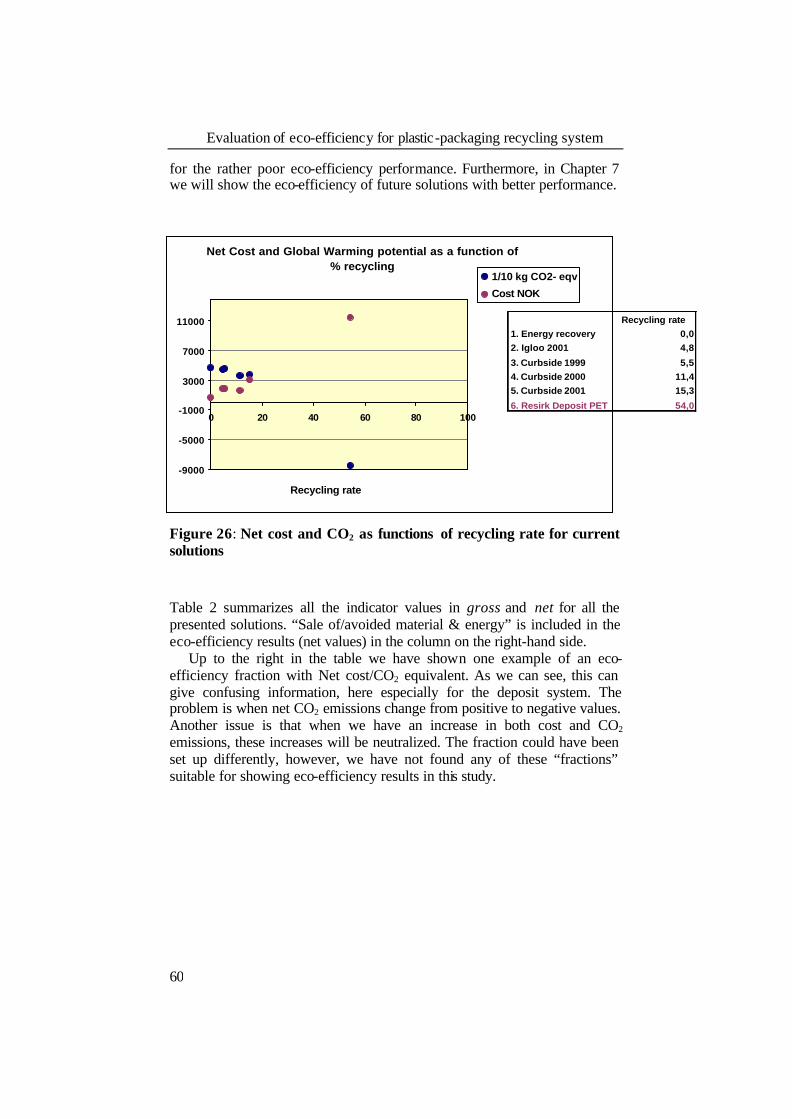
Evaluation of eco-efficiency for plastic-packaging recycling system
60
for the rather poor eco-efficiency performance. Furthermore, in Chapter 7 we will show the eco-efficiency of future solutions with better performance.
Figure 26: Net cost and CO2 as functions of recycling rate for current solutions
Table 2 summarizes all the indicator values in gross and net for all the presented solutions. “Sale of/avoided material & energy” is included in the eco-efficiency results (net values) in the column on the right-hand side.
Up to the right in the table we have shown one example of an eco-efficiency fraction with Net cost/CO2 equivalent. As we can see, this can give confusing information, here especially for the deposit system. The problem is when net CO2 emissions change from positive to negative values. Another issue is that when we have an increase in both cost and CO2 emissions, these increases will be neutralized. The fraction could have been set up differently, however, we have not found any of these “fractions” suitable for showing eco-efficiency results in this study.
Net Cost and Global Warming potential as a function of % recycling
-9000
-5000
-1000
3000
7000
11000
0 20 40 60 80 100
Recycling rate
1/10 kg CO2- eqv
Cost NOK
Recycling rate1. Energy recovery 0,02. Igloo 2001 4,8
3. Curbside 1999 5,54. Curbside 2000 11,45. Curbside 2001 15,3
6. Resirk Deposit PET 54,0

Evaluation of eco-efficiency for plastic-packaging recycling system
61
Recycled fraction (%) Eco-eff. fraction: - Net Cost/ Net CO2
Incineration 0,0 -1,44
Curbside 1999 5,5 -4,16
Curbside 2000 11,4 -4,45
Curbside 2001 15,3 -8,19
Igloo 2001 4,8 -4,25
Deposit 2000 54,0 13,61
Cost + Sale of Material & Energy = Net cost (NOK/ tonn)
Incineration 1955 -1273 682
Curbside 1999 3198 -1302 1895
Curbside 2000 3283 -1657 1626
Curbside 2001 4692 -1677 3015
Igloo 2001 3465 -1588 1877
Deposit 2000 16807 -5231 11576
CO2-eqv. + Avoided Material & Energy = Net CO2-eqv (kg/ tonn)
Incineration 2045 -1572 473
Curbside 1999 1936 -1480 456
Curbside 2000 1822 -1457 365
Curbside 2001 1775 -1407 368
Igloo 2001 1961 -1519 442
Deposit 2000 1121 -1972 -851
Energy consumption + Avoided Material & Energy = Net energy consumption (10 MJ/tonn)
Incineration 86 -2601 -2515
Curbside 1999 88 -2449 -2361
Curbside 2000 95 -2060 -1965
Curbside 2001 147 -2010 -1863
Igloo 2001 100 -2543 -2443
Deposit 2000 473 -4349 -3876
HTP Cancer + Avoided Material & Energy = Net HTP Cancer (kg benzene eqv./ tonn)
Incineration 1628 -3 1626
Curbside 1999 1613 -3 1610
Curbside 2000 1484 -3 1482
Curbside 2001 1451 -2 1448
Igloo 2001 1577 -3 1574
Deposit 2000 1456 -1 1455
HTP Noncancer + Avoided Material & Energy = Net HTP Noncancer (tonn toluene eqv./tonn)
Incineration 2076 25 2101
Curbside 1999 2059 23 2082
Curbside 2000 1941 -4 1937
Curbside 2001 1896 -3 1893
Igloo 2001 2062 -4 2058
Deposit 2000 1887 -2 1886
Eco- Efficiency Indicatorvalues
Table 2: Eco-efficiency indicator quantified for current recycling system, gross and net values

Evaluation of eco-efficiency for plastic-packaging recycling system
62
5.5 Sensitivity analysis
To show the importance of assumptions made in the assessment, and the effect of changing some parameters, we have chosen to undertake a sensitivity analysis on the 2001 curbside system. We can see from Chapter 5.2 that energy recovery and avoided energy production are major contributors to the environmental results, hence some sensitivity relates to this part. The following sensitivity aspects will be discussed: • Households cleaning plastic with hot water • More potentially recyclable plastic is generated in households • Composition of the plastic may be different • Incineration and avoided production of energy based on average
household waste • Avoided energy is 90% hydropower • LDPE replaces virgin plastic instead of wood in pallet blocks • High recycling rates and ”loop closing” • Sales price of recycled material • Transport
Households cleaning plastic with hot water A study by SSB (Bruvoll et al. 2000) has found that 40% of households use hot water to clean curbside material, and the effect of this is shown here. The results are based on consumption of 0.22 kWh/kg electricity (90% hydropower and 10% coal). We see from Figure 27 that the increased cost is relatively insignificant, though it contributes slightly more to Global Warming and Energy Consumption, Figure 28 and Figure 29.
0
500
1000
1500
2000
Co
st (
NO
K)/
to
nn
pla
stic
g
ener
ated
in h
ou
seh
old
s
Household Adm. &marketing Igloo
Total transport Sorting Recycling
Net Cost - Curbside 2001, Hot water sensitivity
Curbside 2001
Hot watersensitivity
Figure 27: Hot water sensitivity – net cost

Evaluation of eco-efficiency for plastic-packaging recycling system
63
0
10
20
30
40
50
60
70
80
90
100
kg C
O2
eqv.
/to
nn
pla
stic
gen
erat
ed in
h
ou
seh
old
s
Household Total transport Sorting Recycling
Global warming potential - Curbside 2001, Hot water sensitivity
Curbside2001
Hot watercleaning
Figure 28: Hot water sensitivity – global warming potential
0
200
400
600
800
1000
1200
1400
1600
MJ
ener
gy/
to
nn
gen
erat
ed p
last
ic in
h
ou
seh
old
s
Consumer Total transport Sorting (incl Deie) Recycling
Energy consumption - Curbside 2001, Hot water sensitivity
Curbside 2001
Hot water cleaning
Figure 29: Hot water sensitivity – energy consumption
More recyclable plastic is generated It is not quite clear how much potential recyclable plastic packaging is actually generated in households. We have used 7.95 kg/innhab./year. However, an assessment by Interconsult, where waste samples have been collected, indicates that the total generated amount may be considerably higher (21.5 kg/person/ year) (Interconsult 2001). If we assume that the potential recyclable plastic packaging generated is 12.5 kg/person, instead of

Evaluation of eco-efficiency for plastic-packaging recycling system
64
7.95, this implies a higher rate of ”improperly sorted” material in households. Only 53% is properly sorted in environmental-waste bins, compared to 83% in the Curbside 2001 reference. This gives a lower recycling rate of 9.7% instead of 15.3%.
Composition of the plastic may be different The plastic mix also has a certain degree of uncertainty. We show the effect of a composition change from 60% foil/film (LDPE) and 40% HDPE/PP, to 75% LDPE and 25% HDPE/PP. In the way this is modeled, the same amounts will still be recycled, so this change in assumption will only affect the energy recovery and avoided energy step. Foil/film plastic has a slightly higher energy content (heat value) and a bit different emission rates on HTP (Human Toxicity Potential) than rigid plastic. From Figure 30and–Figure 33 “Change in plastic mix” we see that this change in assumption does not affect the global warming or the energy consumption a great deal, but it gives significantly lower HTP cancer and non-cancer emissions.
Energy recovery and energy avoided based on average household waste Instead of using incineration data for the plastic fraction only, here we show the effect of treating plastic as an average part of all the household waste that is incinerated together. The average waste has a much lower heat value than plastic, and different emissions rates. From Figure 30–and Figure 33 “Incineration of General waste” we see that this change in assumption drastically decreases the global warming emissions, but at the same time significantly reduces the energy output, which implies less energy can be replaced/avoided. The HTP emission also decreases drastically.
Avoided energy is 90% hydropower Instead of replacing a mix of 75% light oil and 25% hydropower, we analyze with a mix of 90% electricity from hydropower and 10% power from coal. We can see from Figure 30 and –Figure 33 “Avoided Energy 90% Hydro” that this more than halves the global warming gain of avoided energy production, which means a very high total global warming load. It is important to remember here that approximately 85% of the plastic is energy recovered in the 2001 curbside system. Because it is more energy demanding to produce a unit of energy with oil than with hydropower, we see that the avoided energy is reduced. This change of assumption has a relatively small impact on HTP emissions. LDPE replaces virgin plastic instead of wood in pallet blocks In Figure 30 and Figure 31 we show the effect of the small recycled fraction of LDPE replacing 90% virgin plastic instead of wood in pallet blocks, and we can see that this has a clear positive effect on CO2 and energy consumption. Producing wood is much less energy demanding than

Evaluation of eco-efficiency for plastic-packaging recycling system
65
producing plastic, therefore it is not very efficient to replace wooden products with recycled plastic.
-1500
-1000
-500
0
500
1000
1500
2000
kg C
O2
eqv.
/to
nn
pla
stic
gen
erat
ed in
ho
useh
olds
Household Totaltransport
Sorting Recycling Incineration AvoidedRaw
materialprod.
AvoidedEnergyprod.
Total
Global Warming potential - Sensitivity 2001
Curbside 2001
Change in plasticmix
Incineration ofgeneral waste
Avoided Energy90% Hydro
LDPE replacevirgin (not wood)
Figure 30: Sensitivity Curbside 2001- global warming potential
-30000
-25000
-20000
-15000
-10000
-5000
0
5000
MJ
/to
nn
pla
stic
gen
erat
ed in
h
ou
seh
old
s
Household Totaltransport
Sorting Recycling Incineration AvoidedRaw
materialprod.
AvoidedEnergyprod.
Total
Energy consumption - Sensitivity 2001
Curbside 2001
Change in plasticmix
Energy recoveryof general waste
Avoided Energy90% Hydro
LDPE replacevirgin (not wood)
Figure 31: Sensitivity Curbside 2001- energy consumption
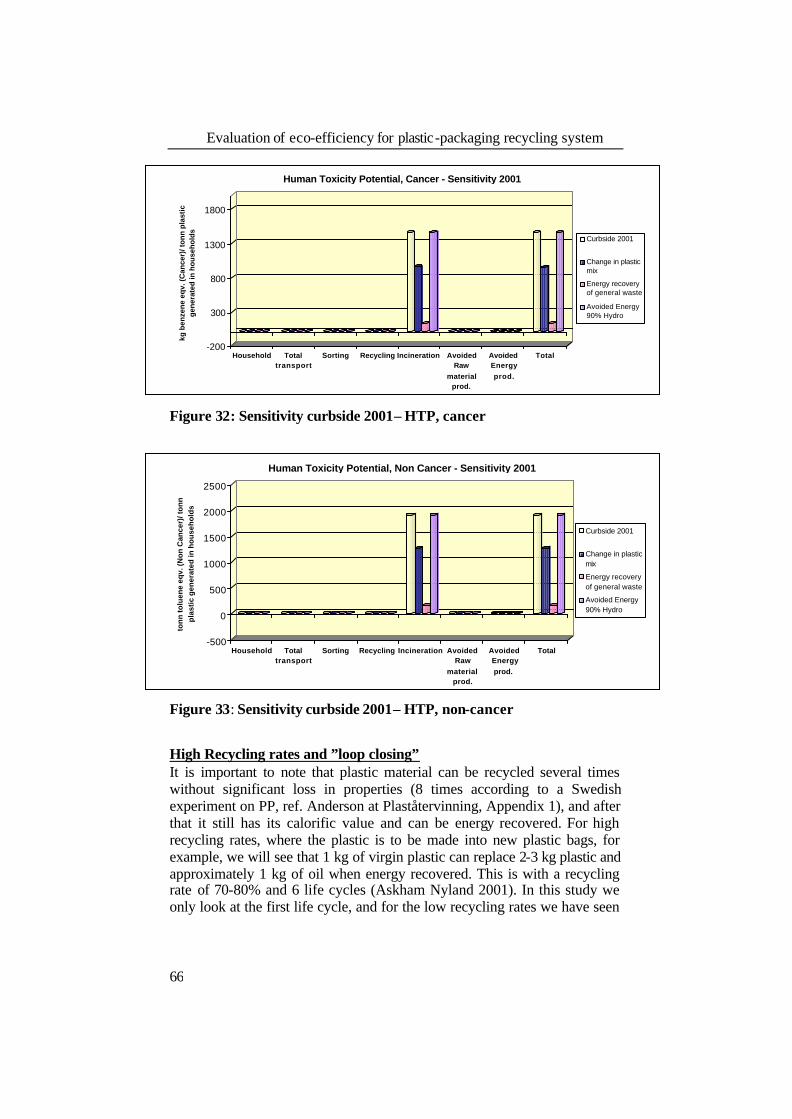
Evaluation of eco-efficiency for plastic-packaging recycling system
66
-200
300
800
1300
1800
kg b
enze
ne
eqv.
(C
ance
r)/ t
on
n p
last
ic
gen
erat
ed in
ho
use
ho
lds
Household Totaltransport
Sorting Recycling Incineration AvoidedRaw
materialprod.
AvoidedEnergyprod.
Total
Human Toxicity Potential, Cancer - Sensitivity 2001
Curbside 2001
Change in plasticmix
Energy recoveryof general waste
Avoided Energy90% Hydro
Figure 32: Sensitivity curbside 2001– HTP, cancer
-500
0
500
1000
1500
2000
2500
ton
n t
olu
ene
eqv.
(N
on
Can
cer)
/ to
nn
p
last
ic g
ener
ated
in h
ou
seh
old
s
Household Totaltransport
Sorting Recycling Incineration AvoidedRaw
materialprod.
AvoidedEnergyprod.
Total
Human Toxicity Potential, Non Cancer - Sensitivity 2001
Curbside 2001
Change in plasticmix
Energy recoveryof general waste
Avoided Energy90% Hydro
Figure 33: Sensitivity curbside 2001– HTP, non-cancer
High Recycling rates and ”loop closing” It is important to note that plastic material can be recycled several times without significant loss in properties (8 times according to a Swedish experiment on PP, ref. Anderson at Plaståtervinning, Appendix 1), and after that it still has its calorific value and can be energy recovered. For high recycling rates, where the plastic is to be made into new plastic bags, for example, we will see that 1 kg of virgin plastic can replace 2-3 kg plastic and approximately 1 kg of oil when energy recovered. This is with a recycling rate of 70-80% and 6 life cycles (Askham Nyland 2001). In this study we only look at the first life cycle, and for the low recycling rates we have seen
Evaluation of eco-efficiency for plastic-packaging recycling system
67
so far this effect will not be applicable. The explained effect will only be of importance for one of the scenarios in this report, Intelligent Igloo, in Chapter 7.3.
It is assumed that we replace virgin plastic with recycled plastic for HDPE and PP, but for some applications and with the surplus of recycled material on the market, the case might actually be that that we are replacing other recycled plastic. This means that the environmental benefit will be lower than if virgin plastic was replaced.
Sales price of recycled material What price the recycled material is sold for is very important for the economy of a recycling system. The price is around 60% of virgin plastic, but may depend on the quality and demand of recycled material. The prices can vary a great deal from one year to another, depending on raw material prices and other factors. If the price of recycled plastic in this study had been the same as for virgin plastic, which means an increase in PP/HDPE from about 4.5 NOK/kg to about 8 NOK/kg, this could actually contribute to making the recycling profitable.
Transport We have not undertaken a sensitivity analysis of transport, though it could be argued that allocating collection impact, for example, should be based on volume instead of on a mass basis. However, since the transport in this system is relatively well optimized, and the intelligent-igloo scenario in Chapter 5.6 will show the effect of reduced transport need due to early sorting and compacting, transport will not be discussed further in this chapter.
Summary We have selected what we found were the appropriate methodical and data-technical conditions suitable to give the most correct information in the assessment. We see, however, from the sensitivity analysis that many factors may influence the results, depending on the assumptions made. But, though the indicators in some cases will increase/decrease considerably, this mainly relates to energy recovery/avoided energy, while economy and sorting/recycling rates are not affected to any major extent. Hence the sensitivity analysis shows that changed assumptions will not alter the main conclusions reached so far. However, we can clearly see that what we replace with recycled or recovered plastic is very important.

69
6 DEVELOPMENT OF COMPANY-SPECIFIC INDICATORS
6.1 Introduction
In Chapter 5 we evaluated the eco-efficiency of the plastic -packaging recycling systems. Here we will carry out Step 5 in the methodology developed in Chapter 2 by taking a closer look at the existing curbside- and igloo solutions for 2001. We will identify improvement potential and corresponding company-specific indicators as a basis to improve the overall eco-efficiency of these systems. First, in Chapter 6.2 we will quantitatively identify the main contribution stages to each of the eco-efficiency indicators of the recycling system and then define company-specific indicators based on these findings. These are the “cause-and-effect” indicators from figure 4 in Chapter 2.5.2, and are typical examples of what is termed operational performance indicators in ISO 14031 (ISO 1999). Second, in Chapter 6.3, we will use these indicators and information from the qualitative research interview to suggest improvement potentials for each of the life-cycle stages for the recycled plastic packaging. To evaluate the extent to which these improvement potentials can be realized over a future period of time, more company-specific indicators should be developed (the “cause” indicators in figure 4). These indicators can be both operational-performance and management-performance indicators. However, to avoid any mistakes we will not distinguish between operational and management indicators in the following. They will basically both be termed company-specific indicators.
It should be noted that while we use the term company-specific indicators, in addition to companies, this might be life-cycle stages, activities or actors along the plastic -packaging material chain.
To ensure that the most appropriate indicators on the company level are selected, the indicator should (see also Chapter 2.6.6):
• Be related to companies, activities or actors in the recycling chain
that make the highest contributions to the overall eco-efficiency of the recycling system
• Have a significant potential for improvement • Be based on operational or management aspects within the
companies • Be connected to one or more of the eco-efficiency indicators • Be understandable, relevant and meaningful for various decision
makers in the activities or organizations

Development of company-specific indicators
70
• Be appropriate to use for internal communication and external reporting
• Be based as far as possible on available information
We will present each of the quantified eco-efficiency indicators for the recycling system from Chapter 4, one by one, divided according to the various stages in the recycling chain. We present both the curbside and igloo solution in the same diagrams. The reason for this is not to compare the solutions, but rather to have a broader basis for identifying the improvement potentials.
In contrast to what we did in Chapter 5, where indicator values were related to the functional unit of 1000 kg of plastic packaging generated in households, and the material and money flow through the various stages, we will show the indicators as costs or emissions per kg in the actual process stage. In our opinion this gives more appropriate information to the companies, as they normally relate their performance per unit (e.g. metric ton), not per quantity flow from “our” defined system and functional unit.
It should be noted that only the stages upstream of central sorting are different in the two systems. The process of central sorting, further transport, recycling and energy recovery are similar for both the curbside and igloo solutions.
6.2 Identification of company-specific indicators
6.2.1 Costs
For the eco-efficiency indicator net cost we can see that costs are apportioned into several activities in the recycling chain, see Figure 34. Before identifying the most important cost indicators we will briefly comment on the differences in unit costs between the igloo and curbside solution. Due to the fact that the igloo system is quite new and thus only a relatively small amount of plastic packaging is collected, the unit costs for investment in igloos, administration and marketing and transport to sorting are higher than for the more established curbside system. These costs will probably be reduced noticeably after a year or two, when the system is more established and well known.
Incineration contributes a relatively large amount to the overall costs. However, since these unit costs are probably already minimized, and since the incomes from sales equalize these costs, we do not recommend that a particular emphasis should be put on this activity.
Sorting contributes a very large amount to the overall costs. Note that sorting 1+2 in the figure represent the (two rounds of) sorting at the central sorting plant into recyclable plastic -packaging fractions (bottles/cans and

Development of company-specific indicators
71
foils), while sorting 3 is the sorting of bottles/cans into HDPE and PP. From conversations with the actors, it would appear there should be a high possibility of reducing the costs in the central sorting activity. The costs are also relatively high in the stage household sorting (investment in bins, administration and marketing), in the recycling process and in transport. From conversations with the actors we know that it should be possible to reduce household sorting costs and recycling costs.
Transport costs, on the other hand, are optimized to a very high degree and we do not suggest these as indicators. Another important issue, which is very important for the overall eco-efficiency, is the sales price of recycling material. This is a good indicator of the market and quality of recycled material and should be included among the company-specific indicators
Per step Cost - Cubside and Igloo 2001
-3000
-2000
-1000
0
1000
2000
3000
Consu
mer/ in
vest.b
oxes
Adm, m
arketin
g
Trans
p. Rest
frac. t
o ene
rgy
Trans
p. Pla
stic co
llection So
rting 1
+2
Sortin
g 3 (H
DPE/PP
)
Trans
p. Recy
cling c
aRe
cycling
Trans
p. Inc
inerat
ion
Incine
ration
Sale r
ec.pla
stic
Sale e
nergy
Co
st (
NO
K)/
to
nn
pla
stic
in e
ach
ste
p
Curbside
Igloo
Figure 34: Cost (NOK)/metric ton packaging handled in each activity in curbside and igloo system 2001.
After having identified the largest contributions and improvement potential, we suggest that the companies/activities should measure the following two company-specific indicators:
• Costs/kg – sorting households • Costs/kg – central sorting • Costs/kg – recycling • Sales price recycled material/kg

Development of company-specific indicators
72
6.2.2 Percentage material available for recycling
Recycled plastic packaging is an alternative to virgin materials for use in new plastic products. Figure 35 below shows how much of the material is sorted properly in each stage and thus available to recycle into new products. The figure shows that more than 90% of the potentially recyclable plastic is improperly sorted (and thus less than 10% is recycled) in the igloo solution, while the corresponding figure for the curbside system is around 80%. As we can see, almost all the loss of potentially recyclable material occurs in the sorting in households and at the central sorting plant stages. We can see, however, that for the igloo option the largest fraction (around 70%) of material is lost in the household sorting phase, while the central sorting stage is the major loss stage in the curbside system (around 65%). There is a low degree of loss of material in the second central sorting (sorting 3) stage and in the recycling stage.
0
10
20
30
40
50
60
70
80
90
100
Wro
ng
so
rted
mat
eria
l an
d lo
ss in
%
of g
ener
ated
pla
stic
in
ho
use
ho
lds
Consu
mer
Sortin
g 1+2
Sortin
g 3 (H
DPE/
PP)
Recyc
ling Total
"Wrong" sorted material and loss for Curbside and Igloo 2001
Curbside
Igloo
Figure 35: Percentage of potentially recyclable material improperly sorted in each of the stages in curbside and igloo system 2001
We suggest that the companies measure the following two company-specific indicators:
- Improperly sorted/kg – sorting households - Improperly sorted/kg – central sorting
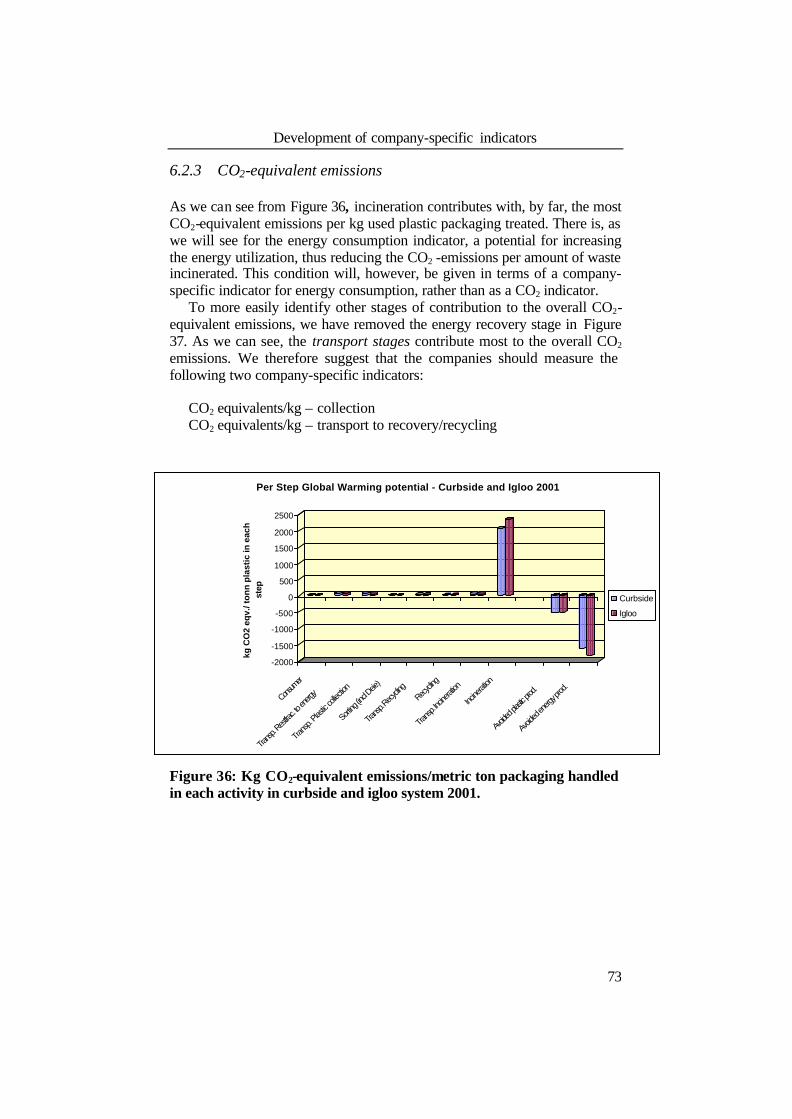
Development of company-specific indicators
73
6.2.3 CO2-equivalent emissions
As we can see from Figure 36, incineration contributes with, by far, the most CO2-equivalent emissions per kg used plastic packaging treated. There is, as we will see for the energy consumption indicator, a potential for increasing the energy utilization, thus reducing the CO2 -emissions per amount of waste incinerated. This condition will, however, be given in terms of a company-specific indicator for energy consumption, rather than as a CO2 indicator.
To more easily identify other stages of contribution to the overall CO2-equivalent emissions, we have removed the energy recovery stage in Figure 37. As we can see, the transport stages contribute most to the overall CO2 emissions. We therefore suggest that the companies should measure the following two company-specific indicators:
CO2 equivalents/kg – collection CO2 equivalents/kg – transport to recovery/recycling
-2000
-1500
-1000
-500
0
500
1000
1500
2000
2500
kg C
O2
eqv.
/ to
nn
pla
stic
in e
ach
st
ep
Consu
mer
Transp
. Rest
frac. to
energ
y
Trans
p. Pla
stic co
llection
Sortin
g (inc
l Deie
)
Transp
. Recy
cling
Recyclin
g
Transp
. Incin
eration
Incine
ration
Avoid
ed pla
stic pro
d.
Avoid
ed en
ergy p
rod.
Per Step Global Warming potential - Curbside and Igloo 2001
Curbside
Igloo
Figure 36: Kg CO2-equivalent emissions/metric ton packaging handled in each activity in curbside and igloo system 2001.
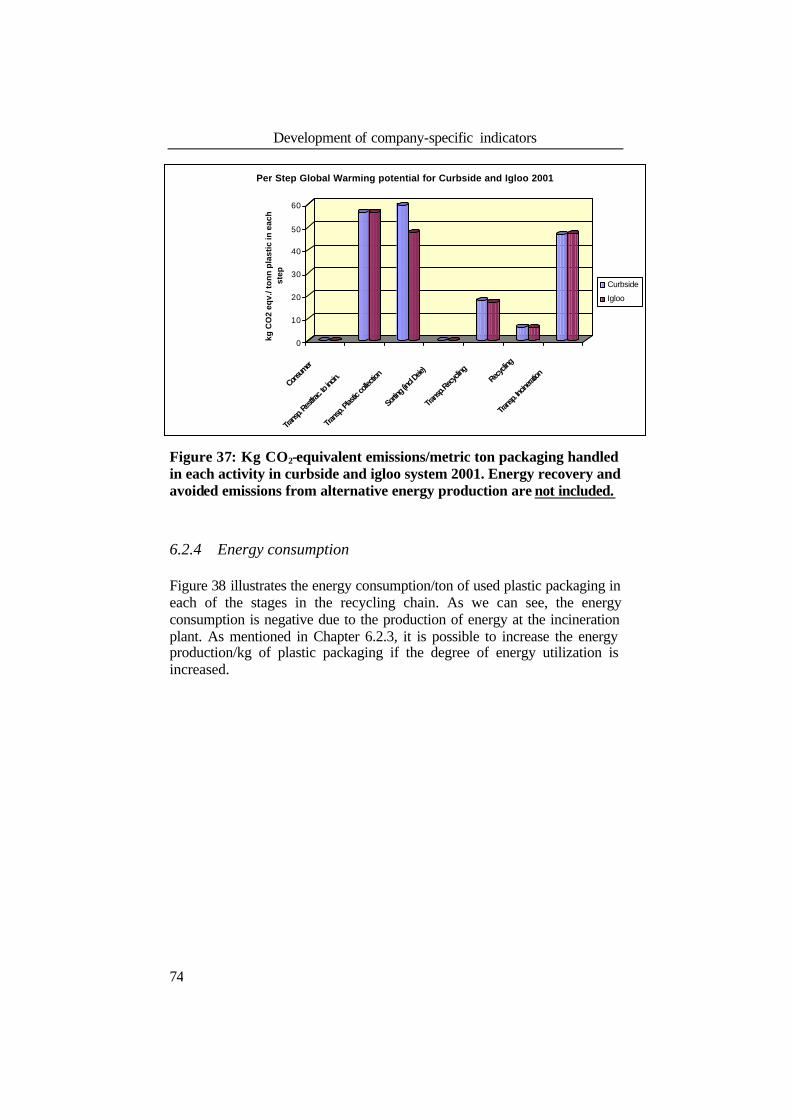
Development of company-specific indicators
74
0
10
20
30
40
50
60
kg C
O2
eqv.
/ to
nn
pla
stic
in e
ach
st
ep
Cons
umer
Trans
p. Rest
frac. t
o incin
.
Trans
p. Pla
stic co
llectio
n
Sortin
g (inc
l Deie
)
Trans
p. Rec
ycling
Recyclin
g
Trans
p. Inc
inerat
ion
Per Step Global Warming potential for Curbside and Igloo 2001
Curbside
Igloo
Figure 37: Kg CO2-equivalent emissions/metric ton packaging handled in each activity in curbside and igloo system 2001. Energy recovery and avoided emissions from alternative energy production are not included.
6.2.4 Energy consumption
Figure 38 illustrates the energy consumption/ton of used plastic packaging in each of the stages in the recycling chain. As we can see, the energy consumption is negative due to the production of energy at the incineration plant. As mentioned in Chapter 6.2.3, it is possible to increase the energy production/kg of plastic packaging if the degree of energy utilization is increased.

Development of company-specific indicators
75
-35000
-30000
-25000
-20000
-15000
-10000
-5000
0
5000
MJ/
ton
n pl
astic
in e
ach
step
Consu
mer
Transp
. Rest
frac. to
incin.
Trans
p. Plas
tic colle
ction
Sortin
g (inc
l Deie
)
Transp
. Recy
cling
Recyclin
g
Transp
. Incin
eration
Incine
ration
Avoid
ed pla
stic pro
d.
Avoid
ed ene
rgy pro
d.
Per Step Energy Consumption - Curbside and Igloo 2001
Curbside
Igloo
Figure 38: MJ energy consumption/metric ton packaging handled in each activity in curbside and igloo system 2001.
0
100
200
300
400
500
600
700
800
900
1000
MJ/
ton
n p
last
ic in
eac
h s
tep
Consu
mer
Trans
p. Res
tfrac. t
o incin
.
Trans
p. Plas
tic co
llectio
n
Sortin
g (inc
l Deie
)
Trans
p. Recy
cling
Recyc
ling
Per Step Energy Consumption - Curbside and Igloo 2001
Curbside
Igloo
Figure 39: MJ energy consumption/metric ton packaging in each activity in curbside and igloo system 2001. Energy recovery and avoided emissions from alternative energy production are not included.
In Figure 39 we can see that as with the CO2 emissions, the transport stages also contribute noticeably to the energy account. These are stages where

Development of company-specific indicators
76
there may be a certain potential for reduction per kg of plastic packaging transported. However, since these stages are well covered by the CO2-equivalent emission indicators, we do not include them as indicators here.
We therefore suggest that the incineration plant should measure the following company-specific indicators:
Energy production/kg – incineration
6.2.5 Human Toxicity Potential (HTP Cancer and HTP Non-Cancer)
For the last two eco-efficiency indicators, the human toxicity potential (HTP cancer and non-cancer), we can see in Figure 40 that the major emissions come from the incineration plant (energy recovery). A reduction in these emissions may be obtainable by improving the cleaning technology at the incineration plant. In Figure 41 we can see that the transport stages also contribute to some extent to the overall emissions. However, we suggest the transport phase be omitted as the contributions are relatively small compared to the emissions from incineration, and also because we are not sure whether a significant reduction of HTP in these stages is obtainable. Moreover, it is difficult to measure toxic emission from the actual vehicles.
-500
0
500
1000
1500
2000
2500
3000
kg b
enze
ne
eqv.
(Can
cer)
an
d
ton
n t
olu
ene
eqv.
(N
on
Can
cer)
/ to
nn
pla
stic
in e
ach
ste
p
Consu
mer
Transp
. Rest
frac. to
incin.
Transp
. Plas
tic col
lection
Sortin
g (inc
l Deie
)
Transp
. Recy
cling
Recyclin
g
Transp
. Incin
eration
Incine
ration
Avoid
ed pla
stic pr
od.
Avoid
ed ene
rgy pro
d.
Per Step Human Toxicicity Potential, Cancer and Non Cancer - Curbside and Igloo 2001
Curbside- Cancer
Curbside- NonCancer
Igloo- Cancer
Igloo - NonCancer
Figure 40: HTP emissions/metric ton packaging handled in each activity in curbside and igloo system 2001

Development of company-specific indicators
77
0
0,02
0,04
0,06
0,08
0,1
0,12
0,14
kg b
enze
ne
eqv.
(Can
cer)
an
d
ton
n t
olu
ene
eqv.
(N
on
Can
cer)
/ to
nn
pla
stic
in e
ach
ste
p
Consu
mer
Trans
p. Res
tfrac. t
o inc
in.
Trans
p. Pla
stic co
llection
Sortin
g (inc
l Deie
)
Trans
p. Rec
ycling
Recyc
ling
Trans
p. Inc
inerat
ion
Per Step Human Toxicicity Potential, Cancer and Non Cancer - Curbside and Igloo 2001
Curbside- Cancer
Curbside- NonCancerIgloo- Cancer
Igloo - NonCancer
Figure 41: MJ energy consumption/metric ton packaging handled in each activity in curbside - and igloo system 2001. Energy recovery and avoided emissions from alternative energy production are not included.
We suggest that the following company-specific indicators should be measured at the incineration plant.
HTP/kg incinerated – incineration
6.3 Development of more company-specific indicators
In Chapter 6.2 we identified where in the recycling chain the changes must occur to improve the overall eco-efficiency, and developed the corresponding company-specific indicators. In this section we will focus on how these changes can be obtained and use this as the basis for the development of more company-specific indicators. These indicators should be applied by the companies to evaluate the extent to which the identified operational challenges have been solved. While until now we have focused on indicators for the recycling chain, we will now change our perspective to operational possibilities for actors in the life-cycle material chain of plastic packaging. Through research interviews and conversations with the actors in the recycling chain we have identified some technical, economic, organizational, political and cultural issues that are decisive for the activity’s eco-efficiency. The work of Lillo et al on perspectives on recycling of plastic packaging from the municipality of Trondheim (Lillo et al. 2001) is a
Development of company-specific indicators
78
valuable addition here. Nonetheless, it is necessary to point out that this analysis of the company level should have been more thorough. We recommend that a more thorough study be undertaken in a future project
It is important to repeat that in this project we focus on how to improve the recycling system, not on reducing the amount of used plastic packaging generated in households, even though this is an important challenge from an environmental point of view.
Now we will examine all the life-cycle stages, from design and production of plastic packaging to recycling into plastic -packaging products and energy recovery. The company-specific indicators identified in Chapter 6.2 will be used as a basis to identify and present improvement potentials and corresponding company-specific indicators for each of the activities in this life-cycle material chain.
Generally in all stages
Company-specific indicators identified (in Chapter 6.2):
No such indicators were identified
How to improve the eco-efficiency of the recycling system in general:
§ Improve communication and co-operation between the central
authorities, the material company Plastretur, and the actors in the recycling chain
§ Create an image of waste as a safe and clean resource, and a waste-management system as a product system that transforms resources into new products
§ Increase competition between the actors in the recycling chain in order to reduce costs
§ Establish long-term agreements between governments/Plastretur/Norsk Resirk and the actors in the recycling chain in order to ensure a market predictability for the companies
§ Ensure that environmental considerations are included in the decision-making processes in the companies
Company-specific indicators based on the above-identified improvement potential None suggested
In the design and production of plastic packaging
Company-specific indicators identified (in Chapter 6.2):

Development of company-specific indicators
79
§ None identified
How to improve the eco-efficiency of the recycling system
§ Consider change of (packaging) material type § Make packaging and main product easier to separate and clean and thus
to recycle § Increase standardization of packaging § Improve the degree of visible and understandable labeling on the
packaging. International standards should be followed. Digital labeling could be considered
§ Avoid as far as possible non-compatible materials in labels, corks, glue, etc. § Avoid use of the non-recyclable thermoset plastic
§ Avoid plastics that contain toxic substances or substances that contaminate the recycling loop (e.g. PVC in PET bottles)
It must be mentioned, however, that a change in the packaging type must
not compromise the most important aim from an economic and environmental point of view, namely to ensure absolutely safe transport and storing conditions for the main product.
Company-specific indicators based on the above-identified improvement potential
• % of packaging produced properly labeled § % of packaging produced with compatible materials
In the filling and packing stage
Company-specific indicators identified (in Chapter 6.2):
§ None identified
How to improve the eco-efficiency of the recycling system
§ Take into account the improvement potential in 5.4.3 when deciding
which packaging to use
Company-specific indicators based on the above-identified improvement potential
§ % of packaging properly labeled applied § % of packaging with one plastic packaging material only applied

Development of company-specific indicators
80
In transport to plastic packaging producer, to filling, to shops and to households
§ Not analyzed
Generation and sorting of plastic -packaging waste in households
Company-specific indicators identified (in Chapter 6.2):
§ Costs/kg (information to households and administration and
marketing of the source separation) § % improperly sorted in households
How to improve the value of the above-identified company-specific indicators
§ Justify the existing sorting system (or design of a new one) § Encourage households by giving correct information on the “faith”
of the sorted plastic packaging § Improve information to households and encourage them to sort and
clean the materials
81
7 ECO-EFFICIENCY EVALUATIONS OF POSSIBLE FUTURE SYSTEMS
7.1 Introduction
In previous chapters of this report we have evaluated the systems using different eco-efficiency indicators. However, since these indicators are based on empirical findings, and hence, on observed recycling rates, the indicators cannot offer information about efficiency in the systems for lower or higher recycling rates than what has been observed in the particular systems. In order to reveal which factors are important for improving eco-efficiency for higher levels of recycling rates, we apply the approach that was outlined in Chapter 4, which is aimed at making the analysis more "dynamic". The indicators for eco-efficiency used in this analysis are reduced to costs and the recycling rate for the total recycling system.
The eco-efficiency quantified for the current system in Chapter 5 identified improvement potential in Chapter 6, and the dynamic approach following in Chapter 7.2 will provide input for what is needed to increase the eco-efficiency in future systems. Hence in Chapter 7.3 we will analyze and present the eco-efficiency results for two “future” scenarios, intelligent igloo and plastic bag, where we look beyond the limitations of the current collection solutions for Trondheim.
7.2 Improving eco-efficiency in recycling systems
In the previous chapters we have evaluated the systems using different eco-efficiency indicators. However, since these indicators are based on empirical findings, and hence, on observed recycling rates, the indicators cannot provide information about efficiency in the systems for lower or higher recycling rates than what has been observed. To reveal which factors are important for achieving efficiency for higher levels of recycling rates, we apply the approach that was outlined in Chapter 3, which aims to make the analysis more ”dynamic”.
Since the focus in an LCA, which is a method often applied in an analys is of eco-efficiency, is on function rather than volumes, advantages and disadvantages related to scale are outside the scope of the LCA (Bouman et al., 2000). Furthermore, a scenario analysis cannot be based on static methods, such as cost-benefit analysis and LCA, without major qualifications. And it is one of these qualifications that we are trying to make by extending the analysis with estimates of cost-efficiency as a part of the

Eco-efficiency evaluations of possible future systems
82
eco-efficiency measure7. More specifically we measure eco-efficiency using the relationship between efficient recycling ratios and the corresponding cost level, where both parameters depend on the mix of input factors used in production processes and the flow of raw material through the system. We are hence able to provide a great deal more of the information needed for making material recycling more effective and/or for improving the decision maker’s ability to choose the correct strategy for waste treatment. More specifically, what we seek is to unveil the mechanisms that can promote or hinder the potential improvements in recycling systems.
In this section we therefore extend the static approach, but reduce the number of eco-efficiency indicators to one. Our strategy is hence to investigate how the cost-efficiency and recycling rates within the system respond to changes in different parameters and variables, and also to examine the effect of different time horizons. We will also look into alternative ways of organizing the recovery of the plastic material.
7.2.1 Time horizons
Our model’s underlying assumptions are related to technological development, efficiency improvements in the various stages of the life cycle, public opinion on recycling, and market conditions for the recycled material, as well as virgin material. Consequently, a range of different development paths is possible, depending on how technology and societal elements evolve over time. Our primary aim is not to find the one and only true development path, but to show what characterizes scenarios able to improve material recycling, or alternatively, what makes material recycling a favorable alternative in waste management. The following can summarize the role of time in our analysis:
• First, we can consider the existing system and make incremental changes and investigate the short-run effects on costs and on the recycling rate. This strategy is characterized by a high degree of realism, but is not able to produce substantial increases in the recycling rate.
• The second strategy is to investigate more radical changes in a longer time perspective, which is necessary to significantly change the recycling rate without increasing the costs proportionally. In the absence of high degrees of economies of scale, the only way to increase the recycling rate without greatly increasing the costs, besides changing the general attitude towards recycling activities, is to implement new technology, and next to combine this with other
7 A second qualification is the calculation of indirect effects. This can be done by
combining LCA with input -output models, see Joshi (2000), Hendrickson, Horvath, Joshi, and Lave, L. (1998).

Eco-efficiency evaluations of possible future systems
83
ways of organizing the recycling system. Consequently, the environmental impact will be changed as both the economic and environmental performance and the structure of the system are changed, as the amount of material throughput changes accordingly 8.
7.2.2 Important assumptions
The optimizing procedure in our model consists of minimizing total costs per ton of plastic material that comes out of the system subject to mass balance constraints and calibrated parameters9. This objective function reflects the system boundaries specified in chapter 4 and that the decision maker has interest in recovering plastic -packaging material as long as the level of costs is acceptable. Using non-linear programming we can derive the efficient level of recycling10.
A simplified system is considered, as the model does not include sorting at Deje Bruk and material recovery in Töckfors and Arvika. The conclusions from the study are, however, not affected by this assumption, although the quantitative results would have been adjusted if we were to model the entire system. This is not an important shortcoming since the main object of our study is the mechanisms affecting efficiency, and not the numbers themselves. In a choice between linear, Cobb-Douglas, Leontief, and CES production functions, we use the Cobb-Douglas functional form, based on a trade-off between simplicity and flexibility. Furthermore, the costs are net costs, as the revenues from the sale of the recycled material are subtracted from the cost-estimates.
Another important aspect is that we do not internalize any environmental externalities. The results must therefore be interpreted with this in mind. The curbside system in 2000 and 2001 is used as a reference system so that the effect of variables and parameters are evaluated relative to the reference system. Last, but not least, it is worth noting that there is a great deal of uncertainty connected to the results. The curves and numbers that are reported should therefore be looked upon as expected values within confidence intervals.
Furthermore, the outline of this section builds upon two alternative ways of modeling the system:
• One can model the system where there are no constraints on the output from the households, i.e. there are no variable costs or impediments to the rate of household sorting.
8 This fact requires assessment of indirect effects, which could be made by applying
input-output models, but this is not attempted here. 9 A recalculation backwards through the system would relate the costs to the functional
unit used to calculate the eco-efficiency indicators in earlier sections. 10 For an example of a combination of LCA and linear programming, see Weaver et al.
(1997).

Eco-efficiency evaluations of possible future systems
84
• Alternatively, the law of mass conservation connecting material input to the output in the system will be modeled in more detail. Hence if we want to illustrate the importance of the mass balance conditions, we can study the system for various exogenously determined output levels in the first process (see Figure 6)11. Also here the effect of variations in key variables and parameters will be investigated.
The plastic -packaging waste from Trondheim is only a small fraction of
the material input in some of the downstream processes, and will therefore not be the only factor affecting the cost-curves late in the life cycle. Nevertheless, to be able to offer recommendations for recycling systems in general, we assume that the output in a process in our system significantly affects processes later in the life cycle.
7.2.3 Empirical validity
The calibration of the model is based on data from the curbside system in 2000 and 2001. In this section we evaluate the validity of the model compared to these two years, in addition to the curbside system in 1999 and the plastic-bag scenario (see section 7.5.2). The results are given in Table 3 below.
Table 3: Comparison of the empirical data for 1999, 2000, 2001, and the “plastic -bag” system in Molde (2001) with the efficient recycling level predicted by the model.
1999 2000 2001
Plastic-bag scenario
Average cost (NOK) kr 8,692.0 kr 8,490.70 kr 8,594.50 NOK 8,208.20 Empirical Recycling ratio (%) 5.5 % 11.4 % 15.3 % 37.0 %
Average cost (NOK) NOK 9,309.50 Efficient (estimated)
Recycling ratio (%) 8.8%
The model prescribes an efficient rate of recycling close to 9% and a total cost per ton of recycled material of approximately 9300 NOK. This is a slight overestimation of the costs compared to the empirical data, which is also seen in figure 42 below.
11 We will use exogenously determined output in the household sector, as we do not
attempt to model the behavior in this sector explicitly. Exogenously means determined outside the model.
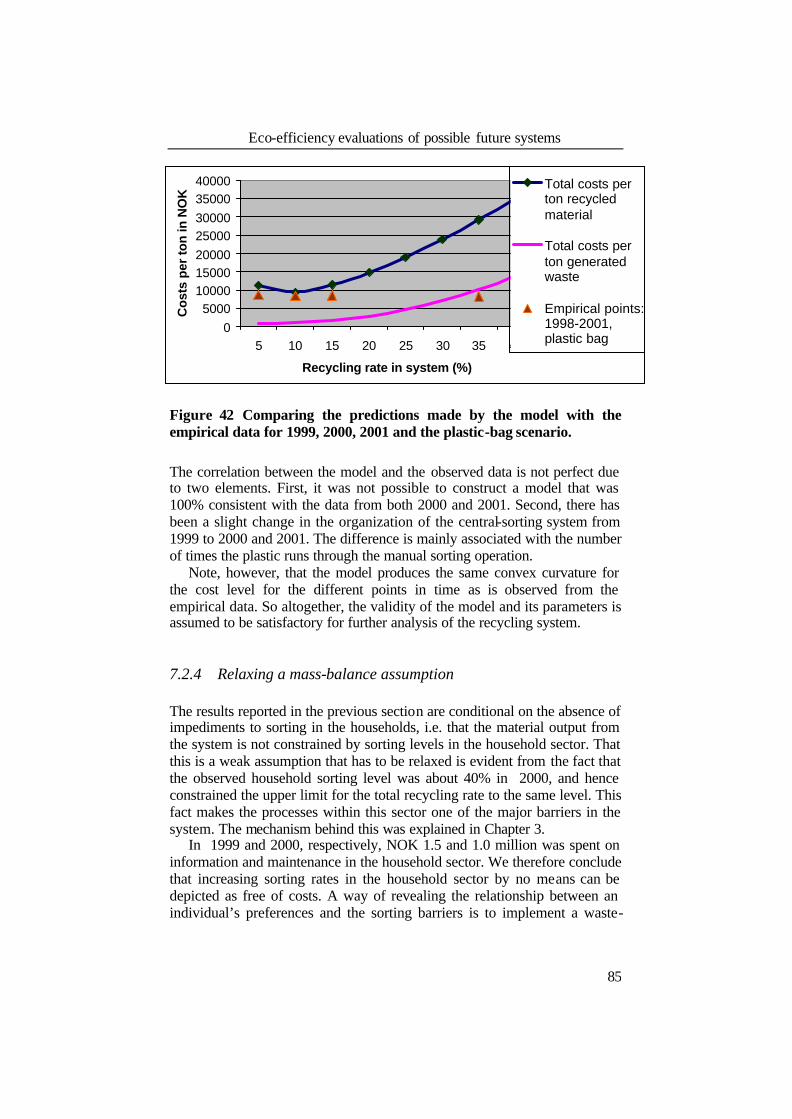
Eco-efficiency evaluations of possible future systems
85
05000
10000150002000025000300003500040000
5 10 15 20 25 30 35 40
Recycling rate in system (%)
Co
sts
per
ton
in N
OK
Total costs perton recycledmaterial
Total costs perton generatedwaste
Empirical points:1998-2001,plastic bag
Figure 42 Comparing the predictions made by the model with the empirical data for 1999, 2000, 2001 and the plastic-bag scenario.
The correlation between the model and the observed data is not perfect due to two elements. First, it was not possible to construct a model that was 100% consistent with the data from both 2000 and 2001. Second, there has been a slight change in the organization of the central-sorting system from 1999 to 2000 and 2001. The difference is mainly associated with the number of times the plastic runs through the manual sorting operation.
Note, however, that the model produces the same convex curvature for the cost level for the different points in time as is observed from the empirical data. So altogether, the validity of the model and its parameters is assumed to be satisfactory for further analysis of the recycling system.
7.2.4 Relaxing a mass-balance assumption
The results reported in the previous section are conditional on the absence of impediments to sorting in the households, i.e. that the material output from the system is not constrained by sorting levels in the household sector. That this is a weak assumption that has to be relaxed is evident from the fact that the observed household sorting level was about 40% in 2000, and hence constrained the upper limit for the total recycling rate to the same level. This fact makes the processes within this sector one of the major barriers in the system. The mechanism behind this was explained in Chapter 3.
In 1999 and 2000, respectively, NOK 1.5 and 1.0 million was spent on information and maintenance in the household sector. We therefore conclude that increasing sorting rates in the household sector by no means can be depicted as free of costs. A way of revealing the relationship between an individual’s preferences and the sorting barriers is to implement a waste-

Eco-efficiency evaluations of possib le future systems
86
treatment fee that varies with the amount of sorted material. If the individual chooses to start sorting when she can save money on the activity, this shows that the barrier to sorting represents a cost lower than the specific amount saved by this activity. However, implementing varying fees would result in household sorting rates being lower than 100%. This recognizes the fact that there are variable costs associated with sorting activities too high to counterbalance the utility of sorting. Consequently, we find that it is relevant to include the variable costs in the household sector in the subsequent analysis of cost-efficiency.
The relationship between barriers for sorting and households sorting rates is complex, and a thorough study is needed to reveal the mechanisms. We do not attempt this here. Rather we use a cost function where the households are assumed to use less than half a minute on sorting each day and that the alternative value of that time is NOK 3.5 per hour 12 (Bruvoll et al., 2000). This cost represents the barrier to higher sorting rates, and by expressing it in monetary terms we are able to model a mechanism causing one major bottleneck, namely the low material throughput in households.
The inclusion of costs associated with sorting barriers in the household sector must necessarily lead to an increase in unit costs. This reflects an important point, namely that some degree of effort is needed to raise the household sorting rate. Together with the fact that the behavior of the households is not a part of the optimizing procedure, proper mass-balance modeling requires an analysis based on the output of the first process in the material flow. Thus, we will hereafter illustrate the system for different exogenously determined household sorting rates.
7.2.5 Improving efficiency
In figure 42 we saw that an increase in the recycling rate from what has been observed will lead to substantially higher unit costs unless some changes are made within the present system. The underlying reason is of course that in the short run the capacity of the different processes is fixed, which makes the marginal costs increase steeply as we approach the maximum capacity of the input factors. Comparing the level of efficiency in the estimated model with the empirical data suggests that any efficiency gains due to economies of scale are not readily available in the existing system. We will therefore next analyze alternative measures for increasing the efficient recycling rates in this system.
12 This implies that the variable cost is NOK 3.5 for sorting over a period of 120 days for
one household. This amounts to NOK 10.6 per year per household.
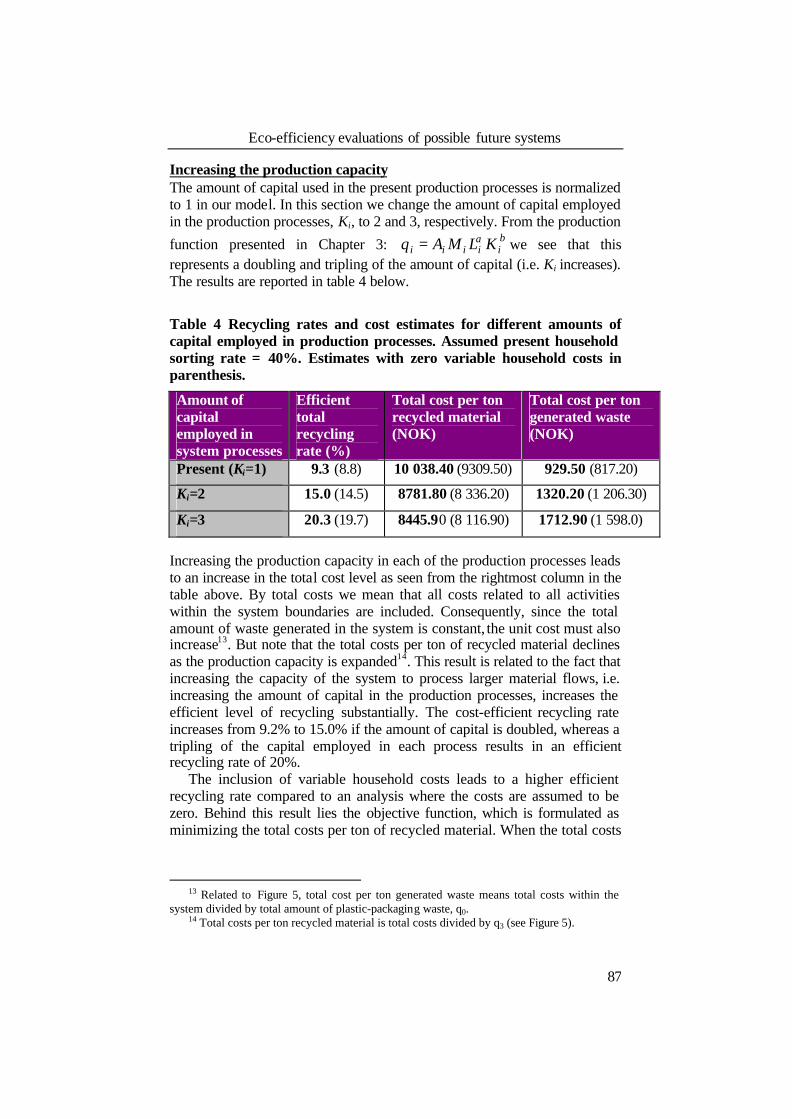
Eco-efficiency evaluations of possible future systems
87
Increasing the production capacity The amount of capital used in the present production processes is normalized to 1 in our model. In this section we change the amount of capital employed in the production processes, Ki, to 2 and 3, respectively. From the production
function presented in Chapter 3: βαiiiii KLMAq = we see that this
represents a doubling and tripling of the amount of capital (i.e. Ki increases). The results are reported in table 4 below.
Table 4 Recycling rates and cost estimates for different amounts of capital employed in production processes. Assumed present household sorting rate = 40%. Estimates with zero variable household costs in parenthesis.
Amount of capital employed in system processes
Efficient total recycling rate (%)
Total cost per ton recycled material (NOK)
Total cost per ton generated waste (NOK)
Present (Ki=1) 9.3 (8.8) 10 038.40 (9309.50) 929.50 (817.20)
Ki=2 15.0 (14.5) 8781.80 (8 336.20) 1320.20 (1 206.30)
Ki=3 20.3 (19.7) 8445.90 (8 116.90) 1712.90 (1 598.0)
Increasing the production capacity in each of the production processes leads to an increase in the total cost level as seen from the rightmost column in the table above. By total costs we mean that all costs related to all activities within the system boundaries are included. Consequently, since the total amount of waste generated in the system is constant, the unit cost must also increase13. But note that the total costs per ton of recycled material declines as the production capacity is expanded14. This result is related to the fact that increasing the capacity of the system to process larger material flows, i.e. increasing the amount of capital in the production processes, increases the efficient level of recycling substantially. The cost-efficient recycling rate increases from 9.2% to 15.0% if the amount of capital is doubled, whereas a tripling of the capital employed in each process results in an efficient recycling rate of 20%.
The inclusion of variable household costs leads to a higher efficient recycling rate compared to an analysis where the costs are assumed to be zero. Behind this result lies the objective function, which is formulated as minimizing the total costs per ton of recycled material. When the total costs
13 Related to Figure 5, total cost per ton generated waste means total costs within the
system divided by total amount of plastic-packaging waste, q0. 14 Total costs per ton recycled material is total costs divided by q3 (see Figure 5).

Eco-efficiency evaluations of possible future systems
88
of the system increase due to the household costs, it is optimal to increase the share of the waste being recycled in order to lower the unit costs.
Since it takes time to change the amount and type of capital used in the production processes, the different scenarios may represent different time perspectives. A possible interpretation of is therefore that in a longer time perspective, it will be efficient to recycle approximately 20% of the recyclable plastic packaging.
No efficiency gains due to further adjustments to the material inflow are considered here. The next section analyses the effect of fine-tuning the system towards the material inflow.
Fine tuning the system In a longer time perspective the managers of each process are able to adjust the production process, which means they are able to adjust the use of input factors to the amount of material inflow. This is modeled by making the material input in each process endogenously determined. In the production function βαγ
ii1iiii KLqmAq −= this means that qi-1 is not given from the existing system as we see it today but determined within the model.
Expanding the capacity in the production facility and making adjustments to the inflow of material are processes that take time to implement. A scenario where the amount of capital is relatively large along with a process tuned in to the given material inflow must therefore be interpreted as a long-run scenario.
Compared to the present system with a household sorting rate of 40%, an optimally adjusted system reduces the total cost per ton of recycled material by more than 20%, whereas the increase in the efficient recycling rate ranges from 2 to 8 percentage points, depending on the amount of capital employed (Table 5). Since the objective function is to minimize total costs per unit recycled material, we see that a fine tuning aimed at this specific goal makes the system less efficient when evaluated according to total costs per ton of generated plastic -packaging waste as this parameter increases relative to the present situation.
Table 5 The isolated effect of adjusting the processes optimally to the inflow of raw material on unit costs and efficient recycling rate. Shown for different amounts of capital and a household sorting rate of 40%.
Reduction in Amount of capital employed in processes
total cost per ton recycled material (%)
total cost per ton generated waste (%)
Increase in recycling rate measured in percentage points
Present (K i=1) 23.4 -43.5 8.1 Ki=2 23.5 -16.6 7.9 Ki=3 (long run) 21.5 -11.0 2.6
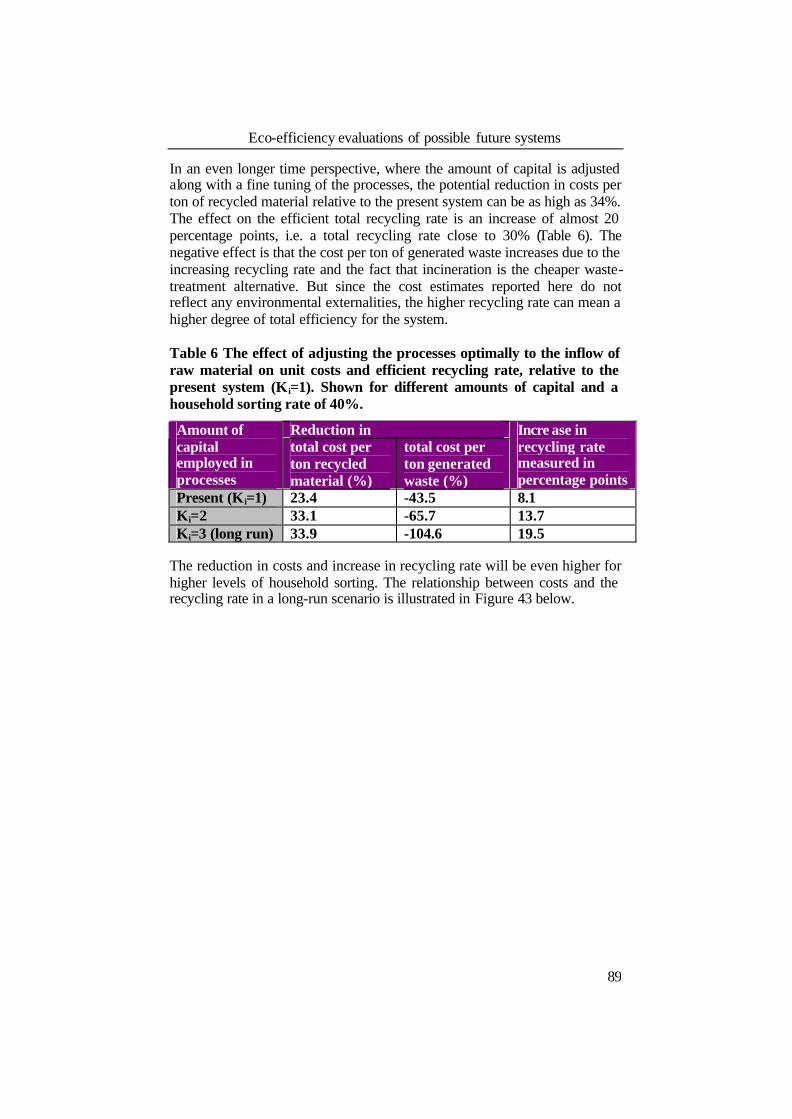
Eco-efficiency evaluations of possible future systems
89
In an even longer time perspective, where the amount of capital is adjusted along with a fine tuning of the processes, the potential reduction in costs per ton of recycled material relative to the present system can be as high as 34%. The effect on the efficient total recycling rate is an increase of almost 20 percentage points, i.e. a total recycling rate close to 30% (Table 6). The negative effect is that the cost per ton of generated waste increases due to the increasing recycling rate and the fact that incineration is the cheaper waste-treatment alternative. But since the cost estimates reported here do not reflect any environmental externalities, the higher recycling rate can mean a higher degree of total efficiency for the system.
Table 6 The effect of adjusting the processes optimally to the inflow of raw material on unit costs and efficient recycling rate, relative to the present system (K i=1). Shown for different amounts of capital and a household sorting rate of 40%.
Reduction in Amount of capital employed in processes
total cost per ton recycled material (%)
total cost per ton generated waste (%)
Incre ase in recycling rate measured in percentage points
Present (K i=1) 23.4 -43.5 8.1 Ki=2 33.1 -65.7 13.7 Ki=3 (long run) 33.9 -104.6 19.5
The reduction in costs and increase in recycling rate will be even higher for higher levels of household sorting. The relationship between costs and the recycling rate in a long-run scenario is illustrated in Figure 43 below.

Eco-efficiency evaluations of possible future systems
90
0
5000
10000
15000
20000
25000
30000
10 20 30 40 50 60 70 80Household sorting rate (%)
Co
st p
er t
on
(N
OK
)
0
10
20
30
40
50
60
70
Rec
yclin
g ra
te (
%)
Total cost perton recycledmaterial (NOK)
Total cost perton generatedwaste (NOK)
Total recyclingrate (%)
Figure 43 A long-run scenario for different household sorting rates where the amount of capital is 3 (in the present system it is normalized to 1) and where the processes are optimally adjusted towards the inflow of material. Costs per ton of recycled material and per ton of generated waste in addition to the total recycling rate are reported.
Reducing sorting barriers in the household sector In addition to a refund system, there are at least two alternative ways of increasing the household sorting rate that we pursue here. Reducing the number of fractions to be sorted can produce increased sorting efficiency, at least for the sorted material (SSB, 2000). The households can then spend their “sorting-time” on fewer fractions and both the quantity and quality may be boosted. The opposite is to increase the number of waste fractions so that it becomes easier to know where to put the different types of material, consequently increasing material output.
It is, of course, difficult to predict the outcome of changing the number of waste fractions without a thorough study of this particular problem. We base the costs in the household sector on a production function given as:
( ) 11 f4LqAq 1011βα −=
where q0 is the amount of generated waste in the household sector and f the number of fractions to be sorted. This is only meant to illustrate the basic relationship between costs and sorting, and not a full model of household behavior. Nevertheless, given the assumptions reported at the start of this section and utility maximizing individuals, a reduction in the number of fractions from 3 to 2 increases the household sorting rate by 20 percentage points to a new level of 60 percent.

Eco-efficiency evaluations of possible future systems
91
Changing the output of the household sector alone will not cause any change in the total recycling rate of the system unless the processes are adjusted to the larger flow of material. The effect on the efficient level of total recycling is therefore analyzed in a scenario where the processes are adjusted to the new situation. Results are reported in Table 7 below.
Table 7 Impact on total system from making the sorting in households more efficient together with adjustments for the inflow of material in each process for different time perspectives relative to the present system. (The number of waste fractions is reduced from 3 to 2, which leads to a household sorting rate of 60%).
Relative reductions in Amount of capital employed in processes
Increase in efficient total recycling rate (measured in percentage points)
total cost per ton recycled material (%)
total cost per ton generated waste (%)
Present (Ki=1) 18.0 47.1 -55.2 Ki=2 20.7 47.7 -24.3 Ki=3 24.1 46.7 -16.6
What we see is that the costs and efficient recycling rate of the system are greatly affected by the level of output in the first stage of the life cycle. An increase of 20 percentage points in the household sorting rate can lead to an increase in the total recycling rate by more than 100% in a long-run perspective. Moreover, we see a substantial reduction in costs per ton of recycled material of well above 40%. Note that this is based on optimally adjusted system processes and must therefore be interpreted as an upper limit for the potential efficiency gain from this measure. Nevertheless, this demonstrates how barriers in the first process in the recycling chain can have significant effects on the efficiency of the total system.
Introducing a dynamic element: Learning by doing, changes in efficiency As time goes by, people operating within the recycling system gain experience about each process and the way they interact with each other. From this one can expect an efficiency gain, also known as learning by doing (Arrow, 1962). Time in itself cannot explain increases in efficiency; it is the continuous existence of the system and the knowledge created from activities within the system that is the cause of increased efficiency. Our attempt to model this mechanism is made very simple as a general increase in efficiency of 10% is expected. The question of how long the system has to operate in order to achieve this gain is not pursued here.
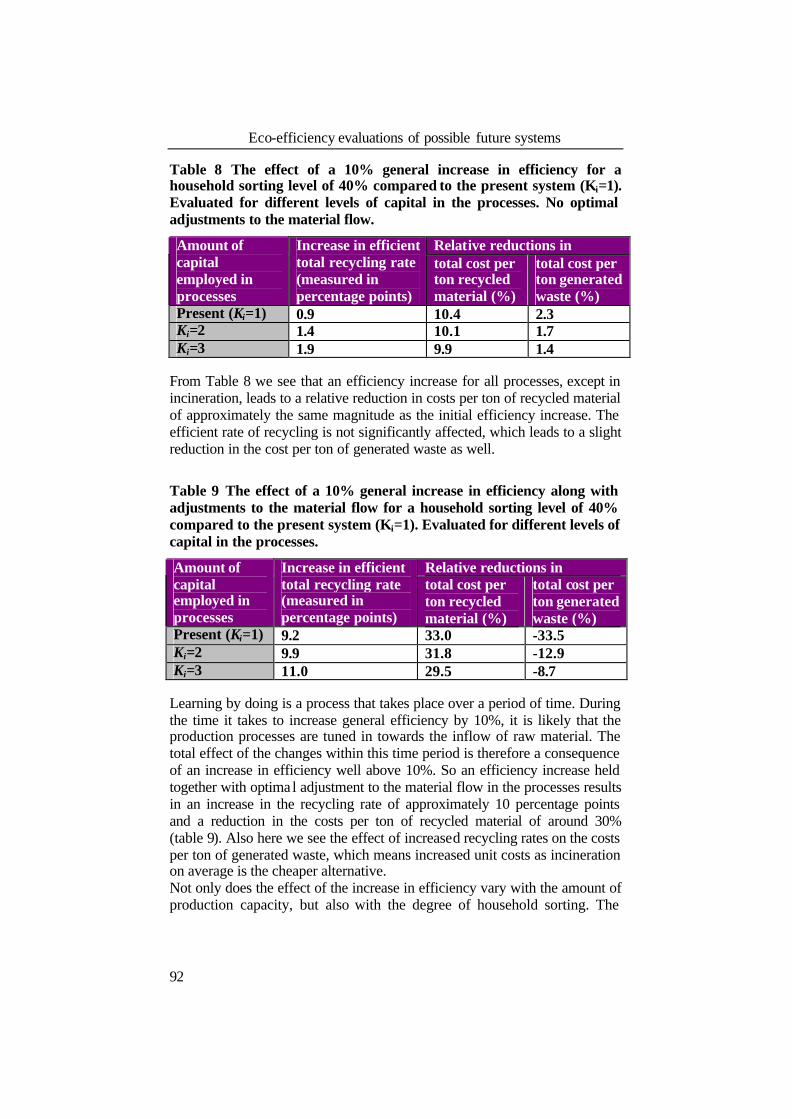
Eco-efficiency evaluations of possible future systems
92
Table 8 The effect of a 10% general increase in efficiency for a household sorting level of 40% compared to the present system (Ki=1). Evaluated for different levels of capital in the processes. No optimal adjustments to the material flow.
Relative reductions in Amount of capital employed in processes
Increase in efficient total recycling rate (measured in percentage points)
total cost per ton recycled material (%)
total cost per ton generated waste (%)
Present (Ki=1) 0.9 10.4 2.3 Ki=2 1.4 10.1 1.7 Ki=3 1.9 9.9 1.4
From Table 8 we see that an efficiency increase for all processes, except in incineration, leads to a relative reduction in costs per ton of recycled material of approximately the same magnitude as the initial efficiency increase. The efficient rate of recycling is not significantly affected, which leads to a slight reduction in the cost per ton of generated waste as well.
Table 9 The effect of a 10% general increase in efficiency along with adjustments to the material flow for a household sorting level of 40% compared to the present system (Ki=1). Evaluated for different levels of capital in the processes.
Relative reductions in Amount of capital employed in processes
Increase in efficient total recycling rate (measured in percentage points)
total cost per ton recycled material (%)
total cost per ton generated waste (%)
Present (Ki=1) 9.2 33.0 -33.5 Ki=2 9.9 31.8 -12.9 Ki=3 11.0 29.5 -8.7
Learning by doing is a process that takes place over a period of time. During the time it takes to increase general efficiency by 10%, it is likely that the production processes are tuned in towards the inflow of raw material. The total effect of the changes within this time period is therefore a consequence of an increase in efficiency well above 10%. So an efficiency increase held together with optima l adjustment to the material flow in the processes results in an increase in the recycling rate of approximately 10 percentage points and a reduction in the costs per ton of recycled material of around 30% (table 9). Also here we see the effect of increased recycling rates on the costs per ton of generated waste, which means increased unit costs as incineration on average is the cheaper alternative. Not only does the effect of the increase in efficiency vary with the amount of production capacity, but also with the degree of household sorting. The
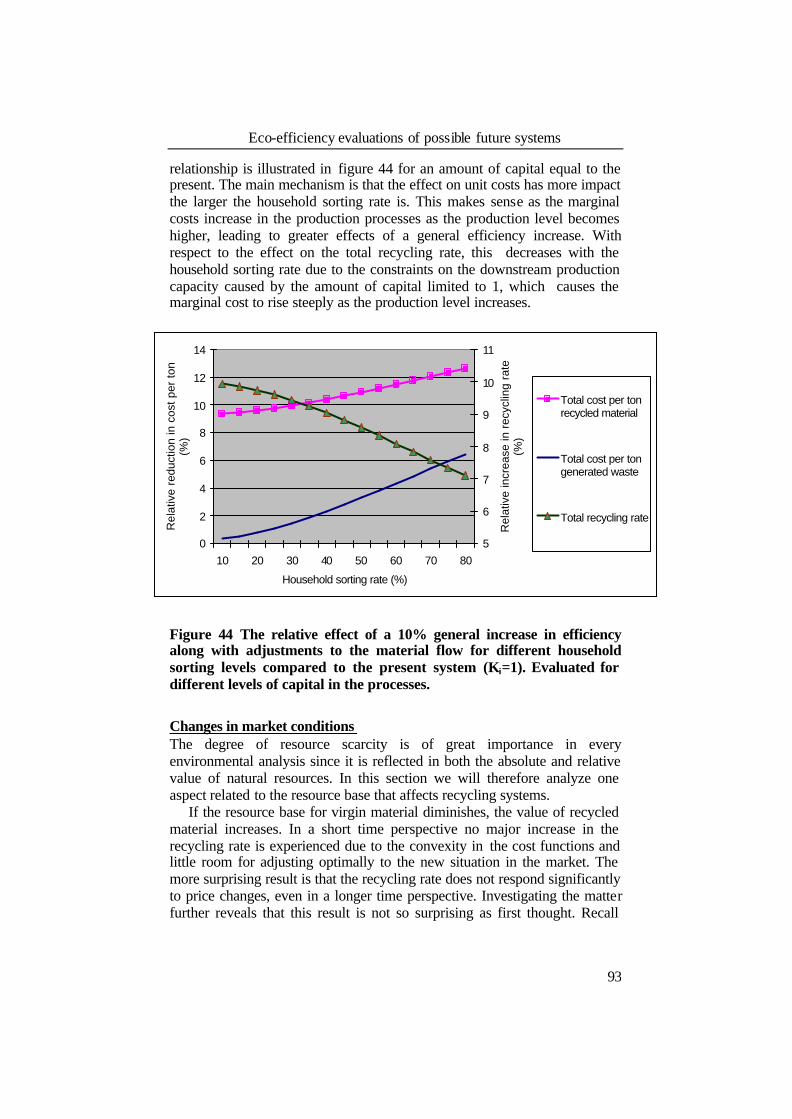
Eco-efficiency evaluations of possible future systems
93
relationship is illustrated in figure 44 for an amount of capital equal to the present. The main mechanism is that the effect on unit costs has more impact the larger the household sorting rate is. This makes sense as the marginal costs increase in the production processes as the production level becomes higher, leading to greater effects of a general efficiency increase. With respect to the effect on the total recycling rate, this decreases with the household sorting rate due to the constraints on the downstream production capacity caused by the amount of capital limited to 1, which causes the marginal cost to rise steeply as the production level increases.
0
2
4
6
8
10
12
14
10 20 30 40 50 60 70 80
Household sorting rate (%)
Rel
ativ
e re
duct
ion
in c
ost p
er to
n (%
)
5
6
7
8
9
10
11
Rel
ativ
e in
crea
se in
rec
yclin
g ra
te
(%)
Total cost per tonrecycled material
Total cost per tongenerated waste
Total recycling rate
Figure 44 The relative effect of a 10% general increase in efficiency along with adjustments to the material flow for different household sorting levels compared to the present system (Ki=1). Evaluated for different levels of capital in the processes.
Changes in market conditions The degree of resource scarcity is of great importance in every environmental analysis since it is reflected in both the absolute and relative value of natural resources. In this section we will therefore analyze one aspect related to the resource base that affects recycling systems.
If the resource base for virgin material diminishes, the value of recycled material increases. In a short time perspective no major increase in the recycling rate is experienced due to the convexity in the cost functions and little room for adjusting optimally to the new situation in the market. The more surprising result is that the recycling rate does not respond significantly to price changes, even in a longer time perspective. Investigating the matter further reveals that this result is not so surprising as first thought. Recall
Eco-efficiency evaluations of possible future systems
94
Figure 6 in Chapter 4.3 where it was shown that the mass balance greatly influences the characteristics of the cost curves. As long as the sorting rate in the household sector is not positively affected by the same cause that raised the price of recycled material, the determination of the overall recycling rate is dominated by the conditions in the upstream processes. It is hence important to note that the isolated effect of a price increase is a downward shift in the cost curve in the last process only.
If the cause underlying the increase in the market price also has a positive effect on the attitude towards sorting in the households, the effect on the recycling rate is likely to be significantly positive. However, a close study of the underlying cause is needed, since increased prices on recycled material can be explained by a variety of factors, such as political, social, business strategies, emergence of new products and changes in the resource base for virgin material.
7.2.6 Uncertainty and robustness
We must point out that the analysis deals with certain measures not observed in the system. Furthermore, the model used in the analysis in this section is based on data combined with calibration of the parameters where no data were available. How realistic the results from a model are compared to the real world depends on the amount of calibration needed and on the validity of the chosen functional forms. In our case, the uncertainty is mostly related to labor productivity and the different amounts of material input that affect the marginal costs.
Since the calibration is based on a specific case, the model and its results are not applicable to recycling systems in general. Nevertheless, the fundamental mechanisms similar to most recycling systems have been highlighted and we have tried to illustrate their impact on eco-efficiency.
7.2.7 A short summary
It is important to remember that in the analysis offered above, no environmental externalities are accounted for, and the model that we have used is based on a number of assumptions. Even though the model is very simple and results to some degree are uncertain, we can offer some insight into the cost-efficiency of recycling systems. These are summarized below:
• For the analysis to be relevant it is important that the law of mass conservation is properly reflected in the chosen model. The inclusion of mass-balance constraints has demonstrated that optimizing and expanding production capacities in the steps in the recycling system increases efficiency greatly, but may not be a cost-efficient policy if the

Eco-efficiency evaluations of possible future systems
95
material output from households constrains the recycling rate of the system.
• Since household sorting is of crucial importance for the eco-efficiency improvements, it is probably well worth looking into ways of increasing the sorting rate in the household sector. What our analysis has shown is that simplifying the household sorting process increases not only the household sorting rate but also the overall recycling rate, in addition to greatly reducing unit costs. Therefore this kind of change will produce significant contributions to increasing eco-efficiency. Ways of increasing output in the household sector can be to design waste fee-refund systems or implement more sophisticated technology in sorting and collection of municipal waste.
• The importance of continuation of systems in order to realize efficiency gains related to learning by doing is demonstrated by our analysis of a general 10% increase in efficiency. The danger of relying heavily on the continuation argument is technology lock-ins, which can lead to missing out on potentially larger efficiency gains connected to alternative recycling strategies.
• The importance of the early processes in the life cycle is illustrated by our finding that a price increase for recycled material is not very effective since the conditions in the upstream processes potentially dominate the effect in the last process.
7.3 Eco-efficiency evaluation of possible future recycling chains
7.3.1 Introduction
In Chapter 5, we found that the current plastic -recycling systems are far from good enough. This relates especially to recycling rates and cost. In Chapter 7.2, the importance of consumer participation, and high sorting rates in the early phases has been emphasized. In this section we will present two scenarios on how plastic packaging can be recycled in a more efficient manner, these are described in more detail in Chapter 4.4. The first, “Pla stic Bag”, is based on a collection solution that is successfully running in municipalities in the Molde region today, and the second, “Intelligent Igloo”, is more a future solution. Intelligent igloo is based on a combination of today’s igloo collection, with a further developed recognition, sorting and compacting technology borrowed from Reverse Vending Machines (“Pantemaskiner”). This solution can include different incentive programs to increase participation.
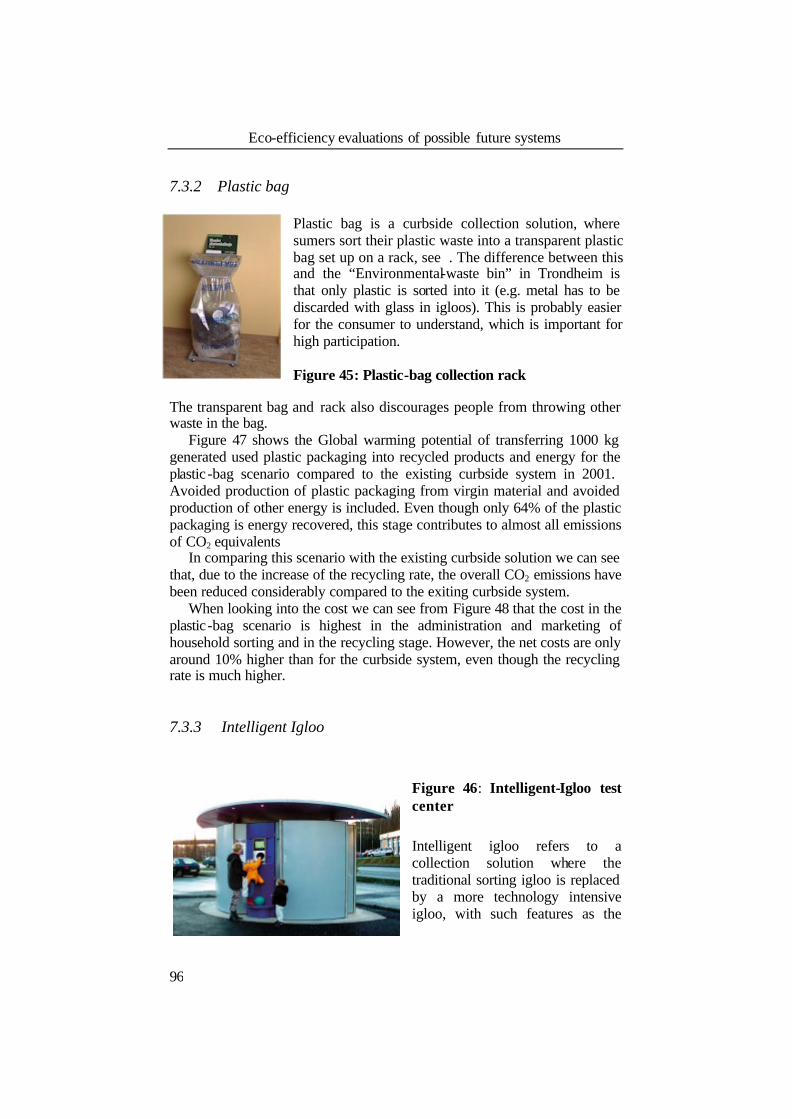
Eco-efficiency evaluations of possible future systems
96
7.3.2 Plastic bag Plastic bag is a curbside collection solution, where sumers sort their plastic waste into a transparent plastic bag set up on a rack, see . The difference between this and the “Environmental-waste bin” in Trondheim is that only plastic is sorted into it (e.g. metal has to be discarded with glass in igloos). This is probably easier for the consumer to understand, which is important for high participation.
Figure 45: Plastic-bag collection rack
The transparent bag and rack also discourages people from throwing other waste in the bag.
Figure 47 shows the Global warming potential of transferring 1000 kg generated used plastic packaging into recycled products and energy for the plastic -bag scenario compared to the existing curbside system in 2001. Avoided production of plastic packaging from virgin material and avoided production of other energy is included. Even though only 64% of the plastic packaging is energy recovered, this stage contributes to almost all emissions of CO2 equivalents
In comparing this scenario with the existing curbside solution we can see that, due to the increase of the recycling rate, the overall CO2 emissions have been reduced considerably compared to the exiting curbside system.
When looking into the cost we can see from Figure 48 that the cost in the plastic-bag scenario is highest in the administration and marketing of household sorting and in the recycling stage. However, the net costs are only around 10% higher than for the curbside system, even though the recycling rate is much higher.
7.3.3 Intelligent Igloo
Figure 46: Intelligent-Igloo test center
Intelligent igloo refers to a collection solution where the traditional sorting igloo is replaced by a more technology intensive igloo, with such features as the
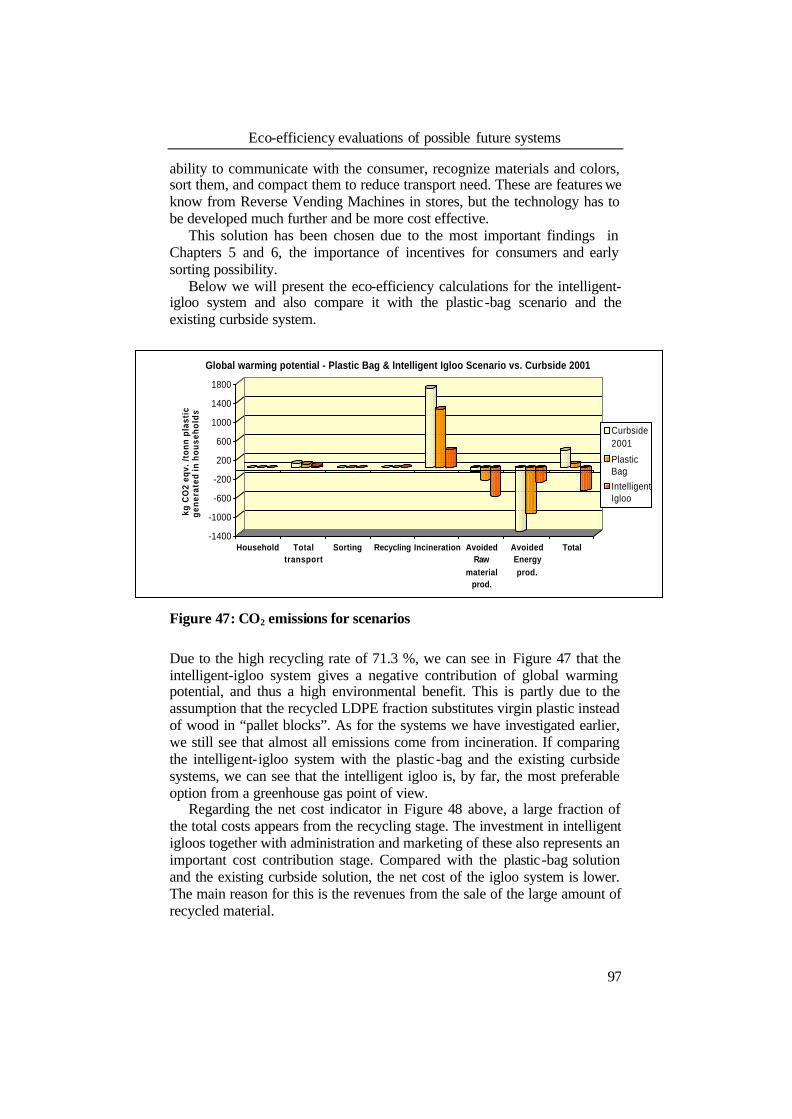
Eco-efficiency evaluations of possible future systems
97
ability to communicate with the consumer, recognize materials and colors, sort them, and compact them to reduce transport need. These are features we know from Reverse Vending Machines in stores, but the technology has to be developed much further and be more cost effective.
This solution has been chosen due to the most important findings in Chapters 5 and 6, the importance of incentives for consumers and early sorting possibility.
Below we will present the eco-efficiency calculations for the intelligent-igloo system and also compare it with the plastic -bag scenario and the existing curbside system.
-1400
-1000
-600
-200
200
600
1000
1400
1800
kg C
O2
eqv.
/ton
n pl
asti
c g
ener
ated
in h
ou
seh
old
s
Household Totaltransport
Sorting Recycling Incineration AvoidedRaw
materialprod.
AvoidedEnergyprod.
Total
Global warming potential - Plastic Bag & Intelligent Igloo Scenario vs. Curbside 2001
Curbside2001
PlasticBagIntelligentIgloo
Figure 47: CO2 emissions for scenarios
Due to the high recycling rate of 71.3 %, we can see in Figure 47 that the intelligent-igloo system gives a negative contribution of global warming potential, and thus a high environmental benefit. This is partly due to the assumption that the recycled LDPE fraction substitutes virgin plastic instead of wood in “pallet blocks”. As for the systems we have investigated earlier, we still see that almost all emissions come from incineration. If comparing the intelligent-igloo system with the plastic -bag and the existing curbside systems, we can see that the intelligent igloo is, by far, the most preferable option from a greenhouse gas point of view.
Regarding the net cost indicator in Figure 48 above, a large fraction of the total costs appears from the recycling stage. The investment in intelligent igloos together with administration and marketing of these also represents an important cost contribution stage. Compared with the plastic-bag solution and the existing curbside solution, the net cost of the igloo system is lower. The main reason for this is the revenues from the sale of the large amount of recycled material.
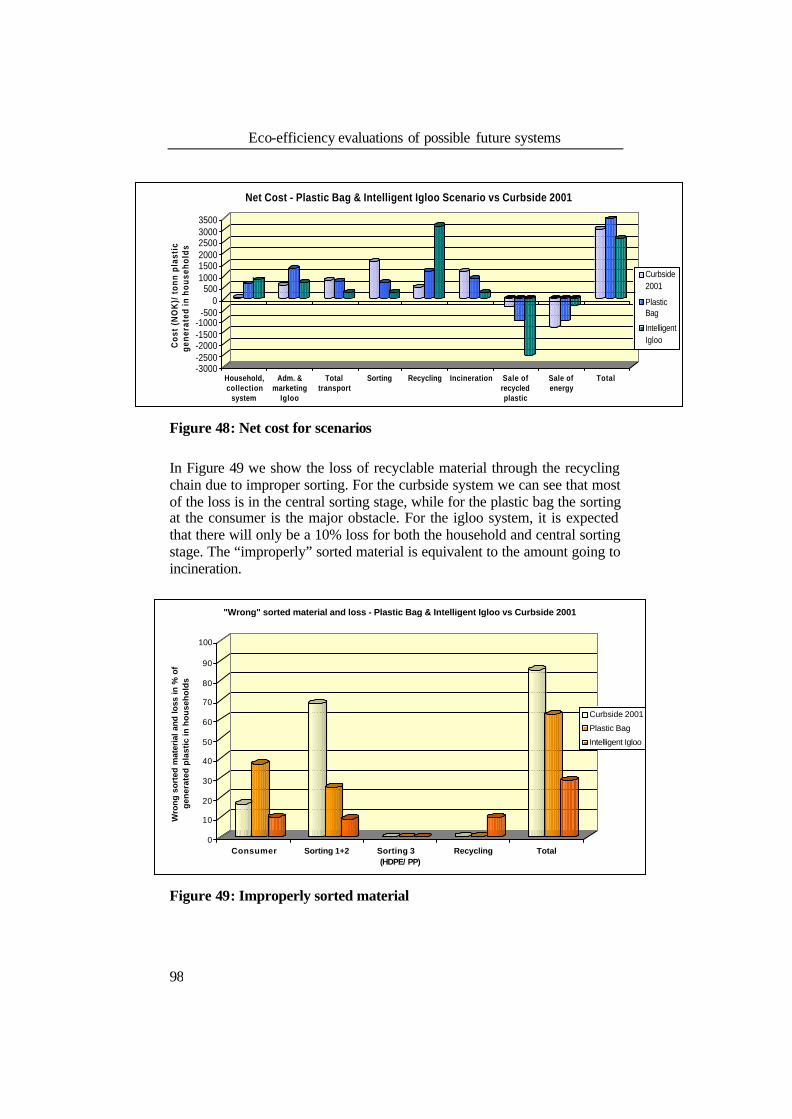
Eco-efficiency evaluations of possible future systems
98
-3000-2500-2000-1500-1000
-5000
500100015002000250030003500
Cos
t (N
OK
)/ t
onn
plas
tic
gene
rate
d in
hou
seho
lds
Household,collection
system
Adm. &marketing
Igloo
Totaltransport
Sorting Recycling Incineration Sale ofrecycledplastic
Sale ofenergy
Total
Net Cost - Plastic Bag & Intelligent Igloo Scenario vs Curbside 2001
Curbside2001
PlasticBag
IntelligentIgloo
Figure 48: Net cost for scenarios In Figure 49 we show the loss of recyclable material through the recycling chain due to improper sorting. For the curbside system we can see that most of the loss is in the central sorting stage, while for the plastic bag the sorting at the consumer is the major obstacle. For the igloo system, it is expected that there will only be a 10% loss for both the household and central sorting stage. The “improperly” sorted material is equivalent to the amount going to incineration.
0
10
20
30
40
50
60
70
80
90
100
Wro
ng
so
rted
mat
eria
l an
d lo
ss in
% o
f g
ener
ated
pla
stic
in h
ou
seh
old
s
Consumer Sorting 1+2 Sorting 3 (HDPE/ PP)
Recycling Total
"Wrong" sorted material and loss - Plastic Bag & Intelligent Igloo vs Curbside 2001
Curbside 2001
Plastic Bag
Intelligent Igloo
Figure 49: Improperly sorted material

Eco-efficiency evaluations of possible future systems
99
Table 10 shows all the calculated eco-efficiency indicators for the three systems. From this table and the eco-efficiency compass in figure 50, we can see that the intelligent-igloo scenario is the best on all indicators. The plastic-bag scenario is the second best on all the eco-efficiency indicators, except from a cost point of view, where the existing curbside system is slightly better.
Table 10: Eco-efficiency indicator quantified for scenarios, gross and net values
Recycled fraction %Curbside 2001 15,3Plastic Bag 37,6Intelligent Igloo 71,3
Cost + Sale of Material & Energy = Net cost (NOK/ tonn)Curbside 2001 4692 -1677 3015Plastic Bag 5413 -1943 3470Intelligent Igloo 5449 -2828 2621
CO2-eqv. + Avoided Material & Energy = Net CO2-eqv (kg/ tonn)Curbside 2001 1775 -1407 368Plastic Bag 1318 -1230 88Intelligent Igloo 433 -904 -471
Energy consumption + Avoided Material & Energy = Net energy consumption (10 MJ/tonn)Curbside 2001 147 -2434 -2287Plastic Bag 132 -2415 -2283Intelligent Igloo 98 -2573 -2475
HTP Cancer + Avoided Material & Energy = Net HTP Cancer (kg benzene eqv./ tonn)
Curbside 2001 1451 -2 1448Plastic Bag 1075 -2 1073Intelligent Igloo 189 -1 188
HTP Noncancer + Avoided Material & Energy = Net HTP Noncancer (tonn toluene eqv./tonn)
Curbside 2001 1896 -3 1893Plastic Bag 1405 -3 1403Intelligent Igloo 250 -1 249
Eco- Efficiency Indicator values
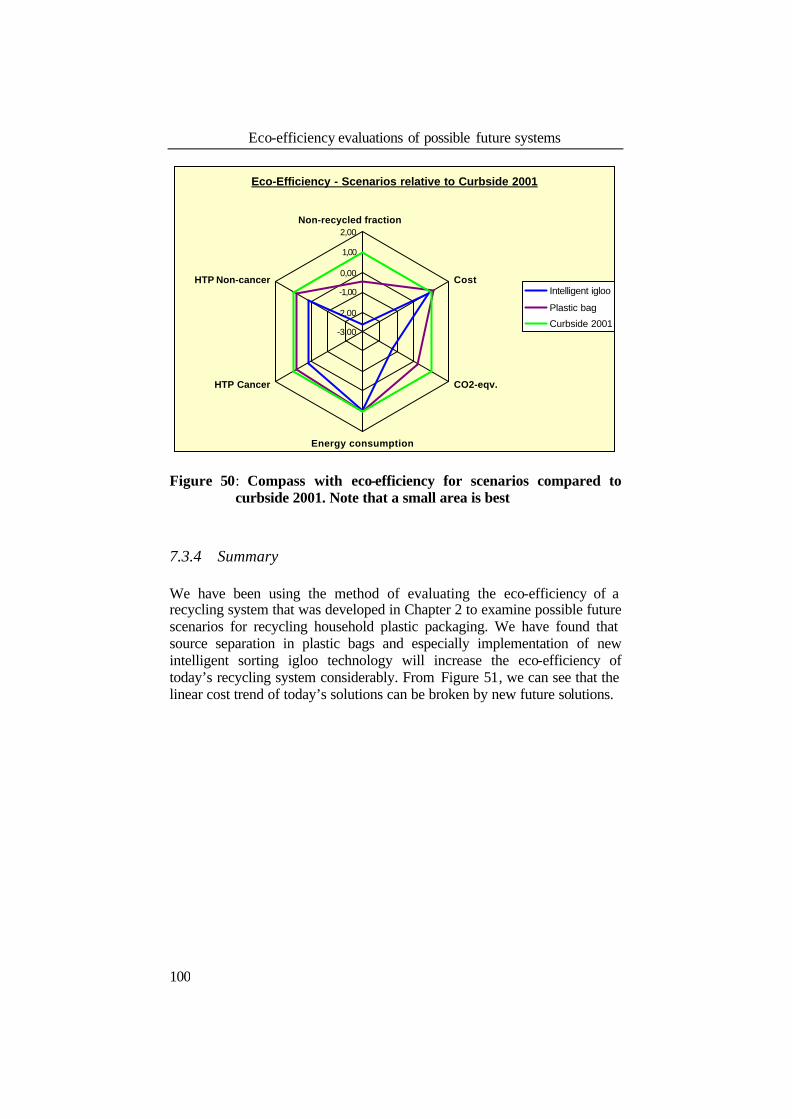
Eco-efficiency evaluations of possible future systems
100
Eco-Efficiency - Scenarios relative to Curbside 2001
-3,00
-2,00
-1,00
0,00
1,00
2,00Non-recycled fraction
Cost
CO2-eqv.
Energy consumption
HTP Cancer
HTP Non-cancerIntelligent igloo
Plastic bag
Curbside 2001
Figure 50: Compass with eco-efficiency for scenarios compared to curbside 2001. Note that a small area is best
7.3.4 Summary
We have been using the method of evaluating the eco-efficiency of a recycling system that was developed in Chapter 2 to examine possible future scenarios for recycling household plastic packaging. We have found that source separation in plastic bags and especially implementation of new intelligent sorting igloo technology will increase the eco-efficiency of today’s recycling system considerably. From Figure 51, we can see that the linear cost trend of today’s solutions can be broken by new future solutions.

Eco-efficiency evaluations of possible future systems
101
Net Cost and Global Warming potential as a function of % recycling
-9000
-5000
-1000
3000
7000
11000
0 20 40 60 80 100
Recycling rate
1/10 kg CO2- eqv
Cost NOK
Figure 51: Net cost and CO2 as functions of recycling rate for all solutions
Recycling rate
1. Energy recovery 0,02. Igloo 2001 4,8
3. Curbside 1999 5,5
4. Curbside 2000 11,45. Curbside 2001 15,3
6. Plastic Bag 37,6
7. Resirk Deposit PET 54,08. Intelligent Igloo 71,3
New solutions

103
8 DISCUSSION
The aim of this project has been to develop methods for the evaluation of eco-efficiency in a recycling system, and thereafter apply these methods to evaluate current and possible future recycling systems.
8.1 A static eco-efficiency approach
It may be argued that the static method we have developed is not that different from the traditional method of life-cycle assessment (LCA). This is in part true, even though life-cycle evaluations based on a combination of environmental and economic data are not very common. Nevertheless, we use LCA in part as the basis for method development and thereby include the strengths of this method, such as systematic definitions of system borders and functional units. However, in addition to the end-of-life cycle focus from LCA, we also adopt the flexibility from the eco-efficiency and indicator development fields. Another strength of the method is that we take both a system and a company perspective to evaluate the system, and to identify improvement potentials for the companies in the analyzed recycling systems. We think this is a valuable contribution, as the focus in LCA is mainly on the system level, while the concept of eco-efficiency mostly focuses on one company’s performance. In our method the focus is on the defined recycling-system level, which is the level where improvements must be made. However, in order to identify and put the improvement potential into effect, the development and use of indicators at the activity/company level is an important part of our method.
One problem when carrying out analyses using our method (and also LCA and other methods) is the danger of sub-optimization. When focusing on evaluating and improving a recycling system, defined by a material fraction and geographical area, there is the danger of neglecting other product, material or recycling systems. Optimization of one system may lead to deterioration of another. We cannot guarantee that such a sub-optimization is carried out when applying our method. We can only encourage the users of the method to be aware of the potential problem, and as far as possible, avoid it when defining the system in Step 1 of the method.
We have carried out a comprehensive study on evaluating current and future recycling systems, and we have to a certain extent identified improvement potential and developed company-specific indicators. However, we have not carried out the step of implementation and testing of indicators on the company level. Until this has been carried out, we cannot discuss the extent to which it is realistic to develop and use company-

Discussion
104
specific indicators that a) work as a basis for eco-efficiency improvements of the whole recycling chain and b) are appropriate for decision making within the activities in the recycling chain. We recommend that this, together with more comprehensive work on improvement potential and the corresponding indicators, be carried out in a further study.
Does the method really evaluate the eco-efficiency of recycling systems? The answer to this question is of course dependent on how eco-efficiency is understood and perceived. We have used the work on eco-efficiency by the World Business Council on Sustainable Development (WBCSDs) as the starting point for developing our method and the indicators. We have extended the WBCSD's company approach, identified important environmental and economic issues within recycling systems and thereafter modified the WBCSD's indicators based on these findings. This should be in line with the WBCSD's opinion, since they argue that companies also should consider developing indicators that are based on larger parts of the life cycle of product or materials. Eco-efficiency, moreover, is claimed to be a flexible and open approach and from this perspective it should be legitimate to extend the main focus to the recycling-system level. Another question is the extent to which the generally applicable indicators and the system-specific indicators are appropriate for evaluating current or possible future systems, and to what extent the company-specific indicators are appropriate as an information basis to release improvement potential at the company level. We argue that development of indicators is a value-based occupation, and that is no such thing as a best objective indicator. An appropriate indicator is relevant and understandable and is good as long as it gives useful information for the decision makers to help the business change and improve its environmental and economic performance and the recycling system it is a part of. By including the decision makers in the development of indicators, we are convinced that these criteria are to a large extent met if the method is applied in an appropriate way. However, our method and indicators are not able to give the complete economic and environmental picture of the analyzed recycling systems. Neither is the method able to give fully scientific answers to questions concerning the extent to which one waste-management option is better than another, from an economic, as well as an environmental point of view. The eco-efficiency method is first of all helpful because it gives indications of the strengths and weaknesses of existing and future recycling systems.
In this report we have been concerned about how to present the eco-efficiency indicators in a clear and understandable way. As discussed above, eco-efficiency indicators should not be expressed as ratios if this does not give the appropriate type of information for decision makers. We have avoided the use of such ratios due to the fact that they gave both potentially misleading and confusing information. We have presented them indicator by indicator, with a special focus on CO2-equivalent emissions and cost. One might argue that it is difficult to make decisions on the basis of economy and

Discussion
105
ecology when the indicators are not aggregated to one single eco-efficiency indicator. In our opinion such aggregation often can be misleading and give non-transparent results. We suggest that the decision makers undertake their own valuation of economic and environmental indicators. For one decision maker the cost may be the most important factor, while another may be more concerned about toxic emissions. We have made our conclusions in the report on economic issues (cost) on the one hand and environmental issues (CO2 emissions, energy, recycling rate and toxic emissions) on the other. Nevertheless, some may argue that it is not easy to make decisions based on more than one indicator, and thus that a weighting procedure between the indicators should be carried out, which for instance turns different indicators into one indicator expressed by monetary value. However, since not all environmental impacts are included in the method, such a valuation will not give a full overview of the overall costs in any case. Another reason to avoid this is that single indicators on various economic and environmental issues make it less transparent for the decision maker. Furthermore, (correct) market prices are often non-existent, making calculated costs very uncertain.
8.2 Who can apply the static method?
An expert is needed to perform the analysis and to ensure involvement of the current actors/companies in the recycling system. Moreover, each company needs a skilled person to participate in the analysis group and in the development, implementation and follow up of the company-specific indicators. Even though to some extent we have tested our method, we do not yet know how applicable the method is for other users. Is it too complicated? Evaluating the eco-efficiency of the defined recycling system (Steps 1 to 4) should be about as complicated as a standard LCA, even though the system-specific indicators must be developed by the persons carrying out the analysis. However, since the method also includes the important part of identification of improvement potential in the recycling system, as well the development of company-specific indicators (Step 5), some resources in terms of time and money are probably required.
In the development of company-specific indicators an important question may arise: How can we be sure that company-specific indicators that measure improvements for the system at the same time indicate a change for the better from the individual company’s point of view? As mentioned above, as we have not fully developed the company-specific indicators we are unable to answer this question at this stage. However, in our dynamic cost-efficiency approach for measuring eco-efficiency, we sketch the trade-offs between efficient production levels in the individual processes and the level that improves efficiency in the overall system, and hence the need for side payments within the system. Although we do not reach a conclusion on this specific matter, our method offers a broader insight on these potential

Discussion
106
contradictions. We recommend that the condition between what is eco-efficient for the recycling systems and what is good for each of the companies in the systems should be investigated in further studies.
We have used the plastic -packaging cases to develop the method. To test and improve the applicability of the method a comprehensive study of another recycling system should also be carried out.
8.3 A more dynamic approach
As an addition to the static eco-efficiency method we have also developed and applied a more dynamic method for evaluating the eco-efficiency of recycling systems by means of the cost- and %-recycled indicators. Since the amount of available data is too small to undertake a valid regression analysis, we have combined the data at hand with theoretical knowledge to estimate the relationship between economic costs and various recycling rates. The shortcoming of this approach is of course that the model is a theoretic construction resting on relatively few empirical findings. Our estimates must therefore be viewed as expected values within a confidence interval that depends on the assumptions made in advance. Since our model, like every model, is based on certain assumptions, the application of it requires a certain amount of practical and theoretical knowledge, making the results to some degree uncertain. Nevertheless, our contribution to discussions on eco-efficiency is important for two reasons. First, as far as we know, we are among the first to try to estimate how the costs created within a recycling system are related to the law of mass conservation, production technology, learning by doing, the time perspective, and hence, related to different recycling rates. Second, since decisions concerning waste treatment policies cannot be based on purely static methods, the estimation of more dynamic cost-curves like ours is tantamount to acquiring the needed information. So even if our results are to some degree uncertain, they point to important mechanisms in the system that are crucial to be aware of when we want to evaluate efficiency.
8.4 What are the differences between the methods?
A main feature of this report is that our suggestions for improvement of the eco-efficiency in recycling systems are based on both a static and a more dynamic methodological approach. Although the two methods focus on different aspects of the system, they point to many of the same mechanisms that have impact on eco-efficiency. The main methodological difference between the methods is found along two different dimensions. First, they vary along the environment-economy dimension. Whereas the static method

Discussion
107
based on LCA focuses mainly on the environmental and economic impacts of the current situation, the more dynamic approximation deals with the production processes, the associated cost-structure and how these elements change as the businesses and the whole system produce various degrees of material recovery. Second, they are different in that the static approach is relatively more connected to empirical data, while the dynamic approach is a mix of empirical data and theoretical experiment, as it analyzes recycling rates not yet observed. The degree of methodological difference between the two methods is a strong point rather than a weakness because we have shown that focusing on static and dynamic conditions, respectively, leads to the same conclusions regarding eco-efficiency improvements.
Many studies have been carried out to give a more or less clear answer to the question regarding the extent to which recycling or recovery should be the prioritized waste-management strategy for plastic packaging. This has not been the aim of this study. We have rather focused on finding ways of improving the eco-efficiency for systems where recycling is the preferred option.
8.5 Findings
In this project we have quantified the eco-efficiency for handling and recycling/incineration of 1000 kg of potentially recyclable plastic packaging (mixed and PET bottles). This means that we are looking at the eco-efficiency of a generated fraction in households which is going to recycling or to incineration with energy recovery. However, in Chapter 6 and in part Chapter 7, we have also calculated the eco-efficiency for the recycled fraction only. Even though we have studied different solutions and systems and thus should be aware of drawing conclusions, it appears that an increased recycling rate gives improved environmental performance, but at the same time increased costs. The environmental gain is further increased if the energy produced from incineration mainly substitutes electricity from hydropower instead of mainly light oil, as we assume in the analysis. Additional environmental improvements will be obtained if we assume that re-granulate, instead of pallet blocks, are produced by the recycling companies. However, even if there appears to be a positive correlation between the recycling rate and improved environmental performance, the costs of recycling should be reduced noticeably to justify the strong emphasis on the highest possible recycling rate. We have shown that this is possible if changes in the source separation phase are introduced.
The intelligent-igloo scenario has shown that it is probably necessary to look beyond the limitations of today’s collection systems in order to find a truly eco-efficient solution for the future. Moreover, a holistic system perspective is crucial, and the changes must occur within the activities along the entire plastic-packaging material chain , not only along the recycling

Discussion
108
chain. Design and production of plastic packaging, source separation in households and sorting at a central sorting plant are the most important life-cycle stages in terms of improvement. In other words, the plastic packaging should be made easier to source separate, e.g. labeled and more standardized. However, in what manner this is realistic to obtain has not been analyzed in this report.
We have carried out an analysis for one geographical area, the city of Trondheim in Norway. As mentioned above, we believe that the methods developed are suitable for other systems as well. Regarding the results from the eco-efficiency analysis, our study does not allow us to claim that recycling is better than incineration with energy recovery in general or that a certain percentage of all plastic packaging should be recycled. We would, however, argue that our main conclusions on efforts introduced as early as possible in the life-cycle chain and the possibility of improving the eco-efficiency of present systems to a large extent should be valid for other plastic-packaging recycling systems as well.
109
9 CONCLUSION
We have developed a static and a more dynamic method for the evaluation of the eco-efficiency of recycling systems, and thereafter applied these methods on the systems for recycling of plastic packaging from households in the city of Trondheim, Norway. The static eco-efficiency analysis method should be carried out in six steps, where the first four steps focus on evaluating the eco-efficiency of a defined recycling system, while the last two steps put emphasis on identifying the improvement potentials within the recycling systems. Development and implementation of indicators for the various companies in the recycling chain are important elements of this process. In the dynamic method two of the developed indicators (% recycling and cost) in the static method are applied in the evaluation of the eco-efficiency of existing and future plastic -packaging recycling systems with a special focus on the production processes and the accompanying cost structure. Since the amount of available data is too limited to carry out a valid regression analysis, we have combined the data at hand with theoretical knowledge in order to estimate the relationship between economic costs and various recycling rates.
The eco-efficiency analysis of today’s recycling system for household plastic packaging from Trondheim shows that a great deal of work is required to reduce the costs and thus to justify the systems, even though we have shown that increased recycling rates give improved environmental performance. If the identified improvement potential is not realized, then incineration with energy recovery, instead of material recovery, may very well be a preferable option for the analyzed system. However, our analysis of possible future recycling systems has shown that recycling of relatively large amounts of the plastic packaging generated in households is preferable from an eco-efficiency point of view. To improve the efficiency of recycling systems we have found that efforts should be applied as early as possible in the life cycle of plastic -packaging material. Improved labeling and standardization of packaging, incentives and technology for improved source separation, and production of high-quality recycled products all play a decisive role for the eco-efficiency outcome of the future recycling systems.
Further work should be carried out to test the usefulness of developing and implementing indicators for the companies in the recycling chain, with the aim of improving the eco-efficiency of the recycling system. It is also important to extend the work on barriers and the improvement potential within the decisive household phase. An important question to be answered is what kind of incentive and technology is needed to obtain proper sorting among households. A reply to this, and other issues pointed out in this report, requires refinement of methods and is hence a starting point for further studies of eco-efficiency improvements.

111
10 REFERENCES Askham Nyland, C.: How LCA is used for Assessment of Waste
Management Systems, Including a Model Allowing for Recycling of Materials Several Times, Submitted to Journal of Life Cycle Assessment, November 2001
Association of Plastics Manufacturers in Europe (APME).: Internet: http://www.apme.org/literature/htm/home.htm
Arrow, K. : The Economic Implications of Learning by Doing, Review of Economic Studies 29, p. 62- 68., 1962
Bossel, H. : Indicators for Sustainable Development: Theory, Method, Applications. A report to the Balaton group. International Institute for Sustainable Development, Winnipeg, Canada, 1999
Bouman, M., Heijungs, R., van der Voet, E., van den Bergh, J. C. J. M., and Huppes, G. : Material flows and economic models: an analytical comparison of SFA, LCA and partial equilibrium models. Ecological Economics 32, p. 195-216, 2000
Brattebø, H. and Hanssen, O.J.: Productivity 2005 – Research plan P2005 Industrial ecology. IndEcol-report 1/2000. NTNU Industrial Ecology Programme, Trondheim, Norway, 2000
Bruvoll, A.: The costs of alternative policies for paper and plastics waste. Statistics Norway, 1998/2
Bruvoll, A., Halvorsen, B. and Nyborg, K. : Husholdningenes kildesortering, (Households' Sorting at the Source) Samfunnspeilet 4/2000, Statistisk Sentralbyrå, Oslo, 2000.
Econ: Miljøkostnader ved avfallsbehandling, (Environmental costs of waste treatment) ECON-rapport nr. 85/00, Oslo, 2000
Eggels, P.G., Ansems, A.M.M., van der Ven B.l. : Eco-efficiency of recovery scenarios of plastic packaging. Intended for Association of Plastics Manufacturers in Europe (APME). TNO-report TNO-MEP-R 2000/119. TNO Environment, Energy and Process Innovation, Apelddoorn, The Netherlands, 2000
Ehrenfeld, J.R.: “Industrial ecology: A strategic framework for product policy and other sustainable practices”. In Green Goods, edited by E.Ryden and J.Strahl. Kretsloppdelegationen. Rapport 1995:5.Stockholm
Ekvall, T and Tillmann, A.-M..: Open-Loop Recycling: Criteria for Allocation Procedures. J. of Industrial Ecology, 2 (3) 155-162, 1997
Ekvall, T and Finnveden, G.: Allocation in ISO 14041- a critical review. J. of Cleaner Production 9 (2001), 197-208
Eriksson, E., Ölund G.: Återvinna, förbränna eller deponera? Miljöanalys av producentansvaret för plastforpakningar (Recycling, energy recovery or landfill? Environmental analysis of producer responsibility for plastic

References
112
packaging), Department of Technical Environmental Planning, Chalmers University of Technology, Gothenburg, Sweden, 1999.
European Recovery and Recycling Association (ERRA): Value Chain Analysis: Evaluation of Recycling Cost and Benefit. Briefing Paper. ERRA.2000
Finnveden, G.: Methodological aspects of life cycle assessment of integrated solid waste management systems. Resources, conservation and recycling. 26(1999) 173-187. 1999
Fussler.C.: Driving Eco-innovation: A breakthrough discipline for innovation and sustainability. Pitman Publishing. London. 1996
Global Reporting Iniative: Guidelines on Corporate Sustainability Reporting.CERES. 1999
Graedel, T.and Allenby, B.: Industrial Ecology. Prentice Hall. 1995 GUA.: Evaluation of the Austrian Model for elaborating Cost-Benefit
Analysis in the field of waste management. Vienna, Austria, 1999 Guineé, J.B., Gorrée, M., Heijungs, R., Huppes, G., Kleijn, R., de Koning,
A., van Oers, L., Sleeswijk A.W., Suh, S., Udo de Haes, H.A., de Bruijn, H., van Duin, R., Huijbregts, M.A.J., Lindeijer, E., Roorda, A.A.H., van der Ven, B.L., Weidema, B.P.: Life cycle assessment - An operational guide to the ISO Standards, CML (Centre of Environmental Science), The Netherlands, May 2001. Soon available at Kluwer Academic Press
Hanssen, O.J.: Eco-efficiency vs Eco-effectiveness. Evaluating the environmental performance of products in a sustainable perspective. Submitted to Journal of Industrial Ecology, September 2001
HARVARD BUSINESS REVIEW: Harvard business review on managing the value chain, McGraw-Hill Publishing Company, 2000.
Hendrickson, C., Horvath, A., Joshi, S., and Lave, L. : Economic Input-Output Models for Environmental Life-Cycle Assessment. Environmental Science & Technology, (13) 4, p. 184A-191A. 2000
Hertwich, E.G., Hammitt, J.K., Pease, W.S.: A Theoretical Foundation for Life-Cycle Assessment: Recognizing the Role of Values in Environmental Decision Making. J. of Industrial Ecology, vol 4, no 1, 2000
Hertwich, E.G., Mateles S.F., Pease, W.S., McKone T.E.: Human Toxicity Potentials for Life Cycle Assessment and Toxics Release Inventory Risk Screening. Environmental Toxicology and Chemistry 20(4):928–939, 2001.
Interconsult: Analyse av avfall i Trondheim (Analysis of waste in Trondheim), November 2001
Joshi, S. :Product Environmental Life-Cycle Assessment Using Input-Output Techniques. Journal of Industrial Ecology 3, No. 2 & 3, p. 95-120. 2000
International Organizations for Standardization (ISO): The ISO 14031 standard: Environmental performance evaluation. 1999

References
113
International Organizations for Standardization (ISO): The ISO 14041 standard: Environmental management-Life Cycle Assessment- Goal and cope definition and inventory analysis. 1998
Meadows, D.: Indicators and Information Systems for Sustainable Develoment. A Report to the Balaton Group. Published by The Sustainability Institute, Hartland Four Corners VT 05049, September 1998
Matthews, E. , Amann, C., Bringezu, S., Fischer-Kowalski, M., Huttler, W., Kleijn, R., Moriguchi, Y., Otke, C., Rodenburg, E. Rogich, D., Schandl, H. , Schutz, H. van der Voet, E. & Weiss, H.: The weight of nations, material outflows from industrial economies. World Institute Report, Washington DC. 2000
Matthews, H.,S. and Small, M.J.: Extending the boundaries of life-cycle assessment through environmental economic input-output models, Journal of Industrial Ecology 4, p. 7-10. 2000
McDonough, W. and Braungart, M. The NEXT Industrial Revolution, The Atlantic Monthly, 282 (4).1998.
Møller, H., Olsen, A., Hanssen, O.J.: Utviklingen i materialeffektivitet i norsk emballasjesektor 1995-2000 (Development of material efficiency in the Norwegian packaging sector). Østfold Research Foundation, OR 14.01, Fredriksatd, Norway, April 2001
NORDEPE: Nordic project for Development and Implementation of Environmental Performance indicators in Industry. Main report. Nordic Industrial Fund 2001
Norwegian Research Council: Bærekraftig utvikling – Øko-effektivitet og industriell utvikling.. Report from the conference 21-22 March 2000, Norwegian Research Council, Oslo, Norway, 2000
Organisation for economic co-operation and development (OECD): Extended producer responsibility – A guidance manual for governments, OECD, 2001
OECD: Eco-efficiency. Paris, 1998 Raadal, H. et al.: Recycling of plastic packaging waste in the Drammen
region of Norway, Østfold Research Foundation. 1999 Schmidheiny, S.: Changing course: A global Business Perspective on
Development and the Environment. Cambridge, MA, The MIT Press. 1992
Statens forurensingstilsyn (SFT): Utslipp ved håndtering av kommunalt avfall (Emissions from treatment of municipal waste). Rapport 96:16. Statens forurensingstilsyn 1996.
Song, H.-S. and Hyun, J.C.: A study on the comparison of the various waste management scenarios for PET bottles using the life-cycle assessment (LCA) methodology, Resources, Conservation and Recycling 27(1999), 267-284

References
114
Verfaillie, H.A., Bidwell, R. : Measuring eco-efficiency – a guide to reporting company performance. World Business Council on Sustainable Development, 2000
Weitz, K. et al.: Life Cycle Management of Municipal Solid Waste. Int. J.LCA 4 (4) 195-201. 1999
World Business Council for Sustainable Development: Eco-efficiency- creating more value with less impact, World Business Council on Sustainable Development, 2000
Weaver, P. M., Gabel, H. L., Bloemhof-Ruwaard, J. M., and van Wassenhove, L. N.: Optimizing Environmental Product Life Cycles. A Case Study of the European Pulp and Paper Sector. Environmental and Resource Economics 9, p. 199-224. 1997
World Commission on Environment and Development. Our common future. 1987
Wollrad, V. and Scmied, M.: Assessment of Plastic Recovery Options. Commissioned by the EEB, Brussel. 2000
Wrisberg, M. N. (ed).: Analytical tools for environmental design and management in a systems perspective. Centre of Environmental Science, Leiden., 2000, Soon available at Kluwer Academic Press
Økstad, E. and Grøm, E.H.: Environmental performance indicators for local communication. Case-report in NORDEPE-project, Nordic Industrial Fund, 2000
115
11 APPENDIX
A1 – Participants A2 - Dynamic approach, theoretical background A3 - Data and assumptions
For mixed plastic packaging recycling, curbside and igloo a) Material flow, curbside
Environmental data, curbside b) Economic data, curbside c) Material flow, igloo d) Environmental data, igloo e) Economic data, igloo
§ For data on one-way PET deposit system contact Jarle Grytli at Norsk
Resirk for approval, then Solveig Steinmo at Tomra for the data. § For questions about data on Plastic Bag and Intelligent Igloo scenario
contact Solveig Steinmo at Tomra.
A4 - Classification parameters a) CO2- eqivalents and energy b) Human toxicity potential

Appendix
116
APPENDIX 1 Participants
Participant Role Contact person Case Ministry of Environment (MD)
Governmental Ellen Hambro* Source separation mixed plastic
Norwegian Pollution Control Authority (SFT)
Governmental Kristin Dagenborg* and Rune Opheim*
Source separation mixed plastic
Plastretur Material company (coordinator)
Frode Syvertsen* Geir Schefte, Peter Sundt
Source separation mixed plastic
Trondheim Kommune- Avfallsseksjonen
Governmental (municipality)
Knut J.Bakkejord* Geir Hanssen
Source separation mixed plastic
Romsdalshalvøens Inter-kommunale Miljøverk
Governmental (municipalities)
Berit Øren Follo Source separation mixed plastic
Trondheim Renholdsverk
Renovation and sorting
Lars Volden/Astrid Solheim*
Source separation mixed plastic
Søre Sunnmøre Reinhaldsverk
Central sorting Lars Rune Skeide Source separation mixed plastic
Norsk Gjenvinning avd. Midt-Norge
Renovation Torgrim Aalmo* Source separation mixed plastic
Plastgjenvinning i Tydal
Recycler Jens Arne Kvello* Source separation mixed plastic
Heimdal Resirk Recycler Steffen Rogstad* Source separation mixed plastic
Folldal Gjenv. Recycler Torbjørn Rogstad* Source separation mixed plastic
Trondheim Energiverk
Incineration Bente Soreng* Source separation mixed plastic
Plaståtervinning (Sverige)
Sorting and Recycling
Leif Andersson Source separation mixed plastic
Plaståtervinning, Tøckfors
Recycling Lasse Andersson* Source separation mixed plastic
Norsk Resirk Material company (coordinator)
Jarle Grytli* Deposit PET-system
Strandplast Recycler Kaj Strand* Deposit PET-system Orkla Foods Packer and filler Ole Petter Trovaag * Deposit PET-system Superfoss Packaging Manufacturer of
one-way PET bottles
Svein Arnesen Deposit PET-system
Tomra (management/ R&D)
Reverse vending machine
Terje Hanserud *
Deposit PET-system
*Interviews have been carried out with these persons
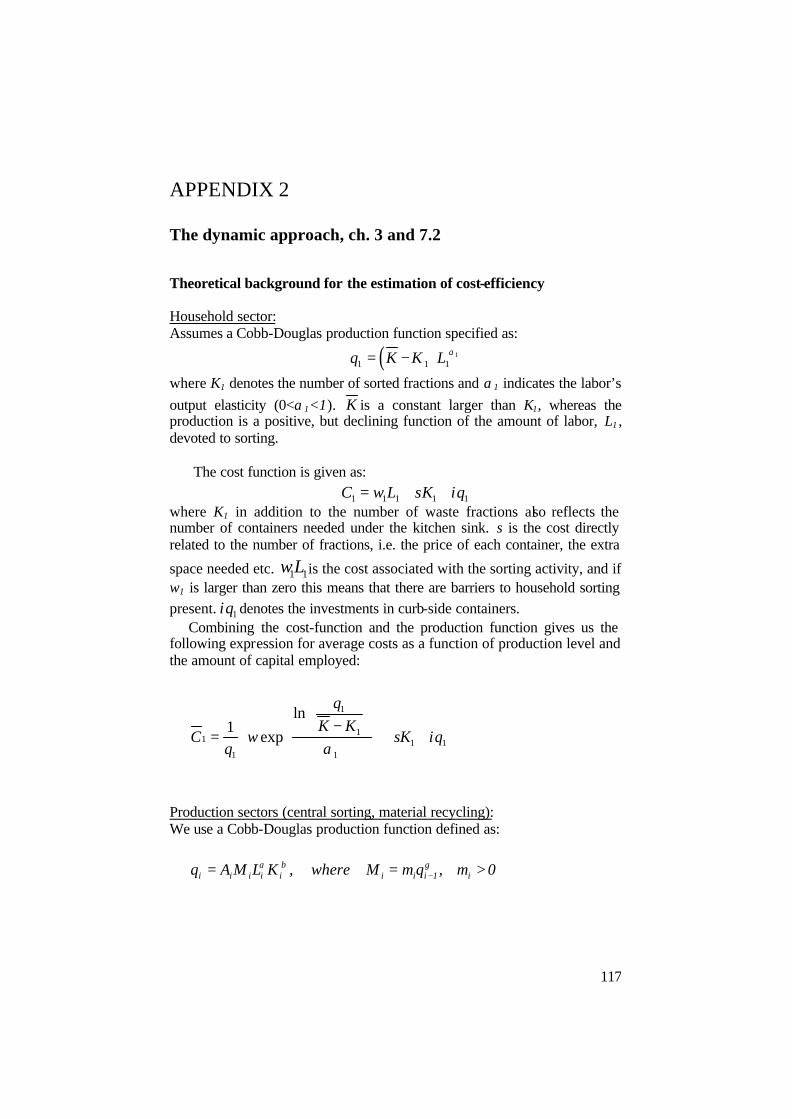
117
APPENDIX 2
The dynamic approach, ch. 3 and 7.2
Theoretical background for the estimation of cost-efficiency Household sector: Assumes a Cobb-Douglas production function specified as:
( ) 11 1 1q K K L α= −
where K1 denotes the number of sorted fractions and α1 indicates the labor’s output elasticity (0<α1<1). K is a constant larger than K1, whereas the production is a positive, but declining function of the amount of labor, L1 , devoted to sorting.
The cost function is given as:
1 1 1 1 1C w L sK qι= + + where K1 in addition to the number of waste fractions also reflects the number of containers needed under the kitchen sink. s is the cost directly related to the number of fractions, i.e. the price of each container, the extra
space needed etc. 1 1wL is the cost associated with the sorting activity, and if w1 is larger than zero this means that there are barriers to household sorting present. 1qι denotes the investments in curb-side containers.
Combining the cost-function and the production function gives us the following expression for average costs as a function of production level and the amount of capital employed:
1
11 1 1
1 1
ln1
exp
qK K
C w sK qq
ια
− = + +
Production sectors (central sorting, material recycling): We use a Cobb-Douglas production function defined as:
0m ,qmM where,KLMAq i1iiiiiiii >== −γβα
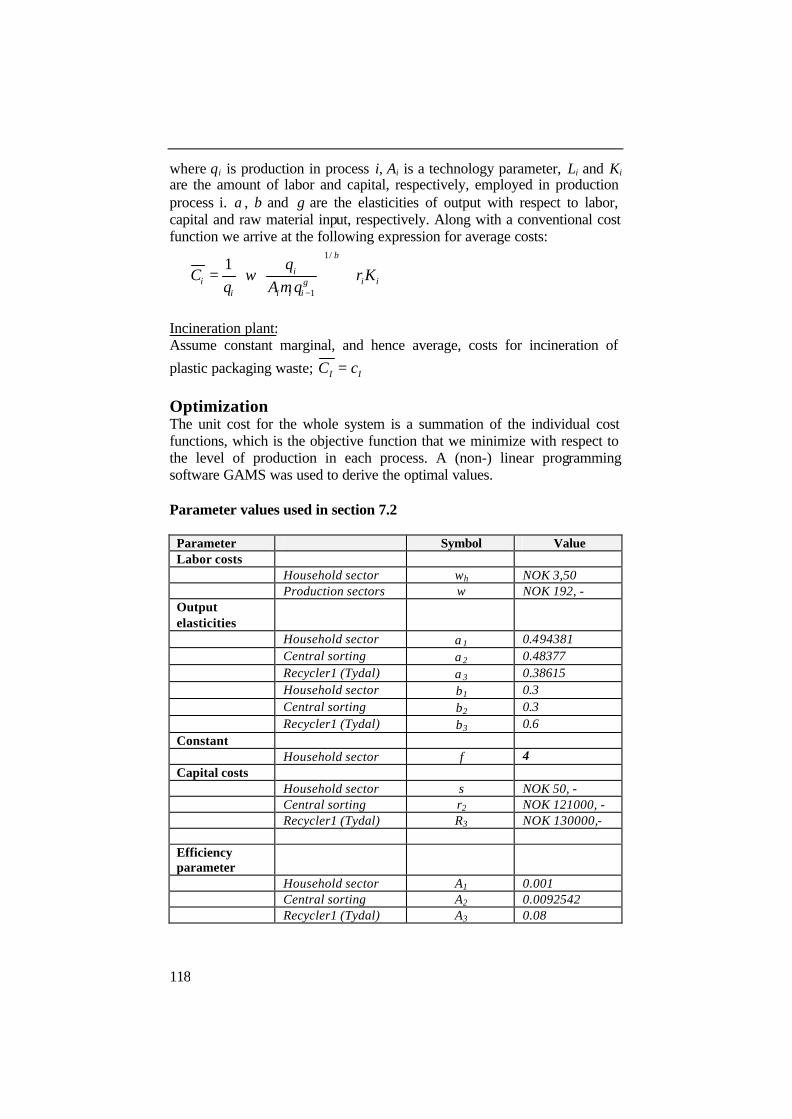
118
where qi is production in process i, Ai is a technology parameter, Li and Ki are the amount of labor and capital, respectively, employed in production process i. α, β and γ are the elasticities of output with respect to labor, capital and raw material input, respectively. Along with a conventional cost function we arrive at the following expression for average costs:
1/
1
1 ii i i
i i i i
qC w r K
q A m q
β
γ−
= +
Incineration plant: Assume constant marginal, and hence average, costs for incineration of
plastic packaging waste; I IC c=
Optimization The unit cost for the whole system is a summation of the individual cost functions, which is the objective function that we minimize with respect to the level of production in each process. A (non-) linear programming software GAMS was used to derive the optimal values.
Parameter values used in section 7.2
Parameter Symbol Value Labor costs Household sector wh NOK 3,50 Production sectors w NOK 192, - Output elasticities
Household sector α1 0.494381 Central sorting α2 0.48377 Recycler1 (Tydal) α3 0.38615 Household sector β1 0.3 Central sorting β2 0.3 Recycler1 (Tydal) β3 0.6 Constant Household sector f 4 Capital costs Household sector s NOK 50, - Central sorting r2 NOK 121000, - Recycler1 (Tydal) R3 NOK 130000,- Efficiency parameter
Household sector A1 0.001 Central sorting A2 0.0092542 Recycler1 (Tydal) A3 0.08
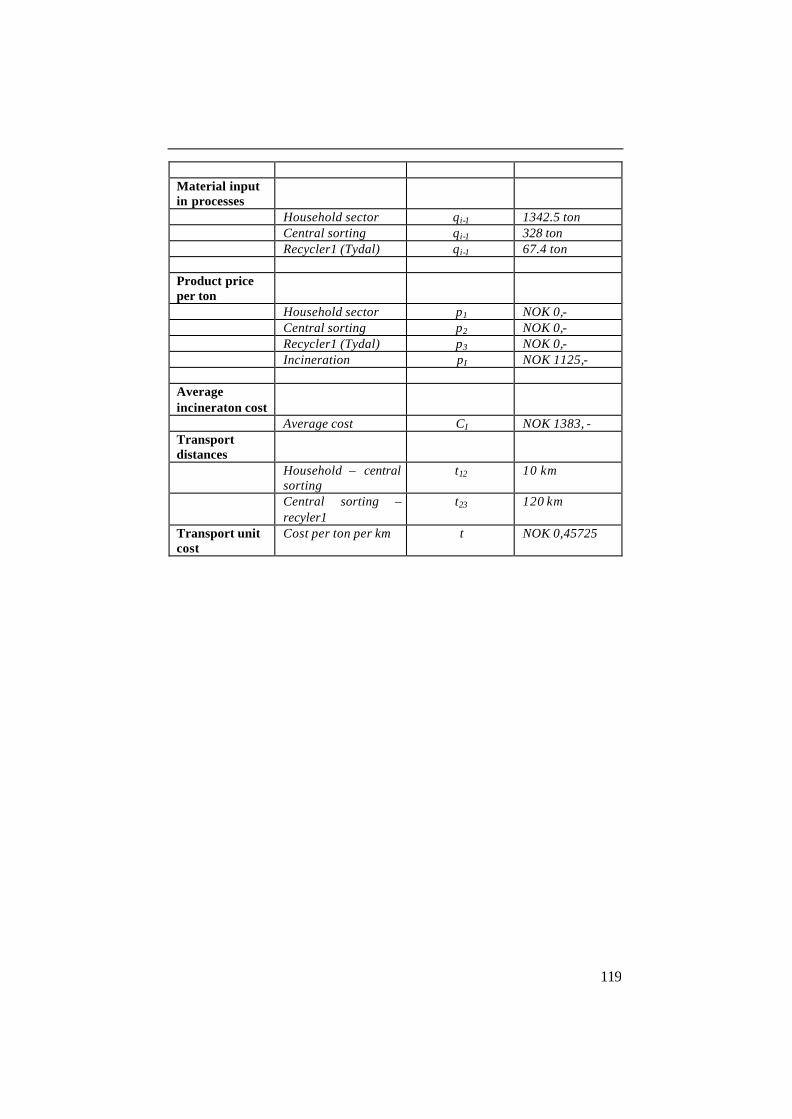
119
Material input in processes
Household sector qi-1 1342.5 ton Central sorting qi-1 328 ton Recycler1 (Tydal) qi-1 67.4 ton Product price per ton
Household sector p1 NOK 0,- Central sorting p2 NOK 0,- Recycler1 (Tydal) p3 NOK 0,- Incineration pI NOK 1125,- Average incineraton cost
Average cost CI NOK 1383, - Transport distances
Household – central sorting
t12 10 km
Central sorting – recyler1
t23 120 km
Transport unit cost
Cost per ton per km t NOK 0,45725


121
APPENDIX 3 A)
Material flow- Curbside Trondheim 1999
Process/ element
Assumptions Data source Calculation/ Data used
Comments
Inhabitants connected to curbside system
All inhabitants (147 700) generate equal amount of waste
Avfallseksjonen Tr.heim. Geir Hanssen (e-mail 100800), note/e-mail 171100)
62,4 % of the 147.700 innhab. have curbside system
Generated plastic waste- households Potentially recyclable fraction
7,95 kg per inhab/year (general Norway) 60% film plastic (assumed LDPE) 40% rigid plastic (assumed HDPE + PP 25/15)
Raadal et al 1999 “Plukkanalyse” (Interconsult 2001) http://www.apme.org/literature/htm/home.htm
0,624 x 147.700x 7,95= 732 tonn total (recyclable plastic) Basis for functional unit (FU=1000 kg)
55.000 tonn/year household plastic packaging waste generated à 12,5 kg per inhab/ year generated (Raadal et al 1999)
Recyclable plastic sorted into “environmental waste” bin
17,7% recyclable plastic in “Miljødunk” 1487 tonn delivered to central sorting
“Plukkanalyse” (Interconsult 1999) Hanssen (e-mail March 2000)
0,177x 1487= 263 tonn /year 35,9% of FU (359 kg)
Uncertain estimates
Recyclable plastic in “rest fraction”
All plastic either to “environmental waste” bin or “restfraction”
Hanssen 732 – 263 = 469 tonn 64,1 % of FU (641 kg)
Rest fraction to energy recovery
(732– 263 =) 469 tonn
Sorted plastic for mat. recycling
Trondheim Renholdsverk (TRV) 2000- weighted and reported to SSB
40 tonn LDPE 15,2% of plastic in Miljødunk (55 kg of FU)
To Plastgjenvinning in Tydal “pallet block” production
LDPE Material recycling
No material loss Interview Kvello Plastgjenvinng in Tydal Nov -99
40 tonn “pallet blocks” output No material loss (55 kg of FU)
Pallet blocks consists of 50% plastic and 50% paper
Recyclable plastic in “environmental waste” bin to energy recovery
263 – 40 = 223 tonn 304 kg of FU
Substitution LDPE (avoided production)
The block from Tydal substitutes wooden block 1,7 kg plastic blocks
Kvello (Phone 22.09.00)
0.85 kg plastic pallet blocks substitutes 1 kg wooden block
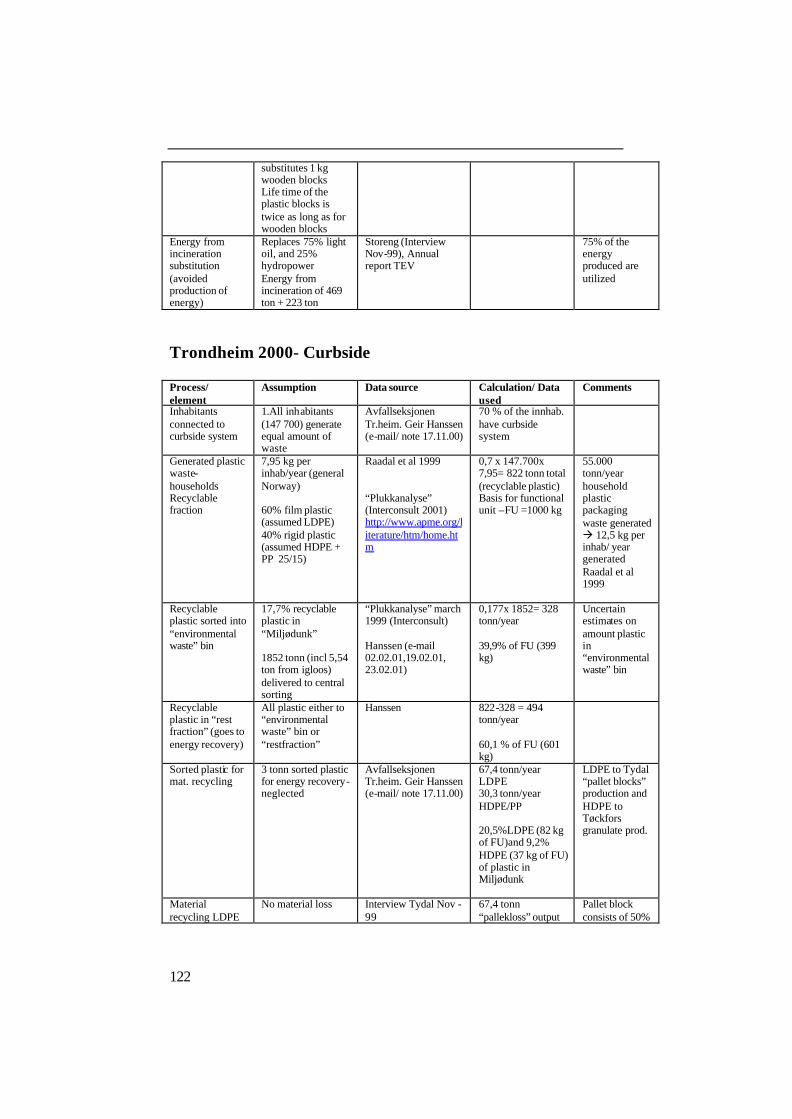
122
substitutes 1 kg wooden blocks Life time of the plastic blocks is twice as long as for wooden blocks
Energy from incineration substitution (avoided production of energy)
Replaces 75% light oil, and 25% hydropower Energy from incineration of 469 ton + 223 ton
Storeng (Interview Nov-99), Annual report TEV
75% of the energy produced are utilized
Trondheim 2000- Curbside
Process/ element
Assumption Data source Calculation/ Data used
Comments
Inhabitants connected to curbside system
1.All inhabitants (147 700) generate equal amount of waste
Avfallseksjonen Tr.heim. Geir Hanssen (e-mail/ note 17.11.00)
70 % of the innhab. have curbside system
Generated plastic waste- households Recyclable fraction
7,95 kg per inhab/year (general Norway) 60% film plastic (assumed LDPE) 40% rigid plastic (assumed HDPE + PP 25/15)
Raadal et al 1999 “Plukkanalyse” (Interconsult 2001) http://www.apme.org/literature/htm/home.htm
0,7 x 147.700x 7,95= 822 tonn total (recyclable plastic) Basis for functional unit –FU =1000 kg
55.000 tonn/year household plastic packaging waste generated à 12,5 kg per inhab/ year generated Raadal et al 1999
Recyclable plastic sorted into “environmental waste” bin
17,7% recyclable plastic in “Miljødunk” 1852 tonn (incl 5,54 ton from igloos) delivered to central sorting
“Plukkanalyse” march 1999 (Interconsult) Hanssen (e-mail 02.02.01,19.02.01, 23.02.01)
0,177x 1852= 328 tonn/year 39,9% of FU (399 kg)
Uncertain estimates on amount plastic in “environmental waste” bin
Recyclable plastic in “rest fraction” (goes to energy recovery)
All plastic either to “environmental waste” bin or “restfraction”
Hanssen 822-328 = 494 tonn/year 60,1 % of FU (601 kg)
Sorted plastic for mat. recycling
3 tonn sorted plastic for energy recovery- neglected
Avfallseksjonen Tr.heim. Geir Hanssen (e-mail/ note 17.11.00)
67,4 tonn/year LDPE 30,3 tonn/year HDPE/PP 20,5%LDPE (82 kg of FU)and 9,2% HDPE (37 kg of FU) of plastic in Miljødunk
LDPE to Tydal “pallet blocks” production and HDPE to Tøckfors granulate prod.
Material recycling LDPE
No material loss Interview Tydal Nov -99
67,4 tonn “pallekloss” output
Pallet block consists of 50%

123
plastic and 50% paper
Sorting bottles and cans Deie Bruk in Karlstad
At Deie 50 % is sorted out for energy recovery (20 % of this is not packaging), for the Trondheim part (which is sorted earlier) we assume 10 % to energy (and 54% HDPE and 36% PP output) (ration between HDPE and PP ca 60/40)
(Andersson 27.04.01) 3,0 tonn to Energy 16,4 tonn HDPE 10,9 tonn PP 10 % to energy 54% HDPE and 36% PP output
606 km Trondheim to Karlstad
Material recycling bottles and rigid containers (HDPE)
Treatment of the 2% loss not included
(Andersson 27.04.01) 16 ton granulate output Loss: 2 %
Deie Bruk-Arvika 81 km (loss goes to energy recovery)
Material recycling bottles and rigid containers (PP)
Treatment of the 2% loss not included
(Andersson 27.04.01) 10,7 ton output granulate output Loss: 2 % to energy recovery
Deie Bruk-Tøckfors 121 km (loss goes to energy recovery)
Recyclable plastic in “environmental waste” bin to energy recovery
230 tonn (280 kg of FU)
Substitution LDPE (avoided production)
Kvello (Phone 22.09.00)
0.85 kg plastic pallet brick substitutes 1 kg wooden brick
Substitution PP (avoided) production)
1 kg substitutes 0,9 kg virgin PP
10,7 ton PP * 0.9 10 % quality loss each time recycled
Substitution HDPE
1 kg substitutes 0,9 kg virgin HDPE
16 ton HDPE * 0.9 10 % quality loss each time recycled
Energy from TEV substitution (avoided production of energy)
Replaces 75% light oil, and 25% hydropower Energy from incineration of 494 ton+230 ton
75% of the energy produced are utilized
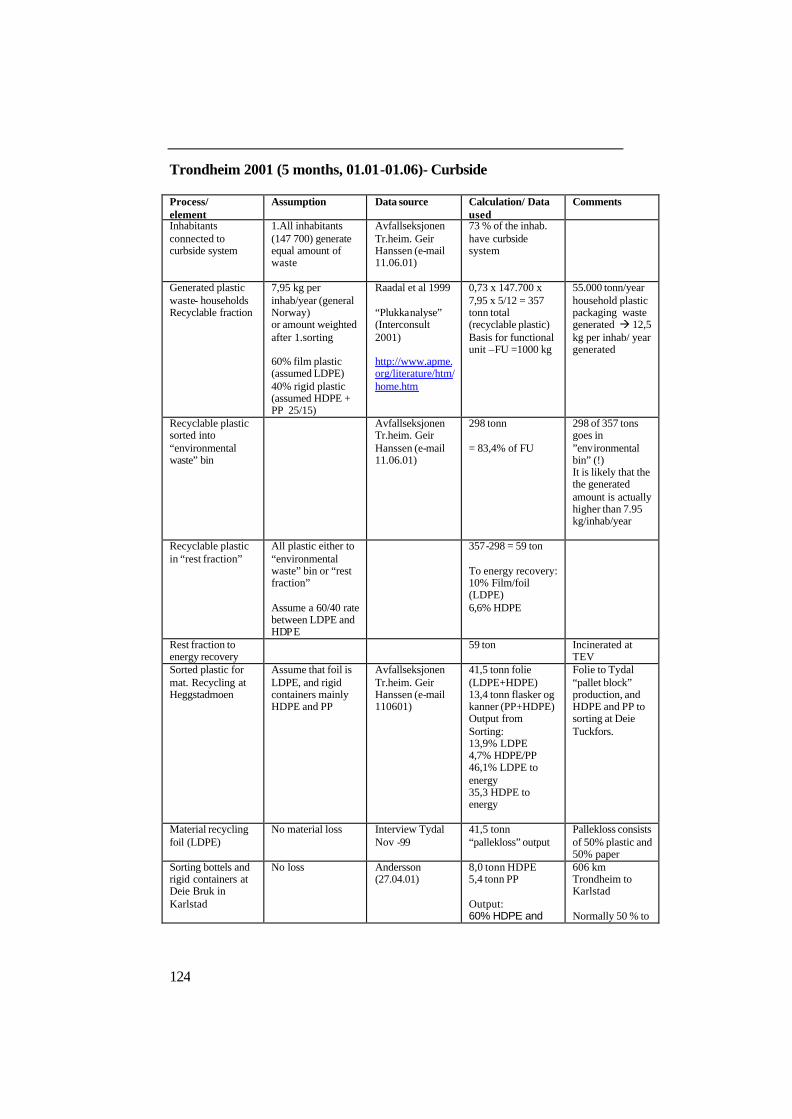
124
Trondheim 2001 (5 months, 01.01-01.06)- Curbside
Process/ element
Assumption Data source Calculation/ Data used
Comments
Inhabitants connected to curbside system
1.All inhabitants (147 700) generate equal amount of waste
Avfallseksjonen Tr.heim. Geir Hanssen (e-mail 11.06.01)
73 % of the inhab. have curbside system
Generated plastic waste- households Recyclable fraction
7,95 kg per inhab/year (general Norway) or amount weighted after 1.sorting 60% film plastic (assumed LDPE) 40% rigid plastic (assumed HDPE + PP 25/15)
Raadal et al 1999 “Plukkanalyse” (Interconsult 2001) http://www.apme.org/literature/htm/home.htm
0,73 x 147.700 x 7,95 x 5/12 = 357 tonn total (recyclable plastic) Basis for functional unit –FU =1000 kg
55.000 tonn/year household plastic packaging waste generated à 12,5 kg per inhab/ year generated
Recyclable plastic sorted into “environmental waste” bin
Avfallseksjonen Tr.heim. Geir Hanssen (e-mail 11.06.01)
298 tonn = 83,4% of FU
298 of 357 tons goes in ”environmental bin” (!) It is likely that the the generated amount is actually higher than 7.95 kg/inhab/year
Recyclable plastic in “rest fraction”
All plastic either to “environmental waste” bin or “rest fraction” Assume a 60/40 rate between LDPE and HDPE
357-298 = 59 ton To energy recovery: 10% Film/foil (LDPE) 6,6% HDPE
Rest fraction to energy recovery
59 ton
Incinerated at TEV
Sorted plastic for mat. Recycling at Heggstadmoen
Assume that foil is LDPE, and rigid containers mainly HDPE and PP
Avfallseksjonen Tr.heim. Geir Hanssen (e-mail 110601)
41,5 tonn folie (LDPE+HDPE) 13,4 tonn flasker og kanner (PP+HDPE) Output from Sorting: 13,9% LDPE 4,7% HDPE/PP 46,1% LDPE to energy 35,3 HDPE to energy
Folie to Tydal “pallet block” production, and HDPE and PP to sorting at Deie Tuckfors.
Material recycling foil (LDPE)
No material loss Interview Tydal Nov -99
41,5 tonn “pallekloss” output
Pallekloss consists of 50% plastic and 50% paper
Sorting bottels and rigid containers at Deie Bruk in Karlstad
No loss
Andersson (27.04.01)
8,0 tonn HDPE 5,4 tonn PP Output: 60% HDPE and
606 km Trondheim to Karlstad Normally 50 % to

125
40% PP output
energy recovery, however since sorted twice earlier, no loss in this system
Material recycling- bottels and rigid containers (HDPE)
Treatment of the 2% loss not included
Andersson (27.04.01)
8,0 ton granulate output Loss: 2 %
Deie Bruk-Arvika 81 km (loss goes to energy recovery)
Material recycling -bottels and rigid containers (PP)
Treatment of the 2% loss not included
Andersson (27.04.01)
5,4 ton output granulate output Loss: 2 %
Deie Bruk-Tøckfors 121 km (loss goes to energy recovery)
Recyclable plastic in “environmental waste bin” to energy recovery
No material loss Avfallseksjonen Tr.heim. Geir Hanssen (e-mail 11.06.01)
244 ton Delivered to Umeå Energi, 700 km away
Substitution LDPE (avoided production)
Kvello (Phone 22.09.00)
0.85 kg plastic pallet brick substitutes 1 kg wooden brick.
Substitution PP (avoided) production)
1 kg substitutes 0,9 kg virgin
8 ton PP * 0.9 10 % quality loss each time recycled
Substitution HDPE 1 kg substitutes 0,9 kg virgin
5,4 ton HDPE * 0.9 10 % quality loss each time recycled
Energy from TEV substitution (avoided production of energy)
Energy from incineration of 59 ton Replaces 75% light oil, and 25% hydropower
75% of the energy produced are utilized
Energy from Umeå Energy substitution (avoided production of energy)
Energy form incineration of 244 tonn Assume same as TRV: Replaces 75% light oil, and 25% hydropower
75% of the energy produced are utilized
An overview of the actors and persons given in the table is presented in appendix
1

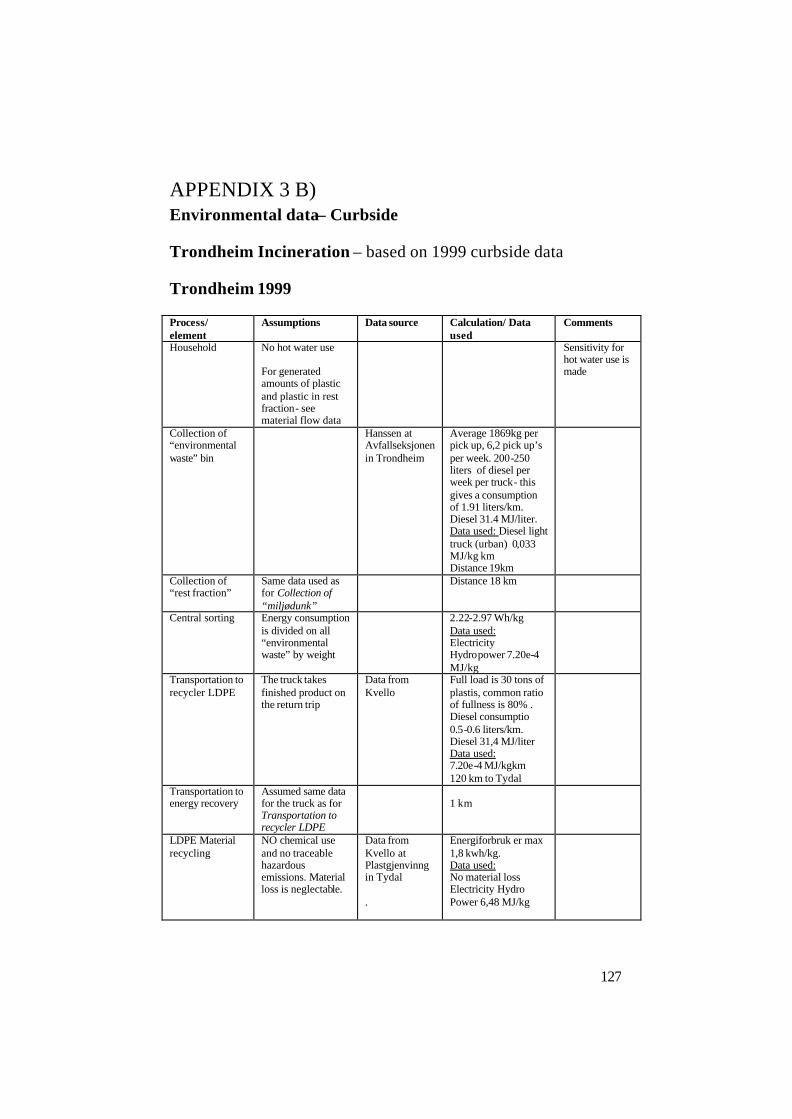
127
APPENDIX 3 B) Environmental data– Curbside
Trondheim Incineration – based on 1999 curbside data
Trondheim 1999
Process/ element
Assumptions Data source Calculation/ Data used
Comments
Household No hot water use For generated amounts of plastic and plastic in rest fraction- see material flow data
Sensitivity for hot water use is made
Collection of “environmental waste” bin
Hanssen at Avfallseksjonen in Trondheim
Average 1869kg per pick up, 6,2 pick up’s per week. 200-250 liters of diesel per week per truck- this gives a consumption of 1.91 liters/km. Diesel 31.4 MJ/liter. Data used: Diesel light truck (urban) 0,033 MJ/kg km Distance 19km
Collection of “rest fraction”
Same data used as for Collection of “miljødunk”
Distance 18 km
Central sorting Energy consumption is divided on all “environmental waste” by weight
2.22-2.97 Wh/kg Data used: Electricity Hydropower 7.20e-4 MJ/kg
Transportation to recycler LDPE
The truck takes finished product on the return trip
Data from Kvello
Full load is 30 tons of plastis, common ratio of fullness is 80% . Diesel consumptio 0.5-0.6 liters/km. Diesel 31,4 MJ/liter Data used: 7.20e-4 MJ/kgkm 120 km to Tydal
Transportation to energy recovery
Assumed same data for the truck as for Transportation to recycler LDPE
1 km
LDPE Material recycling
NO chemical use and no traceable hazardous emissions. Material loss is neglectable.
Data from Kvello at Plastgjenvinng in Tydal .
Energiforbruk er max 1,8 kwh/kg. Data used: No material loss Electricity Hydro Power 6,48 MJ/kg
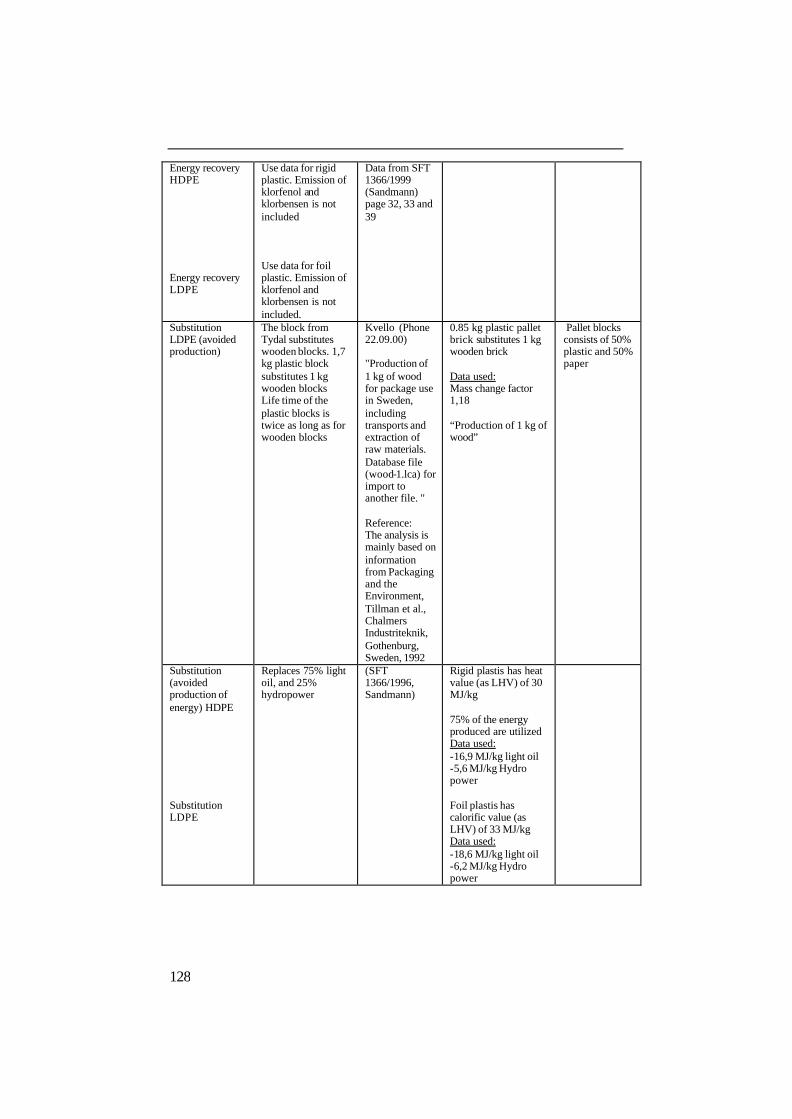
128
Energy recovery HDPE Energy recovery LDPE
Use data for rigid plastic. Emission of klorfenol and klorbensen is not included Use data for foil plastic. Emission of klorfenol and klorbensen is not included.
Data from SFT 1366/1999 (Sandmann) page 32, 33 and 39
Substitution LDPE (avoided production)
The block from Tydal substitutes wooden blocks. 1,7 kg plastic block substitutes 1 kg wooden blocks Life time of the plastic blocks is twice as long as for wooden blocks
Kvello (Phone 22.09.00) "Production of 1 kg of wood for package use in Sweden, including transports and extraction of raw materials. Database file (wood-1.lca) for import to another file. " Reference: The analysis is mainly based on information from Packaging and the Environment, Tillman et al., Chalmers Industriteknik, Gothenburg, Sweden, 1992
0.85 kg plastic pallet brick substitutes 1 kg wooden brick Data used: Mass change factor 1,18 “Production of 1 kg of wood”
Pallet blocks consists of 50% plastic and 50% paper
Substitution (avoided production of energy) HDPE Substitution LDPE
Replaces 75% light oil, and 25% hydropower
(SFT 1366/1996, Sandmann)
Rigid plastis has heat value (as LHV) of 30 MJ/kg 75% of the energy produced are utilized Data used: -16,9 MJ/kg light oil -5,6 MJ/kg Hydro power Foil plastis has calorific value (as LHV) of 33 MJ/kg Data used: -18,6 MJ/kg light oil -6,2 MJ/kg Hydro power
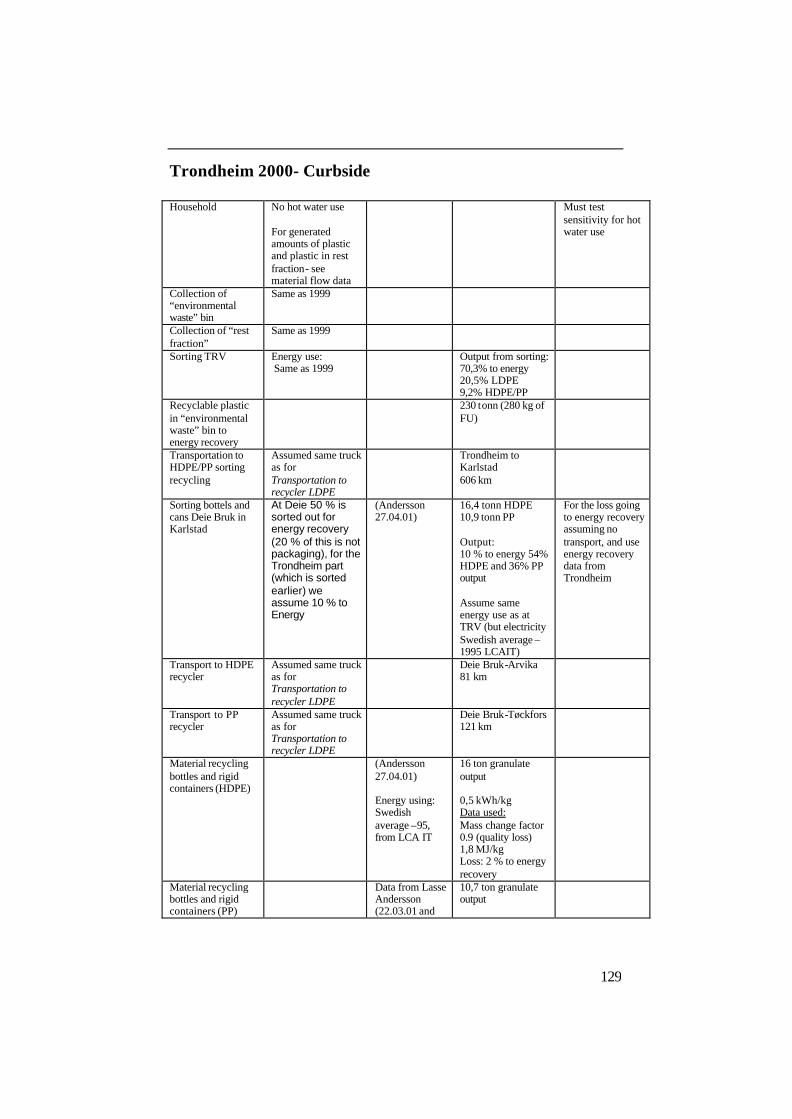
129
Trondheim 2000- Curbside Household No hot water use
For generated amounts of plastic and plastic in rest fraction- see material flow data
Must test sensitivity for hot water use
Collection of “environmental waste” bin
Same as 1999
Collection of “rest fraction”
Same as 1999
Sorting TRV Energy use: Same as 1999
Output from sorting: 70,3% to energy 20,5% LDPE 9,2% HDPE/PP
Recyclable plastic in “environmental waste” bin to energy recovery
230 tonn (280 kg of FU)
Transportation to HDPE/PP sorting recycling
Assumed same truck as for Transportation to recycler LDPE
Trondheim to Karlstad 606 km
Sorting bottels and cans Deie Bruk in Karlstad
At Deie 50 % is sorted out for energy recovery (20 % of this is not packaging), for the Trondheim part (which is sorted earlier) we assume 10 % to Energy
(Andersson 27.04.01)
16,4 tonn HDPE 10,9 tonn PP Output: 10 % to energy 54% HDPE and 36% PP output Assume same energy use as at TRV (but electricity Swedish average –1995 LCAIT)
For the loss going to energy recovery assuming no transport, and use energy recovery data from Trondheim
Transport to HDPE recycler
Assumed same truck as for Transportation to recycler LDPE
Deie Bruk-Arvika 81 km
Transport to PP recycler
Assumed same truck as for Transportation to recycler LDPE
Deie Bruk-Tøckfors 121 km
Material recycling bottles and rigid containers (HDPE)
(Andersson 27.04.01) Energy using: Swedish average –95, from LCA IT
16 ton granulate output 0,5 kWh/kg Data used: Mass change factor 0.9 (quality loss) 1,8 MJ/kg Loss: 2 % to energy recovery
Material recycling bottles and rigid containers (PP)
Data from Lasse Andersson (22.03.01 and
10,7 ton granulate output
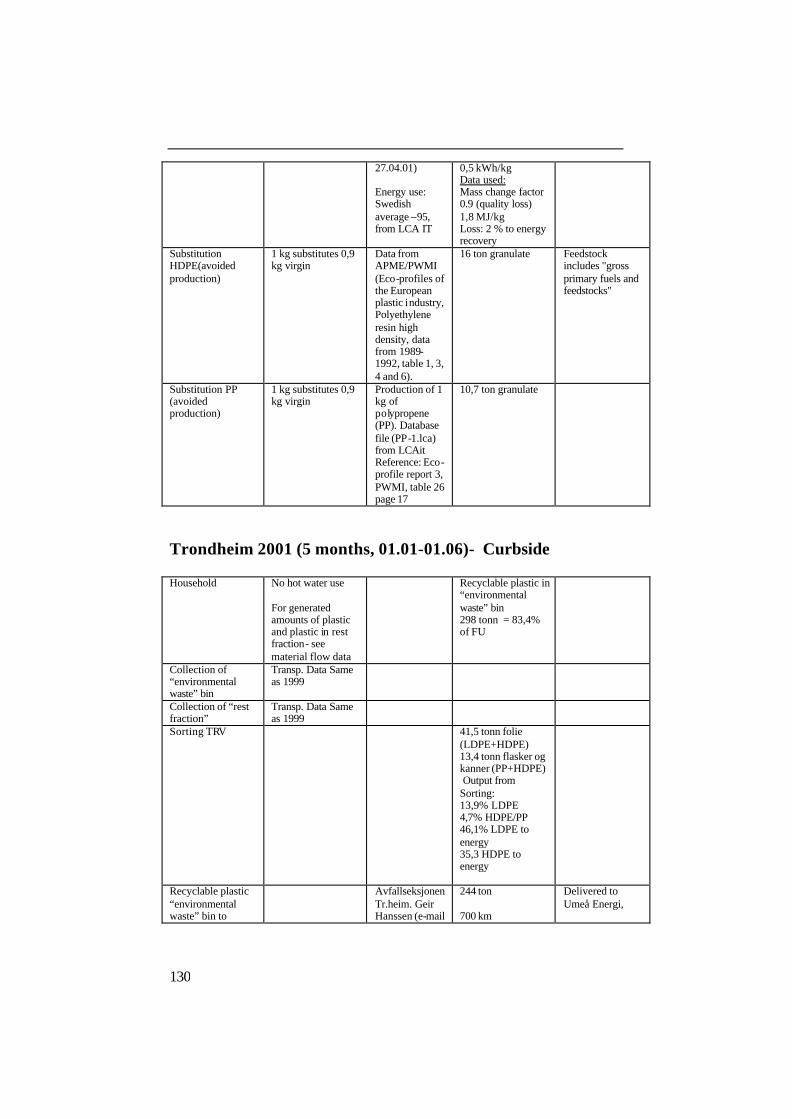
130
27.04.01) Energy use: Swedish average –95, from LCA IT
0,5 kWh/kg Data used: Mass change factor 0.9 (quality loss) 1,8 MJ/kg Loss: 2 % to energy recovery
Substitution HDPE(avoided production)
1 kg substitutes 0,9 kg virgin
Data from APME/PWMI (Eco-profiles of the European plastic industry, Polyethylene resin high density, data from 1989-1992, table 1, 3, 4 and 6).
16 ton granulate Feedstock includes "gross primary fuels and feedstocks"
Substitution PP (avoided production)
1 kg substitutes 0,9 kg virgin
Production of 1 kg of polypropene (PP). Database file (PP-1.lca) from LCAit Reference: Eco-profile report 3, PWMI, table 26 page 17
10,7 ton granulate
Trondheim 2001 (5 months, 01.01-01.06)- Curbside Household No hot water use
For generated amounts of plastic and plastic in rest fraction- see material flow data
Recyclable plastic in “environmental waste” bin 298 tonn = 83,4% of FU
Collection of “environmental waste” bin
Transp. Data Same as 1999
Collection of “rest fraction”
Transp. Data Same as 1999
Sorting TRV 41,5 tonn folie (LDPE+HDPE) 13,4 tonn flasker og kanner (PP+HDPE) Output from Sorting: 13,9% LDPE 4,7% HDPE/PP 46,1% LDPE to energy 35,3 HDPE to energy
Recyclable plastic “environmental waste” bin to
Avfallseksjonen Tr.heim. Geir Hanssen (e-mail
244 ton 700 km
Delivered to Umeå Energi,
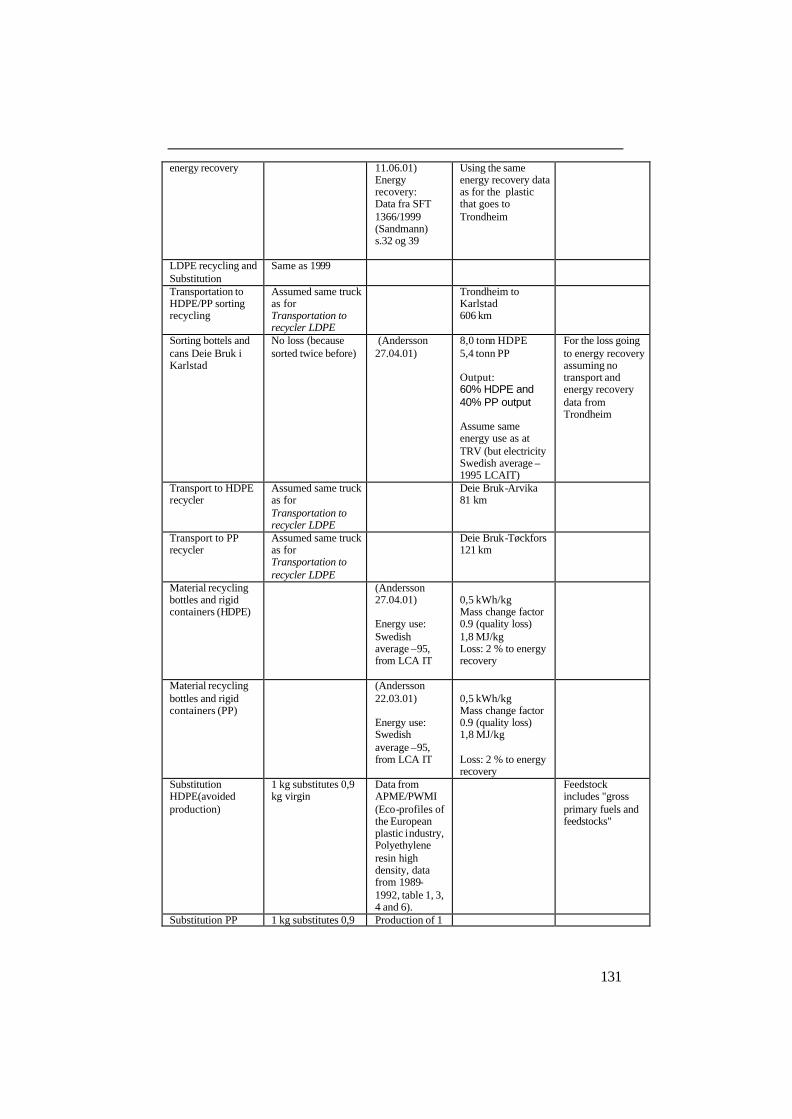
131
energy recovery 11.06.01) Energy recovery: Data fra SFT 1366/1999 (Sandmann) s.32 og 39
Using the same energy recovery data as for the plastic that goes to Trondheim
LDPE recycling and Substitution
Same as 1999
Transportation to HDPE/PP sorting recycling
Assumed same truck as for Transportation to recycler LDPE
Trondheim to Karlstad 606 km
Sorting bottels and cans Deie Bruk i Karlstad
No loss (because sorted twice before)
(Andersson 27.04.01)
8,0 tonn HDPE 5,4 tonn PP Output: 60% HDPE and 40% PP output Assume same energy use as at TRV (but electricity Swedish average –1995 LCAIT)
For the loss going to energy recovery assuming no transport and energy recovery data from Trondheim
Transport to HDPE recycler
Assumed same truck as for Transportation to recycler LDPE
Deie Bruk-Arvika 81 km
Transport to PP recycler
Assumed same truck as for Transportation to recycler LDPE
Deie Bruk-Tøckfors 121 km
Material recycling bottles and rigid containers (HDPE)
(Andersson 27.04.01) Energy use: Swedish average –95, from LCA IT
0,5 kWh/kg Mass change factor 0.9 (quality loss) 1,8 MJ/kg Loss: 2 % to energy recovery
Material recycling bottles and rigid containers (PP)
(Andersson 22.03.01) Energy use: Swedish average –95, from LCA IT
0,5 kWh/kg Mass change factor 0.9 (quality loss) 1,8 MJ/kg Loss: 2 % to energy recovery
Substitution HDPE(avoided production)
1 kg substitutes 0,9 kg virgin
Data from APME/PWMI (Eco-profiles of the European plastic industry, Polyethylene resin high density, data from 1989-1992, table 1, 3, 4 and 6).
Feedstock includes "gross primary fuels and feedstocks"
Substitution PP 1 kg substitutes 0,9 Production of 1

132
(avoided production)
kg virgin kg of polypropene (PP). Database file (PP-1.lca) from LCAit Reference: Eco-profile report 3, PWMI, table 26 page 17.

133
APPENDIX 3 C)
Net Cost data - Curbside
Trondheim Incineration – based on 1999 curbside data Trondheim 1999
Process/ element
Assumptions Data source Calculation/ Data used
Comments
Source separation
For 1000 kg generated in Curbside system Allocate investment costs on all waste fractions No running costs, investment costs of containers only
Hanssen (e-mail 11.08.00)
Investment costs: 1,6 mill kr/29346 tonn = 54 NOK/tonn
Only investment costs in this process. Support from Plastretur: 1100 NOK/tonn to AS for the fraction sorted to recycling (uncertain figure)
Administration and marketing
(INFO: 1,5 mill + PUK: 4,22 mill + Assumed labourcost: 2 mill) / devided by 2 (environmental waste and paper), 1487 tonn environmental waste gives 504 + 1420 + 672 = 2.600 NOK/tonn as total administration cost
2.600 NOK/tonn
Collection/ pick up
For 732 ton/year plastic generated. Same costs for collection of “environmental waste” and “rest fractionl” Total costs =average price for the collection service
Hanssen (e-mail 11.08.00)
33,5 mill kr x 0,624/29346 tonn = 713 NOK/tonn
AS paid 33,5 mill to TRV and NG for these services in 1999
Central sorting
For 263 ton/year plastic in “environmental waste bin” Same cost for all “environmental waste” (both the fraction to recycling and the one to incineration)
Avfallseksjonen (Meeting 16.06.00)
705685 kr/1487 tonn = 475 NOK/tonn
To low estimate? No account balance available at TRV Hanssen (phone 23.02.01) Support from Plastretur:1200 kr/ton for the amount plastic sorted (uncertain figure)
Transport from sorting at TRV to mat. recycler
For 40 ton/year to recycling in Tydal Cost per March-01
Kvello (e-mail 27.02.01) Volden (phone 01.03.01)
100 NOK/tonn Tydal pay for this and are included in their total cost Support from Plastretur: 1400

134
kr/tonn for delivered to recycling
Transport from sorting TRV to Energy recovery (TEV)
For 223 ton/year unsorted plastic in “environmental waste bin” Costs included in the sorting costs
0 Unknown. Included in the price from AS to TRV for sorting (Hanssen, phone 23.02.01)
Delivery of plastic packaging to incineration at TEV
For 692 (469+263)ton/year unsorted plastic in “environmental waste bin”
”Resultat TEVFjernvarme1999” Resultat TEV Fjernvarme 1999 (www.tev.no/generelt/aktuelt/resultatfjernvarme.html)
40.379.532 kr/94521 tonn = 427 kr/ton
Income for TEV but regarded as a cost for the system
Recycling of “pallet blocks” at Plastgjenvinning i Tydal
For 40 ton/year produced 0 profit: Total costs = sales price+support
Kvello (phone 22.09.00)
1800 kr/tonn+1700 kr/tonn- 100 kr/tonn= 3400 NOK/tonn
Support from Plastretur: 1700 kr/tonn for sold material. Tydal pay for the transport
Sale of recycled material (LDPE)
Average sales price Kvello (phone 22.09.00)
1800 NOK/tonn The brick from Tydal substitutes wooden bricks and the price is the same. 1,7 kg plastic brick substitutes 1 kg wooden bricks Life time plastic bricks is twice as long as for wooden bricks
Energy recovery
Total cost: = Sum driftskostander +(finanskostander-finansinntekter) +skattekostnad
”Resultat TEVFjernvarme1999” Resultat TEV Fjernvarme 1999 (www.tev.no/generelt/aktuelt/resultatfjernvarme.html)
Total costs = 113 182 903 kr / 94521 tonn = 1197 NOK/ tonn
Price for AS when delivering to TEV: 670 kr/tonn
Sale of district heating
Average sale price for all waste incinerated
”Resultat TEVFjernvarme1999” (www.tev.no/generelt/aktuelt/resultatfjernvarme.html)
Energisalg fjernvarme: 120 278 960 kr / 94521 tonn = 1273 NOK/tonn
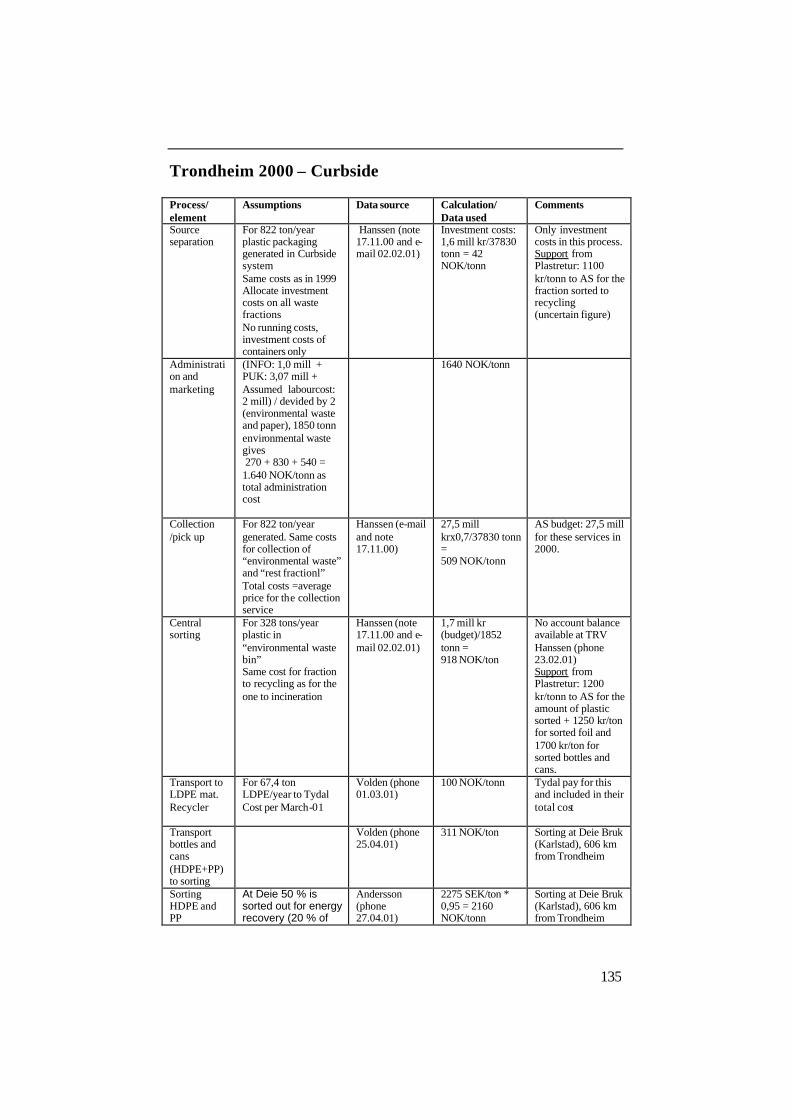
135
Trondheim 2000 – Curbside
Process/ element
Assumptions Data source Calculation/ Data used
Comments
Source separation
For 822 ton/year plastic packaging generated in Curbside system Same costs as in 1999 Allocate investment costs on all waste fractions No running costs, investment costs of containers only
Hanssen (note 17.11.00 and e-mail 02.02.01)
Investment costs: 1,6 mill kr/37830 tonn = 42 NOK/tonn
Only investment costs in this process. Support from Plastretur: 1100 kr/tonn to AS for the fraction sorted to recycling (uncertain figure)
Administration and marketing
(INFO: 1,0 mill + PUK: 3,07 mill + Assumed labourcost: 2 mill) / devided by 2 (environmental waste and paper), 1850 tonn environmental waste gives 270 + 830 + 540 = 1.640 NOK/tonn as total administration cost
1640 NOK/tonn
Collection /pick up
For 822 ton/year generated. Same costs for collection of “environmental waste” and “rest fractionl” Total costs =average price for the collection service
Hanssen (e-mail and note 17.11.00)
27,5 mill krx0,7/37830 tonn = 509 NOK/tonn
AS budget: 27,5 mill for these services in 2000.
Central sorting
For 328 tons/year plastic in “environmental waste bin” Same cost for fraction to recycling as for the one to incineration
Hanssen (note 17.11.00 and e-mail 02.02.01)
1,7 mill kr (budget)/1852 tonn = 918 NOK/ton
No account balance available at TRV Hanssen (phone 23.02.01) Support from Plastretur: 1200 kr/tonn to AS for the amount of plastic sorted + 1250 kr/ton for sorted foil and 1700 kr/ton for sorted bottles and cans.
Transport to LDPE mat. Recycler
For 67,4 ton LDPE/year to Tydal Cost per March-01
Volden (phone 01.03.01)
100 NOK/tonn Tydal pay for this and included in their total cost
Transport bottles and cans (HDPE+PP) to sorting
Volden (phone 25.04.01)
311 NOK/ton Sorting at Deie Bruk (Karlstad), 606 km from Trondheim
Sorting HDPE and PP
At Deie 50 % is sorted out for energy recovery (20 % of
Andersson (phone 27.04.01)
2275 SEK/ton * 0,95 = 2160 NOK/tonn
Sorting at Deie Bruk (Karlstad), 606 km from Trondheim

136
this is not packaging), for the Trondheim part (which is sorted earlier) we assume 10 % to energy (and 54% HDPE and 36% PP output) Exchange rate from Norges Bank –average 2000
Output: 3,0 tonn to Energy 16,4 tonn HDPE 10,9 tonn PP
Assume energy recovery cost of Trondheim and no transport cost of energy fraction
Transport from sorting to HDPE mat.recycler
Assume same cost as Trondheim -Tydal
Volden (phone 01.03.01)
100 NOK/ton Recycling at Plaståtervinning in Arvika, 81 km from Karlstad
Transport from sorting PP recycler
Assume same costs as Trondheim -Tydal
Volden (phone 01.03.01)
100 NOK/ton Recycling at Plaståtervinning in Tøckfors, 121 km from Karlstad
Transport from sorting at TRV to energy recovery
Assume costs included in the sorting at TRV
Hanssen, (phone 23.02.01)
0 Unknown. Included in the price from AS to TRV for sorting
Recycling of pallet blocks at Plastgjenvinning i Tydal
Same as 1999 3400 NOK/tonn
Production of PP regranulate Truckfors
Andersson (phone 27.04.01)
3500 SEK/tonn * 0.95= 3325 NOK/tonn
Production of HDPE regranulate at Arvika
Same costs as Tøckfors
3325 NOK/tonn
Sale of recycled material
Average sales price Kvello (phone 22.09.00)
1800 NOK/tonn
Sale of PP-regranulate
Price had recently increased to 4250 SEK/tonn in march –01 therefor using 4000 SEK
Andersson (meeting 22.03.01)
4000 SEK/tonn * 0,95 = 3800 NOK/tonn
Sales price
Sale of HDPE regranulate
Andersson (meeting 22.03.01)
4800 SEK/tonn* 0,95 = 4560 NOK/tonn
Sales price
Energy recovery
Same costs for all kinds of waste
Resultat TEV Fjernvarme 2000 (www.tev.no)
Total costs= 1383 NOK/ton
Sale of district heating
Average sales price for all waste incinerated
Resultat TEV Fjernvarme 2000 (www.tev.no)
Revenues district heating: 1552 NOK/ tonn

137
Trondheim 2001 (first 5 months) – Curbside
Process/ element
Assumptions Data source Calculation/ Data used
Comments
Source separation
For 357 ton/5 months plastic packaging generated in Curbside system Same costs as in 1999
Avfallseksjonen Tr.heim. Geir Hanssen (e-mail 110601)
Investment costs: 1,6 mill kr/37830 tonn = 42 NOK/tonn
Only investment costs in this process.
Administration and marketing
Assume: INFO: 0,6 mill devided by 2 (env.waste and paper), 1820 tonn environmental waste Assumed labour cost: For both curbside and igloo 2001: 2 mill devided by 2 (env.waste and paper), 1894 tonn environmental waste gives 165 + 528 = 693 NOK/tonn as total administration cost
693 NOK/tonn
Collection /pick up
For 357 ton/5mnd. Same costs for collection of “environmental waste” and “rest fraction” Net production costs =average price for the collect ion service
Avfallseksjonen Tr.heim. (meeting 31.01.01 and Geir Hanssen e-mail 11.06.01)
27,8x0,73/(4x8495) = 597 NOK/tonn
Budget 2001: 27,8 mill (e-mail Teialeret 25.04.01) Support from PR to AS: 1100 kr/tonn for 182 tonn (after 1.sorting)
Central sorting For 298 ton/3months Uncertain data: 650 is for environmental waste (invoices) 1200 kr/ton is very rough estimate from Volden
Volden (phone 25.04.01)
650 kr/ton (from AS for first sorting) + 1200 kr/ton (from PR for 2.sorting) = 1850 NOK/ton
Support from PR to TRV: 1200 kr/tonn as regional receiver + 1250 kr/ton for sorted film (24,3 tons), 2500 kr/ton for bottles and cans (6 tons) and 500 kr/ton for energy fraction (150 kr/ton) .
Transport to LDPE mat. Recycler
Hanssen(e-mail 23.02.01) Volden (phone 25.04.01)
100 NOK/tonn TRV does not pay for the cargo to Tydal 176 km
Transport bottles and cans (HDPE+PP) to sorting
“TelfsamtaleVolden250401”
311 NOK/ton Sorting at Deie Bruk (Karlstad), 606 km from Trondheim
Sorting HDPE and PP
Exchange rate from Norges Bank –average 2001 (5mht)
”TlfLAndersson270401”
2275 SEK/ton * 0,9 = 2050 NOK/tonn
Sorting at Deie Bruk (Karlstad), 606 km from Trondheim
Transport sorting to HDPE mat.recycler
Assume the same as Trondheim -Tydal
Hanssen (e-mail 23.02.01)
100 NOK/tonn Karlstad-Arvika = 81 km

138
Transport sorting to PP mat.recycler
Assume the same as Trondheim -Tydal
100 NOK/tonn Karlstad-Tøckfors 121 km
Transport from sorting at TRV to energy recovery
For 244 ton/5mnth Total cost =price TRV pay for the cargo
Volden (phone 25.04.01)
254 kr/ton TRV pay for the transport to Umeå Energi, 700 km
Recycling of pallet blocks at Plastgjenvinning i Tydal
0 profit: costs = sales price+support Included transport from Trondheim
Kvello (phone 22.09.00) Schefte (phone 26.04.01)
1800 kr/tonn +1450 kr/tonn – 100 kr/ton (transport) = 3150 NOK/ton
Support from Plastretur: 1450 kr/tonn for sold material
Production of PP regranulate, Truckfors
Andersson (phone 27.04.01)
3500 SEK/tonn * 0,9 = 3150 NOK/tonn
Production of HDPE regranulate at Arvika
Same costs as Tøckfors Andersson (phone 27.04.01)
3500 SEK/tonn * 0,9 = 3150 NOK/tonn
Sale of recycled material (pallet blocks)
Average selling price
Kvello (phone 22.09.00)
1800 NOK/tonn See 2000
Sale of PP-regranulate
Andersson (meeting 22.03.01)
4250 SEK/ton * 0,9 = 3825 NOK/tonn
Sales price
Sale of HDPE regranulate
Andersson (meeting 22.03.01)
4800 SEK/ton * 0,9 = 4320 NOK/ tonn
Sales price
Incineration Umeå
No data from Umeå Use data from TEV
Total costs= 1383 NOK/ton
Sale of district heating from Umeå
No data from Umeå Use data from TEV
Revenues district heating: 1552 NOK/ton
Incineration TRV
Same costs for all kinds of waste Data for 2000
Resultat TEV Fjernvarme 2000 (www.tev.no)
Total costs= 1383 NOK/ton
Sale of district heating TRV
Average sale price for all waste incinerated Data for 2000
Resultat TEV Fjernvarme 2000 (www.tev.no)
Revenues district heating: 1552 kr/ton

139
APPENDIX 3 D) Material flow- Igloo Trondheim 2001 (5 months, 01.01-01.06)
Process/ element Assumption Data source Calculation/ Data
used Comments
Inhabitants connected to curbside system
All inhabitants (147 700) generate equal amout of waste
Avfallseksjonen Tr.heim. Geir Hanssen (e-mail 110601)
15 % of the innhab. are connected to the bring system
38 igloos
Generated plastic waste- households Recyclable fraction (rest fraction curbside + “environmental waste- igloo”
7,95 kg per inhab/year (general Norway) or amount weighted after 1.sorting 60% film plastic (assumed LDPE) 40% rigid plastic (assumed HDPE and PP 25/15)
Raadal et al 1999 Geir Hanssen (e-mail 130601)
0,15 x 147.700x 7,95 x 5/12 = 73 tonn total (recyclable plastic for 5 months) Basis for functional unit –FU =1000 kg
55.000 tonn/year household plastic packaging waste generated à 12,5 kg per inhab/ year generated
Recyclable plastic sorted into “environmental waste- igloo”
Avfallseksjonen Tr.heim. Geir Hanssen (e-mail 130601)
Assumes that 60 % in ”Miljødunk” is recyclable plastic 31x0,6= 18,6 tonn = 25,5% of FU
Recyclable plastic in “rest fraction” at each household
All plastic either to “environmental waste- igloo” or “restfraction” at each household
Plukkanalyse (Interconsult –99)
73-18,6 = 54,4 ton 60/40 rate gives 44,7% LDPE to energy and 29,8% HDPE/PP
Plukkanalyse: Rest fraction, delivered HVS in 2001 pr 01.06.01: 13893 tonn, wich gives 282 tonn plastic packaging! (13893 x 0,20 x 0,1018)
Rest fraction to energy recovery
54,4 t on Assumed 60/40 rate gives 44,7% LDPE to energy and 29,8% HDPE
Incinerated at TEV
Sorted plastic for mat. recycling at Heggstadmoen
Assume that foil is LDPE, and rigid containers mainly HDPE and PP
Hanssen (e-mail 110601)
41,5 tonn foil (LDPE) x 18,6/298 (Igloo/total)= 2,7 tonn 13,4 tonn HDPE/PP x 18,6/298= 0,84 tonn To recycling: 14,5% LDPE 4,5% HDPE/PP To energy:
Foil to Tydal “pallet blocks” production and HDPE and PP to sorting at Deie Truckfors.
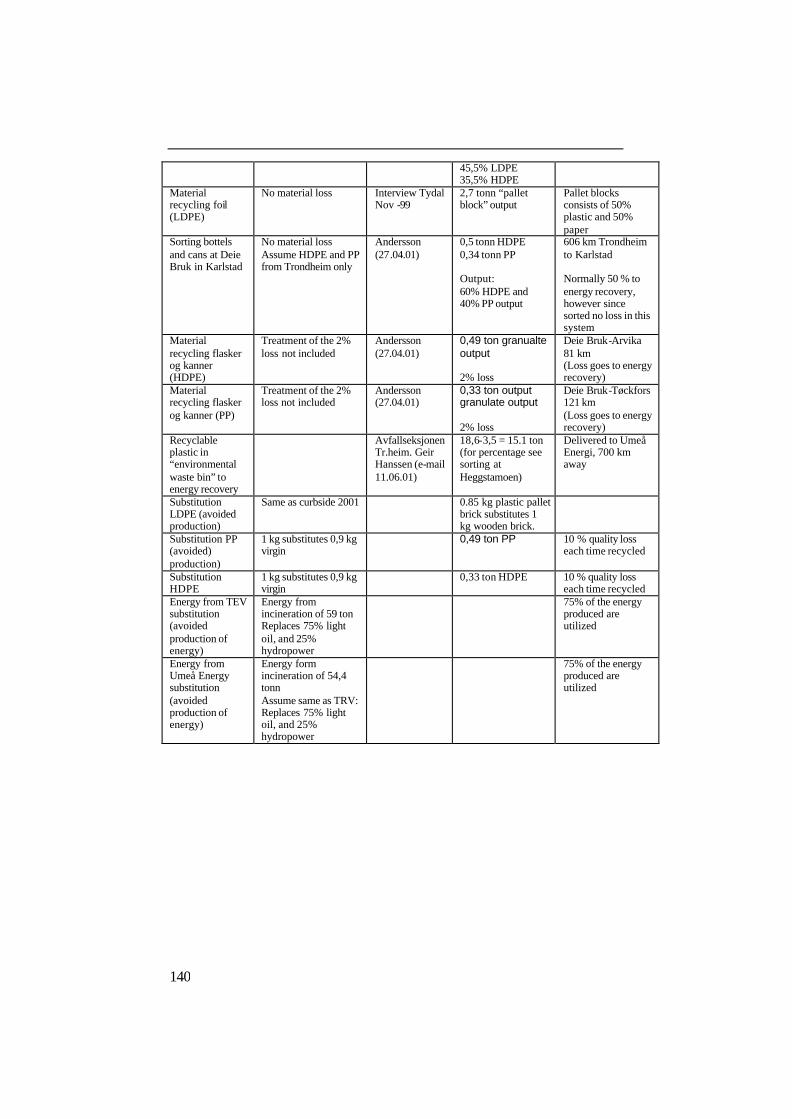
140
45,5% LDPE 35,5% HDPE
Material recycling foil (LDPE)
No material loss Interview Tydal Nov -99
2,7 tonn “pallet block” output
Pallet blocks consists of 50% plastic and 50% paper
Sorting bottels and cans at Deie Bruk in Karlstad
No material loss Assume HDPE and PP from Trondheim only
Andersson (27.04.01)
0,5 tonn HDPE 0,34 tonn PP Output: 60% HDPE and 40% PP output
606 km Trondheim to Karlstad Normally 50 % to energy recovery, however since sorted no loss in this system
Material recycling flasker og kanner (HDPE)
Treatment of the 2% loss not included
Andersson (27.04.01)
0,49 ton granualte output 2% loss
Deie Bruk-Arvika 81 km (Loss goes to energy recovery)
Material recycling flasker og kanner (PP)
Treatment of the 2% loss not included
Andersson (27.04.01)
0,33 ton output granulate output 2% loss
Deie Bruk-Tøckfors 121 km (Loss goes to energy recovery)
Recyclable plastic in “environmental waste bin” to energy recovery
Avfallseksjonen Tr.heim. Geir Hanssen (e-mail 11.06.01)
18,6-3,5 = 15.1 ton (for percentage see sorting at Heggstamoen)
Delivered to Umeå Energi, 700 km away
Substitution LDPE (avoided production)
Same as curbside 2001 0.85 kg plastic pallet brick substitutes 1 kg wooden brick.
Substitution PP (avoided) production)
1 kg substitutes 0,9 kg virgin
0,49 ton PP
10 % quality loss each time recycled
Substitution HDPE
1 kg substitutes 0,9 kg virgin
0,33 ton HDPE 10 % quality loss each time recycled
Energy from TEV substitution (avoided production of energy)
Energy from incineration of 59 ton Replaces 75% light oil, and 25% hydropower
75% of the energy produced are utilized
Energy from Umeå Energy substitution (avoided production of energy)
Energy form incineration of 54,4 tonn Assume same as TRV: Replaces 75% light oil, and 25% hydropower
75% of the energy produced are utilized

141
APPENDIX 3 E) Environmental data - Igloo Trondheim 2001 (5 months, 01.01-01.06)
NB: Generally same data as for 2001- curbside except from material flows, household transport, and collection of ”environmental waste igloo”
Process/ element
Assumptions Data source Calculation/ Data used
Comments
Household No hot water use For generated amounts of plastic and plastic in rest fraction- see material flow data
Consumer transport to igloo
Due to only 200m max distance to igloos- it is assumed walking
No transport env. load - walking
Collection of “miljødunk”
Assumed 10% less diesel consumption due to less idle time and 10% shorter distance compared to curbside
Calculated as 20% shorter distance (compared to 19 km) = 15,2 km
Collection of “rest fraction”
Transp. Data Same as curbside 2001
Sorting TRV Same as curbside 2001 Recyclable plastic in “Miljø dunk” to energy recovery
Avfallseksjonen Tr.heim. Geir Hanssen (e-mail 110601) Energy recovery: Data fra SFT 1366/1999 (Sandmann) s.32 og 39
700 km Using the same energy recovery data as for the plastic that goes to Trondheim
Delivered to Umeå Energi,
LDPE recycling and Substitution
Same as curbside 2001
Transportation to HDPE/PP sorting recycling
Assumed same truck as for Transportation to recycler LDPE
Trondheim to Karlstad 606 km
Sorting bottels and cans Deie Bruk i Karlstad
No loss (because sorted twice before)
Andersson (27.04.01)
Output: 60% HDPE and 40% PP output Assume same energy use as at TRV (but electricity Swedish average –
For the loss going to energy recovery assuming no transport and energy recovery data from Trondheim
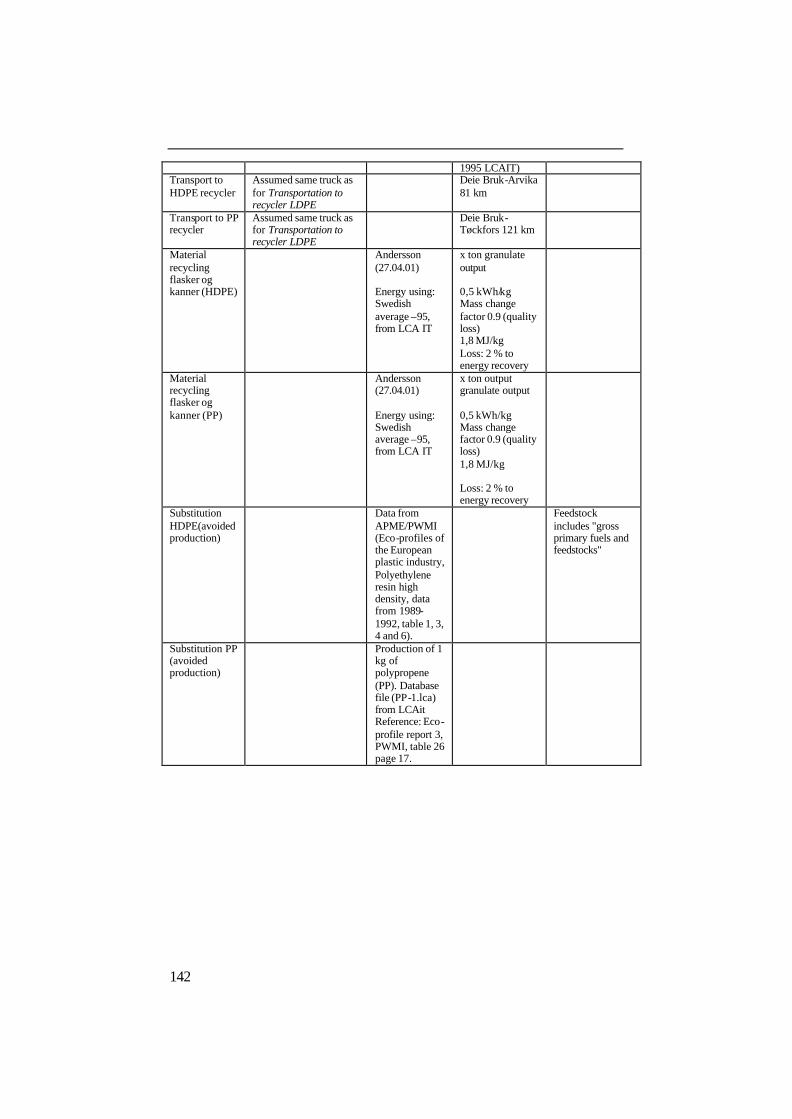
142
1995 LCAIT) Transport to HDPE recycler
Assumed same truck as for Transportation to recycler LDPE
Deie Bruk-Arvika 81 km
Transport to PP recycler
Assumed same truck as for Transportation to recycler LDPE
Deie Bruk-Tøckfors 121 km
Material recycling flasker og kanner (HDPE)
Andersson (27.04.01) Energy using: Swedish average –95, from LCA IT
x ton granulate output 0,5 kWh/kg Mass change factor 0.9 (quality loss) 1,8 MJ/kg Loss: 2 % to energy recovery
Material recycling flasker og kanner (PP)
Andersson (27.04.01) Energy using: Swedish average –95, from LCA IT
x ton output granulate output 0,5 kWh/kg Mass change factor 0.9 (quality loss) 1,8 MJ/kg Loss: 2 % to energy recovery
Substitution HDPE(avoided production)
Data from APME/PWMI (Eco-profiles of the European plastic industry, Polyethylene resin high density, data from 1989-1992, table 1, 3, 4 and 6).
Feedstock includes "gross primary fuels and feedstocks"
Substitution PP (avoided production)
Production of 1 kg of polypropene (PP). Database file (PP-1.lca) from LCAit Reference: Eco-profile report 3, PWMI, table 26 page 17.
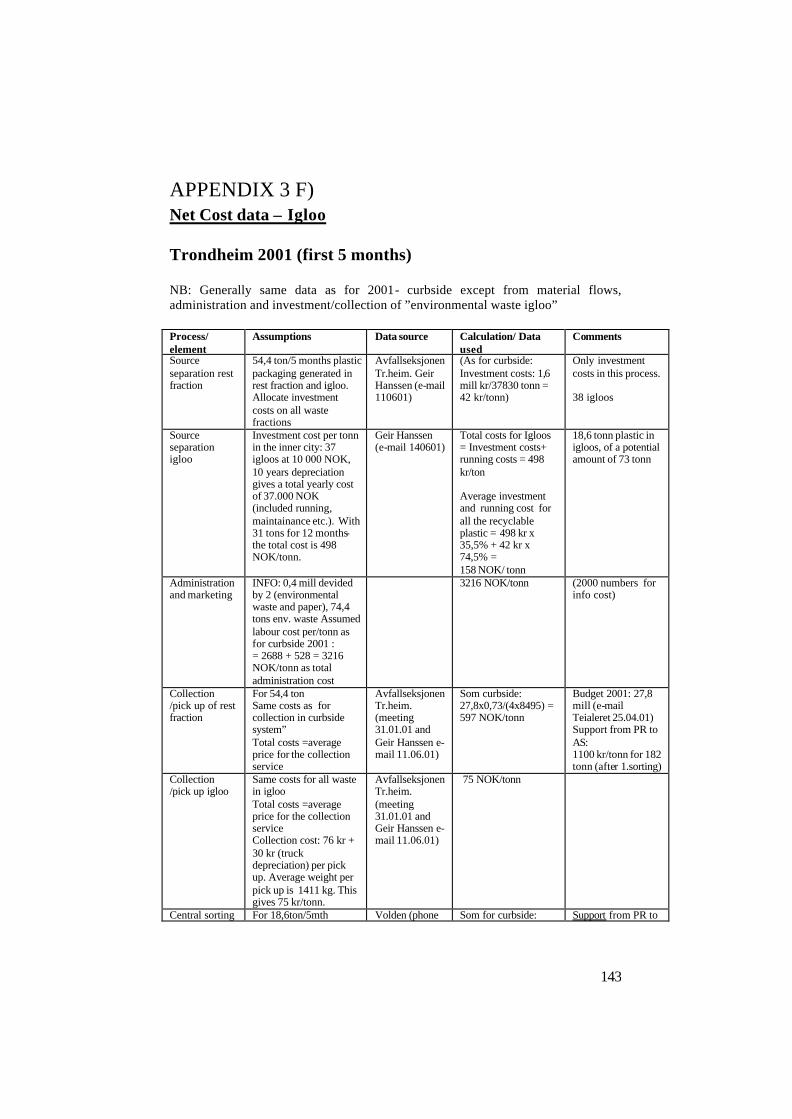
143
APPENDIX 3 F) Net Cost data – Igloo Trondheim 2001 (first 5 months)
NB: Generally same data as for 2001- curbside except from material flows, administration and investment/collection of ”environmental waste igloo”
Process/ element
Assumptions Data source Calculation/ Data used
Comments
Source separation rest fraction
54,4 ton/5 months plastic packaging generated in rest fraction and igloo. Allocate investment costs on all waste fractions
Avfallseksjonen Tr.heim. Geir Hanssen (e-mail 110601)
(As for curbside: Investment costs: 1,6 mill kr/37830 tonn = 42 kr/tonn)
Only investment costs in this process. 38 igloos
Source separation igloo
Investment cost per tonn in the inner city: 37 igloos at 10 000 NOK, 10 years depreciation gives a total yearly cost of 37.000 NOK (included running, maintainance etc.). With 31 tons for 12 months- the total cost is 498 NOK/tonn.
Geir Hanssen (e-mail 140601)
Total costs for Igloos = Investment costs+ running costs = 498 kr/ton Average investment and running cost for all the recyclable plastic = 498 kr x 35,5% + 42 kr x 74,5% = 158 NOK/ tonn
18,6 tonn plastic in igloos, of a potential amount of 73 tonn
Administration and marketing
INFO: 0,4 mill devided by 2 (environmental waste and paper), 74,4 tons env. waste Assumed labour cost per/tonn as for curbside 2001 : = 2688 + 528 = 3216 NOK/tonn as total administration cost
3216 NOK/tonn (2000 numbers for info cost)
Collection /pick up of rest fraction
For 54,4 ton Same costs as for collection in curbside system” Total costs =average price for the collection service
Avfallseksjonen Tr.heim. (meeting 31.01.01 and Geir Hanssen e-mail 11.06.01)
Som curbside: 27,8x0,73/(4x8495) = 597 NOK/tonn
Budget 2001: 27,8 mill (e-mail Teialeret 25.04.01) Support from PR to AS: 1100 kr/tonn for 182 tonn (after 1.sorting)
Collection /pick up igloo
Same costs for all waste in igloo Total costs =average price for the collection service Collection cost: 76 kr + 30 kr (truck depreciation) per pick up. Average weight per pick up is 1411 kg. This gives 75 kr/tonn.
Avfallseksjonen Tr.heim. (meeting 31.01.01 and Geir Hanssen e-mail 11.06.01)
75 NOK/tonn
Central sorting For 18,6ton/5mth Volden (phone Som for curbside: Support from PR to

144
Uncertain data: 650 is for environmental waste (invoices) 1200 kr/ton is very rough estimate from Volden
25.04.01) 650 kr/ton (from AS for first sorting) + 1200 kr/ton (from PR for 2.sorting) = 1850 kr/ton
TRV: 1200 kr/tonn as regional receiver + 1250 kr/ton for sorted film (24,3 tons), 2500 kr/ton for bottles and cans (6 tons) and 500 kr/ton for energy fraction (150 kr/ton) .
Transport to LDPE mat. Recycler
Hanssen (e-mail 23.02.01) Volden (phone 01.03.01)
100 NOK/tonn Same as Curbside 2001 TRV does not pay for the cargo to Tydal 176 km
Transport bottles and cans (HDPE+PP) to sorting
Volden (phone 01.03.01)
311 NOK/ton Same as Curbside 2001 To Deie Bruk (Karlstad), 606 km from Trondheim
Sorting HDPE and PP
Andersson (phone 27.04.01)
2275 SEK/ton* 0,9 = 2050 NOK/tonn
Same as Curbside 2001 Sorting at Deie Bruk (Karlstad)
Transport sorting to HDPE mat.recycler
Hanssen (e-mail 23.02.01)
100 NOK/tonn Same as Curbside 2001 Karlstad-Arvika = 81 km
Transport sorting to PP mat.recycler
100 NOK/tonn Same as Curbside 2001 Karlstad-Tøckfors 121 km
Transport from sorting at TRV to energy recovery
Volden (phone 25.04.01)
254 NOK/ton Same as Curbside 2001 TRV pay for the transport to Umeå Energi, 700 km
Recycling of pallet blocks at Plastgjenvinning i Tydal
Kvello (phone 22.09.00) Schefte (phone 26.04.01)
1800 kr/tonn+1450 kr/tonn – 100 kr/ton (transport) = 3150 NOK/ton
Same as Curbside 2001 Support from Plastretur: 1450 kr/tonn for sold material
Production of PP regranulate, Truckfors
Andersson (phone 27.04.01)
3500 SEK/tonn* 0,9 = 3150 NOK/tonn
As for curbside 2001
Production of HDPE regranulate at Arrvika
Andersson (phone 27.04.01)
3500 SEK/tonn* 0,9 = 3150 NOK/tonn
As for curbside 2001
Sale of recycled material (pallet blocks)
Kvello (phone 22.09.00)
1800 NOK/tonn As for curbside 2001
Sale of PP-regranulate
Andersson (meeting 22.03.01)
Som for curbside:4250 kr/ton* 0,9 = 3825 NOK/tonn
Sales price as for curbside 2001
Sale of HDPE regranulate
Andersson (meeting
Som for curbside:4800 kr/ton* 0,9 = 4320
Sales price as for curbside 2001

145
22.03.01) NOK/ tonn Incineration Umeå
No data from Umeå Use data from TEV
Resultat TEV Fjernvarme 2000 (www.tev.no)
Total costs= 1383 NOK/ton
Sale of district heating from Umeå
No data from Umeå Use data from TEV
Resultat TEV Fjernvarme 2000 (www.tev.no)
Inntekter fjernvarme: 1552 NOK/ton
Incineration TRV
Same costs for all kinds of waste
Resultat TEV Fjernvarme 2000 (www.tev.no)
Total costs = 1383 NOK/ton
As for curbside 2001
Sale of district heating TRV
Average sale price for all waste incinerated
Resultat TEV Fjernvarme 2000 (www.tev.no)
Revenues district heating 1552 NOK/ton
As for curbside 2001

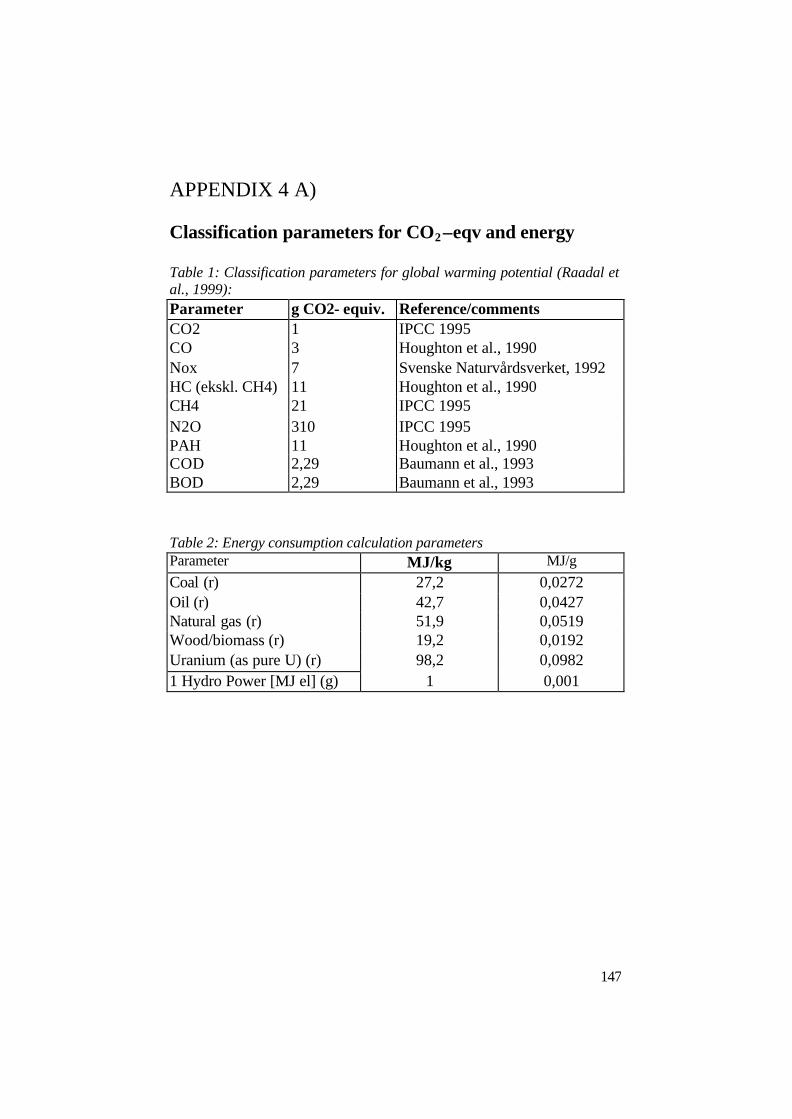
147
APPENDIX 4 A) Classification parameters for CO2 –eqv and energy Table 1: Classification parameters for global warming potential (Raadal et al., 1999): Parameter g CO2- equiv. Reference/comments CO2 1 IPCC 1995 CO 3 Houghton et al., 1990 Nox 7 Svenske Naturvårdsverket, 1992 HC (ekskl. CH4) 11 Houghton et al., 1990 CH4 21 IPCC 1995 N2O 310 IPCC 1995 PAH 11 Houghton et al., 1990 COD 2,29 Baumann et al., 1993 BOD 2,29 Baumann et al., 1993
Table 2: Energy consumption calculation parameters Parameter MJ/kg MJ/g Coal (r) 27,2 0,0272 Oil (r) 42,7 0,0427 Natural gas (r) 51,9 0,0519 Wood/biomass (r) 19,2 0,0192 Uranium (as pure U) (r) 98,2 0,0982 1 Hydro Power [MJ el] (g) 1 0,001


149
APPENDIX 4 B) Human Toxicity Potential (Hertwich et al. 2001) In the study only part of the HTP method is included, due to what was found relevant for the assessed recycling systems. Heavy metals and dioxin from the following list is included.
Chem
ChemID Cancer air HTP
Cancer sw HTP
NonCancer air HTP
NonCancer sw HTP
Dominant exposure route
Dominant exposure route sw
[kg benzene air equivalents]
[kg benzene air equivalents]
[kg benzene air equivalents]
[kg toluene air equivalents]
[kg toluene air equi-valents]
1,1,1,2-TETRACHLORROETHANE
630-20-6 7,1 e+0 6,2 e-1 2,6 e+2 2,2 e+1 InhA InhA
1,1,1-Trichloroethane 71-55-6 2,0 e+2 1,9 e+2 BInhA InhA
1,1,2,2-Tetrachloroethane
79-34-5 2,2 e+1 1,4 e+1 1,0 e+1 8,3 e+0 InhA InhA
1,1,2-Trichloroethane 79-00-5 5,5 e+0 5,7 e+0 2,0 e+1 4,3 e+1 InhA InhA
1,1-Dichloroethane 75-34-3 5,5 e-1 5,1 e-1 1,9 e+1 1,8 e+1 InhA InhA 1,1-Dichloroethylene 75-35-4 2,0 e+0 1,0 e+1 8,4 e+0 4,5 e+1 BInhA InhW
1,1-DIFLUORO-1-CHLOROETHANE
75-68-3 7,9 e+0 6,8 e-2 BInhA InhA
1,1-DIMETHYLHYDRAZINE
57-14-7 1,7 e+0 6,8 e-1 9,5 e+2 4,4 e+2 IepA IwW
1,2,3,4,6,7,8-HEPTACHLORODIBENZOFURAN
67562-39-4 8,7 e+5 4,5 e+6 BImS BIfW
1,2,4,5-tetrachlorobenzene
95-94-3 3,3 e+4 5,9 e+4 InhA IfW
1,2,4-Trichlorobenzene
120-82-1 3,0 e+1 2,1 e+2 InhA IfW
1,2,4-TRIMETHYLBENZENE
95-63-6 3,5 e+0 8,4 e+2 BInhA IfW
1,2-DIBROMOETHANE
106-93-4 8,4 e+0 1,6 e+1 4,1 e+3 3,5 e+3 InhA InhA
1,2-Dichlorobenzene (o)
95-50-1 3,0 e+1 3,3 e+1 InhA InhA
1,2-Dichloroethane 107-06-2 5,3 e+0 5,8 e+0 1,9 e+1 2,0 e+1 InhA InhA 1,2-DICHLOROETHYLENE
540-59-0 1,0 e+1 2,7 e+1 InhA InhW
1,2-Dichloropropane 78-87-5 1,6 e+0 2,1 e+0 6,3 e+2 7,3 e+2 InhA InhA 1,2-dinitrobenzene 528-29-0 2,2 e+3 5,9 e+2 IepA IwW
1,3-BUTADIENE 106-99-0 3,3 e-1 1,2 e+1 1,2 e+0 4,3 e+1 BInhA InhW 1,3-DICHLOROBENZENE
541-73-1 9,1 e-1 1,2 e+0 1,9 e+1 2,2 e+1 InhA InhA
1,3-Dichloropropene 542-75-6 1,7 e-1 3,6 e-1 1,5 e+1 1,2 e+2 InhA InhW
1,3-PHENYLENEDIAMI
108-45-2 4,5 e+1 2,3 e+1 IepR * IwW

150
NE 1,4-Dichlorobenzene (p)
106-46-7 2,6 e+0 1,6 e+0 8,1 e+0 4,6 e+0 InhA InhA
1,4-dinitrobenzene 100-25-4 6,5 e+2 6,8 e+2 InhA InhA 1,4-DIOXANE 123-91-1 3,1 e-2 9,6 e-2 3,8 e-2 1,2 e-1 InhA IwW 11,12-BENZOFLUORANTHENE
207-08-9 5,8 e+2 1,9 e+4 BIfW BIfW
1-CHLORO-2,3-EPOXYPROPANE
106-89-8 1,4 e+0 5,8 e-1 1,7 e+3 6,2 e+2 InhA InhA
1-chloro-4-nitrobenzene
100-00-5 6,8 e+0 6,4 e+0 InhA InhA
1-Chlorobutane 109-69-3 1,9 e+0 2,5 e+0 BInhA InhA
1-NAPHTYL N-METHYLCARBAMATE
63-25-2 2,4 e-4 8,3 e-2 3,0 e-3 1,0 e+0 InhA InhW
2,2-(4,4'-DIHYDROXYDIPHENYL)PROPANE
80-05-7 4,2 e+0 9,9 e-1 IepR IfW
2,3,4,6-Tetrachlorophenol
58-90-2 7,6 e+1 1,5 e+2 IepR * IfW
2,3,4,7,8-PENTACHLORODIBENZOFURAN
57117-31-4 1,1 e+7 5,0 e+7 5,8 e+8 2,7 e+9 BIepA BIfW
2,3,7,8-TCDD 1746-01-6 1,8 e+9 1,0 e+9 2,3 e+12 1,3 e+12 BImR BImW 2,3,7,8-TETRACHLORODIBENZOFURAN
51207-31-9 1,9 e+6 8,8 e+6 BIepA BIfW
2,4,5-T 93-76-5 1,5 e+2 1,3 e+1 IepA DerW 2,4,5-trichlorophenol 95-95-4 1,4 e+1 1,8 e+1 IepA IfW
2,4,6-TRICHLOROPHENOL
88-06-2 2,8 e+0 5,3 e-2 2,8 e+1 5,3 e-1 IepA IfW
2,4,6-trinitrophenol 88-89-1 1,6 e+4 1,9 e+3 IepR * IwW 2,4,6-trinitrotoluene 118-96-7 2,8 e-1 4,1 e-3 5,2 e+2 7,8 e+0 IepR IwW
2,4-D [ACETIC ACID (2,4-DICHLOROPHENOXY)-]
94-75-7 2,8 e-1 1,9 e-2 4,2 e+1 2,9 e+0 IepR IwW
2,4-DIAMINOTOLUENE
95-80-7 9,7 e+0 2,0 e+0 IepR IwW
2,4-DICHLOROPHENOL
120-83-2 6,1 e+1 3,5 e-1 IepA IfW
2,4-DIMETHYLPHENOL
105-67-9 3,3 e-1 2,2 e+0 InhA IfW
2,4-DINITROPHENOL
51-28-5 2,1 e+2 2,0 e+1 InhA IwW
2,4-Dinitrotoluene 121-14-2 3,5 e+0 5,1 e-2 1,6 e+2 2,3 e+0 IepA IwW 2,6-DIMETHYLPNENOL
576-26-1 5,2 e+1 9,8 e+2 InhA IwW
2,6-Dinitrotoluene 606-20-2 6,0 e+0 5,8 e-2 2,5 e+2 2,4 e+0 IepA IwW 2-AMINONAPHTHALENE
91-59-8 7,4 e-1 3,7 e+0 InhA IwW
2-butenal 123-73-9 6,7 e-1 1,8 e+0 InhA InhW
2-CHLOR-1,3-BUTADIENE
126-99-8 5,3 e+0 5,4 e+1 BInhA InhW
2-chlorophenol 95-57-8 2,6 e+1 1,3 e+2 InhA IfW

151
2-Chloropropane 75-29-6 4,2 e+1 4,9 e+1 InhA InhA 2-METHOXYETHANOL
109-86-4 3,6 e+0 4,6 e+1 InhA InhW
2-nitroaniline 88-74-4 5,4 e+2 9,0 e+2 InhA IwW 2-NITROPROPANE 79-46-9 6,0 e+0 5,6 e+1 3,2 e+0 3,0 e+1 InhA InhW
2-nitrotoluene 88-72-2 3,5 e+0 2,8 e+0 InhA IwW 2-PHENYLPHENOL 90-43-7 2,9 e-5 2,5 e-3 2,2 e-2 1,8 e+0 InhA IfW
3,3-Dichlorobenzidine 91-94-1 2,3 e-1 3,4 e-3 IepA IfW 3-nitrotoluene 99-08-1 1,2 e+2 1,5 e+2 InhA InhA
4,4'-DIAMINO DITAN
101-77-9 2,8 e+0 5,6 e-1 7,4 e-1 1,2 e-1 IepR IwW
4,6-DINITRO-O-CRESOL
534-52-1 4,5 e+3 1,5 e+2 IepA IwW
4-AMINOBIPHENYL 92-67-1 1,3 e+2 1,6 e+1 IepR IwW 4-NITROPHENOL 100-02-7 6,8 e+0 6,7 e+0 BInhA InhW
ABAMECTIN 71751-41-2 4,2 e+3 8,0 e+1 IepA IwW Acenaphthene 83-32-9 1,8 e-1 6,5 e+0 InhA IfW
ACEPHATE 30560-19-1 1,9 e-1 3,8 e-2 1,6 e+2 3,1 e+1 IepR * IwW ACETALDEHYDE 75-07-0 3,5 e-3 6,3 e-3 3,9 e+0 1,1 e+1 InhA InhW ACETAMIDE 60-35-5 3,3 e-1 2,4 e-2 IepA IwW
Acetone 67-64-1 3,6 e-1 2,3 e-1 InhA InhA ACETONITRILE 75-05-8 1,6 e+2 7,0 e+1 InhA InhA
ACETOPHENONE 98-86-2 7,6 e+0 1,8 e+0 InhA InhA ACROLEIN 107-02-8 2,2 e+3 1,1 e+4 InhA IfW
ACRYLAMIDE 79-06-1 8,7 e+1 2,1 e+0 2,8 e+3 6,5 e+1 IepA IwW ACRYLIC ACID 79-10-7 3,0 e+1 3,7 e-1 IepA IwW
ACRYLONITRILE 107-13-1 1,8 e+0 1,7 e+0 8,8 e+1 6,5 e+1 InhA InhW ALDICARB 116-06-3 9,1 e+2 1,9 e+3 IepR * IfW
Aldrin 309-00-2 6,4 e+2 9,3 e+3 3,7 e+5 5,4 e+6 BIupR BIfW ALLYL ALCOHOL 107-18-6 1,7 e+0 2,3 e+0 InhA IwW
ALLYL CHLORIDE 107-05-1 8,1 e-3 2,0 e-2 3,8 e+1 9,5 e+1 BInhA InhW ALLYL TRICHLORIDE
96-18-4 1,7 e+2 2,1 e+2 1,1 e+2 1,4 e+2 InhA InhA
alpha-HCH (alpha-BHC)
319-84-6 5,8 e+1 1,8 e+2 6,7 e+1 2,0 e+2 IepA IfW
ALUMINUM (FUME OR DUST)
7429-90-5 3,0 e+4 2,4 e+1 IepA* IwW
AMMONIA 7664-41-7 3,2 e+0 5,9 e-2 InhA InhW ANILAZINE 101-05-3 2,6 e+3 1,5 e+2 IepA IfW
ANILINE 62-53-3 2,3 e-3 7,8 e-3 4,0 e+1 1,4 e+2 InhA IwW Anthracene 120-12-7 3,6 e-2 2,0 e-2 IepA IfW
ANTIMONY 7440-36-0 1,9 e+4 3,8 e+3 IepA* IwW ANTIMONY COMPOUNDS
ADQ500 1,9 e+4 3,8 e+3 IepA* IwW
Aroclor 1016 12674-11-2 4,8 e+3 5,1 e+5 BInhA IfW ARSENIC 7440-38-2 3,3 e+3 8,2 e+2 2,2 e+5 5,2 e+4 IupR IupW ARSENIC COMP OUNDS
ARF750 3,3 e+3 8,2 e+2 2,2 e+5 5,2 e+4 IupR IupW
Atrazine 1912-24-9 1,0 e+1 1,1 e-2 3,8 e+1 4,0 e-2 IepR IfW Azinphos-methyl 86-50-0 1,5 e+2 1,7 e+1 IepR IwW

152
AZIRIDINE 151-56-4 1,4 e+2 8,4 e+2 InhA IwW BARIUM 7440-39-3 9,6 e+2 1,3 e+2 IepA* IfW BARIUM COMPOUNDS
BAK500 9,6 e+2 1,3 e+2 IepA* IfW
BAYGON 114-26-1 2,0 e-2 1,2 e-2 3,8 e+1 2,3 e+1 IepR * IwW BENOMYL 17804-35-2 3,2 e-2 7,9 e-3 4,4 e+0 1,1 e+0 IepR IwW
Bentazone 25057-89-0 1,5 e+3 4,0 e+3 IwW IwW Benzene 71-43-2 1,0 e+0 8,5 e-1 1,7 e+1 1,4 e+1 InhA InhA
BENZENE, M-DIMETHYL
108-38-3 1,7 e-1 9,1 e-1 BInhA InhW
BENZENE, O-DIMETHYL
95-47-6 2,8 e-1 1,1 e+0 BInhA InhW
BENZENE, P-DIMETHYL
106-42-3 2,7 e-1 1,1 e+0 BInhA InhW
benzenethiol 108-98-5 1,0 e+4 3,7 e+4 InhA InhW
benzidine 92-87-5 6,3 e+3 7,2 e+2 1,2 e+2 1,4 e+1 IepR * IwW Benzo(a)anthracene 56-55-3 1,4 e+1 5,5 e-1 IepA IfW
Benzo(a)pyrene 50-32-8 1,6 e+3 1,1 e+1 BIepA BIepW Benzo(b)fluoranthene 205-99-2 6,4 e+1 4,7 e+2 BIepA BIfW
BENZO(B)PYRIDINE
91-22-5 1,9 e+1 1,3 e+1 InhA IwW
benzoic acid 65-85-0 2,8 e-2 5,3 e-3 InhA IwW
BENZOIC TRICHLORIDE (BENZOTRICHLORIDE)
98-07-7 2,8 e+2 2,3 e-2 InhA IfW
BENZYL CHLORIDE
100-44-7 4,8 e-1 7,4 e-2 2,3 e+1 3,6 e+0 InhA InhW
BERYLLIUM 7440-41-7 2,8 e+1 7,7 e-47 4,0 e+5 1,4 e+3 IepA* IupW
BERYLLIUM COMPOUNDS
BFQ500 2,8 e+1 7,7 e-47 4,0 e+5 1,4 e+3 IepA* IupW
beta-HCH (beta-BHC) 319-85-7 1,0 e+2 1,7 e+2 3,2 e+3 5,3 e+3 IepA IfW
BIFENTHRIN 82657-04-3 5,0 e+0 1,3 e+1 2,5 e+2 6,7 e+2 BIepA BIfW BIPHENYL 92-52-4 6,7 e-1 8,6 e+0 InhA IfW
BIS(2-CHLORO-1-METHYLETHYL) ETHER
108-60-1 2,2 e-2 3,1 e-1 InhA InhW
Bis(2-chloroethyl)ether
111-44-4 1,0 e+1 2,4 e+1 3,4 e+0 8,3 e+0 InhA IwW
Bis(2-ethylhexyl)phthalate
117-81-7 2,4 e-1 1,0 e-1 4,7 e+1 2,0 e+1 IepA IfW
BIS(TRIBUTYLTIN) OXIDE
56-35-9 2,8 e+3 2,5 e+4 IepA* IfW
Bromodichloromethane
75-27-4 1,3 e+2 9,9 e+1 1,5 e+3 1,1 e+3 InhA InhA
Bromoform 75-25-2 1,9 e+0 2,0 e+0 7,1 e+2 7,2 e+2 InhA InhA Bromoxynil 1689-84-5 5,8 e+0 2,0 e+0 8,0 e+1 2,8 e+1 IepR IfW
Butanol 71-36-3 9,5 e-1 3,5 e-1 InhA IwW Butyl benzyl phthalate 85-68-7 5,4 e+0 1,9 e-1 IepA IepA
Butyric acid, 4-(2,4-dichlorophenoxy)
94-82-6 1,7 e+2 1,8 e+1 IepA IfW
CADMIUM 7440-43-9 8,3 e+1 3,9 e-49 5,0 e+6 3,6 e+5 IupR IupW
CADMIUM COMPOUNDS
CAE750 8,3 e+1 3,9 e-49 5,0 e+6 3,6 e+5 IupR IupW
Captafol 01.06.25 1,5 e+0 4,9 e+0 1,4 e+2 4,6 e+2 IepA IfW
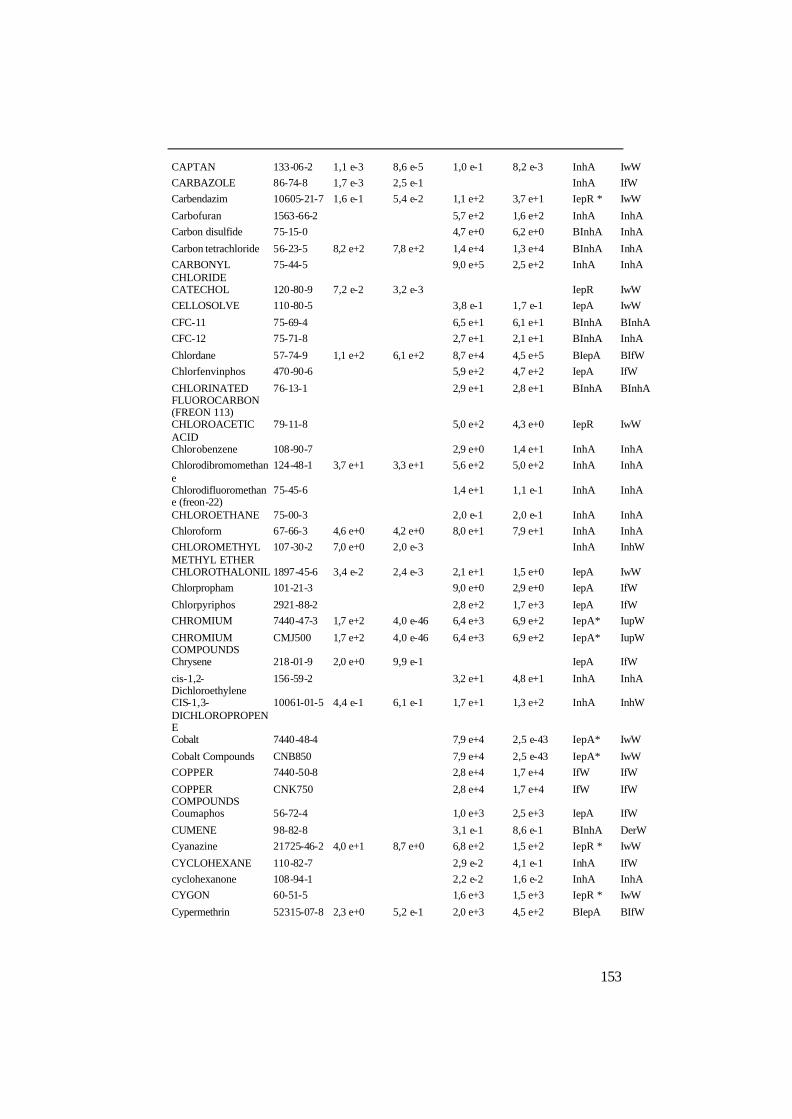
153
CAPTAN 133-06-2 1,1 e-3 8,6 e-5 1,0 e-1 8,2 e-3 InhA IwW CARBAZOLE 86-74-8 1,7 e-3 2,5 e-1 InhA IfW Carbendazim 10605-21-7 1,6 e-1 5,4 e-2 1,1 e+2 3,7 e+1 IepR * IwW
Carbofuran 1563-66-2 5,7 e+2 1,6 e+2 InhA InhA Carbon disulfide 75-15-0 4,7 e+0 6,2 e+0 BInhA InhA
Carbon tetrachloride 56-23-5 8,2 e+2 7,8 e+2 1,4 e+4 1,3 e+4 BInhA InhA CARBONYL CHLORIDE
75-44-5 9,0 e+5 2,5 e+2 InhA InhA
CATECHOL 120-80-9 7,2 e-2 3,2 e-3 IepR IwW CELLOSOLVE 110-80-5 3,8 e-1 1,7 e-1 IepA IwW
CFC-11 75-69-4 6,5 e+1 6,1 e+1 BInhA BInhA CFC-12 75-71-8 2,7 e+1 2,1 e+1 BInhA InhA
Chlordane 57-74-9 1,1 e+2 6,1 e+2 8,7 e+4 4,5 e+5 BIepA BIfW Chlorfenvinphos 470-90-6 5,9 e+2 4,7 e+2 IepA IfW
CHLORINATED FLUOROCARBON (FREON 113)
76-13-1 2,9 e+1 2,8 e+1 BInhA BInhA
CHLOROACETIC ACID
79-11-8 5,0 e+2 4,3 e+0 IepR IwW
Chlorobenzene 108-90-7 2,9 e+0 1,4 e+1 InhA InhA Chlorodibromomethane
124-48-1 3,7 e+1 3,3 e+1 5,6 e+2 5,0 e+2 InhA InhA
Chlorodifluoromethane (freon-22)
75-45-6 1,4 e+1 1,1 e-1 InhA InhA
CHLOROETHANE 75-00-3 2,0 e-1 2,0 e-1 InhA InhA Chloroform 67-66-3 4,6 e+0 4,2 e+0 8,0 e+1 7,9 e+1 InhA InhA CHLOROMETHYL METHYL ETHER
107-30-2 7,0 e+0 2,0 e-3 InhA InhW
CHLOROTHALONIL 1897-45-6 3,4 e-2 2,4 e-3 2,1 e+1 1,5 e+0 IepA IwW Chlorpropham 101-21-3 9,0 e+0 2,9 e+0 IepA IfW
Chlorpyriphos 2921-88-2 2,8 e+2 1,7 e+3 IepA IfW CHROMIUM 7440-47-3 1,7 e+2 4,0 e-46 6,4 e+3 6,9 e+2 IepA* IupW
CHROMIUM COMPOUNDS
CMJ500 1,7 e+2 4,0 e-46 6,4 e+3 6,9 e+2 IepA* IupW
Chrysene 218-01-9 2,0 e+0 9,9 e-1 IepA IfW
cis-1,2-Dichloroethylene
156-59-2 3,2 e+1 4,8 e+1 InhA InhA
CIS-1,3-DICHLOROPROPENE
10061-01-5 4,4 e-1 6,1 e-1 1,7 e+1 1,3 e+2 InhA InhW
Cobalt 7440-48-4 7,9 e+4 2,5 e-43 IepA* IwW
Cobalt Compounds CNB850 7,9 e+4 2,5 e-43 IepA* IwW COPPER 7440-50-8 2,8 e+4 1,7 e+4 IfW IfW
COPPER COMPOUNDS
CNK750 2,8 e+4 1,7 e+4 IfW IfW
Coumaphos 56-72-4 1,0 e+3 2,5 e+3 IepA IfW
CUMENE 98-82-8 3,1 e-1 8,6 e-1 BInhA DerW Cyanazine 21725-46-2 4,0 e+1 8,7 e+0 6,8 e+2 1,5 e+2 IepR * IwW
CYCLOHEXANE 110-82-7 2,9 e-2 4,1 e-1 InhA IfW cyclohexanone 108-94-1 2,2 e-2 1,6 e-2 InhA InhA CYGON 60-51-5 1,6 e+3 1,5 e+3 IepR * IwW
Cypermethrin 52315-07-8 2,3 e+0 5,2 e-1 2,0 e+3 4,5 e+2 BIepA BIfW

154
Cyromazine 66215-27-8 1,4 e-1 6,3 e-2 2,2 e+2 9,9 e+1 IepR * IwW DDD 72-54-8 3,9 e+2 2,9 e+3 BIfW BIfW DDE 72-55-9 2,3 e+2 4,2 e+2 BIupR BIfW
DDT 50-29-3 2,2 e+2 4,9 e+2 7,3 e+4 1,6 e+5 BIfW BIfW DDVP (DICHLORVOS)
62-73-7 3,7 e-1 6,0 e-1 2,5 e+2 2,7 e+2 InhA InhW
Deltamethrin 52918-63-5 8,0 e+1 3,1 e+0 IepA IfW Demeton 8065-48-3 2,1 e+4 2,0 e+3 IepR * IwW
Diazinon 333-41-5 3,1 e+3 2,5 e+3 IepA IfW Dibenz(a,h)anthracene 53-70-3 6,7 e+1 2,1 e+3 BIepA BIfW
DIBROMOMETHANE
74-95-3 3,1 e+2 3,2 e+2 InhA InhA
Dicamba 1918-00-9 4,9 e+1 1,1 e+1 IepR IwW
DICHLOROBENZENE (MIXED ISOMERS)
25321-22-6 1,8 e+0 1,9 e+0 2,4 e+1 2,5 e+1 IepA* IfW
Dichlorprop 120-36-5 1,9 e+2 7,8 e+1 IepR * IepW Dicofol 115-32-2 7,6 e+1 2,3 e+2 5,8 e+3 1,7 e+4 IepA* IfW
Dieldrin 60-57-1 4,7 e+3 3,1 e+4 1,7 e+5 1,1 e+6 IfW IfW DIETHANOLAMINE 111-42-2 1,4 e+1 3,0 e-1 IepR * IwW Diethyl phthalate 84-66-2 7,5 e-1 7,8 e-1 IepA IfW
diethyl sulfate 64-67-5 2,4 e-1 2,4 e-2 InhA IwW Dimethyl phthalate 131-11-3 6,3 e-2 4,5 e-3 InhA IwW
DIMETHYL SULFATE
77-78-1 1,4 e+2 2,0 e-1 InhA IwW
DIMETHYLAMINE 124-40-3 1,8 e+1 1,8 e+1 InhA IwW
DIMETHYLPHYLAMINE
121-69-7 4,8 e+0 1,0 e+1 InhA InhW
Di-n-butyl phthalate 84-74-2 2,0 e+1 4,5 e+0 IepA DerW
DINITROBUTYL PHENOL
88-85-7 1,6 e+3 1,8 e+3 IepA DerW
Di-n-octyl phthalate 117-84-0 4,0 e+4 4,3 e+5 BIepA BIfW
DIPHENYLAMINE 122-39-4 8,8 e+0 3,5 e+1 IepA IfW Disulfothon 298-04-4 1,1 e+4 1,1 e+4 IepA IfW
Diuron 330-54-1 9,9 e+2 3,2 e+2 IepR IfW Endosulfan 115-29-7 9,1 e+0 5,6 e+1 InhA IfW
Endrin 72-20-8 1,2 e+4 9,2 e+4 IfW IfW ETHOPROP 13194-48-4 3,7 e+0 3,7 e+0 3,8 e+4 3,8 e+4 IfW IfW
ethyl acetate 141-78-6 1,2 e-1 4,6 e-2 InhA InhW ETHYL ACRYLATE 140-88-5 1,5 e-2 3,4 e-2 6,3 e-1 1,5 e+0 InhA InhW
ETHYL DIPROPYLTHIOCARBAMATE
759-94-4 1,5 e+0 5,0 e+0 InhA IfW
Ethyl ether (diethyl ether)
60-29-7 1,7 e-1 7,1 e-1 InhA InhW
ethyl methacrylate 97-63-2 6,3 e-1 2,7 e+0 BInhA InhW Ethylbenzene 100-41-4 3,3 e-1 8,0 e-1 BInhA InhW
ETHYLENE GLYCOL
107-21-1 2,4 e-1 1,0 e-2 IepA IwW
ETHYLENE OXIDE 75-21-8 3,1 e+1 1,5 e+1 2,0 e+3 9,3 e+2 InhA InhA
ETHYLENETHIOUREA
96-45-7 3,1 e-1 1,3 e-1 2,4 e+3 1,0 e+3 IepR * IwW

155
Fenitrothion 122-14-5 1,2 e+3 3,1 e+2 IepA IfW FENTHION 55-38-9 7,9 e+3 3,6 e+4 IfW IfW Fentin acetate 900-95-8 2,8 e+3 1,5 e+3 IepR IfW
Fluoranthene 206-44-0 2,1 e+1 2,0 e+1 IepA IfW Fluorene 86-73-7 3,4 e+0 4,1 e+1 InhA IfW
FOLPET 133-07-3 9,2 e-2 7,6 e-4 7,4 e+0 6,2 e-2 IepA IfW FORMALDEHYDE 50-00-0 3,0 e-3 3,0 e-4 4,8 e+0 5,2 e-1 InhA IwW
FORMIC ACID 64-18-6 1,7 e-1 4,7 e-3 InhA IwW Furan 110-00-9 3,4 e+1 7,9 e+1 InhA InhW
gamma-HCH (lindane)
58-89-9 3,6 e+1 1,3 e+2 3,8 e+3 1,2 e+4 IepA IfW
Glyphosate 1071-83-6 1,0 e-2 7,3 e-2 4,9 e+1 3,5 e+2 IepW IepW
Heptachlor 76-44-8 1,0 e+1 4,7 e+2 1,0 e+2 4,7 e+3 IepA IfW Heptachlor epoxide 1024-57-3 4,6 e+1 5,2 e+3 7,7 e+3 8,7 e+5 InhA IfW
HEXACHLORINATED DIBENZOFURAN, 1,2,3,4,7,8-
70648-26-9 6,5 e+8 5,8 e+8 BIfW BIfW
Hexachloro-1,3-butadiene
87-68-3 8,5 e+1 1,1 e+2 1,5 e+4 8,0 e+4 BInhA InhA
Hexachlorobenzene 118-74-1 3,2 e+3 4,7 e+3 6,1 e+4 9,0 e+4 IepA IfW Hexachlorocyclopentadiene
77-47-4 5,0 e+1 2,5 e+2 BInhA IfW
Hexachloroethane 67-72-1 4,6 e+2 4,0 e+2 1,9 e+4 1,7 e+4 BInhA BInhA HEXANE 110-54-3 6,1 e-1 1,8 e+1 BInhA IfW
HEXONE 108-10-1 7,3 e-1 6,2 e-1 InhA InhW Hydrazine 302-01-2 4,8 e+0 1,2 e+1 1,4 e+2 3,5 e+2 InhA IwW
HYDROCYANIC ACID
74-90-8 2,1 e+4 1,9 e+4 InhA InhA
Hydrogen Chloride 7647-01-0 3,9 e-1 4,3 e-1 InhA InhA
Hydrogen Sulphide (H2S)
05.06.87 5,1 e-2 2,3 e+1 InhA InhA
HYDROQUINONE 123-31-9 8,2 e-1 3,2 e-4 1,0 e+1 4,0 e-3 IepR IwW
Indeno(1,2,3-c,d)pyrene
193-39-5 8,2 e+1 7,3 e+3 BIfW BIfW
Iprodione 36734-19-7 2,3 e+0 7,9 e-2 3,7 e+1 1,3 e+0 IepR IfW
isobutanol 78-83-1 3,6 e-1 8,8 e-2 InhA IwW Isophorone 78-59-1 1,3 e-4 3,1 e-3 8,1 e-3 3,9 e-1 InhA IwW
ISOPROPYL ALCOHOL (MANUFACTURING-STRONG ACID PROCESS ONLY, NO SUPPLIER NOTIFICATION)
67-63-0 1,2 e-2 9,2 e-3 InhA IwW
LEAD 7439-92-1 3,5 e+1 2,6 e+0 1,5 e+6 1,1 e+5 IupR IupW LEAD COMPOUNDS
LCT000 3,5 e+1 2,6 e+0 1,5 e+6 1,1 e+5 IupR IupW
LINURON 330-55-2 3,5 e+0 6,8 e+0 2,8 e+2 5,4 e+2 IepR * IfW MALATHION 121-75-5 2,8 e+1 1,9 e+1 IepR IfW
MALEIC ANHYDRIDE
108-31-6 1,7 e+2 1,1 e-5 IepR IwW
MANGANESE 7439-96-5 7,9 e+3 9,1 e+0 IepA* IwW
MANGANESE MAR500 7,9 e+3 9,1 e+0 IepA* IwW
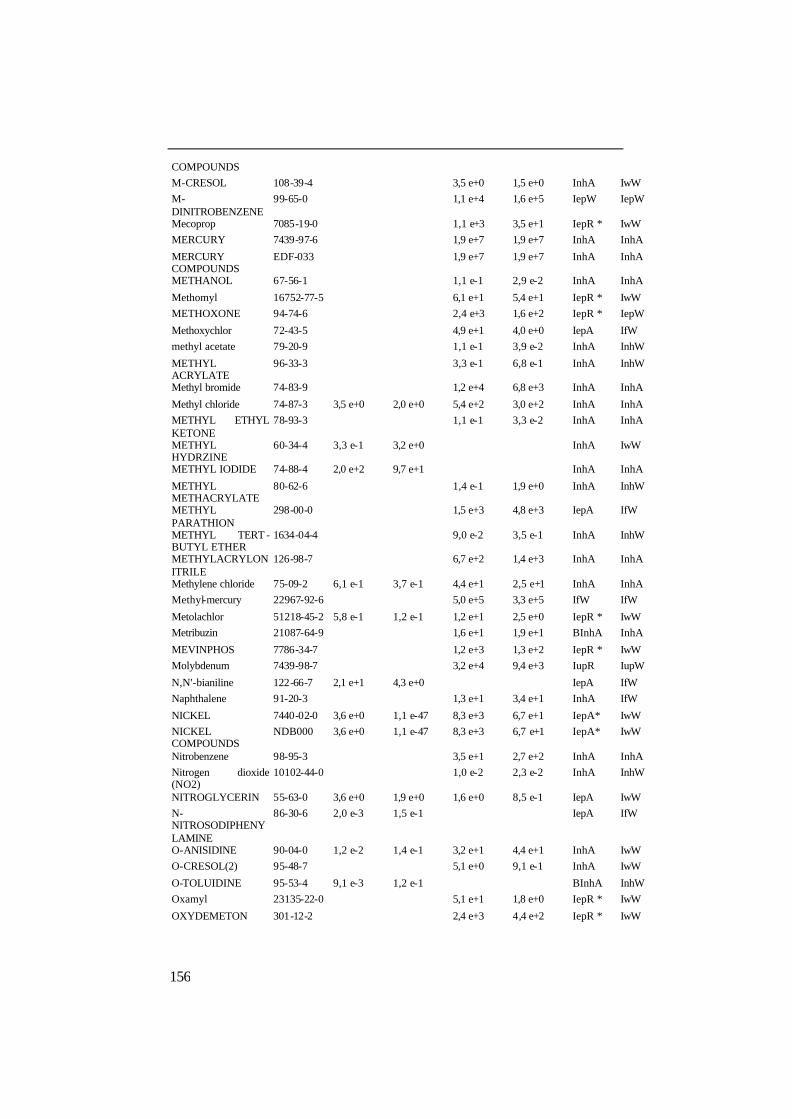
156
COMPOUNDS M-CRESOL 108-39-4 3,5 e+0 1,5 e+0 InhA IwW M-DINITROBENZENE
99-65-0 1,1 e+4 1,6 e+5 IepW IepW
Mecoprop 7085-19-0 1,1 e+3 3,5 e+1 IepR * IwW MERCURY 7439-97-6 1,9 e+7 1,9 e+7 InhA InhA
MERCURY COMPOUNDS
EDF-033 1,9 e+7 1,9 e+7 InhA InhA
METHANOL 67-56-1 1,1 e-1 2,9 e-2 InhA InhA
Methomyl 16752-77-5 6,1 e+1 5,4 e+1 IepR * IwW METHOXONE 94-74-6 2,4 e+3 1,6 e+2 IepR * IepW
Methoxychlor 72-43-5 4,9 e+1 4,0 e+0 IepA IfW methyl acetate 79-20-9 1,1 e-1 3,9 e-2 InhA InhW
METHYL ACRYLATE
96-33-3 3,3 e-1 6,8 e-1 InhA InhW
Methyl bromide 74-83-9 1,2 e+4 6,8 e+3 InhA InhA
Methyl chloride 74-87-3 3,5 e+0 2,0 e+0 5,4 e+2 3,0 e+2 InhA InhA METHYL ETHYL KETONE
78-93-3 1,1 e-1 3,3 e-2 InhA InhA
METHYL HYDRZINE
60-34-4 3,3 e-1 3,2 e+0 InhA IwW
METHYL IODIDE 74-88-4 2,0 e+2 9,7 e+1 InhA InhA
METHYL METHACRYLATE
80-62-6 1,4 e-1 1,9 e+0 InhA InhW
METHYL PARATHION
298-00-0 1,5 e+3 4,8 e+3 IepA IfW
METHYL TERT -BUTYL ETHER
1634-04-4 9,0 e-2 3,5 e-1 InhA InhW
METHYLACRYLONITRILE
126-98-7 6,7 e+2 1,4 e+3 InhA InhA
Methylene chloride 75-09-2 6,1 e-1 3,7 e-1 4,4 e+1 2,5 e+1 InhA InhA Methyl-mercury 22967-92-6 5,0 e+5 3,3 e+5 IfW IfW
Metolachlor 51218-45-2 5,8 e-1 1,2 e-1 1,2 e+1 2,5 e+0 IepR * IwW Metribuzin 21087-64-9 1,6 e+1 1,9 e+1 BInhA InhA
MEVINPHOS 7786-34-7 1,2 e+3 1,3 e+2 IepR * IwW Molybdenum 7439-98-7 3,2 e+4 9,4 e+3 IupR IupW
N,N'-bianiline 122-66-7 2,1 e+1 4,3 e+0 IepA IfW Naphthalene 91-20-3 1,3 e+1 3,4 e+1 InhA IfW
NICKEL 7440-02-0 3,6 e+0 1,1 e-47 8,3 e+3 6,7 e+1 IepA* IwW NICKEL COMPOUNDS
NDB000 3,6 e+0 1,1 e-47 8,3 e+3 6,7 e+1 IepA* IwW
Nitrobenzene 98-95-3 3,5 e+1 2,7 e+2 InhA InhA Nitrogen dioxide (NO2)
10102-44-0 1,0 e-2 2,3 e-2 InhA InhW
NITROGLYCERIN 55-63-0 3,6 e+0 1,9 e+0 1,6 e+0 8,5 e-1 IepA IwW N-NITROSODIPHENYLAMINE
86-30-6 2,0 e-3 1,5 e-1 IepA IfW
O-ANISIDINE 90-04-0 1,2 e-2 1,4 e-1 3,2 e+1 4,4 e+1 InhA IwW O-CRESOL(2) 95-48-7 5,1 e+0 9,1 e-1 InhA IwW
O-TOLUIDINE 95-53-4 9,1 e-3 1,2 e-1 BInhA InhW Oxamyl 23135-22-0 5,1 e+1 1,8 e+0 IepR * IwW
OXYDEMETON 301-12-2 2,4 e+3 4,4 e+2 IepR * IwW
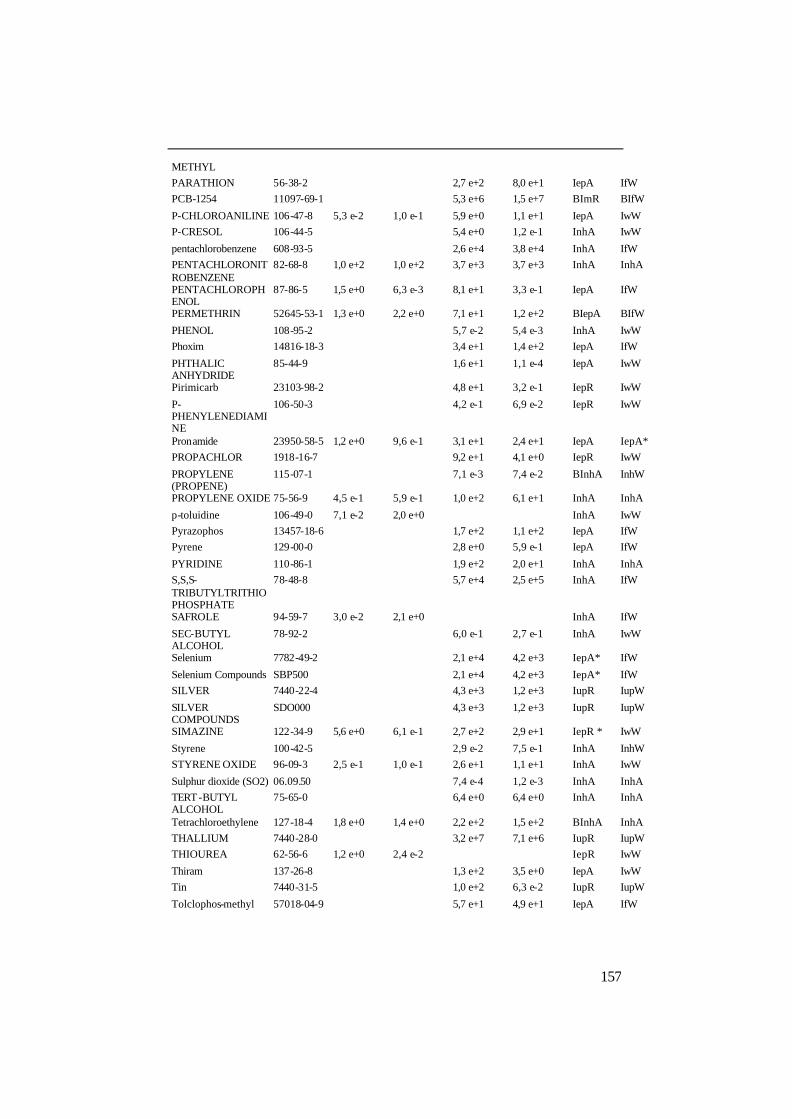
157
METHYL PARATHION 56-38-2 2,7 e+2 8,0 e+1 IepA IfW PCB-1254 11097-69-1 5,3 e+6 1,5 e+7 BImR BIfW
P-CHLOROANILINE 106-47-8 5,3 e-2 1,0 e-1 5,9 e+0 1,1 e+1 IepA IwW P-CRESOL 106-44-5 5,4 e+0 1,2 e-1 InhA IwW
pentachlorobenzene 608-93-5 2,6 e+4 3,8 e+4 InhA IfW PENTACHLORONITROBENZENE
82-68-8 1,0 e+2 1,0 e+2 3,7 e+3 3,7 e+3 InhA InhA
PENTACHLOROPHENOL
87-86-5 1,5 e+0 6,3 e-3 8,1 e+1 3,3 e-1 IepA IfW
PERMETHRIN 52645-53-1 1,3 e+0 2,2 e+0 7,1 e+1 1,2 e+2 BIepA BIfW
PHENOL 108-95-2 5,7 e-2 5,4 e-3 InhA IwW Phoxim 14816-18-3 3,4 e+1 1,4 e+2 IepA IfW
PHTHALIC ANHYDRIDE
85-44-9 1,6 e+1 1,1 e-4 IepA IwW
Pirimicarb 23103-98-2 4,8 e+1 3,2 e-1 IepR IwW
P-PHENYLENEDIAMINE
106-50-3 4,2 e-1 6,9 e-2 IepR IwW
Pronamide 23950-58-5 1,2 e+0 9,6 e-1 3,1 e+1 2,4 e+1 IepA IepA* PROPACHLOR 1918-16-7 9,2 e+1 4,1 e+0 IepR IwW
PROPYLENE (PROPENE)
115-07-1 7,1 e-3 7,4 e-2 BInhA InhW
PROPYLENE OXIDE 75-56-9 4,5 e-1 5,9 e-1 1,0 e+2 6,1 e+1 InhA InhA
p-toluidine 106-49-0 7,1 e-2 2,0 e+0 InhA IwW Pyrazophos 13457-18-6 1,7 e+2 1,1 e+2 IepA IfW Pyrene 129-00-0 2,8 e+0 5,9 e-1 IepA IfW
PYRIDINE 110-86-1 1,9 e+2 2,0 e+1 InhA InhA S,S,S-TRIBUTYLTRITHIOPHOSPHATE
78-48-8 5,7 e+4 2,5 e+5 InhA IfW
SAFROLE 94-59-7 3,0 e-2 2,1 e+0 InhA IfW
SEC-BUTYL ALCOHOL
78-92-2 6,0 e-1 2,7 e-1 InhA IwW
Selenium 7782-49-2 2,1 e+4 4,2 e+3 IepA* IfW
Selenium Compounds SBP500 2,1 e+4 4,2 e+3 IepA* IfW SILVER 7440-22-4 4,3 e+3 1,2 e+3 IupR IupW
SILVER COMPOUNDS
SDO000 4,3 e+3 1,2 e+3 IupR IupW
SIMAZINE 122-34-9 5,6 e+0 6,1 e-1 2,7 e+2 2,9 e+1 IepR * IwW
Styrene 100-42-5 2,9 e-2 7,5 e-1 InhA InhW STYRENE OXIDE 96-09-3 2,5 e-1 1,0 e-1 2,6 e+1 1,1 e+1 InhA IwW
Sulphur dioxide (SO2) 06.09.50 7,4 e-4 1,2 e-3 InhA InhA TERT -BUTYL ALCOHOL
75-65-0 6,4 e+0 6,4 e+0 InhA InhA
Tetrachloroethylene 127-18-4 1,8 e+0 1,4 e+0 2,2 e+2 1,5 e+2 BInhA InhA THALLIUM 7440-28-0 3,2 e+7 7,1 e+6 IupR IupW THIOUREA 62-56-6 1,2 e+0 2,4 e-2 IepR IwW
Thiram 137-26-8 1,3 e+2 3,5 e+0 IepA IwW Tin 7440-31-5 1,0 e+2 6,3 e-2 IupR IupW
Tolclophos-methyl 57018-04-9 5,7 e+1 4,9 e+1 IepA IfW

158
Toluene 108-88-3 1,0 e+0 1,3 e+0 BInhA InhW Toxaphene 8001-35-2 4,5 e+1 5,8 e+1 4,2 e+3 5,5 e+3 BInhA InhA trans-1,2-Dichloroethylene
156-60-5 1,4 e+0 5,9 e+0 InhA InhA
trans-1,3-dichloropropene
10061-02-6 2,6 e-1 5,5 e-1 1,0 e+1 1,2 e+2 InhA InhW
TRIALLATE 2303-17-5 2,5 e+1 7,0 e+1 6,6 e+2 1,8 e+3 IfW IfW Triazophos 24017-47-8 9,3 e+2 7,8 e+2 IepA* IfW TRICHLORFON 52-68-6 4,2 e+2 1,7 e+1 IepR * IwW
Trichloroethylene 79-01-6 5,9 e-2 1,9 e-1 9,8 e-1 2,6 e+1 BInhA InhA TRIETHYLAMINE 121-44-8 4,5 e+0 2,3 e+0 InhA InhW
TRIFLURALIN 1582-09-8 1,9 e-1 4,1 e-2 9,2 e+1 2,0 e+1 IepA IfW TRIPHENYLTIN CHLORIDE
639-58-7 2,8 e+3 1,5 e+3 IepA IfW
VANADIUM (FUME OR DUST)
7440-62-2 3,0 e+3 1,9 e+3 IepA* IfW
VINYL ACETATE 108-05-4 1,9 e+0 1,3 e+0 InhA InhW
VINYL BROMIDE 593-60-2 1,3 e-1 7,6 e-1 1,7 e+1 9,8 e+1 InhA InhW Vinyl chloride 75-01-4 1,5 e+0 4,9 e+0 1,1 e+2 9,7 e+3 InhA InhW
Xylenes (total) 1330-20-7 2,3 e-1 5,5 e-1 BInhA InhW ZINC 7440-66-6 5,0 e+2 3,6 e+1 IepA* IfW
ZINC COMPOUNDS ZFS000 5,0 e+2 3,6 e+1 IepA* IfW ZINEB 12122-67-7 1,7 e+1 4,7 e+0 IepR * IwW

Reports published by The Industrial Ecology Programme
Norwegian University of Science and Technology
1/1999 Ingvild V. Malvik, Elin Mathiassen, Terje Semb Bærekraftig mobilitet – en visjon for framtiden?
2/1999Jørund Buen, Karl C. Nes, Vidar Furholt, Karine Ulleberg
Den bærekraftige bilen – finnes den? El-bilen PIVCO CityBee i et industriøkologisk perspektiv
3/1999 Hilde Nøsen OpokuA Grand Objective lost in the Waste Bin? Local Agenda 21 and solid waste reduction in the Norwegian municipality of Trondheim.
4/1999 Martina M. Keitsch, John Hermansen, Audun Øfsti
Sustainable Urban Watermanagement based on the Concept of Industrial Ecology
5/1999 Helge Brattebø, Stig Larssæther, Kjetil Røine
En sammenstilling av kunnskapsstatus (state-of-the-art) innen feltet industriell økologi
1/2000 Helge Brattebø, Ole Jørgen Hanssen (ed.)
“Productivity 2005” – Research Plan P-2005 Industrial Ecology
2/2000 Jørund Buen Industriell økologi – Nytter det bare i Nord? Om industriøkologisk kapasitet
3/2000 Kjetil Røine Does Industrial Ecology provide any new Perspectives?
4/2000 Lars Brede Johansen Eco-efficiency gjennom systemisk miljøstyring
5/2000 Galina Gaivoronskaia, Knut Erik Solem
The Debate on the Risk of Genetically Modified Food: The Politics of Science
6/2000 Øivind Hagen, Stig Larssæther
The need for cultural innovation to face the environmental challenge in business
1/2001 Johan Thoresen P-2005:Implementation and Maintenance of Ecopark co-operation
2/2001 Annik Magerholm Fet, Lars Brede Johansen
Miljøprestasjonsindikatorer og miljøregnskaper ved møbelproduksjon
3/2001
K. Røine, S. Støren, J.T. Solstad, F. Syversen, M. Hagen, S. Steinmo, M.Hermundsgård, M. Westberg, J. Svanqvist
Fra åpne til lukkede material- og produktstrømmer – betraktninger rundt sløyfebegrepet
4/2001 Ottar Michelsen, Ingvild Vaggen Malvik
Perspektiver ved en bærekraftig utvikling i Jämtland og Trøndelag

Program for industriell økologi (IndEcol) er et tverrfaglig universitetsprogram etablert i 1998 for en periode på minst ti år ved Norges teknisk-naturvitenskapelige universitet (NTNU). Pro-grammet omfatter et studieprogram opprettet i 1999 og et stort antall doktorgradsprosjekter og forskningsprosjekter rettet mot vareproduser-ende industri, energi- og byggesektoren. Tverr-faglig forskning og undervisning står sentralt ved IndEcol, og målet er å knytte sammen tek-nologiske, naturvitenskapelige og samfunns-vitenskapelige bidrag i letingen etter bærekraft-ige løsninger på produksjon og forbruk av energi og ressurser.
The Industrial Ecology Programme (IndEcol) is a multidisciplinary university programme es-tablished at the Norwegian University of Science and Technology (NTNU) in 1998 for a period of minimum ten years. It includes a comprehensive educational curriculum launched in 1999 and a signifi cant number of doctoral students as well as research projects geared towards Norwegian manufacturing, energy and building industries. The activities at IndEcol have a strong attention to interdisciplinary research and teaching, bridg-ing technology, natural and social sciences in the search for sustainable solutions for production and consumption of energy and resources.
NTNU-IndEcolIndustrial Ecology ProgrammeNO-7491 Trondheim
Tel.: + 47 73 59 89 40Fax: + 47 73 59 89 43E-mail: [email protected]: www.indecol.ntnu.no ISSN 1501-6153ISBN 82-7948-027-7