eco efficiency manual
TRANSCRIPT
7/30/2019 Eco Efficiency Manual
http://slidepdf.com/reader/full/eco-efficiency-manual 1/153
Eco-efficiencyfor the
Dairy Processing Industry
7/30/2019 Eco Efficiency Manual
http://slidepdf.com/reader/full/eco-efficiency-manual 2/153
Prepared by:
The UNEP Working Group for Cleaner Production in the Food Industry
Environmental Management Centre, The University of Queensland, St LuciaPenny Prasad, Robert Pagan, Michael Kauter and Nicole Price
Telephone: + 61 7 3365 1432
E-mail: [email protected]
Sustainable Business
Level 9, 121 Walker Street, North Sydney
Patrick Crittenden
Telephone: + 61 2 4268 0839
E-mail: [email protected]
This manual was produced as part of the Dairy Processing Eco-efficiency
Project (DAV447) and was funded by Dairy Australia.
DAIRY AUSTRALIA
Level 5, IBM Tower
60 City Road
Southbank Victoria 3006
Australia
Telephone: + 61 3 9694 3777
Fax: + 61 3 9694 3733
www.dairyaustralia.com.au
AUGUST 2004
ISBN 0 9581814 6 2

7/30/2019 Eco Efficiency Manual
http://slidepdf.com/reader/full/eco-efficiency-manual 3/153
ii ECO-EFFICIENCY FOR THE DAIRY PROCESSING INDUSTRY
Acknowledgements
Dairy Australia and the UNEP Working Group for Cleaner Production are grateful to
the following individuals for their participation in this project and the development
of the manual.
Steering CommitteeRoss Nicol Dairy Australia
Susan Blacklow National Foods Limited
Janis Cecins Dairy Farmers
Patrick Crittendon Sustainable Business
Richard Tomsett Bonlac Foods Limited
Neil Van Buuren Murray Goulburn Co-operative Company Limited
Mike Weeks Dairy Processing Engineering Centre
Karin Harding Tatura Milk Industries Limited
Peter Gross Bonlac Foods Limited
Adrian Poon Bonlac Foods Limited
Anthony Best Warrnambool Cheese and Butter Factory Company Limited
Margaret Berbers Parmalat Australia Limited
Mike Jones Queensland Department of Primary Industries and Fisheries
Bob Pagan UNEP Working Group for Cleaner Production in the Food
Industry
Penny Prasad UNEP Working Group for Cleaner Production in the Food
Industry
Disclaimer: While every attempt has been made to ensure that the information in this publication
is correct at the time of printing, errors can occur. The information is provided as general
information only. Specific issues relevant to your workplace should be considered in light of this
and on an individual basis. The information provided in this publication should not be construed
as legal advice. You should consult with professional advisers familiar with your particular factual
situation for advice concerning specific environmental requirements.
Cover images: Dairy Australia, Dairy Processing Engineering Centre and UNEP Working Group for
Cleaner Production.
n e a o ust ne oung)
7/30/2019 Eco Efficiency Manual
http://slidepdf.com/reader/full/eco-efficiency-manual 4/153
7/30/2019 Eco Efficiency Manual
http://slidepdf.com/reader/full/eco-efficiency-manual 5/153
iv ECO-EFFICIENCY FOR THE DAIRY PROCESSING INDUSTRY
3.2.2 Efficient process control 24
3.2.3 Leaks 25
3.3 Reducing demand for water: cleaning 26
3.3.1 Design and selection of processing equipment and process layout 26
3.3.2 Dry cleaning 26
3.3.3 Trigger-operated controls for hoses 26
3.3.4 High-pressure cleaning systems 27
3.3.5 Clean-in-place systems 27
3.3.6 Scheduling or modifying product changeovers 30
3.3.7 Crate washers 30
3.4 Reducing demand for water: utilities 31
3.4.1 Blowdown in cooling towers and boilers 31
3.4.2 Cooling tower operation 31
3.4.3 Equipment sealing water 32
3.5 Ancillary water use 32
3.6 Stormwater 33
3.7 Water recycling and reuse 34
3.7.1 Condensate recovery 34
3.7.2 Use of membranes for water recovery 38
3.8 Wastewater 39
3.8.1 Treatment of wastewater 39
3.8.2 Selection of a wastewater treatment system 40
3.8.3 Reuse of treated wastewater for irrigation 41
4 Energy4.1 Overview of energy use 43
4.1.1 The cost of energy 45
4.2 Energy management 46
4.3 Reducing the demand for steam and hot water 47
4.3.1 Evaporation 47
4.3.2 Membrane concentration 49
4.3.3 Spray drying 49
4.3.4 Boiler operation 51
4.3.5 Steam delivery 54
4.3.6 High-efficiency boilers 56
4.4 Reducing the demand for electricity 57
4.4.1 Refrigeration systems 57
4.4.2 Compressed air systems 61
4.4.3 Homogenisers 64
7/30/2019 Eco Efficiency Manual
http://slidepdf.com/reader/full/eco-efficiency-manual 6/153
CONTENTS v
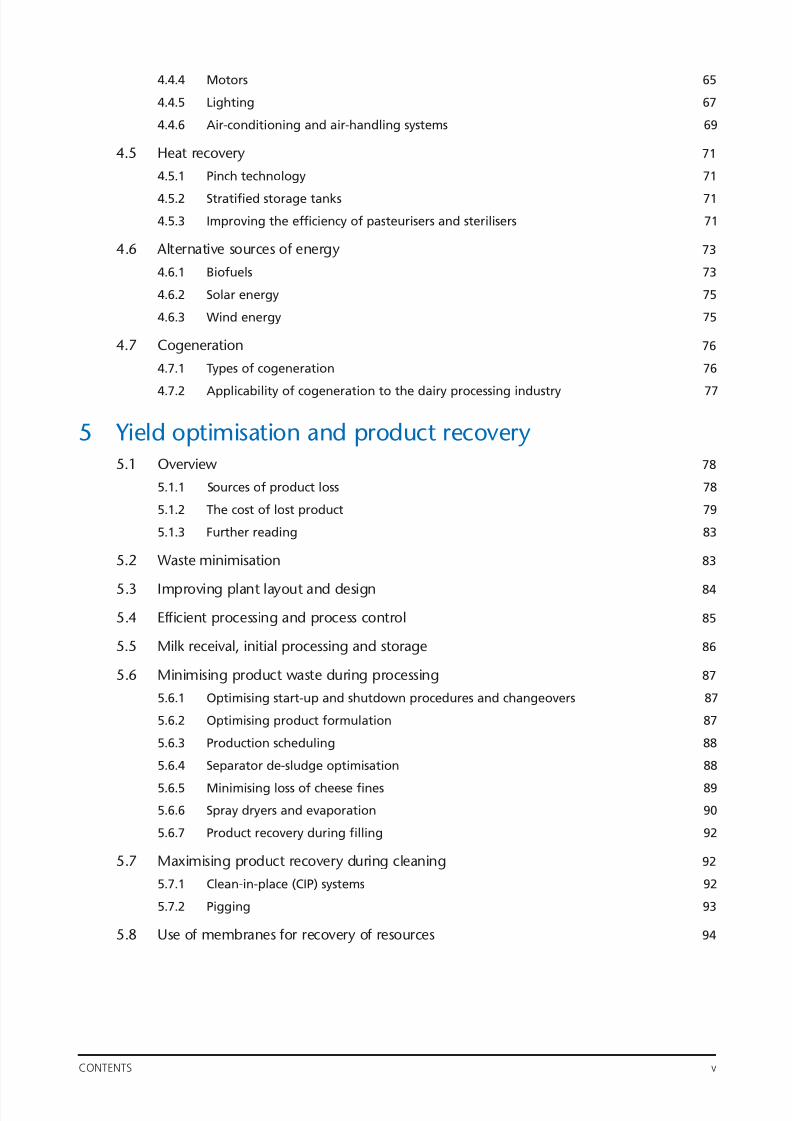
4.4.4 Motors 65
4.4.5 Lighting 67
4.4.6 Air-conditioning and air-handling systems 69
4.5 Heat recovery 71
4.5.1 Pinch technology 71
4.5.2 Stratified storage tanks 71
4.5.3 Improving the efficiency of pasteurisers and sterilisers 71
4.6 Alternative sources of energy 73
4.6.1 Biofuels 73
4.6.2 Solar energy 75
4.6.3 Wind energy 75
4.7 Cogeneration 76
4.7.1 Types of cogeneration 76
4.7.2 Applicability of cogeneration to the dairy processing industry 77
5 Yield optimisation and product recovery5.1 Overview 78
5.1.1 Sources of product loss 78
5.1.2 The cost of lost product 79
5.1.3 Further reading 83
5.2 Waste minimisation 83
5.3 Improving plant layout and design 84
5.4 Efficient processing and process control 85
5.5 Milk receival, initial processing and storage 86
5.6 Minimising product waste during processing 87
5.6.1 Optimising start-up and shutdown procedures and changeovers 87
5.6.2 Optimising product formulation 87
5.6.3 Production scheduling 88
5.6.4 Separator de-sludge optimisation 88
5.6.5 Minimising loss of cheese fines 89
5.6.6 Spray dryers and evaporation 90
5.6.7 Product recovery during filling 92
5.7 Maximising product recovery during cleaning 92
5.7.1 Clean-in-place (CIP) systems 92
5.7.2 Pigging 93
5.8 Use of membranes for recovery of resources 94
7/30/2019 Eco Efficiency Manual
http://slidepdf.com/reader/full/eco-efficiency-manual 7/153
vi ECO-EFFICIENCY FOR THE DAIRY PROCESSING INDUSTRY
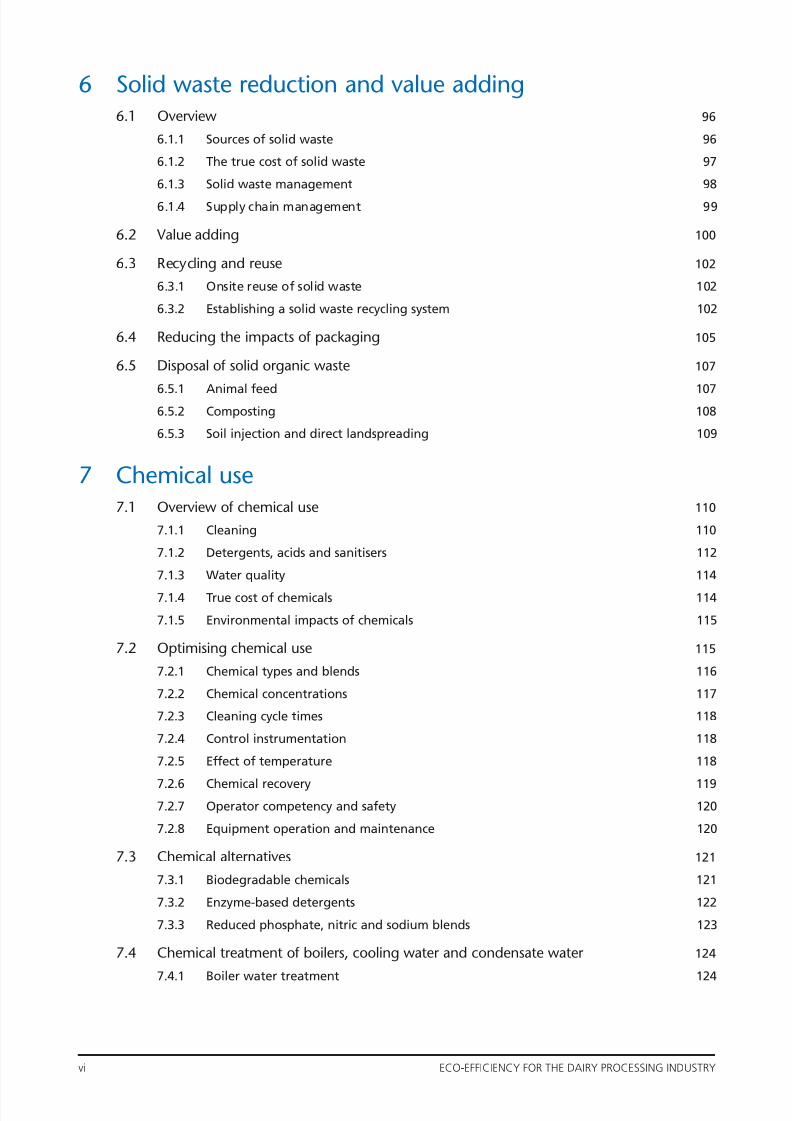
6 Solid waste reduction and value adding6.1 Overview 96
6.1.1 Sources of solid waste 96
6.1.2 The true cost of solid waste 97
6.1.3 Solid waste management 98
6.1.4 Supply chain management 99
6.2 Value adding 100
6.3 Recycling and reuse 102
6.3.1 Onsite reuse of solid waste 102
6.3.2 Establishing a solid waste recycling system 102
6.4 Reducing the impacts of packaging 105
6.5 Disposal of solid organic waste 107
6.5.1 Animal feed 1076.5.2 Composting 108
6.5.3 Soil injection and direct landspreading 109
7 Chemical use7.1 Overview of chemical use 110
7.1.1 Cleaning 110
7.1.2 Detergents, acids and sanitisers 112
7.1.3 Water quality 114
7.1.4 True cost of chemicals 114
7.1.5 Environmental impacts of chemicals 115
7.2 Optimising chemical use 115
7.2.1 Chemical types and blends 116
7.2.2 Chemical concentrations 117
7.2.3 Cleaning cycle times 118
7.2.4 Control instrumentation 118
7.2.5 Effect of temperature 118
7.2.6 Chemical recovery 1197.2.7 Operator competency and safety 120
7.2.8 Equipment operation and maintenance 120
7.3 Chemical alternatives 121
7.3.1 Biodegradable chemicals 121
7.3.2 Enzyme-based detergents 122
7.3.3 Reduced phosphate, nitric and sodium blends 123
7.4 Chemical treatment of boilers, cooling water and condensate water 124
7.4.1 Boiler water treatment 124
7/30/2019 Eco Efficiency Manual
http://slidepdf.com/reader/full/eco-efficiency-manual 8/153
CONTENTS vii
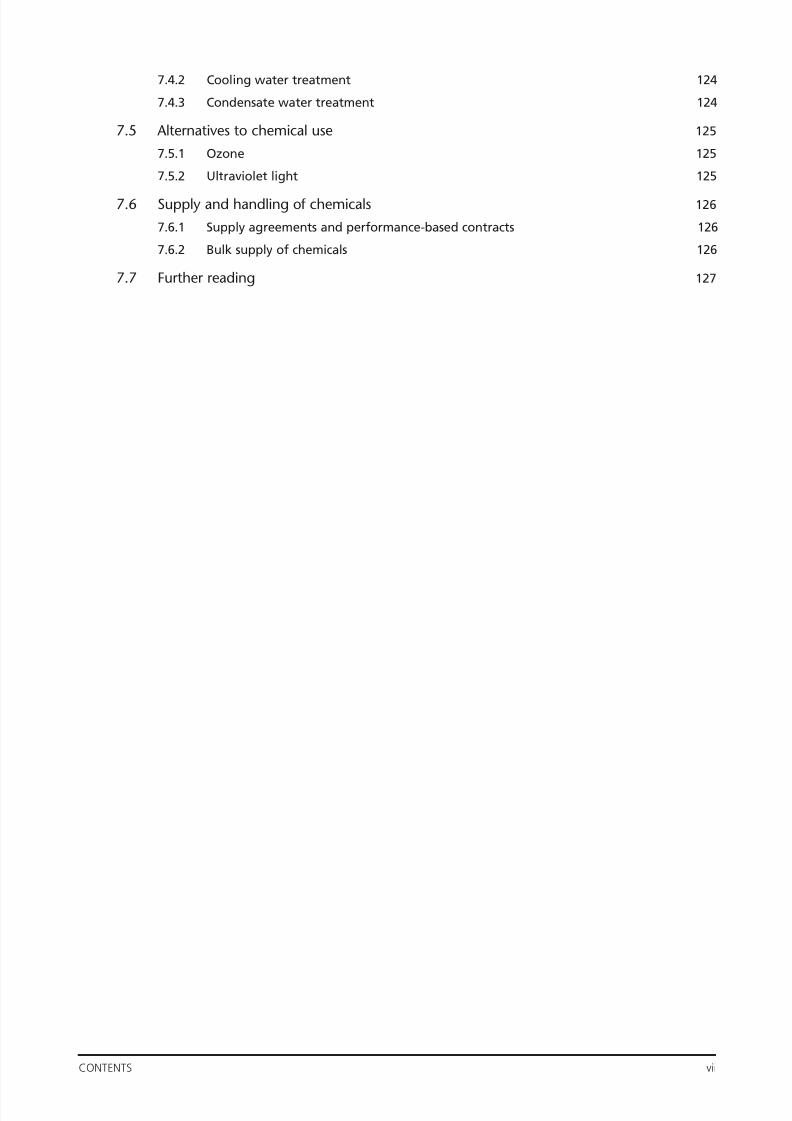
7.4.2 Cooling water treatment 124
7.4.3 Condensate water treatment 124
7.5 Alternatives to chemical use 125
7.5.1 Ozone 125
7.5.2 Ultraviolet light 125
7.6 Supply and handling of chemicals 126
7.6.1 Supply agreements and performance-based contracts 126
7.6.2 Bulk supply of chemicals 126
7.7 Further reading 127
7/30/2019 Eco Efficiency Manual
http://slidepdf.com/reader/full/eco-efficiency-manual 9/153
viii ECO-EFFICIENCY FOR THE DAIRY PROCESSING INDUSTRY
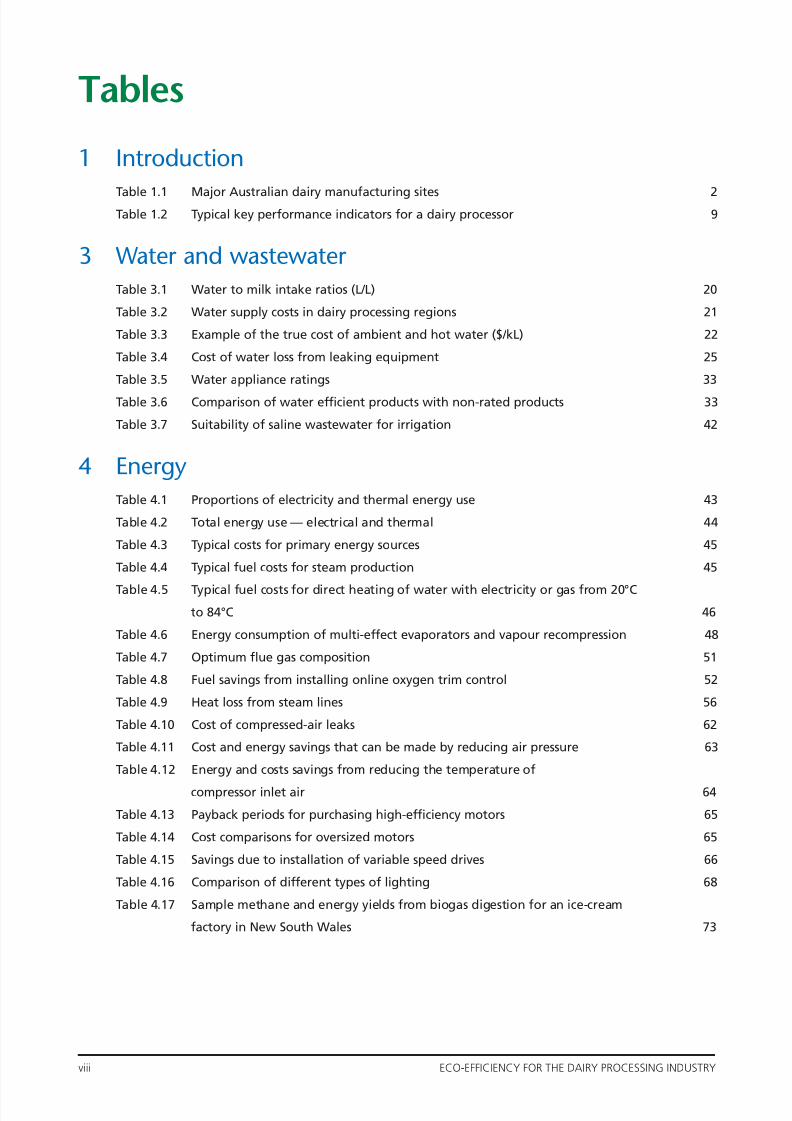
Tables
1 Introduction
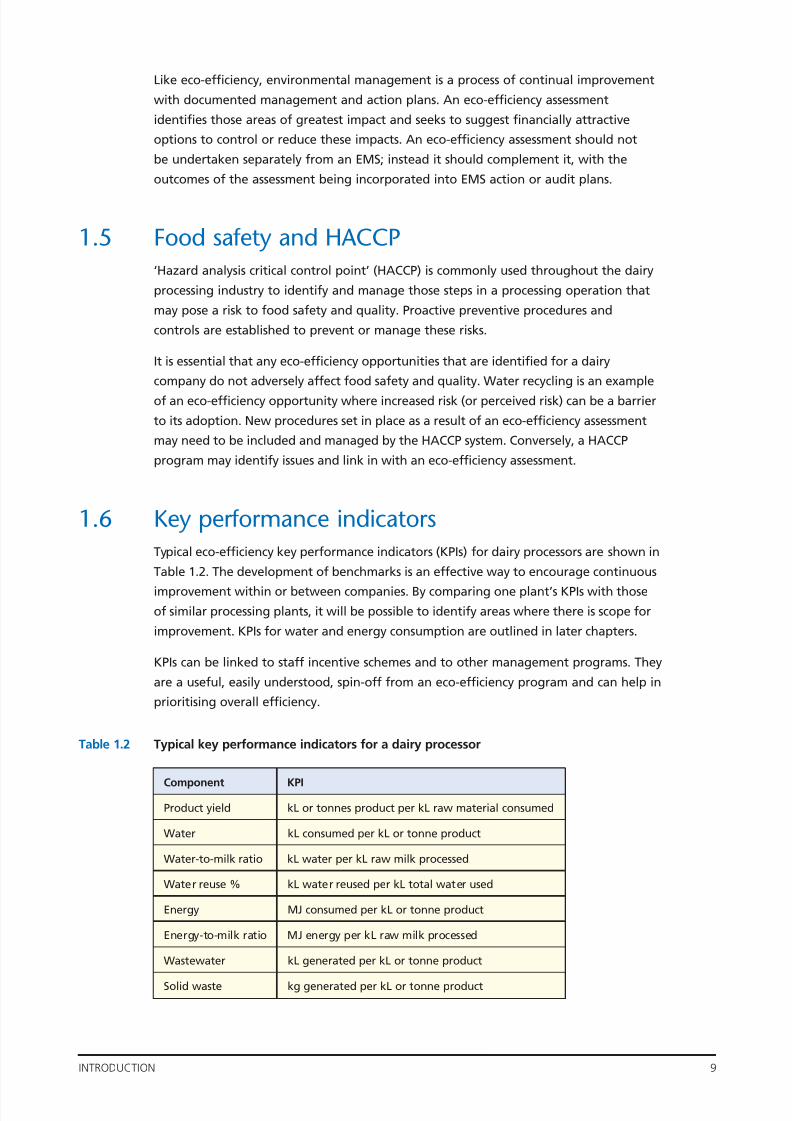
Table 1.1 Major Australian dairy manufacturing sites 2Table 1.2 Typical key performance indicators for a dairy processor 9
3 Water and wastewater
Table 3.1 Water to milk intake ratios (L/L) 20
Table 3.2 Water supply costs in dairy processing regions 21
Table 3.3 Example of the true cost of ambient and hot water ($/kL) 22
Table 3.4 Cost of water loss from leaking equipment 25
Table 3.5 Water appliance ratings 33
Table 3.6 Comparison of water efficient products with non-rated products 33
Table 3.7 Suitability of saline wastewater for irrigation 42
4 Energy
Table 4.1 Proportions of electricity and thermal energy use 43
Table 4.2 Total energy use — electrical and thermal 44
Table 4.3 Typical costs for primary energy sources 45
Table 4.4 Typical fuel costs for steam production 45
Table 4.5 Typical fuel costs for direct heating of water with electricity or gas from 20°C
to 84°C 46
Table 4.6 Energy consumption of multi-effect evaporators and vapour recompression 48
Table 4.7 Optimum flue gas composition 51
Table 4.8 Fuel savings from installing online oxygen trim control 52
Table 4.9 Heat loss from steam lines 56
Table 4.10 Cost of compressed-air leaks 62
Table 4.11 Cost and energy savings that can be made by reducing air pressure 63
Table 4.12 Energy and costs savings from reducing the temperature of
compressor inlet air 64
Table 4.13 Payback periods for purchasing high-efficiency motors 65
Table 4.14 Cost comparisons for oversized motors 65
Table 4.15 Savings due to installation of variable speed drives 66
Table 4.16 Comparison of different types of lighting 68
Table 4.17 Sample methane and energy yields from biogas digestion for an ice-cream
factory in New South Wales 73
7/30/2019 Eco Efficiency Manual
http://slidepdf.com/reader/full/eco-efficiency-manual 10/153
TABLES ix
5 Yield optimisation and product recovery
Table 5.1 Sources of product loss in dairy processing plants 79
Table 5.2 Indicative wastewater characteristics from dairy processing plants 80
Table 5.3 Effluent to milk ratio (L/L) 81
Table 5.4 Trade waste charges in various regions 82
Table 5.5 Comparison of trade waste charges for Plant A 82
Table 5.6 Membranes used in the dairy industry 94
6 Solid waste reduction and value adding
Table 6.1 Sources of solid waste in dairy processing plants 97
7 Chemical use
Table 7.1 Characteristics of typical soiling found in the dairy industry 111
Table 7.2 Types of chemicals used in the dairy industry 113
Table 7.3 Comparison of inorganic and organic acids 122
7/30/2019 Eco Efficiency Manual
http://slidepdf.com/reader/full/eco-efficiency-manual 11/153
x ECO-EFFICIENCY FOR THE DAIRY PROCESSING INDUSTRY
Figures
Figure 1.1 Milk production by state 2002–03 2
Figure 1.2 Utilisation of manufacturing milk 2002–03 2
Figure 1.3 Waste minimisation hierarchy 5
Figure 1.4 Method of undertaking an eco-efficiency assessment 8
Figure 3.1 Breakdown of water use of a market milk processor 20
Figure 4.1 Energy cost breakdown by area — milk plant 44
Figure 4.2 Energy cost breakdown by area — powder, cheese and whey plant 44
Figure 4.3 Single effect falling film evaporator schematic 48
Figure 6.1 Waste minimisation hierarchy 99
7/30/2019 Eco Efficiency Manual
http://slidepdf.com/reader/full/eco-efficiency-manual 12/153
INTRODUCTION 1
1 Introduction
This manual has been developed to help the Australian dairy processing industry
increase its competitiveness through increased awareness and uptake of eco-efficiency.
The manual seeks to consolidate and build on existing knowledge, accumulatedthrough projects and initiatives that the industry has previously undertaken to improve
its use of raw materials and resources and reduce the generation of wastes. Where
there is an existing comprehensive report or publication, the manual refers to this for
further information.
Eco-efficiency is about improving environmental performance to become more efficient
and profitable. It is about producing more with less. It involves applying strategies that
will not only ensure efficient use of resources and reduction in waste, but will also
reduce costs.
This chapter outlines the environmental challenges faced by Australian dairy processors.The manual explores opportunities for reducing environmental impacts in relation to
water, energy, product yield, solid and liquid waste reduction and chemical use.
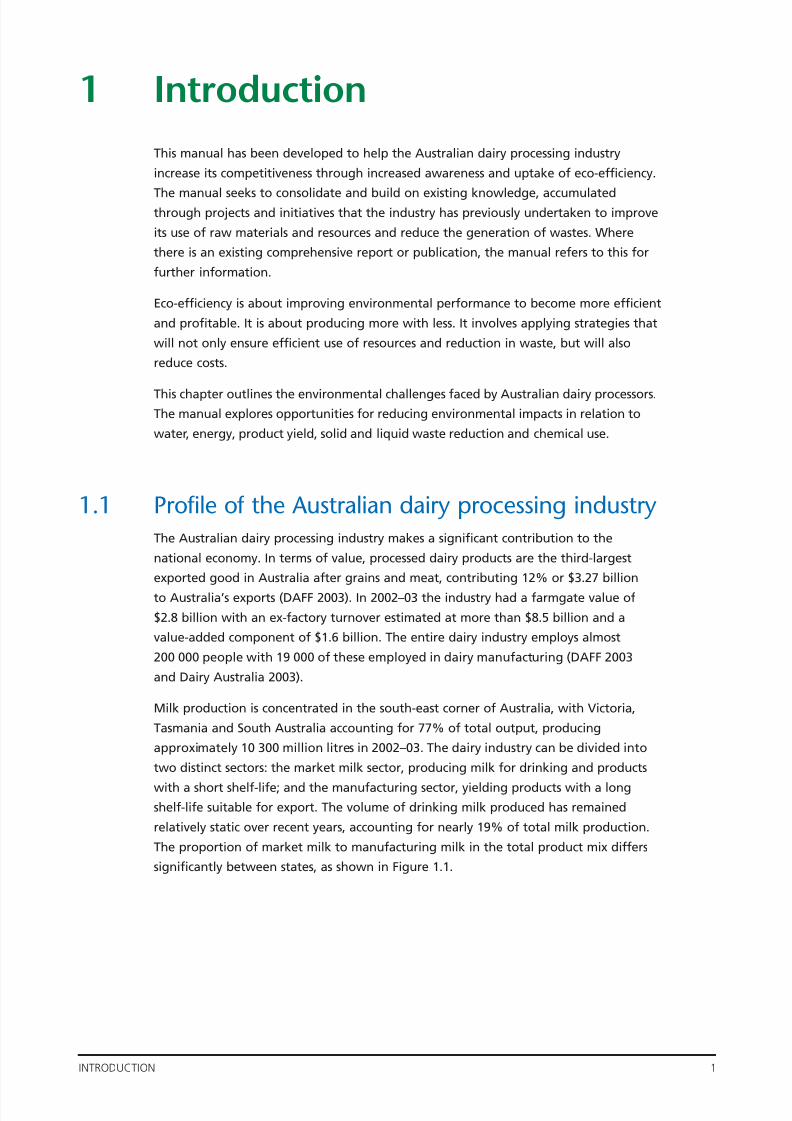
1.1 Profile of the Australian dairy processing industryThe Australian dairy processing industry makes a significant contribution to the
national economy. In terms of value, processed dairy products are the third-largest
exported good in Australia after grains and meat, contributing 12% or $3.27 billion
to Australia’s exports (DAFF 2003). In 2002–03 the industry had a farmgate value of
$2.8 billion with an ex-factory turnover estimated at more than $8.5 billion and a
value-added component of $1.6 billion. The entire dairy industry employs almost
200 000 people with 19 000 of these employed in dairy manufacturing (DAFF 2003
and Dairy Australia 2003).
Milk production is concentrated in the south-east corner of Australia, with Victoria,
Tasmania and South Australia accounting for 77% of total output, producing
approximately 10 300 million litres in 2002–03. The dairy industry can be divided into
two distinct sectors: the market milk sector, producing milk for drinking and products
with a short shelf-life; and the manufacturing sector, yielding products with a longshelf-life suitable for export. The volume of drinking milk produced has remained
relatively static over recent years, accounting for nearly 19% of total milk production.
The proportion of market milk to manufacturing milk in the total product mix differs
significantly between states, as shown in Figure 1.1.
7/30/2019 Eco Efficiency Manual
http://slidepdf.com/reader/full/eco-efficiency-manual 13/153
2 ECO-EFFICIENCY FOR THE DAIRY PROCESSING INDUSTRY
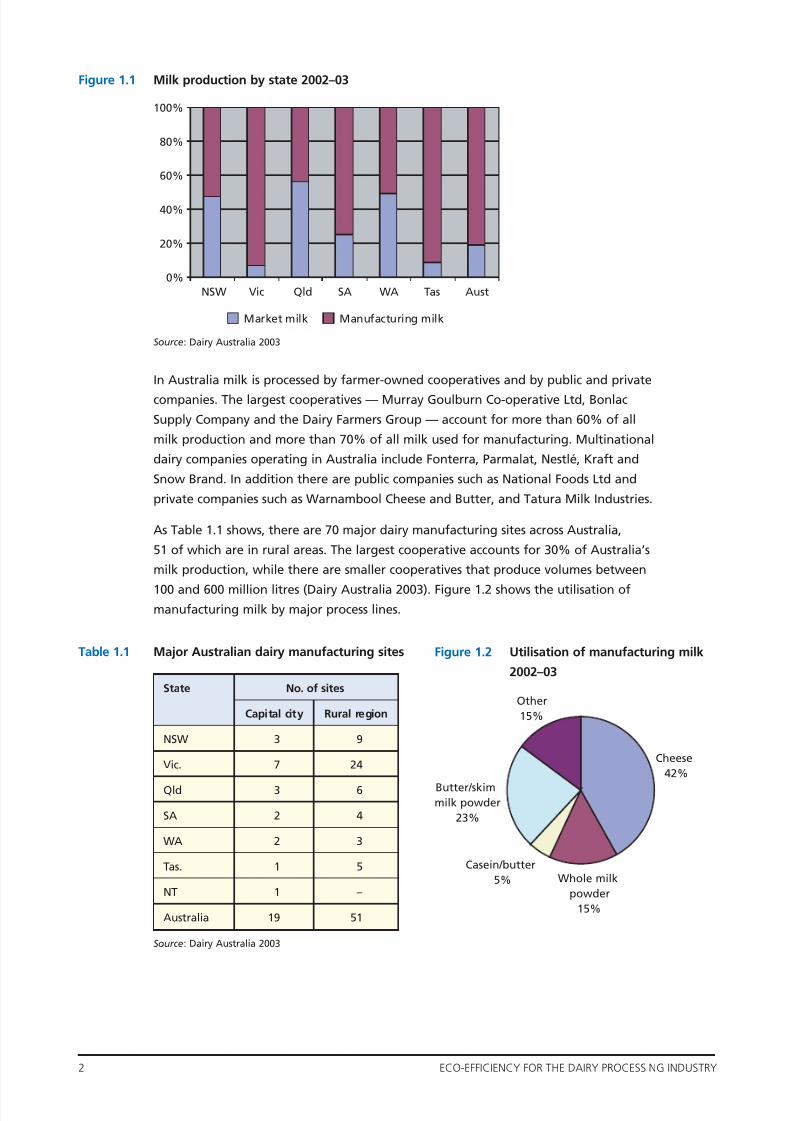
Figure 1.1 Milk production by state 2002–03
Source: Dairy Australia 2003
In Australia milk is processed by farmer-owned cooperatives and by public and private
companies. The largest cooperatives — Murray Goulburn Co-operative Ltd, Bonlac
Supply Company and the Dairy Farmers Group — account for more than 60% of all
milk production and more than 70% of all milk used for manufacturing. Multinational
dairy companies operating in Australia include Fonterra, Parmalat, Nestlé, Kraft and
Snow Brand. In addition there are public companies such as National Foods Ltd and
private companies such as Warnambool Cheese and Butter, and Tatura Milk Industries.
As Table 1.1 shows, there are 70 major dairy manufacturing sites across Australia,
51 of which are in rural areas. The largest cooperative accounts for 30% of Australia’s
milk production, while there are smaller cooperatives that produce volumes between
100 and 600 million litres (Dairy Australia 2003). Figure 1.2 shows the utilisation ofmanufacturing milk by major process lines.
Table 1.1 Major Australian dairy manufacturing sites
Source: Dairy Australia 2003
0%
20%
40%
60%
80%
100%
NSW Vic Qld SA WA Tas Aust
Market milk Manufacturing milk
State No. of sites
Capital city Rural region
NSW 3 9
Vic. 7 24
Qld 3 6
SA 2 4
WA 2 3
Tas. 1 5
NT 1 –
Australia 19 51
Cheese
42%
Whole milk
powder
15%
Casein/butter
5%
Butter/skimmilk powder
23%
Other
15%
Figure 1.2 Utilisation of manufacturing milk
2002–03
7/30/2019 Eco Efficiency Manual
http://slidepdf.com/reader/full/eco-efficiency-manual 14/153
INTRODUCTION 3
1.2 Environmental challenges
1.2.1 Compliance and legislation
Environmental legislation that regulates Australian dairy processing plants is
implemented by authorities such as state environmental protection agencies (EPAs) and
local councils. Dairy processors are generally required to have licences for emissions to
air and surface waters and the disposal to land of some solid and liquid wastes such as
sludge and treated wastewater. Disposal of wastewater to the sewerage system is
regulated by local councils or local water authorities.
1.2.2 Water supply and pricing
Over the entire life cycle of dairy manufacture, including milk production on farm,
transportation and dairy processing, 99% of the total water consumption can be
attributed to the farm (Lunde et al. 2003). For the industry as a whole, therefore,
efforts to make major gains in reducing the environmental impacts of water
consumption should be focused on the farm. Nevertheless, there are gains to be made
by dairy processors in minimising water consumption within factories. Depending on
the product mix, dairy processing plants can use substantial volumes of water for
equipment cleaning, cooling towers, boilers and other processes. Water supply to dairy
processing plants varies according to location, but may be from town water, bores,
rivers, dams or irrigation channels. Some factories are required to install large storage
reserves to cater for periods of non-supply; for example Bonlac’s Stanhope factory must
store its entire winter supply to allow maintenance of water channels by the local
water board. As increasing pressure is placed on limited water reserves, government
bodies and water authorities are actively seeking to promote greater water efficiency
and are encouraging water conservation strategies and incentives. For example,
Brisbane Water recently introduced a scheme for providing water rebates to large users
of water that have developed and implemented water management plans (Cameron
Jackson 2004, pers. comm.) and Sydney Water is encouraging large users of water to
reduce water consumption through involvement in the ‘Every Drop Counts’ business
partnership program (Sydney Water 2004).
Water supply costs for Australian processors are vary according to the region, ranging
between 20c/kL for a North Queensland processor and $1.28/kL for a processor in
South-East Queensland. Water supply costs are discussed further in Chapter 3. Manywater authorities are now progressively introducing a user-pays charging system to
recover the full cost of supplying water to the consumer, in order to encourage water
conservation and to cut costs.
1.2.3 Wastewater discharge costs
Wastewater discharge costs vary according to the region, and according to whether
the waste is being discharged to land, surface waters or the sewerage system. Plants
discharging treated wastewater to municipal sewerage systems face the highest costs.
Most water authorities charge on the basis of the organic loads (BOD/COD) and includea separate volumetric charge. However, there are exceptions to this, such as plants
7/30/2019 Eco Efficiency Manual
http://slidepdf.com/reader/full/eco-efficiency-manual 15/153
4 ECO-EFFICIENCY FOR THE DAIRY PROCESSING INDUSTRY
discharging to Sydney Water’s direct ocean outfalls, where the charging structure is
based only on the mass load (in kg) of waste components. Some utility operators have
introduced additional charges for nitrogen, phosphorus and sodium loads and these
charges are increasing. For example, Ipswich Water in Queensland currently charges
80c/kg for nitrogen and $3/kg for phosphorus. These charges are expected to increase
to more than $2/kg and $9/kg over the next few years (Mark Sherson 2004, pers.
comm.). Many utility operators also charge for oil and grease content and suspended
solids. The charge structure is affected by the processes used by the treatment plants,
and by the costs incurred in handling different components of the wastewater.
Charging structures can also be used to ‘send a message’ to customers and encourage
measures such as waste minimisation to reduce loads.
Factories that dispose of effluent directly to land generally do not pay disposal charges,
but must meet licence conditions for the quality of effluent with respect to
components such as mineral content, salt level, BOD or COD, phosphorus, nitrogen,
and oil and grease.
Full cost recovery charging has not so far been applied to sewer discharges, but this
situation is changing. Many local authorities and water boards, especially those in
metropolitan areas, are in the process of formulating charging systems that will
progressively increase wastewater discharge fees on a user-pays basis until something
approaching full cost recovery is achieved.
1.2.4 Energy and energy supply costs
As with most Australian industries, dairy companies rely on fossil fuels — particularly
coal-generated electricity, coal and natural gas — for their energy supply. National
greenhouse abatement initiatives such as the Greenhouse Challenge and the Australian
Renewable Energy Certificate scheme have been launched in recent years to increase
awareness of environmental issues and encourage the more efficient and sustainable
use of energy. As yet, only a small number of dairy companies have joined these
schemes. Nevertheless, Australian dairy processors appear to be relatively energy-
efficient compared with dairy processing companies internationally. A recent survey of
Australian dairy processors has shown that energy consumption per unit of production
is comparable to, if not better than, energy consumption in European dairies (see
Chapter 4, ‘Energy’). The dairy manufacturing industry has radically improved its
energy efficiency over the last 20 years (in some cases by as much as 50%) through
industry-wide upgrading of equipment and the closing of smaller, less efficient
factories (Lunde et al. 2003). The industry could further explore the use of renewable
energy, and an obvious means is through the use of biogas (from anaerobic digesters)
to supplement energy supplies. Cogeneration systems have been investigated but to
date have been found not to be financially viable.
The national energy supply market (electricity and gas) has been progressively
deregulated over the last decade. Deregulation in the electricity industry began in
Victoria in 1994 and has spread to most states, giving dairy companies a choice of retail
companies for their supply of electricity. The low cost of energy and the lack of
mechanisms to control demand in Australia are seen as among the main factors
7/30/2019 Eco Efficiency Manual
http://slidepdf.com/reader/full/eco-efficiency-manual 16/153
INTRODUCTION 5
inhibiting the adoption of more energy-efficiency practices (UNEP 2002). Energy is
typically the greatest of all utility costs, despite the low unit cost, so significant savings
are possible; it therefore makes economic sense for dairy processors to minimise energy
consumption. A medium to large dairy processing site could typically spend $2–3 million
on energy costs per year, so a possible 10% reduction in energy costs can be a significant
incentive to reduce energy use.
1.2.5 Solid waste management
Solid wastes generated by dairy processors include:
• packaging waste such as cardboard, cartons, paper and plastic
• organic waste such as sludge and reject product
• building and maintenance wastes
• office waste.
Dairy processing plants in city areas are generally well serviced by waste disposal and
recycling companies, so it is usually more profitable for a company to segregate and
recycle wastes than to dispose of waste to landfill. Processing plants in regional areas
may experience some difficulties until waste services are developed and expanded.
Organic waste is generally disposed of as animal feed, applied to farm land as fertiliser,
composted, or digested to produce biogas.
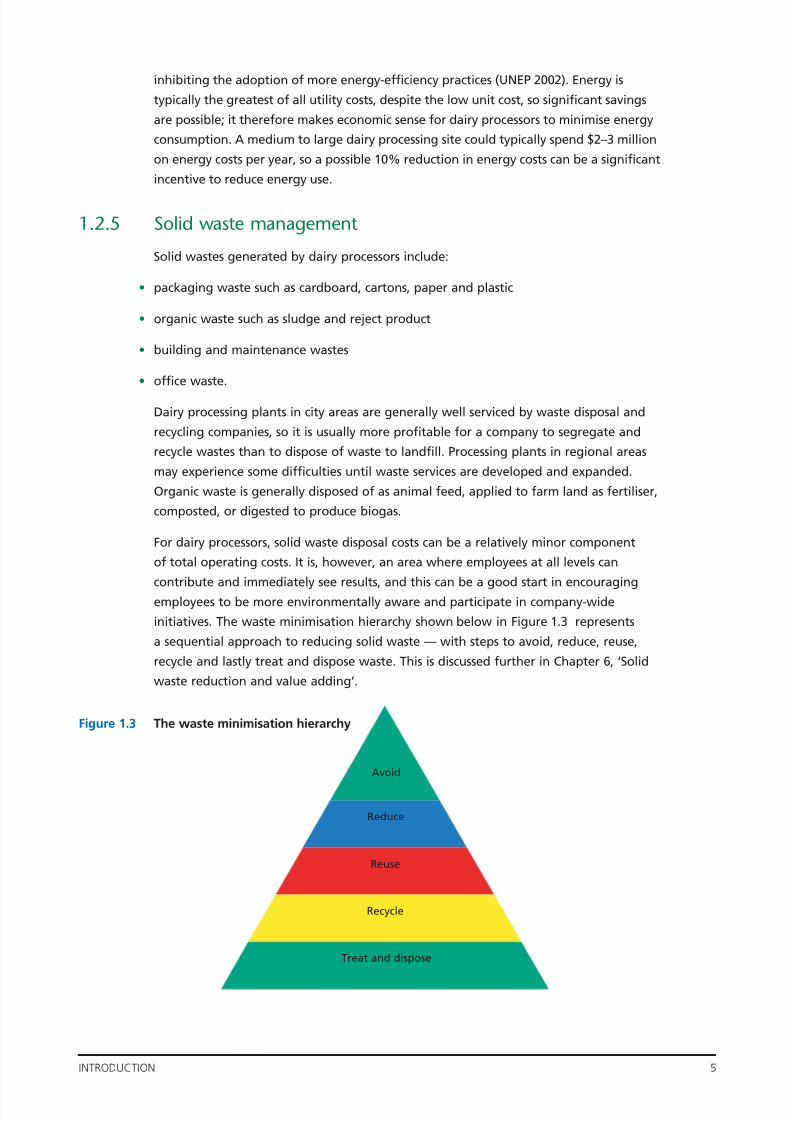
For dairy processors, solid waste disposal costs can be a relatively minor component
of total operating costs. It is, however, an area where employees at all levels can
contribute and immediately see results, and this can be a good start in encouraging
employees to be more environmentally aware and participate in company-wide
initiatives. The waste minimisation hierarchy shown below in Figure 1.3 represents
a sequential approach to reducing solid waste — with steps to avoid, reduce, reuse,
recycle and lastly treat and dispose waste. This is discussed further in Chapter 6, ‘Solid
waste reduction and value adding’.
Figure 1.3 The waste minimisation hierarchy
Avoid
Reuse
Recycle
Treat and dispose
Reduce

7/30/2019 Eco Efficiency Manual
http://slidepdf.com/reader/full/eco-efficiency-manual 17/153
6 ECO-EFFICIENCY FOR THE DAIRY PROCESSING INDUSTRY
1.2.6 Packaging
Dairy processors face increasing pressure to develop and use packaging that reduces
the consumption of resources, enables reuse or recycling, and minimises landfill
disposal. The importance placed on packaging may reflect the strong increase in
awareness resulting from the National Packaging Covenant (NPC), launched in 1999.
The NPC encourages voluntary actions by signatory companies to reduce packagingwaste, and is underpinned by regulation in all states to include non-signatories. In
some cases packaging initiatives are driven by the requirements of export customers.
Most dairy processing companies are signatories to the NPC.
Eco-efficiency opportunities for reducing packaging waste are included in Chapter 6.
1.3 What is eco-efficiency?
Eco-efficiency is a ‘win–win’ business strategy that helps companies save money andreduce their environmental impact. Eco-efficiency means increasing process efficiencies
and reducing environmental impact, for example by reducing the use of goods and
services, enhancing recyclability, and maximising the use of renewable resources. The
World Business Council for Sustainable Development has identified a range of ways
companies can improve their eco-efficiency (WBCSD 2000). Companies can:
• reduce material intensity of goods and services
• reduce energy intensity of goods and services
• reduce toxic emissions
• enhance material recyclability
• maximise use of renewable resources
• extend product durability
• increase efficiency in the use of goods and services.
Eco-efficiency is often pursued through approaches and ‘tools’ such as cleaner
production, environmental management systems, life-cycle assessment and design
for the environment. These tools help companies identify opportunities to improve
resource efficiency and reduce environmental impacts.
Eco-efficiency involves systematically evaluating existing practices to identify
opportunities for improvement. The ultimate goal is to avoid the use of a resource or
eliminate the production of a waste altogether. Failing this, smarter solutions to
existing practices are investigated, which aim to reduce, reuse, recover or recycle
7/30/2019 Eco Efficiency Manual
http://slidepdf.com/reader/full/eco-efficiency-manual 18/153
7/30/2019 Eco Efficiency Manual
http://slidepdf.com/reader/full/eco-efficiency-manual 19/153
8 ECO-EFFICIENCY FOR THE DAIRY PROCESSING INDUSTRY
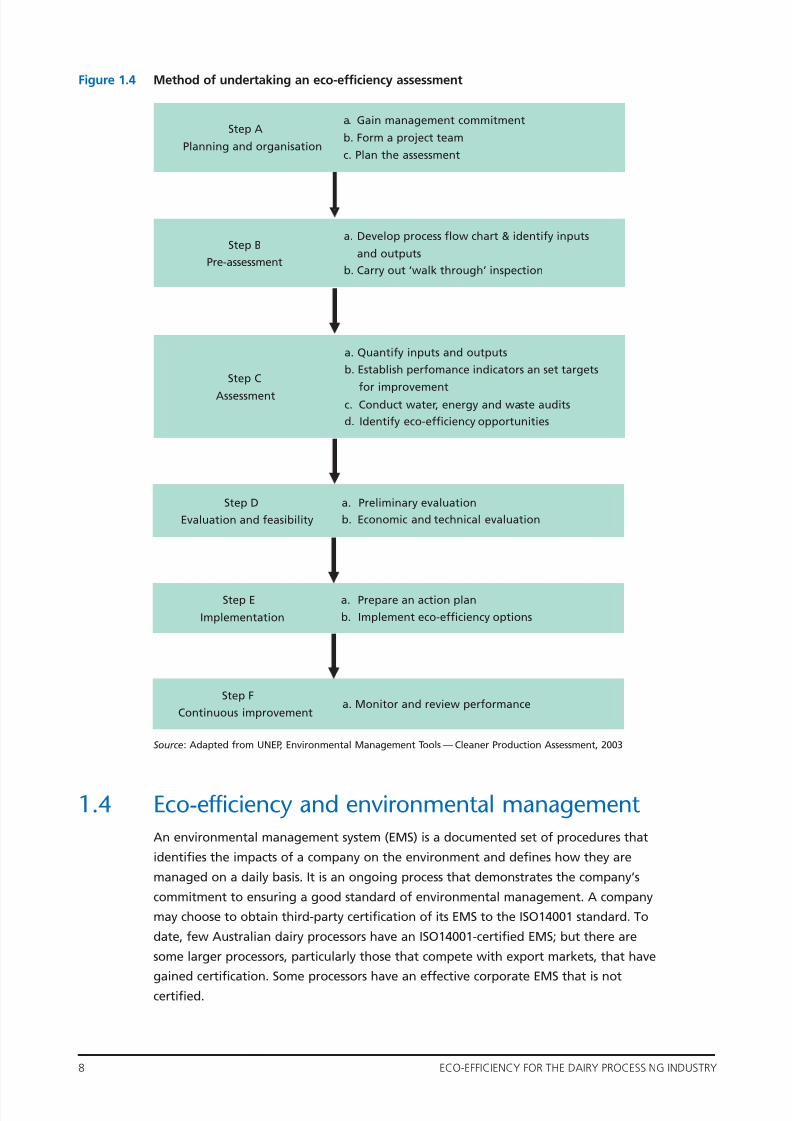
Figure 1.4 Method of undertaking an eco-efficiency assessment
Source: Adapted from UNEP, Environmental Management Tools — Cleaner Production Assessment, 2003
1.4 Eco-efficiency and environmental managementAn environmental management system (EMS) is a documented set of procedures that
identifies the impacts of a company on the environment and defines how they are
managed on a daily basis. It is an ongoing process that demonstrates the company’s
commitment to ensuring a good standard of environmental management. A company
may choose to obtain third-party certification of its EMS to the ISO14001 standard. To
date, few Australian dairy processors have an ISO14001-certified EMS; but there are
some larger processors, particularly those that compete with export markets, that have
gained certification. Some processors have an effective corporate EMS that is notcertified.
Step A
Planning and organisation
a. Gain management commitment
b. Form a project team
c. Plan the assessment
Step B
Pre-assessment
a.
and outputs
b. Carry out ‘walk through’ inspection
Develop process flow chart & identify inputs
Step C
Assessment
a. Quantify inputs and outputs
b. Establish perfomance indicators an set targets
for improvementc. Conduct water, energy and waste audits
d. Identify eco-efficiency opportunities
Step D
Evaluation and feasibility
a. Preliminary evaluation
b. Economic and technical evaluation
Step E
Implementation
a. Prepare an action plan
b. Implement eco-efficiency options
Step F
Continuous improvement
a. Monitor and review performance
7/30/2019 Eco Efficiency Manual
http://slidepdf.com/reader/full/eco-efficiency-manual 20/153
7/30/2019 Eco Efficiency Manual
http://slidepdf.com/reader/full/eco-efficiency-manual 21/153
10 ECO-EFFICIENCY FOR THE DAIRY PROCESSING INDUSTRY
1.7 Achieving best practice in dairy processingSubsequent chapters describe numerous eco-efficiency opportunities that are available
to the dairy processing industry. Many of the opportunities described are not new, and
could be considered as good operating or engineering practice; and they have been
undertaken to some degree by most leading dairy processing companies. Where
possible, benchmark figures have been provided for aspects such as water and energyconsumption and wastewater volumes and quality. While the question of ‘best practice
in dairy processing’ cannot be directly quantified within the scope of this document,
the following points attempt to describe the characteristics of a dairy processing
company and operation that is headed towards best practice. Ideally, the adoption of
best-practice technologies, procedures and initiatives should be considered during the
design and planning stages of a plant. A holistic approach should also be taken in
deciding what is the most appropriate technology or plant design. For example, if a
factory in a regional area has the option to irrigate, it may not be sensible for it to
treat wastewater to potable water standards.
1.7.1 Characteristics of a company that is aiming for best practice
General:
• a multi-use clean-in-place (CIP) system with the use of membranes to recover product,
chemicals and water
• integrated process control software that enables trending of key variables and
generates customised reports for different purposes; able to be accessed by
management from office workstations; and uses programs that interface with
accounting, inventory, maintenance and quality systems
• membrane plants for the recovery of condensate, cleaning chemicals and, in some
circumstances, whey proteins.
Product yield:
• inline monitoring of key contaminant levels — COD, EC, pH, turbidity, protein, fat
• effectively designed pigging systems for key product lines
• CIP-able bag houses for spray dryers.
Water usage:
• a detailed water balance or model that identifies the volume of water used in each
area
• water meters installed at strategic locations through the plant, and a system for
regularly monitoring and reporting water consumption
• inline probes to detect product–water interfaces
7/30/2019 Eco Efficiency Manual
http://slidepdf.com/reader/full/eco-efficiency-manual 22/153
INTRODUCTION 11
• segregation of wastewater streams, with appropriate-quality streams reused rather
than all streams being sent to the waste treatment process or to effluent; diversion
of wastewater streams to different stages of the treatment process as required, using
online monitoring of chemical oxygen demand (COD) or other parameter
• in powder plants, a condensate recovery system for ‘cow water’ that reuses 90–100%
of available condensate
• a knowledge of the typical quantity and quality of wastewater streams at all times
during processing using online and traditional monitoring techniques
• recirculation or reuse of pump sealing water
• zero discharge of wastewater to sewer for dairy processors in regional areas that have
the opportunity to use water for irrigation.
Energy usage:
• a detailed energy balance or model that identifies what quantity of energy is used in
each area
• a system for the regular monitoring and reporting of energy consumption
• in powder plants, mechanical vapour recompression evaporators and multi-stage dryers
• high-efficiency boilers with recuperators and economisers for recovery of heat to pre-heat
flue gas and boiler feed water
• biogas recovery, with biogas used to supplement energy consumption
• cogeneration plants that export excess electricity to the grid
• efficient demand-management systems, including load shedding, to reduce peak
demand
• efficient refrigeration systems that utilise state-of-the-art control systems, variable
speed drive (VSD) compressors, heat recovery and ice bank storage where applicable
• high-efficiency motors of at least 90% efficiency
• efficient lighting systems that take advantage of natural light and automatically switch
off or dim according to lighting needs
• pinch analysis of dairy factories to identify possible areas for improvement in heating
and cooling duties.
Chemicals:
• the use of enzyme-based and chemicals with reduced rates of phosphate and nitrogen
• the holistic use of chemicals with consideration of the impact of wastewater disposal,
particularly in regard to irrigation and salinity issues
• clean-in-place systems incorporating chemical recovery.
7/30/2019 Eco Efficiency Manual
http://slidepdf.com/reader/full/eco-efficiency-manual 23/153
12 ECO-EFFICIENCY FOR THE DAIRY PROCESSING INDUSTRY
Future technologies:
• the use of alternative renewable fuels such as solar and wind energy
• the possible use of ozone for the treatment of wastewater streams
• active noise control of spray dryers to control noise pollution.
1.8 SummaryIn past years, the dairy processing industry has undertaken various resource
management and waste minimisation programs to increase operating efficiencies.
These programs have been undertaken on a corporate basis or for individual sites
driven by a few motivated managers. Many of the 70 dairy processing plants across
Australia are well over 50 years old, with processing operations that have grown in
size, with a combination of old and new equipment and technologies, and with
workforces of various levels of experience. For these plants, there are numerous
eco-efficiency opportunities that can be taken up. These range from simply improving
housekeeping through to investing capital to upgrade or replace existing equipment.
The chapters that follow describe some of the challenges and opportunities that are
available to the industry.
7/30/2019 Eco Efficiency Manual
http://slidepdf.com/reader/full/eco-efficiency-manual 24/153
MAKING ECO-EFFICIENCY HAPPEN IN YOUR ORGANISATION 13
2 Making eco-efficiency happenin your organisation
‘Doing more with less’ (i.e. eco-efficiency) makes good business sense. No employeeor manager would ever successfully argue that they should be doing ‘less with more’
(i.e. less output from more resources), or that they should be actively working to create
more waste! Waste costs money, is detrimental to the environment and is generally
bad for business.
The dairy industry has achieved substantial improvements in efficiency over recent
years. Yet careful examination still reveals elements of waste — wasted money,
wasted resources (such as energy and water) and wasted product.
Although eco-efficiency makes good business sense, there are some barriers that limit
its uptake. This chapter discusses those barriers and shows how they can be overcome,
through a case study that draws on the experience of Murray Goulburn and its
involvement in the Commonwealth Government’s Energy Efficiency Best Practice
Program — a program that was designed to address internal organisational barriers
to change. Although Murray Goulburn’s experience was focused specifically on energy,
the approaches that were developed can be used to implement each of the
eco-efficiency areas highlighted in this manual.
2.1 Barriers to eco-efficiency‘The main barrier to the implementation of most projects identified
by others is that of ownership of the problem. Support from senior
management is also imperative to ensure success of the project.’
— Ted Isaacs, Murray Goulburn Cooperative, Leongatha
In researching this manual we asked staff what they saw as the key barriers to the
implementation of eco-efficiency. Their responses included:
• lack of capital
• lack of time and human resources
• operator awareness and training — particularly when there are many casual staff
• lack of communication
• unsystematic approaches to eco-efficiency initiatives that prevent projects from being
implemented, being completed or being reversed at a later time if necessary
• getting senior management and board approval for projects.
There are no simple answers for these and the many other potential barriers that exist
within organisations; however, each of them must be overcome if the eco-efficiencyproject is to be successful.
7/30/2019 Eco Efficiency Manual
http://slidepdf.com/reader/full/eco-efficiency-manual 25/153
14 ECO-EFFICIENCY FOR THE DAIRY PROCESSING INDUSTRY
Here are some of the key points to consider:
• Develop management awareness, commitment and support for projects. This is
important from the beginning, and throughout projects, to ensure there is time
for holding team meetings, performing process trials and implementing solutions.
• Establish a cross-functional working group. This should include a range of staff,
including cleaners, operators, engineers and managers.
• Hold regular team meetings, to keep focus and to ensure continued progress.
• Determine baseline information on resource consumption and waste generation.
When you achieve savings it is important that you can clearly communicate exactly
what those savings are. There must be a clear picture of the situation before the
savings were made.
• Ensure that you develop good business cases for the eco-efficiency projects that you
are trying finance. This should include clearly communicating additional benefits such
as positive publicity, improved involvement with the local community, safety, andoperational benefits. In some instances you might also explore whether there are
alternative approaches that have not been considered.
More detailed information on carrying out an eco-efficiency assessment is available in
the UNEP Eco-efficiency toolkit for the Queensland food processing industry , which
includes a self-assessment guide (UNEP 2004).
2.2 Avenues for supporting the implementation of eco-efficiencyOne of the most effective means of implementing eco-efficiency is through site-based
cross-functional teams. This is discussed further in the next section, in the context of
the Murray Goulburn experience.
Here are some other ways in which dairy processing companies have supported and
implemented eco-efficiency projects:
• The appointment of designated managers and supervisors. Many dairy processors have
appointed managers to work specifically on projects within the company that improveproduct yield and reduce waste (e.g. Murray Goulburn’s Process Improvement Manager
or Energy Manager).
• Partnerships with suppliers and customers to improve production efficiencies and
reduce the use of resources. Some dairy processing companies have formed
partnerships with chemical suppliers to optimise clean-in-place systems and reduce
chemical use. Partnerships with packaging suppliers have reduced the environmental
impacts of packaging, often driven by the National Packaging Covenant. Similarly,
partnerships with customers have improved efficiency and reduced waste by solving
supply chain management problems.
7/30/2019 Eco Efficiency Manual
http://slidepdf.com/reader/full/eco-efficiency-manual 26/153
MAKING ECO-EFFICIENCY HAPPEN IN YOUR ORGANISATION 15
• Including eco-efficiency aspects in tender and proposal documents. If it is specified in
tender documents that resource consumption must be considered during the design
stages of projects, it can go a long way towards improving process yields and reducing
environmental impacts. Examples might include the installation of metering devices
during commissioning stages, the selection of less resource-intensive equipment, or
improved process layout design.
• Environmental management systems. If the company has established an environmental
management system (EMS), this can also provide an opportunity to integrate
eco-efficiency into the way things are done in the organisation. An EMS provides
a management structure that allows for setting targets, clarifying responsibilities,
training, and raising awareness to achieve environmental improvement. A focus within
the EMS on continuous improvement will allow it to be used to go beyond mere
compliance and achieve many of the environmental improvement opportunities
discussed in this manual. An EMS can also provide legitimacy within an organisation
for a focus on eco-efficiency — particularly where the organisation also has an
environmental policy that commits it to a high level of environmental performance.
• Grants and partnerships with government bodies. There are opportunities to obtain
national and state government grants, which can provide encouragement and financial
support for improving efficiency through the use of more efficient technology and
research.
• Support from industry associations. Organisations such as Dairy Australia, the
International Dairy Federation (IDF) and the Dairy Processing Engineering Centre
(DPEC) provide valuable resources in the form of publications, training and advice that
can be used to support an eco-efficiency program.
Making eco-efficiency happen within your organisation requires support from a range
of areas; it is not the sole responsibility of one particular manager or group. It depends
on support and encouragement from all levels of your organisation, as well as external
stakeholders such as suppliers, customers, industry associations and government.
A good way of getting started is through a site-based team, as described in the next
section.
2.3 The Murray Goulburn experience
2.3.1 Building skills, knowledge and support through site-based teams
Site-based teams provide an excellent mechanism for breaking down the many
barriers to cross-functional communication that limit the uptake of eco-efficiency
improvements. They also build a sense of ownership and awareness of environmental
issues at the site level. This is demonstrated by the work of Murray Goulburn’s energy
team at the company’s Rochester site. The Rochester energy team demonstrated that
better energy management saves money, reduces waste and helps build links with the
local community.
7/30/2019 Eco Efficiency Manual
http://slidepdf.com/reader/full/eco-efficiency-manual 27/153
16 ECO-EFFICIENCY FOR THE DAIRY PROCESSING INDUSTRY
To get a team together, a flyer was put on the Rochester noticeboard, inviting staff
involvement. The only requirement was that the team should include a range of staff
from different functional areas — operators, maintenance staff, boiler technicians,
supervisors and an engineer. The cross-functional make-up of the group was the key
to its success. This was demonstrated at the team’s first meeting; when it was exploring
potential energy-efficiency projects, the members came up with over 50 different
opportunities.
In order to determine which projects they should focus on, the team carried out anumber of activities.
• It reviewed existing onsite energy data and monitoring equipment. The members knew
they first had to understand how energy was used and wasted, in order to understand
the potential for savings.
• It identified the people who could help or hinder them in implementing their projects
(key stakeholders). The members invited their branch manager, a senior engineer and
the environmental manager to a meeting, in which they asked questions about the
kind of support they could expect for their projects. This group of people also provided
valuable input to the technical and organisational aspects of the projects.
• It developed a business plan that mapped out the resources required, the likely
financial savings and other benefits that would be achieved, and the people and tasks
that would ‘make the projects happen’. The business plan was presented to the
managing director to get his input, and ultimately his support, for the team’s activities.
The first project the team implemented was achieved through improved
communication between the boiler house and process operators. It did not require
any capital outlay but led to annual savings of $180 000 and 1536 tonnes of CO2
(which contributes to global warming). The following different perspectives and
the team approach contributed in various ways to identifying and implementing
this project:
Key learning
When you can tap into a cross-section of skills and knowledge from different functional
areas the possibilities for improvement are much greater. Why? Because everyone gets the
opportunity to share their own perspective. This opens up the possibility of identifying and
implementing projects that might otherwise be left alone because of the difficulty of
working across functional areas. When people identify problems themselves and are given
the opportunity to do something about them, they are also more committed to making
them happen.
Key learning
In developing the business plan, the team had learnt a lot about their site, its production
process, and the opportunities and challenges of implementing change. Their discussions
with key managers across the organisation helped develop support from outside the team,
and helped them to be very clear about what they needed to do to successfully implementeco-efficiency.
7/30/2019 Eco Efficiency Manual
http://slidepdf.com/reader/full/eco-efficiency-manual 28/153
MAKING ECO-EFFICIENCY HAPPEN IN YOUR ORGANISATION 17
Process operator perspective
Steam is a critical production input. Any time delay in the provision of steam has a
direct impact on production. Steam must be available and ready to go at all times.
Boiler operator perspective
Process operators require steam. To ensure that steam is readily available at all times
two boilers need to be warmed up and ready to go. Even though it is inefficient to
have them idling at 30%, steam must available quickly.
Eco-efficiency perspective
Operating boilers at 30% load is inefficient and expensive, and generates greenhouse
gas emissions unnecessarily.
Benefits of a team approach
Because process operators and boiler operators were both part of a team that had
a shared goal and commitment to saving energy, it was obvious to both groups that
improved communication would allow the boilers to be run more efficiently, while at
the same time ensuring that the process operators were not left without steam when
they started up a production process. Because they came up with the idea of the
project themselves, there was a lot more commitment to implementation and
ensuring that the improved communication processes actually worked.
2.3.2 Raising management awareness of the benefits of eco-efficiency
It is critical that both company and site management understand and support
eco-efficiency.
Following the work of the Rochester team, Murray Goulburn held a special meeting
for all senior and site managers to explore the risks and opportunities that energy
management held for the business overall. The workshop included:
• an update on the scientific and political developments of global warming and climate
change, and its likely impact on business
• a presentation from representatives of the Rochester energy team, discussing how theyachieved $180 000 of energy savings and were on track to achieve more
• an interactive session to identify strategies and actions that would support a more
focused approach to energy management across all Murray Goulburn sites.
After the workshop it was agreed that representatives from each of Murray Goulburn’s
seven sites would attend a two-day workshop to discuss and develop action plans for
establishing energy management teams on each site.
Soon after, a new position of Energy Manager was created, and filled by a senior
engineer, to ensure that there was a strong link between corporate and site-based
energy initiatives.

7/30/2019 Eco Efficiency Manual
http://slidepdf.com/reader/full/eco-efficiency-manual 29/153
18 ECO-EFFICIENCY FOR THE DAIRY PROCESSING INDUSTRY
2.4 SummaryThere are some barriers to the implementation of eco-efficiency. The best approach to
overcoming these barriers will depend on the nature and priority of each organisation,
its culture, and working approaches adopted at each site. The keys to successful
implementation of eco-efficiency include:
• developing management awareness, commitment and support
• establishing a site-based cross-functional working group
• involving and obtaining the support of external stakeholders such as suppliers,
customers, industry associations and perhaps government
• reporting back to, and discussing eco-efficiency initiatives at, regular team meetings
• establishing baseline information on resource consumption and waste generation
• ensuring that good business cases are developed for eco-efficiency projects.
Environmental management systems can provide an important framework for
eco-efficiency, as they supply a structure for setting targets, clarifying
responsibilities, training, and raising awareness to achieve environmental
improvement.
The work done at Murray Goulburn demonstrates one successful approach to
implementing energy efficiency. Consider your own unique circumstances. You can
use the ideas presented in this chapter to develop your own implementation plan
for eco-efficiency.
7/30/2019 Eco Efficiency Manual
http://slidepdf.com/reader/full/eco-efficiency-manual 30/153
WATER 19
3 Water
3.1 Overview of water use
This chapter discusses water use in dairy processing plants. Eco-efficiency opportunitiesare discussed under the broad categories of reducing demand in processing, cleaning,
utilities and amenities, followed by opportunities for recycling and reuse, and finally a
brief discussion on wastewater treatment.
3.1.1 Water use in dairy factories
The total amount of water used by the dairy industry is approximately 3000 GL/yr,
which is equivalent to 13% of Australia’s total freshwater resources (Lunde et al. 2003).
Of this, 99% is attributed to on-farm use, indicating that the main opportunities for
reducing water consumption in the dairy industry are to be found in improving theefficiency of milk production at the farm. Nevertheless, there are still gains to be made
by dairy processors in minimising water consumption within factories. The source and
quality of water is an issue for some processors, depending on their location. Generally
they use town water, but other sources include river water, irrigation channel water,
bore water and reclaimed condensate. Water shortages in both regional and urban
areas are leading processors to review the effectiveness of their onsite water use, both
of their own accord and in response to pressure from local authorities.
Dairy factories also produce high volumes of moderate to high-strength liquid wastes
(i.e. with high BOD and COD levels). Water and wastewater management can incur
costs for dairy processors, and these vary according to the location of the processing
plant, the source of water and the requirements for effluent treatment. The location
and type of processing plant and the options for effluent discharge play major roles in
determining the level of water reuse and recycling, as well as the degree and method
of effluent treatment. Factories in regional areas often have the option of using
effluent water for irrigation and may therefore not realise the major financial or
environmental benefit to be gained from treating and reusing effluent within the
factory. Generally, dairy processors who can reduce water use over the broader system
(including upstream and downstream of processing plants), without compromising
quality or hygiene standards, will benefit from reduced water supply and effluent
charges as well as improving the sustainability of the dairy processing industry. HACCP
plans play an important role in ensuring that hygiene standards, which are critical to
producing a quality product, are met.
Water is used in dairy factories for processing and cleaning, for the operation of
utilities such as cooling water and steam production, and for ancillary purposes such as
amenities and gardens. Figure 3.1 shows an example of water use in a dairy processing
factory that produces market milk.

7/30/2019 Eco Efficiency Manual
http://slidepdf.com/reader/full/eco-efficiency-manual 31/153
20 ECO-EFFICIENCY FOR THE DAIRY PROCESSING INDUSTRY
Figure 3.1 Breakdown of water use of a market milk processor
Many dairy processors track the overall consumption of water by monitoring the ratio
of water to raw milk intake. Water consumption in Europe has been reported to range
from 0.2 to 11 L/L milk (Daufin et al. 2001) with effluent volumes per raw milk intake in
the same range. Ratios for Australian processors producing any combination of white
milk, cheese, powders or yoghurts range from 0.07 to 2.90 L/L milk, with the average
being around 1.5 L/L milk (UNEP 2004).
Table 3.1 shows the range of ratios for factories producing white or flavoured milks,
cheese and whey products, and powdered products. For factories that produce
powdered products, there is the potential for the majority of water (>95%) to be
supplied from treated condensate, also known as ‘cow water’. However, the potential
for recovering condensate depends on the scale of a particular powder plant and the
ratio of supply to demand on a given day. For example, if the production rate isreduced during the off-peak season there will consequently be less condensate
available for recovery. The range in water to milk intake ratios indicates there is
potential for some dairy processing plants to decrease water consumption significantly.
Table 3.1 Water to milk intake ratios (L/L)
a Excludes UHT milk.
3.1.2 The true cost of water
Water is often viewed as a cheap resource — which is not surprising, considering that
Australians pay more for 1 L of milk than for 1000 L of water. Increasingly, however,
there is a shift away from this attitude, with an increase in community awareness of
the value of water and a trend for local councils and water authorities to move
Min. Max. Average No. of plants
providing data
White and flavoured onlya 1.05 2.21 1.44 7
Cheese and whey products 0.64 2.90 1.64 3
Powdered products 0.07 2.70 1.52 10
CIP
28%
Pasteurisation
25%
Crate wash
16%
Operational
processes
12%
Trade waste4%
Manual
washing
6%
Cooling towers
6%
Other
3%
7/30/2019 Eco Efficiency Manual
http://slidepdf.com/reader/full/eco-efficiency-manual 32/153
WATER 21
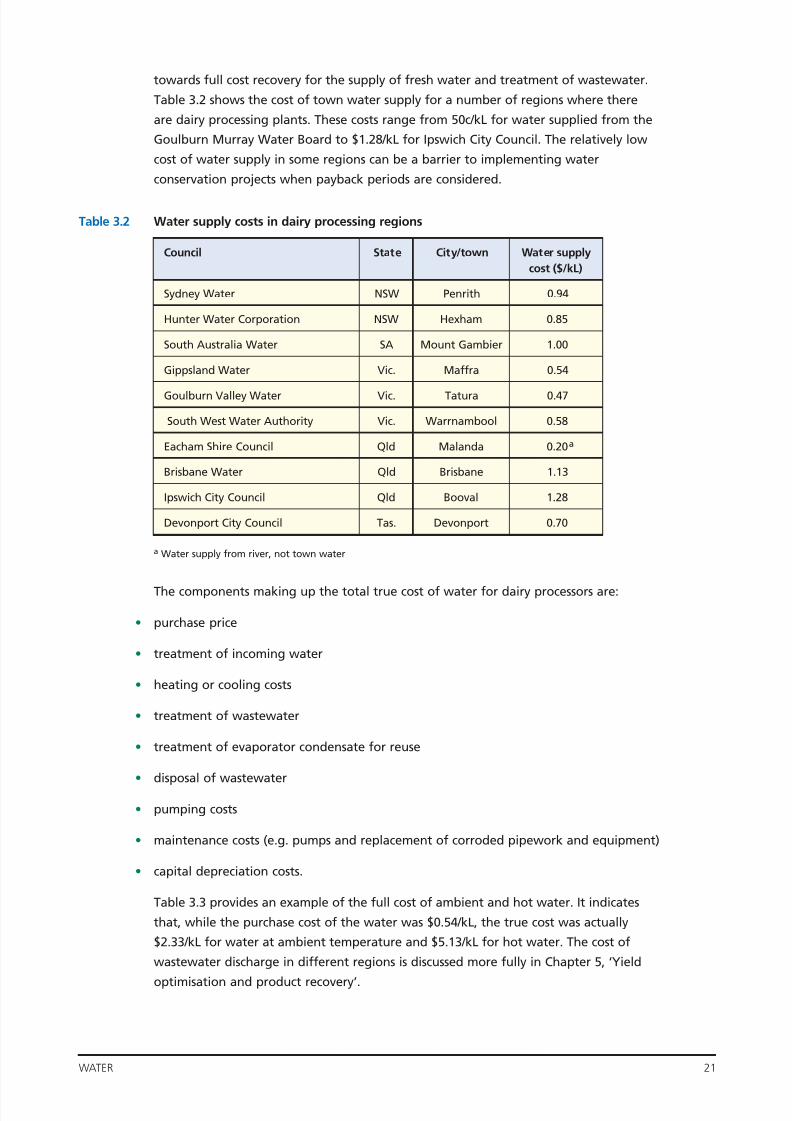
towards full cost recovery for the supply of fresh water and treatment of wastewater.
Table 3.2 shows the cost of town water supply for a number of regions where there
are dairy processing plants. These costs range from 50c/kL for water supplied from the
Goulburn Murray Water Board to $1.28/kL for Ipswich City Council. The relatively low
cost of water supply in some regions can be a barrier to implementing water
conservation projects when payback periods are considered.
Table 3.2 Water supply costs in dairy processing regions
a Water supply from river, not town water
The components making up the total true cost of water for dairy processors are:
• purchase price
• treatment of incoming water
• heating or cooling costs
• treatment of wastewater
• treatment of evaporator condensate for reuse
• disposal of wastewater
• pumping costs
• maintenance costs (e.g. pumps and replacement of corroded pipework and equipment)
• capital depreciation costs.
Table 3.3 provides an example of the full cost of ambient and hot water. It indicates
that, while the purchase cost of the water was $0.54/kL, the true cost was actually
$2.33/kL for water at ambient temperature and $5.13/kL for hot water. The cost of
wastewater discharge in different regions is discussed more fully in Chapter 5, ‘Yield
optimisation and product recovery’.
Council State City/town Water supply
cost ($/kL)
Sydney Water NSW Penrith 0.94
Hunter Water Corporation NSW Hexham 0.85
South Australia Water SA Mount Gambier 1.00
Gippsland Water Vic. Maffra 0.54
Goulburn Valley Water Vic. Tatura 0.47
South West Water Authority Vic. Warrnambool 0.58
Eacham Shire Council Qld Malanda 0.20a
Brisbane Water Qld Brisbane 1.13
Ipswich City Council Qld Booval 1.28
Devonport City Council Tas. Devonport 0.70

7/30/2019 Eco Efficiency Manual
http://slidepdf.com/reader/full/eco-efficiency-manual 33/153
22 ECO-EFFICIENCY FOR THE DAIRY PROCESSING INDUSTRY
Table 3.3 Example of the true cost of ambient and hot water ($/kL)
a Based on assumption of treatment costs for an anaerobic digester
b Cost for heating to 80°C using steam produced by a gas boiler
3.1.3 Measuring water consumption
To understand how to manage water effectively it is essential to understand how muchwater enters and leaves the factory and where it is being used. Understanding water
flows will help to highlight where the greatest opportunities for cost savings are. This
can be achieved by developing a detailed water model for the site using dedicated
software or a simple spreadsheet. The water model should balance the total water
entering the factory over a period with the volume of water used in processing and
finally disposed as effluent.
There are a number of methods that can help to quantify water use and develop a
water model:
• Install flow meters in strategic areas to directly measure water use.
• Use a bucket and stopwatch to estimate flow from pipes or hoses.
• Use manufacturers’ data to estimate water use for some equipment and compare with
actual water use.
• Use known operational data to estimate water use (e.g. a 10 kL tank fills every wash cycle).
When identifying areas of water use, manual operations as well as equipment should
be monitored carefully (e.g. the volume of water used for washing down floors and
equipment must be taken into account). It is also a good opportunity to observe staff
behaviour (e.g. taps left running or hoses left unattended).
Flow meters
Flow meters on equipment with high water consumption, incoming water inlets and
wastewater discharge outlets will allow regular recording and monitoring of water use.
Flow meters are also useful for measuring ‘standing still’ water consumption during
periods when equipment is not operating, to detect any leaks. When installing a meter
ensure that the meter is tailored to meet the application (e.g. measurement of product
wastewater or clean-in-place volumes).The cost of installing or hiring flow meters will
vary according to the meter size and functionality. Factors to consider include pipe size,
Purchase $0.54
Wastewater treatmenta $0.75
Wastewater pumping $0.05
Wastewater discharge (volume charge) $1.09
True cost of ambient water $2.43
Heating to 80°Cb $2.80
True cost of hot water $5.23
7/30/2019 Eco Efficiency Manual
http://slidepdf.com/reader/full/eco-efficiency-manual 34/153
WATER 23
flow rate (L/min), fluid quality (e.g. incoming potable water, wastewater, process
water), type of power supply (mains, battery or solar), accuracy required and piping
installation costs. It is also particularly important to consider ongoing maintenance and
recalibration costs. Often a higher capital cost with lower maintenance costs can result
in lower life-cycle costs.
3.1.4 Increasing staff awareness and involvement
The involvement and support of staff is essential in reducing water use. Ideas for
involving staff and encouraging water conservation include:
• forming a water management team
• using posters and stickers to promote awareness of water efficiency
• implementing staff suggestion schemes to encourage ideas for reducing water use
• promoting progress by displaying graphs and performance measures
• regularly discussing water efficiency at staff meetings
• considering a staff incentive scheme and including targets in staff job goals.
Involvement of staff, the establishment of clear goals and targets, and prompt
implementation of initiatives can help develop a strong water conservation culture.
‘It is important to set targets and allow operators active involvement in
developing improvements.’ — Adam Carty, Murray Goulburn Cooperative, Kiewa,
Victoria, commenting on minimising site water use.
‘One of the main issues is operator awareness and training. With such a large
number of casual and seasonal staff, training and awareness has to be
maintained so that eco-efficient projects are continually generated from the
floor and maintained.’ — Peter McDonald, Murray Goulburn Cooperative Co., Koroit, Victoria.
‘Every Drop Counts’
Improved water management: Dairy Farmers, Lidcombe
Dairy Farmers in Lidcombe joined the Sydney Water ‘Every Drop Counts’ water minimisation
business partnership. The company installed 27 water meters across the site and worked on
developing an accurate understanding of water flow to each area. A water assessment was
undertaken over a number of months, identifying savings by preventing cooling tower overflow;
recirculating homogeniser water, crate wash water and DAF water; reducing water for cleaning;
repairing leaks; and reviewing truck washing practices. The assessment identified total savings in
water costs of $300 000/yr with an initial cost of $150 000 and ongoing costs of $26 000/yr.
Improved water management: National Foods, Penrith
National Foods Ltd in Penrith also joined the Every Drop Counts partnership. Additional water
meters were installed and these were fitted with pulse unit and data loggers, allowing the
daily water usage to be recorded and downloaded to a central system. Water usage for the
site was mapped and potential improvements identified, including redesign of the crate wash
system, improved maintenance and monitoring, more efficient pasteuriser and bottle washing,
collection of rainwater, and reductions in water use for pump seals. Water use for the site was
reduced by 22% as a result of the program, reducing water use by 110 kL/day and saving
$104 000/yr, with implementation costs of $86 000.
7/30/2019 Eco Efficiency Manual
http://slidepdf.com/reader/full/eco-efficiency-manual 35/153
24 ECO-EFFICIENCY FOR THE DAIRY PROCESSING INDUSTRY
3.2 Reducing demand for water: processing
3.2.1 Optimising rate of water flow
Sometimes equipment operates at water pressures or flow rates that are variable and
set higher than necessary (e.g. pump sealing water, homogeniser cooling water, belt
filter sprays or carton machine cooling water). By conducting trials to determine the
optimum flow for the equipment or comparing the flow rate with manufacturers’
specifications, consumption could be reduced. To maintain a constant and optimum
flow rate, consider installing a flow regulator.
3.2.2 Efficient process control
Installing automatic monitoring and control devices in key sites can lower production
costs. A wide variety of devices are used in dairy factories to detect operating
parameters such as level, flow, temperature, pH, conductivity and turbidity. These are
particularly important for detecting the quality of processing and waste streams to
enable the maximum recovery of product, chemical and water. Refer to the DRDC
publication Milk processing effluent stream characterisation and utilisation (DRDC
1999) for information on instrumentation and methods for monitoring and controlling
waste streams.
Water sprays are often used in dairy factories for washing, or to lubricate equipment.
Water is wasted if sprays are left operating unnecessarily during breaks in production;
this can be prevented by linking sprays to conveyor or equipment motors, using
automatic cut-off valves. Timers may also be useful for shutting off sprays or taps when
not in use.
Increasing staff awareness: Murray Goulburn
Murray Goulburn Cooperative sites introduced environmental awareness training into their
staff inductions. The inductions have a ‘two-tiered’ approach where staff have a training
session which is followed up a few months later to reinforce the earlier message. This has
ensured that all staff are aware of the initiatives to minimise water use and are encouraged
to generate projects.
Measurement of resources: Peters and Brownes, BalcattaPeters and Brownes in Balcatta have built a site database of utility usage/production data,
which provides ‘year to date’ usage of electricity, gas and water consumption. Water,
electricity and gas usage is metered within strategic locations of the factory allowing
resource use to be analysed by area, and the information is available to managers online.
Optimising homogeniser cooling water: Dairy Farmers, Mount Gambier
Dairy Farmers in Mount Gambier reduced water costs by $10 800/yr, by reducing the flow of
cooling water to the homogeniser to the optimum rate. The cost was only $250 for the
installation of a flow regulation valve.
7/30/2019 Eco Efficiency Manual
http://slidepdf.com/reader/full/eco-efficiency-manual 36/153
WATER 25
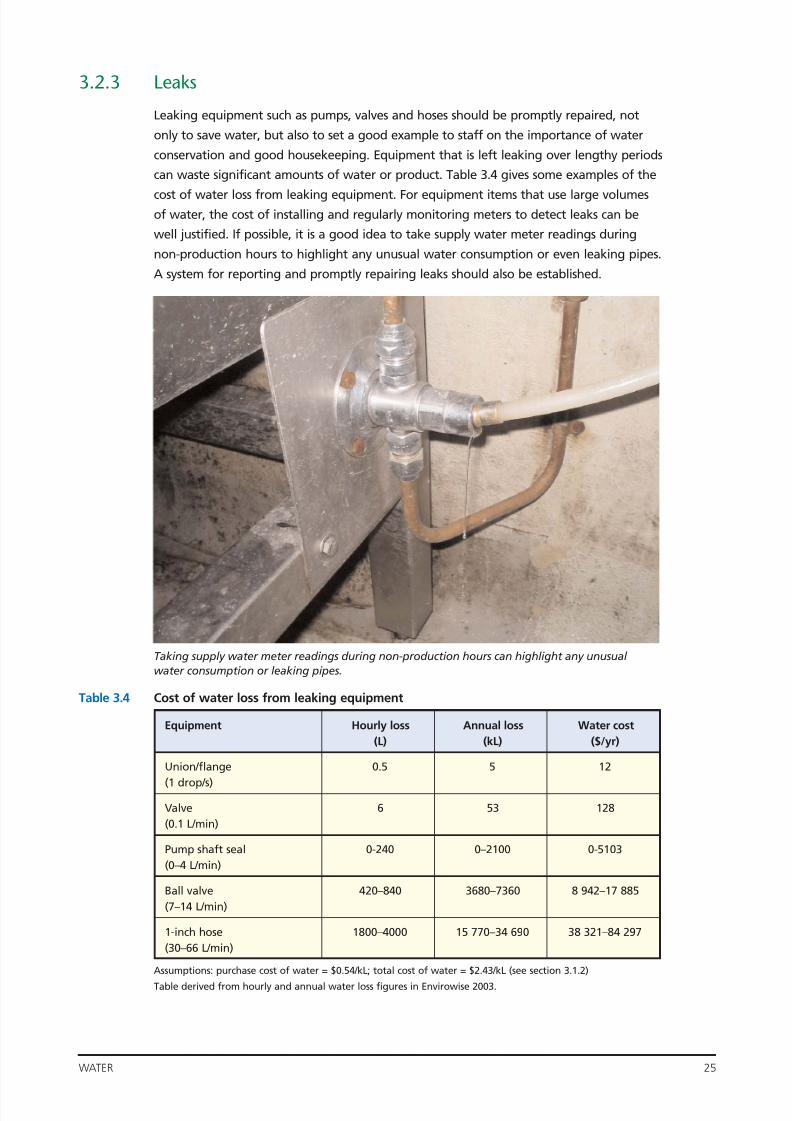
3.2.3 Leaks
Leaking equipment such as pumps, valves and hoses should be promptly repaired, not
only to save water, but also to set a good example to staff on the importance of water
conservation and good housekeeping. Equipment that is left leaking over lengthy periods
can waste significant amounts of water or product. Table 3.4 gives some examples of the
cost of water loss from leaking equipment. For equipment items that use large volumesof water, the cost of installing and regularly monitoring meters to detect leaks can be
well justified. If possible, it is a good idea to take supply water meter readings during
non-production hours to highlight any unusual water consumption or even leaking pipes.
A system for reporting and promptly repairing leaks should also be established.
Table 3.4 Cost of water loss from leaking equipment
Assumptions: purchase cost of water = $0.54/kL; total cost of water = $2.43/kL (see section 3.1.2)
Table derived from hourly and annual water loss figures in Envirowise 2003.
Taking supply water meter readings during non-production hours can highlight any unusual water consumption or leaking pipes.
Equipment Hourly loss Annual loss Water cost
(L) (kL) ($/yr)
Union/flange 0.5 5 12
(1 drop/s)
Valve 6 53 128
(0.1 L/min)
Pump shaft seal 0-240 0–2100 0-5103
(0–4 L/min)
Ball valve 420–840 3680–7360 8 942–17 885
(7–14 L/min)
1-inch hose 1800–4000 15 770–34 690 38 321–84 297
(30–66 L/min)
7/30/2019 Eco Efficiency Manual
http://slidepdf.com/reader/full/eco-efficiency-manual 37/153
26 ECO-EFFICIENCY FOR THE DAIRY PROCESSING INDUSTRY
3.3 Reducing demand for water: cleaningA large proportion of the water consumed by dairy processors (50–90%) is used for
cleaning equipment and surrounding areas of the plant (Envirowise 1999a). There
are numerous opportunities for reducing water use for cleaning, as outlined in
the following section. The Dairy Process Engineering Centre (DPEC) publication
Performance evaluation guide manual — cleaning systems 98/99 (DPEC 1989/99) is apractical guide for evaluating the effectiveness of a cleaning system and benchmarking
current performance. It also includes a worked example and ready-to-use work sheets.
Another useful resource is CIP: cleaning in place (Romney 1990).
3.3.1 Design and selection of processing equipment and process layout
Criteria for the selection of equipment and the design of process layout should include
ease of cleaning. This will minimise the risk of product contamination and spoilage, as
well as reducing water and chemical use and the time taken for cleaning. Pipe runs
should be designed with minimal bends and dead legs where contamination can occur.Additional valves may be installed in existing pipes to prevent them from acting as
dead legs; and pipes should run on a decline to allow for efficient drainage. Floor
surfaces should be designed to promote run-off, to reduce the need for hosing of
product residues.
3.3.2 Dry cleaning
Dry cleaning not only reduces water and chemical use but also reduces the volume of
wastewater and improves its quality. As much product as possible should therefore be
removed from plant and equipment by dry cleaning techniques before being washeddown. In some cases usable product can be recovered also. Cleaning aids such as
squeegees and brushes are used in dairy factories, and care must be taken to ensure
they do not become a source of contamination. For this reason, some factories use
distinguishing features such as colour coding so that cleaning aids are used only in
designated areas.
Scrubber dryers and vacuum cleaners can wet or dry clean and remove gross soiling
before washing with water to reduce the amount of wastewater that would normally
be discharged to the drain. They are fast and efficient, reduce chemical use, and are
suitable for relatively dry areas such as cold stores or warehouses where hosing isunsuitable and there may be large expanses of floor space.
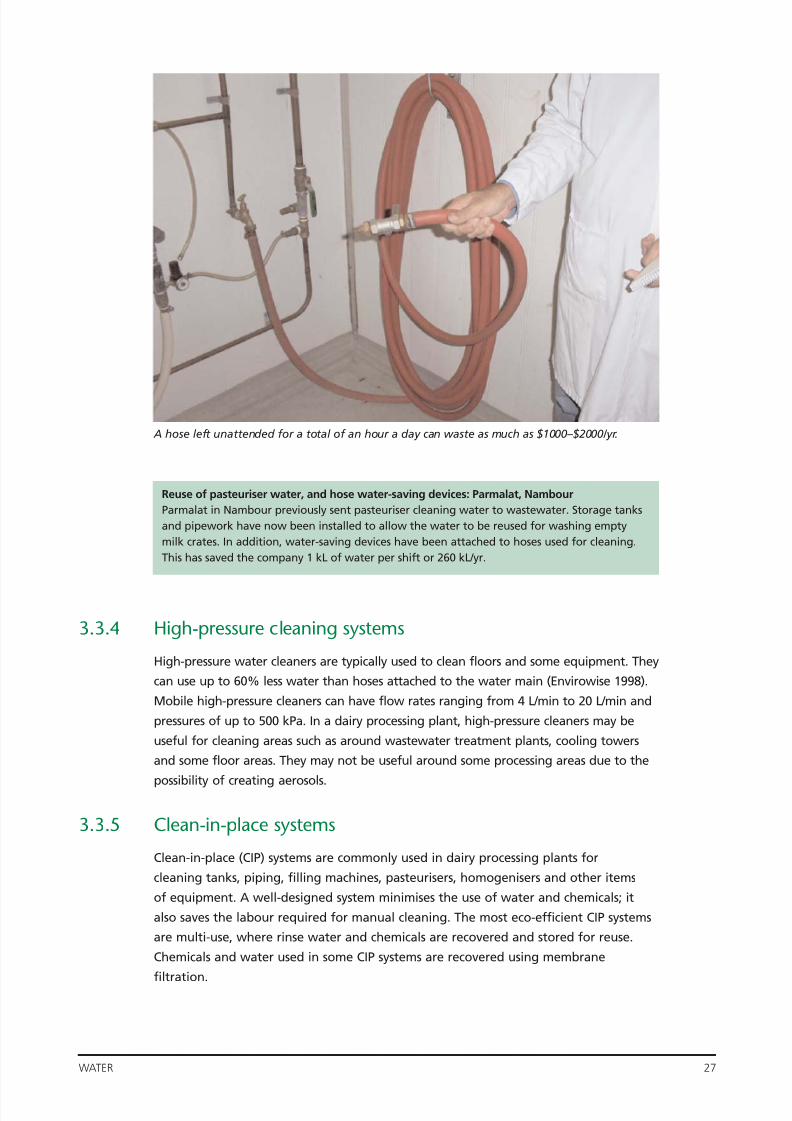
3.3.3 Trigger-operated controls for hoses
Hoses left on unnecessarily waste water. For example, a hose left unattended for a
total of one hour each day can lose between 470 kL and 940 kL annually, equating to
$1000–$2000 every year for each hose.1 The cost of a trigger gun can range between
$20 and $200 for a heavy-duty unit.
1 Assumptions: $2.43/kL for true water cost; 260 days each year; hose flow rate of 0.5–1.0 L/s
7/30/2019 Eco Efficiency Manual
http://slidepdf.com/reader/full/eco-efficiency-manual 38/153
WATER 27
3.3.4 High-pressure cleaning systems
High-pressure water cleaners are typically used to clean floors and some equipment. They
can use up to 60% less water than hoses attached to the water main (Envirowise 1998).
Mobile high-pressure cleaners can have flow rates ranging from 4 L/min to 20 L/min and
pressures of up to 500 kPa. In a dairy processing plant, high-pressure cleaners may be
useful for cleaning areas such as around wastewater treatment plants, cooling towers
and some floor areas. They may not be useful around some processing areas due to the
possibility of creating aerosols.
3.3.5 Clean-in-place systems
Clean-in-place (CIP) systems are commonly used in dairy processing plants for
cleaning tanks, piping, filling machines, pasteurisers, homogenisers and other items
of equipment. A well-designed system minimises the use of water and chemicals; it
also saves the labour required for manual cleaning. The most eco-efficient CIP systems
are multi-use, where rinse water and chemicals are recovered and stored for reuse.
Chemicals and water used in some CIP systems are recovered using membrane
filtration.
A hose left unattended for a total of an hour a day can waste as much as $1000–$2000/yr.
Reuse of pasteuriser water, and hose water-saving devices: Parmalat, Nambour
Parmalat in Nambour previously sent pasteuriser cleaning water to wastewater. Storage tanks
and pipework have now been installed to allow the water to be reused for washing empty
milk crates. In addition, water-saving devices have been attached to hoses used for cleaning.
This has saved the company 1 kL of water per shift or 260 kL/yr.
7/30/2019 Eco Efficiency Manual
http://slidepdf.com/reader/full/eco-efficiency-manual 39/153
28 ECO-EFFICIENCY FOR THE DAIRY PROCESSING INDUSTRY
In most systems, interfaces between product, chemical and rinse water are detected
using conductivity or turbidity meters; other systems use timers. The effectiveness of
conductivity and turbidity meters compared with timers is a topic of debate. Timers
may not provide a consistent or repeatable quality of clean due to factors such as
varying flow rates, pressures, and pump or valve wear; meters can fail, causing
operating delays or unnecessary loss of product, chemicals or water to the waste
stream. In addition, instrumentation can ‘drift’ out of calibration over time; and timers
can be adjusted to compensate for operational factors. Regardless of which system is
used, it is important to regularly verify chemical strengths and temperatures as well as
carrying out visual checks, if possible, to ensure equipment is clean. These checks may
be done every day, shift or clean. It is also important to carry out longer-term
monitoring — for example, every 12 months to validate CIP system settings and review
timers, chemical concentrations, temperatures and general cleaning effectiveness.
For further reading on CIP systems see AS 1162:2000, Cleaning and Sanitizing Dairy
Factory Equipment; and AS/NZS 2541:1998, Guide to the Cleaning-in-Place of Dairy
Factory Equipment. CIP systems are also discussed further in Chapter 7, ‘Chemical use’,which includes information on types of chemicals used and typical concentrations.
‘When optimising CIP systems, take one step at a time and don’t try to make
too many changes at once.’ — Alison Dilger, National Foods, Morwell
Reuse of water by CIP system: Pauls Ltd, Stuart Park1
Pauls in Stuart Park previously utilised a single-use CIP system where all water and chemicals
were used once and then discharged to waste. The system has been replaced with a multi-use
CIP system that recycles final rinse water for the pre-rinse cycle. All chemicals used in the
system are also returned and circulated through holding vats, where temperature and
conductivity are monitored and automatically adjusted to meet specifications. The new CIP
system saves Pauls $40 000/yr, with a payback period of only one year.
Fine-tuning of CIP system: National Foods Ltd, Penrith
National Foods in Penrith, as part of a regular audit of CIP systems, reviewed the flush time of
their pasteuriser. They were able to reduce the flush time by 12 min/day, which resulted in
water savings of 15 ML/yr.
Validation of CIP System: National Foods Ltd, Morwell
During the early stages of commissioning the National Foods Morwell plant, there were
problems with product quality and cleaning times, and concentrations of cleaning agents were
increased. As the quality issues were resolved it was found that many concentrations and times
were above recommended levels. These were able to be reduced without compromising
product quality, although there were challenges in convincing others that this was the case.
The costs of implementing the changes were just the time and tests required to make thechanges. Savings were in the order of $100 000 /yr.
Upgrade of major CIP set: Murray Goulburn Cooperative, Koroit
Murray Goulburn’s Koroit factory upgraded its CIP system and installed additional tanks for
the storage of used and clean caustic. Previously, not all the evaporators had access to the CIP
system, so water and chemicals were disposed after a single use. The initiative ensured
increased chemical recovery, better quality of chemical supply, reduced effluent volume and
less plant downtime; it led to savings of $80 000/yr. The cost of implementation was $90 000.
Optimisation of CIP system: Murray Goulburn, Leitchville
Murray Goulburn in Leitchville incorporated its milk pasteuriser CIP system into the cheese
room CIP system, allowing water and chemicals to be reused rather than being sent to drain
after a single use. The project outlay was $50 00, with savings of $73 000/yr in chemicals and16 kL/day of hot water.
1 Environment Australia 2001
7/30/2019 Eco Efficiency Manual
http://slidepdf.com/reader/full/eco-efficiency-manual 40/153
WATER 29
Burst rinsing
Burst rinsing is becoming more commonly used for the pre-cleaning of tanks and
tankers to maximise product recovery before CIP. Depending on the characteristics of
the product being cleaned (e.g. its viscosity), a series of bursts rather than a continuous
rinse can minimise water use. One disadvantage is that it can add time to a cleaning
cycle.
Spray balls and nozzles
Spray balls and nozzles are an integral part of a CIP system. Spray nozzles for tank
cleaning usually come in three main types:
• fluid-driven tank wash nozzles which are rotated by the reactionary force of the fluid
leaving the nozzle
• motor-driven tank washers, controlled by air or electric motors which rotate the spray
head for high-impact cleaning
• stationary tank wash nozzles or spray balls which use a cluster of nozzles in a fixed
position.
Spray balls and nozzles should be selected to suit the application, particularly with
regard to the temperature and corrosive nature of the cleaning fluids. Spray nozzles
should be regularly monitored and maintained and their efficiency reviewed as part of
a cleaning validation program.
CIP rinse recovery: Bonlac Foods Ltd, Spreyton
At Bonlac Foods in Spreyton large volumes of water are required for final rinsing after CIP of
the separators and evaporator. After the chemical concentration has dropped to an acceptable
level this water is diverted from the wastewater system to an irrigation dam. Excessive
chemical contamination of irrigation water is avoided by the use of conductivity probes.
Burst rinsing of tankers: Murray Goulburn, Leongatha
Murray Goulburn in Leongatha routinely rinsed its milk tankers before CIP, flushing out the
milk solids and losing them to effluent. Burst rinsing, which has now been introduced,
displaces milk solids from the tanker and associated lines without excessive dilution. The milk
solids are recovered for processing.
Burst rinsing: Peters and Brownes, Balcatta
Peters and Brownes in Balcatta introduced burst rinsing into the ice-cream CIP after an audit
by the factory’s chemical suppliers. The initiative required some small program changes to the
CIP automation system but resulted in water savings of 15 ML/yr or $20 000. The plant found
burst rinsing could not be used for all operations; for example, it added too much time to the
cheese processing cleaning cycle where time was critical. Also, burst rinsing was not continued
in areas of the beverage plant because there were no savings. The plant is continuing trials in
other areas.

7/30/2019 Eco Efficiency Manual
http://slidepdf.com/reader/full/eco-efficiency-manual 41/153
30 ECO-EFFICIENCY FOR THE DAIRY PROCESSING INDUSTRY
3.3.6 Scheduling or modifying product changeovers
Efficient product scheduling and planning of product changeovers is an effective means
of reducing resource consumption for cleaning and is commonly practised by dairy
plant managers. Product changeovers should be optimised so that equipment cleaning
is kept to a minimum and productivity is maximised.
‘Pigging’ systems
Pigging is a method of removing product from pipes; it can reduce the volume of
water required for cleaning by minimising residual product left in the system, and
therefore reduce rinse times. Pigging systems are discussed further in Chapter 5,
‘Yield optimisation and product recovery’.
3.3.7 Crate washers
Crate washers can use a significant volume of water in a plant producing short shelf-life
milk. The breakdown of water consumption in Figure 3.1 shows crate washing as
accounting for 16% of the total water used. Crate washers can be prone to leaks and
it is important that they are well maintained. Recirculating water in crate washers is
a relatively easy method of reducing consumption. Another idea is to investigate
adjusting the washer speed and length of cleaning cycles, to achieve the most efficient
clean while still meeting hygiene standards.
Water-efficient spray nozzles: milk and beverage processor, USA
Schroeder Milk Co. in Minnesota now saves around 20 000 L daily after improving the
efficiency of spray nozzles on its carton washer. The company changed from using shower
heads and spray bars to smaller nozzles and mist sprays, and now only operates the washer
when needed instead of continuously.1
1 University of Minnesota 2003
Effluent volume prediction model: Murray Goulburn, Leongatha
Murray Goulburn in Leongatha uses an Excel-based effluent volume prediction model to monitor
and help schedule CIP washes. The model is used to prevent the wastewater system from being
overloaded and allows wastewater volumes to be benchmarked and potentially reduced.
Redesign of crate wash system: National Foods Ltd, Penrith
National Foods in Penrith redesigned its crate wash system to allow the recirculation of water.
The improvement saved 60 kL/day of water and $105 000/yr, based on water supply and
discharge costs. The cost of implementation was $50 000.

7/30/2019 Eco Efficiency Manual
http://slidepdf.com/reader/full/eco-efficiency-manual 42/153
WATER 31
3.4 Reducing demand for water: utilities
3.4.1 Blowdown in cooling towers and boilers
Blowdown prevents the build-up of dissolved solids deposits in cooling towers and
boilers, which reduces operating efficiency. Cooling towers and boilers often operate
with a constant blowdown flow, or are timed to release water at regular intervals
while some blowdown is regulated manually. In order to minimise the flow of make-up
water needed after each blowdown, a conductivity probe can be installed. The probe
initiates blowdown only when the conductivity in the water exceeds a set value. It may
be possible to reuse boiler blowdown water for non-product uses such as floor cleaning
or perhaps ash sluicing (for factories with coal-fired boilers). Blowdown can also be a
good source of recovered heat, as discussed in Chapter 4, ‘Energy’.
3.4.2 Cooling tower operation
Cooling towers can be a source of microbial contamination, or can use excessive water,
if they are not well maintained. A regular maintenance schedule will enhance the
tower’s efficiency and maximise its lifespan. Requirements for microbial control
measures are set out in AS/NZS 3666.1:2002, Air-Handling and Water Systems of
Buildings — Microbial Control — Design, Installation And Commissioning, and in
guidelines issued by state health departments.
Float valves are used on many cooling towers to control make-up water supply. The
valve should be located in a position where it cannot be affected by water movement
as a result of wind or water flowing through inlet pipes into the tower basin.
Cooling towers should be regularly checked for leaks and scale build-up.
7/30/2019 Eco Efficiency Manual
http://slidepdf.com/reader/full/eco-efficiency-manual 43/153
32 ECO-EFFICIENCY FOR THE DAIRY PROCESSING INDUSTRY
3.4.3 Equipment sealing water
Some items of equipment, such as vacuum pumps, centrifugal pumps and
homogenisers, require sealing and cooling water. Often this water is used ‘once
through’ and disposed to drain after a single use. There can be opportunity for
substantial savings by recovering this water for other uses. In the case of pumps, an
alternative is to use types that have a dry mechanical seal; however, care must be taken
if using dry seals for pasteurised products, due to the possible risk of contamination if
product reaches past the seal and cannot be easily removed during cleaning.
3.5 Ancillary water use
Water use in amenities, kitchens/cafeterias and gardens may be a small percentage
of a factory’s overall water use but there can still be significant savings to be made.
Practising water conservation, often by implementing simple and low-cost measures,
also sends a strong message to staff. Table 3.5 shows water efficiency ratings and
corresponding flow rates of various appliances. A comparison of water-efficient
products and non-rated products is shown in Table 3.6, with an indication of
potential savings in water volume.
Overflow of water on cooling tower: Murray Goulburn, Leongatha
Murray Goulburn in Leongatha conducted a water audit, which identified that one of the
cooling towers was intermittently overflowing. The leak was measured at 120 L/min, which
equated to around 57 000 L/day, assuming the leak occurred 30% of the time.
Recirculation of vacuum pump sealing water: Murray Goulburn, KoroitMurray Goulburn Cooperative in Koroit installed a water recirculation system on the powder
packing plant vacuum pumps, reducing water use by approximately 10 000 kL/yr and saving
$5000 in water supply costs. Wastewater at Koroit is used for irrigation, so there were no
additional savings in disposal costs.
Recirculation of vacuum pump sealing water: Murray Goulburn, Leitchville
At the Murray Goulburn Leitchville factory a water recirculation system was installed on the
vacuum pump. The water is cooled using an air-cooled radiator. The project was very
successful, saving $27 000 in maintenance costs and 1.1 million L/yr in water that was
previously sent to drain. The cost of implementation was $15 000, which included a pump,
balance tank, pipework and fan.
Recirculation of homogeniser water: Dairy Farmers, Bomaderry
At Dairy Farmers in Bomaderry most of the pumps and homogenisers require water cooling
for their seals. Where possible, recaptured condensate water is used on the pump seals. There
are three homogenisers on the site, all of which are now fitted with water recycling units;
these recycle water used on the homogeniser seals and only require dumping and cleaning
once a day. Now around 15 kL of water per day is saved, with mains water costs of $120/day.
The cost of the recirculation system was approximately $4500.
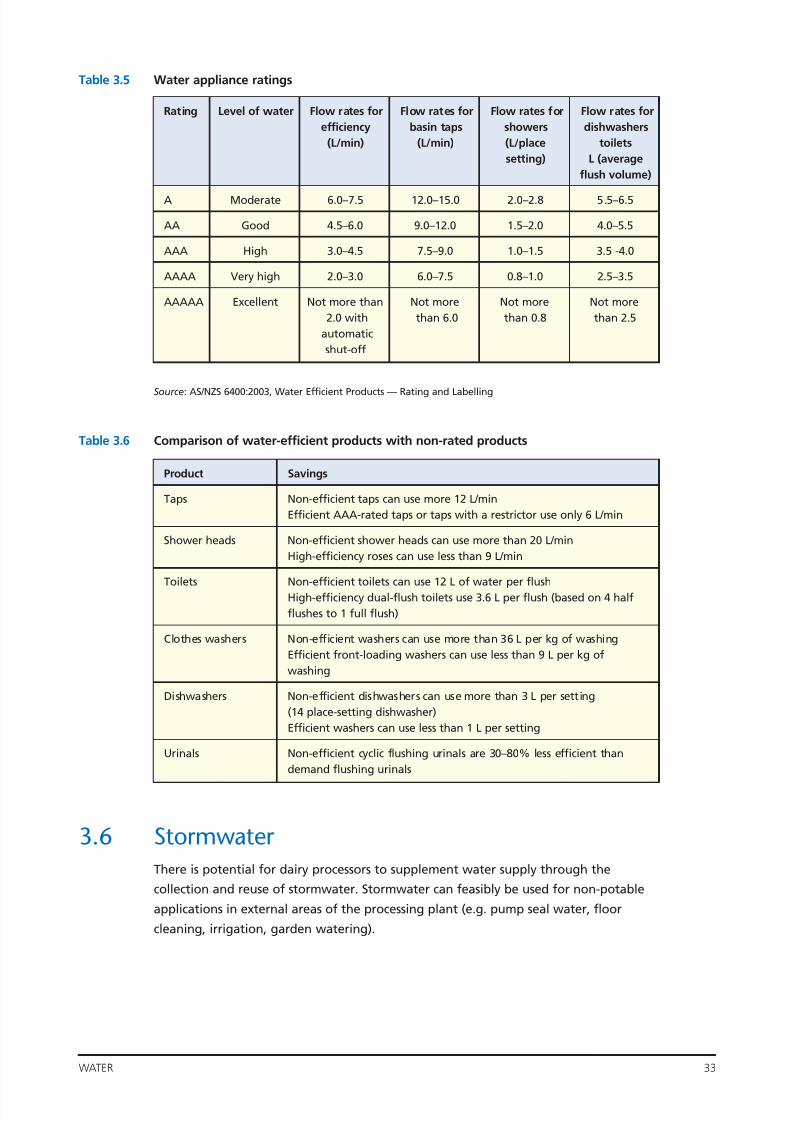
7/30/2019 Eco Efficiency Manual
http://slidepdf.com/reader/full/eco-efficiency-manual 44/153
WATER 33
Table 3.5 Water appliance ratings
Source: AS/NZS 6400:2003, Water Efficient Products — Rating and Labelling
Table 3.6 Comparison of water-efficient products with non-rated products
3.6 Stormwater There is potential for dairy processors to supplement water supply through the
collection and reuse of stormwater. Stormwater can feasibly be used for non-potable
applications in external areas of the processing plant (e.g. pump seal water, floor
cleaning, irrigation, garden watering).
Rating Level of water Flow rates for Flow rates for Flow rates for Flow rates for
efficiency basin taps showers dishwashers
(L/min) (L/min) (L/place toilets
setting) L (average
flush volume)
A Moderate 6.0–7.5 12.0–15.0 2.0–2.8 5.5–6.5
AA Good 4.5–6.0 9.0–12.0 1.5–2.0 4.0–5.5
AAA High 3.0–4.5 7.5–9.0 1.0–1.5 3.5 -4.0
AAAA Very high 2.0–3.0 6.0–7.5 0.8–1.0 2.5–3.5
AAAAA Excellent Not more than Not more Not more Not more
2.0 with than 6.0 than 0.8 than 2.5
automatic
shut-off
Product Savings
Taps Non-efficient taps can use more 12 L/min
Efficient AAA-rated taps or taps with a restrictor use only 6 L/min
Shower heads Non-efficient shower heads can use more than 20 L/min
High-efficiency roses can use less than 9 L/min
Toilets Non-efficient toilets can use 12 L of water per flush
High-efficiency dual-flush toilets use 3.6 L per flush (based on 4 half
flushes to 1 full flush)
Clothes washers Non-efficient washers can use more than 36 L per kg of washing
Efficient front-loading washers can use less than 9 L per kg of
washing
Dishwashers Non-efficient dishwashers can use more than 3 L per setting
(14 place-setting dishwasher)
Efficient washers can use less than 1 L per setting
Urinals Non-efficient cyclic flushing urinals are 30–80% less efficient than
demand flushing urinals
7/30/2019 Eco Efficiency Manual
http://slidepdf.com/reader/full/eco-efficiency-manual 45/153
34 ECO-EFFICIENCY FOR THE DAIRY PROCESSING INDUSTRY
3.7 Water recycling and reuseSome wastewater streams are relatively clean and can be recycled or reused onsite.
If the quality of wastewater streams is not suitable, some form of treatment may be
necessary if the water is to be reused. In some cases in may be necessary to segregate
wastewater systems to allow for reuse. Generally, water that will be in contact with
product must be of drinking water quality and meet the Australian Drinking Water
Guidelines (NHMRC & ARMCANZ 1996). Water that is recovered for use as boiler and
cooling tower make-up must also generally be of high quality, as excessive organics or
salts in the water will become concentrated and cause damage through excessive
scaling or corrosion. Conductivity is usually used as an indicator of boiler feed-water
quality and a maximum acceptable conductivity of 25 µS/cm has been cited (IDF 1988).
Advice on the quality of water that can be reused in boilers and cooling towers should
be sought from relevant experts.
3.7.1 Condensate recovery
Condensate water can be generated from two areas in dairy processing plants: from
drying and evaporation processes used to concentrate milk products or produce
powders (vapour condensate); and from boiler and steam supply systems. Recovery
of condensate from these areas is discussed below.
Use of stormwater: National Foods Ltd, Penrith
National Foods in Penrith reconnected an existing stormwater collection tank. The stormwater
supplements trade waste vacuum pump sealing water, which is also recirculated. The initiative
has saved the company 12 kL/day and $4000 in water supply and discharge costs. The initial
cost was $2000, with operating costs of $100/yr.
Reuse of pasteuriser flush water: National Foods Ltd, Chelsea Heights
National Foods in Chelsea Heights reduced water use by 3 kL/day by recovering water from
the pasteuriser flush. Estimated savings per year are greater than 1 ML. The company is
planning to implement the same initiative on the remaining pasteurisers.
Reuse of pasteuriser sanitiser water: Murray Goulburn, Leitchville
Murray Goulburn in Leitchville now recovers pasteuriser sanitising water by returning it to thehot water system. The factory collects around 8 kL of 85°C water per day, which was previously
sent to drain, saving around 2900 kL/yr and approximately $1000 in water supply costs. Water
from the factory is used for irrigation so there were no savings in disposal costs. The cost of
installation was $8000 for a double butterfly valve, non-return valve, pipework and
programming. The conductivity sensor and divert valve is used to divert water that may be
contaminated.
Reuse of instrument cleaning water: Dairy Farmers, Malanda
Dairy Farmers in Malanda reuse water used for cleaning inline instruments that are used for
testing quality parameters of incoming water such as turbidity. The instruments need to have
a constant flow of water across them. The water is stored and pumped back into the water
treatment (clarifier) system, saving 26 ML/yr and $5200 per year in water supply costs (based
on a cost of 0.20c/kL).
7/30/2019 Eco Efficiency Manual
http://slidepdf.com/reader/full/eco-efficiency-manual 46/153
WATER 35
Drying and evaporation processes
Condensate recovery systems are widely used in Australian dairy factories and can
provide a substantial proportion of total water supplies. Around 87% of raw milk is
water, the majority of which (about 85%) may be recovered, to potentially provide up
to 100% of total factory requirements. The benefits of condensate recovery can be
twofold, with savings in water consumption as well as in the recovery of heat energy.Vapour condensate, also known as ‘cow water’, can be used in numerous areas of the
plant such as boiler and cooling tower feed water, CIP systems, cheese curd wash water,
dryer wet scrubbers, indirect heating (via heat exchange) and pump seal water. There
are, however, some factors to take into consideration in using condensate:
• It may contain carryover of product.
• It may require cooling.
• It is very low in dissolved solids (measured by conductivity), which can cause corrosion.
• It can be odorous.
The quality of vapour condensate depends on the type of product that is being
evaporated, the evaporator installation, the place of extraction, the efficiency of
operating personnel and the care they take. For example, it has been shown that the
BOD of vapour condensate produced from concentrating acid whey has been almost
14 times that of condensate produced from concentrating skim milk, which can limit
the opportunities for reuse: ‘In general it has been found that the condensate from
the earlier stages (effects) of an evaporator can be used after monitoring as boiler feed
water, with that from the later stages being suitable for washing floors and the
exterior of plant and vehicles.’ (IDF 1988) Generally, without further treatmentcondensate is classified as non-potable.
The IDF Bulletin 232 (IDF 1988) lists a number of requirements for the reuse of
condensate:
• Stable evaporation operation is the most important prerequisite for obtaining a
high-quality condensate.
• Continuous inspection and monitoring of the condensate quality is necessary. This is
usually done using conductivity and/or turbidity.
• It must be possible to chemically clean all the systems used to collect and convey the
condensate.
• Continuous supervision of the evaporation installation and treatment of vapour
condensate is important.
• Mixing of condensate with other types of water must be avoided, due to the potential
for rapid bacterial growth.
• If disinfection is required, condensate should be adequately and properly dosed with
disinfectant, with time allowed for additives to react.
7/30/2019 Eco Efficiency Manual
http://slidepdf.com/reader/full/eco-efficiency-manual 47/153
36 ECO-EFFICIENCY FOR THE DAIRY PROCESSING INDUSTRY
To utilise the maximum available volume of condensate — and depending on the
initial quality — further treatment may be needed before use. Methods used for
treating condensate include the addition of disinfectants such as silver ions, chlorine
and chlorine compounds, and P3-oxonia, as well as technologies such as carbon
filtration and ion exchange (IDF 1988). Reverse osmosis is used as a higher level of
treatment, to remove unwanted components and produce water that can be reused
in most areas of a dairy processing plant. This is discussed further in the next section.
Condensate is also often acidic, and may require caustic addition to increase the
pH — for example to prevent boiler corrosion if used as boiler feed water.
It has been found that the use of relatively clean condensate for cooling tower
make-up water can allow the growth of bacteria despite the use of biocides. This can
be explained by the relatively low conductivity of the condensate compared to town
water, and its effect on the frequency of boiler and cooling tower blowdown. As
blowdown is usually controlled on the basis of conductivity, the low conductivity of
condensate leads to less frequent blowdown and higher concentrations of organics,
which can encourage microbial growth. This can also increase the level of scaling andbuild-up in the boiler or cooling tower, decreasing the life of the equipment.
Condensate is a good source of heat energy, and should be utilised. Significant savings
in heating costs can be realised by recovering the heat energy for purposes such as
pre-heating product or boiler feed water. For best results, condensate recovery should
be integrated into the process at design stage to gain maximum economic benefit from
energy and water recovery. Further information can be found in Chapter 4, ‘Energy’.
For further reading see the IDF Bulletin No. 232/1988, The quality, treatment and use of
condensate and reverse osmosis permeates (IDF 1998).
Boiler condensate return systems
Water produced from the boiler system in the form of steam condensate should also be
recovered wherever possible, to reduce the amount of make-up water required by the
boiler. Reducing condensate loss can reduce water supply, chemical use and operating
costs by up to 70% (FEMP 2003). A condensate return system also reduces energy costs,
because the already hot condensate requires less energy to reheat. Steam traps,
condensate pumps and lines should be routinely inspected, while boiler systems should
be maintained to reduce blowdown and maintain boiler efficiency. More information
on boiler condensate return systems can be found in Chapter 4.
‘In sensitive areas of the plant, it was necessary to only use recaptured
condensate which has a low or no bacterial load.’ — Peter Ryan, Dairy Farmers,
Bomaderry
‘We have an EPA licence to send excess evaporator condensate water to the
Hunter River. The odour prevents us from using it in the boilers and other
products. We have capital works in progress that will enable us to use all of
the condensate water that we produce.’ — Garry Christie, Dairy Farmers, Hexham
7/30/2019 Eco Efficiency Manual
http://slidepdf.com/reader/full/eco-efficiency-manual 48/153
WATER 37
Challenges with recovery of condensate water: Bonlac, Spreyton
Bonlac at Spreyton recovers milk evaporator condensate, which is cooled before being sent
to process water tanks with mains water make-up. The water is sanitised by dosing and
recirculating with chlorine dioxide. Whey permeate evaporator condensate is recovered hot
and used to supplement boiler feedwater or hot water, or is sent to irrigation. The trace
organics in milk condensate rule out its use in some product contact applications. It was also
found that acidity of recovered condensate plus excess acid from chlorine dioxide dosing has
caused corrosion problems in non-stainless steel piping and equipment. It is important tospecify corrosion-resistant piping material and provide for pH adjustment.
Recovery of condensate water: Murray Goulburn Cooperative, Koroit
Murray Goulburn at Koroit installed a 1 million litre condensate water recovery tank and
automated the water recovery system. The installation has increased water-holding capacity
and reduced production downtime, due to having immediate access to a bulk supply of water
as opposed to waiting for town water. Downtime was also reduced as one of two condensate
tanks could be cleaned without shutting down the plant. Savings were approximately
88 000 kL/yr and $50 000/yr for an outlay of $200 000. Over 90% of water requirements are
now supplied by the condensate water. One issue with installation was setting up an
appropriate water treatment system to ensure the quality of the water.
Reuse of condensate water: Murray Goulburn, RochesterMurray Goulburn’s Rochester site recovers 190 ML/yr of condensate from the factory’s milk and
whey powder evaporators for use within the plant. Condensate cannot be recovered from all
the evaporators due to occasional product carryover. There are also issues with the low pH of
some condensate, which precipitates protein and leads to the growth of thermophilic bacteria.
Condensate water is blended with town water which is then chlorinated, filtered to remove
chlorine, and passed through an ion exchange bed to remove hardness before use.
Reuse of dryer condensate water: Murray Goulburn, Maffra
Murray Goulburn in Maffra introduced a water recovery and reuse program. Initiatives
included using condensate water from dryer air heaters for supplementing boiler and
de-aerator feed water; dryer wet scrubbers; indirect cooling in heat exchangers; pump
seal water; and external tanker CIP rinsing. Some of the condensate is treated with chlorine
dioxide and filtered before reuse. CIP final rinse water is also recovered and used for thefirst rinse on the next CIP. As a result, fresh water consumption for the factory has reduced
by 110 ML/yr and supplementary supplies of town water no longer need to be brought in by
tanker. The program has saved the company at least $59 000/yr in water costs, not including
tanker transport costs.
Condensate recovery, Dairy Farmers: Bomaderry
Dairy Farmers in Bomaderry are installing additional storage capacity to allow the collection
of 60 kL of condensate water per day. Currently 30 kL water of nearly distilled quality is sent
to the boiler for feed make-up. The rest of the condensate will be used as make-up water in
the operation of the crate washer. Savings in water costs are expected to be approximately
$12 000/yr. Additional savings, which could be high as $25 000, will be made from reduced
costs to irrigate and dispose of water. Potential problems with using the water are the volatile
organic odours and the small amount of dissolved salts coming off the wash cycles of theevaporator.
Discontinued use of condensate for cooling tower make-up: Bonlac, Spreyton
Bonlac in Spreyton previously recovered evaporator condensate for use as cooling tower
make-up. The low conductivity of the condensate meant that blowdown was less frequent
and traces of organics became more concentrated. Persistent contamination of the cooling
tower led to the decision to discontinue using condensate for cooling tower make-up.
7/30/2019 Eco Efficiency Manual
http://slidepdf.com/reader/full/eco-efficiency-manual 49/153
38 ECO-EFFICIENCY FOR THE DAIRY PROCESSING INDUSTRY
3.7.2 Use of membranes for water recovery
Membranes are commonly used within the dairy industry for the recovery of product,
chemicals or water. This section looks at the use of membranes to recover and reduce
the consumption of water. The use of membranes in dairy processing plants is covered
further in Chapter 5, ‘Yield optimisation and product recovery’.
Some dairy processing plants use reverse osmosis (RO) to polish evaporator condensate.
The filtration process removes trace elements, which can cause corrosion. It also
removes traces of product (from carryover), thus improving the quality of the permeate
and increasing the possibilities for reuse within the plant. Permeate produced from
membrane filtration can be used to supplement process water that is in contact with
product; however, it requires further treatment to make it potable quality and is more
commonly used for boiler and cooling tower water make-up. RO will not remove all
the BOD from the stream, but a 90–95% reduction is normally achieved (PCI-memtech
2000). A barrier to the use of membrane filtration for treating condensate water for
reuse is the cost of treatment compared with the cost of using fresh town water. For
example, it is estimated that the cost of treatment for one Victorian plant is around
90c/kL, whereas the cost of town water is only 69 c/kL (Matthew McGuiness 2004,
pers. comm.).
Membrane filtration is not suitable for recovering water from all waste streams. For
example, water recovered from whey permeates by reverse osmosis should not be used
in cheese factories because of the risk of bacteriophage, a virus that disrupts the cell
membranes of bacteria used in the cheese-making process (Peter Gross 2004, pers.
comm.). Bacteriophage infection can reduce the rate of fermentation in cheese-making
and lead to lower-quality cheese.
Water recovery using membranes: Murray Goulburn, Rochester
Murray Goulburn’s Rochester plant processes around 800 kL/day of whey to produce whey
powder and lactose powder. Whey is processed in ultrafiltration, nanofiltration and reverse
osmosis plants. The permeate from the RO plant is recycled to the factory as usable water.
Over a year the RO plant saves 70 000 kL ($32 000) in reduced water intake.
Challenges with RO permeate chlorinator: Murray Goulburn, Leitchville
At Murray Goulburn in Leitchville reverse osmosis (RO) permeate is chlorinated before being
used to supplement cooling tower and boiler water requirements. The reuse of the permeate
allowed mains water use to be reduced by 17%; however, the system had to be shut down
due to fouling problems with the membranes, which affected the quality of the permeate.
The initial cost of the system was $40 000, with a 12-month payback period. The chlorinationsystem is sized to treat 1 million litres of water per day. Challenges include the amount of
chlorination required and control of bacteria in the cooling towers.
Novel use of reverse osmosis water: Dairy Farmers, Malanda
Whey proteins are processed in a reverse osmosis plant at Dairy Farmers in Malanda. The
company installed pipework to allow water from the RO plant to be used in the laboratory.
This eliminated the need to produce 60 kL/week of distilled water (3 ML/yr), and saved $600
in water supply costs. The pipework installation cost $500.
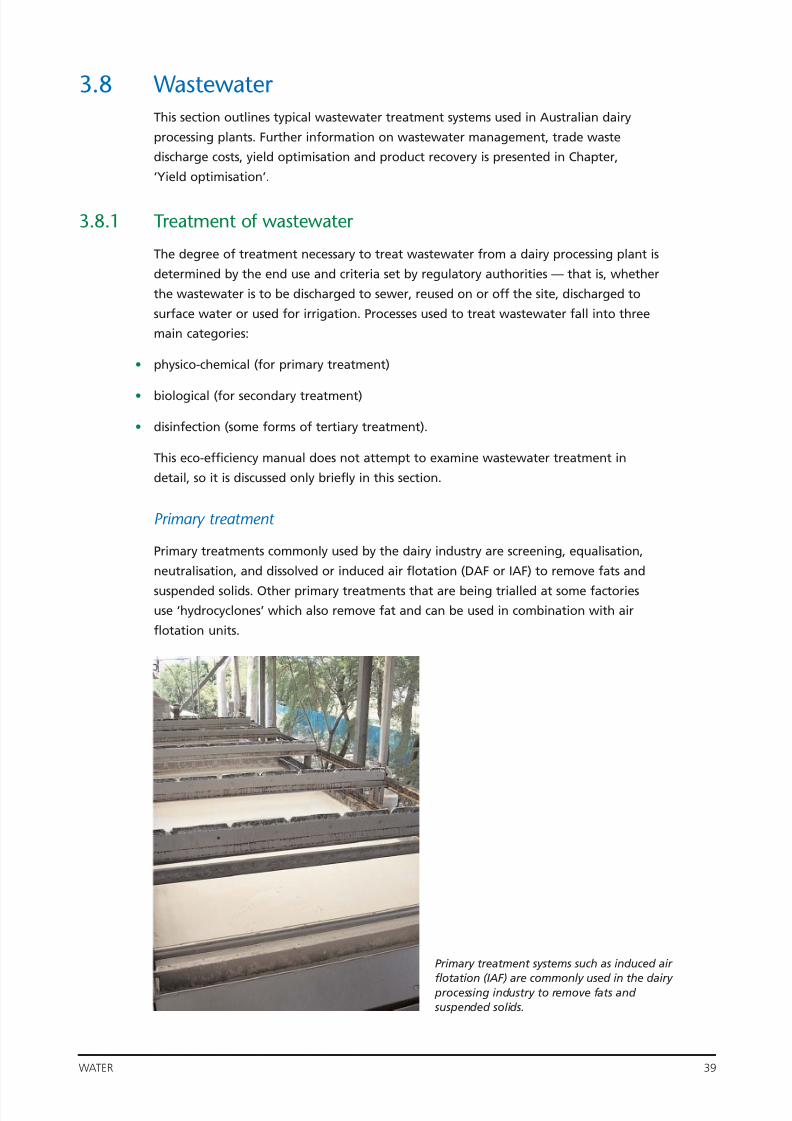
7/30/2019 Eco Efficiency Manual
http://slidepdf.com/reader/full/eco-efficiency-manual 50/153
WATER 39
3.8 Wastewater This section outlines typical wastewater treatment systems used in Australian dairy
processing plants. Further information on wastewater management, trade waste
discharge costs, yield optimisation and product recovery is presented in Chapter,
‘Yield optimisation’.
3.8.1 Treatment of wastewater
The degree of treatment necessary to treat wastewater from a dairy processing plant is
determined by the end use and criteria set by regulatory authorities — that is, whether
the wastewater is to be discharged to sewer, reused on or off the site, discharged to
surface water or used for irrigation. Processes used to treat wastewater fall into three
main categories:
• physico-chemical (for primary treatment)
• biological (for secondary treatment)
• disinfection (some forms of tertiary treatment).
This eco-efficiency manual does not attempt to examine wastewater treatment in
detail, so it is discussed only briefly in this section.
Primary treatment
Primary treatments commonly used by the dairy industry are screening, equalisation,
neutralisation, and dissolved or induced air flotation (DAF or IAF) to remove fats and
suspended solids. Other primary treatments that are being trialled at some factoriesuse ‘hydrocyclones’ which also remove fat and can be used in combination with air
flotation units.
Primary treatment systems such as induced air
flotation (IAF) are commonly used in the dairy processing industry to remove fats and suspended solids.

7/30/2019 Eco Efficiency Manual
http://slidepdf.com/reader/full/eco-efficiency-manual 51/153
7/30/2019 Eco Efficiency Manual
http://slidepdf.com/reader/full/eco-efficiency-manual 52/153
WATER 41
• opportunities for the system to recover valuable materials contained in the waste
stream
• opportunities to reuse water after treatment
• opportunities to recycle biosolids or effluent after treatment
• the ease with which the system can be operated
• the efficiency of the wastewater treatment system in meeting regulatory requirements
• the complexity of the process and risk of system failure.
Where financially viable, wastewater treatments should be selected that enable
existing and future opportunities for water reuse, product and energy recovery, and
effluent or biosolid recycling. Again, from an eco-efficiency perspective, the most
important step is to minimise the volume of wastewater and prevent waste from
entering the wastewater stream in the first place. This is discussed in more detail in
Chapter 5.
3.8.3 Reuse of treated wastewater for irrigation
Some wastewater streams from dairy processing plants in regional areas are used for
irrigation. The suitability of wastewater for irrigation can vary according to:
• the concentration of dissolved salts in the water, measured as electrical conductivity (EC)
• the concentrations of specific salts such as sodium, phosphate and nitrates
• soil type (e.g. permeability and how well it drains)
• crop type (e.g. salt tolerance of particular species)
• the climate (e.g. amount of leaching due to rainfall )
• method of irrigation (e.g. whether from overhead sprinklers, because wastewater with
high salt levels may cause leaf burn).
Zero discharge of wastewater: Bonlac Foods, Stanhope
Bonlac Foods in Stanhope will begin reusing 100% of its wastewater for irrigation in a project
focusing on the sustainable reuse of water. Previously the water was irrigated to land over
summer and to surface waters during winter. The project will involve building new storage
and treatment lagoons and preparing more than 250 hectares of land for irrigation.
Recovery of wastewater for ash sluicing: Bonlac Foods, Spreyton
Bonlac Foods in Spreyton uses considerable volumes of water to sluice ash from the coal-fired
boilers. A system was installed to recover treated wastewater for this purpose. Treated water
is visually clear after treatment by the DAF plant, but has a moderately high dissolved BOD
content. The system includes strainers to protect the pump and valves, and has an automatic
backup supply of process water. The cost of the system is $34 000, with anticipated savings of$15 000/yr in water and trade waste charges.
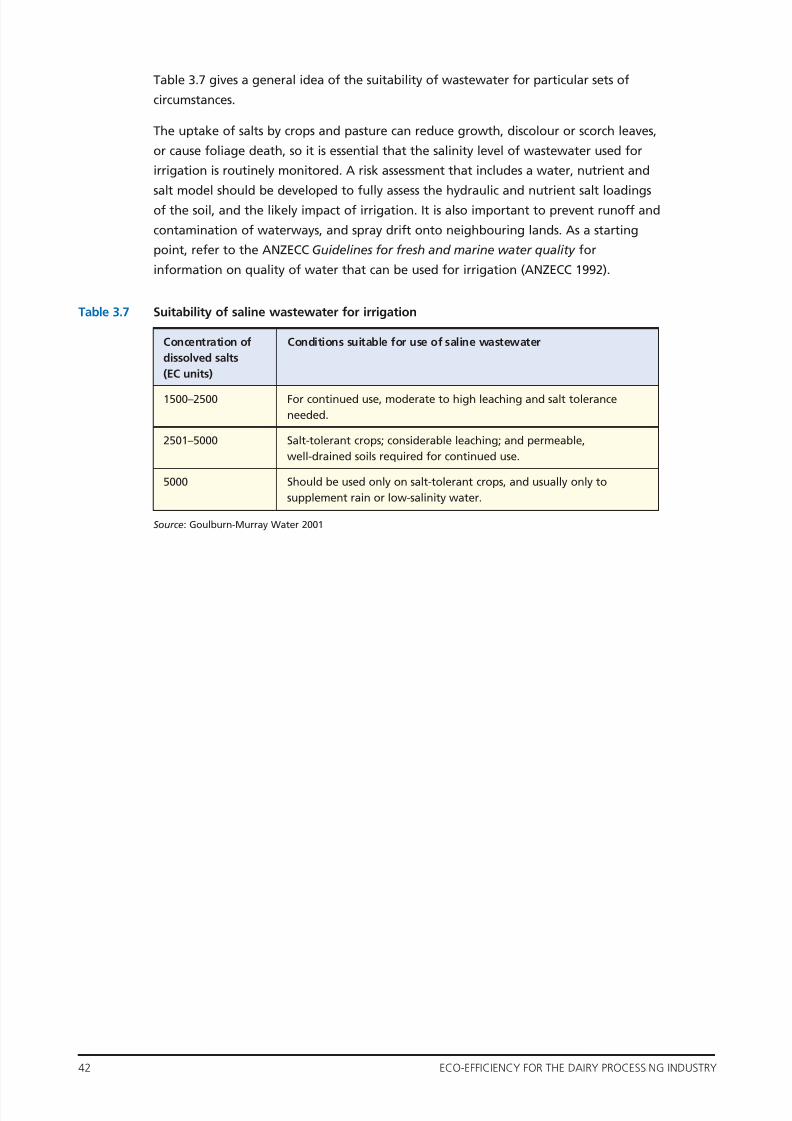
7/30/2019 Eco Efficiency Manual
http://slidepdf.com/reader/full/eco-efficiency-manual 53/153
42 ECO-EFFICIENCY FOR THE DAIRY PROCESSING INDUSTRY
Table 3.7 gives a general idea of the suitability of wastewater for particular sets of
circumstances.
The uptake of salts by crops and pasture can reduce growth, discolour or scorch leaves,
or cause foliage death, so it is essential that the salinity level of wastewater used for
irrigation is routinely monitored. A risk assessment that includes a water, nutrient and
salt model should be developed to fully assess the hydraulic and nutrient salt loadingsof the soil, and the likely impact of irrigation. It is also important to prevent runoff and
contamination of waterways, and spray drift onto neighbouring lands. As a starting
point, refer to the ANZECC Guidelines for fresh and marine water quality for
information on quality of water that can be used for irrigation (ANZECC 1992).
Table 3.7 Suitability of saline wastewater for irrigation
Source: Goulburn-Murray Water 2001
Concentration of Conditions suitable for use of saline wastewater
dissolved salts
(EC units)
1500–2500 For continued use, moderate to high leaching and salt tolerance
needed.
2501–5000 Salt-tolerant crops; considerable leaching; and permeable,
well-drained soils required for continued use.
5000 Should be used only on salt-tolerant crops, and usually only to
supplement rain or low-salinity water.

7/30/2019 Eco Efficiency Manual
http://slidepdf.com/reader/full/eco-efficiency-manual 54/153
ENERGY 43
4 Energy
4.1 Overview of energy use
The dairy manufacturing industry has radically improved its energy efficiency over thelast 20 years (in some cases by as much as 50%) through industry-wide upgrading of
equipment and the closure of smaller, less efficient factories (Lunde et al. 2003). Dairy
factories still use significant amounts of energy, depending on the types of products
manufactured. Dairy factories producing mainly market milk use energy for heating
and pasteurisation, cooling and refrigeration, lighting, airconditioning, pumping, and
operating processing and auxiliary equipment. Factories producing concentrated milk
products, cheese, whey or powders require additional energy for churning, pressing,
separation, concentration, evaporation and drying.
The sources of energy in Australian dairy processing plants are generally electricity and
thermal energy from fossil fuels including coal, oil, natural gas and LPG, while a small
number of plants supplement fuel supplies with biogas. In this section, energy use has
been analysed for three categories of dairy processing plants: those where the primary
product is white or flavoured milk, those that primarily produce cheese and whey, and
those that produce mainly powdered products.1 Table 4.1 shows typical percentages of
energy supplied from electricity and other fuels used to produce thermal energy
(i.e. steam for Australian dairy plants surveyed during this project).
Table 4.1 Proportions of electricity and thermal energy use
* excluding powders
Table 4.2 shows total use of energy (electrical and thermal) per kL of raw milk intake.
As the table shows, these figures vary by around 18% for liquid milk plants and over
500% for plants producing mainly powders. The wide variation for powdered plants is
mainly due to the differences in evaporating technology used. The median of thesefigures is around 45–65% of typical energy consumption in dairies in the UK. The
Australian data also compares favourably with figures quoted by the International
Dairy Federation. Electricity consumption for a range of plants was 0.22–0.47 GJ/t milk
treated, and thermal energy consumption was 2.88–5.40 GJ (Kjaergaard-Jensen 1999);
these are significantly higher than the Australian figures. In Canada, average electricity
use was 0.61 GJ/kL for a liquid milk plant and 0.36 GJ/kL for a cheese, whey, powder
plant, while for thermal use the figures were 1.06 GJ/kL and 1.07–1.38 GJ/kL
respectively (Wardrop Engineering 1997); these are closer to the Australian data.
1 Energy data is based on a survey of Australian dairy processors. Figures are for a total of 17 plants including1 5 primarily milk producers, 3 cheese and whey and 9 mainly powder producers.
Electricity (%) Thermal (%)
Milk only 66 34
Cheese and whey products* 27 73
Mainly powders 21 79

7/30/2019 Eco Efficiency Manual
http://slidepdf.com/reader/full/eco-efficiency-manual 55/153

7/30/2019 Eco Efficiency Manual
http://slidepdf.com/reader/full/eco-efficiency-manual 56/153
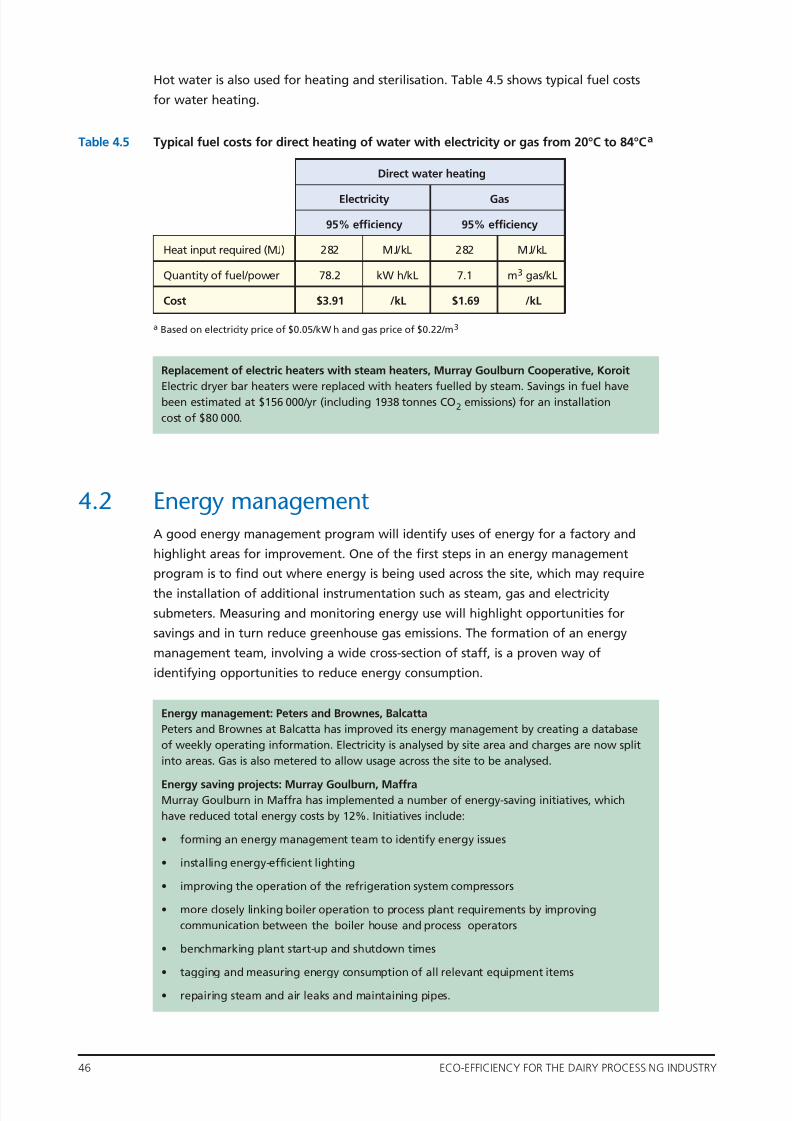
7/30/2019 Eco Efficiency Manual
http://slidepdf.com/reader/full/eco-efficiency-manual 57/153
46 ECO-EFFICIENCY FOR THE DAIRY PROCESSING INDUSTRY
Hot water is also used for heating and sterilisation. Table 4.5 shows typical fuel costs
for water heating.
Table 4.5 Typical fuel costs for direct heating of water with electricity or gas from 20°C to 84°C a
a Based on electricity price of $0.05/kW h and gas price of $0.22/m3
4.2 Energy managementA good energy management program will identify uses of energy for a factory and
highlight areas for improvement. One of the first steps in an energy management
program is to find out where energy is being used across the site, which may require
the installation of additional instrumentation such as steam, gas and electricity
submeters. Measuring and monitoring energy use will highlight opportunities for
savings and in turn reduce greenhouse gas emissions. The formation of an energy
management team, involving a wide cross-section of staff, is a proven way of
identifying opportunities to reduce energy consumption.
Direct water heating
Electricity Gas
95% efficiency 95% efficiency
Heat input required (MJ) 282 MJ/kL 282 MJ/kL
Quantity of fuel/power 78.2 kW h/kL 7.1 m3 gas/kL
Cost $3.91 /kL $1.69 /kL
Replacement of electric heaters with steam heaters, Murray Goulburn Cooperative, Koroit
Electric dryer bar heaters were replaced with heaters fuelled by steam. Savings in fuel have
been estimated at $156 000/yr (including 1938 tonnes CO2 emissions) for an installation
cost of $80 000.
Energy management: Peters and Brownes, Balcatta
Peters and Brownes at Balcatta has improved its energy management by creating a database
of weekly operating information. Electricity is analysed by site area and charges are now split
into areas. Gas is also metered to allow usage across the site to be analysed.
Energy saving projects: Murray Goulburn, MaffraMurray Goulburn in Maffra has implemented a number of energy-saving initiatives, which
have reduced total energy costs by 12%. Initiatives include:
• forming an energy management team to identify energy issues
• installing energy-efficient lighting
• improving the operation of the refrigeration system compressors
• more closely linking boiler operation to process plant requirements by improving
communication between the boiler house and process operators
• benchmarking plant start-up and shutdown times
• tagging and measuring energy consumption of all relevant equipment items
• repairing steam and air leaks and maintaining pipes.
7/30/2019 Eco Efficiency Manual
http://slidepdf.com/reader/full/eco-efficiency-manual 58/153
ENERGY 47
Demand management
There are substantial savings possible through managing the electricity demand of the
plant. Demand charges are based on the largest amount of electricity consumed in any
single demand period (e.g. 15 minutes) during the billing period. Demand charges can
therefore be decreased by managing the operation of equipment to utilise off-peak
supplies, load shedding, and staggering the start-up times of large equipment items
such as compressors or dryers. Soft starters on motors will also flatten out power
demand during start-up.
4.3 Reducing the demand for steam and hot water
4.3.1 Evaporation
Evaporators are commonly used in dairy processing plants to concentrate heat-treated
milk from approximately 10% to around 50% total solids. Figure 4.3 shows a schematic
of a falling film evaporator typically used by the industry. Evaporators may be single- or
multiple-stage (effect) where energy savings are made by using the vapour from the
first effect to heat product in the second, and so on. Energy consumption is reduced by
increasing the number of effects, up to as many as seven for large factories in Europe
(ETSU 1998). Thermal vapour recompressors (TVRs) further reduce energy usage by
using a steam ejector to compress the vapour, increasing its temperature and pressure
before utilising its evaporative energy. Mechanical vapour recompressors (MVRs), which
use a motor or mechanically driven compressor, are even more energy-efficient than
TVRs, even though additional electrical energy is required to operate the compressor.
The most energy-efficient evaporators use a combination of multi-stage design andmechanical vapour recompression. Table 4.6 shows a comparison of energy
Product scheduling improvements save energy: National Foods, Penrith
National Foods in Penrith, by improving product scheduling and increasing throughput of the
factory, has also saved in energy and water for washing the pasteuriser. Operating procedures
dictate that the pasteuriser is cleaned every 9–14 hours, depending on the type of product.
The product scheduling improvements have reduced the time for which the pasteuriser
switches to recirculation mode (effectively not producing product), thereby reducing energy
and water consumption per unit of product.
Reducing power demand: Murray Goulburn Cooperative, Leongatha
Murray Goulburn in Leongatha conducted an electrical energy audit. The survey provided a
better understanding of electrical load characteristics, an opportunity to better manage peak
loads, and a basis for future selection characteristics for electrical equipment. The audit
provided the framework for better managing variable production inputs. Potential savings
in demand charges were estimated at $100 000. Challenges include having people underst
and the ramifications of their actions when plant is started, and potential costs.
Improved start-up procedures: Murray Goulburn Cooperative, Koroit
A procedure was developed for plant start-up after power flicks at Murray Goulburn’s Koroit
plant; this resulted in savings due to reduced peak loadings. Large equipment items are nowstarted in sequence, which has reduced the maximum demand of the site.

7/30/2019 Eco Efficiency Manual
http://slidepdf.com/reader/full/eco-efficiency-manual 59/153
48 ECO-EFFICIENCY FOR THE DAIRY PROCESSING INDUSTRY
requirements for four combinations of evaporators. A study of five Australian milk
powder factories indicated that a combination of TVRs, MVRs, multiple-stage
evaporators (up to five) and multiple-stage dryers are currently used by the industry
(Lunde et al. 2003).
Figure 4.3 Single-effect falling film
evaporator schematic
Source: Tetra Pak Handbook, 1995
Table 4.6 Energy consumption of multi-effect evaporators and vapour recompression
a Joyce 1993
b ETSU 1998
Technology Typical specific energy consumption
Triple-effect evaporation 0.14 kW h per kg water evaporateda
Five-effect evaporation 0.085 kW h per kg water evaporateda
TVR + triple-effect evaporation 0.12–0.15 kW h per kg water evaporatedb
MVR + triple-effect evaporation 0.01–0.02 kW h per kg water evaporatedb
Use of mechanical vapour recompression: dairy processor, Japan
Meiji Milk Products in Japan replaced a thermal vapour recompression evaporator (TVR) with
a mechanical vapour recompression (MVR) system, and reduced evaporator operating costs by
75%. The MVR was installed on a four-effect evaporator with an evaporation rate of 30 t/h. The
TVR had operating costs of US$680 000/yr, while the MVR required only US$175 000/yr. The cost
of the new MVR was US$1.5 million compared to US$1.3 million for a new TVR evaporator.
Source: CADDET 1992
7/30/2019 Eco Efficiency Manual
http://slidepdf.com/reader/full/eco-efficiency-manual 60/153
ENERGY 49
4.3.2 Membrane concentration
Membranes are often used to concentrate dairy streams in preparation for further
processing. For example, ultrafiltration (UF), nanofiltration (NF) and reverse osmosis (RO)
membranes have been used to concentrate whole milk, skim milk, whey and protein
streams (Koch 2004; PCI-memtech 2000). Membrane processes are energy-efficient for
concentration, with typical energy consumption around 0.004–0.01 kW h per kg ofwater removed (ETSU 1998), which is significantly more economical than using
evaporation methods (Table 4.6). However, there are economic limitations to
the level of concentration that can be attained, to the point where it is financially
preferable to use traditional evaporation methods. For example, whey is concentrated
up to 18–27% because beyond that range process performance is reduced, due to the
high osmotic pressure, high retentate viscosity, lactose crystallisation and calcium
phosphate precipitation (Daufin et al. 2001). The more concentrated the retentate,
the higher is the pressure and the more robust the membranes required for filtration.
Membranes have been used to concentrate streams to up 55% total solids (PCI-memtech
2000), primarily determined by viscosity and fouling considerations. Pumping equipmentwill also be more energy-intensive, which will lead to higher operating costs. Further
information on membranes can be found in ‘Cost-effective membrane technologies
for minimising wastes and effluents’ (WS Atkins Consultants Ltd 1997).
4.3.3 Spray drying
Spray drying is used extensively by the dairy industry for producing powdered milk,
whey and cheese. It involves atomising the feed into a spray of droplets which are put
into contact with hot air in a drying chamber. Spray dryers are usually used in
conjunction with evaporators, and dry product from around 50% solids through to
97% solids. The energy consumed in spray drying is reported at around 0.05–0.1 kW h
per kg of water removed (ETSU 1998). Dryers may be co-current, counter-current and
mixed flow, with sprays produced by a rotary (wheel) atomiser or nozzle atomiser
(Schuck 2002). Spray dryers may be single, two-stage or multi-stage, with the latter
being the most energy-efficient but also the most capital-intensive. Second and later
stages use fluidised bed drying, which is more energy-efficient.
Thickening and desalinating whey in the dairy industry: dairy processor, The Netherlands1
Before food ingredients can be made out of whey, the original thin liquid must be
concentrated and desalinated. A whey processing plant in The Netherlands has installed
a nanofiltration unit to perform part of the total thickening process. The membrane filter
replaces an evaporator and ion exchanger; this increases the solids content of the whey from
5.5% to 17%, and removes 70% of the salt content with the permeate. Steam consumption
for the old system was 436 m3 natural gas equivalent (NGE) per tonne dry solids, and electricityconsumption was 11.5 m3 NGE/t. Steam use for the new system has decreased to 120 m3 NGE/t
but electricity consumption has increased to 19.2 m3 NGE/t. Net energy savings are 308 m3
NGE/t, which equates to around 70% of the original energy consumption. In addition there
were savings in chemical and water use for cleaning. The payback period was 1.3 years.1
1 CADDET 1999
7/30/2019 Eco Efficiency Manual
http://slidepdf.com/reader/full/eco-efficiency-manual 61/153
50 ECO-EFFICIENCY FOR THE DAIRY PROCESSING INDUSTRY
A useful measure of the dryer efficiency is specific energy consumption (SEC), which
measures how much energy is required per kilogram of water evaporated from the
feed, where:
SEC (kJ/kg) = rate of energy consumption of dryer (kW) / rate of evaporation of dryer kg/s
The evaporative rate, E , in kg vapour/s is given by:
E = W S ( X 1 – X 0) where
W S = dry solids feed rate and X 1 and X 0 are the moisture contents of the input and
output streams defined as a fraction of the dry solids weight.
The rate of energy consumption should be routinely monitored and compared against
other similar spray dryers. Tips for the efficient operation of a spray dryer include:
• operating the plant at full design rating
• maximising the solids content of the milk concentrate, to achieve good atomisation at
the spray nozzle or atomiser
• minimising the loss of waste heat from the exhaust (It is desirable to use high inlet air
temperatures and low exhaust air temperatures, to achieve the required degree of
drying. This can be achieved through two-stage drying, where a fluid bed dryer is
installed to reduce residual moisture content of the product to an acceptable level,
hence allowing the dryer to run with lower exhaust air temperatures.)
• recovering waste heat by installing a recuperator that uses exhaust air to pre-heat the
inlet air
• investigating ways of pre-heating the milk concentrate.
There can be problems with recuperating waste heat, due to the presence of
particulates in the exhaust air stream and the tendency for fouling, which causes
hygiene problems. This technology is no longer in use in Australian dairy factories
for this reason. A more detailed discussion on heat recovery systems and the efficient
operation of spray dryers can be found in Good Practice Guide 185 of the UK Energy
Efficiency Best Practice Programme, Spray drying (ETSU 1996).
The energy efficiency of the dryer can be maximised by maximising the solids content
of the feed — for example, operating at 40% solids instead of 30% reduces the heat
input by 36% (ETSU 1996).
As a rule of thumb, every 0.5% increase in feedstock
solids reduces energy consumption by 2%.
ETSU 1996
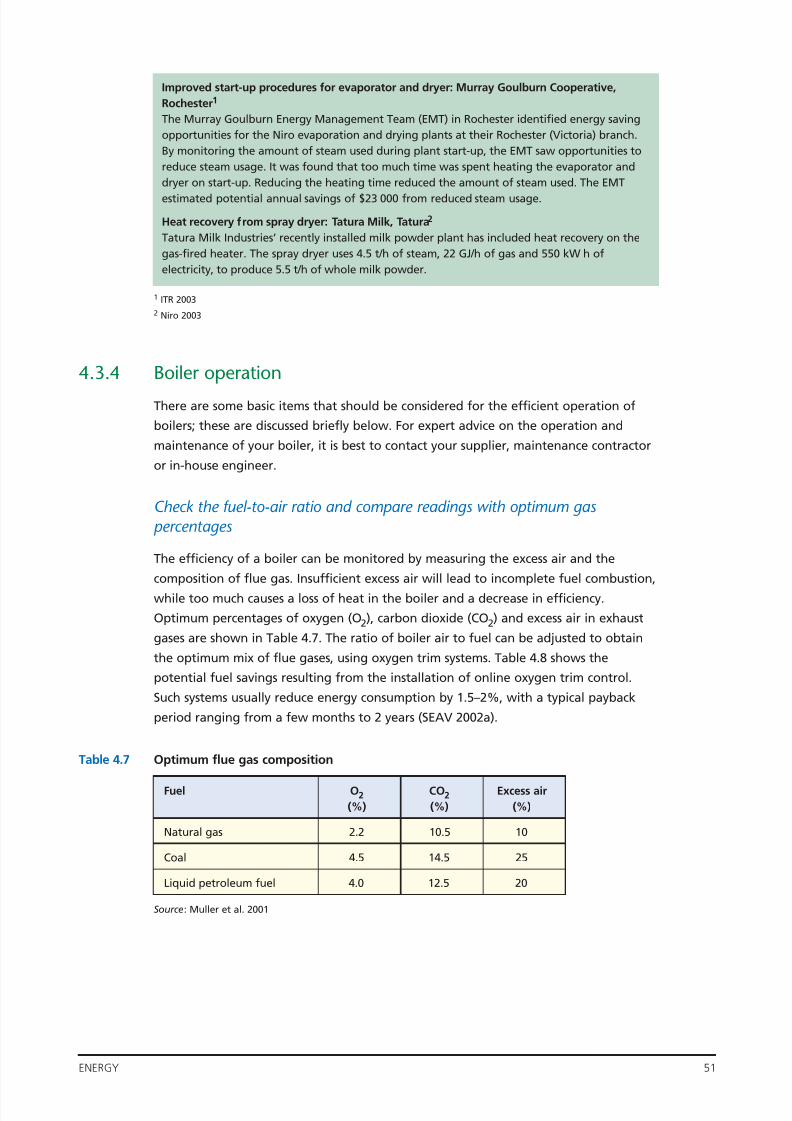
7/30/2019 Eco Efficiency Manual
http://slidepdf.com/reader/full/eco-efficiency-manual 62/153
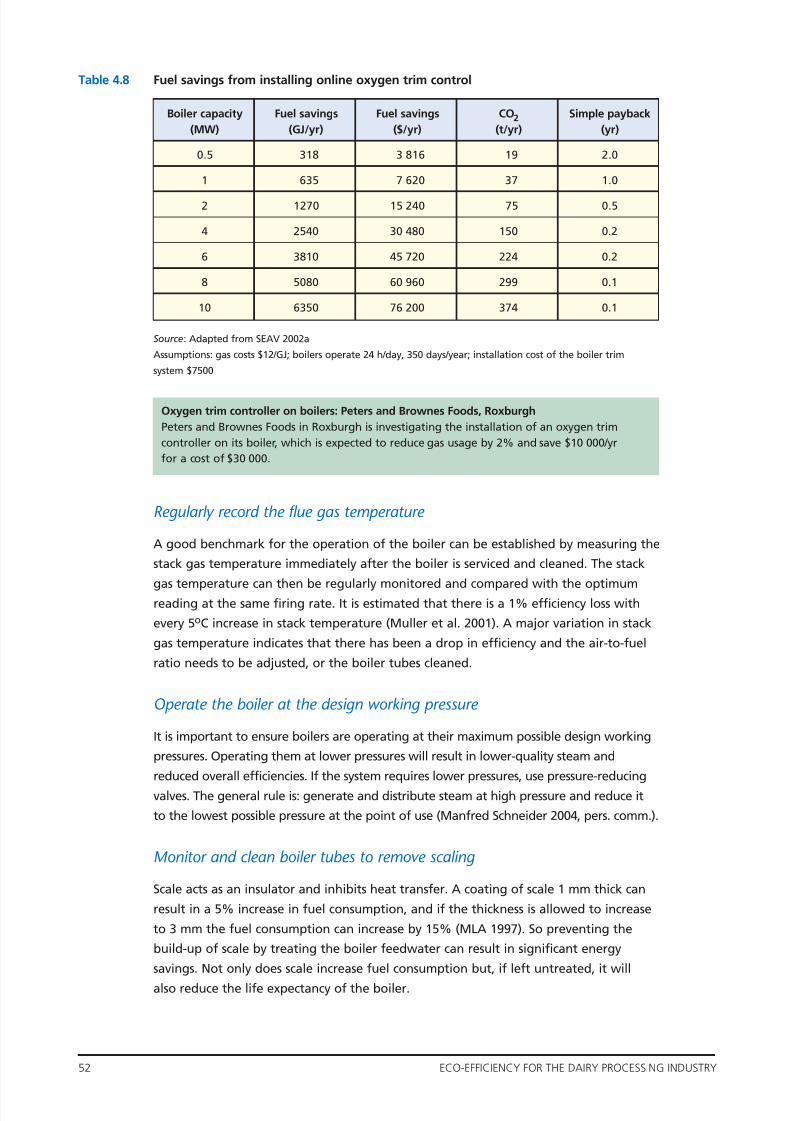
7/30/2019 Eco Efficiency Manual
http://slidepdf.com/reader/full/eco-efficiency-manual 63/153
52 ECO-EFFICIENCY FOR THE DAIRY PROCESSING INDUSTRY
Table 4.8 Fuel savings from installing online oxygen trim control
Source: Adapted from SEAV 2002a
Assumptions: gas costs $12/GJ; boilers operate 24 h/day, 350 days/year; installation cost of the boiler trim
system $7500
Regularly record the flue gas temperature
A good benchmark for the operation of the boiler can be established by measuring the
stack gas temperature immediately after the boiler is serviced and cleaned. The stack
gas temperature can then be regularly monitored and compared with the optimumreading at the same firing rate. It is estimated that there is a 1% efficiency loss with
every 5oC increase in stack temperature (Muller et al. 2001). A major variation in stack
gas temperature indicates that there has been a drop in efficiency and the air-to-fuel
ratio needs to be adjusted, or the boiler tubes cleaned.
Operate the boiler at the design working pressure
It is important to ensure boilers are operating at their maximum possible design working
pressures. Operating them at lower pressures will result in lower-quality steam and
reduced overall efficiencies. If the system requires lower pressures, use pressure-reducing
valves. The general rule is: generate and distribute steam at high pressure and reduce it
to the lowest possible pressure at the point of use (Manfred Schneider 2004, pers. comm.).
Monitor and clean boiler tubes to remove scaling
Scale acts as an insulator and inhibits heat transfer. A coating of scale 1 mm thick can
result in a 5% increase in fuel consumption, and if the thickness is allowed to increase
to 3 mm the fuel consumption can increase by 15% (MLA 1997). So preventing the
build-up of scale by treating the boiler feedwater can result in significant energy
savings. Not only does scale increase fuel consumption but, if left untreated, it will
also reduce the life expectancy of the boiler.
Boiler capacity Fuel savings Fuel savings CO2 Simple payback
(MW) (GJ/yr) ($/yr) (t/yr) (yr)
0.5 318 3 816 19 2.0
1 635 7 620 37 1.0
2 1270 15 240 75 0.5
4 2540 30 480 150 0.2
6 3810 45 720 224 0.2
8 5080 60 960 299 0.1
10 6350 76 200 374 0.1
Oxygen trim controller on boilers: Peters and Brownes Foods, Roxburgh
Peters and Brownes Foods in Roxburgh is investigating the installation of an oxygen trim
controller on its boiler, which is expected to reduce gas usage by 2% and save $10 000/yr
for a cost of $30 000.
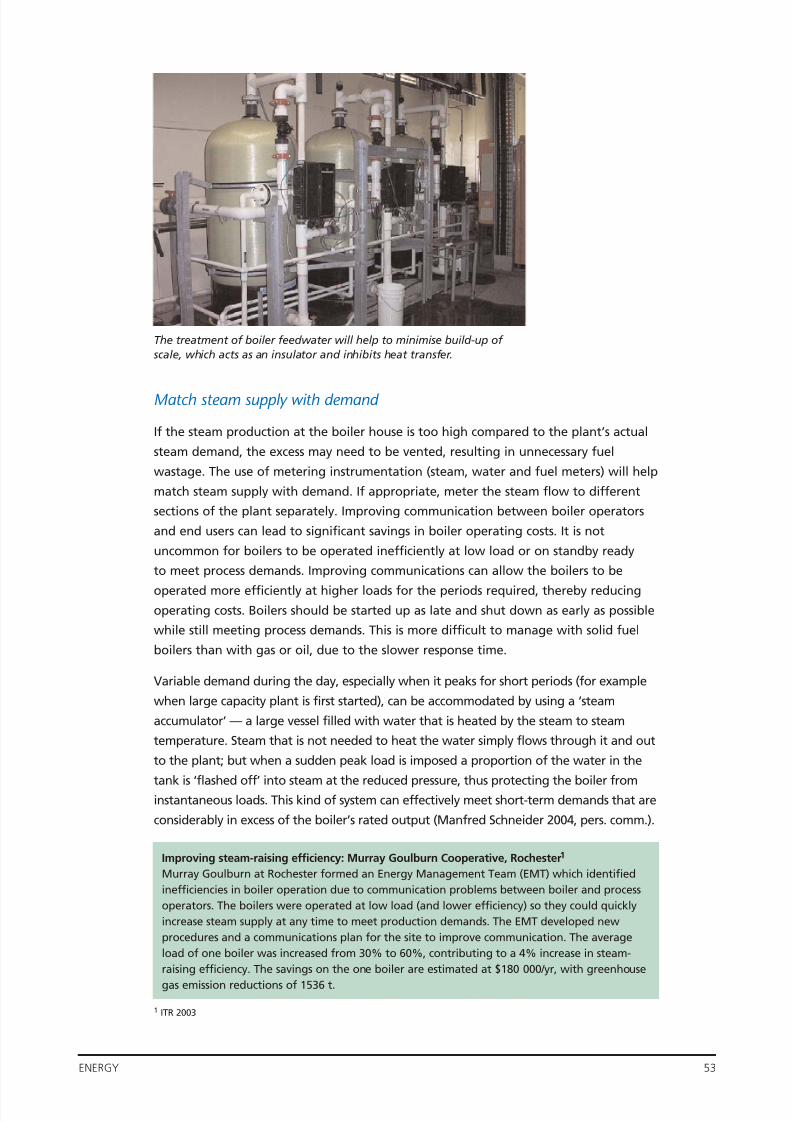
7/30/2019 Eco Efficiency Manual
http://slidepdf.com/reader/full/eco-efficiency-manual 64/153
ENERGY 53
Match steam supply with demand
If the steam production at the boiler house is too high compared to the plant’s actual
steam demand, the excess may need to be vented, resulting in unnecessary fuel
wastage. The use of metering instrumentation (steam, water and fuel meters) will help
match steam supply with demand. If appropriate, meter the steam flow to different
sections of the plant separately. Improving communication between boiler operators
and end users can lead to significant savings in boiler operating costs. It is not
uncommon for boilers to be operated inefficiently at low load or on standby ready
to meet process demands. Improving communications can allow the boilers to be
operated more efficiently at higher loads for the periods required, thereby reducingoperating costs. Boilers should be started up as late and shut down as early as possible
while still meeting process demands. This is more difficult to manage with solid fuel
boilers than with gas or oil, due to the slower response time.
Variable demand during the day, especially when it peaks for short periods (for example
when large capacity plant is first started), can be accommodated by using a ‘steam
accumulator’ — a large vessel filled with water that is heated by the steam to steam
temperature. Steam that is not needed to heat the water simply flows through it and out
to the plant; but when a sudden peak load is imposed a proportion of the water in the
tank is ‘flashed off’ into steam at the reduced pressure, thus protecting the boiler frominstantaneous loads. This kind of system can effectively meet short-term demands that are
considerably in excess of the boiler’s rated output (Manfred Schneider 2004, pers. comm.).
The treatment of boiler feedwater will help to minimise build-up of
scale, which acts as an insulator and inhibits heat transfer.
Improving steam-raising efficiency: Murray Goulburn Cooperative, Rochester1
Murray Goulburn at Rochester formed an Energy Management Team (EMT) which identified
inefficiencies in boiler operation due to communication problems between boiler and process
operators. The boilers were operated at low load (and lower efficiency) so they could quickly
increase steam supply at any time to meet production demands. The EMT developed new
procedures and a communications plan for the site to improve communication. The average
load of one boiler was increased from 30% to 60%, contributing to a 4% increase in steam-
raising efficiency. The savings on the one boiler are estimated at $180 000/yr, with greenhouse
gas emission reductions of 1536 t.
1 ITR 2003
7/30/2019 Eco Efficiency Manual
http://slidepdf.com/reader/full/eco-efficiency-manual 65/153
54 ECO-EFFICIENCY FOR THE DAIRY PROCESSING INDUSTRY
4.3.5 Steam delivery
Rectification of steam leaks
Leaks allow live steam to be wasted, causing more steam production to be required to
meet the plant’s needs. As more replacement feedwater is required, more fuel is used
for heating and more chemicals are needed for treatment. For example, a hole 1 mmin diameter in a steam line at 700 kPa will lead to a annual loss of 3000 L of fuel oil or
4300 m3 of natural gas, equating to around $2000 (SEAV 2002b).
Boiler condensate return systems
Boiler condensate (as opposed to evaporator condensate) contains valuable heat energy.
It should be returned to the boiler feed tank to save water and utilise this energy, unless
it is excessively contaminated with product or corrosive elements. If it is contaminated,
the heat it contains could be recovered (e.g. via a heat exchanger to the cold make-up
water). If contamination is only a possibility, various contamination detection systems
are available (usually conductivity meters) to enable its normal recovery or rejection to
waste if contaminated. A 5°C increase in the temperature of the feedwater will save
around 1% of the fuel used to raise steam (SEAV 2002a). In addition, the water has
usually been chemically treated already, thus saving treatment costs.
Condensate return systems are often designed with flash vessels to allow for the
re-evaporation of condensate into steam (referred to as flashing). The flash vessels
also remove non-condensable gases such as air and CO2. If these gases remain in the
equipment being heated, the gases form pockets that insulate the heat transfer surface
and decrease boiler efficiency (Graham Smith 2004, pers. comm.). The steam in theflash vessels can be used as a low-grade heat source.
Elimination of steam leaks: Bonlac Foods, Spreyton
Bonlac Foods in Spreyton generates steam and distributes it at 4000 kPa — the pressure
required for spray dryer air heating. All other duties use steam at 1000 kPa which is produced
at four ‘letdown’ stations located near the points of use. Design faults at the letdown stations
allowed continual leakage of steam. The stations were rebuilt with heavy-duty automated
isolating valves and improved design. The improvements saved $71 300 in coal supply costs.
The cost of implementation was $147 000. The completion of the project was delayed by the
difficulty in scheduling windows in the production schedule to allow installation; but theproject could have been avoided if the design of the steam equipment had been examined
more critically during construction.

7/30/2019 Eco Efficiency Manual
http://slidepdf.com/reader/full/eco-efficiency-manual 66/153
ENERGY 55
Maintenance of steam traps
A steam trap is an automatic valve for removal of condensate from a steam system.In the presence of steam it closes, preventing steam from being passed through it and
being wasted before it has given up its heat and condensed. In the presence of water
it opens, allowing the discharge of condensate. Depending on its type, it may also
open to discharge non-condensable gases. Where feasible, condensate removed from
steam traps should be returned to the boiler feed tank as previously discussed. Regular
testing and maintenance of steam traps and condensate lines saves money and time
as well as improving operating efficiency. Traps can be checked by plant staff or an
outside contractor. Traps that are losing steam can waste thousands of dollars a year,
usually far more than the cost of their replacement or repair (Smith 2004, pers. comm.).
‘Be proactive. The savings are the result of fixing a large number of small
out-of-the-way items.’ — Ted Isaacs, Murray Goulburn Cooperative, Leongatha
Rationalisation of boiler use and steam lines
For some older factories that have progressively expanded over the years, steam supply
lines may not take the most direct route from the boiler to the point of use. This results
in a greater length of steam pipework than is really required and greater opportunity
for heat loss and leaks. Rationalising steam and condensate pipework can lead to
savings in boiler operating costs. A review of boiler use may also identify the need
for a boiler upgrade or even replacement.
Condensate return: National Foods Ltd, Murray Bridge
At National Foods in Murray Bridge a system was installed to recapture condensate from the
large steam users and return it to the boiler. This has reduced the running costs of the boiler
and reduced the use of boiler chemicals. Challenges included installing the pumps and
pipework for the return line to the boilers on an existing system. Condensate return lines
should be installed with the boiler, saving time and effort upfront.
Improved condensate return: Murray Goulburn, Rochester
1
Murray Goulburn in Rochester, as part of the Energy Efficiency Best Practice project of the
Australian Government Department of Industry, Tourism and Resources (ITR), identified savings
of around $200 000/yr in natural gas costs by improving the efficiency of the condensate
return system, repairing steam leaks and improving maintenance of pipes. By insulating
condensate return pipes, boiler feedwater temperature could be increased from 45°C to 65°C,
thereby increasing the boiler efficiency by 3.3%.
1 ITR 2003
Steam system audit: Murray Goulburn Cooperative, Leongatha
Murray Goulburn in Leongatha undertook a steam system audit to review the efficiency of the
many steam traps. It cost the plant $10 000 to eliminate the faulty/leaking traps. Savings have
not been quantified.
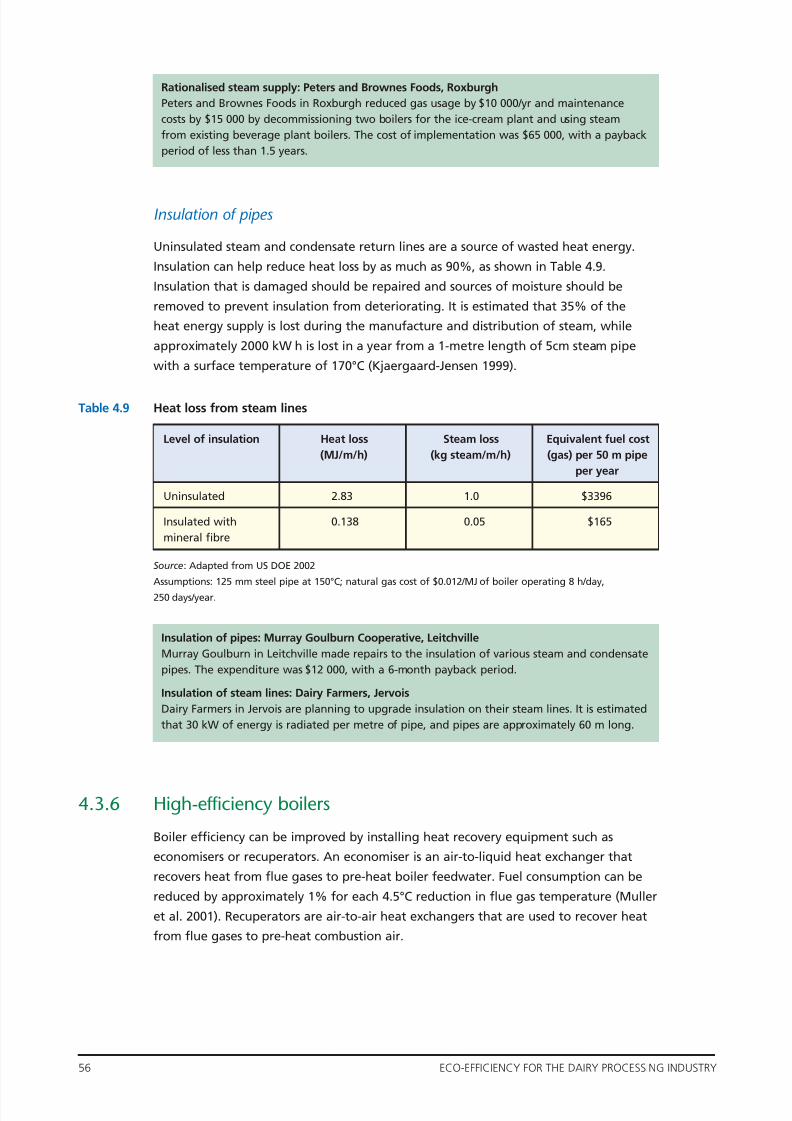
7/30/2019 Eco Efficiency Manual
http://slidepdf.com/reader/full/eco-efficiency-manual 67/153
56 ECO-EFFICIENCY FOR THE DAIRY PROCESSING INDUSTRY
Insulation of pipes
Uninsulated steam and condensate return lines are a source of wasted heat energy.
Insulation can help reduce heat loss by as much as 90%, as shown in Table 4.9.
Insulation that is damaged should be repaired and sources of moisture should be
removed to prevent insulation from deteriorating. It is estimated that 35% of the
heat energy supply is lost during the manufacture and distribution of steam, while
approximately 2000 kW h is lost in a year from a 1-metre length of 5cm steam pipe
with a surface temperature of 170°C (Kjaergaard-Jensen 1999).
Table 4.9 Heat loss from steam lines
Source: Adapted from US DOE 2002
Assumptions: 125 mm steel pipe at 150°C; natural gas cost of $0.012/MJ of boiler operating 8 h/day,
250 days/year.
4.3.6 High-efficiency boilers
Boiler efficiency can be improved by installing heat recovery equipment such as
economisers or recuperators. An economiser is an air-to-liquid heat exchanger that
recovers heat from flue gases to pre-heat boiler feedwater. Fuel consumption can be
reduced by approximately 1% for each 4.5°C reduction in flue gas temperature (Muller
et al. 2001). Recuperators are air-to-air heat exchangers that are used to recover heat
from flue gases to pre-heat combustion air.
Rationalised steam supply: Peters and Brownes Foods, Roxburgh
Peters and Brownes Foods in Roxburgh reduced gas usage by $10 000/yr and maintenance
costs by $15 000 by decommissioning two boilers for the ice-cream plant and using steam
from existing beverage plant boilers. The cost of implementation was $65 000, with a payback
period of less than 1.5 years.
Level of insulation Heat loss Steam loss Equivalent fuel cost
(MJ/m/h) (kg steam/m/h) (gas) per 50 m pipe
per year
Uninsulated 2.83 1.0 $3396
Insulated with 0.138 0.05 $165
mineral fibre
Insulation of pipes: Murray Goulburn Cooperative, Leitchville
Murray Goulburn in Leitchville made repairs to the insulation of various steam and condensate
pipes. The expenditure was $12 000, with a 6-month payback period.
Insulation of steam lines: Dairy Farmers, Jervois
Dairy Farmers in Jervois are planning to upgrade insulation on their steam lines. It is estimated
that 30 kW of energy is radiated per metre of pipe, and pipes are approximately 60 m long.
7/30/2019 Eco Efficiency Manual
http://slidepdf.com/reader/full/eco-efficiency-manual 68/153
ENERGY 57
Combustion air blower variable speed drives can be retrofitted to continually match
the load on the boiler. When replacing or upgrading boilers, many dairy processing
companies are also investigating the option of converting to a more efficient and cleaner
fuel (e.g. coal or fuel oil to gas). The installation of these energy-saving measures can
mean an improvement in boiler efficiency from around 90–94% for a new boiler. The
environmental impacts of switching fuels will be reduced (less greenhouse gas emissions),
but the disadvantage is the higher cost of natural gas as shown previously in Table 4.4.
4.4 Reducing the demand for electricity
4.4.1 Refrigeration systems
The energy cost of a refrigeration system can approach 20% of the total energy costs
in a liquid milk processing plant (Figure 4.1). Dairy processors typically use the vapour
compression cycle refrigeration system consisting of a compressor, condenser,
evaporator and expansion valve. The most common refrigerant is ammonia.
The efficiency of a refrigeration system is measured by the coefficient of system
performance (COSP) which is the quantity of refrigeration produced (cooling output
in kilowatts) divided by the total energy required by the system (energy input in
kilowatts). The higher the COSP, the higher is the efficiency of the system.
A useful software model, Coldsoft, is available from the Australian Dairy Processing
Engineering Centre (DPEC 2003b). The model allows plant personnel to review and
improve the performance of dairy site refrigeration systems.
Compressors
The purpose of the compressor is to draw low-pressure refrigerant vapour from theevaporator, and compress it so the vapour can be condensed back into a liquid by cooling
with air or water. The compressor is the workhorse of a refrigeration system and usually
accounts for between 80% and 100% of the system’s total energy consumption
(Carruthers 2004, pers. comm.). It is important, therefore, that the system operates under
optimum conditions. The amount of energy used by a compressor is affected by the:
• type of compressor
• compressor load
• temperature difference of the system (i.e. the number of degrees by which the systemis required to cool).
Energy-efficiency in boiler design: Bonlac Foods, Darnum Park1
Bonlac Foods in Darnum Park increased the efficiency of their four 10 MW boilers by
installing economisers, oxygen trim control, variable-speed drives and automatic blowdown
control. Around 80% of the condensate is returned to the boilers, utilising heat in the
condensate and reducing water consumption, chemical consumption and wastewater
generation.
1 AGO 2002a

7/30/2019 Eco Efficiency Manual
http://slidepdf.com/reader/full/eco-efficiency-manual 69/153
58 ECO-EFFICIENCY FOR THE DAIRY PROCESSING INDUSTRY
Compressor selection
There are three main types of compressor used for refrigeration — reciprocating,
rotary screw and scroll. Centrifugal compressors are often used for air-conditioning
systems. It is important when selecting a compressor to choose a type best suited to the
refrigeration duty and one that will enable the system’s COSP to be as high as possible.
Compressor load
The compressor’s capacity needs to be matched with the load. If a compressor is not
required, or is oversized, it operates at only partial load and the energy efficiency may
be reduced. The use of multiple compressors with a sequencing or capacity control
system to match the load can help to improve efficiency. In some cases, even with a
capacity control system an oversized compressor will still be inefficient as a result of
frequent stopping and starting. Some compressors are more efficient than others at
part load, depending on the method of capacity control, and it is best to ask themanufacturer for a profile of efficiencies at varying load conditions.
Ice banks can be an effective way of meeting peak demands without the need for
large compressor capacity. They are best used in applications where there are short to
medium peak loads but a much lower average load during a production day. Ice can be
formed during the night to take advantage of cheaper off-peak electricity.
The compressor is the workhorse of a refrigeration system and usually accounts for between
80% and 100% of the system’s total energy consumption.
7/30/2019 Eco Efficiency Manual
http://slidepdf.com/reader/full/eco-efficiency-manual 70/153
ENERGY 59
Minimising temperature difference
Compressors are most efficient when the condensing temperature (and therefore
pressure) is as low as possible and the evaporating temperature (pressure) is as high
as possible, while still meeting the refrigeration duties.
Increasing the evaporating temperature will increase the compressor efficiency, so
the thermostats should not be set lower than necessary. For example, it is cheaper
and requires less energy to cool a stream down to 4°C than to 2°C. Less heat energy
will be absorbed into the refrigerant, which in turn will reduce load on the compressor.
In some cases this may not be possible, due to production temperature and humidity
requirements; but do not cool more than is required.
Alternatively, the condensing temperature can be decreased by ensuring that the
condenser, which may be a water- or air-cooled cooling tower, is operating efficiently.
Condensers should be sized correctly to maintain the optimum condensing
temperature within the capabilities of the refrigeration system. If the condenser is too
large, however, the refrigerant can actually sub-cool2 and this will affect the function
of the expansion valve.
A refrigeration system with a small evaporator and condenser may require a smaller
initial capital outlay; however, running costs may be greatly increased by the need for
a larger compressor, so this should be avoided.
1 SEAV 2002b2 Subcooling refers to cooling of the refrigerant below its saturation point (the point at which liquid turns into a vapour).
Installation of new condenser: Dairy Farmers, Booval
Dairy Farmers in Booval installed a new condenser to reduce the operating head pressure and
save on the operating costs of the refrigeration plant. The payback on capital investment was
2 years. Challenges included the selection of a condenser to comply with noise limits.
An increase of 1°C in evaporating temperature or a reduction of 1°C in condensing
temperature will increase the compressor efficiency by 2–4%.
ETSU 2000
Energy management control system: Nestlé, Victoria1
A Nestlé ice-cream plant in Victoria uses electricity worth around $960 000/yr. About 13 GW h
of this electricity is used by the refrigeration system.
A feasibility study for the refrigeration system showed that the compressors were operatingunder no load, there were numerous compressor start-ups, and the suction temperature of
12°C into the compressors was far above design temperature of 3°C due to incorrect valve
selection. The minimum condenser pressure was also being maintained at around 1000 kPa
over the winter months.
The study recommended upgrading the current control system to improved valve selection so
that the correct suction gas temperature (3°C) could be recovered, enabling the compressors
to operate at higher loading and minimise stopping.
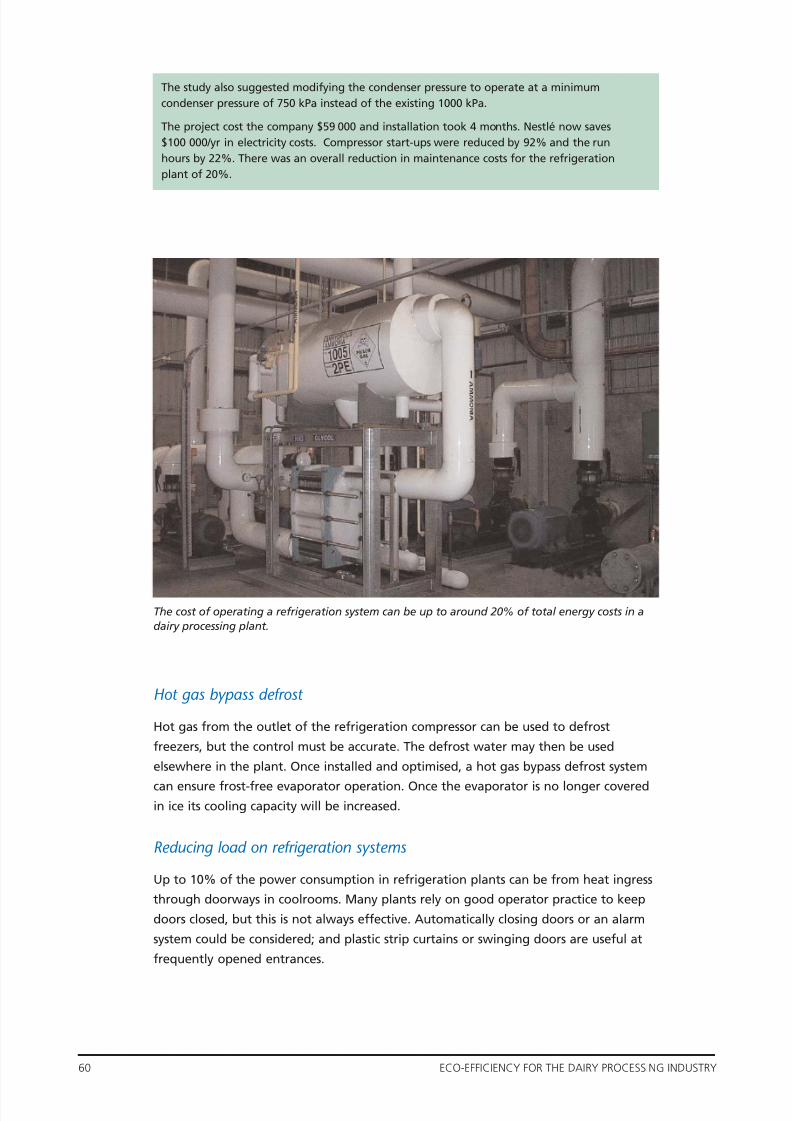
7/30/2019 Eco Efficiency Manual
http://slidepdf.com/reader/full/eco-efficiency-manual 71/153
60 ECO-EFFICIENCY FOR THE DAIRY PROCESSING INDUSTRY
Hot gas bypass defrost
Hot gas from the outlet of the refrigeration compressor can be used to defrost
freezers, but the control must be accurate. The defrost water may then be used
elsewhere in the plant. Once installed and optimised, a hot gas bypass defrost system
can ensure frost-free evaporator operation. Once the evaporator is no longer coveredin ice its cooling capacity will be increased.
Reducing load on refrigeration systems
Up to 10% of the power consumption in refrigeration plants can be from heat ingress
through doorways in coolrooms. Many plants rely on good operator practice to keep
doors closed, but this is not always effective. Automatically closing doors or an alarm
system could be considered; and plastic strip curtains or swinging doors are useful at
frequently opened entrances.
The study also suggested modifying the condenser pressure to operate at a minimum
condenser pressure of 750 kPa instead of the existing 1000 kPa.
The project cost the company $59 000 and installation took 4 months. Nestlé now saves
$100 000/yr in electricity costs. Compressor start-ups were reduced by 92% and the run
hours by 22%. There was an overall reduction in maintenance costs for the refrigeration
plant of 20%.
The cost of operating a refrigeration system can be up to around 20% of total energy costs in a
dairy processing plant.

7/30/2019 Eco Efficiency Manual
http://slidepdf.com/reader/full/eco-efficiency-manual 72/153
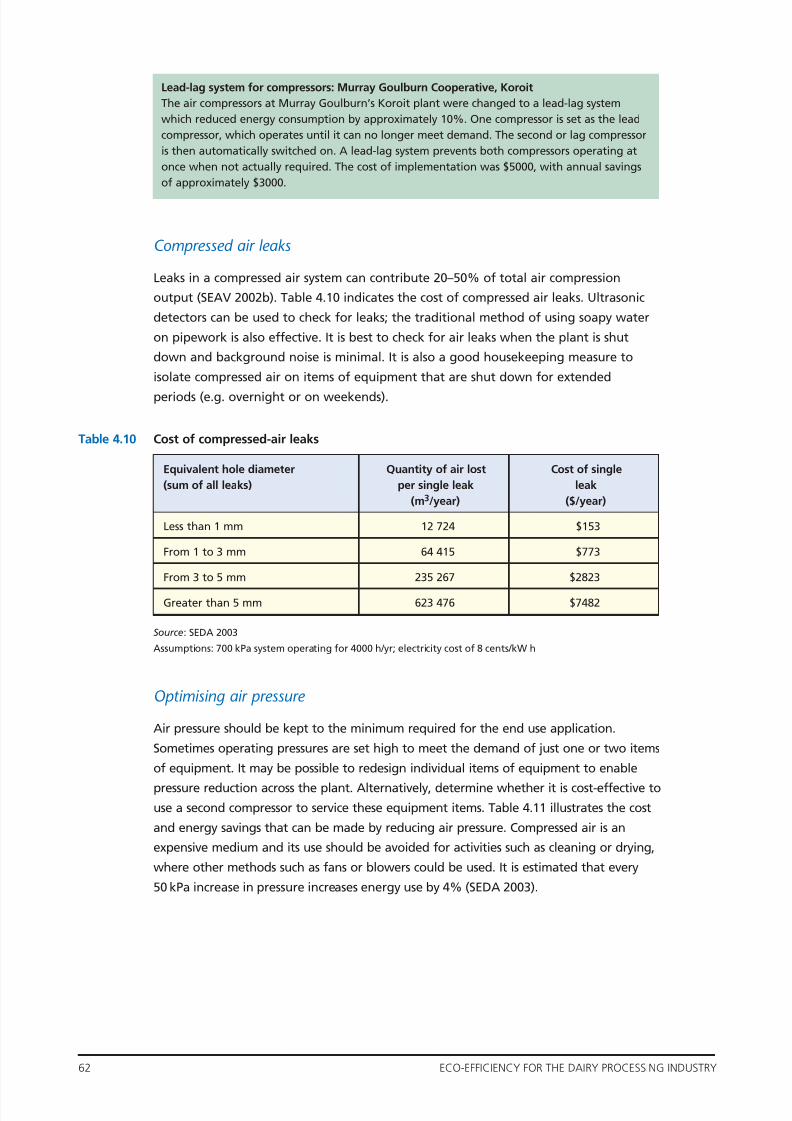
7/30/2019 Eco Efficiency Manual
http://slidepdf.com/reader/full/eco-efficiency-manual 73/153
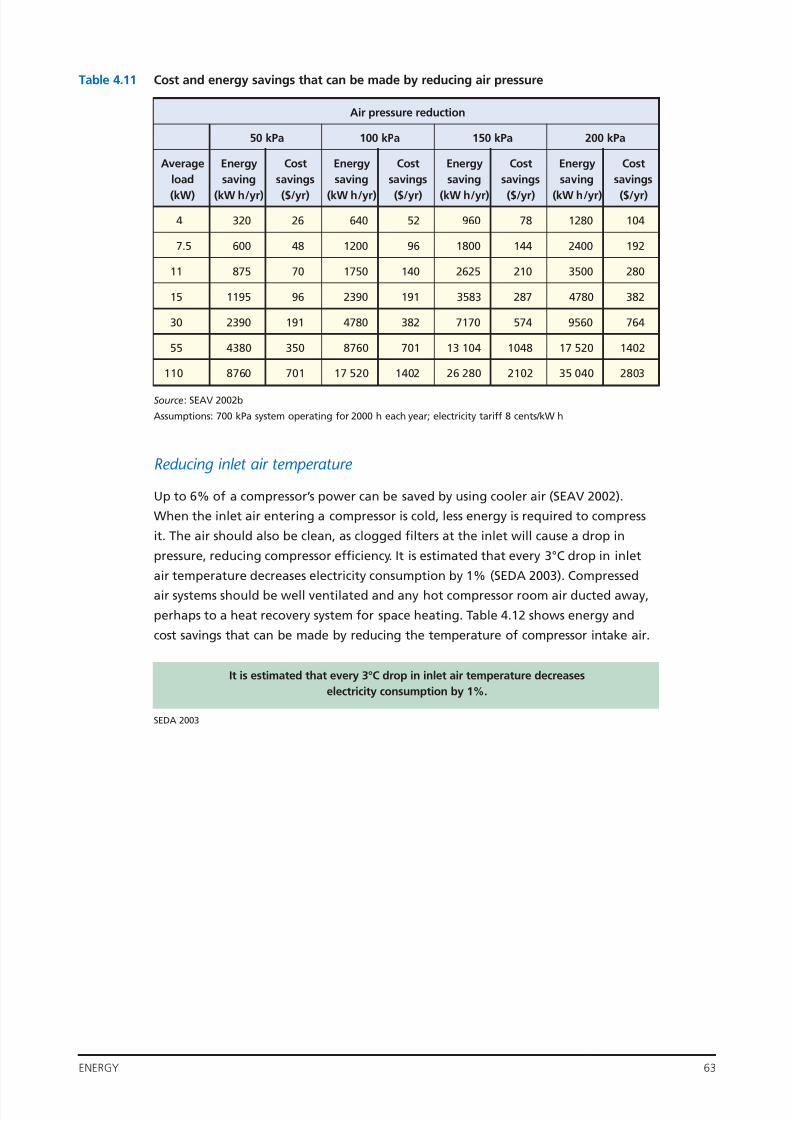
7/30/2019 Eco Efficiency Manual
http://slidepdf.com/reader/full/eco-efficiency-manual 74/153
ENERGY 63
Table 4.11 Cost and energy savings that can be made by reducing air pressure
Source: SEAV 2002b
Assumptions: 700 kPa system operating for 2000 h each year; electricity tariff 8 cents/kW h
Reducing inlet air temperature
Up to 6% of a compressor’s power can be saved by using cooler air (SEAV 2002).
When the inlet air entering a compressor is cold, less energy is required to compress
it. The air should also be clean, as clogged filters at the inlet will cause a drop in
pressure, reducing compressor efficiency. It is estimated that every 3°C drop in inlet
air temperature decreases electricity consumption by 1% (SEDA 2003). Compressed
air systems should be well ventilated and any hot compressor room air ducted away,
perhaps to a heat recovery system for space heating. Table 4.12 shows energy and
cost savings that can be made by reducing the temperature of compressor intake air.
Air pressure reduction
50 kPa 100 kPa 150 kPa 200 kPa
Average Energy Cost Energy Cost Energy Cost Energy Cost
load saving savings saving savings saving savings saving savings
(kW) (kW h/yr) ($/yr) (kW h/yr) ($/yr) (kW h/yr) ($/yr) (kW h/yr) ($/yr)
4 320 26 640 52 960 78 1280 104
7.5 600 48 1200 96 1800 144 2400 192
11 875 70 1750 140 2625 210 3500 280
15 1195 96 2390 191 3583 287 4780 382
30 2390 191 4780 382 7170 574 9560 764
55 4380 350 8760 701 13 104 1048 17 520 1402
110 8760 701 17 520 1402 26 280 2102 35 040 2803
It is estimated that every 3°C drop in inlet air temperature decreases
electricity consumption by 1%.
SEDA 2003
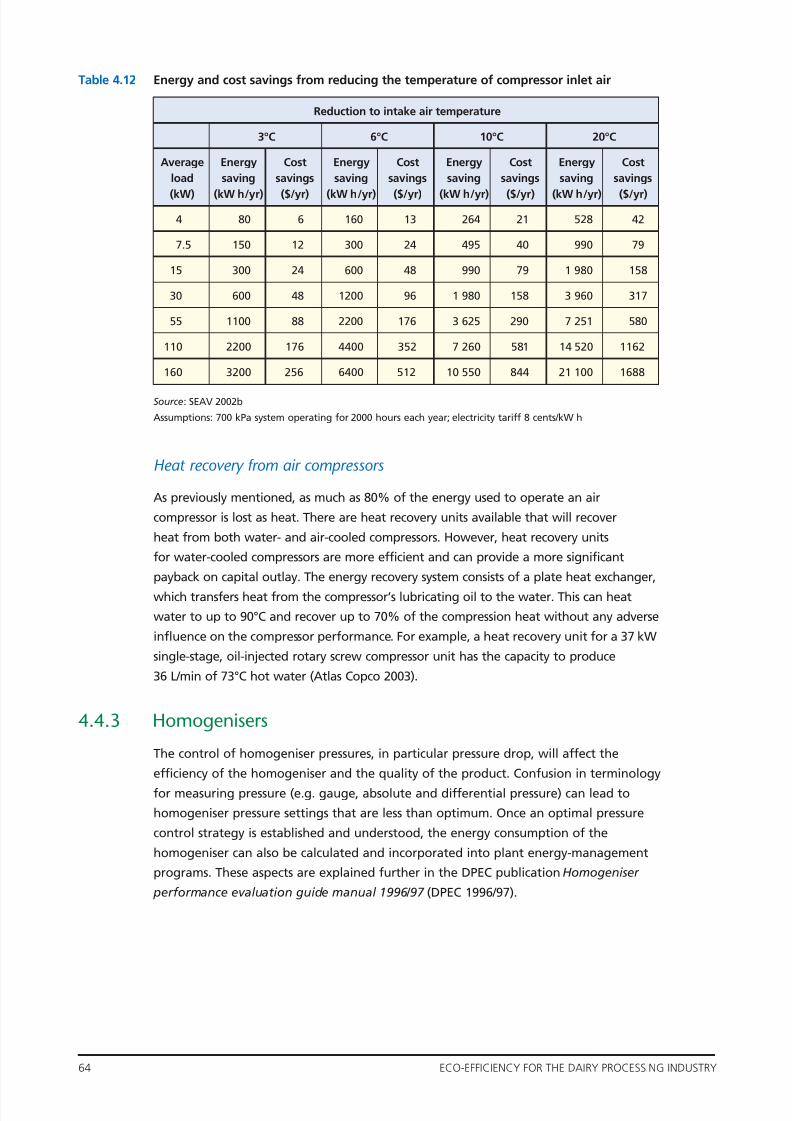
7/30/2019 Eco Efficiency Manual
http://slidepdf.com/reader/full/eco-efficiency-manual 75/153
64 ECO-EFFICIENCY FOR THE DAIRY PROCESSING INDUSTRY
Table 4.12 Energy and cost savings from reducing the temperature of compressor inlet air
Source: SEAV 2002b
Assumptions: 700 kPa system operating for 2000 hours each year; electricity tariff 8 cents/kW h
Heat recovery from air compressors
As previously mentioned, as much as 80% of the energy used to operate an air
compressor is lost as heat. There are heat recovery units available that will recover
heat from both water- and air-cooled compressors. However, heat recovery units
for water-cooled compressors are more efficient and can provide a more significant
payback on capital outlay. The energy recovery system consists of a plate heat exchanger,
which transfers heat from the compressor’s lubricating oil to the water. This can heat
water to up to 90°C and recover up to 70% of the compression heat without any adverse
influence on the compressor performance. For example, a heat recovery unit for a 37 kW
single-stage, oil-injected rotary screw compressor unit has the capacity to produce
36 L/min of 73°C hot water (Atlas Copco 2003).
4.4.3 Homogenisers
The control of homogeniser pressures, in particular pressure drop, will affect the
efficiency of the homogeniser and the quality of the product. Confusion in terminology
for measuring pressure (e.g. gauge, absolute and differential pressure) can lead to
homogeniser pressure settings that are less than optimum. Once an optimal pressure
control strategy is established and understood, the energy consumption of the
homogeniser can also be calculated and incorporated into plant energy-management
programs. These aspects are explained further in the DPEC publication Homogeniser
performance evaluation guide manual 1996/97 (DPEC 1996/97).
Reduction to intake air temperature
3°C 6°C 10°C 20°C
Average Energy Cost Energy Cost Energy Cost Energy Cost
load saving savings saving savings saving savings saving savings
(kW) (kW h/yr) ($/yr) (kW h/yr) ($/yr) (kW h/yr) ($/yr) (kW h/yr) ($/yr)
4 80 6 160 13 264 21 528 42
7.5 150 12 300 24 495 40 990 79
15 300 24 600 48 990 79 1 980 158
30 600 48 1200 96 1 980 158 3 960 317
55 1100 88 2200 176 3 625 290 7 251 580
110 2200 176 4400 352 7 260 581 14 520 1162
160 3200 256 6400 512 10 550 844 21 100 1688
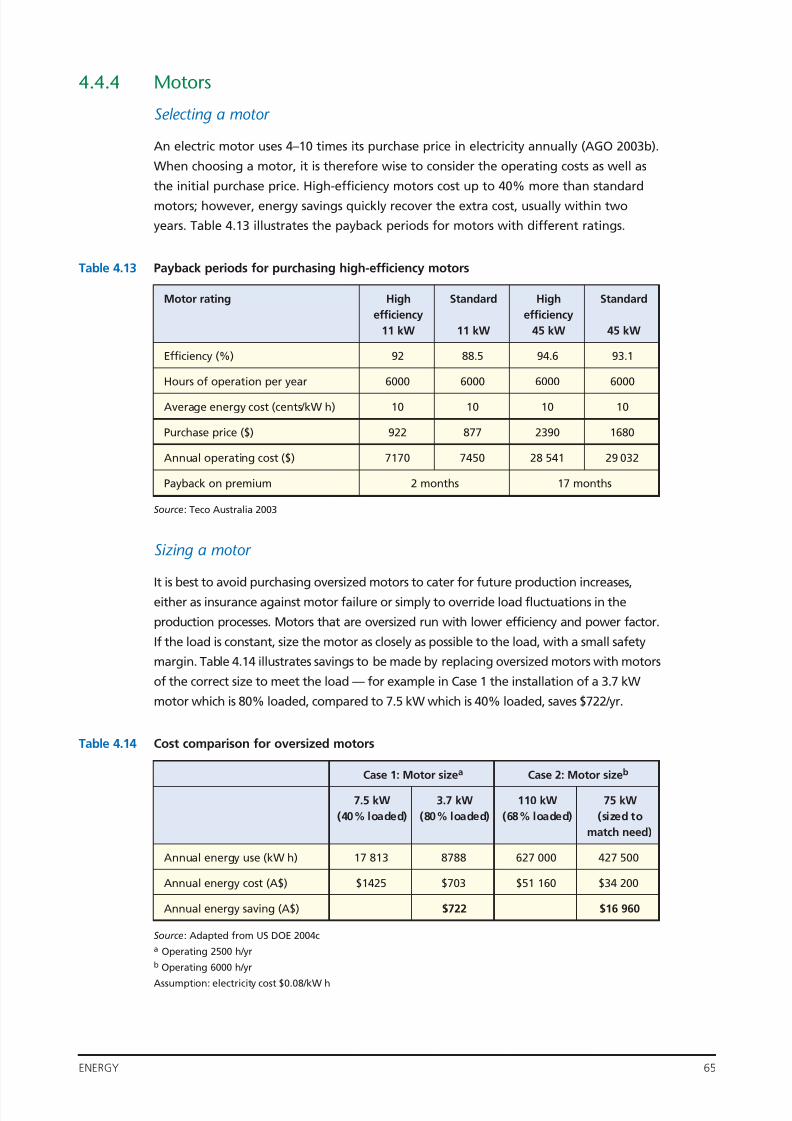
7/30/2019 Eco Efficiency Manual
http://slidepdf.com/reader/full/eco-efficiency-manual 76/153
ENERGY 65
4.4.4 Motors
Selecting a motor
An electric motor uses 4–10 times its purchase price in electricity annually (AGO 2003b).
When choosing a motor, it is therefore wise to consider the operating costs as well as
the initial purchase price. High-efficiency motors cost up to 40% more than standard
motors; however, energy savings quickly recover the extra cost, usually within two
years. Table 4.13 illustrates the payback periods for motors with different ratings.
Table 4.13 Payback periods for purchasing high-efficiency motors
'
Source: Teco Australia 2003
Sizing a motor
It is best to avoid purchasing oversized motors to cater for future production increases,
either as insurance against motor failure or simply to override load fluctuations in the
production processes. Motors that are oversized run with lower efficiency and power factor.
If the load is constant, size the motor as closely as possible to the load, with a small safety
margin. Table 4.14 illustrates savings to be made by replacing oversized motors with motors
of the correct size to meet the load — for example in Case 1 the installation of a 3.7 kW
motor which is 80% loaded, compared to 7.5 kW which is 40% loaded, saves $722/yr.
Table 4.14 Cost comparison for oversized motors
Source: Adapted from US DOE 2004ca Operating 2500 h/yrb Operating 6000 h/yr
Assumption: electricity cost $0.08/kW h
Motor rating High Standard High Standard
efficiency efficiency
11 kW 11 kW 45 kW 45 kW
Efficiency (%) 92 88.5 94.6 93.1
Hours of operation per year 6000 6000 6000 6000
Average energy cost (cents/kW h) 10 10 10 10
Purchase price ($) 922 877 2390 1680
Annual operating cost ($) 7170 7450 28 541 29 032
Payback on premium 2 months 17 months
Case 1: Motor sizea Case 2: Motor sizeb
7.5 kW 3.7 kW 110 kW 75 kW
(40% loaded) (80% loaded) (68% loaded) (sized to
match need)
Annual energy use (kW h) 17 813 8788 627 000 427 500
Annual energy cost (A$) $1425 $703 $51 160 $34 200
Annual energy saving (A$) $722 $16 960
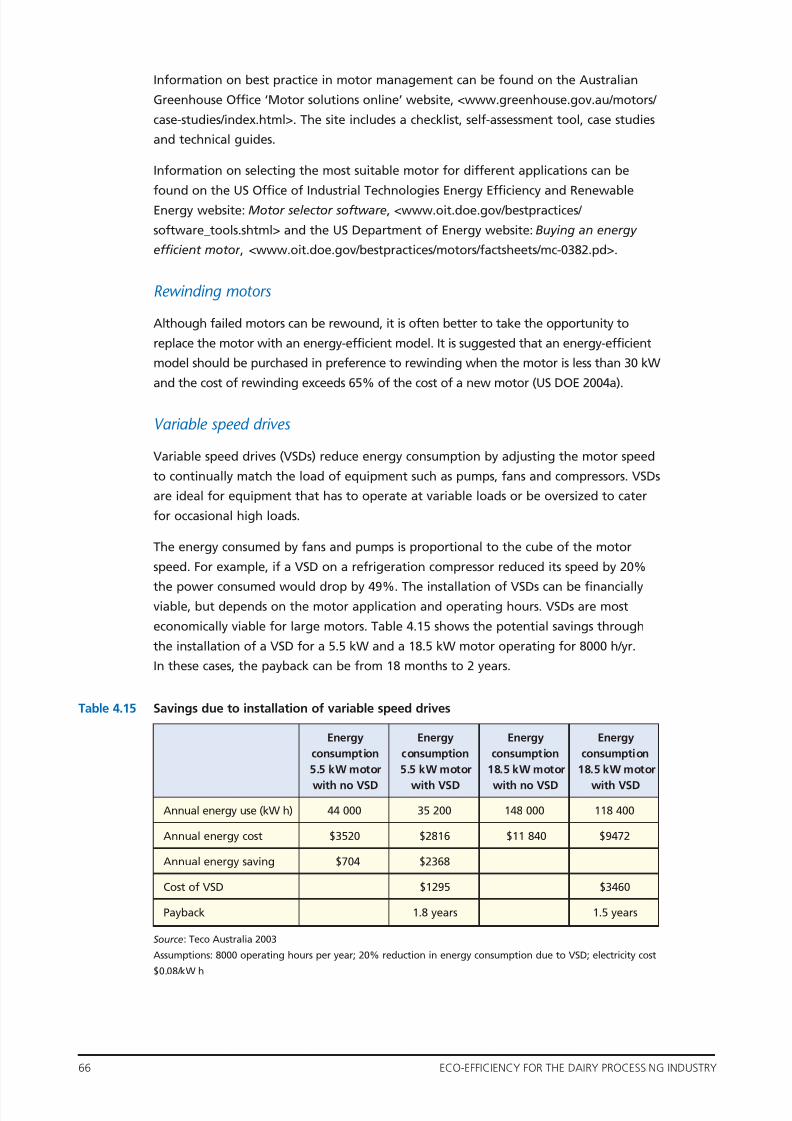
7/30/2019 Eco Efficiency Manual
http://slidepdf.com/reader/full/eco-efficiency-manual 77/153
66 ECO-EFFICIENCY FOR THE DAIRY PROCESSING INDUSTRY
Information on best practice in motor management can be found on the Australian
Greenhouse Office ‘Motor solutions online’ website, <www.greenhouse.gov.au/motors/
case-studies/index.html>. The site includes a checklist, self-assessment tool, case studies
and technical guides.
Information on selecting the most suitable motor for different applications can be
found on the US Office of Industrial Technologies Energy Efficiency and RenewableEnergy website: Motor selector software, <www.oit.doe.gov/bestpractices/
software_tools.shtml> and the US Department of Energy website: Buying an energy
efficient motor , <www.oit.doe.gov/bestpractices/motors/factsheets/mc-0382.pd>.
Rewinding motors
Although failed motors can be rewound, it is often better to take the opportunity to
replace the motor with an energy-efficient model. It is suggested that an energy-efficient
model should be purchased in preference to rewinding when the motor is less than 30 kW
and the cost of rewinding exceeds 65% of the cost of a new motor (US DOE 2004a).
Variable speed drives
Variable speed drives (VSDs) reduce energy consumption by adjusting the motor speed
to continually match the load of equipment such as pumps, fans and compressors. VSDs
are ideal for equipment that has to operate at variable loads or be oversized to cater
for occasional high loads.
The energy consumed by fans and pumps is proportional to the cube of the motor
speed. For example, if a VSD on a refrigeration compressor reduced its speed by 20%
the power consumed would drop by 49%. The installation of VSDs can be financiallyviable, but depends on the motor application and operating hours. VSDs are most
economically viable for large motors. Table 4.15 shows the potential savings through
the installation of a VSD for a 5.5 kW and a 18.5 kW motor operating for 8000 h/yr.
In these cases, the payback can be from 18 months to 2 years.
Table 4.15 Savings due to installation of variable speed drives
Source: Teco Australia 2003
Assumptions: 8000 operating hours per year; 20% reduction in energy consumption due to VSD; electricity cost
$0.08/kW h
Energy Energy Energy Energy
consumption consumption consumption consumption
5.5 kW motor 5.5 kW motor 18.5 kW motor 18.5 kW motor
with no VSD with VSD with no VSD with VSD
Annual energy use (kW h) 44 000 35 200 148 000 118 400
Annual energy cost $3520 $2816 $11 840 $9472
Annual energy saving $704 $2368
Cost of VSD $1295 $3460
Payback 1.8 years 1.5 years
7/30/2019 Eco Efficiency Manual
http://slidepdf.com/reader/full/eco-efficiency-manual 78/153
ENERGY 67
4.4.5 Lighting
Around 4–6% of total electricity consumption is used for lighting in dairy processing
plants (Kjaergaard-Jensen 1999). Different styles of lighting are available for different
purposes, and they have varying efficiencies. Some types of lighting and their uses are
listed below, from most to least energy-efficient (DSIR 2001b).
Low-pressure sodium: This is the most efficient type of lamp at present. It is most
suited to exterior lighting and emits yellow light.
High-pressure sodium: These are not as energy-efficient as low-pressure sodium lights.
They are suitable for internal and external use where colour rendition is not important.
Metal halide and mercury vapour: These are commonly used for high-bay factory
lighting, and emit a bluish-white light. Metal halide is 25% more efficient than mercury
vapour lighting. Two types of metal halide lighting are available — standard and pulse
start. Pulse start lights are more efficient and start more quickly.
Fluorescent: These are the most efficient type for lighting small areas with low ceilings,
or for task-level lighting. Fluorescent lights are available as a standard long lamp or in
a compact style, which can be used as a direct replacement for incandescent lamps. Theinitial cost is higher, but the lamps use one-fifth the electricity and last up to 10 times
as long.
Standard 40 W fluorescent tubes can be replaced with 36 W high-density tri-phosphor
tubes, which are 20% more efficient and produce 15% more light.
Tungsten halogen lamps: These lamps are cheap to purchase but have high operating
costs. They are useful for floodlighting.
Miniature dichroic down lights: These are often used in reception areas and
restaurants. Their energy efficiency is inferior to that of fluorescent lights and theyshould be avoided if energy consumption is a priority.
Incandescent lamps: These are the least efficient, and although they have a low
purchase cost they will end up costing more in the long run because of higher
operating costs and lower product life.
Variable speed drive on cooling tower fans: National Foods Ltd, Murray Bridge
National Foods in Murray Bridge installed variable speed (frequency) drives on the fan motors
of the refrigeration system water cooling towers. The fan motors were not required to be run
at all times. Savings in energy consumption resulted (but were not quantified). The
modification needed to be performed during low demand for refrigeration so that production
requirements were not disrupted.
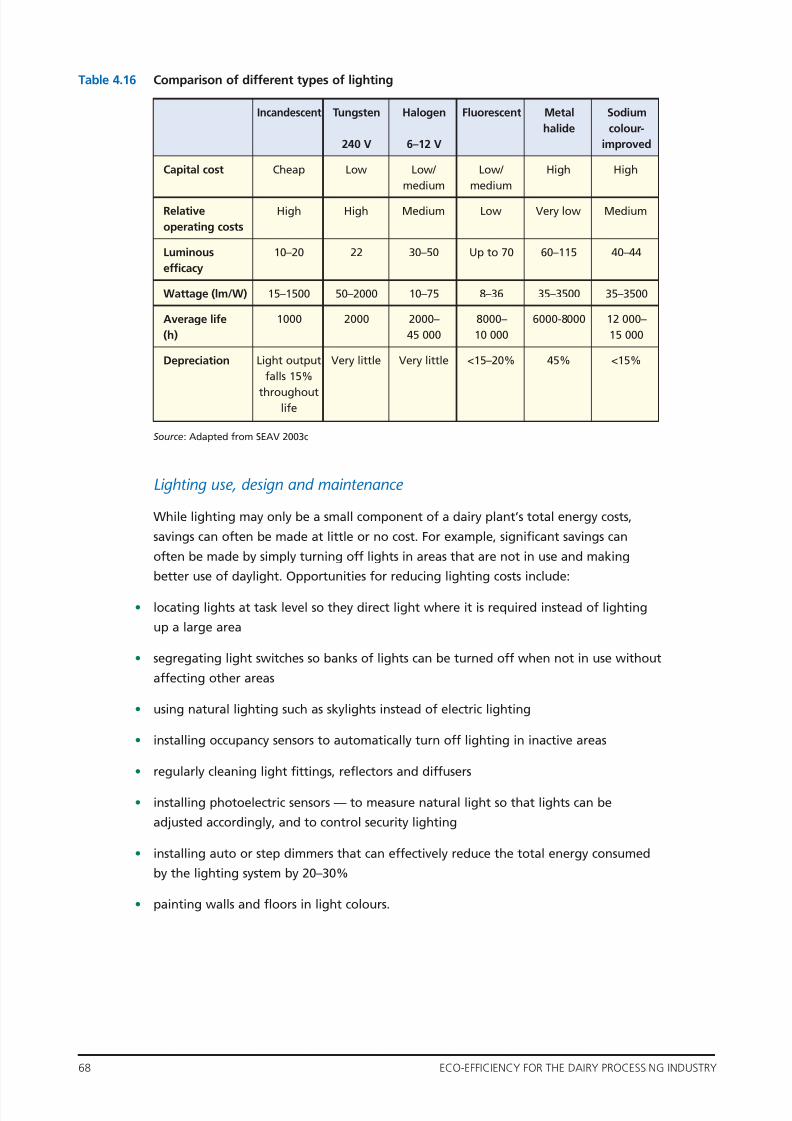
7/30/2019 Eco Efficiency Manual
http://slidepdf.com/reader/full/eco-efficiency-manual 79/153
68 ECO-EFFICIENCY FOR THE DAIRY PROCESSING INDUSTRY
Table 4.16 Comparison of different types of lighting
Source: Adapted from SEAV 2003c
Lighting use, design and maintenance
While lighting may only be a small component of a dairy plant’s total energy costs,
savings can often be made at little or no cost. For example, significant savings can
often be made by simply turning off lights in areas that are not in use and making
better use of daylight. Opportunities for reducing lighting costs include:
• locating lights at task level so they direct light where it is required instead of lighting
up a large area
• segregating light switches so banks of lights can be turned off when not in use without
affecting other areas
• using natural lighting such as skylights instead of electric lighting
• installing occupancy sensors to automatically turn off lighting in inactive areas
• regularly cleaning light fittings, reflectors and diffusers
• installing photoelectric sensors — to measure natural light so that lights can be
adjusted accordingly, and to control security lighting
• installing auto or step dimmers that can effectively reduce the total energy consumed
by the lighting system by 20–30%
• painting walls and floors in light colours.
Incandescent Tungsten Halogen Fluorescent Metal Sodium
halide colour-
240 V 6–12 V improved
Capital cost Cheap Low Low/ Low/ High High
medium medium
Relative High High Medium Low Very low Medium
operating costs
Luminous 10–20 22 30–50 Up to 70 60–115 40–44
efficacy
Wattage (lm/W) 15–1500 50–2000 10–75 8–36 35–3500 35–3500
Average life 1000 2000 2000– 8000– 6000-8000 12 000–
(h) 45 000 10 000 15 000
Depreciation Light output Very little Very little <15–20% 45% <15%
falls 15%
throughoutlife
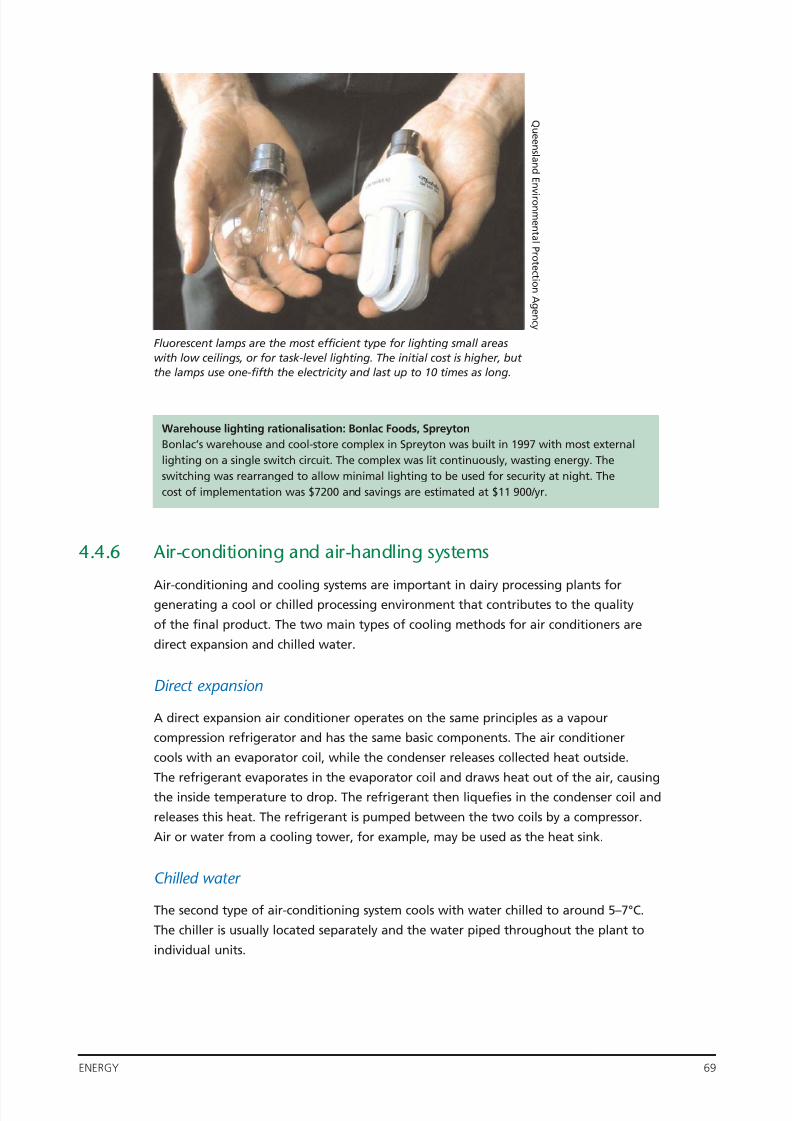
7/30/2019 Eco Efficiency Manual
http://slidepdf.com/reader/full/eco-efficiency-manual 80/153
ENERGY 69
4.4.6 Air-conditioning and air-handling systems
Air-conditioning and cooling systems are important in dairy processing plants forgenerating a cool or chilled processing environment that contributes to the quality
of the final product. The two main types of cooling methods for air conditioners are
direct expansion and chilled water.
Direct expansion
A direct expansion air conditioner operates on the same principles as a vapour
compression refrigerator and has the same basic components. The air conditioner
cools with an evaporator coil, while the condenser releases collected heat outside.
The refrigerant evaporates in the evaporator coil and draws heat out of the air, causing
the inside temperature to drop. The refrigerant then liquefies in the condenser coil and
releases this heat. The refrigerant is pumped between the two coils by a compressor.
Air or water from a cooling tower, for example, may be used as the heat sink.
Chilled water
The second type of air-conditioning system cools with water chilled to around 5–7°C.
The chiller is usually located separately and the water piped throughout the plant to
individual units.
Fluorescent lamps are the most efficient type for lighting small areas
with low ceilings, or for task-level lighting. The initial cost is higher, but
the lamps use one-fifth the electricity and last up to 10 times as long.
Q u e en s l an d E n
v i r onm en t al P r o t e c t i onA g en c y
Warehouse lighting rationalisation: Bonlac Foods, Spreyton
Bonlac’s warehouse and cool-store complex in Spreyton was built in 1997 with most external
lighting on a single switch circuit. The complex was lit continuously, wasting energy. The
switching was rearranged to allow minimal lighting to be used for security at night. The
cost of implementation was $7200 and savings are estimated at $11 900/yr.
7/30/2019 Eco Efficiency Manual
http://slidepdf.com/reader/full/eco-efficiency-manual 81/153
70 ECO-EFFICIENCY FOR THE DAIRY PROCESSING INDUSTRY
Systems also have humidifiers or dehumidifiers to add or remove moisture to or from
the air, and filters to clean the air. All air conditioners also have control systems with
varying levels of sophistication to maintain temperature and humidity.
Choosing energy-efficient systems
Selection of an air-conditioning system should not be based on price alone. Whileenergy-efficient models may have higher initial costs, such a system will usually pay for
itself several times over in saved operating costs during its lifetime. Energy efficiency
will depend not only on choosing a system that produces as much cooling per hour
as possible for every watt of power it draws, but also on correctly sizing the system.
An undersized system will be overworked and will not meet the plant’s needs. An
oversized system, on the other hand, as well as being more expensive initially, will
cycle on and off more frequently and make the system less efficient.
Economy air cycles are a good way of reducing energy use in air-conditioning systems,
particularly in cooler regions. Economy air cycles take advantage of outside air
temperatures, reducing the use of energy for cooling.
Other opportunities for reducing the operating cost of an air-conditioning system
include:
• selecting a system based on the accurate sizing of your plant’s cooling requirements
(Some contractors use specifically designed software to determine the best size, the
number and size of ducts, and the dehumidification capacity of the system.)
• ensuring the system is accessible for cleaning and maintenance so that components
such as filters, coils, ducts, fins, refrigerant, compressor and thermostats can be easily
maintained and leaks repaired
• investigating cooling using off-peak tariffs
• ensuring thermostats are set to the optimum setting and installed away from heat
sources
• operating the system only when necessary — use an energy monitoring and control
system to control temperatures in different areas of the factory
• investigating the benefits of floor, wall and roof insulation — look at possibilities for
using blinds, reflective film, eaves and vegetation
• insulating ducting and pipes, and if possible keeping ducts within the air-conditioned
space
• investigating the use of evaporative coolers if climatic conditions are suitable.

7/30/2019 Eco Efficiency Manual
http://slidepdf.com/reader/full/eco-efficiency-manual 82/153
ENERGY 71
4.5 Heat recoveryThere are many opportunities for recovering heat in dairy processing plants; however,
the feasibility of implementing such systems depends on the location of the heat source
in relation to the potential area of use, the capital cost of heat recovery equipment,
and the potential energy savings. In addition to the commonly used regenerative
pasteurisers and sterilisers, examples of heat recovery opportunities in dairy processingplants include from heated whey during cheese processing to preheat incoming milk,
from boiler flue gases, boiler blowdown and condensate recovery systems and from
the heated air from spray dryers. The potential for heat recovery from evaporator
condensate varies with the type and efficiency of the evaporator. For example,
evaporators using mechanical vapour recompression are more energy-efficient than
those with thermal vapour compression (see section 4.3.1), recovering excess heat and
producing a cooler condensate (around 15°C, compared to around 60°C) (Peter Gross
2004, pers. comm.).
4.5.1 Pinch technology
A strategic method for looking at the opportunities for heat recovery is through a
procedure known as ‘pinch technology’. This involves analysing the heating or cooling
requirements of various process streams and matching these requirements to determine
the minimum amount of heat energy input into a system. The document Introduction to
pinch technology by Linhoff March has further information and can be downloaded at
<http://www.linnhoffmarch.com/pdfs/PinchIntro.pdf> (Linhoff March 1998).
4.5.2 Stratified storage tanks
A number of cheese-manufacturing plants have installed stratified storage tanks to
recover heat from whey produced during cheese-making to pre-heat raw milk. Heat
recovered from whey produces heated water (via heat exchange), which is then stored
in a purpose-built storage tank. When required for pre-heating of raw milk, the heated
water is drawn out of the storage tank, used to pre-heat the milk and returned to the
same tank as cooled water. The cooled water is then stored for several hours until
required for cooling the whey. The stratified tank has no physical barrier between the
cool and heated layers of water and is designed to prevent excessive mixing during
removal and filling of water. Further information can be found in the January 1997
issue of the DPEC Newsletter (DPEC 1997).
4.5.3 Improving the efficiency of pasteurisers and sterilisers
Pasteurisers and sterilisers use a regenerative heat exchange process, which recovers
heat from hot pasteurised milk to pre-heat incoming chilled milk. Regeneration ratios
can be calculated to determine the efficiency of the pasteuriser; this is shown in the UK
publication Reducing energy costs in dairies (ETSU 1998).
7/30/2019 Eco Efficiency Manual
http://slidepdf.com/reader/full/eco-efficiency-manual 83/153
72 ECO-EFFICIENCY FOR THE DAIRY PROCESSING INDUSTRY
Heat recovery from flared biogas: Murray Goulburn Cooperative, Leitchville
Murray Goulburn in Leitchville anaerobically digests wastewater, producing biogas which is
flared to atmosphere. A suggested project is to recover heat from the flare to warm wastewater
to an optimum temperature for digestion. Digestion currently occurs at 26–33.5°C, depending on
the time of year and source of effluent. The optimum temperature, however, is 35–36°C because
a temperature above 32°C is necessary to help emulsify long-chain fatty acids.
Stratified storage tank and heat recovery from wastewater: Murray Goulburn Cooperative,Leitchville
Murray Goulburn in Leitchville reclaims heat from its warm whey through a water medium.
The water is then pumped into the bottom of a 200 000 L hot water bank. The hot water in
the tank is transferred from the top of the tank for the pre-heat of the pasteuriser. The cost
of implementation consisted of labour costs for programming and optimising several cascade
loops. The system maintains cold whey temperatures for the whole day and has improved the
performance of the membrane plant. The processing plant also recovers heat from its cleaning
wastewater that cannot otherwise be recycled or reused. The heat reclaimed from the
wastewater is used to heat incoming mains water, which will then be used in processing.
Heat recovery from cheese whey: Bonlac Foods, Wynyard
Bonlac Foods in Wynyard comprises a large cheese factory integrated with membrane
filtration plants producing whey protein concentrate (for drying) and permeate concentrates.A recirculating water system was installed to use waste heat from cheese whey at 38°C to
preheat incoming raw milk before it is pasteurised. The system includes a stratified storage
tank to handle the time lapse between energy demand and supply. The system design was
combined with plant upgrades to install a cold ultrafiltration (UF) system and increased
refrigeration capacity. Overall heat savings were sufficient to shut down the second of two
boilers previously used to supply steam. (Note: these savings included those derived from
the change from hot to cold UF and must be offset against increased refrigeration loads.)
Heat recovery and reduction in steam usage: Dairy Farmers, Mount Gambier
Dairy Farmers in Mount Gambier reduced steam usage by removing the steam barrier on the
homogeniser. The steam barrier was not required because the equipment was operated in
non-aseptic mode. Some thermal energy was also saved by returning hot condensate to the
feedwater tank for reuse. The project reduced energy costs by $4500 per year and madefurther savings of $12 500/yr by extending the life of the seals on the homogeniser.
Heat recovery from refrigeration compressors: National Foods Ltd, Penrith
National Foods in Penrith recover heat from the refrigeration compressors to pre-heat site
process water. The system allows water used for cleaning to be heated to 50°C. Heated water
for hosing was previously provided by a boiler.
Heat recovery from ammonia refrigeration system: Peters and Brownes Foods, Roxburgh
Peter and Brownes Foods in Roxburgh is investigating heat recovery from its ammonia
refrigeration system to supply the ice-cream hot water boilers. The system will recover
heat from superheated ammonia vapour (ammonia that is heated above its evaporating
temperature). It is expected to save $20 000/yr in gas usage for hot water. The capital cost
for the system is expected to be $50 000.
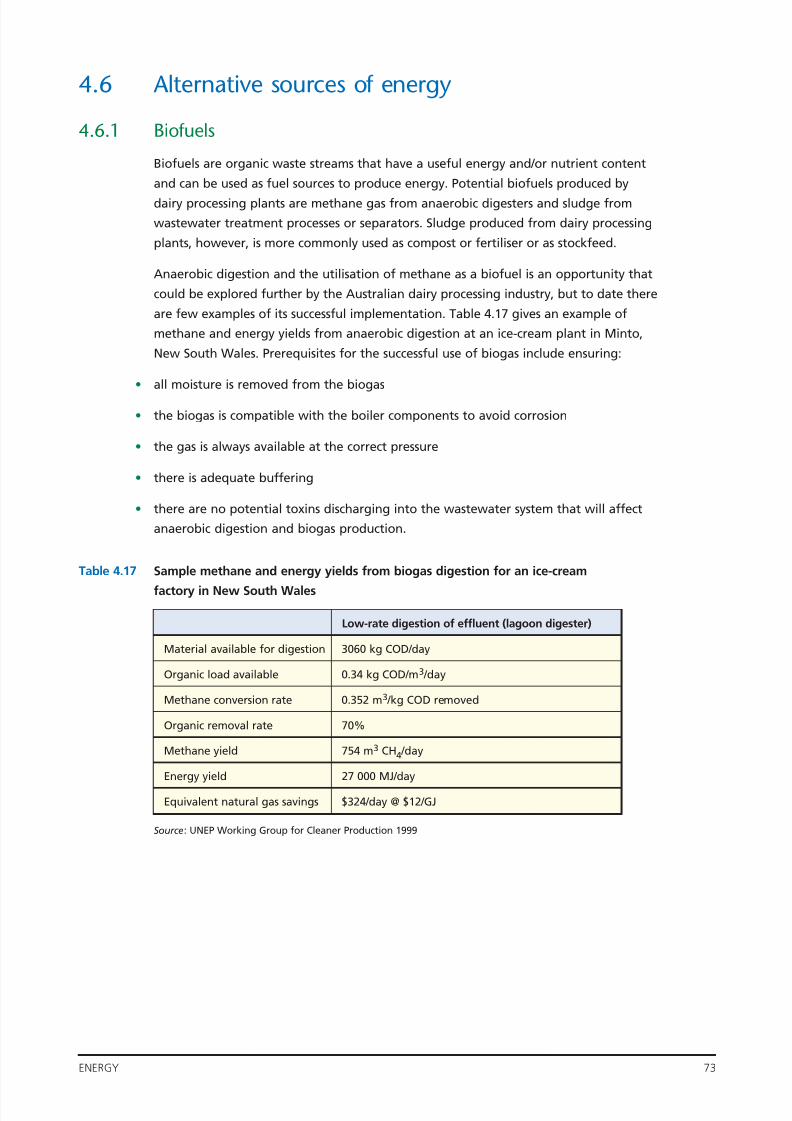
7/30/2019 Eco Efficiency Manual
http://slidepdf.com/reader/full/eco-efficiency-manual 84/153
ENERGY 73
4.6 Alternative sources of energy
4.6.1 Biofuels
Biofuels are organic waste streams that have a useful energy and/or nutrient content
and can be used as fuel sources to produce energy. Potential biofuels produced by
dairy processing plants are methane gas from anaerobic digesters and sludge from
wastewater treatment processes or separators. Sludge produced from dairy processing
plants, however, is more commonly used as compost or fertiliser or as stockfeed.
Anaerobic digestion and the utilisation of methane as a biofuel is an opportunity that
could be explored further by the Australian dairy processing industry, but to date there
are few examples of its successful implementation. Table 4.17 gives an example of
methane and energy yields from anaerobic digestion at an ice-cream plant in Minto,
New South Wales. Prerequisites for the successful use of biogas include ensuring:
• all moisture is removed from the biogas
• the biogas is compatible with the boiler components to avoid corrosion
• the gas is always available at the correct pressure
• there is adequate buffering
• there are no potential toxins discharging into the wastewater system that will affect
anaerobic digestion and biogas production.
Table 4.17 Sample methane and energy yields from biogas digestion for an ice-cream
factory in New South Wales
Source: UNEP Working Group for Cleaner Production 1999
Low-rate digestion of effluent (lagoon digester)
Material available for digestion 3060 kg COD/day
Organic load available 0.34 kg COD/m3 /day
Methane conversion rate 0.352 m3 /kg COD removed
Organic removal rate 70%
Methane yield 754 m3 CH4 /day
Energy yield 27 000 MJ/day
Equivalent natural gas savings $324/day @ $12/GJ
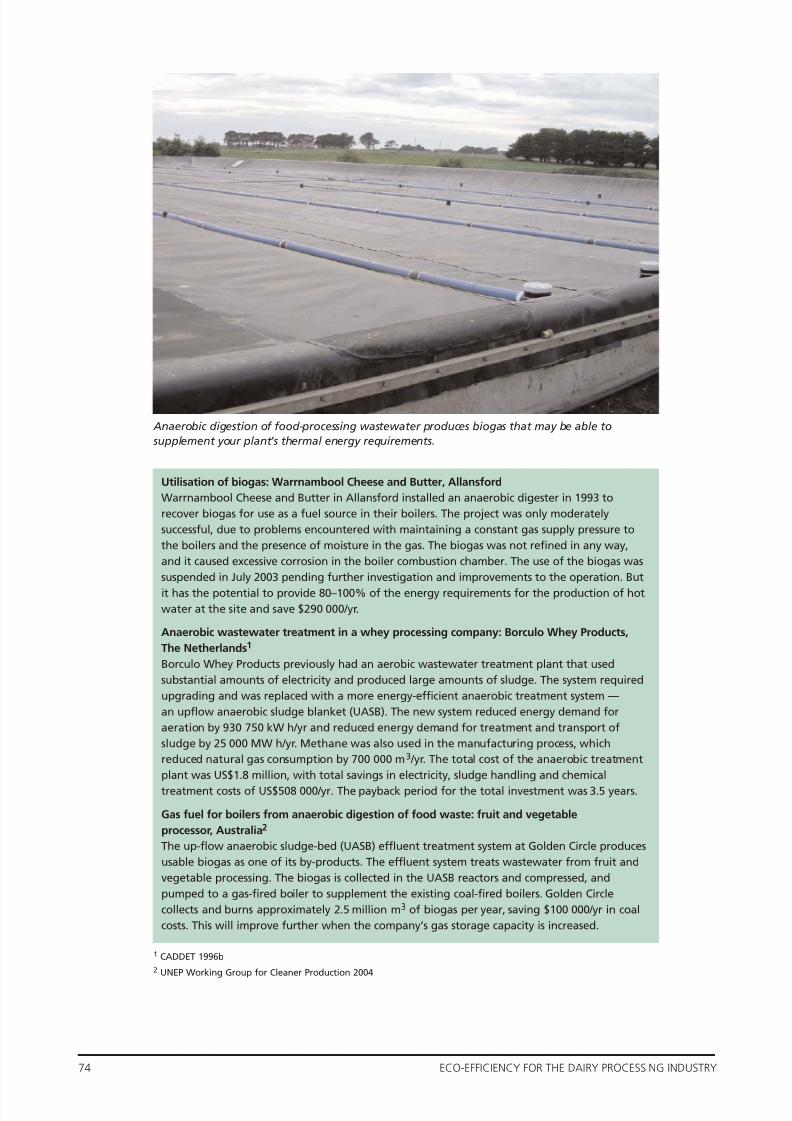
7/30/2019 Eco Efficiency Manual
http://slidepdf.com/reader/full/eco-efficiency-manual 85/153
74 ECO-EFFICIENCY FOR THE DAIRY PROCESSING INDUSTRY
Anaerobic digestion of food-processing wastewater produces biogas that may be able to
supplement your plant’s thermal energy requirements.
Utilisation of biogas: Warrnambool Cheese and Butter, Allansford
Warrnambool Cheese and Butter in Allansford installed an anaerobic digester in 1993 to
recover biogas for use as a fuel source in their boilers. The project was only moderately
successful, due to problems encountered with maintaining a constant gas supply pressure to
the boilers and the presence of moisture in the gas. The biogas was not refined in any way,
and it caused excessive corrosion in the boiler combustion chamber. The use of the biogas was
suspended in July 2003 pending further investigation and improvements to the operation. But
it has the potential to provide 80–100% of the energy requirements for the production of hotwater at the site and save $290 000/yr.
Anaerobic wastewater treatment in a whey processing company: Borculo Whey Products,
The Netherlands1
Borculo Whey Products previously had an aerobic wastewater treatment plant that used
substantial amounts of electricity and produced large amounts of sludge. The system required
upgrading and was replaced with a more energy-efficient anaerobic treatment system —
an upflow anaerobic sludge blanket (UASB). The new system reduced energy demand for
aeration by 930 750 kW h/yr and reduced energy demand for treatment and transport of
sludge by 25 000 MW h/yr. Methane was also used in the manufacturing process, which
reduced natural gas consumption by 700 000 m3 /yr. The total cost of the anaerobic treatment
plant was US$1.8 million, with total savings in electricity, sludge handling and chemical
treatment costs of US$508 000/yr. The payback period for the total investment was 3.5 years.
Gas fuel for boilers from anaerobic digestion of food waste: fruit and vegetable
processor, Australia2
The up-flow anaerobic sludge-bed (UASB) effluent treatment system at Golden Circle produces
usable biogas as one of its by-products. The effluent system treats wastewater from fruit and
vegetable processing. The biogas is collected in the UASB reactors and compressed, and
pumped to a gas-fired boiler to supplement the existing coal-fired boilers. Golden Circle
collects and burns approximately 2.5 million m3 of biogas per year, saving $100 000/yr in coal
costs. This will improve further when the company’s gas storage capacity is increased.
1 CADDET 1996b
2 UNEP Working Group for Cleaner Production 2004
7/30/2019 Eco Efficiency Manual
http://slidepdf.com/reader/full/eco-efficiency-manual 86/153
ENERGY 75
4.6.2 Solar energy
Solar energy can be used to produce power (via photovoltaic cells) or as a source of
thermal energy. There is virtually no use of solar technology in dairy processing plants
to date. This is partly due to the relatively high capital cost of installation, but also
because some processing plants, particularly those that produce powdered products,
already have an adequate supply of thermal energy in the form of condensate water.
An advantage of solar heating systems is that, although they can have high initial costs,
operating costs are low if they are well designed and properly installed and
maintained. Dairy processing plants have large amounts of roof space that could be
utilised for solar collectors. Possible uses of solar heat energy are to pre-heat boiler
feedwater or hot water for cleaning.
4.6.3 Wind energy
Wind generators are a possible future source of alternative energy for those companies
that have a constant source of ‘clean wind’ (i.e. wind coming from a constant direction
and not made turbulent by nearby obstacles). In Australia the industry is growing, with
current generating capacity enough to provide power requirements for 83 000 homes.
Currently there are more than 2800 MW of wind generators in planning, enough for
over half a million households, and worth $5 billion in investment. Wind energy costs
about 7.5 cents/kW h to generate, and costs continue to fall at around 4%/yr (AusWEA
2004). For Australian dairy processors, as for most large manufacturers, wind power
is cost-prohibitive compared to traditional sources of power (i.e. coal-fired power
generation), and to date wind generators have not been used. Possible environmental
constraints to using wind power include noise and effect on visual amenity. Further
information can be found at the Australian Wind Energy Association website,
<www.auswea.com.au>.
Savings from pre-heating water using solar power: Zane Australia
Zane Australia uses around 100 kL of 80°C hot water daily for general cleaning and processing.
The cost of heating 100 kL of water from ambient temperature to 80°C using steam is around
$80 000/yr. If a solar heating system were used to preheat the water from ambienttemperature to 50–60°C, the cost of steam heating would be reduced by $44 600. A suitable
solar heating system similar to those used to heat swimming pools would cost $120 000 to
install. The solar absorber uses a low-pressure (50 kPa) unglazed solar absorber collection
system to supply heating to a water reservoir stored in an insulated tank. Such a system
would require a roof area of 1000 m2. The payback period would be 2.7 years.1
1 Ross Hamilton 2003, pers. comm.
7/30/2019 Eco Efficiency Manual
http://slidepdf.com/reader/full/eco-efficiency-manual 87/153
76 ECO-EFFICIENCY FOR THE DAIRY PROCESSING INDUSTRY
4.7 CogenerationCogeneration or combined heat and power (CHP) systems use a single source of fuel
to produce both electrical and thermal energy. The main advantage of a cogeneration
system is the overall system efficiency, which can be as high as 80%. In contrast, the
conversion efficiency of a conventional power station producing only power is only
about 36%, with the remainder lost as unrecovered heat. It has been demonstrated
that cogeneration results in a 20–30% reduction in energy costs with payback period
of 2–4 years and reductions in CO2 emissions of 50% (Kjaergaard-Jensen 1999). Upfront
capital cost, labour and operational costs are recovered by savings on energy prices.
Cogeneration plants that produce power in excess of factory requirements can export
the power to the grid.
4.7.1 Types of cogeneration
There are three main application opportunities for cogeneration:
Steam turbines require a source of high-pressure steam to produce electricity and
are mostly used when electricity demand is greater than 1 MW.
Gas turbines produce electricity while also providing a heat source suitable for
applications requiring high-pressure steam. They can be used for smaller-capacity
systems (from a fraction of a megawatt) and provide the flexibility of intermittent
operation.
Reciprocating engines can be operated as cogeneration systems by recovering the heat
from the engine exhaust and jacket coolant. Approximately 70–80% of fuel energy
input is converted to heat that can be recovered to produce hot water up to around
100°C, or low-pressure stream.
Gas turbines have been used in New Zealand dairy processing plants such as those at
Te Rapa, Te Awamutu and Hawera, which are owned by Fonterra.
Wind generator: dairy processor, UK1
Longley Dairy in West Yorkshire, UK installed a wind generator in 1986 which generated
approximately 9% of the dairy’s electricity demand. Base load demand for electricity at the
dairy is 230 kW and peak demand is 1420 kW, rising to 1500 kW in hot weather. The system
consists of a 23 m tower with a three-blade rotor of 17 m diameter with two 18 kW and
90 kW generators. The small generator begins to produce electricity at wind speeds of 3 m/s
and the large one at 5 m/s. Rated output is at 12 m/s and the average wind speed at the site
is 8 m/s. Electricity is generated at 415 V, eliminating the need for a transformer. The capital
cost of the system was UK£50 000 (1986 prices) including construction and installation, and
the payback period for the project was 6 years. Annual operating costs are minimal and
routine maintenance is carried out every 3 months for about 2 hours.
1 CADDET 1997
7/30/2019 Eco Efficiency Manual
http://slidepdf.com/reader/full/eco-efficiency-manual 88/153
7/30/2019 Eco Efficiency Manual
http://slidepdf.com/reader/full/eco-efficiency-manual 89/153
78 ECO-EFFICIENCY FOR THE DAIRY PROCESSING INDUSTRY
5 Yield optimisation and productrecovery
5.1 OverviewEfficiency in the utilisation of raw materials to optimise product yield is an important
aspect of eco-efficiency and has the greatest scope for financial and environmental
savings. Materials such as raw or pasteurised milk, cheese or whey, and components
of milk such as fat, lactose and protein can be lost from the process and end up in the
wastewater or solid waste stream. These losses are a waste of resources that could
otherwise be recovered as products or co-products. They also contribute to the
pollutant load of the wastewater stream, resulting in increased treatment and disposal
costs.
This section discusses opportunities to reduce waste in dairy manufacturing processes,
hence helping to optimise yield and efficiently utilise raw materials. These initiatives
can lead to the multiple benefits of reduced volumes of solid waste, reduced pollutant
loads in wastewater and increased yields of saleable products.
5.1.1 Sources of product lossSources of product loss in dairy processing plants are summarised in Table 5.1. Some
sources of loss are unavoidable or inherent due to equipment design (e.g. separatorde-sludge), while others may be due to poor operating procedures or process control.
Opportunities to minimise loss are discussed throughout the chapter.
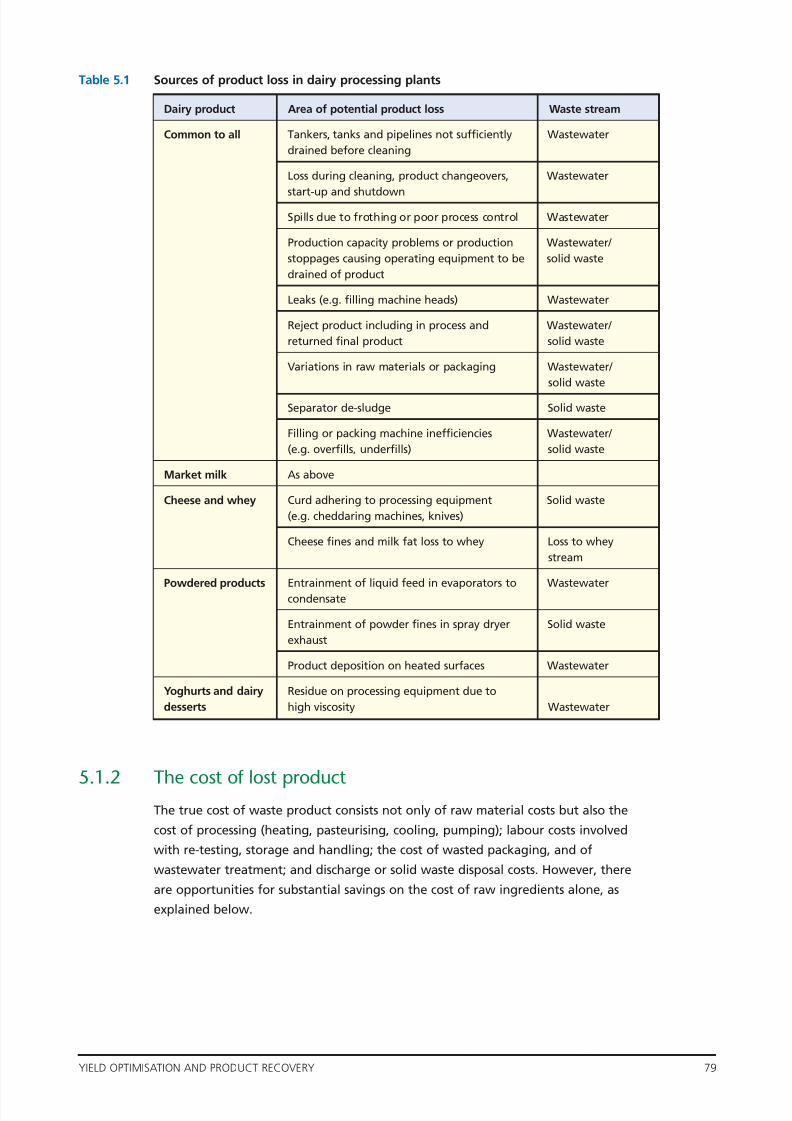
7/30/2019 Eco Efficiency Manual
http://slidepdf.com/reader/full/eco-efficiency-manual 90/153
YIELD OPTIMISATION AND PRODUCT RECOVERY 79
Table 5.1 Sources of product loss in dairy processing plants
5.1.2 The cost of lost productThe true cost of waste product consists not only of raw material costs but also the
cost of processing (heating, pasteurising, cooling, pumping); labour costs involved
with re-testing, storage and handling; the cost of wasted packaging, and of
wastewater treatment; and discharge or solid waste disposal costs. However, there
are opportunities for substantial savings on the cost of raw ingredients alone, as
explained below.
Dairy product Area of potential product loss Waste stream
Common to all Tankers, tanks and pipelines not sufficiently Wastewater
drained before cleaning
Loss during cleaning, product changeovers, Wastewater
start-up and shutdown
Spills due to frothing or poor process control Wastewater
Production capacity problems or production Wastewater/
stoppages causing operating equipment to be solid waste
drained of product
Leaks (e.g. filling machine heads) Wastewater
Reject product including in process and Wastewater/
returned final product solid waste
Variations in raw materials or packaging Wastewater/
solid waste
Separator de-sludge Solid waste
Filling or packing machine inefficiencies Wastewater/
(e.g. overfills, underfills) solid waste
Market milk As above
Cheese and whey Curd adhering to processing equipment Solid waste
(e.g. cheddaring machines, knives)
Cheese fines and milk fat loss to whey Loss to whey
stream
Powdered productsEntrainment of liquid feed in evaporators to Wastewater
condensate
Entrainment of powder fines in spray dryer Solid waste
exhaust
Product deposition on heated surfaces Wastewater
Yoghurts and dairy Residue on processing equipment due to
desserts high viscosity Wastewater
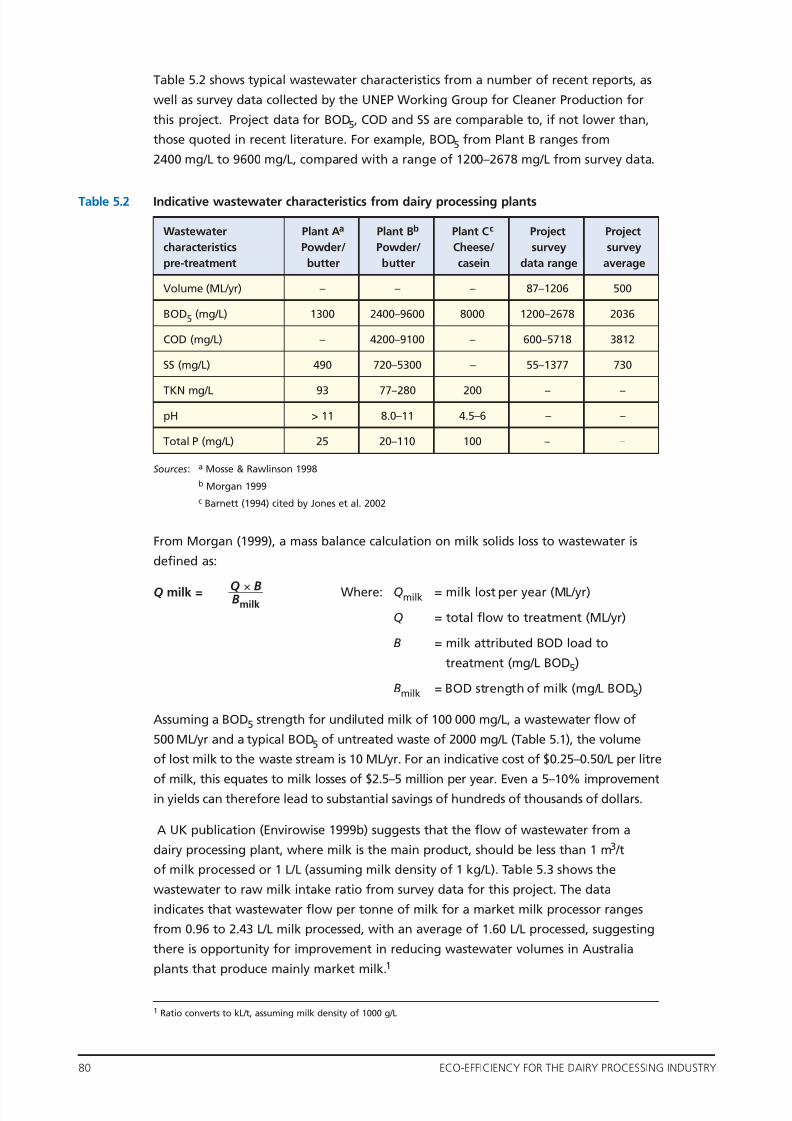
7/30/2019 Eco Efficiency Manual
http://slidepdf.com/reader/full/eco-efficiency-manual 91/153
80 ECO-EFFICIENCY FOR THE DAIRY PROCESSING INDUSTRY
Table 5.2 shows typical wastewater characteristics from a number of recent reports, as
well as survey data collected by the UNEP Working Group for Cleaner Production for
this project. Project data for BOD5, COD and SS are comparable to, if not lower than,
those quoted in recent literature. For example, BOD5 from Plant B ranges from
2400 mg/L to 9600 mg/L, compared with a range of 1200–2678 mg/L from survey data.
Table 5.2 Indicative wastewater characteristics from dairy processing plants
Sources: a Mosse & Rawlinson 1998
b Morgan 1999
c Barnett (1994) cited by Jones et al. 2002
From Morgan (1999), a mass balance calculation on milk solids loss to wastewater is
defined as:
Where: Qmilk = milk lost per year (ML/yr)
Q = total flow to treatment (ML/yr)
B = milk attributed BOD load to
treatment (mg/L BOD5)
Bmilk = BOD strength of milk (mg/L BOD5)
Assuming a BOD5 strength for undiluted milk of 100 000 mg/L, a wastewater flow of
500 ML/yr and a typical BOD5 of untreated waste of 2000 mg/L (Table 5.1), the volume
of lost milk to the waste stream is 10 ML/yr. For an indicative cost of $0.25–0.50/L per litre
of milk, this equates to milk losses of $2.5–5 million per year. Even a 5–10% improvementin yields can therefore lead to substantial savings of hundreds of thousands of dollars.
A UK publication (Envirowise 1999b) suggests that the flow of wastewater from a
dairy processing plant, where milk is the main product, should be less than 1 m3 /t
of milk processed or 1 L/L (assuming milk density of 1 kg/L). Table 5.3 shows the
wastewater to raw milk intake ratio from survey data for this project. The data
indicates that wastewater flow per tonne of milk for a market milk processor ranges
from 0.96 to 2.43 L/L milk processed, with an average of 1.60 L/L processed, suggesting
there is opportunity for improvement in reducing wastewater volumes in Australia
plants that produce mainly market milk.1
1 Ratio converts to kL/t, assuming milk density of 1000 g/L
Wastewater Plant Aa Plant Bb Plant Cc Project Project
characteristics Powder/ Powder/ Cheese/ survey survey
pre-treatment butter butter casein data range average
Volume (ML/yr) – – – 87–1206 500
BOD5 (mg/L) 1300 2400–9600 8000 1200–2678 2036
COD (mg/L) – 4200–9100 – 600–5718 3812
SS (mg/L) 490 720–5300 – 55–1377 730
TKN mg/L 93 77–280 200 – –
pH > 11 8.0–11 4.5–6 – –
Total P (mg/L) 25 20–110 100 – –
Q milk =ᎏ
QBm×
ilBkᎏ
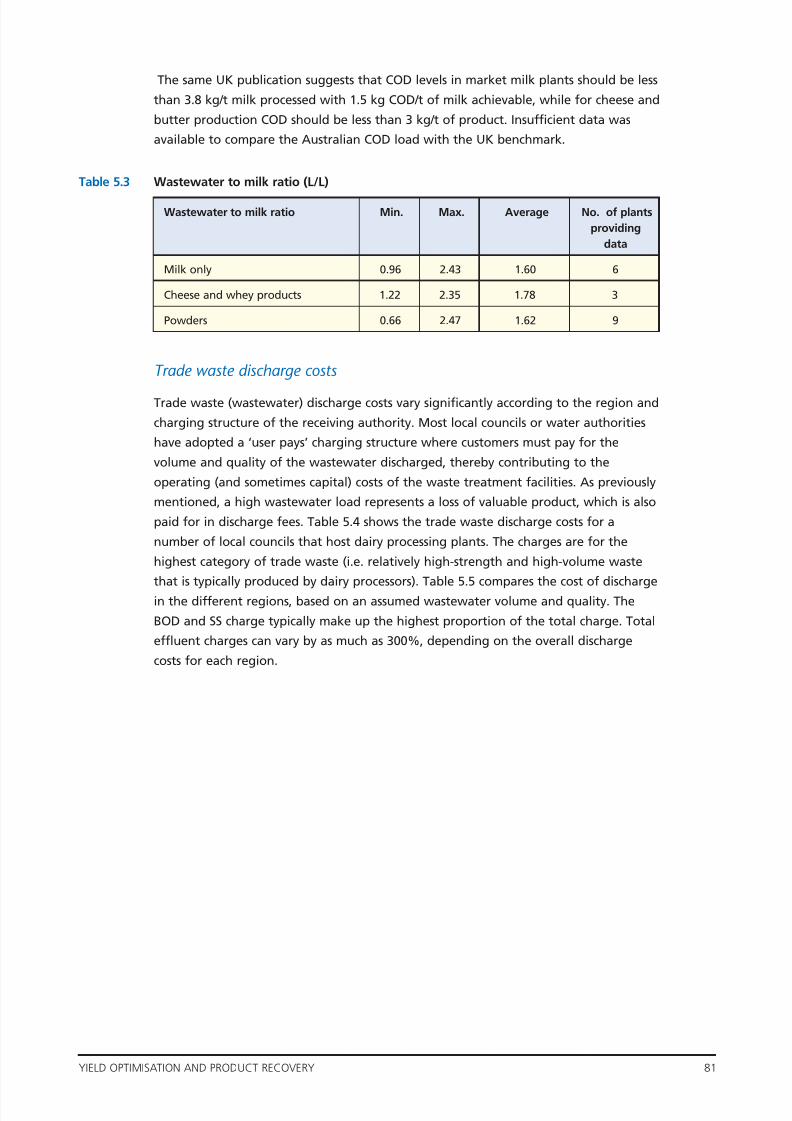
7/30/2019 Eco Efficiency Manual
http://slidepdf.com/reader/full/eco-efficiency-manual 92/153
YIELD OPTIMISATION AND PRODUCT RECOVERY 81
The same UK publication suggests that COD levels in market milk plants should be less
than 3.8 kg/t milk processed with 1.5 kg COD/t of milk achievable, while for cheese and
butter production COD should be less than 3 kg/t of product. Insufficient data was
available to compare the Australian COD load with the UK benchmark.
Table 5.3 Wastewater to milk ratio (L/L)
Trade waste discharge costs
Trade waste (wastewater) discharge costs vary significantly according to the region and
charging structure of the receiving authority. Most local councils or water authorities
have adopted a ‘user pays’ charging structure where customers must pay for the
volume and quality of the wastewater discharged, thereby contributing to the
operating (and sometimes capital) costs of the waste treatment facilities. As previously
mentioned, a high wastewater load represents a loss of valuable product, which is also
paid for in discharge fees. Table 5.4 shows the trade waste discharge costs for a
number of local councils that host dairy processing plants. The charges are for the
highest category of trade waste (i.e. relatively high-strength and high-volume waste
that is typically produced by dairy processors). Table 5.5 compares the cost of discharge
in the different regions, based on an assumed wastewater volume and quality. The
BOD and SS charge typically make up the highest proportion of the total charge. Total
effluent charges can vary by as much as 300%, depending on the overall discharge
costs for each region.
Wastewater to milk ratio Min. Max. Average No. of plants
providing
data
Milk only 0.96 2.43 1.60 6
Cheese and whey products 1.22 2.35 1.78 3
Powders 0.66 2.47 1.62 9

7/30/2019 Eco Efficiency Manual
http://slidepdf.com/reader/full/eco-efficiency-manual 93/153
82 ECO-EFFICIENCY FOR THE DAIRY PROCESSING INDUSTRY
Table 5.4 Trade waste charges in various regionsa
a As at July 2004b Incorporates quality charges
Table 5.5 Comparison of trade waste charges for Plant Aa
a Based on council charge, June 2004
b Costs take into account domestic allowances limits
Wastewater Brisbane Ipswich Sydney Gippsland Goulburn Devonport
load Water Water Water Water Valley City
Water Council
Volume $0.43/kL $0.93/kL $1.12/kL Average $0.34/kL $0.237/kL
$1.10/kLb
BOD5 $1.14/kg $1.15/kg $0.099 + – $0.075/kg $0.531/kg
($0.0166 ×
BOD/600)/kg
SS $0.48/kg $0.76/kg $0.71/kg – – $0.132/kg
Nitrogen $0.43/kg $0.80/kg $0.14/kg – $0.37/kg –
Phosphorus $0.71/kg $3.00/kg $1.11/kg – $0.84/kg –
Grease – – $1.00/kg – – $3.07/kg
Sodium – – – – $0.47/kg –
Wastewater Assumed Brisbane Ipswich Sydney Gippsland Goulburn Devonport
characteristic load Water Water Water Water Valley Water City
($/day) ($/day)b ($/day)b ($/day) ($/day) Council
Volume 1 ML/day 430 930 1120 1100 340 237
BOD5 2000 mg/L 2280 1955 262 – 150 1062
SS 500 mg/L 240 152 213 – – 66
Nitrogen 100 mg/L 43 32 7 – 37 –
Phosphorus 100 mg/L 71 255 100 – 84 –
Grease 500 mg/L – – 450 – – 1535
Sodium 500 mg/L – – – – 235
Total charge
for Plant A $3064 $3294 $2152 $1100 $846 $2900
7/30/2019 Eco Efficiency Manual
http://slidepdf.com/reader/full/eco-efficiency-manual 94/153
YIELD OPTIMISATION AND PRODUCT RECOVERY 83
5.1.3 Further reading
Publications with comprehensive information on wastewater management, waste
minimisation and product recovery include:
• Milk processing effluent stream characterisation and utilisation (Morgan 1999)
• Sources of wastage in the dairy industry (Hale et al. 2003)
• Recovery of milk constituents from cleaning solutions used in the dairy industry
(Houlihan et al. 1999)
• Environmental management tools for the dairy processing industry (Jones et al. 2002).
These reports discuss product loss prevention for various dairy processing operations.
Opportunities discussed in the reports include:
• design of processing plant
• waste characterisation
• optimisation of cleaning systems
• recovery of fat from cream, butter streams and buttermilk
• optimisation of product yield in milk, butter, cheese, powder and whey processing
• waste minimisation in evaporation and spray drying.
This chapter does not attempt to ‘reinvent the wheel’, and therefore does not provide
detailed discussion of aspects that have been covered in past publications. Instead, it
gives examples of waste minimisation and yield optimisation carried out by Australiandairy processors, and refers to past publications where appropriate.
5.2 Waste minimisationAn effective waste minimisation program will decrease the load on a wastewater
treatment plant, reduce solid organic waste and lead to increased product yield and
savings in energy, chemicals, water and possibly labour. In the case of wastewater, it
has been found that losses indicated by product mass balances are much less than
those determined from wastewater analysis. For example, tests by Harper and co-
workers gave an average loss of 5.4% (from analysis of wastewater streams), whereas
plant records showed losses of 1.4% (Harper et al. 1971, as cited in Houlihan et al.
1999). The accurate measurement of wastewater volumes and loads will therefore
provide a more comprehensive picture of where losses are occurring, and this is one of
the first steps in a waste minimisation program. Important steps in waste minimisation
are to:
• determine the sources of wastewater
• locate or install effluent meters and sampling points to determine the volume and
pollutant load of the plant’s wastewater

7/30/2019 Eco Efficiency Manual
http://slidepdf.com/reader/full/eco-efficiency-manual 95/153
84 ECO-EFFICIENCY FOR THE DAIRY PROCESSING INDUSTRY
• regularly monitor the volume and load of wastewater and set up a system for data
processing and reporting
• identify opportunities for improvement
• implement the opportunities
• monitor performance.
A comprehensive approach to waste minimisation is covered in the publication
Environmental management tools for the dairy processing industry (Jones et al. 2002).
Separating wastewater streams on the basis of quality can also reduce the load on
wastewater treatment systems, and give opportunities for reuse that would not arise
if the streams were combined (e.g. separating whey streams for further treatment).
5.3 Improving plant layout and designWaste can be generated as a result of poorly designed processes or processing
equipment. Plants should be designed to have a direct and logical flow of materials
and processes. Waste should not be accepted as normal practice, and each process
step should be designed to keep waste at an absolute minimum. The relocation or
modification of existing factories provides a good opportunity to consider possible
sources of waste and how they can be eliminated or reduced. Areas of waste in dairy
processing plants identified by Houlihan and co-workers (1999) include insufficient
sloping of pipes, installation of pumps in a configuration that does not facilitate
complete drainage, and failure to allow adequate drainage time for equipment.
It is also good practice to consider the potential for generating waste when selecting
new equipment (e.g. ease of cleaning), and this can be included in plant selection or
modification criteria.
Daily monitoring of loss: Murray Goulburn, Maffra
Murray Goulburn in Maffra uses the daily production meeting to discuss product loss/yield
results. For significant incidents a loss declaration form is completed and followed up. This has
raised awareness of product yield, and product losses have decreased over the past few years.
Reducing effluent during cheese-making: Bonlac Foods, Cororooke
An alternative to wet pre-stretcher salting of mozzarella cheese was investigated at Bonlac
in Cororooke. A commercial dry salt application system for mozzarella post-stretching was
purchased and trialled, with the aim of eliminating or at least reducing the effluent stream
from pre-salting. It was found that the product made by the dry salt method did not have the
required body characteristics and often contained pockets of undissolved salt. Trials on the
new system were therefore abandoned.
Environmental criteria for new installations: Murray Goulburn, Maffra
Murray Goulburn in Maffra, in conjunction with its formal economic and technical evaluations
of new plants, also considers environmental issues for all new installations — for example,
expected water consumption and how it can be minimised.
7/30/2019 Eco Efficiency Manual
http://slidepdf.com/reader/full/eco-efficiency-manual 96/153
YIELD OPTIMISATION AND PRODUCT RECOVERY 85
5.4 Efficient processing and process controlWaste can occur through poor process control, such as overfilling of tanks during
processing or inadequate detection of product interfaces. The use of improved and
more reliable instrumentation to detect product interfaces, such as conductivity or
turbidity meters, is helping the dairy industry to reduce product waste and increase
yields.
The reports Milk processing effluent stream characterisation and utilisation (Morgan
1999) and Sources of wastage in the dairy industry (Hale et al. 2003) review the types of
instrumentation that are currently available for measuring and characterising waste. Also
discussed is the importance of calibration. The Morgan report suggests that the most
appropriate instrumentation for waste characterisation for a dairy processing plant
(Bonlac Foods, Cobden) consists of (a) a self-cleaning light absorption turbidity meter
for quick responses to changes in milk solids concentration, and (b) a combination of
temperature, pH and conductivity meters to monitor CIP frequency and effectiveness,
and chemical loss. The report also suggests the use of closed-circuit television on maineffluent streams; this has been adopted by many Australian dairy processors, along with
audible factory alarms to notify operators of abnormal waste flows.
The use of online instrumentation for measuring components such as phosphorus,
nitrogen, fat, protein, BOD and COD has great potential for improving product yields.
Instrumentation that is being developed includes near-infrared spectrophotometry and
UV extinction, also known as nephelometry or turbidimetry (Hannemann 2003;
Morgan 1999). Inline fat and protein monitoring systems that can monitor and control
the composition of powders by measuring the viscosity of concentrated feed milk are
being developed. The monitors allow for improved quality control, reduced product
loss and better energy utilisation (Callaghan 1998).
A challenge that comes with reliance on process control systems — particularly
operator interface units — is that operators can be unfamiliar with the practical
operation of the plant to the extent that pumps, pipelines or valves cannot be
physically identified or located. This should be taken into consideration when
operators are trained, to increase their skills in troubleshooting operational problems.
Advanced process control
Advanced process control systems use sophisticated software to fine-tune operatingprocesses, using such elements as feed-forward or cascade control schemes; time-delay
compensators; self-tuning or adaptive algorithms; or optimisation strategies (Willis and
Tham 2004). The end result is to increase product yield by increasing process stability
and reducing product variability, with the additional benefits of reducing energy
consumption and process wastes. Dairy processors have used advanced process control
systems to fine-tune the operation of equipment including pasteurisers, dryers and
evaporators.
7/30/2019 Eco Efficiency Manual
http://slidepdf.com/reader/full/eco-efficiency-manual 97/153
86 ECO-EFFICIENCY FOR THE DAIRY PROCESSING INDUSTRY
5.5 Milk receival, initial processing and storageWaste can occur during the receival and initial processing stages if tankers and
pipelines are not properly drained, due to poor equipment design or simply to
insufficient time. To minimise the chance of spillage or leakage, tankers should be
completely drained before the product hose is disconnected. Hoses should also becompletely drained so that spills do not occur, and facilities should be installed to
collect spillages (Hale et al. 2003). Loss of raw milk can accidentally occur during tank
filling and storage due to overfilling of tanks, foaming, or inadequate drainage of
tanks and lines before they are cleaned. A suitable monitoring and control system can
overcome this and help prevent product loss from tank overfilling (high level) or foam
formation (agitation during low tank levels).
Tankers should not stand for more than an hour before being unloaded; otherwise
creaming occurs, which leads to losses of product during rinsing and cleaning. Once
creaming occurs it is very difficult to stop the milk fat adhering to the side of the tank,
even with extensive agitation (Hale et al. 2003).
Silo emptying matrix: Bonlac Foods, Cobden
Bonlac in Cobden is developing a silo emptying matrix that allows some silos and pipelines
to be emptied completely. The use of the matrix is expected to improve product yields by
reducing loss to wastewater during cleaning.
Effluent stream alarm: Murray Goulburn, Maffra
Murray Goulburn uses a probe to measure the turbidity of the effluent stream, which sets off
an alarm on a pager carried by production supervisors when set points are exceeded, alertingthem to potential product losses to drain.
Advanced process control: Murray Goulburn, Koroit1
Murray Goulburn in Koroit and Predictive Control Pty Ltd undertook a project in 2000 to
examine the potential for advanced process control (APC) technology to enhance the
operation of evaporators and spray dryers. The technology involved using model predictive
controllers for integrative control to keep the process achieving its maximum potential. The
system consisted of an evaporative controller, a dryer outlet temperature controller, a dryer
moisture controller and an optimiser to coordinate the evaporator and dryer. Constant
maximum evaporation was achieved by manipulating the evaporator feed rate, taking into
consideration the concentrate tank level and dryer feed rate. The results of the project
indicated that, for a 70 000 L/h evaporator, there was potential to increase powder production
capacity by 3%, equating to savings of $491 000/yr for a project cost of $192 000 and a yearlysupport contract of $20 000. Additional savings in energy costs were not quantified.
1 Mackay 2002
Use of isolating valves: National Foods, Salisbury
National Foods in Salisbury installed extra valves to isolate the lines between each of its three
silos, to stop the lines filling when milk was being unloaded into individual silos. Without the
isolation valves the milk in these lines was being lost to drain when water purging took place.
The cost of implementation was $15 000, with a payback period of only 3 months.
7/30/2019 Eco Efficiency Manual
http://slidepdf.com/reader/full/eco-efficiency-manual 98/153
YIELD OPTIMISATION AND PRODUCT RECOVERY 87
5.6 Minimising product waste during processing
5.6.1 Optimising start-up and shutdown procedures and changeovers
There are waste-reduction opportunities in improving start-up and shutdown
procedures, by fine-tuning timers and accurately detecting product interfaces (as
discussed in section 5.4). Start-up times, in particular, have the most potential for
loss because operating processes have not reached a stable mode. Procedures to
accommodate unexpected shutdowns (e.g. due to loss of power or steam) will also
minimise the potential for loss.
5.6.2 Optimising product formulation
Accurate formulation of dairy products presents opportunities for the most substantial
savings in dairy processing plants. The use of computer programs is common, providing
accurate figures for the blending of ingredients. Many dairy processing plants also
standardise milk and milk powders with retentates and permeates, to adjust the fat
and protein content and produce a more consistent product while also reducing
potential waste streams.
Reclaim system for power loss: Murray Goulburn, Koroit
Murray Goulburn in Koroit installed a product reclaim system for site evaporators that reduces
losses during major power flicks and boiler failures. Additional storage was provided, so that
product that does not meet specification can be stored and fed back into the system once it is
back online. The initiative saves $50 000/yr, with a payback period of 2 years.
Fine-tuning start-up and shutdown: National Foods, CrestmeadNational Foods in Crestmead fine-tuned its product start-up and shutdown operation by
reviewing product interfaces and reducing timers to maximise product recovery. The review
led to annual savings of $40 000 or around 60 000 L of milk.
Optimising product formulation: Dairy Farmers, Mount Gambier
Dairy Farmers in Mount Gambier introduced a more accurate method of calculating the
required amount of skim milk powder for making modified milks. Rather than relying on a set
ratio of skim milk powder to milk, they developed an Excel spreadsheet, based on Pearson’s
Square, which enabled operators to calculate the ratio required for each batch to meet
product specifications. The initiative reduced the plant’s use of skimmed milk power by
approximately 100 kg per 100 kL, resulting in a saving of $65 000/yr.
Use of milk permeate for standardisation of powders: Warrnambool Cheese and Butter,
Allansford
Warrnambool Cheese and Butter in Allansford recovers milk permeate from an ultrafiltration
plant to standardise milk powder. Almost 100% of the milk permeate is utilised for standardising,
and any excess permeate is sold off to other dairy companies. A major challenge was setting up
the standardising equation in the logic control system to ensure that the quantity of permeate
used did not reduce the protein levels below specification. The payback period for the project
was 8 months.
Computer-generated product formulation: Dairy Farmers, Shepparton
Dairy Farmers in Shepparton uses formulation computer charts to impose tighter control on
product mixes and to reduce the likelihood of manufacturing products outside specifications.
Savings are generated by reducing the reworking of product and wastage of packagingmaterials and labour.
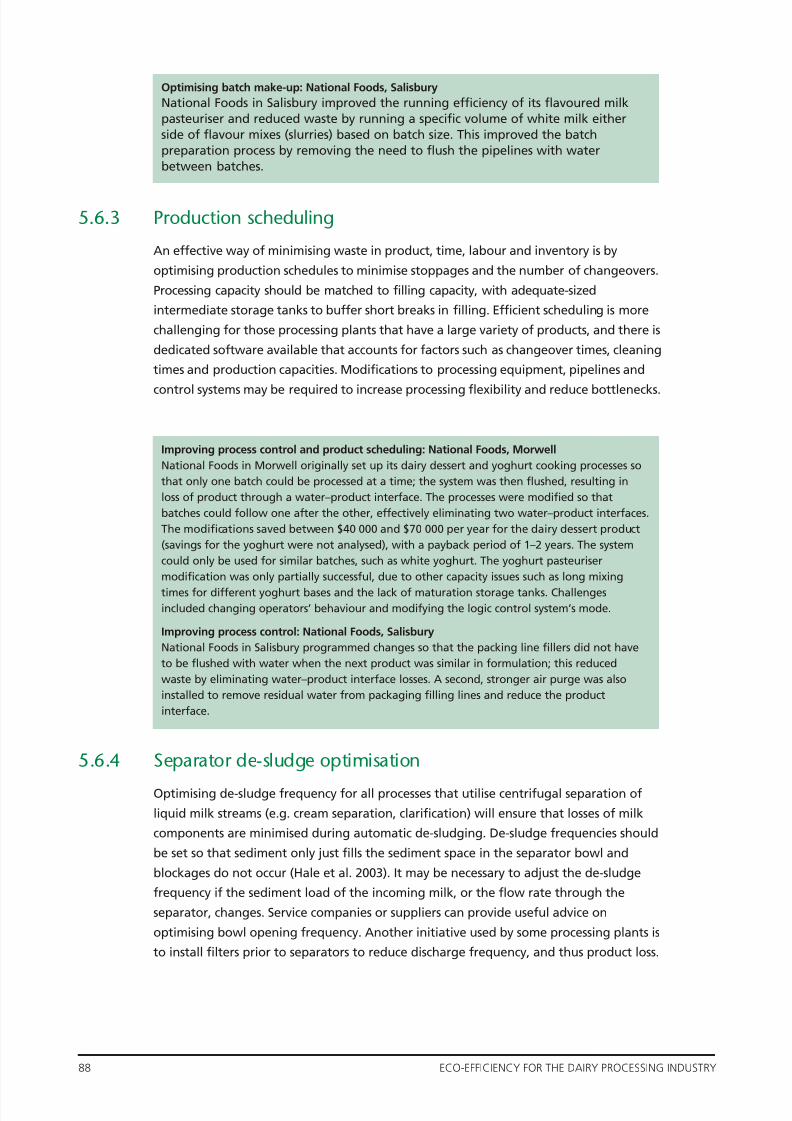
7/30/2019 Eco Efficiency Manual
http://slidepdf.com/reader/full/eco-efficiency-manual 99/153
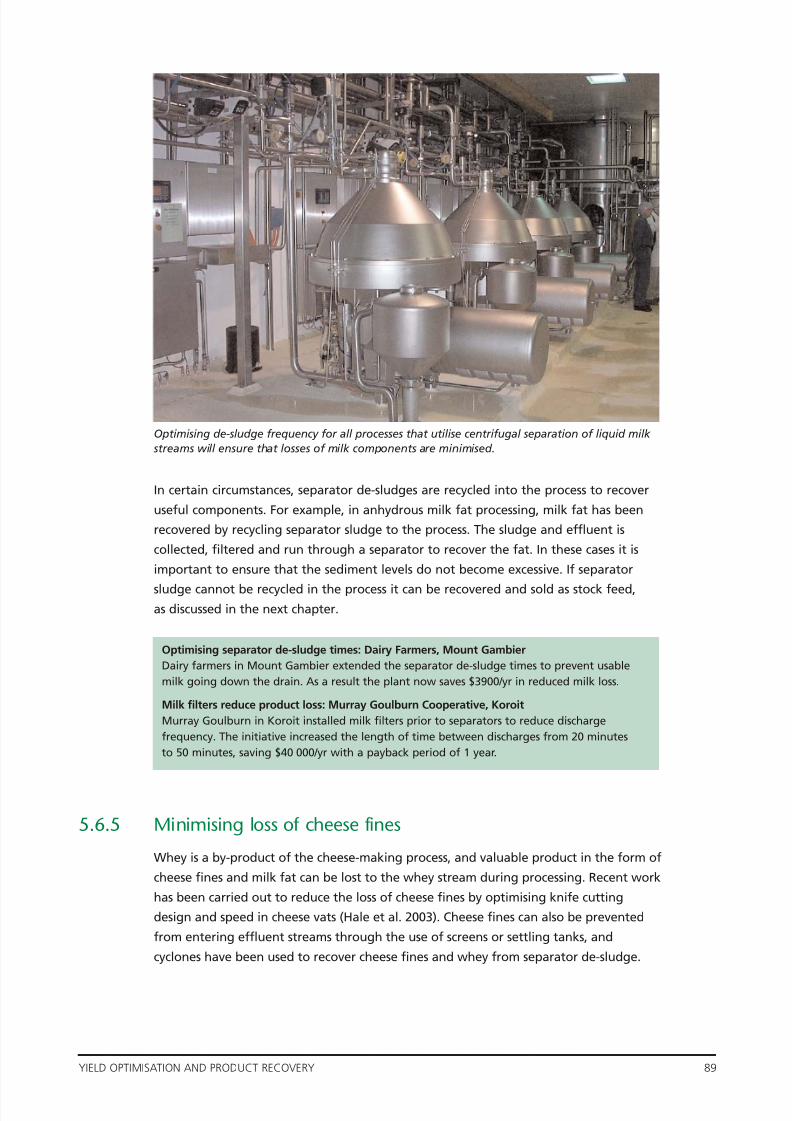
7/30/2019 Eco Efficiency Manual
http://slidepdf.com/reader/full/eco-efficiency-manual 100/153
YIELD OPTIMISATION AND PRODUCT RECOVERY 89
In certain circumstances, separator de-sludges are recycled into the process to recover
useful components. For example, in anhydrous milk fat processing, milk fat has been
recovered by recycling separator sludge to the process. The sludge and effluent is
collected, filtered and run through a separator to recover the fat. In these cases it is
important to ensure that the sediment levels do not become excessive. If separator
sludge cannot be recycled in the process it can be recovered and sold as stock feed,as discussed in the next chapter.
5.6.5 Minimising loss of cheese fines
Whey is a by-product of the cheese-making process, and valuable product in the form of
cheese fines and milk fat can be lost to the whey stream during processing. Recent work
has been carried out to reduce the loss of cheese fines by optimising knife cutting
design and speed in cheese vats (Hale et al. 2003). Cheese fines can also be prevented
from entering effluent streams through the use of screens or settling tanks, and
cyclones have been used to recover cheese fines and whey from separator de-sludge.
Optimising de-sludge frequency for all processes that utilise centrifugal separation of liquid milk
streams will ensure that losses of milk components are minimised.
Optimising separator de-sludge times: Dairy Farmers, Mount Gambier
Dairy farmers in Mount Gambier extended the separator de-sludge times to prevent usable
milk going down the drain. As a result the plant now saves $3900/yr in reduced milk loss.
Milk filters reduce product loss: Murray Goulburn Cooperative, Koroit
Murray Goulburn in Koroit installed milk filters prior to separators to reduce discharge
frequency. The initiative increased the length of time between discharges from 20 minutes
to 50 minutes, saving $40 000/yr with a payback period of 1 year.

7/30/2019 Eco Efficiency Manual
http://slidepdf.com/reader/full/eco-efficiency-manual 101/153
90 ECO-EFFICIENCY FOR THE DAIRY PROCESSING INDUSTRY
An effective method of increasing cheese yield and reducing the volume of whey
produced is to increase the moisture content of the cheese; however, there is a limit to
this as the cheese product can become too soft and be more susceptible to bacterial
spoilage.
Useful and comprehensive information on some of the more technical aspects of
maximising cheese yield can be found in the paper ‘Cheese yield’ (Lucey and Kelly 1994).
5.6.6 Spray dryers and evaporation
There is potential for significant loss in the production of condensed milk and milk
powders — mainly during start-up and shutdown, when operation has not stabilised,and when process equipment is being cleaned. Some loss is common in evaporators
due to deposition of product onto heating surfaces, and entrainment of product in the
vapour phase of multi-effect systems, leading to contaminated condensate. For dryers,
product entrained in the air stream is usually removed using cyclones and bag filters
or scrubbers. Online monitoring of evaporator condensate flows using turbidity or
conductivity are also often used to monitor for product loss due to entrainment. When
excessive entrainment is detected, flow can be automatically diverted to another use.
It is good practice to recover product during cleaning of evaporators or dryers by
collecting the initial rinse water for blending back into the process or, if the quality is
unsuitable, disposal as animal feed. Residual powders should also be recovered from
Increasing cheese moisture: Dairy Farmers, Jervois
Dairy farmers in Jervois increased its yield by standardising the moisture level in cheese. The
initiative saves around $600 000/yr.
Recovery of cheese fines and whey from separator de-sludge: Bonlac Foods, Stanhope
Bonlac in Stanhope use cyclones to recover cheese fines and liquid whey from whey room
separator de-sludge. It is estimated that the initiative will save the plant $170 000/yr, with a
payback period of 3 months. Challenges include keeping the product and separator cyclones
clean.
Recovery of cheese fines: Bonlac Foods, Stanhope1
Bonlac in Stanhope used two initiatives to prevent cheese fines from entering cheese roomwastewater. The first was to install screens at the points where the large losses occur. The
second was to install two large settling tanks in the whey room to capture cheese fines in the
process rinse water. The impact of the project was assessed by monitoring the total suspended
solids levels in the cheese room wastewater. The initiative aimed to decrease the amount of
solids being sent to the wastewater treatment plant and increase cheese production by over
17 700 kg/yr, or approximately 1% of production, worth approximately $100 000. The payback
period was expected to be less than 4 months.
Recovery of cheese product from Cheddar Masters: National Foods, Murray Bridge
National Foods in Murray Bridge fitted knockers to the draining conveyors of two Cheddar
Masters. It has been estimated that the initiative achieved a 75% reduction in waste for
cheeses with a high moisture content that required washing and a 95% in waste for Cheddar.
Recovery of cheese fines: Murray Goulburn, Leitchville
Murray Goulburn in Leitchville installed a vacuum bag sealer and implemented procedures
to hand-salt waste cheese fines for preservation. The initiative reduced solid waste from the
plant by 120 t and captured around $250 000 worth of product.
1 Environment Australia 1996
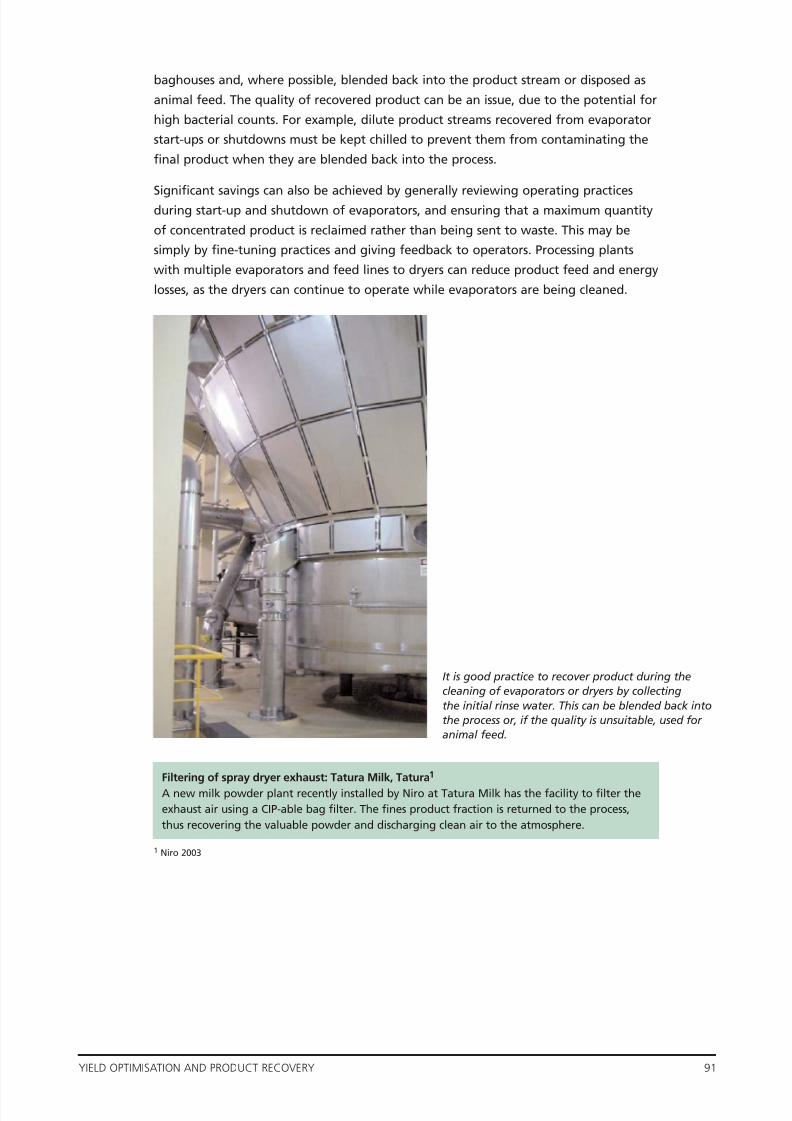
7/30/2019 Eco Efficiency Manual
http://slidepdf.com/reader/full/eco-efficiency-manual 102/153
YIELD OPTIMISATION AND PRODUCT RECOVERY 91
baghouses and, where possible, blended back into the product stream or disposed as
animal feed. The quality of recovered product can be an issue, due to the potential for
high bacterial counts. For example, dilute product streams recovered from evaporator
start-ups or shutdowns must be kept chilled to prevent them from contaminating the
final product when they are blended back into the process.
Significant savings can also be achieved by generally reviewing operating practicesduring start-up and shutdown of evaporators, and ensuring that a maximum quantity
of concentrated product is reclaimed rather than being sent to waste. This may be
simply by fine-tuning practices and giving feedback to operators. Processing plants
with multiple evaporators and feed lines to dryers can reduce product feed and energy
losses, as the dryers can continue to operate while evaporators are being cleaned.
It is good practice to recover product during the
cleaning of evaporators or dryers by collecting
the initial rinse water. This can be blended back into
the process or, if the quality is unsuitable, used for
animal feed.
Filtering of spray dryer exhaust: Tatura Milk, Tatura1
A new milk powder plant recently installed by Niro at Tatura Milk has the facility to filter the
exhaust air using a CIP-able bag filter. The fines product fraction is returned to the process,
thus recovering the valuable powder and discharging clean air to the atmosphere.
1 Niro 2003
7/30/2019 Eco Efficiency Manual
http://slidepdf.com/reader/full/eco-efficiency-manual 103/153
92 ECO-EFFICIENCY FOR THE DAIRY PROCESSING INDUSTRY
5.6.7 Product recovery during filling
Filling machines can be a source of significant loss, particularly when there are
operating problems and filling efficiencies are poor. Waste can also result from the
production of half-filled bottles produced during start-up and shutdown, or from
draining pipelines and filling machines. Milk can be collected for reprocessing, but
strict hygiene procedures must be adhered to, in order to prevent the risk ofcontamination from spoilt product.
5.7 Maximising product recovery during cleaningPoor or inefficient cleaning procedures can be a major source of product loss,
particularly if product is not recovered towards the end of production. The publication
Performance evaluation guide manual — cleaning systems (DPEC 1998/99) outlines a
process for the performance evaluation of cleaning procedures and systems for each
unit operation of a dairy processing plant. Another useful report is Recovery of milk
constituents from cleaning solutions used in the dairy industry (Houlihan et al. 1999).
5.7.1 Clean-in-place (CIP) systems
The detection of product–water interfaces is the most important aspect of product
recovery during cleaning. As discussed previously in section 5.4, they are usually
detected using turbidity or conductivity meters or timers. Process equipment should be
emptied as far as possible before commencing CIP; the mixing of product and cleaning
solutions should be avoided, as it only prolongs cleaning time and adds to wastage of
product and cleaning solution. First flush of process equipment should be collected
Milk recovery during filling: Dairy Farmers, Shepparton
Dairy Farmers in Shepparton collects milk bottles that are improperly capped during
packaging and empties the milk into a vessel to be put back through the pasteuriser. This cost
around $400 to implement and saves around 1000 L of milk per day.
The company also reduced loss during filling by modifying the bottle to decrease the volume
of milk lost through overfilling and reducing the fill level, tightening the margin for the
minimum quantity of milk in the bottle. Different thickness spacers on the filler tubes are used
to control milk levels for different product recipes. A roller device has been installed on the
3 L bottle filler exit; this helps reduce loss caused by the plastic bottles bellowing out slightlywhile filling and then expelling milk as they pass through the filler star wheels. The initiative
cost less than $1000 to implement.
Recovery of product during changeovers: Dairy Farmers, Bomaderry
Dairy Farmers in Bomaderry installed a valve arrangement, balance tank and product pump to
catch all interface product from bottling machine changeovers. Around 500 L/day is now
collected, producing a saving of $160/day. This product is reformulated into products such as
flavoured milks, which are then pasteurised as usual. Uncollected milk often used to spill to the
floor, so wastewater treatment costs have also been reduced. The payback period was 1 month.
Recovery of milk solids, Dairy Farmers, Booval
Dairy Farmers in Booval recovers valuable milk solids from product changeovers and
equipment flushing. Not only is the plant now producing a valuable product from its waste
but the reduction in milk solid loss has also resulted in savings in reduced trade waste costs.
The payback period was 12 months.
7/30/2019 Eco Efficiency Manual
http://slidepdf.com/reader/full/eco-efficiency-manual 104/153
YIELD OPTIMISATION AND PRODUCT RECOVERY 93
and, where possible, blended back into the process or treated and disposed of as
animal feed. Some CIP systems are designed so that pipes are drained of water at the
end of the cleaning cycle, which eliminates a water–product interface and minimises
the loss of product on start-up. Many factories also use filters to remove gross solids
(e.g. fruit pieces, cheese) on supply or return CIP lines.
Product wastage can be estimated by analysing the composition of cleaning solutionsduring each cleaning phase of CIP. Waste streams should be segregated into high- or
low-strength streams. These can be further treated to recover product, water or
chemicals or otherwise disposed to the effluent stream and/or possibly used for
irrigation. CIP systems are discussed in more detail in Chapter 3, ‘Water’.
Flush or burst rinsing of tanks and tankers (also discussed Chapter 3) has now been
adopted by Australian dairy processing companies. The procedure can save not only
in recovered product but also in water usage.
Another means of reducing product loss and minimising resource use is to minimise
the frequency of cleaning. In most factories that produce milk products, the production
runs can take about 8 hours, after which CIP is necessary. In the newest factory of the
Dutch dairy company Campina in Heilbronn, Germany, production runs of 72 hours are
reported (Somsen and Capelle 2002).
5.7.2 Pigging
Pigging systems utilise an inert, flexible plug which is propelled through a pipeline to
push out remaining product in preparation for cleaning. Pigging is generally used for
viscous products such as yoghurts, dairy desserts or cream. The advantage is that
minimal water is used during cleaning, so that maximum product recovery can be
achieved. The design of pigging systems is extremely important, to prevent the pig
from being lodged mid-pipe, delaying production and causing hygiene problems. An
alternative to pigging is to use sterilised air to push product through pipelines.
Flush rinsing of tankers: Murray Goulburn, Leitchville
Murray Goulburn in Leitchville flush-rinses cream tankers before CIP captures product in the milksilo. The project cost $1500 and saved approximately $60 worth of butterfat per tanker flush.
Recovery of cream and oil from AMF CIP: Bonlac, Stanhope
Bonlac in Stanhope, when producing ghee, recovers cream and oil from the anhydrous milk
first CIP rinse for use as feed. The initiative saves $27 000/yr, with a payback period of 1 year.
Replacement of pigging system: National Foods, Morwell
National Foods in Morwell installed a pigging system to recover yoghurt from various product
transfer pipelines. Design problems with the system caused the pig to be lodged at one end of
the pipe run, and there were problems with the line becoming contaminated with unsterilised
air. The decision was made to remove the system and install a series of valves to allow product
to be flushed out of the lines. The installation cost around $10 000 per line, resulting in
savings of up to $50 000/yr depending on the product line. The payback was between
1 and 2 years.
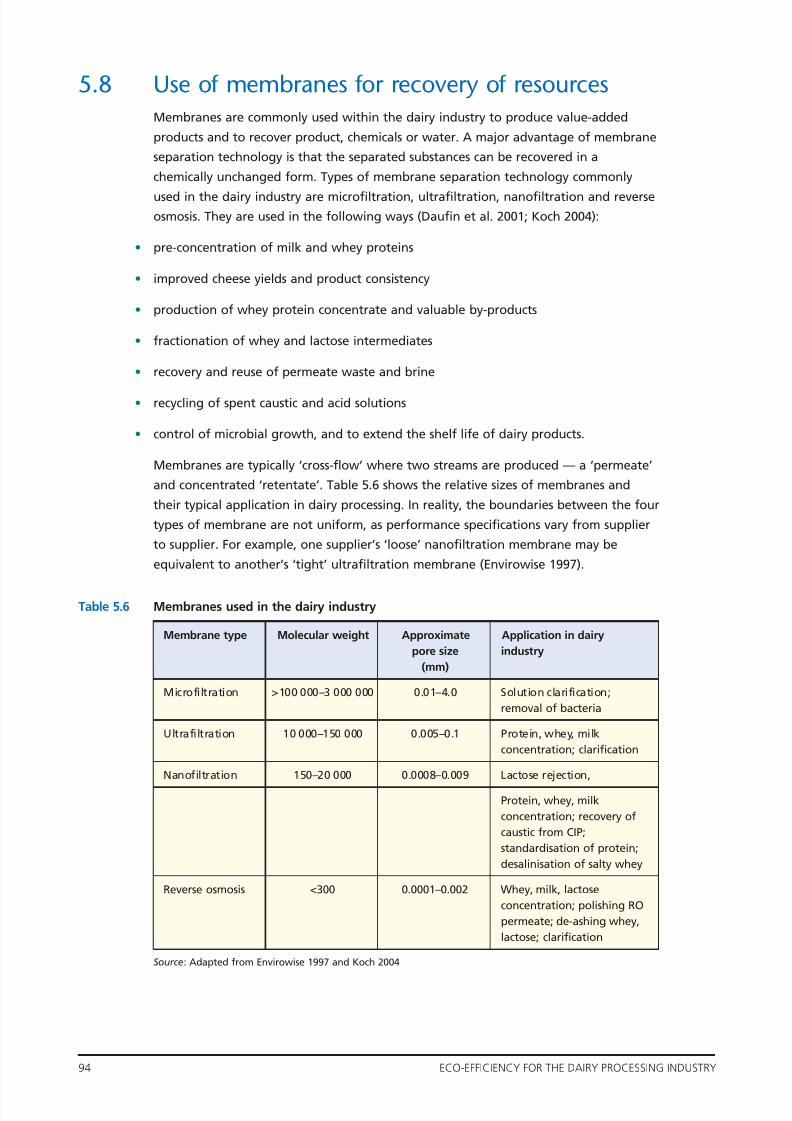
7/30/2019 Eco Efficiency Manual
http://slidepdf.com/reader/full/eco-efficiency-manual 105/153

7/30/2019 Eco Efficiency Manual
http://slidepdf.com/reader/full/eco-efficiency-manual 106/153
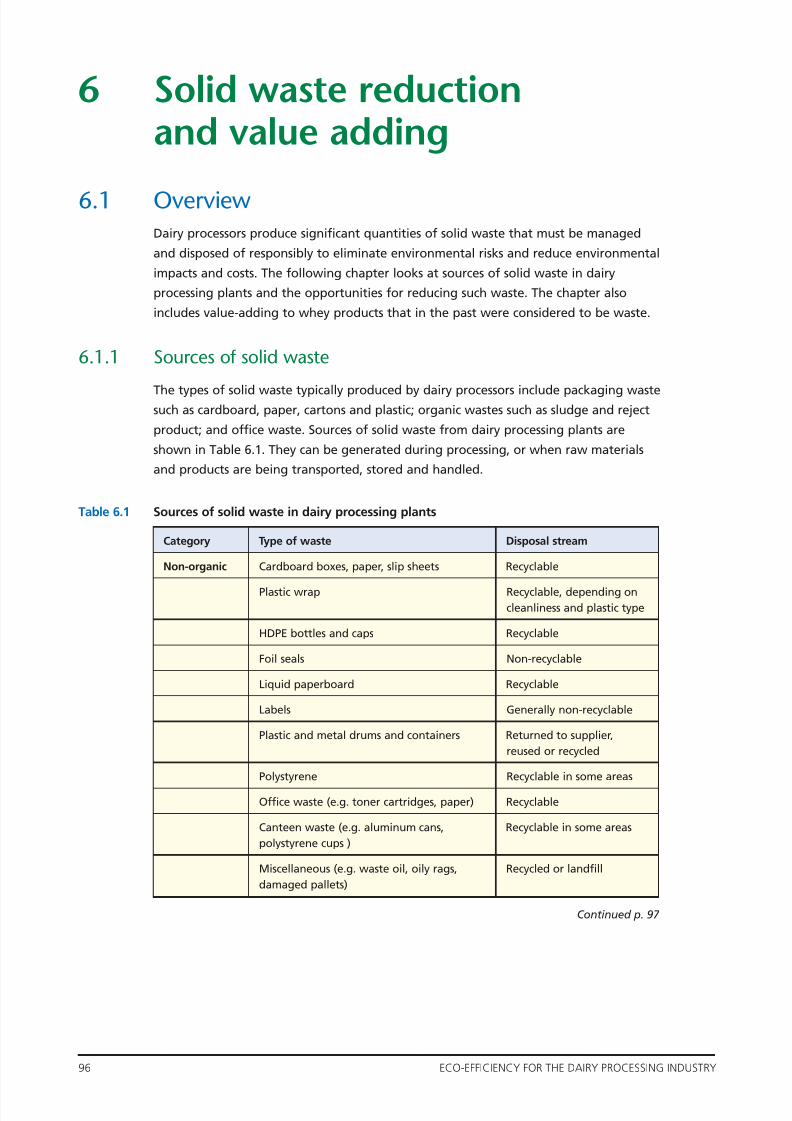
7/30/2019 Eco Efficiency Manual
http://slidepdf.com/reader/full/eco-efficiency-manual 107/153
96 ECO-EFFICIENCY FOR THE DAIRY PROCESSING INDUSTRY
6 Solid waste reductionand value adding
6.1 OverviewDairy processors produce significant quantities of solid waste that must be managed
and disposed of responsibly to eliminate environmental risks and reduce environmental
impacts and costs. The following chapter looks at sources of solid waste in dairy
processing plants and the opportunities for reducing such waste. The chapter also
includes value-adding to whey products that in the past were considered to be waste.
6.1.1 Sources of solid waste
The types of solid waste typically produced by dairy processors include packaging wastesuch as cardboard, paper, cartons and plastic; organic wastes such as sludge and reject
product; and office waste. Sources of solid waste from dairy processing plants are
shown in Table 6.1. They can be generated during processing, or when raw materials
and products are being transported, stored and handled.
Table 6.1 Sources of solid waste in dairy processing plants
Category Type of waste Disposal stream
Non-organic Cardboard boxes, paper, slip sheets Recyclable
Plastic wrap Recyclable, depending oncleanliness and plastic type
HDPE bottles and caps Recyclable
Foil seals Non-recyclable
Liquid paperboard Recyclable
Labels Generally non-recyclable
Plastic and metal drums and containers Returned to supplier,
reused or recycled
Polystyrene Recyclable in some areas
Office waste (e.g. toner cartridges, paper) Recyclable
Canteen waste (e.g. aluminum cans, Recyclable in some areas
polystyrene cups )
Miscellaneous (e.g. waste oil, oily rags, Recycled or landfill
damaged pallets)
Continued p. 97
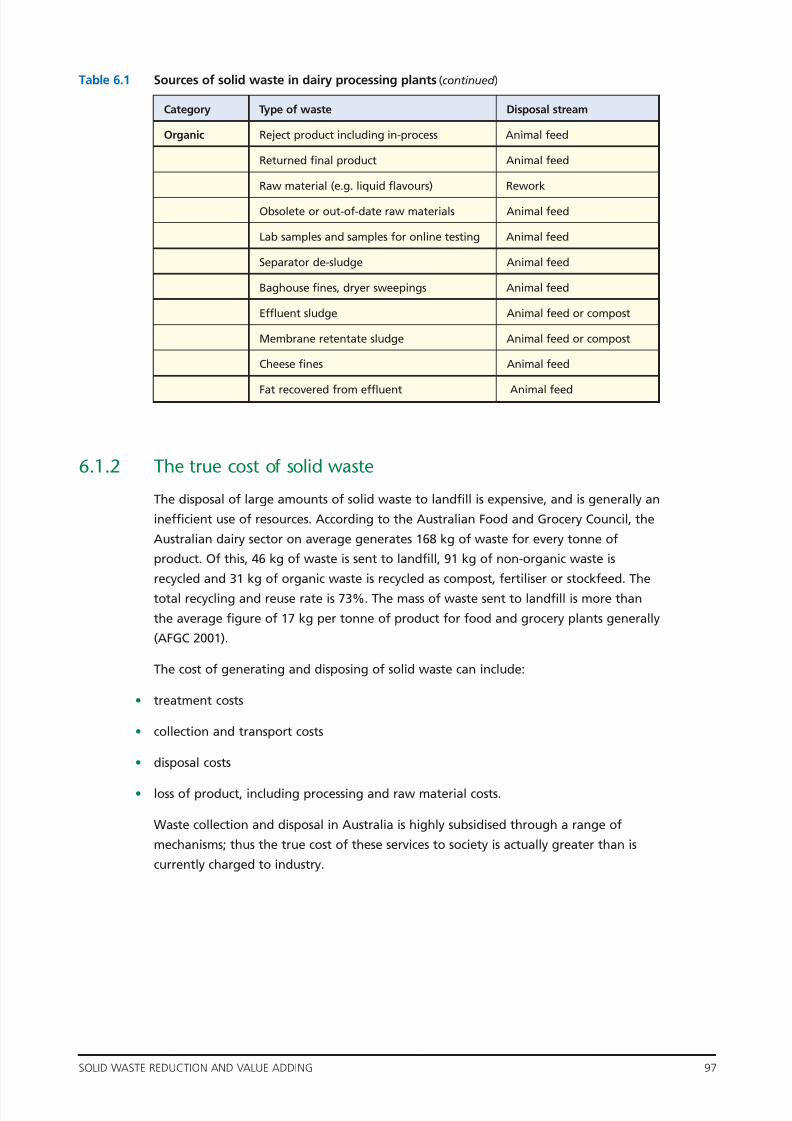
7/30/2019 Eco Efficiency Manual
http://slidepdf.com/reader/full/eco-efficiency-manual 108/153
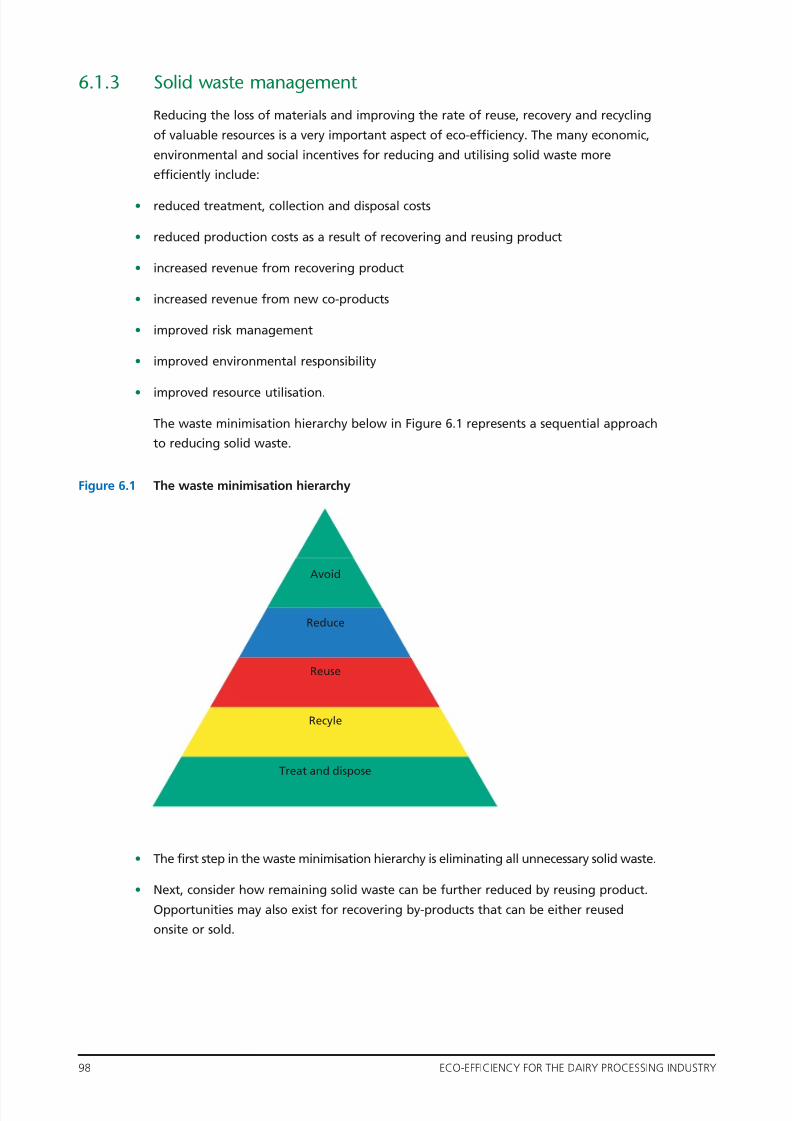
7/30/2019 Eco Efficiency Manual
http://slidepdf.com/reader/full/eco-efficiency-manual 109/153

7/30/2019 Eco Efficiency Manual
http://slidepdf.com/reader/full/eco-efficiency-manual 110/153
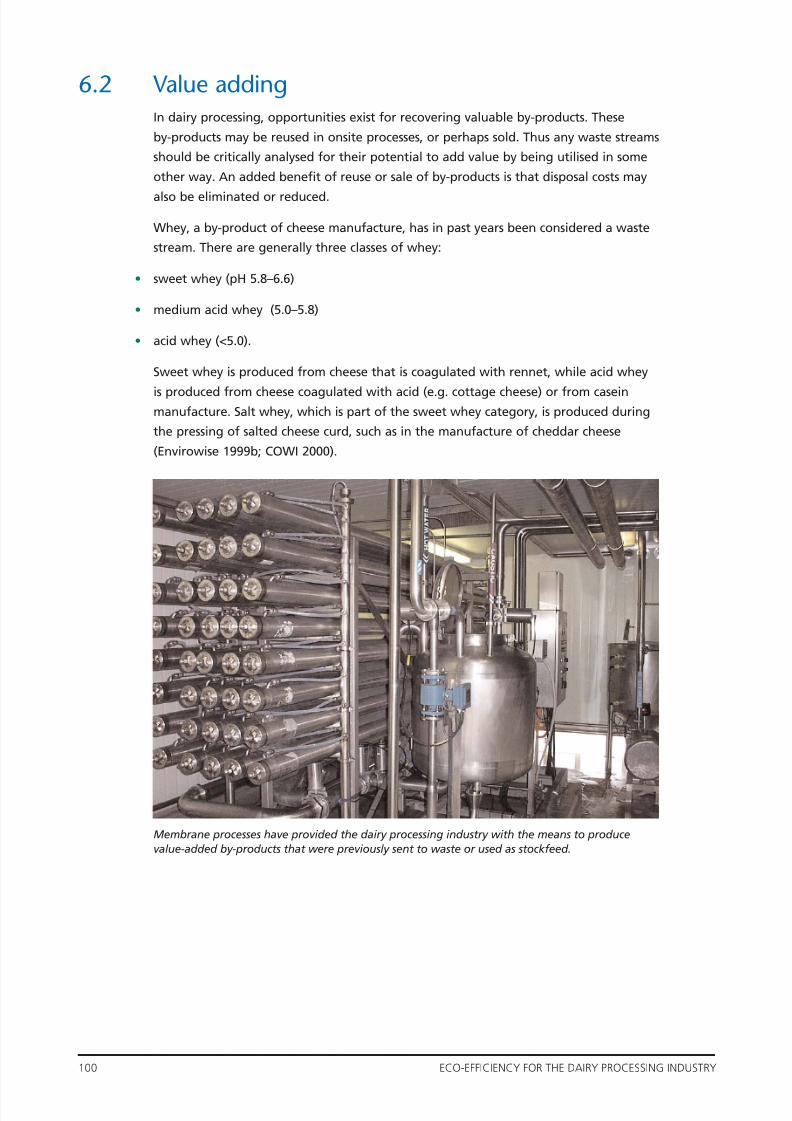
7/30/2019 Eco Efficiency Manual
http://slidepdf.com/reader/full/eco-efficiency-manual 111/153

7/30/2019 Eco Efficiency Manual
http://slidepdf.com/reader/full/eco-efficiency-manual 112/153
7/30/2019 Eco Efficiency Manual
http://slidepdf.com/reader/full/eco-efficiency-manual 113/153
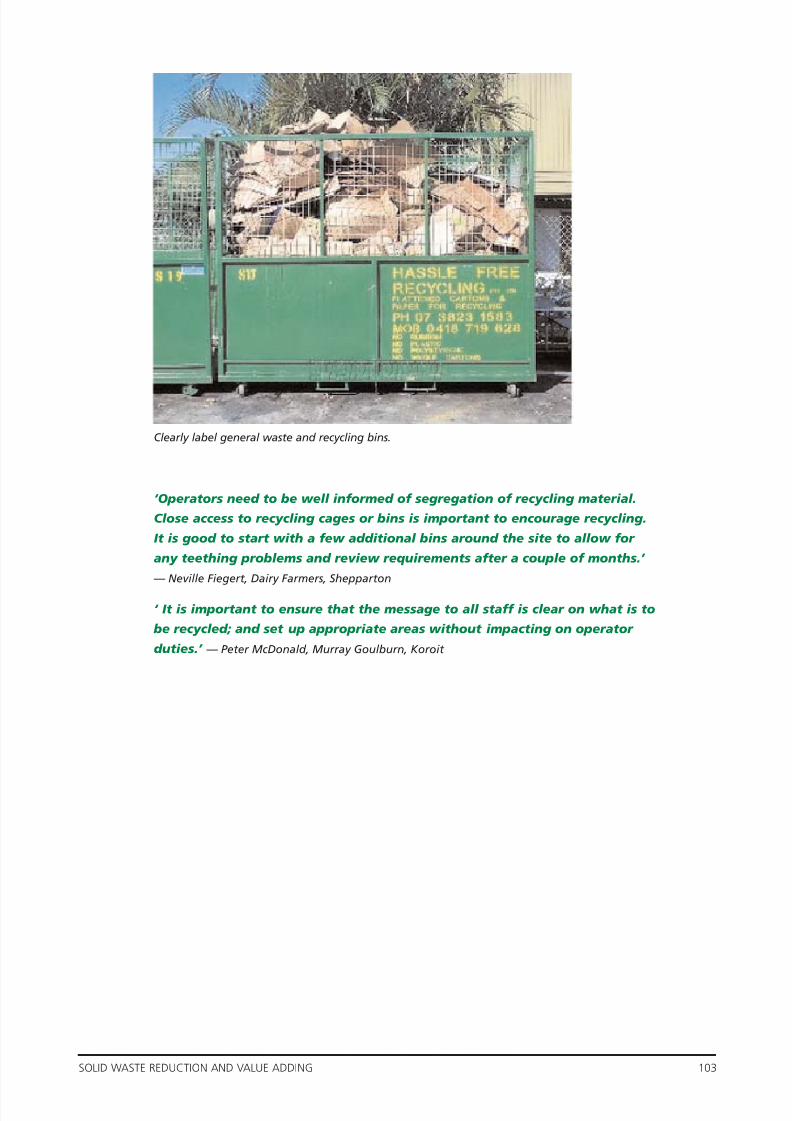
7/30/2019 Eco Efficiency Manual
http://slidepdf.com/reader/full/eco-efficiency-manual 114/153
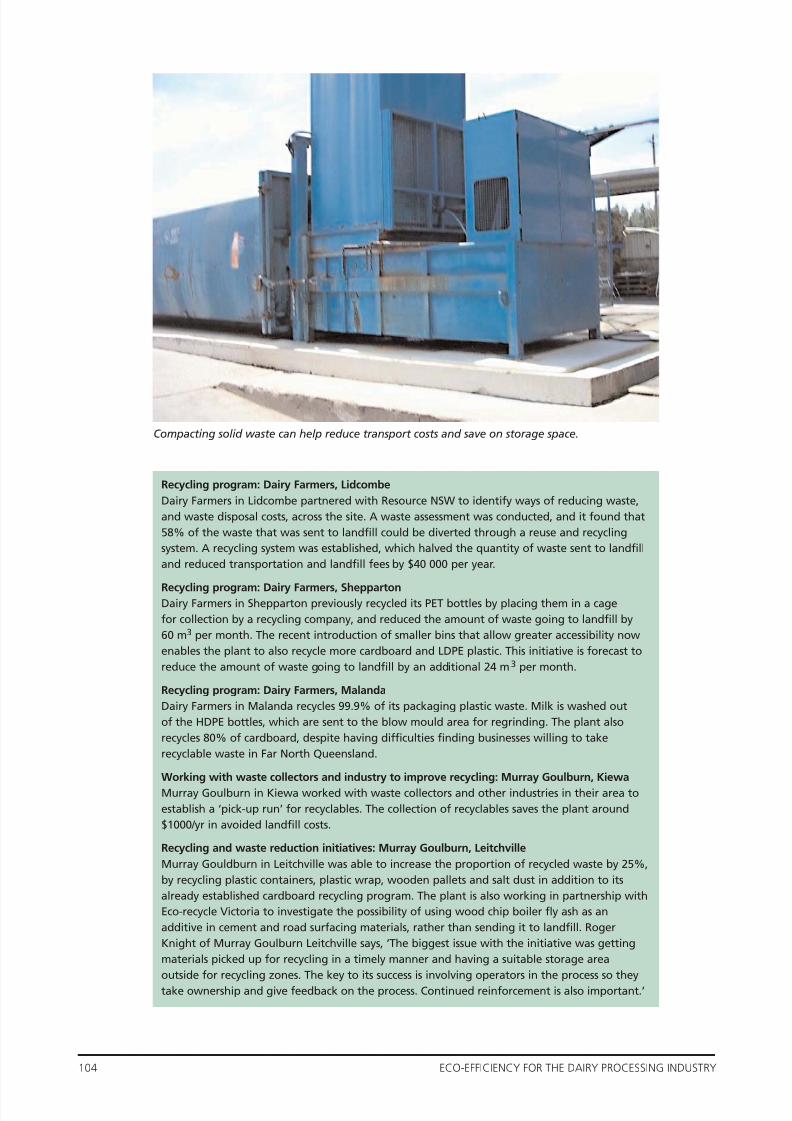
7/30/2019 Eco Efficiency Manual
http://slidepdf.com/reader/full/eco-efficiency-manual 115/153
7/30/2019 Eco Efficiency Manual
http://slidepdf.com/reader/full/eco-efficiency-manual 116/153
7/30/2019 Eco Efficiency Manual
http://slidepdf.com/reader/full/eco-efficiency-manual 117/153
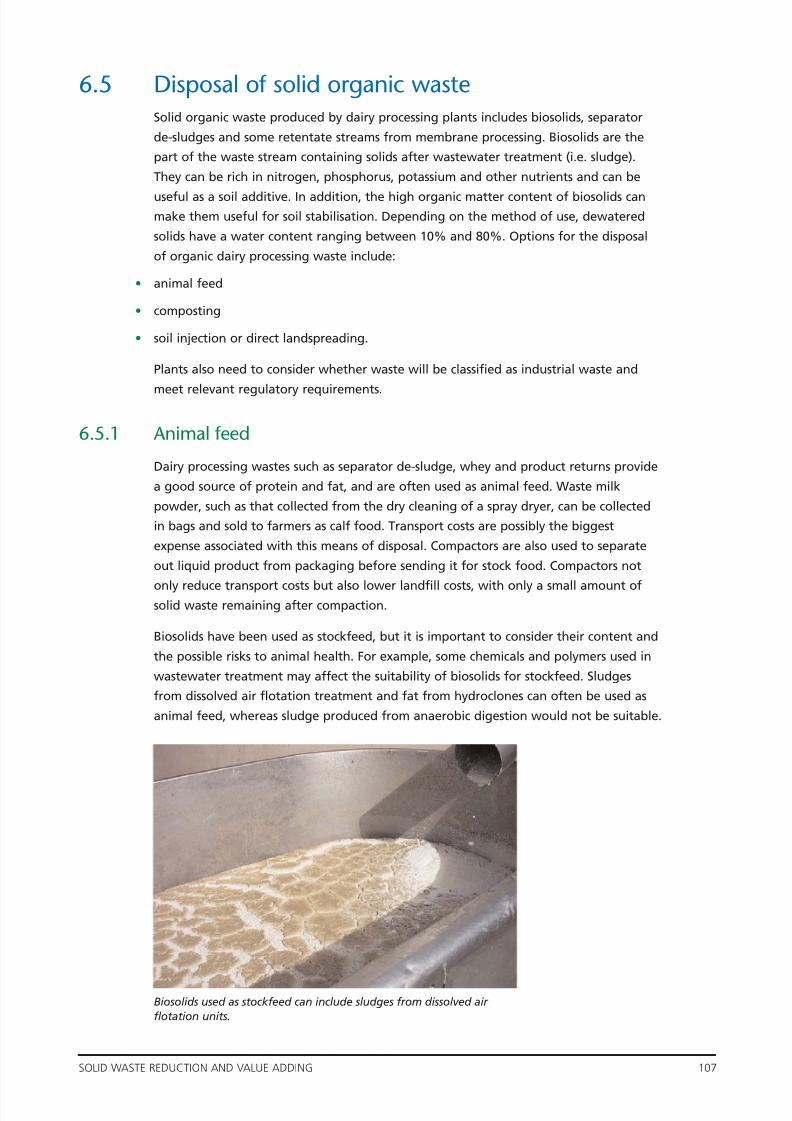
7/30/2019 Eco Efficiency Manual
http://slidepdf.com/reader/full/eco-efficiency-manual 118/153
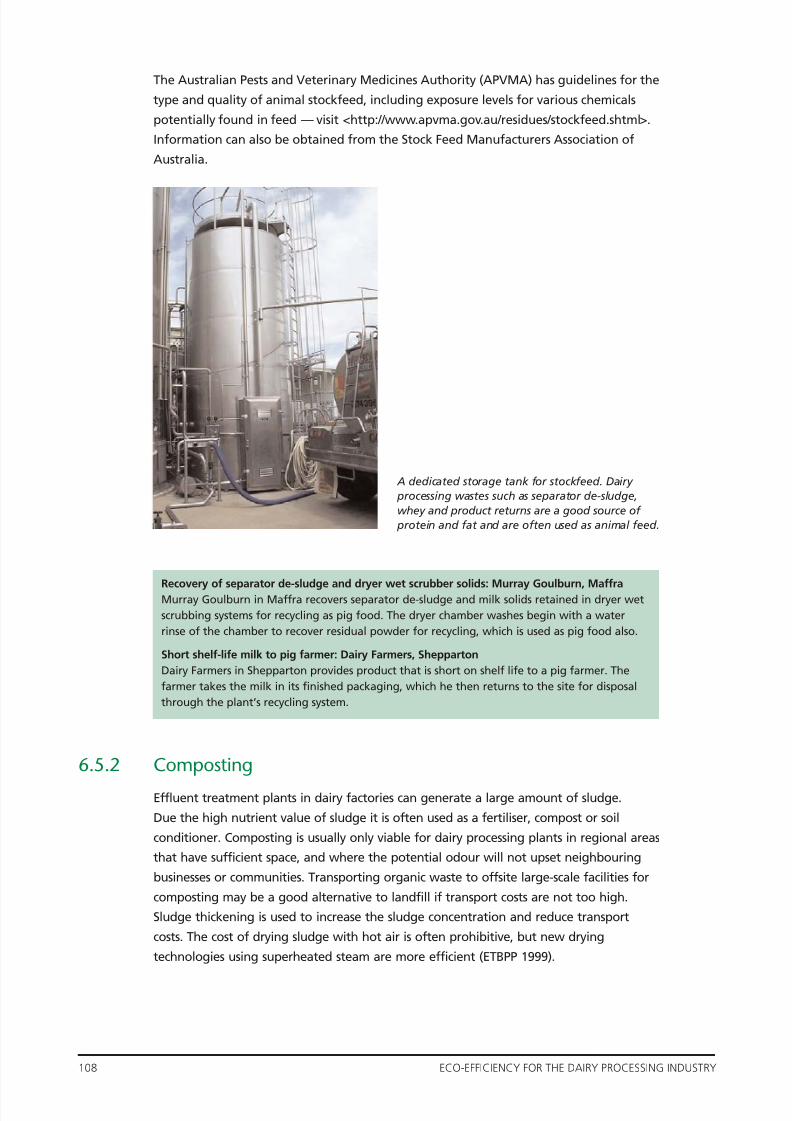
7/30/2019 Eco Efficiency Manual
http://slidepdf.com/reader/full/eco-efficiency-manual 119/153
7/30/2019 Eco Efficiency Manual
http://slidepdf.com/reader/full/eco-efficiency-manual 120/153
7/30/2019 Eco Efficiency Manual
http://slidepdf.com/reader/full/eco-efficiency-manual 121/153
110 ECO-EFFICIENCY FOR THE DAIRY PROCESSING INDUSTRY
7 Chemical use
7.1 Overview of chemical use
The cost of chemicals for dairy processing plants can be several hundred thousanddollars per year and a significant proportion of total operating costs. The dairy
processing industry uses a wide variety of chemicals for cleaning, pH control of process
and waste streams, and treating water for process and auxiliary uses such as boiler and
cooling tower feed. This chapter discusses the use of chemicals in dairy processing
plants, in particular for cleaning, and looks at opportunities to reduce or optimise
chemical use with the aim of lowering operating costs and minimising environmental
impacts.
7.1.1 Cleaning
Most chemicals used in dairy factories are for cleaning. Cleaning of plant and
equipment is essential to maintain strict hygiene standards and eliminate or control
the risk of product contamination and spoilage. Dairy processing plants typically use
a combination of automated clean-in-place (CIP) systems and manual cleaning systems
such as foaming and sanitising of external equipment surfaces and floors.
A CIP system is a fully enclosed automated system that delivers a number of wash
and rinse cycles to the internal surfaces of processing equipment. CIP systems largely
remove human contact with cleaning agents, thus reducing the risk of harmful
exposure. They also reduce labour costs, as well as the wear involved in dismantling
equipment. One of the main advantages of CIP systems is that they can recirculate
chemicals and rinse water, thereby substantially reducing the consumption of water
and chemicals. Typical CIP cycles consist of a water rinse followed by a caustic wash,
a second water rinse, an acid wash, a third water rinse, and often a final sanitiser
rinse. Caustic washes are usually carried out at least once a day; acid washes are less
frequent, and may be carried out once or twice per week. CIP systems may be classified
as single-use, multi-use or full recovery. Single-use (SU) systems dispose of rinse waters
and spent solution to drain after one use, while multi-use (MU) systems recover final
rinse waters and appropriate-quality spent solution for reuse. Full recovery systems
typically use membrane technology to recover chemicals, water and, potentially,
product.
What standard of cleaning is required?
As explained in CIP: cleaning-in-place, edited by AJ Romney (1990), three levels of
cleaning can be identified:
• Physically clean. The surface appears clean but chemical residues may have been
allowed to remain
• Chemically clean. The surface is rendered totally free from any trace of chemical
residue.

7/30/2019 Eco Efficiency Manual
http://slidepdf.com/reader/full/eco-efficiency-manual 122/153

7/30/2019 Eco Efficiency Manual
http://slidepdf.com/reader/full/eco-efficiency-manual 123/153
112 ECO-EFFICIENCY FOR THE DAIRY PROCESSING INDUSTRY
7.1.2 Detergents, acids and sanitisers
Detergents
Detergents used for cleaning are commonly composed of a mixture of ingredients to
interact both chemically and physically with the fouling. A dairy detergent will have
the following attributes (Romney 1990):
• organic dissolving power, to solubilise proteins, fats and sugars
• dispersing and suspending power, to bring insoluble soils into suspension and prevent
their redeposition on cleaned surfaces
• emulsifying power, to hold oils and fats dispersed within the cleaning solution
• sequestering power — the ability to combine with calcium and magnesium salts and
form water-soluble compounds
• wetting power, to reduce surface tension and aid penetration of the soil
• rinsing power — the ability to rinse away clearly without leaving a trace of soil or
chemical on the surface.
Detergents are formulated from a wide range of materials, which usually fall within
the groups of inorganic alkalis, acids and sequestering agents (Wright 1990). Examples
of inorganic alkalis include sodium hydroxide (caustic soda), potassium hydroxide,
sodium carbonate and sodium bicarbonate. They are commonly used in CIP systems
or bottle wash applications and are effective in removing fats. Detergents can also
contain peptising agents, which have the ability to disperse protein. The use of
enzyme-based detergents by Australian dairy processors is becoming more common.
This is discussed further in section 7.3.
Acids
Acid ingredients can be inorganic (e.g. phosphoric, nitric and hydrochloric acid) or
organic (e.g. hydroxyacetic and citric acid). They are designed to remove tenacious soil,
such as mineral deposits, that cannot be removed using alkali detergents.
Sequestering agents are used to prevent scale from developing and include sodium
polyphosphates, gluconic acid and ethylenediaminetetraacetic acid (EDTA) (Wright 1990).
Sanitisers
Sanitisers are used by the dairy processing industry to reduce micro-organisms to a
level that is safe for public health and enhances product quality. Sanitisation can be
achieved using thermal methods such as hot water and steam, or chemicals such as
chlorine-based compounds (e.g. chlorine dioxide) and peroxides( e.g peroxyacetic acid).
Many sanitisers are significantly affected by pH and water quality. Chlorine compounds
are broad-spectrum germicides which are relatively cheap and less affected by water
hardness than many other sanitisers. They are, however, corrosive to many metal
surfaces and are the subject of some health and safety concerns.
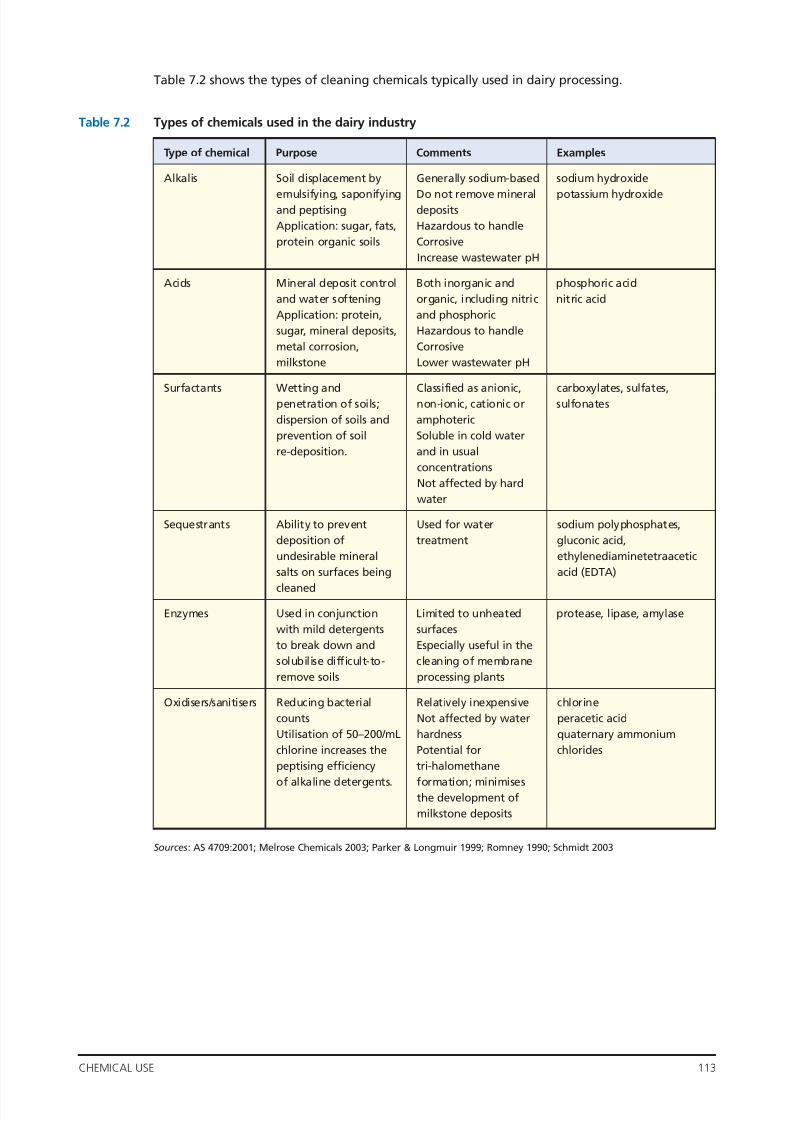
7/30/2019 Eco Efficiency Manual
http://slidepdf.com/reader/full/eco-efficiency-manual 124/153
CHEMICAL USE 113
Table 7.2 shows the types of cleaning chemicals typically used in dairy processing.
Table 7.2 Types of chemicals used in the dairy industry
Sources: AS 4709:2001; Melrose Chemicals 2003; Parker & Longmuir 1999; Romney 1990; Schmidt 2003
Type of chemical Purpose Comments Examples
Alkalis Soil displacement by Generally sodium-based sodium hydroxide
emulsifying, saponifying Do not remove mineral potassium hydroxideand peptising deposits
Application: sugar, fats, Hazardous to handle
protein organic soils Corrosive
Increase wastewater pH
Acids Mineral deposit control Both inorganic and phosphoric acid
and water softening organic, including nitric nitric acid
Application: protein, and phosphoric
sugar, mineral deposits, Hazardous to handle
metal corrosion, Corrosive
milkstone Lower wastewater pH
Surfactants Wetting and Classified as anionic, carboxylates, sulfates,penetration of soils; non-ionic, cationic or sulfonates
dispersion of soils and amphoteric
prevention of soil Soluble in cold water
re-deposition. and in usual
concentrations
Not affected by hard
water
Sequestrants Ability to prevent Used for water sodium polyphosphates,
deposition of treatment gluconic acid,
undesirable mineral ethylenediaminetetraacetic
salts on surfaces being acid (EDTA)
cleaned
Enzymes Used in conjunction Limited to unheated protease, lipase, amylase
with mild detergents surfaces
to break down and Especially useful in the
solubilise difficult-to- cleaning of membrane
remove soils processing plants
Oxidisers/sanitisers Reducing bacterial Relatively inexpensive chlorine
counts Not affected by water peracetic acid
Utilisation of 50–200/mL hardness quaternary ammonium
chlorine increases the Potential for chlorides
peptising efficiency tri-halomethane
of alkaline detergents. formation; minimisesthe development of
milkstone deposits

7/30/2019 Eco Efficiency Manual
http://slidepdf.com/reader/full/eco-efficiency-manual 125/153
7/30/2019 Eco Efficiency Manual
http://slidepdf.com/reader/full/eco-efficiency-manual 126/153
CHEMICAL USE 115
7.1.5 Environmental impact of chemicals
The main environmental impacts of chemicals used in dairy processing plants are:
• the high level of salts in dairy effluent from sodium (caustic) based chemicals and their
impact on land and groundwater
• the impact of nitric and phosphoric acids on nutrient levels in discharges to waterways.
Depending on the region, high salt levels in dairy effluent can exacerbate soil salinity
problems in areas where dairy effluent is used for irrigation, while excessive nutrients
in the form of nitrates and phosphates can cause eutrophication (algal blooms) from
land run-off and where treatment plants discharge to waterways.
7.2 Optimising chemical use
The residue of milk and milk-based products left on plant and equipment provides anideal growth medium for biological material that can be detrimental to human health
and the product’s shelf life and taste (DPEC 1998/99). The degree of chemical use,
therefore, is largely determined by food safety requirements and quality specifications.
Reducing chemical use by careful selection, and optimal utilisation and recovery,
without compromising processing or food safety standards, can result in substantial
savings while also improving the plant’s environmental performance. There are
numerous factors that influence the cleaning process, and many of these are
interlinked. Changes should not be made without considering the overall impact
on cleaning effectiveness and product quality.
There may be opportunities to improve the efficiency of the cleaning process and
chemical use by reviewing:
• chemical types and blends
• chemical concentrations and order of use
• contact or cleaning cycle times
• process control and instrumentation
• correct temperature
• chemical recovery (for CIP systems)
• effective water treatment
• fluid velocity or mechanical action
• operator health and safety
• equipment maintenance and operation.
These opportunities for improvement are applicable to manual equipment cleaning
and plant washdowns as well as CIP systems.

7/30/2019 Eco Efficiency Manual
http://slidepdf.com/reader/full/eco-efficiency-manual 127/153
116 ECO-EFFICIENCY FOR THE DAIRY PROCESSING INDUSTRY
Validation or review of cleaning systems is necessary to prove the cleaning effectiveness
of a system, and can be done as part of the contract obligation of the plant’s chemical
supplier. Improvements are usually achieved by extensive trials to ensure sufficient
cleaning without compromising product quality.
The Dairy Processing Engineering Centre (DPEC) Performance evaluation guide
manual — cleaning systems provides information on evaluating cleaning
effectiveness by carrying out mass and energy balances around individual unit
operations (DPEC 1998/99). The manual also shows how to formulate key
performance indicators against which the performance of the CIP system canbe assessed.
7.2.1 Chemical types and blends
Ideally a cleaning chemical will meet all cleaning requirements as well as being
economical, non-corrosive, non-toxic, stable, non-dusting, effective in softening water,
highly soluble and able to withstand a broad range of environmental conditions. Your
chemical supplier will provide advice on the most appropriate chemicals for each
cleaning task, which clean effectively while also minimising environmental impacts
and ensuring operator safety.
For detergents to be effective, they require sufficient contact time. Some types ofcleaning agents help to increase the ability of chemicals to bond with soiled materials,
to form a thin film or foam on the surfaces which is then removed with pressure and/or
water. The case study below is a good example of the advantages of blending chemicals
to best suit the application. Combined detergents and sanitisers may also provide an
opportunity to clean and sanitise simultaneously, thereby reducing cleaning time,
chemical use and the need for multiple rinses.
Chemicals must always be selected to suit the application. For example, experiments
indicate that concentrations of hydrogen peroxide as low as 50 mg/L can have a negative
effect on the taste of cheese. And water treated with hydrogen peroxide and used for
Installation of CIP system: Pauls, Northern Territory1
Pauls Limited installed a fully automated CIP system for its pasteurised milk vats and associatedlines. The initiative has saved the plant $40 000/yr in reduced water usage and improved
cleaning effectiveness, as well as reduced chemical use. Health and safety conditions for the
plant’s workers have also been improved by the reduction in direct handling of chemicals.
1 Environment Australia 2001
Review of CIP cycle frequency and chemical recovery: National Foods, Salisbury
National Foods in South Salisbury reduced chemical use by 11% by auditing its CIP flip cycle
(valve operation), recovering chemicals from its pasteuriser wash and decreasing the frequency
of acid washes.
Annual CIP audit: National Foods, Penrith
National Foods in Penrith carries out a full CIP audit each year to review cleaning effectiveness.
These audits review chemical concentration and cycle times. The plant’s most recent audit
saved $10 000 in detergents and 15 ML of water.
7/30/2019 Eco Efficiency Manual
http://slidepdf.com/reader/full/eco-efficiency-manual 128/153
CHEMICAL USE 117
dissolving milk powder in the making of culture for cheese manufacture can cause
difficulties due to its effects on acidic-activated cultures (IDF 1988). Care must be taken,
therefore, to ensure thorough drainage of chemicals.
‘Before changing to a new chemical supplier, be sure they have the range
and capability to make special blends to cover all the chemicals you require.’
— Phill Lumsden, Dairy Farmers, Bomaderry, New South Wales
7.2.2 Chemical concentrations
Automated chemical dosing systems minimise the need for operator intervention, and
they are a practical and precise way of avoiding incorrect dosing. Such systems are not
infallible, however, and dairy processing plants should implement work procedures for
the regular testing and monitoring of chemical concentrations. Over-dosing can result
in increased wastewater charges and wasted chemicals, while under-dosing can lead to
contamination and an ineffective cleaning operation. Automatic dosing also reducesthe labour time typically associated with the manual addition of chemicals and can
circumvent the associated occupational health and safety issues.
Different cleaning tasks require different chemical concentrations and there may be
opportunities to reduce chemical use by optimising the concentration. For example, the
cleaning of heated surfaces such as those of pasteurisers will require a higher strength
than storage tanks holding raw milk. Dairy processing plants usually have separate CIP
systems for pre-pasteurising, post-pasteurising, and storage and filling. This presents an
opportunity to optimise the CIP cycles and the concentration of chemicals to suit the
requirements of the equipment being cleaned. Ranges of alkali concentrations
between 0.7% and 1.5% have been reported in the dairy processing industry, while
acid concentrations range from around 0.1 % to 1.2%. Substantial savings can be
achieved if chemical concentrations can be reduced.
Alternative detergent use increased productivity: Bonlac, Stanhope1
Bonlac Foods in Stanhope was using a CIP process with alkaline solution, an acid detergent
(nitric and phosphoric acids) and hot water to clean equipment as part of the cheese-making
process. The waste cleaning solution was treated in onsite wastewater treatment ponds and
then discharged to surface drains. The acid detergent was replaced by Stabilon® detergent,
which is a combination of complex agents, wetting agents, anti-foam agents, cleaning
activators and emulsifiers. The change resulted in a reduction in the cycle time for the CIP
process from 6 h to 4.5 h, allowing more time to produce cheese, and eliminating the acid
detergent in the CIP process. The net benefit was an extra $310/day through reduced
chemical usage and increased cheese production.
1 Environment Australia 1999
Review of CIP chemical concentrations: National Foods, Morwell
National Foods in Morwell reduced its caustic concentrations on its dessert cooker and set
specific acid concentrations on all individual CIP sets. Caustic concentration on the dessert
cooker was reduced to 1.5%. Changes to both acid and caustic concentrations led to total
savings of $100 000/yr. The only real costs for implementing the change were the time taken
to validate the system and costs of checking product quality.
7/30/2019 Eco Efficiency Manual
http://slidepdf.com/reader/full/eco-efficiency-manual 129/153
118 ECO-EFFICIENCY FOR THE DAIRY PROCESSING INDUSTRY
7.2.3 Cleaning cycle times
It is not uncommon for dairy processing plants, over time, to introduce inefficient or
excessive cleaning cycles to compensate for product quality problems or modifications
to processing equipment. Some processors have introduced regular audits of CIP
systems to ensure that the efficiency and effectiveness of their cleaning systems is
maintained. Such audits are carried out by internal staff or on a contract basis bychemical suppliers.
7.2.4 Control instrumentation
CIP systems are typically equipped with inline monitoring instrumentation such as
conductivity and turbidity meters and timers that should be well maintained and
regularly calibrated. Programming the CIP system so that it will not commence
washing unless quality parameters such as temperature and concentration are met
reduces the need for rewashes.
For more information on selecting and installing instruments relevant to performance
evaluation of a cleaning process, see Performance evaluation guide manual — cleaning
systems (DPEC 1989/99).
7.2.5 Effect of temperature
Maintaining the correct temperature is essential for chemical effectiveness. It can also
be an opportunity to reduce energy consumption. Excessively high temperatures may
increase the corrosive nature of many chemicals, while low temperatures may reduce
the chemical’s ability to remove soiling or kill pathogens. Check with your supplier for
the minimum temperature requirements that can be used without compromising
cleaning effectiveness and product quality.
Auditing of dosing equipment: National Foods, Morwell
National Foods in Morwell reduced caustic and acid cycle times on its CIP system. During the
early stages of commissioning the plant significant issues were experienced and cleaning times
were increased. As the many design issues were resolved it was found that the times were
longer than recommended and could be reduced without comprising product quality.
Reduced cleaning by combining acid and sanitiser step: Dairy Farmers, Malanda
Dairy Farmers in Malanda have been working in partnership with Campbell Cleantec, and have
removed a rinse cycle and a sanitation step from all its cleaning circuits by changing from a
caustic/acid/sanitation cycle to a caustic/acid-sanitiser one shot cycle. The initiative has savedthe factory 15 000 kL/yr in rinse water with additional savings in chemical costs.
Instrumentation for cleaning improvements: Dairy Farmers, Malanda
Dairy Farmers in Malanda audited all its CIP processes. Optic sensors were used to fine-tune
water and milk interfaces and conductivity and turbidity meters for cleaning improvements.
Estimated savings for the improvements were $211 500/yr.
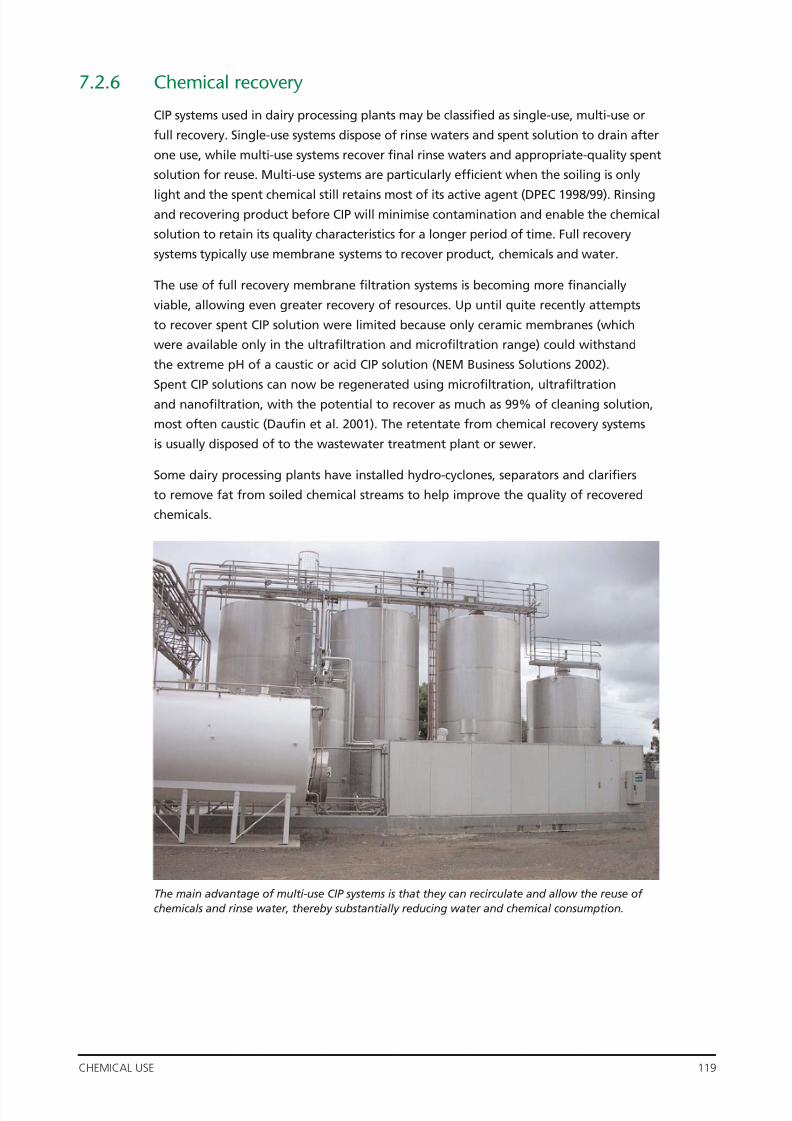
7/30/2019 Eco Efficiency Manual
http://slidepdf.com/reader/full/eco-efficiency-manual 130/153
7/30/2019 Eco Efficiency Manual
http://slidepdf.com/reader/full/eco-efficiency-manual 131/153
7/30/2019 Eco Efficiency Manual
http://slidepdf.com/reader/full/eco-efficiency-manual 132/153
CHEMICAL USE 121
7.3 Chemical alternativesMany dairy processors are now taking a more holistic approach to chemical
alternatives, in partnership with suppliers, with a view to improving cleaning
efficiencies while also reducing chemical consumption and wastewater treatment costs.
7.3.1 Biodegradable chemicals
Non-toxic, organic chemicals, such as plant-based cleaning agents, may provide an
opportunity to reduce maintenance and wastewater discharge costs. Some
biodegradable cleaning products can be more expensive than traditional products; it is
therefore important to take a holistic approach and consider some of the operational
and downstream savings, and not just the initial purchase cost. Biodegradable
(environmentally friendly) chemicals can be perceived as not being as effective as
conventional chemicals. However, recent technological advances have meant that
plant-based ingredients can now be combined to create more powerful cleaning
agents and natural disinfectants. Table 7.3 shows a comparison between inorganic andorganic acids used for cleaning. Biodegradable chemicals used in the dairy processing
industry include acetic acid, citric acid and hydroxyacetic acid.
Peroxyacetic acid is used in the dairy industry as a biodegradable and non-toxic
sanitising agent that is as effective as chlorine and can be used at low concentrations.
The main advantage of peroxyacetic acid over chlorine-based compounds is that, after
dosing into water, there are no problems with corrosive vapours (Chester Kidd 2003,
pers. comm.). Other advantages of peroxyacetic acid include the absence of
phosphates, and its biodegradability.
A number of factors do need to be considered, however, when using peroxyacetic acid.
When peroxyacetic acid is added to water it creates a solution of peroxyacetic acid,
acetic acid and hydrogen peroxide. The breakdown into acetic acid can increase the
BOD loading of wastewater, potentially increasing wastewater disposal costs. The acetic
acid can also lower the pH of the wastewater (to pH 4–5), depending on the initial
concentration of the acetic acid in the peroxyacetic acid product and the dosage of
peroxyacetic acid added to the water. In dairy processing, the pH of the wastewater is
not significant because the volume of water containing acetic acid is mixed with much
larger volumes of wastewater.

7/30/2019 Eco Efficiency Manual
http://slidepdf.com/reader/full/eco-efficiency-manual 133/153
7/30/2019 Eco Efficiency Manual
http://slidepdf.com/reader/full/eco-efficiency-manual 134/153
7/30/2019 Eco Efficiency Manual
http://slidepdf.com/reader/full/eco-efficiency-manual 135/153
124 ECO-EFFICIENCY FOR THE DAIRY PROCESSING INDUSTRY
7.4 Chemical treatment of boilers, cooling water andcondensate water Different water use applications require different water quality, so it is wise to treat it
only to the required quality for each application.
7.4.1 Boiler water treatment
Boiler feedwater may require pre-treatment to remove dissolved oxygen, hardness,
silica and other minerals. Methods used to treat the water include chemical dosing
and filtration, softening, demineralisation, ion exchange and de-aeration. As boiler
feedwater is usually recirculated, blowdown is required to prevent concentration of
impurities that can cause scale on the surfaces of the boiler tubes and reduce effective
heat exchange. Blowdown should be controlled on the basis of concentration of
impurities in the boiler. The installation of conductivity probes that initiate blowdown
only when the water exceeds a set value prevents the unnecessary waste of water,
chemicals and energy due to excessive blowdown.
7.4.2 Cooling water treatment
Cooling tower water requires treatment to control microbial activity (such as
Legionella) to safe levels, while minimising scaling and corrosion of pipework, heat
exchange equipment and the cooling tower. As with boiler feedwater, cooling water
operates as a recirculating flow and therefore requires blowdown to remove solids.
Various chemicals are added to cooling water, including pH adjusters, corrosion
inhibitors, dispersants to keep solids in suspension, and microbiocides (similar to
sanitisers). The installation of a filtration system to remove suspended materials can
help to reduce chemical use while also reducing the need for blowdown and the loss
of heat transfer efficiency.
7.4.3 Condensate water treatment
Information on condensate reuse and condensate water treatment can be found in
Chapter 3.

7/30/2019 Eco Efficiency Manual
http://slidepdf.com/reader/full/eco-efficiency-manual 136/153

7/30/2019 Eco Efficiency Manual
http://slidepdf.com/reader/full/eco-efficiency-manual 137/153
7/30/2019 Eco Efficiency Manual
http://slidepdf.com/reader/full/eco-efficiency-manual 138/153
CHEMICAL USE 127
7.7 Further readingThere are several Australian standards with information on chemical use in dairy
factories. These include:
AS 1398:1998, Iodophors for Use in the Dairying Industry
AS 1162:2000, Cleaning and Sanitising Dairy Factory Equipment
AS 1536:2000, General Purpose Detergents for Use in the Dairying Industry
AS 1087:2003, Sodium Hypochlorite Solutions for Use in the Dairying Industry
AS/NZS 1389:1997, Acidic Detergents for Use in the Dairying Industry
AS/NZS 1400:1997, Heavy-Duty Alkaline Detergents for ‘In-Place’ Cleaning in Dairy Factories
AS/NZS 2541:1998, Guide to the Cleaning-in-Place of Dairy Factory Equipment.
7/30/2019 Eco Efficiency Manual
http://slidepdf.com/reader/full/eco-efficiency-manual 139/153
7/30/2019 Eco Efficiency Manual
http://slidepdf.com/reader/full/eco-efficiency-manual 140/153
7/30/2019 Eco Efficiency Manual
http://slidepdf.com/reader/full/eco-efficiency-manual 141/153
7/30/2019 Eco Efficiency Manual
http://slidepdf.com/reader/full/eco-efficiency-manual 142/153
REFERENCES 131
EPA, NSW 1997, Environmental guidelines — use and disposal of biosolids products,
Chatswood
ETSU (Energy Technology Support Unit) 1996, Spray drying, Good Practice Guide 185,
UK Energy Efficiency Best Practice Programme.
ETSU 1998, Reducing energy costs in dairies- a guide to improved profitability , Good
Practice Guide 209, UK Energy Efficiency Best Practice Programme. Oxfordshire
ETSU 2000, Energy efficiency refrigeration technology — the fundamentals, Best
Practice Guide 280, UK Energy Best Practice Programme. Oxfordshire
FEMP (Federal Energy Management Program) 2003, Water-conservation best
management practices #6 boiler/steam systems, viewed March 2004, <www.eere.
energy.gov/femp/techassist/BMP6.html>.
Goulburn-Murray Water 2001, A close look at saline water , Water notes, viewed May
2004, <http://www.g-mwater.com.au/browse.asp?ContainerID=downloadable_pdfs>.
Grabhoff, A 2002, Enzymatic cleaning of milk pasteurizers, Transactions of the Institute
of Chemical Engineers, vol. 80, Part C, December 247 -252 .
Hale, N., Bertsch, R., Barnett, J. and Duddleston, W.L. 2003, Sources of wastage in the
dairy industry, Bulletin of the International Dairy Federation, no. 382, Brussels.
Hannemann, H 2003, ‘Measurement of wastewater and wastage’, Bulletin of the
International Dairy Federation, no. 382, Brussels.
Harper, WJ and Spillan, M 2004, Cleaning and sanitizing food plant equipment —
cleaning compounds: characteristics and functions, The Ohio State University, viewed
22 April 2004, <http://class.fst.ohio-state.edu/FST401/Information/Cleaning%20and%20
Sanitizing.doc>.
Houlihan, A, Dennien, G, Marschke, R and Smith, S 1999, Recovery of milk constituents
from cleaning solutions used in the dairy industry , DAQ124, Dairy Research
Development Corporation Australia. Melbourne
IDF 1988, The quality, treatment and use of condensate and reverse osmosis permeates,
Bulletin no. 232/1988, International Dairy Federation. Brussels
ITR (Australian Government Department of Industry, Tourism and Resources) 2003, Case
study dairy processing sector, Murray Goulburn Rochester , Energy Efficiency Best Practice
Program, viewed March 2004, <www.industry.gov.au/energybestpractice>.
Jones, MK, Morian, M, Dennien, G, Houlihan, A, Johns, MR and Deeth, H 2002,
Environmental management tools for the dairy processing industry: Part 1, Managing
Waste Minimisation; Part 2, Managing environmental risks, Department of Primary
Industries, Queensland.
Joyce, KM 1993, Energy efficiency in Australian dairy factories, Dairy Research and
Development Corporation Australia, Melbourne
Kjaergaard-Jensen, G 1999, ‘Energy consumption’, Bulletin of the International Dairy Federation, no. 340, pp. 34–41.
7/30/2019 Eco Efficiency Manual
http://slidepdf.com/reader/full/eco-efficiency-manual 143/153
132 ECO-EFFICIENCY FOR THE DAIRY PROCESSING INDUSTRY
Koch Membrane Systems 2004, Information on dairy processing, viewed March 2004,
<http://www.kochmembrane.com/APPLICATIONS/dairy.html>.
Linnhoff March 1998, Introduction to pinch technology , Targeting House, Gadbrook
Park, Northwich, Cheshire, UK, <http://www.linnhoffmarch.com/pdfs/PinchIntro.pdf>.
Lucey, J & Kelly, J 1994, ‘Cheese yield’, Journal of the Society of Dairy Technology , vol.
47, no. 1, February 1994.
Lunde, S., Feitz, A., Jones, M., Dennien, G. and Morian, M. 2003, Evaluation of the
environmental performance of the Australian dairy processing industry using life cycle
assessment , Dairy Research Development Corporation.
Mackay, M 2002 Investigation of the ability of model predictive control to increase
powder production capacity at Murray Goulburn’s Koroit Plant , Dairy Research
Development Corporation Internal document.
Manufacturingtalk 2003a, Physical water conditioning saves chemicals, time, Hydropath
UK , viewed 12 December 2003,<www.manufacturingtalk.com/news/ric/ric101.html>.
Manufacturingtalk 2003b, UV disinfection protects cheese from contamination,
Hanovia, viewed 12 December 2003, <www.manufacturingtalk.com/news/han/
han102.html>.
Melrose Chemicals 2003, Cleaning and disinfection in the food processing industry ,
viewed 11 November 2003, <http://www.melrosechem.com/english/publicat/general/
cleaning.pdf>.
MLA (Meat & Livestock Australia) 1997, Steam generation systems, MLA, Sydney.
MnTAP (Minnesota Technical Assistance Program) 2003, Phosphorus: reducing releases
from industrial cleaning and sanitizing operations, viewed 11 November 2003,<http://
mntap.umn.edu/POTW/11-ReducingPhos.htm>.
Morgan, S 1999, Milk processing effluent stream characterisation and utilisation,
Project CMP121, Dairy Research and Development Corporation.
Mosse, P and Rawlinson, L 1998, Reuse of sludge from a dairy factory lagoon . Water
Vol 25 Jan/Feb 1998 25-28
Muller, MR, Simek, M, Mak, J, & Mitrovic, G 2001, Modern industrial assessments: a
training manual , version 2.0, Rutgers Unversity, New Jersey, USA, viewed 19 March
2003, <http://oipea-www.ruters.edu/documents/doc_f.htm>.
NEM Business Solutions 2002 , Recovery of spent CIP solutions, viewed 20 April
2004, <www.cip.ukcentre.com/recover.htm>.
Nguyen, M, Reynolds, N and Vigneswaran, S 2003, ‘By-product recovery from cottage
cheese production by nanofiltration’, Journal of Cleaner Production, vol. 11(7),
pp.803–807.
NHMRC & ARMCANZ 1996, Australian Drinking Water Guidelines, National Health and
Medical Research Counci (9NHMRC), <http://www.nhmrc.health.gov.au/publicat/pdf/
7/30/2019 Eco Efficiency Manual
http://slidepdf.com/reader/full/eco-efficiency-manual 144/153
7/30/2019 Eco Efficiency Manual
http://slidepdf.com/reader/full/eco-efficiency-manual 145/153
7/30/2019 Eco Efficiency Manual
http://slidepdf.com/reader/full/eco-efficiency-manual 146/153
REFERENCES 135
Efficiency and Renewable Energy, viewed May 2002, <www.oit.doe.gov/bestpractices/
steam/pdfs/insulate.pdf>.
US DOE 2004a, Buying an energy efficient motor , viewed March 2004,
<www.oit.doe.gov/
bestpractices/motors/factsheets/mc-0382.pdf>.
US DOE 2004b Energy efficiency and renewable energy website: Compressed Air
Challenge Office of Industrial Technologies viewed July 2004 <http://www.oit.doe.gov/
bestpractices/compressed_air/>
US DOE 2004c, Energy efficiency and renewable energy website: Motor selector
software, Office of Industrial Technologies viewed March 2004, <www.oit.doe.gov/
bestpractices/software_tools.shtml>.
Wardrop Engineering 1997, Guide to energy efficiency opportunities in the dairy
processing industry . National Dairy Council of Canada. Ottawa
WaterTech Online 2003, Ozone water treatment, viewed December 2003, <http://www.watertechonline.com/ENewsArticle.asp?catID=13>.
WBCSD (World Business Council for Sustainable Development) 2000, Eco-efficiency,
creating more with less impact, viewed March 2004, <http://www.wbcsd.org/
DocRoot/02w8IK14V8E3HMIiFYue/eco_efficiency_creating_more_value.pdf>.
Willis, M. & Tham, M. 1994, Advanced Process Control , University of Newcastle Upon
Tyne, viewed May 2004, <http://lorien.ncl.ac.uk/ming/advcontrl/sect1.htm>.
Wright, W 1990, Chapter 3, ‘The chemistry of detergents’, in CIP: cleaning in place,
ed. AJD Romney, Society of Dairy Technology, Cambridgeshire, UK.
WS Atkins Consultants Ltd 1997, Cost-effective membrane technologies for minimizing
waste and effluents, Environmental Technology Best Practice Programme, Good
Practice Guide No. 5, <www.industry.gov.au/content/itrinternet/cmscontent.
cfm?objectID=4F04C2FA-30B4-4F40-8C42FA915F123E93>.
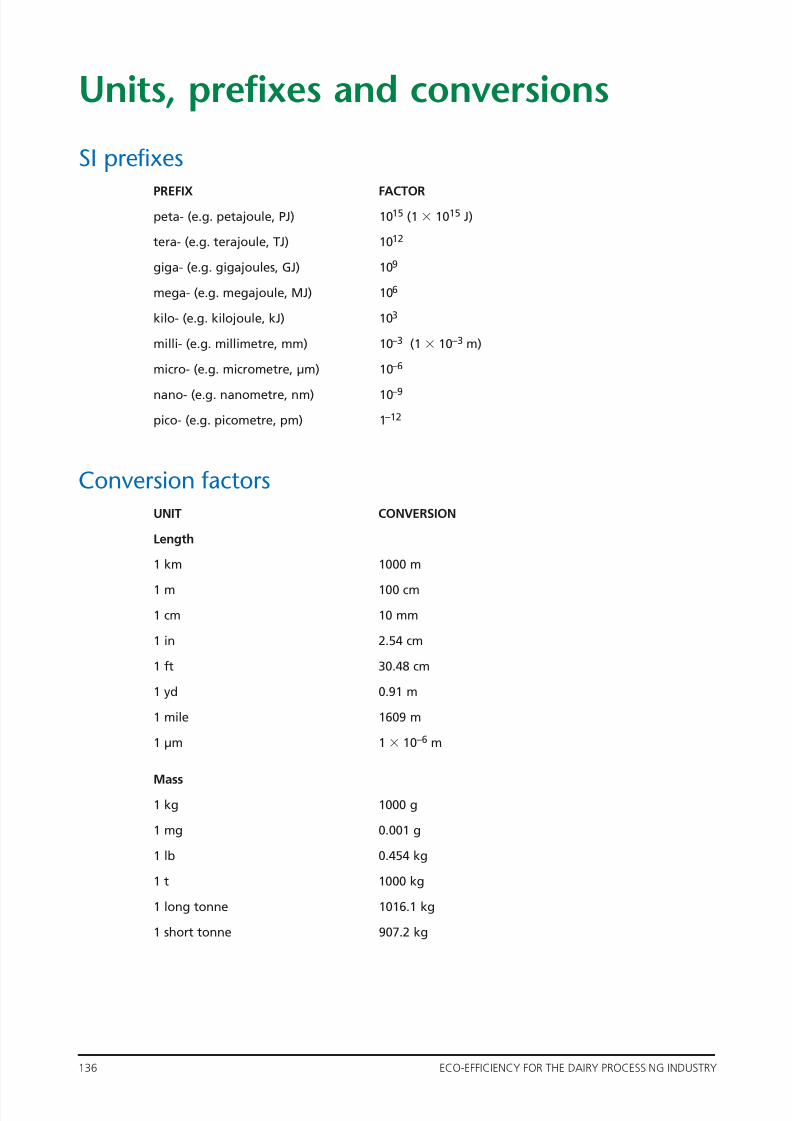
7/30/2019 Eco Efficiency Manual
http://slidepdf.com/reader/full/eco-efficiency-manual 147/153

7/30/2019 Eco Efficiency Manual
http://slidepdf.com/reader/full/eco-efficiency-manual 148/153
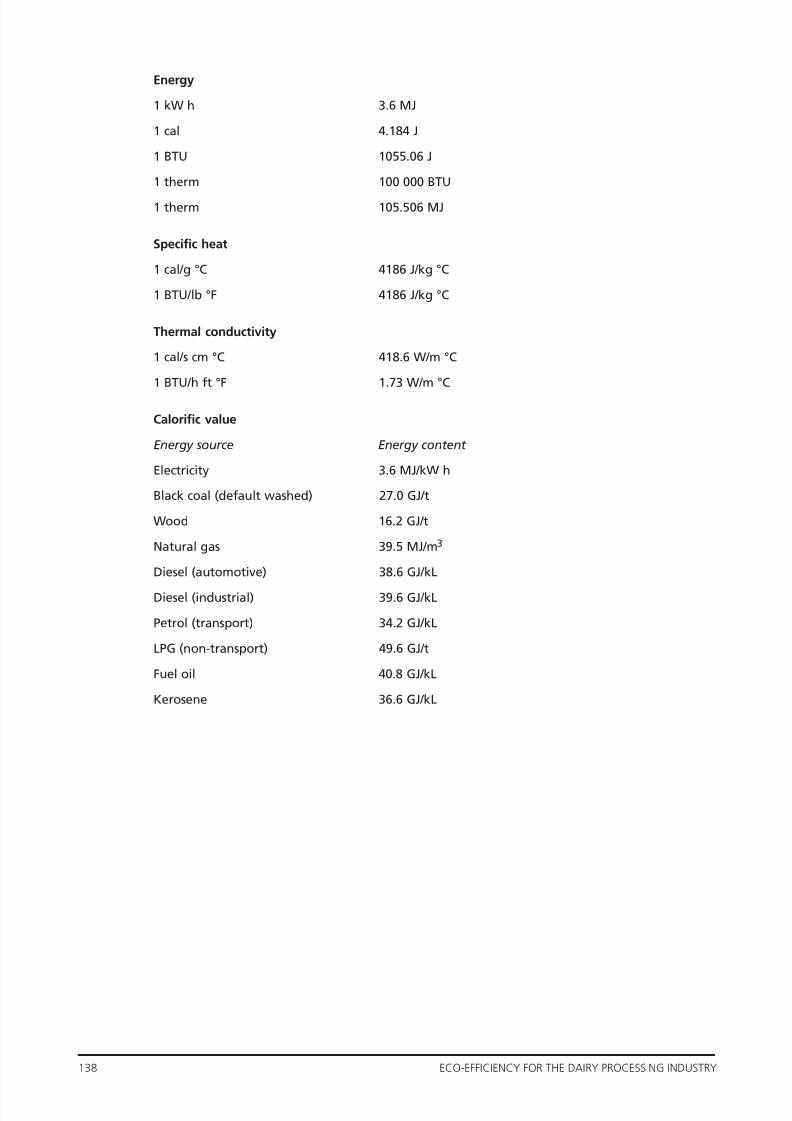
7/30/2019 Eco Efficiency Manual
http://slidepdf.com/reader/full/eco-efficiency-manual 149/153
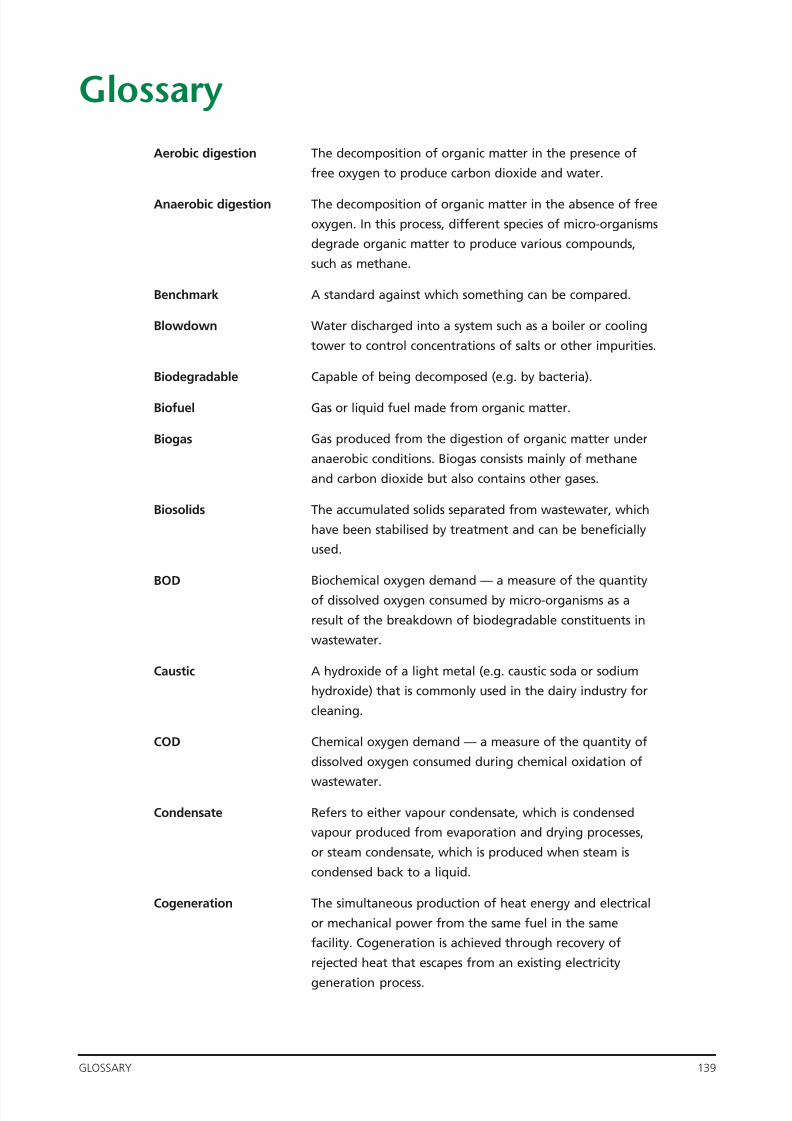
7/30/2019 Eco Efficiency Manual
http://slidepdf.com/reader/full/eco-efficiency-manual 150/153
7/30/2019 Eco Efficiency Manual
http://slidepdf.com/reader/full/eco-efficiency-manual 151/153
7/30/2019 Eco Efficiency Manual
http://slidepdf.com/reader/full/eco-efficiency-manual 152/153

7/30/2019 Eco Efficiency Manual
http://slidepdf.com/reader/full/eco-efficiency-manual 153/153