easuring the digital ransformation and going toolkit
TRANSCRIPT

MEASURING THE DIGITAL
TRANSFORMATION AND GOING
DIGITAL TOOLKITIX NIC.BR ANNUAL WORKSHOP ON SURVEY METHODOLOGY
20 MAY 2019
DANIEL KER

The project
• 2 years (and counting…)
• 14 OECD committees – Science and Technology + Economics,Education, Finance, Labour market, Public Governance, Trade…
• + other OECD bodies, International Organisations
• + academics, business…
• 100+ outputs
• https://www.oecd.org/going-digital/topics/

The OECD Going Digital Summit
• Over 20 sessions, reflecting the 7 dimensions of the Going Digital integrated policy framework
• 700 participants:100+ speakers and moderatorsincl. 25 Ministers and State Secretaries
• Webcast: www.oecd.org/going-digital/summit

Key publications
https://doi.org/10.1787/9789264312012-en https://doi.org/10.1787/9789264311992-en

An integrated policy framework

❑ Indicators mapped to Going Digital
policy framework
❑ Monitor the digital transformation and
“tell stories”
❑ Position countries and monitor progress
❑ Data visualisation and discovery
❑ Highlight main weaknesses of current
metrics and measurement frameworks
❑ Identify key areas for action (9) – “roadmap”
❑ Co-develop with stakeholders
Understand
Advance
MEASURING THE DIGITAL TRANSFORMATION:
BENCHMARKING, IDENTIFYING GAPS AND A MEASUREMENT ROADMAP
http://dx.doi.org/10.1787/9789264311992-en

Trends
0
2
4
6
8
10
12
Index 1990 = 1
AI-related patents All patents
Patents in AI-related technologies, 1990-2016
Source: OECD, Measuring the Digital Transformation, 2019
0
5
10
15
20
25
30
35
% Top 10 economies
2016 2006
Top cited AI science
0
20
40
60
80
100
2006 2016
%CHN EU28 USA Other
Share of world's AI publications
AI-related patents grow 4 times as fast
AI
AI-related technologies developed by UK
companies, selected sectors, 2018

The Internet is near ubiquitous in many countries and the range of activities that people and businesses do online is increasing. However, divides still persist.

Use: individuals
0
20
40
60
80
100% Total users Daily users Total users, 2006
0
20
40
60
80
100
%Social networking Online purchases Online sales Cloud storage Content creation
Internet users,
2018As a percentage
of persons
aged16-74
Diffusion of
selected
online
activities,
2018As a percentage
Internet users
Source: OECD (2019), Measuring the Digital Transformation, based on ICT Usage by Households and Individuals Database, December 2018. https://doi.org/10.1787/888933929775 , https://doi.org/10.1787/888933929775

Use: businesses
Enterprises
purchasing
cloud servicesAs a percentage
of enterprises in
each
employment size
class
Enterprises making e-commerce
sales,2017
As a percentage of enterprises in
each employment size
class
Source: OECD (2019), Measuring the Digital Transformation, based on ICT Usage by Businesses Database, December 2018. https://doi.org/10.1787/888933929908 , https://doi.org/10.1787/888933929851
0
20
40
60
80
100% All enterprises Small Medium Large
0
10
20
30
40
50
60
70% All Small Large

Access: divides
Households in areas where
fixed broadband of
30Mbps or more is available,
2017As a percentage
of households
Enterprises with
broadband
connections, by
speed, 2018As a percentage
of all enterprises
Source: OECD (2019), Measuring the Digital Transformation, based ICT Usage by Businesses Database, December 2018. https://doi.org/10.1787/888933929908 , https://doi.org/10.1787/888933929851
0
20
40
60
80
100
% Rural Total
0
20
40
60
80
100
%

Firms in highly digital-intensive sectors are adding jobs, placing the spotlight on skills and the need for training.

-40
-30
-20
-10
0
10
20
30
40
-100
-75
-50
-25
0
25
50
75
100
%%High Medium-high Medium-low Low Percentage change in total employment (right-hand scale)
-40
-30
-20
-10
0
10
20
30
40
-100
-75
-50
-25
0
25
50
75
100
%%High Medium-high Medium-low Low Percentage change in total employment (right-hand scale)
Contributions to changes in total employment, by digital intensity of
sectors 2006-16
Jobs: Digital intensity in sectors
Source: OECD (2019), Measuring the Digital Transformation, based STAN Database, http://oe.cd/stan, National Accounts Statistics, national sources and Inter-Country Input-Output Database, http://oe.cd/icio, December 2018 https://doi.org/10.1787/888933930573

Employment in ICT specialists and ICT-task intensive occupations within and outside information industries, 2017
As a percentage of total employment
0
5
10
15
20
25
%
Information industries: ICT specialists Information industries: Other ICT task-intensive occupations
Other industries: ICT specialists Other industries: Other ICT task-intensive occupations
0
5
10
15
20
25
%
Information industries: ICT specialists Information industries: Other ICT task-intensive occupations
Other industries: ICT specialists Other industries: Other ICT task-intensive occupations
JOBS: ICT OCCUPATIONS V. ICT TASK INTENSITY
Source: OECD (2019), Measuring the Digital Transformation, based on European Labour Force Surveys and other national sources, December 2018. https://doi.org/10.1787/888933930535

Jobs: Skills pipeline
Tertiary graduates in the natural sciences, engineering, ICTs, and creative and content fields of education, 2016
As a percentage of students graduating at the tertiary level in 2016
Source: OECD (2019), Measuring the Digital Transformation, based on OECD Education Database, September 2018. https://doi.org/10.1787/888933930687
0
5
10
15
20
25
30
35
40
45
%
Natural sciences, mathematics and statistics Engineering, manufacturing and construction
ICT Creative and content
ICT breakdown not available

For many people, the impacts of the digital transformation are felt especially strongly at work.

Perceived impacts of
digital technologies on specific aspects of work, EU
countries, 2018As a percentage
of individuals using digital
equipment at work
Source: OECD (2019), Measuring the Digital Transformation, based on Eurostat Digital Economy and Society Statistics, January 2019. https://doi.org/10.1787/888933928787 ,
-30
-20
-10
0
10
20
30
40
50
Repetitive tasks Independence inorganising tasks
Performancemonitoring
Time spent onacquiring new skills
Ease of collaboration Irregular workinghours
% Increase (all countries) Decrease (all countries) Net impact (all countries) Highest net impact Lowest net impact
Increase
Decrease
Net impact central
area: 50% of countries
0
10
20
30
40
50
60%
Every day or almost every day At least once a week but not every day Less than once a weekIndividuals
teleworking
from home in
the last 12
months, 2018As a percentage
of individuals
using digital
equipment at
work

Innovation
Scientific authors' views
on the digitalisationof science
and its potential
impacts, 2018
Scientific authors' views
on the digitalisation
of science, by country of residence,
2018
Source: OECD (2019), Measuring the Digital Transformation, based OECD International Survey of Scientific Authors, January 2019. https://doi.org/10.1787/888933928996 , https://doi.org/10.1787/888933928977
-10
-5
0
5
10
15
20
25
30
35%
Negative
Positive
-10
-5
0
5
10
15
20
25
30
35
40
Science acrossborders
Efficiency ofscientific work
Collaborativeand interactive
science
Overall view(averageacross
dimensions)
Quality ofscientificresearch
Private sectorengagement in
digitalsolutions for
science
Inclusivenessof research
opportunitiesand public
engagement
Functioning ofincentives and
rewards inscience
% Leaning towards a positive view
Leaning towards a negative view

Jobs: longer-term
Likelihood of automation or significant change to jobs, 2012 or 2015As a percentage of all jobs
Source: OECD (2019), Measuring the Digital Transformation, reproduced from Nedelkoska and Quintini (2018). https://doi.org/10.1787/88893393554
0
10
20
30
40
50
60
70
%
High likelihood of automation (>70%) Likelihood of significant change (50-70%)

Digital transformation offers many opportunities but there are also downsides, and these tend to be less well understood.

Growth…
Labour productivity in information industries, 2016Relative to labour productivity of other industries in the non-agriculture business sector
Source: OECD (2019), Measuring the Digital Transformation, based on OECD, STAN Database, National Accounts Statistics and national sources, September 2018.. https://doi.org/10.1787/88893393554

…and Well-Being
Students who feel bad if no
Internet connection is
available, 2015
As a percentage of 15 year-old
students
Internet users
looking for a
job or
sending a job
application
online, by age, 2017
Source: OECD (2019), Measuring the Digital Transformation. https://doi.org/10.1787/888933929338, https://doi.org/10.1787/888933929395.
0
10
20
30
40
50
60
70
%All 16-24 year-olds
0
10
20
30
40
50
60
70
80
90
%
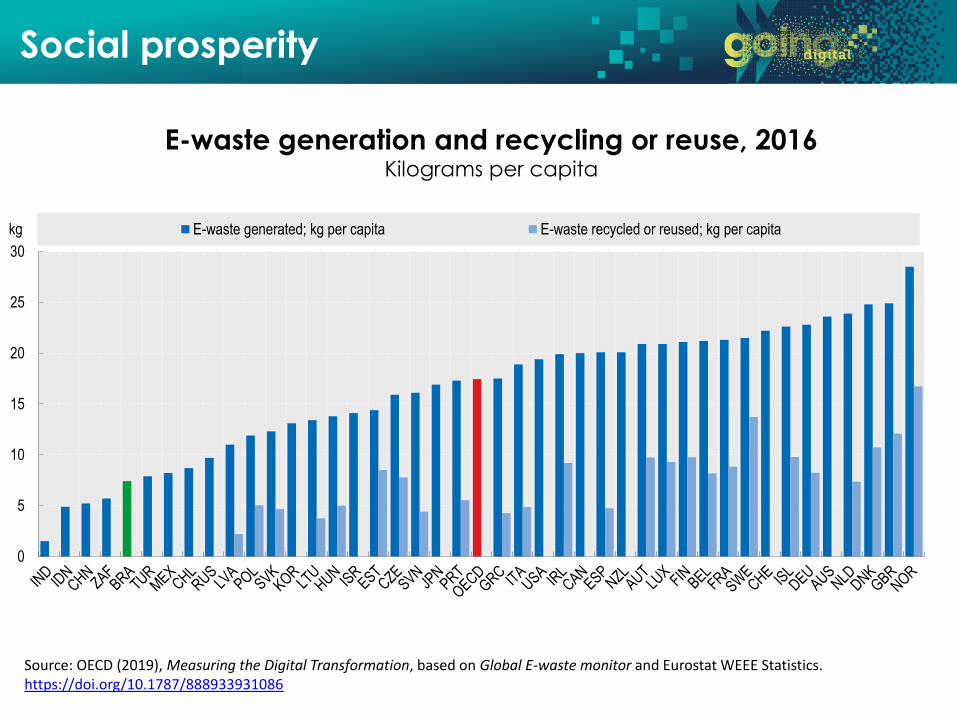
Social prosperity
E-waste generation and recycling or reuse, 2016 Kilograms per capita
Source: OECD (2019), Measuring the Digital Transformation, based on Global E-waste monitor and Eurostat WEEE Statistics. https://doi.org/10.1787/888933931086
0
5
10
15
20
25
30
kg E-waste generated; kg per capita E-waste recycled or reused; kg per capita

Trust
Trust in information accessed through online social networks and messaging applications, 2018
Percentage of respondents, "How much do you trust or not the news and information you access through online social networks and messaging apps?"
Source: OECD (2019), Measuring the Digital Transformation, reproduced from European Commission (2018). https://doi.org/10.1787/888933931390
0
10
20
30
40
50
%
Totally trust Tend to trust

Governments can play an important role in shaping the digital transformation.

Market openness
Digital Services Trade Restrictiveness Index (DSTRI), 2018
Source: OECD (2019), Measuring the Digital Transformation. https://doi.org/10.1787/888933931466, https://doi.org/10.1787/888933931561
0,0 0,1 0,2 0,3 0,4 0,5
CRI
NOR
AUS
CHE
EST
KOR
LUX
SVK
JPN
LTU
NLD
CAN
ESP
GBR
SVN
USA
FRA
ITA
CZE
FIN
MEX
DEU
DNK
IRL
SWE
GRC
PRT
BEL
HUN
ISR
NZL
AUT
TUR
LVA
CHL
POL
ISL
COL
IND
ZAF
RUS
BRA
IDN
CHN
Index
(1=maximum restriction)
Infrastructure and connectivity
Electronic transactions
Payment systems
Intellectual property rights
Other barriers to trade in digitallyenabled services
020406080
LUXIRLCHEGBRNLDFINUSASWEINDOECDJPNISRDEUCANBELFRALVAITACZEHUNCHNKORAUTESPNORSVKPOLZAFMEXESTDNKBRARUSISLNZLAUSSVNCHLLTUIDNPRTGRCTUR%
Insurance and pension services Financial servicesCharges for intellectual property use Telecomms, computer and info. servicesAudiovisual and related services
Imports
0 20 40 60 80
%
Exports
Trade in predominantly digitally deliverable services, 2017As a percentage of total services exports and imports, respectively

IDENTIFYING GAPS AND CO-DEVELOPING
A ROADMAP FOR THE FUTURE
Longer term:
• design new and interdisciplinary approaches to data collection
• leverage the information captured by digital systems
Shorter term:
• improve the international comparability of current indicators
• make statistical systems more flexible and responsive to the introduction of
new and rapidly-evolving concepts driven by the digital transformation
The next generation of data infrastructure for policy making in the digital era needs to build partnerships with the private sectorand engage with stakeholders to bring publicly available, reliable data into the policy-making process.

IDENTIFYING GAPS AND CO-DEVELOPING
A ROADMAP FOR THE FUTURE
Strengthen the evidence base now to better design policies
for digital transformation in the future - 9 ACTIONS
1. Make the digital transformation visible in economic statistics
2. Get the narrative on impacts right
3. Measure wellbeing in the digital age
4. Design new approaches to data collection
5. Monitor transformative technologies (notably IoT, AI, Blockchain)
6. Make sense of data and data flows
7. Define and measure the skills needed in the digital era
8. Measure trust in online environments
9. Assess governments’ digital strengths

The OECD Going Digital Toolkit


Going Digital: Phase II
• Improvements to the Toolkit
• Focus on two key technologies:
• AI
• Blockchain
• Country reviews:
• Going Digital review – aligned with the policy framework
• Telecommunications and broadcasting review
Brazil has commissioned the OECD to undertake both
→currently under way.
For more information:
[email protected] (GD review)
[email protected] (Telecoms review)