eastspring investments dana al-ilham · eastspring investments dana al-ilham. market review the...
TRANSCRIPT

FOR THE SIX MONTHS FINANCIAL PERIOD ENDED 30 SEPTEMBER 2019
INTERIM REPORT
EASTSPRING INVESTMENTSDANA AL-ILHAM
Eastspring Investments Berhad 200001028634 (531241-U)
Level 22, Menara Prudential, Persiaran TRX Barat55188 Tun Razak Exchange, Kuala LumpurT: (603) 2778 3888 F: (603) 2789 7220eastspring.com/my
Client ServicesT: (603) 2778 1000 [email protected]

Dear Valued Investor,
Greetings from Eastspring Investments Berhad!
First and foremost, we would like to take this opportunity to thank you for choosing to invest with Eastspring Investments Berhad.
We are pleased to enclose a copy of the Annual/Interim/Quarterly Fund Reports of Eastspring Investments Berhad’s fund(s) for the reporting period ended 30 September 2019.
You may also download these reports from our website at www.eastspring.com/my
Should you require any assistance, please do not hesitate to contact our Client Services at 03-2778 1000.
Yours sincerely,
Raymond Tang Chee Kin Non-Independent, Executive Director and Chief Executive Officer

TABLE OF CONTENTS
Fund Information 1
Key Performance Data 3
Manager’s Report 6
Market Review 9
Rebates and Soft Commissions 10
Statement by the Manager 12
Trustee’s Report to the Unit Holders of
Eastspring Investments Dana al-Ilham 13
Shariah Adviser’s Report to the Unit Holders of
Eastspring Investments Dana al-Ilham 14
Unaudited Statement of Comprehensive Income 15
Unaudited Statement of Financial Position 16
Unaudited Statement of Changes in Equity 17
Unaudited Statement of Cash Flows 18
Summary of Significant Accounting Policies 19
Notes to the Unaudited Financial Statements 27
Corporate Directory 57

FUND INFORMATION
Name of Fund Eastspring Investments Dana al-Ilham (the “Fund”)
Fund Category/ Type
Shariah equity/growth
Fund Objective The Fund seeks to provide investors with high* capital appreciation** from Shariah-compliant investments which have the potential of substantial value appreciation.
ANY MATERIAL CHANGES TO THE FUND’S OBJECTIVE WOULD REQUIRE UNIT HOLDERS’ APPROVAL.
* high generally refers to potentially higher capital appreciation than the market average.
** high returns are generally associated with high investment risks.
Performance Benchmark
The performance benchmark of the Fund is FTSE Bursa Malaysia EMAS Shariah Index (“FBMS”).
Source: www.bursamalaysia.com
Note: The risk profile of the Fund is different from the risk profile of the performance benchmark.
Fund Income Distribution Policy
Incidental
1Client Services : 03-2778 1000
Interim Report

FUND INFORMATION (CONTINUED)
Breakdown of Unit Holdings by Size
As at 30 September 2019, the size of Eastspring Investments Dana al-Ilham stood at 756.800 million units.
Fund Size
Breakdown of Unit Holdings
Unit Holdings
No. of Unit
Holders %
No. of Units* (‘000) %
5,000 units and below 3,683 21.01 10,244 1.35
5,001 to 10,000 units 3,439 19.62 25,549 3.38
10,001 to 50,000 units 8,030 45.80 187,044 24.72
50,001 to 500,000 units 2,327 13.27 246,980 32.63
500,001 units and above 53 0.30 286,980 37.92
Total 17,532 100.00 756,797 100.00
* excludes units held by the Manager.
Un
its
(Mill
ion
)
Apr2019
Aug2019
Sep2019
May2019
Jun2019
Jul2019
800900
1,000
700
500
300
1000
600
400
200
Client Services : 03-2778 10002
Eastspring Investments Dana al-Ilham

Category 30.9.2019 30.9.2018 30.9.2017
(%) (%) (%)
Quoted Shariah-compliant securities
Construction 1.90 4.94 9.55
Consumer - 0.49 1.80
Consumer Products & Services 18.79 9.50 4.48
Energy 7.17 - -
Financial Services 7.67 4.32 4.48
Health Care 8.89 5.29 9.10
Industrial Products & Services 7.75 13.10 2.06
Infrastructure Project Company - 3.11 5.25
Islamic REITS 1.80 0.79 1.16
Plantation 4.87 5.42 2.68
Property 5.34 3.57 3.48
Technology 9.17 6.32 5.99
Telecommunications & Media 7.68 - -
Trading/Services - 24.45 31.67
Utilities 10.92 - -
91.95 81.30 81.70
Cash and other assets 8.05 18.70 18.30
Total 100.00 100.00 100.00
KEY PERFORMANCE DATAFOR THE FINANCIAL PERIOD ENDED
3Client Services : 03-2778 1000
Interim Report

Category 30.9.2019 30.9.2018 30.9.2017
Net Asset Value (NAV) (RM'000) 490,321 520,857 528,025
Units In Circulation (Units '000) 756,800 742,841 775,617
Net Asset Value Per Unit (RM) 0.6479 0.7012 0.6808
Highest Net Asset Value Per Unit (RM) 0.6721 0.7148 0.6986
Lowest Net Asset Value Per Unit (RM) 0.6284 0.6674 0.6746
Total Return (%)
- Capital Growth 1.49 (0.19) (0.56)
- Income Distribution - - -
Total Return (%) 1.49 (0.19) (0.56)
Gross Distribution Per Unit (RM) - - -
Net Distribution Per Unit (RM) - - -
Management Expense Ratio (MER) (%)* 0.79 0.81 0.84
Portfolio Turnover Ratio (PTR) (times)^ 0.09 0.20 0.35
* There were no significant changes to the MER during the period under review.
^ There were no significant changes to the PTR during the period under review.
KEY PERFORMANCE DATA (CONTINUED)
Client Services : 03-2778 10004
Eastspring Investments Dana al-Ilham

KEY PERFORMANCE DATA (CONTINUED)
1 year 1.10.2018 to
30.9.2019
3 years 1.10.2016 to
30.9.2019
5 years 1.10.2014 to
30.9.2019
(%) (%) (%)
Average total return (2.83) 2.10 1.71
Year ended1.4.2018 to
31.3.20191.4.2017 to
31.3.20181.4.2016 to
31.3.20171.4.2015 to
31.3.20161.4.2014 to
31.3.2015
(%) (%) (%) (%) (%)
Annual total return (4.43) 8.16 1.23 0.91 8.38
Source: The above total return of the Fund was sourced from Lipper for Investment Management.
Bases of calculation and assumptions made in calculating returns:
Percentage growth =
NAVt = NAV at the end of the period
NAV0 = NAV at the beginning of the period Performance annualised = (1 + Percentage Growth)1/n - 1
Adjusted for unit split and distribution paid out for the period
n = Number of years
Past performance is not necessarily indicative of future performance and unit prices and investment returns may go down, as well as up.
NAVt -1NAV0
5Client Services : 03-2778 1000
Interim Report

Fund Performance Over the 5-year period, the Fund recorded a return of 8.85%, outperforming the benchmark return of -10.75% by 19.60%.
For the period under review, the Fund registered a return of 1.49%, outperforming the benchmark return of 0.69% by 0.80%.
The Fund outperformed the benchmark during the period under review mainly due to positive Shariah-compliant stock selections.
The performance is calculated on NAV-to-NAV basis with gross income or dividend reinvested.
Benchmark: FTSE Bursa Malaysia EMAS Shariah Index (“FBMS”).
Source: Lipper for Investment Management and www.bursamalaysia.com, as at 30 September 2019.
Past performance of the Fund is not necessarily indicative of its future performance.
MANAGER’S REPORT
Eastspring Investments Dana al-Ilham Benchmark
Eastspring Investments Dana al-Ilham- 5 Years Return Vs Benchmark
Sep2014
Jan2015
May2015
Sep2015
Jan2016
May2016
Sep2016
Jan2017
May2017
Sep2017
Jan2018
May2018
Sep2018
Jan2019
May2019
Sep2019
5 ye
ars
% C
han
ge
20%
15%
10%
5%
0%
-5%
-10%
-15%
-20%
20%
15%
10%
5%
0%
-5%
-10%
-15%
-20%
Client Services : 03-2778 10006
Eastspring Investments Dana al-Ilham
MANAGER’S REPORT (CONTINUED)
Analysis of Fund Performance
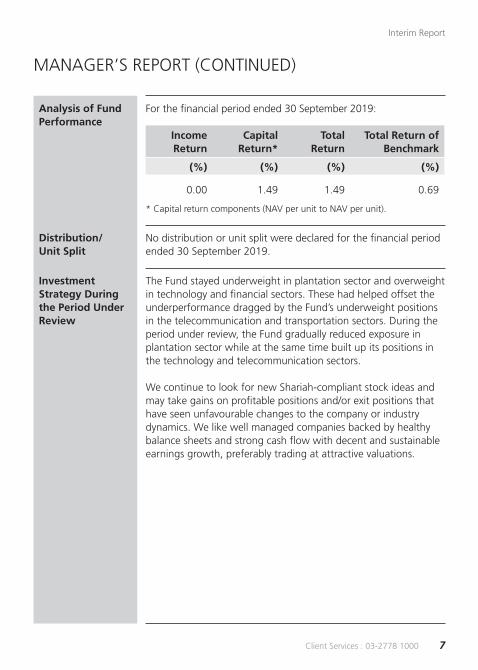
For the financial period ended 30 September 2019:
Income Return
Capital Return*
Total Return
Total Return of Benchmark
(%) (%) (%) (%)
0.00 1.49 1.49 0.69
* Capital return components (NAV per unit to NAV per unit).
Distribution/ Unit Split
No distribution or unit split were declared for the financial period ended 30 September 2019.
Investment Strategy During the Period Under Review
The Fund stayed underweight in plantation sector and overweight in technology and financial sectors. These had helped offset the underperformance dragged by the Fund’s underweight positions in the telecommunication and transportation sectors. During the period under review, the Fund gradually reduced exposure in plantation sector while at the same time built up its positions in the technology and telecommunication sectors.
We continue to look for new Shariah-compliant stock ideas and may take gains on profitable positions and/or exit positions that have seen unfavourable changes to the company or industry dynamics. We like well managed companies backed by healthy balance sheets and strong cash flow with decent and sustainable earnings growth, preferably trading at attractive valuations.
7Client Services : 03-2778 1000
Interim Report

Asset Allocation
Asset Allocation30-Sep
201931-Mar
2019 Changes
(%) (%) (%)
Quoted Shariah-compliant securities 91.95 84.09 7.86 Cash and other assets 8.05 15.91 (7.86)
Asset Allocation as at 30 September 2019
There were no significant changes in asset allocation of the Fund for the period under review.
State of Affairs ofthe Fund
There have been neither significant change to the state of affairs of the Fund nor any circumstances that materially affect any interests of the unit holders during the period under review.
MANAGER’S REPORT (CONTINUED)
Cash and other assets 8.05%
Quoted Shariah-compliant securities
91.95%
Client Services : 03-2778 10008
Eastspring Investments Dana al-Ilham
MARKET REVIEW
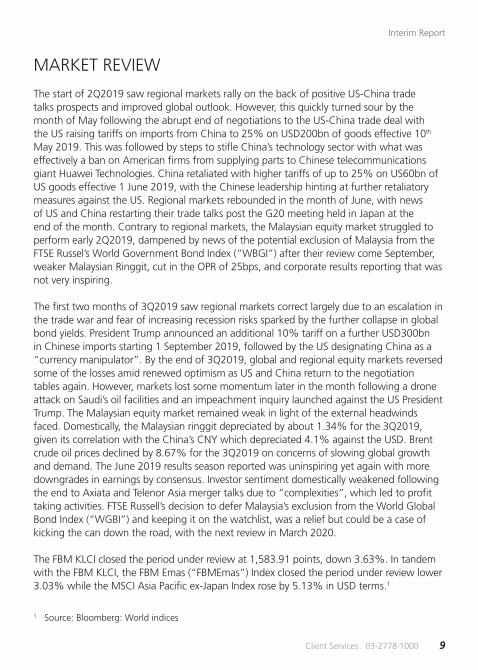
The start of 2Q2019 saw regional markets rally on the back of positive US-China trade talks prospects and improved global outlook. However, this quickly turned sour by the month of May following the abrupt end of negotiations to the US-China trade deal with the US raising tariffs on imports from China to 25% on USD200bn of goods effective 10th May 2019. This was followed by steps to stifle China’s technology sector with what was effectively a ban on American firms from supplying parts to Chinese telecommunications giant Huawei Technologies. China retaliated with higher tariffs of up to 25% on US60bn of US goods effective 1 June 2019, with the Chinese leadership hinting at further retaliatory measures against the US. Regional markets rebounded in the month of June, with news of US and China restarting their trade talks post the G20 meeting held in Japan at the end of the month. Contrary to regional markets, the Malaysian equity market struggled to perform early 2Q2019, dampened by news of the potential exclusion of Malaysia from the FTSE Russel’s World Government Bond Index (“WBGI”) after their review come September, weaker Malaysian Ringgit, cut in the OPR of 25bps, and corporate results reporting that was not very inspiring.
The first two months of 3Q2019 saw regional markets correct largely due to an escalation in the trade war and fear of increasing recession risks sparked by the further collapse in global bond yields. President Trump announced an additional 10% tariff on a further USD300bn in Chinese imports starting 1 September 2019, followed by the US designating China as a “currency manipulator”. By the end of 3Q2019, global and regional equity markets reversed some of the losses amid renewed optimism as US and China return to the negotiation tables again. However, markets lost some momentum later in the month following a drone attack on Saudi’s oil facilities and an impeachment inquiry launched against the US President Trump. The Malaysian equity market remained weak in light of the external headwinds faced. Domestically, the Malaysian ringgit depreciated by about 1.34% for the 3Q2019, given its correlation with the China’s CNY which depreciated 4.1% against the USD. Brent crude oil prices declined by 8.67% for the 3Q2019 on concerns of slowing global growth and demand. The June 2019 results season reported was uninspiring yet again with more downgrades in earnings by consensus. Investor sentiment domestically weakened following the end to Axiata and Telenor Asia merger talks due to “complexities”, which led to profit taking activities. FTSE Russell’s decision to defer Malaysia’s exclusion from the World Global Bond Index (“WGBI”) and keeping it on the watchlist, was a relief but could be a case of kicking the can down the road, with the next review in March 2020.
The FBM KLCI closed the period under review at 1,583.91 points, down 3.63%. In tandem with the FBM KLCI, the FBM Emas (“FBMEmas”) Index closed the period under review lower 3.03% while the MSCI Asia Pacific ex-Japan Index rose by 5.13% in USD terms.1
1 Source: Bloomberg: World indices
9Client Services : 03-2778 1000
Interim Report

REBATES AND SOFT COMMISSIONS
During the period under review, the Manager and its delegates (if any) received goods and services which directly assist the investment management of the Fund, including research and advisory services, market analyses, data and quotation services, and computer hardware and software used for and/or in support of the investment process of fund managers.
The Manager and its delegates (if any) have not received any rebates or shared any commissions from any brokers during the same period under review.
Client Services : 03-2778 100010
Eastspring Investments Dana al-Ilham

EASTSPRING INVESTMENTS DANA AL-ILHAM UNAUDITED FINANCIAL STATEMENTSFOR THE SIX MONTHS FINANCIAL PERIOD ENDED 30 SEPTEMBER 2019
11Client Services : 03-2778 1000
Interim Report

STATEMENT BY THE MANAGER
We, Tang Chee Kin and Iskander Bin Ismail Mohamed Ali, being two of the Directors of Eastspring Investments Berhad, do hereby state that, in the opinion of the Manager, the accompanying unaudited financial statements set out on pages 15 to 56 are drawn up in accordance with the provisions of the Deed and give a true and fair view of the financial position of the Fund as at 30 September 2019 and of its financial performance, changes in equity and cash flows for the six months financial period ended on that date in accordance with the Malaysian Financial Reporting Standards and International Financial Reporting Standards.
For and on behalf of the Manager,EASTSPRING INVESTMENTS BERHAD
TANG CHEE KINExecutive Director/Chief Executive Officer
ISKANDER BIN ISMAIL MOHAMED ALIIndependent, Non-Executive Director
Kuala LumpurDate: 22 November 2019
Client Services : 03-2778 100012
Eastspring Investments Dana al-Ilham

TRUSTEE’S REPORT TO THE UNIT HOLDERS OF EASTSPRING INVESTMENTS DANA AL-ILHAM
We have acted as Trustee for Eastspring Investments Dana al-Ilham (the “Fund”) for the financial period ended 30 September 2019. To the best of our knowledge, for the financial period under review, Eastspring Investments Berhad (the “Manager”) has operated and managed the Fund in accordance with the following:-
a. limitations imposed on the investment powers of the Manager under the Deed(s), the Securities Commission’s Guidelines on Unit Trust Funds, the Capital Markets and Services Act 2007 and other applicable laws;
b. valuation and pricing for the Fund is carried out in accordance with the Deed(s) of the Fund and any regulatory requirements; and
c. creation and cancellation of units for the Fund are carried out in accordance with the Deed(s) of the Fund and any regulatory requirements.
For Deutsche Trustees Malaysia Berhad
Ng Hon Leong Richard Lim Hock SengHead, Trustee Operations Chief Executive Officer
Kuala LumpurDate: 22 November 2019
13Client Services : 03-2778 1000
Interim Report

SHARIAH ADVISER’S REPORT TO THE UNIT HOLDERSOF EASTSPRING INVESTMENTS DANA AL-ILHAM
We have acted as the Shariah Adviser of Eastspring Investments Berhad, the Manager of Eastspring Investments Dana al-Ilham (“the Fund”) for the financial period ended 30 September 2019.
Our responsibility is to ensure that the procedures and processes employed by the Manager as well as the provisions of the Fund’s Deed registered with the Securities Commission (“SC”) are all in accordance with Shariah principles.
In our opinion, based on the periodic reports submitted to us, the Manager has managed and administered the Fund in accordance with Shariah principles and has complied with applicable guidelines, rulings and decisions issued by the Shariah Advisory Council (“SAC”) of the SC for the financial period ended 30 September 2019.
We confirm that the investment portfolio of the Fund comprises securities and instruments which have been classified as Shariah-compliant by either the SAC of the SC or the SAC of Bank Negara Malaysia (“BNM”). As for securities and instruments which have not been classified by the SAC of the SC nor the SAC of BNM, we have reviewed and determined the Shariah status of the said securities and instruments.
For and on behalf of the Shariah Adviser,BIMB SECURITIES SDN BHD
IR. DR. MUHAMAD FUAD ABDULLAHDesignated Shariah Person
Kuala LumpurDate: 22 November 2019
Client Services : 03-2778 100014
Eastspring Investments Dana al-Ilham

UNAUDITED STATEMENT OF COMPREHENSIVE INCOME FOR THE SIX MONTHS FINANCIAL PERIOD ENDED 30 SEPTEMBER 2019
Note
6-months financial
period ended 30.9.2019
6-months financial
period ended 30.9.2018
RM RM
INVESTMENT INCOMEGross dividend income 5,773,490 5,959,282Profit income from financial assets measured at fair value through profit or loss ("FVTPL”) 743,212 1,587,507Net gain/(loss) on financial assets at fair value through profit or loss
6
5,360,265 (3,600,719) 11,876,967 3,946,070
EXPENSESManagement fee 3 (3,797,353) (3,863,379) Trustee fee 4 (177,210) (180,291) Audit fee (3,700) (4,109) Tax agent fee (1,700) (1,706) GST charges (574) (82,940) Other expenses (27,658) (47,056) Transaction costs (229,242) (573,867)
(4,237,437) (4,753,348)
PROFIT/(LOSS) BEFORE TAXATION 7,639,530 (807,278)
TAXATION 5 (13,153) (9,384)
PROFIT/(LOSS) AFTER TAXATION AND TOTAL COMPREHENSIVE INCOME/(LOSS) 7,626,377 (816,662)
Profit/(loss) after taxation is made up of the following: Realised amount (145,921) 18,217,225 Unrealised amount 7,772,298 (19,033,887)
7,626,377 (816,662)
The accompanying summary of significant accounting policies and notes to the unaudited financial statements form an integral part of these unaudited financial statements.
15Client Services : 03-2778 1000
Interim Report

UNAUDITED STATEMENT OF FINANCIAL POSITIONAS AT 30 SEPTEMBER 2019
Note 2019 2018
RM RM
ASSETSCash and cash equivalents 7 39,122,742 93,935,774Amount due from brokers 457,175 4,036,195Amount due from Manager 782,507 3,860,686Tax recoverable 3,054 28,879Dividends receivable 1,770,553 1,441,274Financial assets at fair value through profit or loss 6 450,823,576 423,473,687TOTAL ASSETS 492,959,607 526,776,495
LIABILITIESAmount due to brokers - 4,317,297Amount due to Manager 1,964,827 902,993Accrued management fee 603,053 637,183Amount due to Trustee 28,142 29,735Distribution payable 1,730 -Other payables and accruals 40,898 32,651TOTAL LIABILITIES 2,638,650 5,919,859
NET ASSET VALUE OF THE FUND 490,320,957 520,856,636
EQUITYUnit holders’ capital 442,171,974 448,893,741Retained earnings 48,148,983 71,962,895
NET ASSET ATTRIBUTABLE TO UNIT HOLDERS 490,320,957 520,856,636
NUMBER OF UNITS IN CIRCULATION 9 756,800,365 742,841,111
NET ASSET VALUE PER UNIT (RM) 0.6479 0.7012
The accompanying summary of significant accounting policies and notes to the unaudited financial statements form an integral part of these unaudited financial statements.
Client Services : 03-2778 100016
Eastspring Investments Dana al-Ilham

UNAUDITED STATEMENT OF CHANGES IN EQUITY FOR THE SIX MONTHS FINANCIAL PERIOD ENDED 30 SEPTEMBER 2019
Unit holders’capital
Retainedearnings Total
RM RM RM
Balance as at 1 April 2019 467,704,833 40,522,606 508,227,439
Movement in unit holders’ contribution:Creation of units from applications 35,367,029 - 35,367,029Cancellation of units (60,899,888) - (60,899,888)Total comprehensive income for the financial period - 7,626,377 7,626,377Balance as at 30 September 2019 442,171,974 48,148,983 490,320,957
Balance as at 1 April 2018 450,062,672 72,779,557 522,842,229
Movement in unit holders’ contribution:Creation of units from applications 62,886,426 - 62,886,426Cancellation of units (64,055,357) - (64,055,357)Total comprehensive loss for the financial period - (816,662) (816,662)Balance as at 30 September 2018 448,893,741 71,962,895 520,856,636
The accompanying summary of significant accounting policies and notes to the unaudited financial statements form an integral part of these unaudited financial statements.
17Client Services : 03-2778 1000
Interim Report

UNAUDITED STATEMENT OF CASH FLOWSFOR THE SIX MONTHS FINANCIAL PERIOD ENDED 30 SEPTEMBER 2019
Note
6-months financial
period ended 30.9.2019
6-months financial
period ended 30.9.2018
RM RM
CASH FLOWS FROM OPERATING ACTIVITIESProceeds from sale of Shariah-compliant investments 36,766,855 117,120,257Purchase of Shariah-compliant investments (54,972,256) (89,734,841) Dividends received 5,230,665 5,150,800Profit income received 743,212 1,587,507Management fee paid (3,837,635) (3,892,685) Trustee fee paid (179,090) (181,659) Tax refund 25,824 -Payment for other fees and expenses (262,970) (755,042) Net cash (used in)/generated from operating activities (16,485,395) 29,294,337
CASH FLOWS FROM FINANCING ACTIVITIESCash proceeds from units created 35,983,585 61,412,697Payments for cancellation of units (59,490,464) (65,098,201) Distribution paid - (47,306) Net cash used in financing activities (23,506,879) (3,732,810)
NET (DECREASE)/INCREASE IN CASH AND CASH EQUIVALENTS (39,992,274) 25,561,527
CASH AND CASH EQUIVALENTS AT THE BEGINNING OF THE FINANCIAL PERIOD 79,115,016 68,374,247
CASH AND CASH EQUIVALENTS AT THE END OF THE FINANCIAL PERIOD 7 39,122,742 93,935,774
The accompanying summary of significant accounting policies and notes to the unaudited financial statements form an integral part of these unaudited financial statements.
Client Services : 03-2778 100018
Eastspring Investments Dana al-Ilham

The following accounting policies have been used in dealing with items which are considered material in relation to the financial statements.
A. BASIS OF PREPARATION OF THE FINANCIAL STATEMENTS
The financial statements have been prepared under the historical cost convention in accordance with the Malaysian Financial Reporting Standards (“MFRS”) and International Financial Reporting Standards (“IFRS”), as modified by financial assets at fair value through profit or loss.
The preparation of financial statements in conformity with the MFRS and IFRS requires the use of certain critical accounting estimates and assumptions that affect the reported amounts of assets and liabilities and disclosure of contingent assets and liabilities at the date of the financial statements, and the reported amounts of revenues and expenses during the reported financial period. It also requires the Manager to exercise their judgment in the process of applying the Fund’s accounting policies. Although these estimates and judgment are based on the Manager’s best knowledge of current events and actions, actual results may differ.
The areas involving a higher degree of judgment or complexity, or areas where assumptions and estimates are significant to the financial statements are disclosed in Note J to the financial statements.
a. Standards, amendments to published standards and interpretations that are effective:
The Fund has applied the following amendments for the first time for the financial year beginning on 1 April 2019:
• Amendments to MFRS 112 ‘Income Taxes’ (effective from 1 April 2019) clarify that where income tax consequences of dividends on financial instruments classified as equity1 is recognised (either in profit or loss, other comprehensive income or equity) depends on where the past transactions that generated distributable profits were recognised.
Accordingly, the tax consequences are recognised in profit or loss when an entity determines payments on such instruments are distribution of profits (that is, dividends). Tax on dividend should not be recognised in equity merely on the basis that it is related to a distribution to owners.
SUMMARY OF SIGNIFICANT ACCOUNTING POLICIESFOR THE SIX MONTHS FINANCIAL PERIOD ENDED 30 SEPTEMBER 2019
19Client Services : 03-2778 1000
Interim Report

This standard is not expected to have a significant impact on the Fund’s financial statements.
B. INCOME RECOGNITION
Profit income earned from Islamic deposits is recognised on the accrual basis, using the effective profit rate method.
Dividend income is recognised on the ex-dividend date, when the right to receive the dividend has been established.
Realised gain or loss on disposal of Shariah-compliant securities is accounted for as the difference between the net disposal proceeds and the carrying amount of Shariah-compliant securities, which is determined on a weighted average cost basis.
C. TAXATION
Current tax expense is determined according to the Malaysian tax laws at the current rate based upon the taxable income earned during the financial period.
D. PRESENTATION AND FUNCTIONAL CURRENCY
Items included in the financial statements of the Fund are measured using the currency as the primary economic environment in which the Fund operates (the “functional currency”). The financial statements are presented in Ringgit Malaysia (“RM”), which is the Fund’s presentation and functional currency.
¹ For the purposes of the investments made by the Fund, equity refers to Shariah-compliant equity instruments.
Client Services : 03-2778 100020
Eastspring Investments Dana al-Ilham

E. FINANCIAL ASSETS AND FINANCIAL LIABILITIES
i. Classification
The Fund classify its financial assets in the following measurement categories:
• those to be measured subsequently at fair value (either through other comprehensive income (“OCI”) or through profit or loss), and
• those to be measured at amortised cost
The Fund classifies its Shariah-compliant investments based on both the Fund’s business model for managing those financial assets and the contractual cash flow characteristics of the financial assets. The portfolio of financial assets is managed and performance is evaluated on a fair value basis. The Fund is primarily focused on fair value information and uses that information to assess the assets’ performance and to make decisions. The Fund has not taken the option to irrevocably designate any equity securities as fair value through other comprehensive income. Consequently, all Shariah-compliant investments are measured at fair value through profit or loss.
The Fund classifies cash and cash equivalents, dividends receivable, amount due from brokers and amount due from Manager as financial assets at amortised cost as these financial assets are held to collect contractual cash flows consisting of the amount outstanding.
The Fund classifies amount due to brokers, accrued management fee, amount due to Manager, amount due to Trustee, distribution payable and other payables and accruals as financial liabilities measured at amortised cost.
21Client Services : 03-2778 1000
Interim Report

ii. Recognition and measurement
Regular purchases and sales of financial assets are recognised on the trade date, the date on which the Fund commits to purchase or sell the asset. Shariah-compliant investments are initially recognised at fair value and transaction costs are expensed in the statement of comprehensive income.
Financial assets are derecognised when the rights to receive cash flows from the Shariah-compliant investments have expired or have been transferred and the Fund has transferred substantially all risks and rewards of ownership.
Financial liabilities are recognised in the statement of financial position when, and only when, the Fund becomes a party to the contractual provisions of the financial instrument.
Financial liability is derecognised when the obligation under the liability is extinguished; i.e when the obligation specified in the contract is discharged or cancelled or expired.
Unrealised gains or losses arising from changes in the fair value of the ‘financial assets at fair value through profit or loss’ are presented in the statement of comprehensive income within ‘net gain/(loss) on financial assets at fair value through profit and loss’ in the period in which they arise. Any unrealised gains however are not distributable.
Dividend income from financial assets at fair value through profit or loss is recognised in the statement of comprehensive income as part of gross dividend income when the Fund’s right to receive payments is established.
Quoted Shariah-compliant securities in Malaysia are valued at the last done market price quoted on Bursa Malaysia Securities Berhad (“Bursa Securities”) at the date of the statement of financial position.
If a valuation based on the market price does not represent the fair value of the Shariah-compliant securities, for example during abnormal market conditions or no market price is available, including in the event of a suspension in the quotation of the Shariah-compliant securities for a period exceeding 14 days,
Client Services : 03-2778 100022
Eastspring Investments Dana al-Ilham

or such shorter period as agreed by the Trustee, then the Shariah-compliant securities are valued as determined in good faith by the Manager, based on the methods or bases approved by the Trustee after appropriate technical consultation.
Islamic deposits with licensed financial institutions are stated at cost plus accrued profit calculated on the effective profit method over the period from the date of placement to the date of maturity of the respective Islamic deposits.
Receivables and other financial liabilities are subsequently carried at amortised cost using the effective profit method.
iii. Impairment for assets carried at amortised costs
The Fund measures credit risk and expected credit losses using probability of default, exposure at default and loss given default. Management consider both historical analysis and forward looking information in determining any expected credit loss. Management consider the probability of default to be close to zero as these instruments have a low risk of default and the counterparties have a strong capacity to meet their contractual obligations in the near term. As a result, no loss allowance has been recognised based on 12 months expected credit losses as any such impairment would be wholly insignificant to the Fund.
Significant increase in credit risk
A significant increase in credit risk is defined by management as any contractual payment which is more than 30 days past due.
Definition of default and credit-impaired financial assets
Any contractual payment which is more than 90 days past due is considered credit impaired.
23Client Services : 03-2778 1000
Interim Report

Write-off
The Fund writes off financial assets, in whole or in part, when it has exhausted all practical recovery efforts and has concluded that there is no reasonable expectation of recovery. The assessment of no reasonable expectation of recovery is based on unavailability of obligor’s sources of income or assets to generate sufficient future cash flows to pay the amount. The Fund may write-off financial assets that are still subject to enforcement activity. Subsequent recoveries of amounts previously written off will result in impairment gains. There are no write-offs/recoveries during the financial period.
F. CASH AND CASH EQUIVALENTS
For the purpose of the statement of cash flows, cash and cash equivalents comprise bank balance and Islamic deposits with licensed financial institutions that are readily convertible to known amounts of cash and which are subject to an insignificant risk of changes in value.
G. UNIT HOLDERS’ CAPITAL
The unit holders’ contributions to the Fund meet the criteria to be classified as equity instruments under MFRS 132 “Financial Instruments: Presentation”. Those criteria include:
• the units entitle the holder to a proportionate share of the Fund’s net assets value; • the units are the most subordinated class and class features are identical; • there is no contractual obligations to deliver cash or another financial asset other
than the obligation on the Fund to repurchase; and• the total expected cash flows from the units over its life are based substantially on
the profit or loss of the Fund.
The outstanding units are carried at the redemption amount that is payable at each financial year if unit holder exercises the right to put the unit back to the Fund.
Units are created and cancelled at prices based on the Fund’s net asset value per unit at the time of creation or cancellation. The Fund’s net asset value per unit is calculated by dividing the net assets attributable to unit holders with the total number of outstanding units.
Client Services : 03-2778 100024
Eastspring Investments Dana al-Ilham

H. AMOUNT DUE FROM/(TO) BROKERS
Amounts due from and to brokers represent receivables for Shariah-compliant securities sold and payables for Shariah-compliant securities purchased that have been contracted for but not yet settled or delivered on the statement of financial position date respectively.
These amounts are recognised initially at fair value and subsequently measured at amortised cost using the effective profit method, less provision for impairment for amount due from brokers. A provision for impairment of amount due from brokers is established when there is objective evidence that the Fund will not be able to collect all amounts due from the relevant broker. Significant financial difficulties of the broker, probability that the broker will enter bankruptcy or financial reorganisation, and default in payments are considered indicators that the amount due from brokers is impaired. Once a financial asset or a group of similar financial assets has been written down as a result of an impairment loss, profit income is recognised using the rate of profit used to discount the future cash flows for the purpose of measuring the impairment loss.
The effective profit method is a method of calculating the amortised cost of a financial asset or financial liability and of allocating the profit income or profit expense over the relevant period. The effective profit rate is the rate that exactly discounts estimated future cash payments or receipts throughout the expected life of the financial instrument, or, when appropriate, a shorter period, to the net carrying amount of the financial asset or financial liability. When calculating the effective profit rate, the Fund estimates cash flows considering all contractual terms of the financial instrument but does not consider future credit losses. The calculation includes all fees and points paid or received between parties to the contract that are an integral part of the effective profit rate, transaction costs and all other premiums or discounts.
I. SEGMENTAL INFORMATION
Operating segments are reported in a manner consistent with the internal reporting used by the chief operating decision-maker. The chief operating decision-maker, who is responsible for allocating resources and assessing performance of the operating segments, has been identified as the Investment Committee of the Fund’s Manager that undertakes strategic decisions for the Fund.
25Client Services : 03-2778 1000
Interim Report
J. CRITICAL ACCOUNTING ESTIMATES AND JUDGMENTS IN APPLYING ACCOUNTING POLICIES
The Fund makes estimates and assumptions concerning the future. The resulting accounting estimates will, by definition, rarely equal the related actual results. To enhance the information content on the estimates, certain key variables that are anticipated to have material impacts to the Funds’ results and financial position are tested for sensitivity to changes in the underlying parameters.
Estimates and judgments are continually evaluated by the Manager and the Trustee and are based on historical experience and other factors, including expectations of future events that are believed to be reasonable under the circumstances.
In undertaking any of the Fund’s Shariah-compliant investment, the Manager will ensure that all assets of the Fund under management will be valued appropriately, that is at fair value and in compliance with Securities Commission Guidelines on Unit Trust Funds.
However, the Manager is of the opinion that in applying the accounting policies, no significant judgment was required.
Client Services : 03-2778 100026
Eastspring Investments Dana al-Ilham

1. INFORMATION ON THE FUND
Eastspring Investments Dana al-Ilham (the “Fund”) was constituted pursuant to the execution of a Master Deed dated 25 July 2002 as amended by a Supplemental Master Deed dated 22 June 2004 and a Second Supplemental Master Deed dated 25 January 2005, followed by Master Supplemental Deed dated 12 July 2007 and Second Supplemental Master Deed dated 30 November 2009 between HSBC (Malaysia) Trustee Berhad (“HSBC Trustee”) and Eastspring Investments Berhad (the “Manager”). The Fund replaced HSBC Trustee with Deutsche Trustees Malaysia Berhad (the “Trustee”) effective 1 October 2010. A Supplemental Master Deed was entered into between the Manager and the Trustee on 30 July 2010 to effect the change of trustee from HSBC Trustee to the Trustee, followed by Second Supplemental Master Deed dated 28 January 2011, Third Supplemental Master Deed dated 9 March 2011, Fourth Supplemental Master Deed dated 20 January 2012, Fifth Supplemental Master Deed dated 26 March 2014, Sixth Supplemental Master Deed dated 2 January 2015, Seventh Supplemental Master Deed dated 11 July 2016, Eighth Supplemental Master Deed dated 25 January 2017, Ninth Supplemental Master Deed dated 11 December 2017 and Tenth Supplemental Master Deed dated 4 June 2018 (collectively referred to as the “Deed”).
The Fund was launched on 14 August 2002 and will continue its operations until
terminated by the Trustee or the Manager as provided under Part 12 of the Deed.
The Fund invests principally in a diversified portfolio of Shariah-compliant equities and Shariah-compliant equity-related securities that are undervalued and have good growth potential. All Shariah-compliant investments will be subjected to the Securities Commission (the “SC”) Guidelines on Unit Trust Funds, the Deed and the objective of the Fund.
The Fund seeks to provide investors with high capital appreciation from Shariah-compliant investments which have the potential of substantial value appreciation.
The Manager is a company incorporated in Malaysia and is related to Prudential Plc., a public listed company in the United Kingdom. The principal activity of the Manager is the establishment and management of unit trust funds and asset management.
NOTES TO THE UNAUDITED FINANCIAL STATEMENTSFOR THE SIX MONTHS FINANCIAL PERIOD ENDED 30 SEPTEMBER 2019
27Client Services : 03-2778 1000
Interim Report

2. FINANCIAL RISK MANAGEMENT OBJECTIVES AND POLICIES
The Fund is exposed to a variety of risks which include market risk (inclusive of price risk and exposure to interest rate risk), stock/issuer risk, liquidity risk, fund management risk, non compliance risk, Shariah status reclassification risk, capital risk and credit/default risk.
Financial risk management is carried out through internal control processes adopted by the Manager and adherence to the investment restrictions as stipulated in the Deed.
Financial instruments of the Fund are as follows:
Note
Financial assets at
amortised cost
Financial assets at
fair value through
profit or loss Total
RM RM RM
2019Cash and cash equivalents 7 39,122,742 - 39,122,742Amount due from brokers 457,175 - 457,175Amount due from Manager 782,507 - 782,507Dividends receivable 1,770,553 - 1,770,553Quoted Shariah-compliant securities 6 - 450,823,576 450,823,576
42,132,977 450,823,576 492,956,553
Client Services : 03-2778 100028
Eastspring Investments Dana al-Ilham

Note Receivables
Financial assets at
fair value through
profit or loss Total
RM RM RM
2018Cash and cash equivalents 7 93,935,774 - 93,935,774Amount due from brokers 4,036,195 - 4,036,195Amount due from Manager 3,860,686 - 3,860,686Dividends receivable 1,441,274 - 1,441,274Quoted Shariah-compliant securities 6 - 423,473,687 423,473,687
103,273,929 423,473,687 526,747,616
All liabilities are financial liabilities which are carried at amortised cost.
Market risk
a. Price risk
This risk refers to changes and developments in regulations, politics and the economy of the country. The very nature of an Islamic Unit Trust Fund, however, helps mitigate this risk because a Fund would generally hold a well-diversified portfolio of Shariah-compliant securities from different market sectors so that the collapse of any one of the Shariah-compliant security or any one market sector would not impact too greatly on the value of the Fund.
29Client Services : 03-2778 1000
Interim Report

The table below shows assets of the Fund as at 30 September which are exposed to price risk:
2019 2018
RM RM
Quoted Shariah-compliant securities designated at fair value through profit or loss 450,823,576 423,473,687
The following table summarises the sensitivity of the Fund’s net asset value and profit/(loss) after tax to movements in prices of quoted Shariah-compliant securities at the end of each reporting period. The analysis is based on the assumptions that the market price of the quoted Shariah-compliant securities increased by 5% and decreased by 5% with all other variables held constant. This represents management’s best estimate of a reasonable possible shift in the quoted Shariah-compliant securities, having regard to the historical volatility of the prices.
% Change in priceMarket
value
Increase/(decrease) in profit/(loss) after
tax and net asset value
RM RM
2019+5% 473,364,755 22,541,179-5% 428,282,397 (22,541,179)
2018+5% 444,647,371 21,173,684-5% 402,300,003 (21,173,684)
Client Services : 03-2778 100030
Eastspring Investments Dana al-Ilham

b. Exposure to interest rate risk
Fair value interest rate risk is the risk that the value of a financial instrument will fluctuate due to changes in market interest rates.
Interest rate risk refers to interest rate movements, which will affect the returns on the Shariah-compliant investments held by the Fund.
The above interest rate is a general economic indicator that will have an impact on the management of the Fund regardless whether it is an Islamic Unit Trust Fund or otherwise. It does not in any way suggest that the Fund will invest in conventional financial instruments. All the investments are carried out for the Fund are in accordance with Shariah requirements.
As at the date of the statement of financial position, all the financial assets and financial liabilities have no exposure to interest rate movement except for Islamic deposits with licensed financial institutions of RM38,993,151 (2018: RM92,235,010) which have maturities of less than one year.
The Fund’s investments in Islamic deposits with licensed financial institutions are short-term in nature. Therefore, exposure to interest rate fluctuations is minimal.
The Fund is not exposed to cash flow interest rate risk as the Fund does not hold any financial instruments at variable profit rate.
Stock/Issuer risk
The Fund is restricted to investment in Shariah-compliant securities issued by and Shariah-compliant securities relating to any issuer of not more than fifteen percent (15%) of its net asset value. Furthermore, the Fund is restricted to invest in Shariah-compliant securities issued by and Shariah-compliant securities relating to any group of companies of not more than twenty percent (20%) of its net asset value. Under such restrictions, the exposure risk to the Shariah-compliant securities of any single issuer or any one group of companies is minimised.
Liquidity risk
Liquidity risk is the risk that the Fund will encounter difficulty in meeting its financial obligations. Generally, all investments are subject to a certain degree of liquidity risk depending on the nature of the investment instruments, market, sector and other
31Client Services : 03-2778 1000
Interim Report

factors. For the purpose of the Fund, the Manager will attempt to balance the entire portfolio by investing in a mix of assets with satisfactory trading volume and those that occasionally could encounter poor liquidity. This is expected to reduce the risks for the entire portfolio without limiting the Fund’s growth potentials.
The Fund maintains sufficient level of Islamic liquid assets, after consultation with the Trustee, to meet anticipated payments and cancellations of units by unit holders. Islamic liquid assets comprise cash, Islamic deposits with licensed financial institutions and other Shariah-compliant instruments which are capable of being converted into cash within 7 days.
The table below summarises the Fund’s financial liabilities into relevant maturity groupings based on the remaining period as at the statement of financial position date to the contractual maturity date. The amounts in the table are the contractual undiscounted cash flows.
Less than 1 month
Between 1 month to
1 year Total
RM RM RM
2019Amount due to Manager 1,964,827 - 1,964,827Accrued management fee 603,053 - 603,053Amount due to Trustee 28,142 - 28,142Distribution payable 1,730 - 1,730Other payables and accruals - 40,898 40,898Contractual cash outflows 2,597,752 40,898 2,638,650
2018Amount due to Manager 902,993 - 902,993Accrued management fee 637,183 - 637,183Amount due to Trustee 29,735 - 29,735Amount due to brokers 4,317,297 - 4,317,297Other payables and accruals - 32,651 32,651Contractual cash outflows 5,887,208 32,651 5,919,859
Client Services : 03-2778 100032
Eastspring Investments Dana al-Ilham

Fund management risk
There is the risk that the management company may not adhere to the investment mandate of the respective Fund. With close monitoring by the investment committee, back office system being incorporated with limits and controls, and regular reporting to the senior management team, the management company is able to manage such risk. The Trustee has an oversight function over management of the Fund by the management company to safeguard the interests of unit holders.
Non-compliance risk
Non-compliance risk arises when the Manager and others associated with the Fund are not compliant to the rules set out in the Fund’s constitution or the law that governs the Fund or applicable internal control procedures, or act fraudulently or dishonestly.
The non-compliance may expose the Fund to higher risks which may result in a fall in the value of the Fund which in turn may affect its investment goals. However, the risk can be mitigated by the internal controls and compliance monitoring undertaken by the Manager.
Shariah status reclassification risk
The risk that the currently held Shariah-compliant securities in the portfolio of Islamic funds may be reclassified as Shariah non-compliant in the periodic review of the securities by the Shariah Advisory Council of the Securities Commission or the Shariah Adviser. If this occurs, the Manager will take the necessary steps to dispose of such securities.
Opportunity loss could occur due to the restriction on the Fund to retain the excess capital gains derived from the disposal of the reclassified Shariah non-compliant securities. In such an event, the Fund is required:
i. to dispose such securities with immediate effect or within one (1) calendar month if the value of the securities exceeds or is equal to the investment cost on the effective date of Reclassification of the List of Shariah-compliant securities (“Reclassification“) by the SAC of the SC or the Shariah Adviser. The Fund is allowed to keep dividends received and capital gains from the disposal of the securities up to the effective date of Reclassification. However, any dividends received and excess capital gains from the disposal of the Shariah non-compliant securities after the effective date of Reclassification should be channelled to baitulmal and/or approved charitable bodies;
33Client Services : 03-2778 1000
Interim Report

ii. to hold such securities if the value of the said securities is below the investment cost on the effective date of Reclassification until the total subsequent dividends received (if any) and the market price of the securities is equal to the cost of investment at which time disposal has to take place within one (1) calendar month, capital gains (if any) from the disposal of the securities should be channelled to baitulmal and/or approved charitable bodies; or
iii. to dispose such securities at a price lower than the investment cost which will result in a decrease in the Fund’s value.
Capital risk
The capital of the Fund is represented by equity consisting of unit holders’ capital of RM442,171,974 (2018:RM448,893,741) and retained earnings of RM48,148,983 (2018: RM71,962,895). The amount of equity can change significantly on a daily basis as the Fund is subject to daily subscriptions and redemptions at the discretion of unit holders. The Fund’s objective when managing capital is to safeguard the Fund’s ability to continue as a going concern in order to provide returns for unit holders and benefits for other stakeholders and to maintain a strong capital base to support the development of the Shariah-compliant investment activities of the Fund.
Credit/Default risk
Credit risk refers to the ability of an issuer or a counter party to make timely payments of profit, principals and proceeds from realisation of Shariah-compliant investments.
The credit risk arising from placements of Islamic deposits with licensed financial institutions is managed by ensuring that the Fund will only place Islamic deposits with reputable licensed financial institutions. For the amount due from brokers, the settlement terms are governed by the relevant rules and regulations are prescribed by Bursa Securities. The settlement terms of the proceeds from the creation of units receivable from the Manager are governed by the Securities Commission’s Guidelines on Unit Trust Funds.
The credit/default risk is minimal as all transactions in quoted Shariah-compliant securities are settled/paid upon delivery using approved brokers.
Client Services : 03-2778 100034
Eastspring Investments Dana al-Ilham

The following table sets out the credit risk concentrations and counterparties of the Fund.
Cash and cash
equivalents
Amount due from Manager
Amount due from
brokersDividends receivable Total
RM RM RM RM RM
2019Consumer Products & Services- NR - - - 478,379 478,379Finance- AAA 38,993,151 - - - 38,993,151- AA1 129,591 - - - 129,591Health Care- NR - - - 64,161 64,161Property- NR - - - 168,715 168,715Islamic REITS- NR - - - 36,911 36,911Technology- NR - - - 83,777 83,777Utlities- NR - - - 938,610 938,610Other- NR - 782,507 457,175 - 1,239,682
39,122,742 782,507 457,175 1,770,553 42,132,977
35Client Services : 03-2778 1000
Interim Report

Cash and cash
equivalents
Amount due from Manager
Amount due from
brokersDividends receivable Total
RM RM RM RM RM
2018Construction- NR - - 280,092 - 280,092Finance- AAA 92,235,010 - - - 92,235,010- AA1 1,700,764 - - - 1,700,764Industrial Products & Services- NR - - 521,041 125,883 646,924Infrastructure Project Company- NR - - 1,239,662 - 1,239,662Plantation- NR - - - 79,345 79,345Property- NR - - - 268,842 268,842Technology- NR - - - 130,034 130,034Trading/ Services- NR - - 1,995,400 837,170 2,832,570Other- NR - 3,860,686 - - 3,860,686
93,935,774 3,860,686 4,036,195 1,441,274 103,273,929
None of these assets are past due or impaired.
Client Services : 03-2778 100036
Eastspring Investments Dana al-Ilham

Fair value estimation
Fair value is defined as the price that would be received to sell an asset or paid to transfer a liability in an orderly transaction between market participants at the measurement date (i.e. an exit price).
The fair value of financial assets traded in active market (such as trading Shariah-compliant securities) are based on quoted market prices at the close of trading on the period end date. The Fund utilises the last traded market price for financial assets where the last traded price falls within the bid-ask spread. In circumstances where the last traded price is not within the bid-ask spread, the Manager will determine the point within the bid-ask spread that is representative of the fair value.
An active market is a market in which transactions for the asset take place with sufficient frequency and volume to provide pricing information on an ongoing basis.
The fair value of financial assets that are not traded in an active market is determined
by using valuation techniques.
Fair value hierarchy
i. The table below analyses financial instruments carried at fair value by valuation method. The different levels have been defined as follows:
• Level 1: Quoted prices (unadjusted) in active market for identical assets or liabilities.
• Level 2: Inputs other than quoted prices included within Level 1 that are observable for the asset or liability, either directly (that is, as prices) or indirectly (that is, derived from prices).
• Level 3: Inputs for the asset and liability that are not based on observable market data (that is, unobservable inputs).
The level in the fair value hierarchy within which the fair value measurement is categorised in its entirety is determined on the basis of the lowest level input that is significant to the fair value measurement in its entirety. For this purpose, the significance of an input is assessed against the fair value measurement in its entirety. If a fair value measurement uses observable inputs that require significant adjustment based on unobservable inputs, that measurement is a Level 3 measurement.
37Client Services : 03-2778 1000
Interim Report

Assessing the significance of a particular input to the fair value measurement in its entirety requires judgement, considering factors specific to the asset or liability.
The determination of what constitutes ‘observable’ requires significant judgement by the Fund. The Fund considers observable data to be that market data that is readily available, regularly distributed or updated, reliable and verifiable, not proprietary, and provided by independent sources that are actively involved in the relevant market.
The following table analyses within the fair value hierarchy the Fund’s financial assets (by class) measured at fair value:
Level 1 Level 2 Level 3 Total
RM RM RM RM
2019Financial assets at fair value through profit or loss: Quoted Shariah- compliant securities 450,823,576 - -
450,823,576
2018Financial assets at fair value through profit or loss: Quoted Shariah- compliant securities 423,473,687 - - 423,473,687
Investments whose values are based on quoted market prices in active markets, and are therefore classified within Level 1, include active listed Shariah-compliant securities. The Fund does not adjust the quoted prices for these instruments. The Fund’s policies on valuation of these financial assets are stated in Note E to the financial statements.
ii. The carrying value of cash and cash equivalents, amount due from brokers, amount due from Manager, dividends receivable and all liabilities are a reasonable approximation of their fair values due to their short term nature.
Client Services : 03-2778 100038
Eastspring Investments Dana al-Ilham

3. MANAGEMENT FEE
In accordance with the Deed, the Manager is entitled to a management fee at a rate not exceeding 3.00% per annum on the net asset value of the Fund calculated on daily basis.
For the financial period ended 30 September 2019, the management fee is recognised at a rate of 1.50% (2018: 1.50%) per annum on the net asset value of the Fund, calculated on daily basis.
There will be no further liability to the Manager in respect of the management fee other than the amounts recognised above.
4. TRUSTEE FEE
In accordance with the Deed, the Trustee is entitled to an annual fee at a rate not exceeding 0.20% per annum on the net asset value of the Fund, subject to a minimum fee of RM18,000 per annum.
For the financial period ended 30 September 2019, the Trustee fee is recognised at a rate of 0.07% (2018: 0.07%) per annum on the net asset value of the Fund, inclusive of local custodian fee, calculated on daily basis.
There will be no further liability to the Trustee in respect of the Trustee fee other than the amounts recognised above.
39Client Services : 03-2778 1000
Interim Report

5. TAXATION
6-months financial
period ended 30.9.2019
6-months financial
period ended 30.9.2018
RM RM
Tax charged for the financial period: Current taxation – local 13,153 9,384
The numerical reconciliation between profit/(loss) before taxation multiplied by the Malaysian statutory tax rate and tax expense of the fund is as follows:
6-months financial
period ended 30.9.2019
6-months financial
period ended 30.9.2018
RM RM
Profit/(loss) before taxation 7,639,530 (807,278)
Tax at Malaysian statutory rate of 24% (2018: 24%) 1,833,487 (193,747)
Tax effect of: Shariah-compliant investment income not subject to tax (2,850,472) (924,532) Expenses not deductible for tax purposes 104,732 212,606 Restriction on the tax deductible expenses for Unit Trust Funds 912,253 928,197 Income subject to different tax rate 13,153 (13,140)
Taxation 13,153 9,384
Client Services : 03-2778 100040
Eastspring Investments Dana al-Ilham

6. FINANCIAL ASSETS AT FAIR VALUE THROUGH PROFIT OR LOSS
2019 2018
RM RM
Designated at fair value through profit or loss: Quoted Shariah-compliant securities 450,823,576 423,473,687
Net gain/(loss) on financial assets at fair value through profit or loss: Realised (loss)/gain on disposals (2,412,033) 15,433,168 Change in unrealised fair value gain/(loss) 7,772,298 (19,033,887)
5,360,265 (3,600,719)
41Client Services : 03-2778 1000
Interim Report

Quoted Shariah-compliant securities
Name of counter QuantityAggregate
cost
Fair value as at
30.9.2019
Percentage of net asset value of the
Fund
Units RM RM %
ConstructionEconpile Holdings Berhad 1,949,500 1,277,739 1,345,155 0.27Gabungan AQRS Berhad 4,294,710 7,212,080 5,368,388 1.09WCT Holdings Berhad 2,923,726 5,180,558 2,631,353 0.54
9,167,936 13,670,377 9,344,896 1.90Consumer Products & ServicesAjinomoto (Malaysia) Berhad 76,200
1,345,349
1,269,492 0.26
Bermaz Auto Berhad 4,710,440 6,825,516 10,739,803 2.19DRB-HICOM Berhad 4,196,100 8,931,977 9,944,757 2.03Magni-Tech Industries Berhad
498,300
3,612,675
3,194,103 0.65
Nestle (Malaysia) Berhad 224,000 18,101,608 32,636,800 6.66Padini Holdings Berhad 1,193,100 5,916,738 4,557,642 0.93Petronas Dagangan Berhad 201,300
5,031,312 4,750,680 0.97
QL Resources Berhad 1,342,900 8,345,507 9,682,309 1.97Sime Darby Berhad 2,446,200 6,122,585 5,503,950 1.12UMW Holdings Berhad 2,020,200 9,472,210 9,858,576 2.01
16,908,740 73,705,477 92,138,112 18.79EnergyDialog Group Berhad 6,697,400 12,697,321 22,771,160 4.64 Sapura Energy Berhad 14,163,300 7,342,122 3,965,724 0.81 Serba Dinamik Holdings Berhad
1,985,400
7,154,524 8,437,950 1.72
22,846,100 27,193,967 35,174,834 7.17
Client Services : 03-2778 100042
Eastspring Investments Dana al-Ilham

Quoted Shariah-compliant securities (continued)
Name of counter QuantityAggregate
cost
Fair value as at
30.9.2019
Percentage of net asset value of the
Fund
Units RM RM %
Financial ServicesBIMB Holdings Berhad 2,677,300 11,055,746 10,602,108 2.16Bursa Malaysia Berhad 1,162,200 7,703,962 7,089,420 1.45Syarikat Takaful Malaysia Keluarga Berhad 3,372,400
9,043,899
19,897,160 4.06
7,211,900 27,803,607 37,588,688 7.67Health CareHartalega Holdings Berhad 2,100,100 6,450,764 11,025,525 2.25IHH Healthcare Berhad 1,820,100 10,372,359 10,338,168 2.11Kossan Rubber Industries Berhad 2,377,600
7,944,227 10,176,128 2.08
KPJ Healthcare Berhad 4,851,800 4,891,765 4,293,843 0.88Top Glove Corporation Berhad
1,732,600 9,709,325
7,710,070 1.57
12,882,200 39,368,440 43,543,734 8.89Industrial Products & ServicesATA IMS Berhad 3,610,400 6,101,576 4,801,832 0.98 Cahya Mata Sarawak Berhad
3,782,700
12,742,520 10,213,290 2.08
Petronas Chemicals Group Berhad 1,992,500
16,100,248 15,023,450 3.06
V.S. Industry Berhad 5,914,200 5,730,310 7,984,170 1.6315,299,800 40,674,654 38,022,742 7.75
PlantationIOI Corporation Berhad 1,989,300 9,086,750 8,812,599 1.80Kuala Lumpur Kepong Berhad 318,200
7,318,850 7,344,056 1.50
Sime Darby Plantation Berhad 1,623,534
9,028,410
7,679,316 1.57
3,931,034 25,434,010 23,835,971 4.87
43Client Services : 03-2778 1000
Interim Report
Quoted Shariah-compliant securities (continued)
Name of counter QuantityAggregate
cost
Fair value as at
30.9.2019
Percentage of net asset value of the
Fund
Units RM RM %
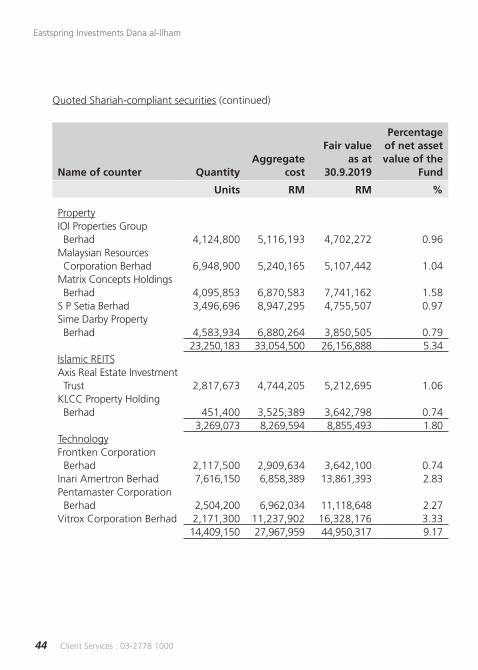
PropertyIOI Properties Group Berhad
4,124,800
5,116,193 4,702,272 0.96
Malaysian Resources Corporation Berhad 6,948,900
5,240,165 5,107,442 1.04
Matrix Concepts Holdings Berhad
4,095,853
6,870,583
7,741,162 1.58
S P Setia Berhad 3,496,696 8,947,295 4,755,507 0.97Sime Darby Property Berhad 4,583,934
6,880,264
3,850,505 0.79
23,250,183 33,054,500 26,156,888 5.34Islamic REITSAxis Real Estate Investment Trust 2,817,673
4,744,205 5,212,695 1.06
KLCC Property Holding Berhad 451,400 3,525,389
3,642,798 0.74
3,269,073 8,269,594 8,855,493 1.80TechnologyFrontken Corporation Berhad
2,117,500 2,909,634 3,642,100 0.74
Inari Amertron Berhad 7,616,150 6,858,389 13,861,393 2.83Pentamaster Corporation Berhad 2,504,200
6,962,034 11,118,648 2.27
Vitrox Corporation Berhad 2,171,300 11,237,902 16,328,176 3.3314,409,150 27,967,959 44,950,317 9.17
Client Services : 03-2778 100044
Eastspring Investments Dana al-Ilham

Quoted Shariah-compliant securities (continued)
Name of counter QuantityAggregate
cost
Fair value as at
30.9.2019
Percentage of net asset value of the
Fund
Units RM RM %
Telecommunications & MediaAxiata Group Berhad 1,730,849 7,449,980 7,442,650 1.52 Digi.Com Berhad 1,103,500 5,012,813 5,241,625 1.07 Telekom Malaysia Berhad 2,198,800 7,388,699 7,915,680 1.61TIME dotCom Berhad 1,867,100 15,534,470 17,046,623 3.48
6,900,249 35,385,962 37,646,578 7.68UtilitiesGas Malaysia Berhad 2,078,400 5,291,179 5,923,440 1.21Petronas Gas Berhad 303,200 5,132,263 4,966,415 1.01Tenaga Nasional Berhad 3,128,700 42,982,860 42,675,468 8.70
5,510,300 53,406,302 53,565,323 10.92
TOTAL QUOTED SHARIAH-COMPLIANT SECURITIES 141,586,665 405,934,849 450,823,576 91.95
ACCUMULATED UNREALISED GAIN OF FINANCIAL ASSETS AT FAIR VALUE THROUGH PROFIT OR LOSS 44,888,727
FAIR VALUE OF FINANCIAL ASSETS AT FAIR VALUE THROUGH PROFIT OR LOSS 450,823,576
45Client Services : 03-2778 1000
Interim Report

Quoted Shariah-compliant securities
Name of counter QuantityAggregate
cost
Fair value as at
30.9.2018
Percentage of net asset value of the
Fund
Units RM RM %
ConstructionAdvancecon Holdings Berhad 1,211,600 1,299,287 484,640 0.09Econpile Holdings Berhad 6,668,950 5,886,326 5,335,160 1.02Econpile Holdings Berhad - Warrant 1,405,150 - 210,773 0.04Gabungan AQRS Berhad 4,210,500 7,212,080 4,673,655 0.90Gabungan AQRS Berhad - Warrant 1,052,625 - - -Gamuda Berhad 1,558,700 6,762,850 5,237,232 1.01Malaysian Resources Corporation Berhad 7,193,600 5,547,839 5,179,392 0.99WCT Holdings Berhad 5,227,900 9,448,597 4,652,831 0.89
28,529,025 36,156,979 25,773,683 4.94ConsumerMagni-Tech Industries Berhad 530,000 3,842,500 2,528,100 0.49
Consumer Products & ServicesFraser & Neave Holdings Berhad 278,600 10,017,532 10,508,792 2.02Nestle (Malaysia) Berhad 224,000 18,101,608 32,793,600 6.30Padini Holdings Berhad 1,048,200 5,527,837 6,163,416 1.18
1,550,800 33,646,977 49,465,808 9.50Financial ServicesBIMB Holdings Berhad 2,552,900 10,660,154 9,675,491 1.86Syarikat Takaful Malaysia Berhad 3,372,400 9,043,899 12,815,120 2.46
5,925,300 19,704,053 22,490,611 4.32
Client Services : 03-2778 100046
Eastspring Investments Dana al-Ilham

Quoted Shariah-compliant securities (continued)
Name of counter QuantityAggregate
cost
Fair value as at
30.9.2018
Percentage of net asset value of the
Fund
Units RM RM %
Health CareHartalega Holdings Berhad 2,360,600 6,303,017 15,627,172 3.00Kossan Rubber Industries Berhad 2,777,600 9,280,739 11,915,904 2.29
5,138,200 15,583,756 27,543,076 5.29Industrial Products & ServicesCahya Mata Sarawak Berhad 4,138,200 13,940,068 12,083,544 2.32Denko Industrial Corporation Berhad 1,284,100 1,990,355 2,105,924 0.40DRB-HICOM Berhad 4,196,100 8,931,977 9,105,537 1.75Lotte Chemical Titan Holding Berhad 930,200 4,806,931 4,688,208 0.90Petronas Chemicals Group Berhad 2,693,800 21,767,050 25,213,968 4.84Press Metal Aluminium Holding Berhad 2,200,200 11,153,700 10,692,972 2.05Prestar Resources Berhad 2,399,900 3,390,611 1,775,926 0.34V.S. Industry Berhad 1,503,100 2,599,311 2,600,363 0.50
19,345,600 68,580,003 68,266,442 13.10Infrastructure Project CompanyDigi.Com Berhad 147,700 664,724 711,914 0.14TIME dotCom Berhad 1,867,100 15,534,471 15,478,259 2.97
2,014,800 16,199,195 16,190,173 3.11
47Client Services : 03-2778 1000
Interim Report

Quoted Shariah-compliant securities (continued)
Name of counter QuantityAggregate
cost
Fair value as at
30.9.2018
Percentage of net asset value of the
Fund
Units RM RM %
PlantationIOI Corporation Berhad 2,053,300 9,379,090 9,321,982 1.79Kuala Lumpur Kepong Berhad 195,900 4,392,141 4,889,664 0.94Sime Darby Plantation Berhad 2,644,834 14,707,819 14,017,620 2.69
4,894,034 28,479,050 28,229,266 5.42PropertyMatrix Concepts Holdings Berhad 4,095,853 6,870,583 8,560,333 1.64S P Setia Berhad 1,750,457 5,355,258 4,726,234 0.91Sime Darby Property Berhad 4,524,234 6,820,862 5,338,596 1.02
10,370,544 19,046,703 18,625,163 3.57Islamic REITSAxis Real Estate Investment Trust 2,797,747 4,717,158 4,112,688 0.79
TechnologyInari Amertron Berhad 6,501,650 5,008,319 14,823,762 2.85Pentamaster Corporation Berhad 191,300 450,856 707,810 0.14Vitrox Corporation Berhad 2,171,300 11,237,902 17,370,400 3.33
8,864,250 16,697,077 32,901,972 6.32
Client Services : 03-2778 100048
Eastspring Investments Dana al-Ilham

Quoted Shariah-compliant securities (continued)
Name of counter QuantityAggregate
cost
Fair value as at
30.9.2018
Percentage of net asset value of the
Fund
Units RM RM %
Trading/ServicesAxiata Group Berhad 1,172,849 5,285,297 5,348,191 1.03Bermaz Auto Berhad 4,710,440 6,825,516 9,939,028 1.91Dialog Group Berhad 8,801,200 16,685,828 30,716,188 5.90Gas Malaysia Berhad 2,078,400 5,291,179 6,006,576 1.15HSS Engineers Berhad 23,000 22,080 21,620 -Maxis Berhad 264,000 1,531,049 1,541,760 0.30MMC Corporation Berhad 2,942,100 5,374,055 4,030,677 0.77MY E.G. Services Berhad 3,817,400 5,442,211 6,680,450 1.28Petronas Dagangan Berhad 201,300 5,031,312 5,286,138 1.01Sapura Energy Berhad 8,703,800 5,349,405 3,568,558 0.69Serba Dinamik Holdings Berhad 2,610,400 8,911,375 9,945,624 1.91Sime Darby Berhad 1,118,300 3,009,018 2,918,763 0.56Tenaga Nasional Berhad 2,674,200 37,204,757 41,343,132 7.94
39,117,389 105,963,082 127,346,705 24.45
TOTAL QUOTED SHARIAH-COMPLIANT SECURITIES 129,077,689
368,616,533
423,473,687 81.30
ACCUMULATED UNREALISED GAIN OF FINANCIAL ASSETS AT FAIR VALUE THROUGH PROFIT OR LOSS 54,857,154
FAIR VALUE OF FINANCIAL ASSETS AT FAIR VALUE THROUGH PROFIT OR LOSS 423,473,687
49Client Services : 03-2778 1000
Interim Report

7. CASH AND CASH EQUIVALENTS
2019 2018
RM RM
Bank balance with a licensed bank 129,591 1,700,764Islamic deposit with a licensed financial institution 38,993,151 92,235,010
39,122,742 93,935,774
The effective weighted average rate of return of Islamic deposit with a licensed financial institution per annum as at the date of the statement of financial position are as follows:
2019 2018
% %
Islamic deposit with a licensed financial institution 2.95 3.30
The Islamic deposits have an average maturity of 1 day (2018: 4 days).
8. SHARIAH INFORMATION OF THE FUND
The Shariah Adviser confirmed that the investment portfolio of the Fund is Shariah-compliant, which comprises:
a. Securities listed on Bursa Malaysia Securities Berhad which have been classified as Shariah-compliant by the Shariah Advisory Council of the Securities Commission Malaysia; and
b. Liquid assets in local market which are placed in Shariah-compliant instruments.
Client Services : 03-2778 100050
Eastspring Investments Dana al-Ilham

9. UNITS IN CIRCULATION
2019 2018
No. of units No. of units
At the beginning of the financial period 796,149,447 744,247,856Creation of units arising from applications during the financial period
54,340,206 90,594,916
Cancellation of units during the financial period (93,689,288) (92,001,661) At the end of the financial period 756,800,365 742,841,111
51Client Services : 03-2778 1000
Interim Report
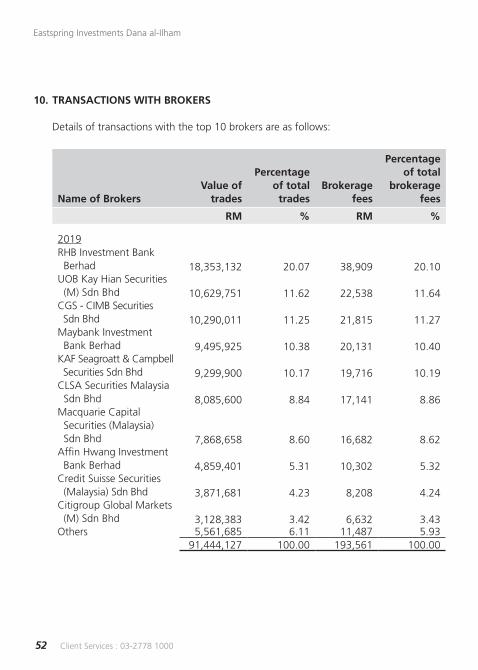
10. TRANSACTIONS WITH BROKERS
Details of transactions with the top 10 brokers are as follows:
Name of BrokersValue of
trades
Percentage of total trades
Brokerage fees
Percentage of total
brokerage fees
RM % RM %
2019RHB Investment Bank Berhad 18,353,132 20.07 38,909 20.10 UOB Kay Hian Securities (M) Sdn Bhd 10,629,751 11.62 22,538 11.64 CGS - CIMB Securities Sdn Bhd 10,290,011 11.25 21,815 11.27 Maybank Investment Bank Berhad 9,495,925 10.38 20,131 10.40 KAF Seagroatt & Campbell Securities Sdn Bhd 9,299,900 10.17 19,716 10.19 CLSA Securities Malaysia Sdn Bhd 8,085,600 8.84 17,141 8.86 Macquarie Capital Securities (Malaysia) Sdn Bhd 7,868,658 8.60 16,682 8.62 Affin Hwang Investment Bank Berhad 4,859,401 5.31 10,302 5.32 Credit Suisse Securities (Malaysia) Sdn Bhd 3,871,681 4.23 8,208 4.24 Citigroup Global Markets (M) Sdn Bhd 3,128,383 3.42 6,632 3.43 Others 5,561,685 6.11 11,487 5.93
91,444,127 100.00 193,561 100.00
Client Services : 03-2778 100052
Eastspring Investments Dana al-Ilham

Name of BrokersValue of
trades
Percentage of total trades
Brokerage fees
Percentage of total
brokerage fees
RM % RM %
2018Maybank Investment Bank Berhad 52,617,966 25.24 128,756 26.25KAF Seagroatt & Campbell Securities Sdn Bhd 28,514,538 13.68 70,665 14.41Affin Hwang Investment Bank Berhad 20,583,414 9.87 43,585 8.89CIMB Investment Bank Berhad 19,922,264 9.55 48,811 9.95UOB Kay Hian Securities (M) Sdn Bhd 17,366,679 8.33 37,611 7.67CLSA Securities Malaysia Sdn Bhd 11,561,810 5.55 28,905 5.89Nomura Securities Malaysia Sdn Bhd 11,408,886 5.47 28,522 5.82Macquarie Capital Securities (Malaysia) Sdn Bhd 10,665,079 5.12 23,899 4.87Hong Leong Investment Bank Berhad 8,226,701 3.95 20,567 4.19Credit Suisse Securities (Malaysia) Sdn Bhd 8,034,171 3.85 18,300 3.73Others 19,600,314 9.39 40,807 8.33
208,501,822 100.00 490,428 100.00
All brokers highlighted above are not related to the Manager.
53Client Services : 03-2778 1000
Interim Report
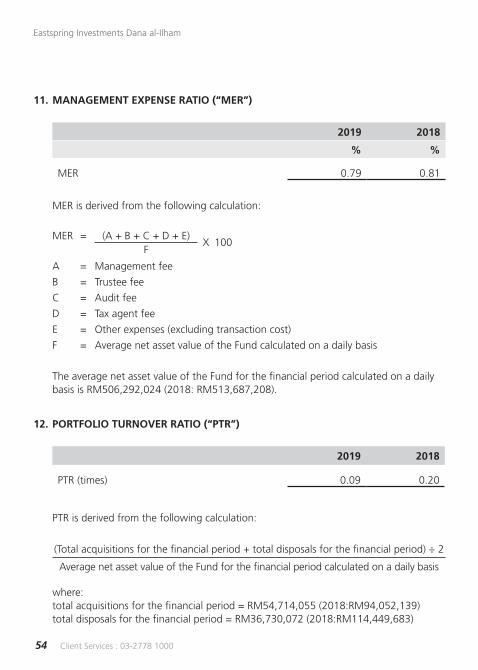
11. MANAGEMENT EXPENSE RATIO (“MER”)
2019 2018
% %
MER 0.79 0.81
MER is derived from the following calculation:
MER = (A + B + C + D + E)X 100
F
A = Management fee
B = Trustee fee
C = Audit fee
D = Tax agent fee
E = Other expenses (excluding transaction cost)
F = Average net asset value of the Fund calculated on a daily basis
The average net asset value of the Fund for the financial period calculated on a daily basis is RM506,292,024 (2018: RM513,687,208).
12. PORTFOLIO TURNOVER RATIO (“PTR”)
2019 2018
PTR (times) 0.09 0.20
PTR is derived from the following calculation:
(Total acquisitions for the financial period + total disposals for the financial period) ÷ 2
Average net asset value of the Fund for the financial period calculated on a daily basis where: total acquisitions for the financial period = RM54,714,055 (2018:RM94,052,139) total disposals for the financial period = RM36,730,072 (2018:RM114,449,683)
Client Services : 03-2778 100054
Eastspring Investments Dana al-Ilham

13. UNITS HELD BY THE MANAGER
The related party of and its relationship with the Fund is as follows:
Related party Relationship
Eastspring Investments Berhad The Manager
2019 2018
No. of units RM No. of units RM
Eastspring Investments Berhad 3,057 1,981 2,910 2,041
The above units were transacted at the prevailing market price.
The units are held legally by the Manager and are within the prescribed limit allowed by SC’s Guidelines on Unit Trust Funds. Other than the above, there were no units held by the Directors or parties related to the Manager.
14. SEGMENTAL INFORMATION
The internal reporting provided to the chief operating decision-maker for the Fund’s assets, liabilities and performance is prepared on a consistent basis with the measurement and recognition principles of MFRS and IFRS. The chief operating decision-maker is responsible for the performance of the Fund and considers the business to have a single operating segment located in Malaysia. Asset allocation decisions are based on a single, integrated investment strategy and the Fund’s performance is evaluated on an overall basis.
The reportable operating segments derive their income by seeking investments to achieve targeted returns consummate with an acceptable level of risk within each portfolio. These returns consist of profit income, dividend income and gains on the appreciation in the value of Shariah-compliant investments.
There were no changes in the reportable operating segments during the financial period.
55Client Services : 03-2778 1000
Interim Report

15. MFRS 9 FINANCIAL INSTRUMENTS
The Fund has adopted MFRS 9, which resulted in changes to the accounting policies and adjustments to the financial position. The main changes are as follows.
Transition
In accordance with the transitional provisions provided in MFRS 9, comparative figures have not been restated. The amendments made by MFRS 9 to MFRS 101 introduced the requirement to present ‘profit income calculated using the effective profit rate’ for financial assets that are measured at amortised cost as a separate line item in the statement of comprehensive income.
As a result, the Fund has reclassified comparative profit income from financial assets measured at FVTPL i.e. Islamic deposits with licensed financial institutions to ‘profit income from financial assets measured at FVTPL’ line for the financial period ended 30 September 2018.
16. APPROVAL OF FINANCIAL STATEMENTS The financial statements have been approved for issue by the Manager on
22 November 2019.
Client Services : 03-2778 100056
Eastspring Investments Dana al-Ilham

57Client Services : 03-2778 1000
Interim Report
CORPORATE DIRECTORY
NAME
EASTSPRING INVESTMENTS BERHAD
COMPANY NO.
200001028634 (531241-U)
REGISTERED OFFICE
Level 25, Menara Hong Leong
No. 6, Jalan Damanlela
Bukit Damansara
50490 Kuala Lumpur
BUSINESS OFFICE
Level 22, Menara Prudential
Persiaran TRX Barat
55188 Tun Razak Exchange
Kuala Lumpur
TELEPHONE NO.
603-2778 3888
FAX NO.
603-2789 7220
WEBSITE
www.eastspring.com/my
TRUSTEENAMEDEUTSCHE TRUSTEES MALAYSIA BERHAD
COMPANY NO.763590-H
REGISTERED OFFICE & BUSINESS OFFICELevel 20, Menara IMCNo. 8, Jalan Sultan Ismail50250 Kuala Lumpur
TELEPHONE NO.603-2053 7522
FAX NO.603-2053 7526
SHARIAH ADVISERNAME
BIMB SECURITIES SDN BHD
COMPANY NO.
290163-X
REGISTERED ADDRESS& BUSINESS ADDRESS
Level 32, Menara Multi Purpose
Capital Square
No. 8, Jalan Munshi Abdullah
50100 Kuala Lumpur
TELEPHONE NO.
603-2613 1600
FAX NO.
603-2613 1799
WEBSITE
www.bimbsec.com.my

Client Services : 03-2778 100058
Eastspring Investments Dana al-Ilham
SALE & PURCHASE OF UNITSEastspring Investments BerhadLevel 22, Menara Prudential
Persiaran TRX Barat
55188 Tun Razak Exchange
Kuala Lumpur
TELEPHONE NO.
603-2778 1000
BRANCHESPetaling JayaEastspring Investments Berhad A-17-P1 & MBlock A, Jaya One72A, Jalan Universiti46200 Petaling Jaya, Selangor
TELEPHONE NO.603-7948 1288
Kota KinabaluEastspring Investments BerhadSuite E3, 9th FloorCPS Tower, Centre Point SabahNo. 1, Jalan Centre Point88000 Kota Kinabalu, Sabah
TELEPHONE NO.6088-238 613
ENQUIRIESCLIENT SERVICES
603-2778 1000

FOR THE SIX MONTHS FINANCIAL PERIOD ENDED 30 SEPTEMBER 2019
INTERIM REPORT
EASTSPRING INVESTMENTSDANA AL-ILHAM
Eastspring Investments Berhad 200001028634 (531241-U)
Level 22, Menara Prudential, Persiaran TRX Barat55188 Tun Razak Exchange, Kuala LumpurT: (603) 2778 3888 F: (603) 2789 7220eastspring.com/my
Client ServicesT: (603) 2778 1000 [email protected]