eastside fire & rescue 2017 budget
TRANSCRIPT

Page 1 of 56
EASTSIDE FIRE & RESCUE
2017 BUDGET
October 13, 2016

Page 2 of 56
TABLE OF CONTENTS LETTER OF TRANSMITTAL Summary of Adopted Changes/Fire Chief’s Message 3 INTRODUCTORY
Mission Statement and Values 5 Strategic Priorities 6 Organizational Chart 7 Board of Directors 8 Executive Staff 9 Budget Policies/Procedures 10 Budget Calendar 19
BUDGET OVERVIEW (Summary) Operating Fund 20 Equipment Replacement Fund 25 Capital Facilities Maintenance Fund 26 BUDGET BY DEPARTMENT/DIVISION/TEAM (Detail)
Administration Department 31 Administrative 32 Pre-Fire & Mapping 33 Information Technology 34 Facilities 35 Shop 36
Operations Department 38 Suppression 39 Technical Rescue Team 40 Wildland Team 41 HazMat Team 42 SCBA 43 Uniforms 44
Training & Safety Department 45 Training 47 Fire Prevention 48 Disaster Preparedness 49 Wellness Program 50 Public Education 51 Chaplains 52
Exhibit A Funding Model 53

Page 3 of 56
EASTSIDE FIRE & RESCUE
To: Board of Directors From: Jeff Clark, Fire Chief Date: October 13, 2016 Subject: 2017 Revenue and Expense Budget I am pleased to present the Agency’s 2017 Revenue and Expense budget. This budget represents our ongoing effort to maintain a high quality of services for the citizens we serve. Operating Budget The Operating budget reflects an overall increase of 4.21% in operating expenses from the 2016 budget. The increase to the 2017 budget is due, in large part, to a 2.0% increase in salaries, increases relating to the CBA and a 6.5% increase in healthcare expenses. The non-partner revenue reflects an increase of 9.37%. The increase to the partners’ operating contributions is 5.9%. Pages 10 through 14 summarize the operating revenue, operating expenses and the overall impact on the operating fund’s 2016 ending fund balance. This budget allows the Agency to maintain its current level of services. Equipment Replacement Fund Budget The Fund is used for the purchase of replacement apparatus, vehicles, and equipment. The fund provides a pooling of funds to replace existing equipment. The agency will maintain a rolling 15 year forecast of revenue versus expenses to ensure a positive fund balance is maintained. See page 15 for a breakdown of the 2017 budgeted Equipment Replacement Fund revenues and expenses.
Page 4 of 56
Capital Facilities Maintenance Fund The fund serves to provide funding for maintenance projects for the fire stations and Headquarters. The maintenance projects are projected out over 20 years, which allows for a smooth funding level from all parties. As with the Equipment Replacement Fund, while the revenues will maintain a smooth and steady funding level, the expenses will increase or decrease from year to year. See page 16 for a breakdown of the 2017 budgeted Capital Facilities Maintenance Fund revenues and expenses. Summary The total revenue budget for all funds is an increase of 4.78% compared to 2016 while the total expense budget for all funds is an increase of 11.24%. Overall effect to all of the partners as a whole for all of the funds is an increase of 4.21% compared to 2016. Since 2012, the total contributions required from all parties have increased an average of 3.59%, while the Agency’s total budget has increased an average of 3.57%. The Agency’s continued focus is to provide the highest level of service while keeping costs as low as possible. I would like to thank all members of the department that contributed to the preparation of the 2017 Revenue and Expense Budget.

Page 5 of 56
EASTSIDE FIRE & RESCUE
Mission Statement
Excellence in Service Dedication to Community
Values
Compassionate Providing empathetic service that advocates for the Communities we serve in a way that
demonstrates “We Care”.
Innovative Taking responsible risks to develop creative ideas that drive change.
Trustworthy
Demonstrating integrity, strength and ability to do the right thing.
Expertise Maintaining our knowledge, skills and abilities to ensure the highest level of service is
provided.
Professionalism Professional pride, adhering to a strong code of moral and ethical conduct in appearance,
attitude and standards.
Wicked Goal
UNIFIED COMMITMENT
Achieve a high performing organization status through a unified commitment by all members and internal stakeholders of EF&R. Unified Commitment is achieved when we all feel as though we belong to the team, we are unified in our commitment to the mission and goals of EF&R, we will strive to experience excitement and enthusiasm about our work, will look forward to working with each other to ensure EF&R is successful. In so doing, we recognize barriers exist, which must be taken down to achieve a unified commitment. Partners must unify and fully commit to EF&R, assets must be planned and utilized across all partners, labor and management must unite behind what is good for the whole and not personal benefit or preference, volunteers and career firefighters must bridge any divide, and preparation of the organization for operational regionalization must occur. Our focus is on what brings us together.

Page 6 of 56
EASTSIDE FIRE & RESCUE
Strategic Priorities
Strategic Priority: Employee Development Invest, support, and empower all personnel to realize their potential.
Strategic Priority: Life Safety Provide for life safety, the protection of property, and the environment.
Strategic Priority: Long-Term Sustainability Be a sustainable, adaptive, and innovative fire department.
Strategic Priority: Community Outreach and Partnerships Advance partnerships that educate and strengthen relationships.
Strategic Priority: Board of Director Development Be a high performing unified Board.
Page 7 of 56
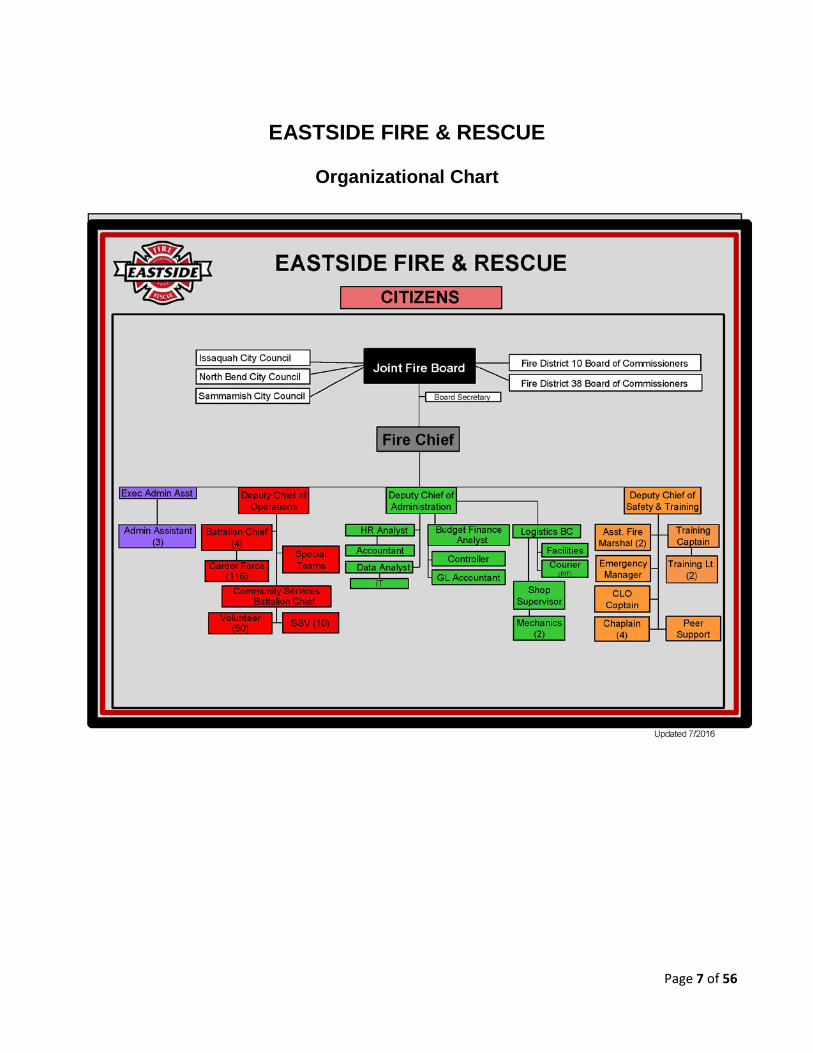
EASTSIDE FIRE & RESCUE
Organizational Chart
Page 8 of 56
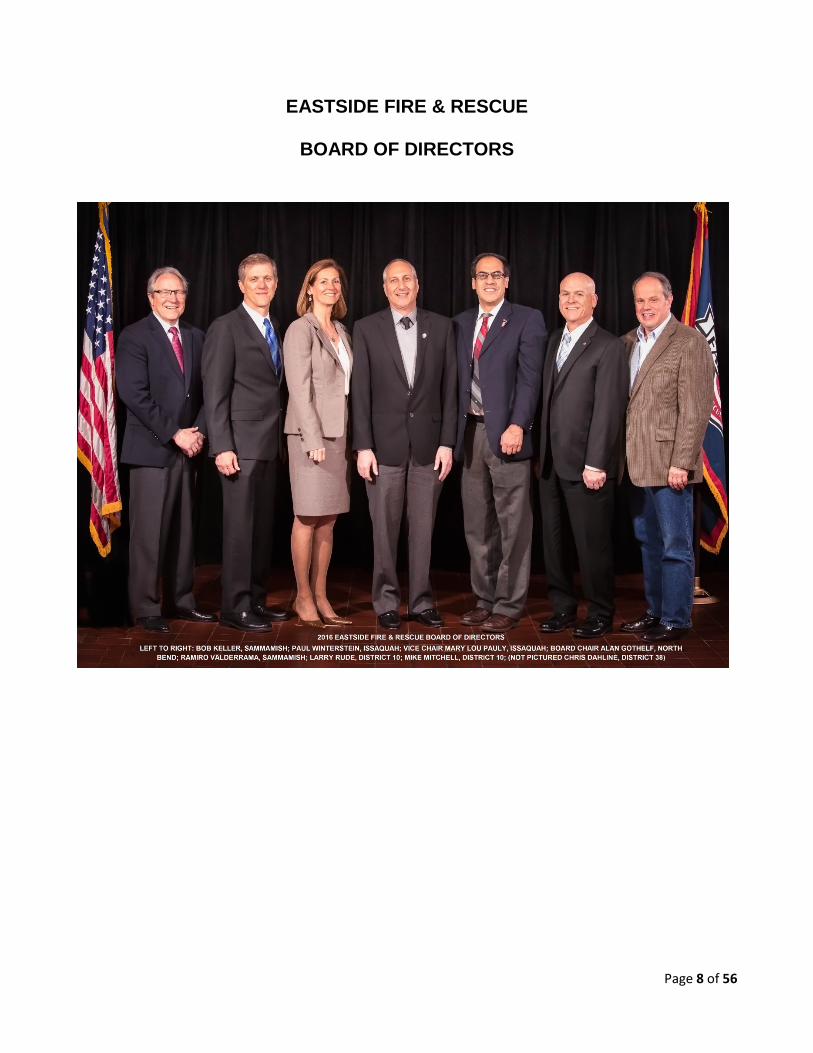
EASTSIDE FIRE & RESCUE
BOARD OF DIRECTORS
Page 9 of 56
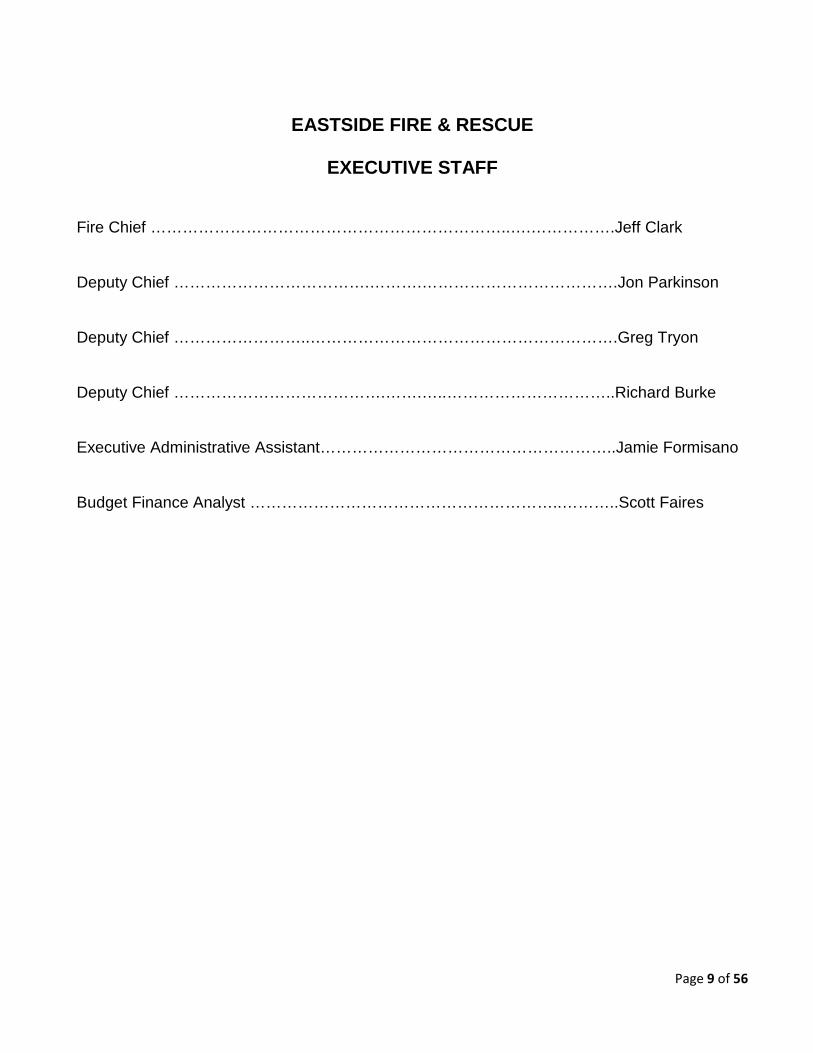
EASTSIDE FIRE & RESCUE
EXECUTIVE STAFF
Fire Chief …………………………………………………………..….…………….Jeff Clark Deputy Chief ……………………………….……….……………………………….Jon Parkinson Deputy Chief ……………………..………………………………………………….Greg Tryon Deputy Chief ………………………………….…….…..…………………………..Richard Burke Executive Administrative Assistant………………………………………………..Jamie Formisano Budget Finance Analyst …………………………………………………..………..Scott Faires
Page 10 of 56
EASTSIDE FIRE & RESCUE
Budget Policy/Procedure 1. Purpose
1.1 To provide guidance and clarification on how the budget will be structured and developed, define the budget control system, how to amend the budget and specific revenue and expenditure principles to ensure ongoing financial sustainability and operating practices.
1.2 This policy ensures the Agency remains a financially stable organization by maintaining appropriate reserves which position EF&R to effectively plan for cash funded needs, as well as unplanned needs caused by significant economic downturns, manage the consequences of outside agency actions that may result in revenue reductions, and address unexpected emergencies, such as natural disasters, catastrophic events caused by human activity, or excessive liabilities or legal judgments against the organization.
2. Reference
2.1 EF&R ILA
2.2 EF&R Operating Budget
2.3 EF&R Capital Facility Maintenance Fund
2.4 EF&R Equipment Replacement Fund 3. Responsibility
3.1 Eastside Fire & Rescue Board of Directors (Board) and the Fire Chief (Chief)
4. Policy
4.1 General
4.1.1 Scope and Length of Budget Period: The budget shall be based on a fiscal year beginning January 1 through December 31, and revenue and expenditures for all funds shall be adopted annually.
4.1.2 Beginning January 1, 2019 EF&R shall begin a two year budget cycle.
4.1.3 Budget Process: The Chief shall annually prepare a balanced budget showing all planned expenses and identifying all revenues to fund the planned expenses.

Page 11 of 56
4.1.4 Budget Adoption: The annual budget shall be adopted, via agenda bill, by the Agency’s Board on or before December 31 of each year.
Due to participation requirements with NORCOM (dispatch services), EF&R’s budget as it pertains to NORCOM’s funding needs, must be approved prior to December 1.
4.1.5 Level of Control: Budgetary control shall be at the Chief level. The Agency cannot spend more than the budget appropriated; however, the Chief has the authority to move funds between line items as long as the overall annual appropriation is not exceeded.
2. Definitions 5.1 Operating Fund: The Operating Fund budget is adopted at the Fund level, meaning the Chief has authority to move funds between line items and shall have a minimum reserve of 10% of budgeted expenses to maintain operations (ILA Exhibit A). 5.2 Facility Maintenance and Repair Fund: The Facility Maintenance and Repair Fund budget is adopted at the Fund level and provides a pooling of dollars for maintenance and repair for fire stations and headquarters. The Chief has authority to move funds between projects and Administration manages the maintenance and repair schedule (ILA Exhibit C).
5.3 Equipment Replacement Fund: The Equipment Replacement Fund budget is adopted at the Equipment level, meaning equipment funded has its own budget authorization that cannot be exceeded without prior approval of the Board. Equipment Replacement Fund (ILA Exhibit B) provides a pooling of funds to replace existing equipment. The scheduled replacement of existing equipment is approved by the Board annually. The agency will maintain a rolling 15 year forecast of revenue versus expenses to ensure a positive fund balance is maintained.
5.4 Capital Assets: A capital asset is a tangible or intangible asset having an expected life of more than one year and costing more than $10,000. The Agency will establish and maintain a capital asset system and conduct or oversee an annual inventory of machinery, equipment, and software. The Chief has the authority to dispose of/surplus non-titled capital assets. Titled assets (e.g. fire engine) declared surplus will be reported, and approved, by the partner listed on the title. Replacement assets will be titled in the name of the appropriate partner. All capital assets will be tagged with a uniquely numbered Agency asset tag identifying the asset as belonging to EF&R.
Page 12 of 56
5.5 Liability Reserve Fund: It shall be the policy of the Board that a segregated fund, referred to as the “Liability Reserve Fund” be established. The Fund shall maintain a minimum annual balance of 20% of long-term liabilities (cash value of vacation liability banks (100%), sick leave banks (25%), and retirement eligible employee replacement cost).
5.6 Balanced Budget: The total of proposed expenditures shall not exceed the total of estimated income and fund balances available. Each fund in the budget must also be in balance; total anticipated revenues plus the necessary portion of fund balance (all resources) must equal total expenditure appropriations for the upcoming fiscal year. Appropriation shall be for a specific fund and balanced based on specific funding sources, therefore savings in one fund shall not be used to cover over- expenditure in another fund.
5.7 Basis of Budgeting: The accounting system is maintained on the same basis as the Adopted Budget. This enables budgets to be easily monitored via accounting system reports on a monthly basis. The budget is prepared on the cash basis, where revenues are recorded when received and expenses are recorded when paid. The Agency will maintain its accounting records in accordance with state and federal laws and regulations. Budgetary reporting will be in accordance with Washington State budget laws and regulations. The Agency will annually report its financial condition and results of operations in accordance with state regulations and on the cash basis as prescribed by the State Auditor’s Office by the last day of May of each year.
The Finance Division will prepare such management reports and other internal reports as determined by the Chief. The Finance Division will also prepare regular budget to actual status reports to keep the Board informed throughout the year.
5.8 Long-Term Financial Forecasts: A rolling five-year forecast of revenues and expenses which provide a mid-range indication of the Agency’s financial trends and provides context for the preparation of the annual budget shall be maintained. The five-year forecast should assume continuation of current service levels, including known changes that will occur during the forecast period.
5.9 Performance Measurement: The Agency will establish goals and objectives and create and track performance measurements to assure the goals and objectives are achieved in an efficient and effective manner.
5.10 Budget Links to Strategic Financial Plans: The annual budget will be developed in accordance with the policies and priorities set forth in the Board approved Strategic Plan, the needs of the community, and local, federal and state laws.
Page 13 of 56
5.11 Examination of Spending Patterns: The Agency will seek to maximize the value the public receives through its spending by critically examining existing spending patterns to ensure they continue to provide value, and if not, reallocate to services that do.
5.12 Prioritizing Services: The Agency will prioritize services based on the Board’s long-term desired results. Additions to the Agency budget outside the annual budget process are discouraged and only approved by the Chief’s office in unique circumstances or by the Board when required. All decision package requests will be considered based on available Agency resources and within projected fiscal constraints. All requests must be fully justified to show that they will maintain or enhance service delivery or support new programs.
5.13 Emergency Spending Authority (Financial & Operational): In the event of an operational emergency (e.g. natural disaster, local wildland interface), the Chief shall have emergency spending authority to utilize monies from all available funds and reserves to ensure the continuation of emergency service delivery. The Chief will notify the Board Chair of the expenditures made during the course of the emergency as soon as possible. Each partner will ensure that funds are pre-designated and immediately available to EF&R in the event of an operational emergency. Following an Emergency Declaration from the Chief each partner shall make immediately available their “designated” fire emergency reserve funds. Emergencies that elevate to a King County and/or State Declaration of Emergency will be documented in a manner consistent with FEMA reimbursement policies.
5.13.1 In the event of a financial emergency (e.g. large number of unplanned retirements), the Chief shall notify the Board Chair of the impact to the Agency and service delivery concerns. Once the Chief recognizes that a financial emergency is going to exceed internal budget and contingencies he/she will notify each partner in writing. Upon receipt of the notification of the financial emergency the partner will place an agenda item on their next governing board agenda for approval to fund their proportional share (as described in the ILA) of the financial emergency.
5.13.2 Partners that receive reimbursement directly related to a declared disaster shall reimburse EF&R the allotted portion of costs associated with EF&R services (i.e. FEMA reimbursement/State Mobilization).
5.14 Funding Liabilities: The current portion of long-term liabilities (i.e. capital infrastructure, annual costs of maintaining and replacing capital assets,
Page 14 of 56
contributions to employee pensions and negotiated benefits), at a minimum, should be funded in the annual budget.
5.15 Contract Impacts: While negotiating and evaluating contracts the Chief shall consider the total budgetary impact of each contract. Once approved by the Chief, or Board when required, all impacts of the contract will be included in the base budget of the agency (i.e. Salary increases contained within a CBA will result in a line item increase in appropriate overtime lines; Standard fee increases for Information Technology service contracts will be included in base budget for the appropriate year).
5.16 Budget Process: The budget will be developed following a detailed calendar to ensure timely preparation and execution, provide opportunities for citizen participation, follow State law, the EF&R ILA, and be summarized within a budget document to clearly communicate policy decisions.
5.17 Audit: The Agency’s financial statements will be audited regularly by the Washington State Auditor’s Office on a schedule determined by that office as is required by State law. The results of such audits will be communicated to the Chief and to the Board.
3. Budget Control System 6.1 Modified Expenditure Control Budgeting (MECB): MECB will be utilized in order to encourage cost effectiveness while providing quality services to Eastside citizens. MECB assumes existing service levels will be maintained and new or enhanced programs require an ongoing source of funding before initiation. The use of MECB supports the following basic philosophies:
a. The Chief is expected to manage wisely and to look for effective and efficient ways to deliver quality services while meeting the goals of the Board; and b. The Chief can find ways to do things more efficiently if given the freedom to innovate and control Agency resources.
6.2 Base Budget Method: The base budget method will be utilized for ongoing Operations and Maintenance (O&M) appropriation. The Agency shall be allocated the prior year's base budget plus contractually obligated increases and impacts to support all ongoing operations, but may request supplemental funding through a decision package process. Requests approved in the Adopted Budget shall be incorporated into the Agency’s base budget. The Chief is responsible for developing expenditure line item budgets. Designated Funds can only be spent for the specified purpose
Page 15 of 56
(Equipment Replacement, Capital Facility Maintenance Fund and Liability Reserve Fund, etc.). 6.2.1 Under the MECB philosophy, the Chief may request to carryforward savings achieved in Base Budget operating accounts to the next year, with justification to the Board. 6.2.2 The Agency will use an Encumbrance Accounting System whereby budgeted funds are committed and no longer available for spending when a purchase order is approved in the financial system. 6.3 Personnel Services Budgeting: Total costs of compensation (full funding) for all personnel must be funded. If revenues are available during the budget process, positions may be added to maintain or enhance service levels following a recommendation from the Chief and Board approval. Professional service additions outside of the budget process are discouraged and only approved by the Chief’s Office in unique circumstances or by the Board when required. 6.4 Budget Resolution Authority: The Adopted Budget Resolution for each fiscal year gives authority to the Chief to allocate, appropriate and expend the budget as approved within the parameters described in this policy. 6.5 Budget Expenditure Limitation: EF&R adopts its expenditure limitation along with the annual budget. The maximum expenditure limit is the total of all identified appropriations in the final budget adopted by the Board. 6.6 Budget Amendments: Total expenditures may not exceed the final appropriation once the budget is adopted. The Board can amend the total appropriation for an individual fund; however, if one fund’s total appropriation is increased, another fund must be decreased by an equal amount or new revenue must be identified by the Chief and approved by the Board. Amendments moving budget appropriation between Funds may be processed at any time during the fiscal year upon written request by the Chief to the Board for approval. 6.7 Revenue and Expenditure Principles: One-time expenses will be funded from one-time balances/revenues and ongoing expenses will be funded by ongoing revenues, except as is provided for by the budget stabilization reserve. Fund balances are non-recurring revenue, and will be appropriately used for one-time expenditures or budgeted as contingency fund appropriations. 6.8 Revenues: Revenue projections will be based on historical trends by developing base lines for ongoing types of revenues versus one-time. Projections used to balance revenues to expenditures will be prepared for

Page 16 of 56
a five period and updated annually to ensure financial sustainability. Conservative but realistic revenue projections will be prepared to assess the limits of budget appropriation using trend analysis and current data to minimize estimating too high, which could result in mid-fiscal year budget issues. 6.9 Expenditures: The Agency will commit to a level of expenditures sufficient to ensure the ongoing health, safety, and welfare of citizens. The Chief is encouraged to periodically review operations for efficiencies and reallocate existing expenditure appropriation before requesting new funding. Personnel expenditures, the largest operating cost, will be appropriated based on full funding of all approved positions. 6.9.1 Employee benefits expenditures (i.e. pensions, health, and worker’s compensation) will be appropriated at levels to ensure adequate funding to remain current and maintain appropriate reserves. Compensation packages will be reviewed periodically to ensure they are sufficient to attract and retain quality employees.
7. RESERVES 7.1 This policy documents the Agency’s approach to establishing and maintaining adequate reserves (target levels) based on consideration of risks to operations. The budgetary fund balance represents the one-time amount accumulated from prior years, which is different than the fund balance under Generally Accepted Accounting Principles (GAAP), but includes the same constraints on spending.
7.2 Governmental Accounting Standards Board (GASB) Statement No. 54 defines five reserve classifications of fund balance based on the level of restrictions placed on the specific purposes for which amounts can be spent: non- spendable fund balance, restricted fund balance, committed fund balance, assigned fund balance, and unassigned fund balance. The last three classifications are termed Unrestricted Fund Balance since the constraint on spending is imposed by the government itself, therefore subject to this reserve policy. Additionally, contingencies and reserves can be appropriated and unappropriated, depending if the Agency would like the reserve to be available for spending in the current budget year or not.
7.3 Operating Fund Reserve Policy: The Operating Fund is the main fund that pays for general services provided by the Agency. The Operating Fund accounts for all general revenues of the Agency and for expenditures related to the rendering of the Agency’s core services. The Operating Fund is considered to have a high level of risk to operations due to its dependence on revenue streams that are susceptible to economic downturns and revenue reduction impacts from outside agency actions. In

Page 17 of 56
addition, the Operating Fund is the main funding source when responding to unexpected events or emergencies. 7.3.1 Consideration of potential risk and other drivers influence the targeted minimum level of total Unrestricted Fund Balance that should be maintained. The Government Finance Officers Association (GFOA) recommends no less than two months of Operating Fund Unrestricted Budgetary Fund Balance. The Agency desires to maintain a prudent level of reserves based on the revenue impacts described above. This reserve policy sets the targeted minimum level at 10% of budgeted Operating Fund revenues. 7.4 Operating Fund Contingency / Appropriated / Unassigned: This Contingency will be maintained equal to 10% of Operating Fund revenues. Acceptable contingency reserve uses are emergency situations, unexpected one-time opportunities, and appropriation transfers to allow spending in other funds. Use of this reserve requires Board approval unless delegated in the annual Budget Resolution. The 10% Operating Fund Contingency reserve must be replenished annually.
The agency will grow the contingency to 10% utilizing end fund balance (After funding 20% of Liability Reserve Fund). Once the 10% is attained, through the use of end fund balance, it will be maintained at 10% annually.
7.5 Budget Stabilization Reserve / Not Appropriated / Assigned: This reserve may be created to offset operating deficits that result from economic downturns and revenue reduction impacts from outside agency actions that can create adverse service impacts, allowing time to reduce spending and/or find other ongoing revenue opportunities. The Board of Director’s may add to the reserve from time to time but not draw from it for more than three consecutive fiscal years. 7.6 Capital Reserves / Appropriated and/or Not Appropriated / Assigned: These reserves may be created to fund planned new and redevelopment capital projects and capital maintenance projects to sustain existing Agency infrastructure. 7.7 Personnel and Operating Reserves / Appropriated and/or Not Appropriated / Assigned: These reserves may be created to fund specific operating expenditure areas that are susceptible to economic fluctuations and to fund personnel costs that can be reasonably estimated and are short-term in nature.
7.7.1 Liability Reserve Fund: It shall be the policy of the Board that a segregated fund, referred to as the “Liability Reserve Fund” be created and shall be used for the following purposes;
Page 18 of 56
a. Vacation Leave Balance b. Sick Leave Balance c. Employee Retirement / Vacancy Replacement costs
7.7.2 The Chief shall be authorized to utilize “Liability” Funds for the purposes identified in Section 7.7.1.
7.7.3 The Chief shall report to the Board, on a monthly basis, the use of any Liability Reserve Fund dollars.
7.7.4 The fund shall be funded annually to meet at least 20% of employee leave bank liabilities based on annual assessment. The primary sources of revenue shall be as follows;
a. Snoqualmie Tribe contract revenues b. End Fund Balance c. Partner Contributions (if needed)
7.8 Other Fund Reserve Policies: In the future other funds can be identified as needing reserves. To establish future reserve funds the Chief must recommend and receive Board approval.
Page 19 of 56
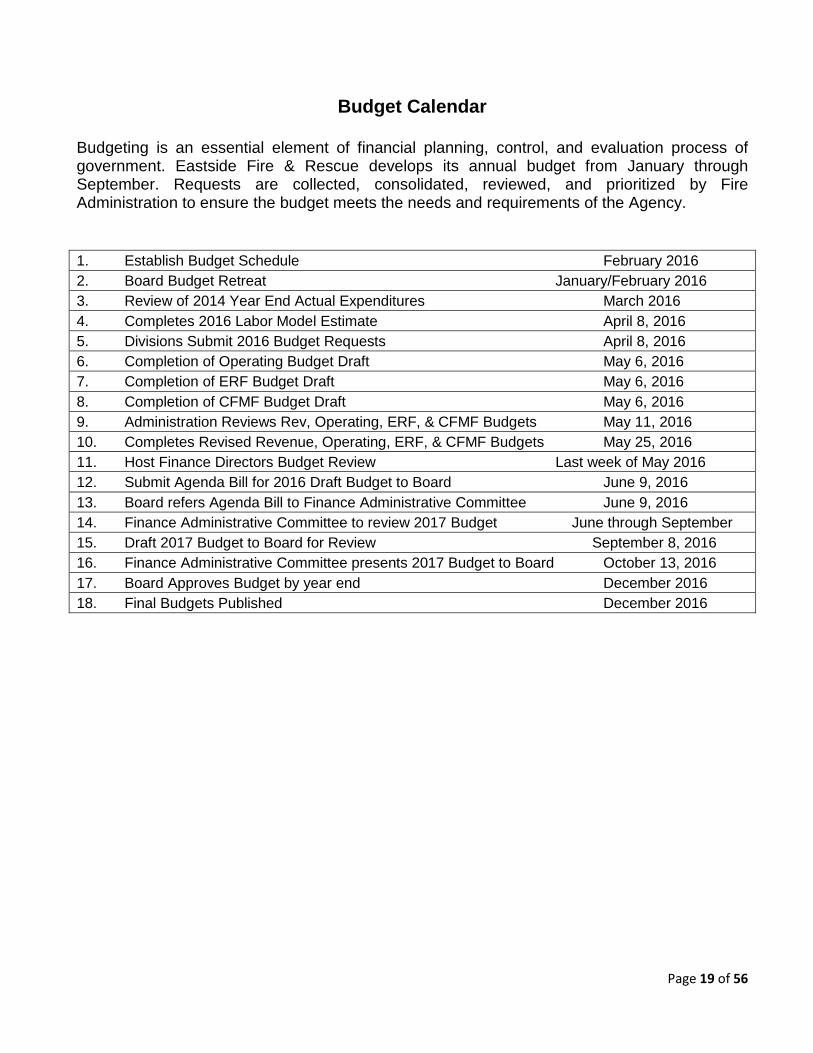
Budget Calendar
Budgeting is an essential element of financial planning, control, and evaluation process of government. Eastside Fire & Rescue develops its annual budget from January through September. Requests are collected, consolidated, reviewed, and prioritized by Fire Administration to ensure the budget meets the needs and requirements of the Agency.
1. Establish Budget Schedule February 2016 2. Board Budget Retreat January/February 2016 3. Review of 2014 Year End Actual Expenditures March 2016 4. Completes 2016 Labor Model Estimate April 8, 2016 5. Divisions Submit 2016 Budget Requests April 8, 2016 6. Completion of Operating Budget Draft May 6, 2016 7. Completion of ERF Budget Draft May 6, 2016 8. Completion of CFMF Budget Draft May 6, 2016 9. Administration Reviews Rev, Operating, ERF, & CFMF Budgets May 11, 2016 10. Completes Revised Revenue, Operating, ERF, & CFMF Budgets May 25, 2016 11. Host Finance Directors Budget Review Last week of May 2016 12. Submit Agenda Bill for 2016 Draft Budget to Board June 9, 2016 13. Board refers Agenda Bill to Finance Administrative Committee June 9, 2016 14. Finance Administrative Committee to review 2017 Budget June through September 15. Draft 2017 Budget to Board for Review September 8, 2016 16. Finance Administrative Committee presents 2017 Budget to Board October 13, 2016 17. Board Approves Budget by year end December 2016 18. Final Budgets Published December 2016
Page 20 of 56
Eastside Fire & Rescue
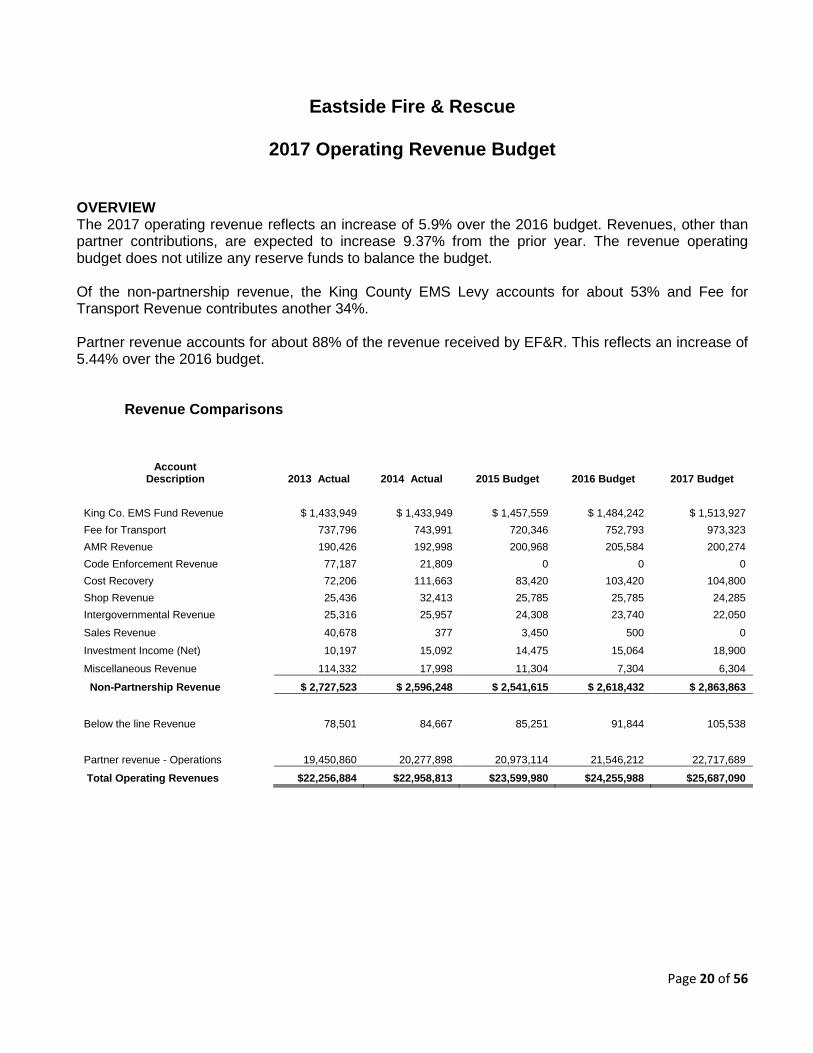
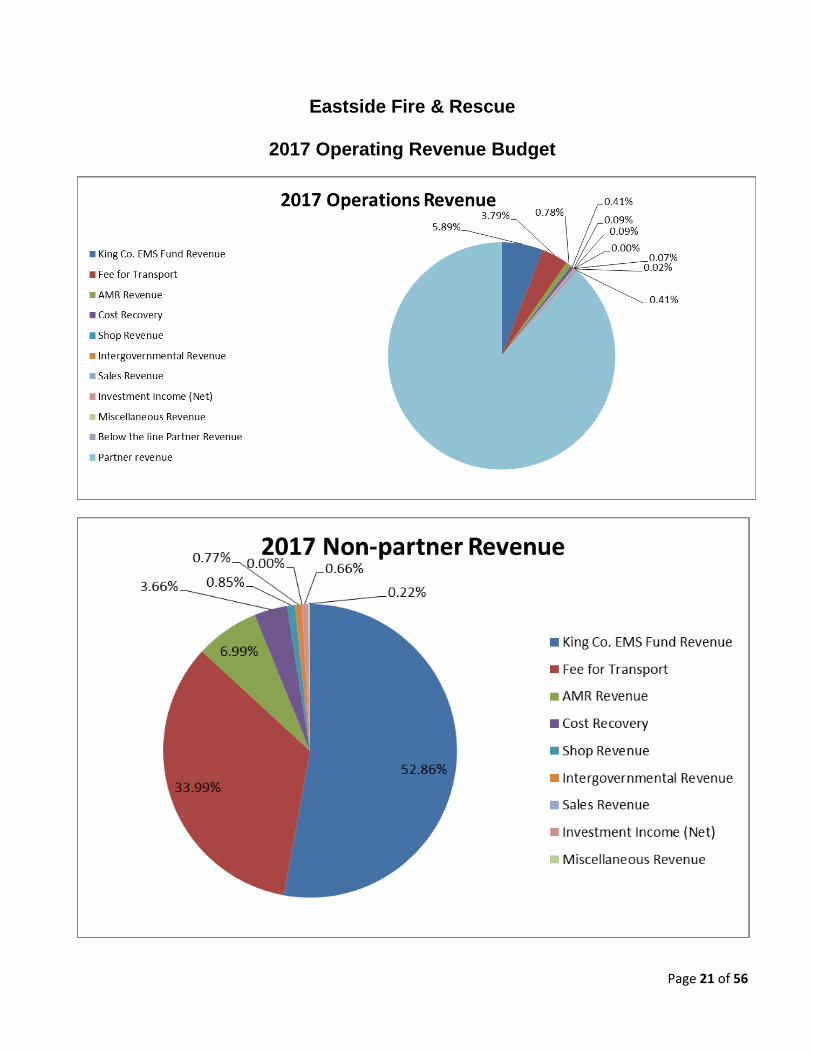
2017 Operating Revenue Budget OVERVIEW The 2017 operating revenue reflects an increase of 5.9% over the 2016 budget. Revenues, other than partner contributions, are expected to increase 9.37% from the prior year. The revenue operating budget does not utilize any reserve funds to balance the budget. Of the non-partnership revenue, the King County EMS Levy accounts for about 53% and Fee for Transport Revenue contributes another 34%. Partner revenue accounts for about 88% of the revenue received by EF&R. This reflects an increase of 5.44% over the 2016 budget.
Revenue Comparisons
Account Description 2013 Actual 2014 Actual 2015 Budget 2016 Budget 2017 Budget
King Co. EMS Fund Revenue $ 1,433,949 $ 1,433,949 $ 1,457,559 $ 1,484,242 $ 1,513,927 Fee for Transport 737,796 743,991 720,346 752,793 973,323 AMR Revenue 190,426 192,998 200,968 205,584 200,274 Code Enforcement Revenue 77,187 21,809 0 0 0 Cost Recovery 72,206 111,663 83,420 103,420 104,800 Shop Revenue 25,436 32,413 25,785 25,785 24,285 Intergovernmental Revenue 25,316 25,957 24,308 23,740 22,050
Sales Revenue 40,678 377 3,450 500 0
Investment Income (Net) 10,197 15,092 14,475 15,064 18,900
Miscellaneous Revenue 114,332 17,998 11,304 7,304 6,304
Non-Partnership Revenue $ 2,727,523 $ 2,596,248 $ 2,541,615 $ 2,618,432 $ 2,863,863
Below the line Revenue 78,501 84,667 85,251 91,844 105,538
Partner revenue - Operations 19,450,860 20,277,898 20,973,114 21,546,212 22,717,689
Total Operating Revenues $22,256,884 $22,958,813 $23,599,980 $24,255,988 $25,687,090
Page 21 of 56
Eastside Fire & Rescue
2017 Operating Revenue Budget

Page 22 of 56
Eastside Fire & Rescue
2017 Operation Ending Fund Balance
2013 2014 2015
2016 – Projected *
Available Ending Fund Balance 2,323,854 2,384,365 2,309,365 2,457,365
2,223,816 2,337,433 2,370,151 2,425,590 10% of Expense Budget
100,038 46,932 (60,786) 31,766 Projected available reserves
* Assumes 100% of the operating budget will be spent in 2016
Per Board policy, minimum ending fund balance is 10% of total operating expenses.

Page 23 of 56
Eastside Fire & Rescue
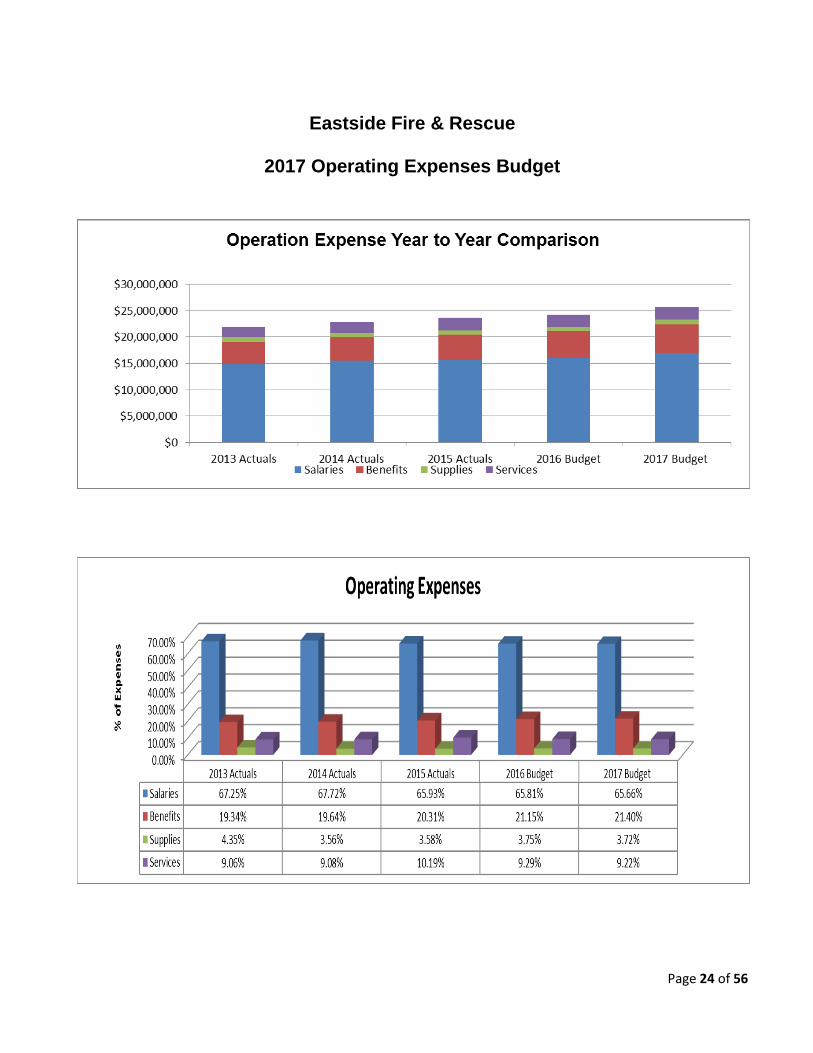
2017 Operating Expenses Budget OVERVIEW The 2017 operating expense budget reflects a 5.9% increase over the 2016 budget. The budget allows for maintaining the current level of services and staffing levels while addressing various needs of the Agency. Expense Comparisons
Title 2013 Actual 2014 Actual 2015 Actual 2016 Budget 2017 Budget Salary $ 13,654,260 $13,896,812 $ 14,080,630 $14,564,732 $15,653,184 Overtime 955,446 1,064,175 1,059,749 1,038,574 1,012,444
Leave/Early out 168,335 409,229 484,927 360,065 201,365
Total Salary 14,778,041 15,370,216 15,625,306 16,963,371 16,866,993
Medical/Insurance/taxes 3,447,077 3,660,300 3,930,662 4,233,083 4,518,762 Employee Assistance Program 5,711 6,100 5,935 6,161 5,962 Pension Expense 797,946 829,368 876,862 890,276 973,013
Total Benefits 4,250,734 4,495,768 4,813,459 5,129,520 5,497,737
Office and Operating Supplies 522,001 409,631 430,574 451,200 447,325
Fuel Expense 163,974 158,277 119,024 172,000 162,000 Small Tools & Equip 269,260 246,534 297,754 287,160 345,817
Total Supplies 955,234 814,443 847,352 910,360 955,142 Professional Services 486,301 501,347 603,152 499,950 582,250 Communications 733,155 801,021 897,280 938,407 878,871
Education & Training 88,392 102,042 113,369 120,290 158,835 Equip Rent & Lease Expense 51,577 44,947 39,158 33,340 43,413
Insurance Liability E&O 155,996 168,483 170,148 175,000 185,000 Utilities 207,766 213,258 215,768 240,000 240,000 Maintenance & Repair Expense 250,735 219,146 294,468 235,500 266,000 Miscellaneous 9,982 28,780 15,990 10,250 12,850 Cap. Outlay Mach. & Equip. 7,610 0 65,980 0 0 Total Services 1,991,514 2,079,024 2,415,312 2,252,737 2,367,219
Total Operating Expenses $ 21,975,524 $22,759,451 $ 23,701,429 $24,255,988 $25,687,090
Page 24 of 56
Eastside Fire & Rescue
2017 Operating Expenses Budget
Page 25 of 56
Eastside Fire & Rescue
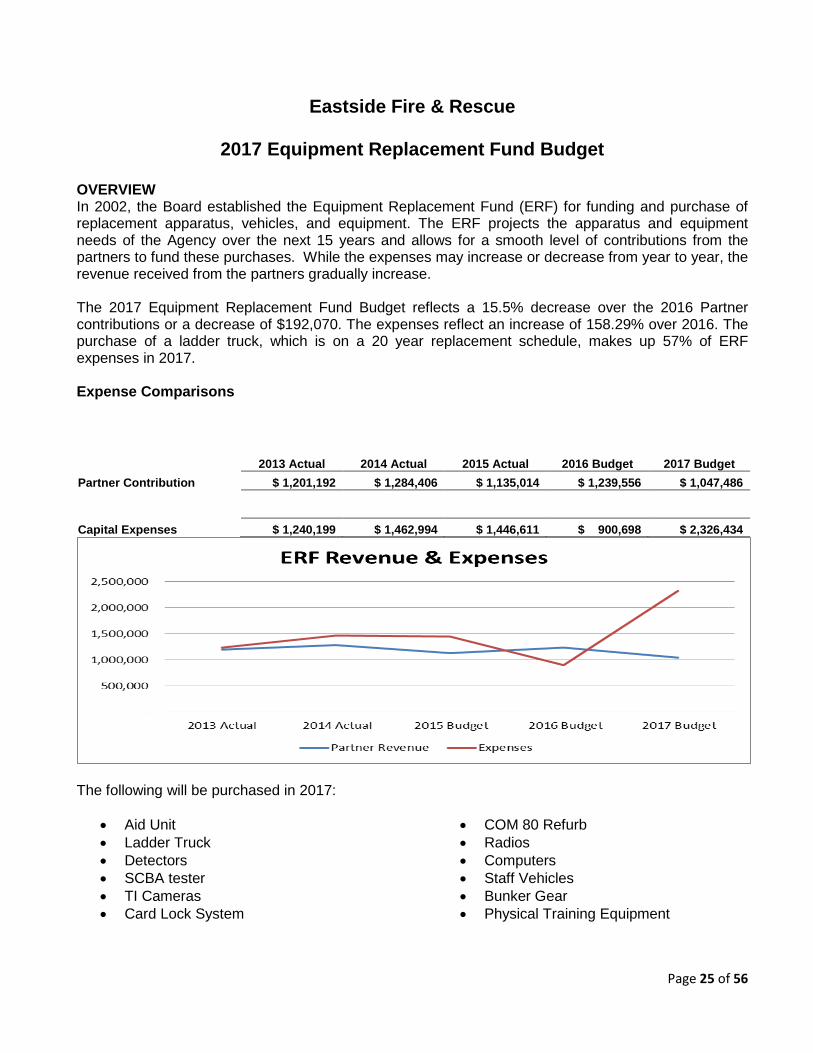
2017 Equipment Replacement Fund Budget OVERVIEW In 2002, the Board established the Equipment Replacement Fund (ERF) for funding and purchase of replacement apparatus, vehicles, and equipment. The ERF projects the apparatus and equipment needs of the Agency over the next 15 years and allows for a smooth level of contributions from the partners to fund these purchases. While the expenses may increase or decrease from year to year, the revenue received from the partners gradually increase. The 2017 Equipment Replacement Fund Budget reflects a 15.5% decrease over the 2016 Partner contributions or a decrease of $192,070. The expenses reflect an increase of 158.29% over 2016. The purchase of a ladder truck, which is on a 20 year replacement schedule, makes up 57% of ERF expenses in 2017. Expense Comparisons
2013 Actual 2014 Actual 2015 Actual 2016 Budget 2017 Budget
Partner Contribution $ 1,201,192 $ 1,284,406 $ 1,135,014 $ 1,239,556 $ 1,047,486
Capital Expenses $ 1,240,199 $ 1,462,994 $ 1,446,611 $ 900,698 $ 2,326,434
The following will be purchased in 2017:
• Aid Unit • Ladder Truck • Detectors • SCBA tester • TI Cameras • Card Lock System
• COM 80 Refurb • Radios • Computers • Staff Vehicles • Bunker Gear • Physical Training Equipment
Page 26 of 56
Eastside Fire & Rescue
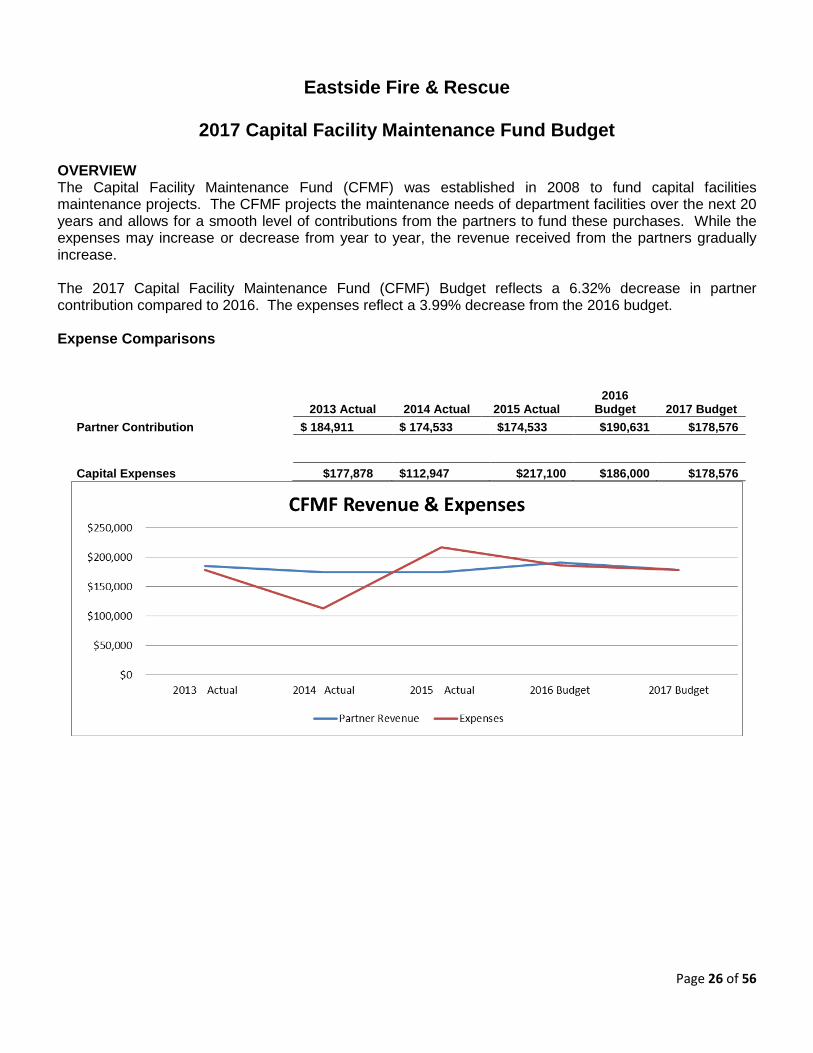
2017 Capital Facility Maintenance Fund Budget OVERVIEW The Capital Facility Maintenance Fund (CFMF) was established in 2008 to fund capital facilities maintenance projects. The CFMF projects the maintenance needs of department facilities over the next 20 years and allows for a smooth level of contributions from the partners to fund these purchases. While the expenses may increase or decrease from year to year, the revenue received from the partners gradually increase. The 2017 Capital Facility Maintenance Fund (CFMF) Budget reflects a 6.32% decrease in partner contribution compared to 2016. The expenses reflect a 3.99% decrease from the 2016 budget. Expense Comparisons
2013 Actual 2014 Actual 2015 Actual
2016 Budget 2017 Budget
Partner Contribution $ 184,911 $ 174,533 $174,533 $190,631 $178,576
Capital Expenses $177,878 $112,947 $217,100 $186,000 $178,576

Page 27 of 56
Eastside Fire & Rescue
2017 Partner Contributions For all Funds
OVERVIEW The 2017 total partner contributions increase is 4.21% from 2016. Since 2012, the total partner contributions have increased an average of 3.59% per year. Contribution Comparisons
Partner Contributions 2013 Actual 2014 Actual 2015 Actual 2016 Budget 2017 Budget Operating Fund $ 19,450,860 $ 20,277,898 $ 20,973,114 $ 21,546,212 $ 22,717,689
Equipment Replacement Fund 1,201,192 1,284,405 1,135,013 1,239,556 1,047,486
Capital Facility Maintenance Fund 184,910 174,533 174,533 190,632 178,576
Total Partner Contribution $ 20,836,962 $ 21,736,836 $ 22,282,660 $ 22,976,400 $ 23,943,751

Page 28 of 56
Eastside Fire & Rescue
2017 Total Partner Contributions
By Partner
Fund 2013 2014 2015 2016 2017 King County Fire Protection District 10 $ 7,133,973 $ 7,428,868 $ 7,455,955 $ 6,623,537 $ 6,902,112
Fire District 38 1,424,228 1,482,892 1,595,823 1,613,025 1,680,776 City of Issaquah 5,406,969 5,643,172 6,160,355 6,437,943 6,709,202 City of North Bend 830,754 873,627 987,658 1,047,663 1,091,910 City of Sammamish 6,041,038 6,308,277 6,082,869 7,254,232 7,559,752
Total Partner Contribution $20,836,962 $21,736,836 $22,282,660 $22,976,400 $23,943,752

Page 29 of 56
Eastside Fire & Rescue
2017 Partner Contributions
By Fund
Fund Operating Equipment
Replacement Capital Facilities
Maintenance Total King County Fire Protection District 10 $ 6,537,631 $ 301,443 $ 63,038 $ 6,902,112 Fire District 38 1,590,486 73,335 16,954 1,680,776 City of Issaquah 6,371,943 293,803 43,456 6,709,202 City of North Bend 1,037,576 47,841 6,492 1,091,910 City of Sammamish 7,180,052 331,064 48,636 7,559,752
Total Partner Contribution $22,717,688 $1,047,486 $ 178,576 $23,943,752

Page 30 of 56
EASTSIDE FIRE & RESCUE
ADMINISTRATION EXPENSE BUDGET
BY DIVISION / PROGRAM
Page 31 of 56
Eastside Fire & Rescue
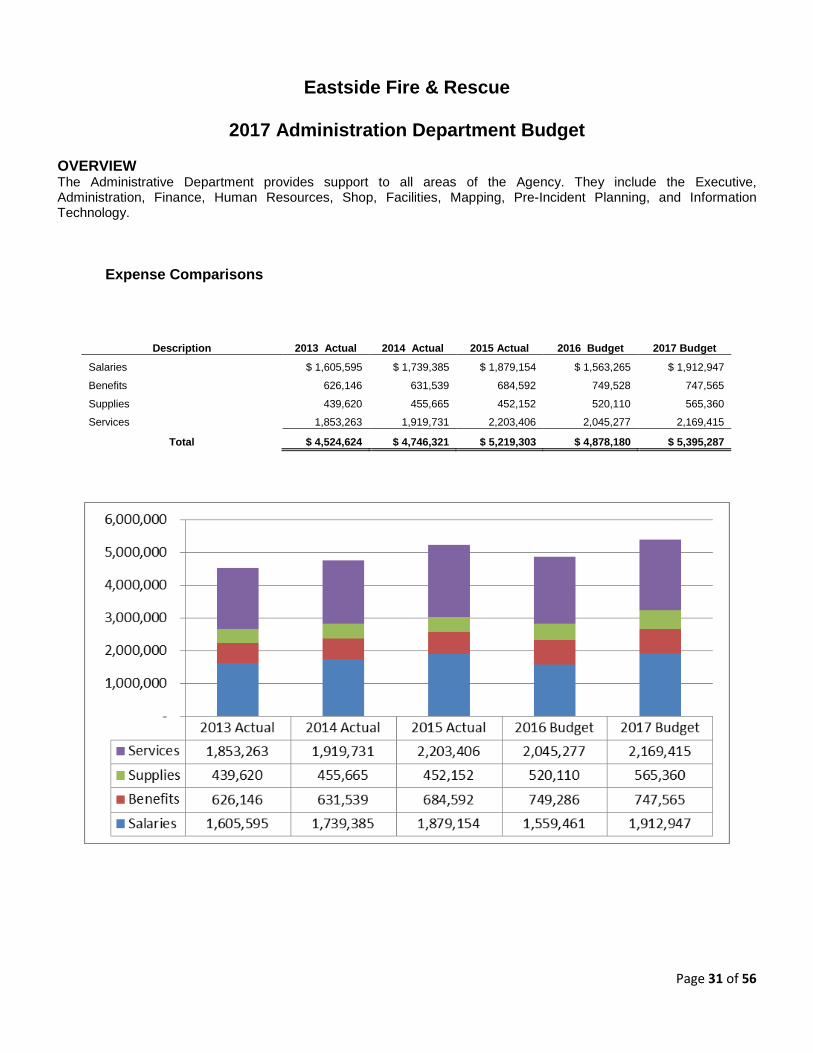
2017 Administration Department Budget OVERVIEW The Administrative Department provides support to all areas of the Agency. They include the Executive, Administration, Finance, Human Resources, Shop, Facilities, Mapping, Pre-Incident Planning, and Information Technology.
Expense Comparisons
Description 2013 Actual 2014 Actual 2015 Actual 2016 Budget 2017 Budget
Salaries $ 1,605,595 $ 1,739,385 $ 1,879,154 $ 1,563,265 $ 1,912,947
Benefits 626,146 631,539 684,592 749,528 747,565
Supplies 439,620 455,665 452,152 520,110 565,360
Services 1,853,263 1,919,731 2,203,406 2,045,277 2,169,415
Total $ 4,524,624 $ 4,746,321 $ 5,219,303 $ 4,878,180 $ 5,395,287

Page 32 of 56
Eastside Fire & Rescue
2017 Administrative Budget OVERVIEW The Administrative Division provides support to all areas of operations of the Agency. They include Executive, Administration, Finance, Human Resources, Planning, and an Emergency Management contractor. The Division has 11.3 FTE.
Expense Comparisons
Description 2013 Actual 2014 Actual 2015 Actual 2016 Budget 2017 Budget
Salaries $ 1,224,990 $ 1,306,554 $ 1,420,068 $ 1,381,868 $ 1,307,909
Benefits 494,475 494,101 511,993 564,030 515,787
Supplies 49,133 41,775 34,438 56,000 55,500
Services 352,661 367,929 443,296 374,800 485,000
Total $ 2,121,259 $ 2,210,358 $ 2,409,795 $ 2,376,698 $ 2,364,196

Page 33 of 56
Eastside Fire & Rescue
2017 Mapping & Pre-Incident Planning Budget OVERVIEW The mapping and pre-incident planning program creates and maintains the maps and preplans that are used by emergency responders and carried in all emergency apparatus. The mapping program provide accurate maps that include information relating to fire hydrant locations, rated bridges, locked gates, limited access points, schools, parks, GEO code grid and any other pertinent information. The maps are continually being verified by the crews in the field and new information is noted so that it can be updated into the program. The 2017 budget allows the continued migration of maps and preplans into the application that will work with on-line maps.
Expense Comparisons
Description 2013 Actual 2014 Actual 2015 Actual 2016 Budget 2017 Budget Salary $ 797 $ 490 $ 0 $ 4,000 $ 0 Supplies 0 3,569 0 7,000 4,000 Services 0 1,180 0 2,000 2,000
Total $ 797 $ 5,239 $ 0 $ 13,000 $ 6,000

Page 34 of 56
Eastside Fire & Rescue
2017 Information Technology Budget OVERVIEW Information Technology supports the computer, data, and communication needs of the Agency. This covers Headquarters, stations, and apparatus as well as dispatch costs. One (1) FTE was moved from the Administrative division to the Information Technology division. Also, the communication systems expense increased 11.11% in order to provide better connectivity to all stations.
Expense Comparisons
Description 2013 Actual 2014 Actual 2015 Actual 2016 Budget 2017 Budget
Salary $ 0 $ 0 $ 0 $ 0 $ 110,969
Benefits 0 0 0 0 39,580
Supplies 38,387 118,619 122,779 161,100 166,500
Services 918,267 974,577 1,105,384 1,045,702 1,026,790
Total $ 956,655 $ 1,093,196 $ 1,228,163 $ 1,206,802 $ 1,343,839

Page 35 of 56
Eastside Fire & Rescue
2017 Facilities Budget OVERVIEW The Facilities Division performs repairs and maintenance work on 14 fire stations and Headquarters. The Division has two (2) FTE. Outside vendors are utilized to perform various work on buildings. The 2017 Facilities budget maintains the current level of maintenance.
Expense Comparison
Description 2013 Actual 2014 Actual 2015 Actual 2016 Budget 2017 Budget
Salaries $ 136,980 $ 148,890 $ 156,384 $ 177,398 $ 240,009
Benefits 46,990 47,657 50,916 56,183 77,584
Supplies 137,973 101,583 97,470 138,590 142,840
Services 456,224 453,594 521,378 494,800 510,150
Total $ 778,167 $ 751,724 $ 826,148 $ 867,213 $ 970,583

Page 36 of 56
Eastside Fire & Rescue
2017 Shop Budget OVERVIEW The Shop Division maintains the apparatus and vehicles used by the Agency. The Shop has three (3) FTEs. Most of the maintenance on the apparatus and Agency vehicles is performed by the Shop personnel. More complex maintenance work is sent to outside vendors for completion. The Shop maintains 74 Agency apparatus, staff vehicles, trailers, utility vehicles, and a boat. The Shop maintains 18 apparatus and staff vehicles of other Agencies through maintenance agreements. The 2017 Shop budget allows the Agency to maintain its current level of operations. Most of the decrease in the Shop budget is due to not filling the Chief of Maintenance position for 2017. Prior shop budgets had half of the cost for the Chief of Maintenance.
Expense Comparison
Description 2013 Actual 2014 Actual 2015 Actual 2016 Budget 2017 Budget Salaries $ 242,829 $ 283,451 $ 302,702 $ 327,000 $ 254,061 Benefits 84,680 89,782 121,684 129,072 114,614 Supplies 201,637 190,119 197,466 183,520 196,520 Services 126,111 122,451 133,346 127,975 145,475 Capital Outlay 0 0 65,980 0 0
Total $ 655,257 $ 685,803 $ 821,177 $ 767,567 $ 710,670
Page 37 of 56
EASTSIDE FIRE & RESCUE
OPERATIONS EXPENSE BUDGET
BY DIVISION / TEAMS

Page 38 of 56
Eastside Fire & Rescue
2017 Operations Department Budget OVERVIEW The Operations Department provides fire, EMS, and specialty team service delivery for the Agency.
Expense Comparisons
Description 2013 Actual 2014 Actual 2015 Actual 2016 Budget 2017 Budget Salaries $ 12,146,875 $ 12,589,590 $ 12,685,757 $ 13,000,752 $ 13,731,255 Benefits 3,385,413 3,622,188 3,890,854 4,098,253 4,412,567 Supplies 391,923 234,004 312,639 344,450 348,582 Services 66,067 20,280 52,667 50,725 41,369 Capital Outlay 7,610 0 0 0 0
Total $ 15,997,888 $ 16,466,062 $ 16,941,917 $ 17,494,180 $ 18,533,773
Page 39 of 56
Eastside Fire & Rescue
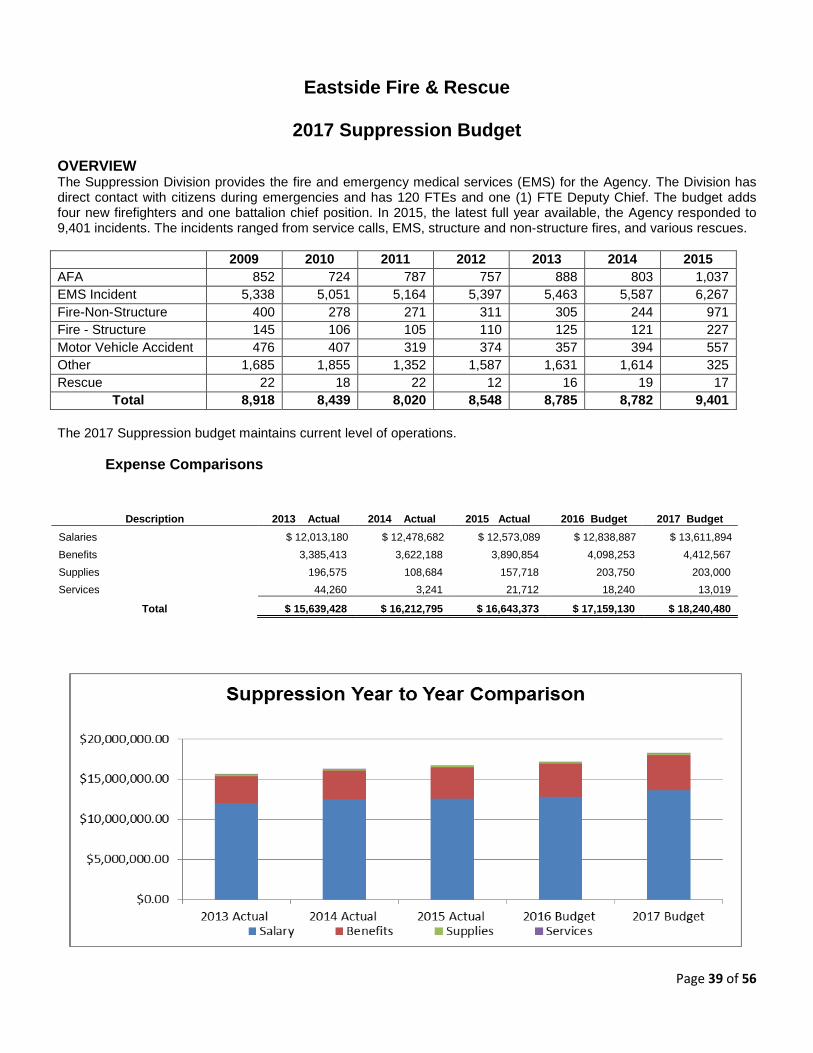
2017 Suppression Budget OVERVIEW The Suppression Division provides the fire and emergency medical services (EMS) for the Agency. The Division has direct contact with citizens during emergencies and has 120 FTEs and one (1) FTE Deputy Chief. The budget adds four new firefighters and one battalion chief position. In 2015, the latest full year available, the Agency responded to 9,401 incidents. The incidents ranged from service calls, EMS, structure and non-structure fires, and various rescues. 2009 2010 2011 2012 2013 2014 2015 AFA 852 724 787 757 888 803 1,037 EMS Incident 5,338 5,051 5,164 5,397 5,463 5,587 6,267 Fire-Non-Structure 400 278 271 311 305 244 971 Fire - Structure 145 106 105 110 125 121 227 Motor Vehicle Accident 476 407 319 374 357 394 557 Other 1,685 1,855 1,352 1,587 1,631 1,614 325 Rescue 22 18 22 12 16 19 17
Total 8,918 8,439 8,020 8,548 8,785 8,782 9,401 The 2017 Suppression budget maintains current level of operations.
Expense Comparisons
Description 2013 Actual 2014 Actual 2015 Actual 2016 Budget 2017 Budget Salaries $ 12,013,180 $ 12,478,682 $ 12,573,089 $ 12,838,887 $ 13,611,894 Benefits 3,385,413 3,622,188 3,890,854 4,098,253 4,412,567 Supplies 196,575 108,684 157,718 203,750 203,000 Services 44,260 3,241 21,712 18,240 13,019
Total $ 15,639,428 $ 16,212,795 $ 16,643,373 $ 17,159,130 $ 18,240,480
Page 40 of 56
Eastside Fire & Rescue
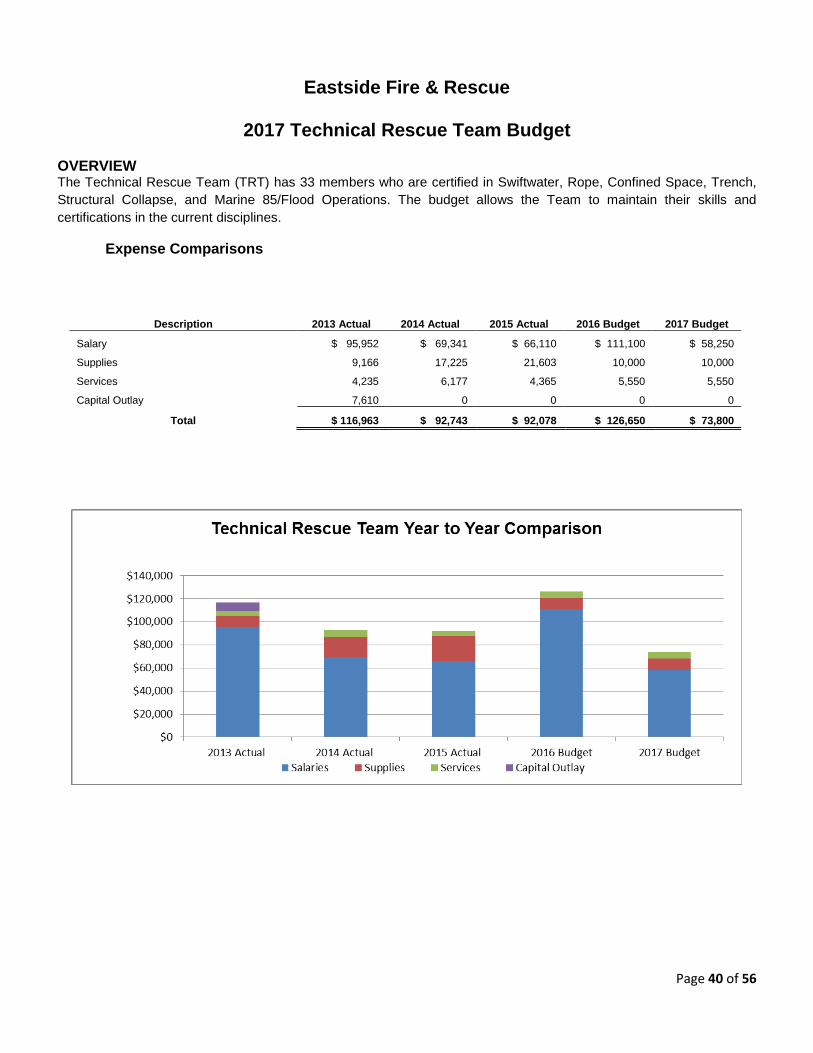
2017 Technical Rescue Team Budget OVERVIEW The Technical Rescue Team (TRT) has 33 members who are certified in Swiftwater, Rope, Confined Space, Trench, Structural Collapse, and Marine 85/Flood Operations. The budget allows the Team to maintain their skills and certifications in the current disciplines.
Expense Comparisons
Description 2013 Actual 2014 Actual 2015 Actual 2016 Budget 2017 Budget
Salary $ 95,952 $ 69,341 $ 66,110 $ 111,100 $ 58,250
Supplies 9,166 17,225 21,603 10,000 10,000
Services 4,235 6,177 4,365 5,550 5,550
Capital Outlay 7,610 0 0 0 0
Total $ 116,963 $ 92,743 $ 92,078 $ 126,650 $ 73,800
Page 41 of 56
Eastside Fire & Rescue
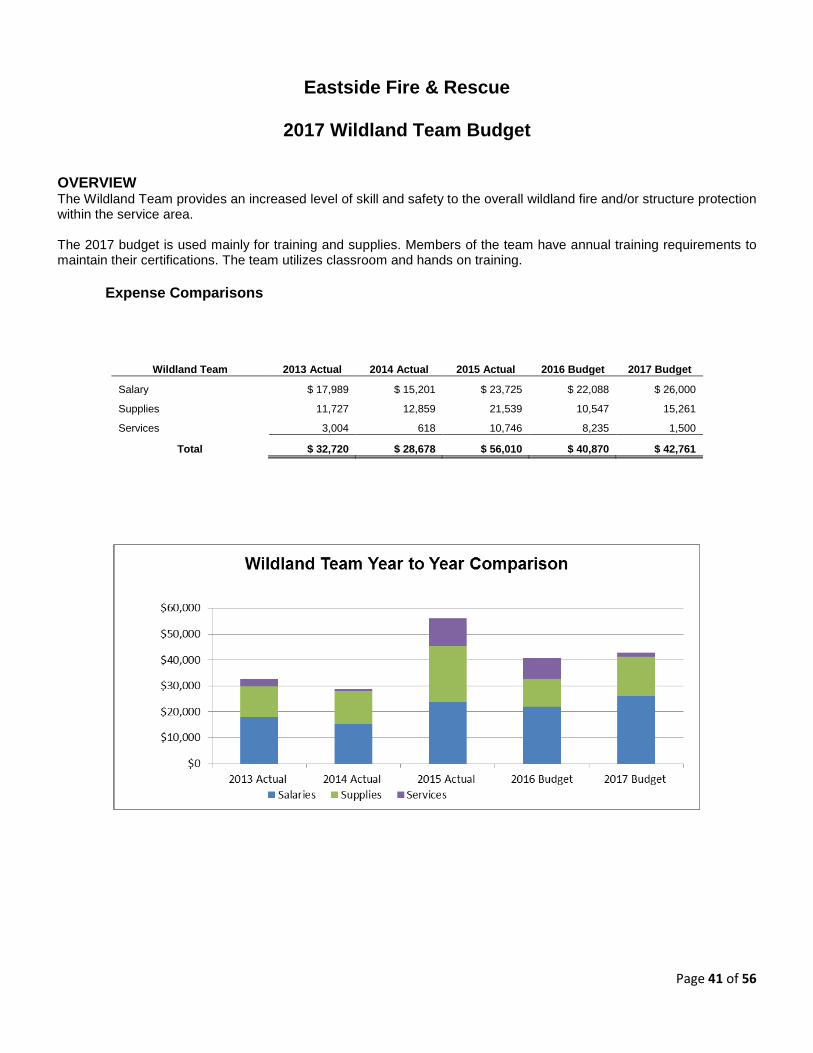
2017 Wildland Team Budget OVERVIEW The Wildland Team provides an increased level of skill and safety to the overall wildland fire and/or structure protection within the service area. The 2017 budget is used mainly for training and supplies. Members of the team have annual training requirements to maintain their certifications. The team utilizes classroom and hands on training.
Expense Comparisons
Wildland Team 2013 Actual 2014 Actual 2015 Actual 2016 Budget 2017 Budget
Salary $ 17,989 $ 15,201 $ 23,725 $ 22,088 $ 26,000
Supplies 11,727 12,859 21,539 10,547 15,261
Services 3,004 618 10,746 8,235 1,500
Total $ 32,720 $ 28,678 $ 56,010 $ 40,870 $ 42,761
Page 42 of 56
Eastside Fire & Rescue
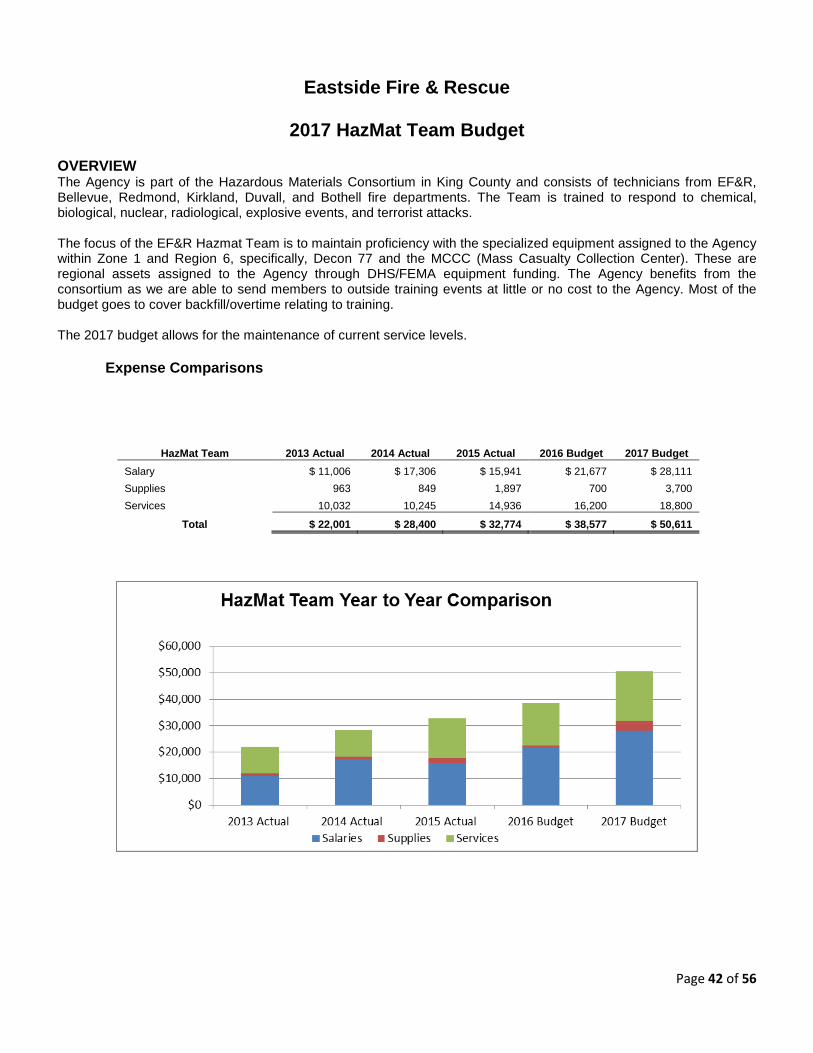
2017 HazMat Team Budget OVERVIEW The Agency is part of the Hazardous Materials Consortium in King County and consists of technicians from EF&R, Bellevue, Redmond, Kirkland, Duvall, and Bothell fire departments. The Team is trained to respond to chemical, biological, nuclear, radiological, explosive events, and terrorist attacks. The focus of the EF&R Hazmat Team is to maintain proficiency with the specialized equipment assigned to the Agency within Zone 1 and Region 6, specifically, Decon 77 and the MCCC (Mass Casualty Collection Center). These are regional assets assigned to the Agency through DHS/FEMA equipment funding. The Agency benefits from the consortium as we are able to send members to outside training events at little or no cost to the Agency. Most of the budget goes to cover backfill/overtime relating to training. The 2017 budget allows for the maintenance of current service levels.
Expense Comparisons
HazMat Team 2013 Actual 2014 Actual 2015 Actual 2016 Budget 2017 Budget Salary $ 11,006 $ 17,306 $ 15,941 $ 21,677 $ 28,111 Supplies 963 849 1,897 700 3,700 Services 10,032 10,245 14,936 16,200 18,800
Total $ 22,001 $ 28,400 $ 32,774 $ 38,577 $ 50,611
Page 43 of 56
Eastside Fire & Rescue
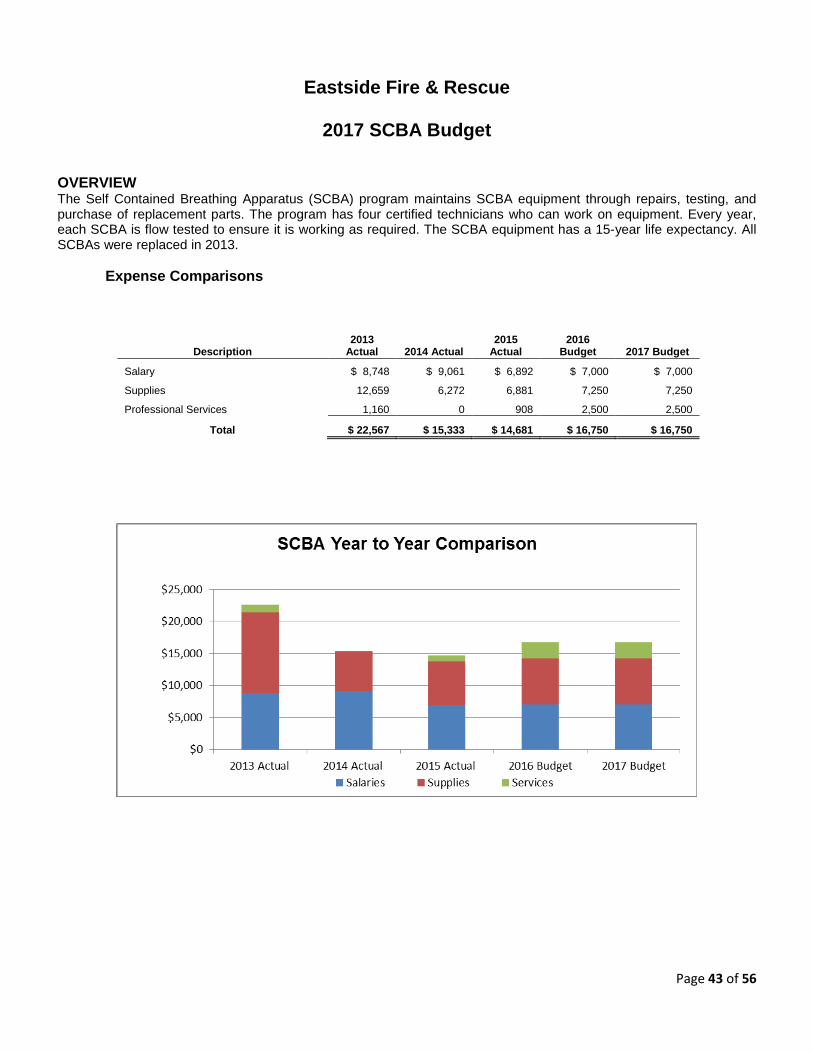
2017 SCBA Budget OVERVIEW The Self Contained Breathing Apparatus (SCBA) program maintains SCBA equipment through repairs, testing, and purchase of replacement parts. The program has four certified technicians who can work on equipment. Every year, each SCBA is flow tested to ensure it is working as required. The SCBA equipment has a 15-year life expectancy. All SCBAs were replaced in 2013.
Expense Comparisons
Description 2013
Actual 2014 Actual 2015
Actual 2016
Budget 2017 Budget
Salary $ 8,748 $ 9,061 $ 6,892 $ 7,000 $ 7,000
Supplies 12,659 6,272 6,881 7,250 7,250
Professional Services 1,160 0 908 2,500 2,500
Total $ 22,567 $ 15,333 $ 14,681 $ 16,750 $ 16,750
Page 44 of 56
Eastside Fire & Rescue
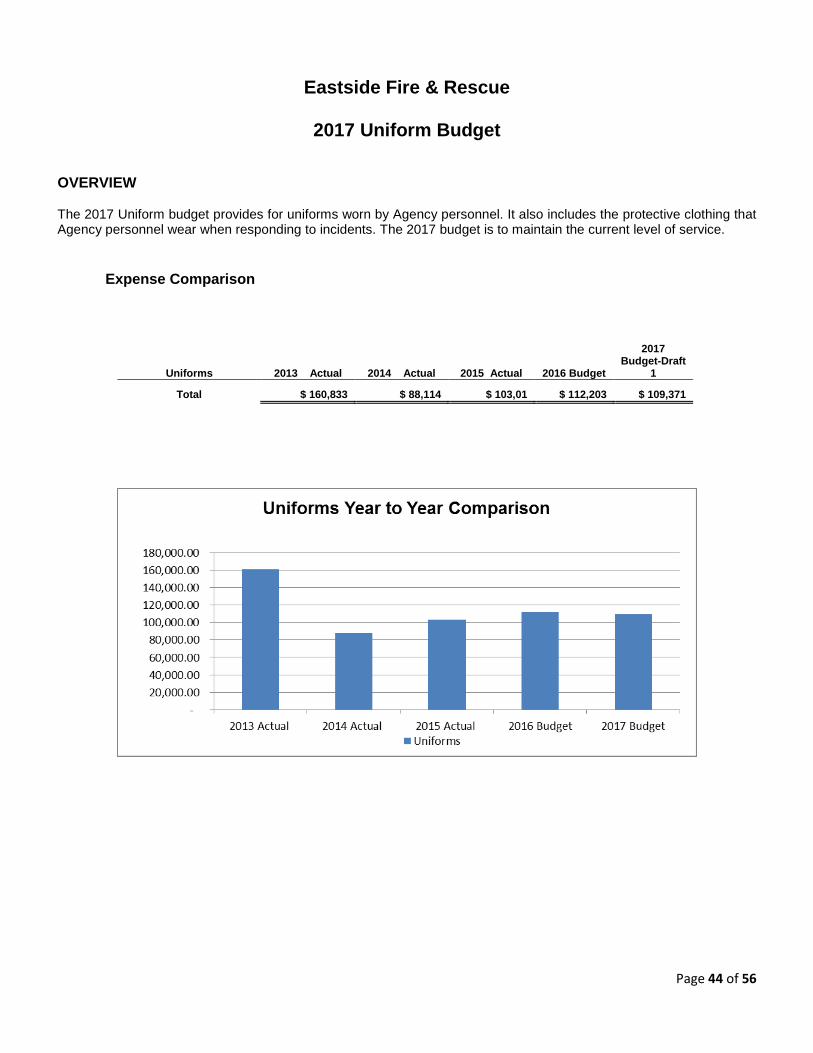
2017 Uniform Budget OVERVIEW The 2017 Uniform budget provides for uniforms worn by Agency personnel. It also includes the protective clothing that Agency personnel wear when responding to incidents. The 2017 budget is to maintain the current level of service.
Expense Comparison
Uniforms 2013 Actual 2014 Actual 2015 Actual 2016 Budget
2017 Budget-Draft
1
Total $ 160,833 $ 88,114 $ 103,01 $ 112,203 $ 109,371
Page 45 of 56
EASTSIDE FIRE & RESCUE
TRAINING & SAFETY
EXPENSE BUDGET
BY DIVISION
Page 46 of 56
Eastside Fire & Rescue
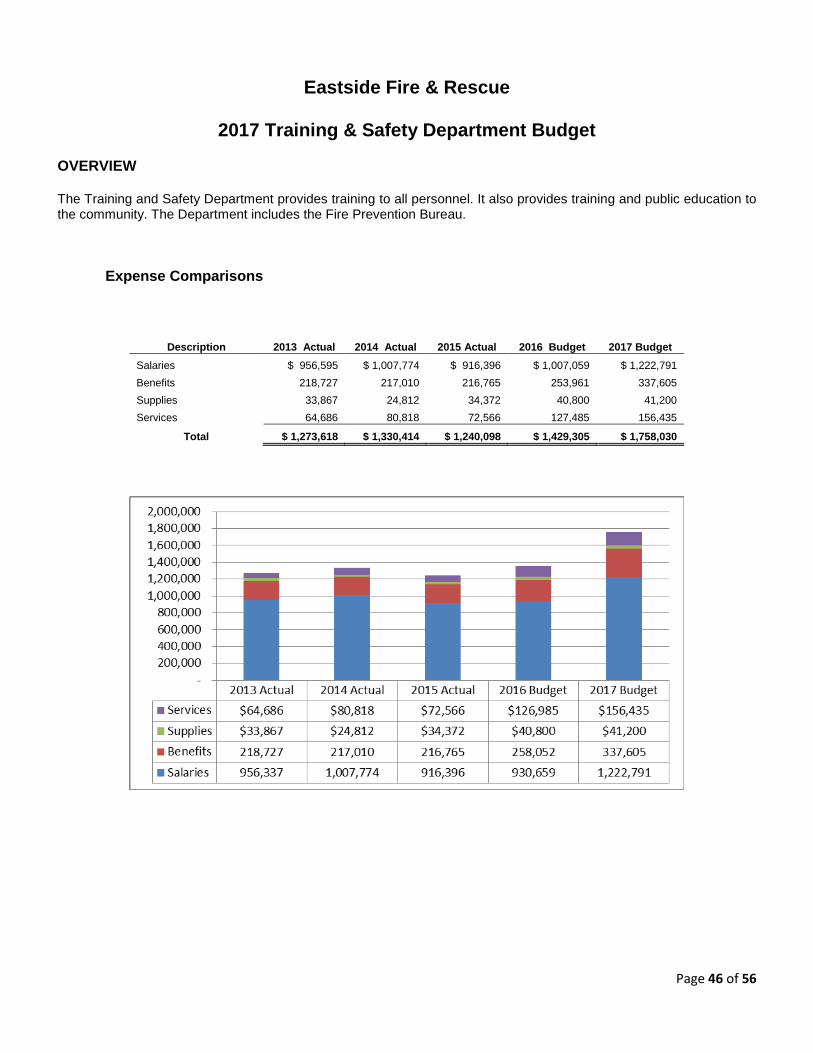
2017 Training & Safety Department Budget OVERVIEW The Training and Safety Department provides training to all personnel. It also provides training and public education to the community. The Department includes the Fire Prevention Bureau.
Expense Comparisons
Description 2013 Actual 2014 Actual 2015 Actual 2016 Budget 2017 Budget Salaries $ 956,595 $ 1,007,774 $ 916,396 $ 1,007,059 $ 1,222,791 Benefits 218,727 217,010 216,765 253,961 337,605 Supplies 33,867 24,812 34,372 40,800 41,200 Services 64,686 80,818 72,566 127,485 156,435
Total $ 1,273,618 $ 1,330,414 $ 1,240,098 $ 1,429,305 $ 1,758,030

Page 47 of 56
Eastside Fire & Rescue
2017 Training Budget OVERVIEW The Training Division provides orientation, skill assessment, and initial training for career firefighters, volunteer Fire and EMS responders. The Division is also responsible for the continuation of required training to ensure employees and volunteers meet required standards and certifications. The Division has four (4) FTEs and 0.5 of an FTE Deputy Chief. The 2017 Training budget will enhance the current level of service, and provide peer support training in addition to the normal training schedule.
Expense Comparison
Description 2013 Actual 2014 Actual 2015 Actual 2016 Budget 2017 Budget
Salaries $ 582,183 $ 606,504 $ 604,398 $ 684,883 $ 762,802
Benefits 119,346 120,090 133,041 158,022 190,781
Supplies 11,713 6,950 7,946 13,000 8,000
Services 50,538 76,002 62,286 78,400 107,600
Total $ 763,780 $ 809,546 $ 807,671 $ 934,305 $ 1,069,183
Page 48 of 56
Eastside Fire & Rescue
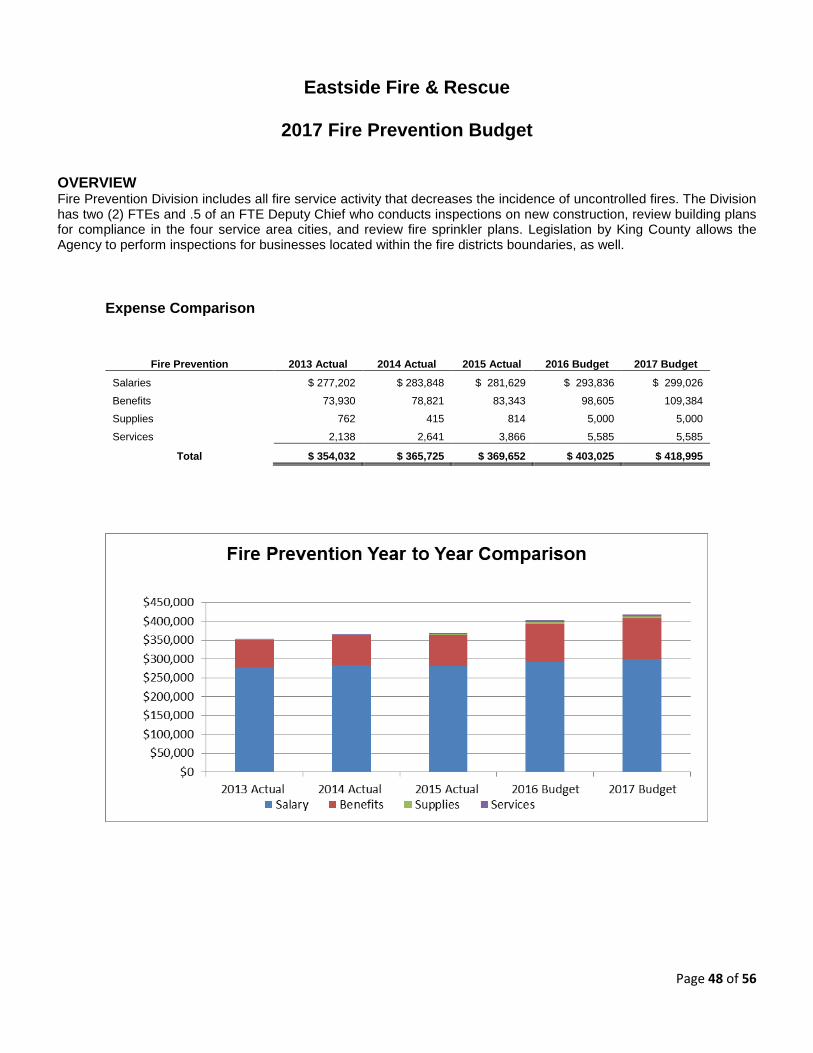
2017 Fire Prevention Budget OVERVIEW Fire Prevention Division includes all fire service activity that decreases the incidence of uncontrolled fires. The Division has two (2) FTEs and .5 of an FTE Deputy Chief who conducts inspections on new construction, review building plans for compliance in the four service area cities, and review fire sprinkler plans. Legislation by King County allows the Agency to perform inspections for businesses located within the fire districts boundaries, as well.
Expense Comparison
Fire Prevention 2013 Actual 2014 Actual 2015 Actual 2016 Budget 2017 Budget
Salaries $ 277,202 $ 283,848 $ 281,629 $ 293,836 $ 299,026
Benefits 73,930 78,821 83,343 98,605 109,384
Supplies 762 415 814 5,000 5,000
Services 2,138 2,641 3,866 5,585 5,585
Total $ 354,032 $ 365,725 $ 369,652 $ 403,025 $ 418,995
Page 49 of 56
Eastside Fire & Rescue
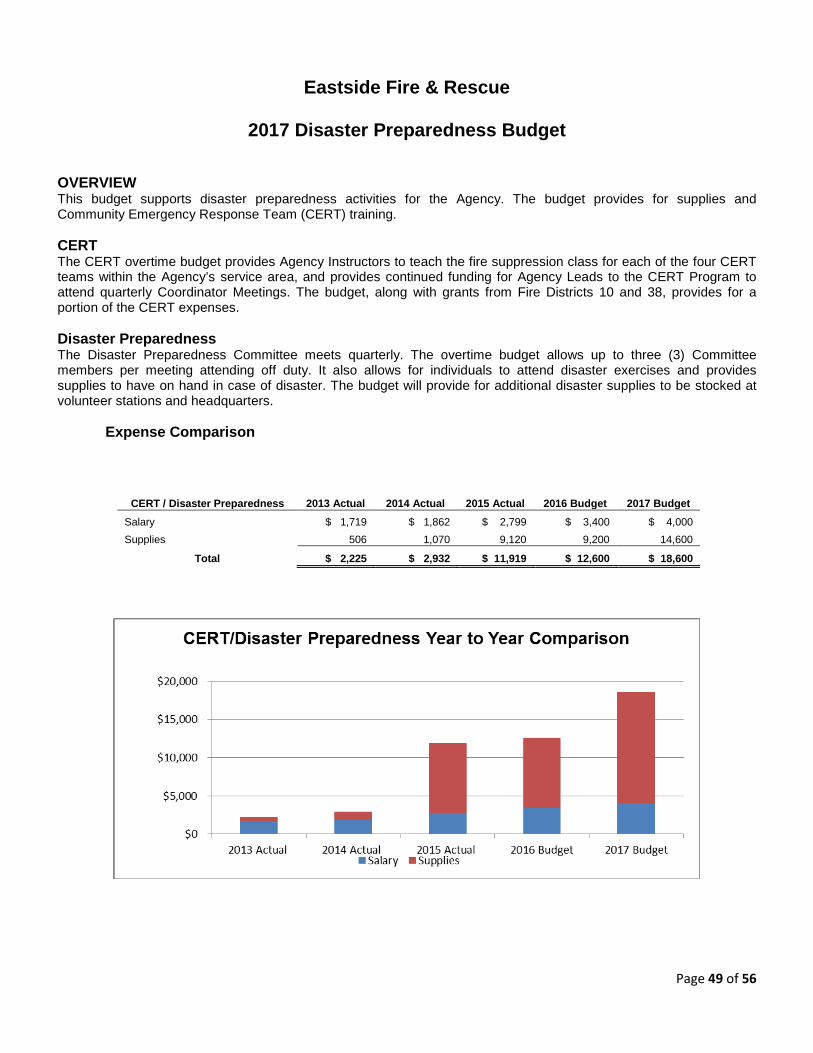
2017 Disaster Preparedness Budget OVERVIEW This budget supports disaster preparedness activities for the Agency. The budget provides for supplies and Community Emergency Response Team (CERT) training. CERT The CERT overtime budget provides Agency Instructors to teach the fire suppression class for each of the four CERT teams within the Agency’s service area, and provides continued funding for Agency Leads to the CERT Program to attend quarterly Coordinator Meetings. The budget, along with grants from Fire Districts 10 and 38, provides for a portion of the CERT expenses. Disaster Preparedness The Disaster Preparedness Committee meets quarterly. The overtime budget allows up to three (3) Committee members per meeting attending off duty. It also allows for individuals to attend disaster exercises and provides supplies to have on hand in case of disaster. The budget will provide for additional disaster supplies to be stocked at volunteer stations and headquarters.
Expense Comparison
CERT / Disaster Preparedness 2013 Actual 2014 Actual 2015 Actual 2016 Budget 2017 Budget Salary $ 1,719 $ 1,862 $ 2,799 $ 3,400 $ 4,000 Supplies 506 1,070 9,120 9,200 14,600
Total $ 2,225 $ 2,932 $ 11,919 $ 12,600 $ 18,600
Page 50 of 56
Eastside Fire & Rescue
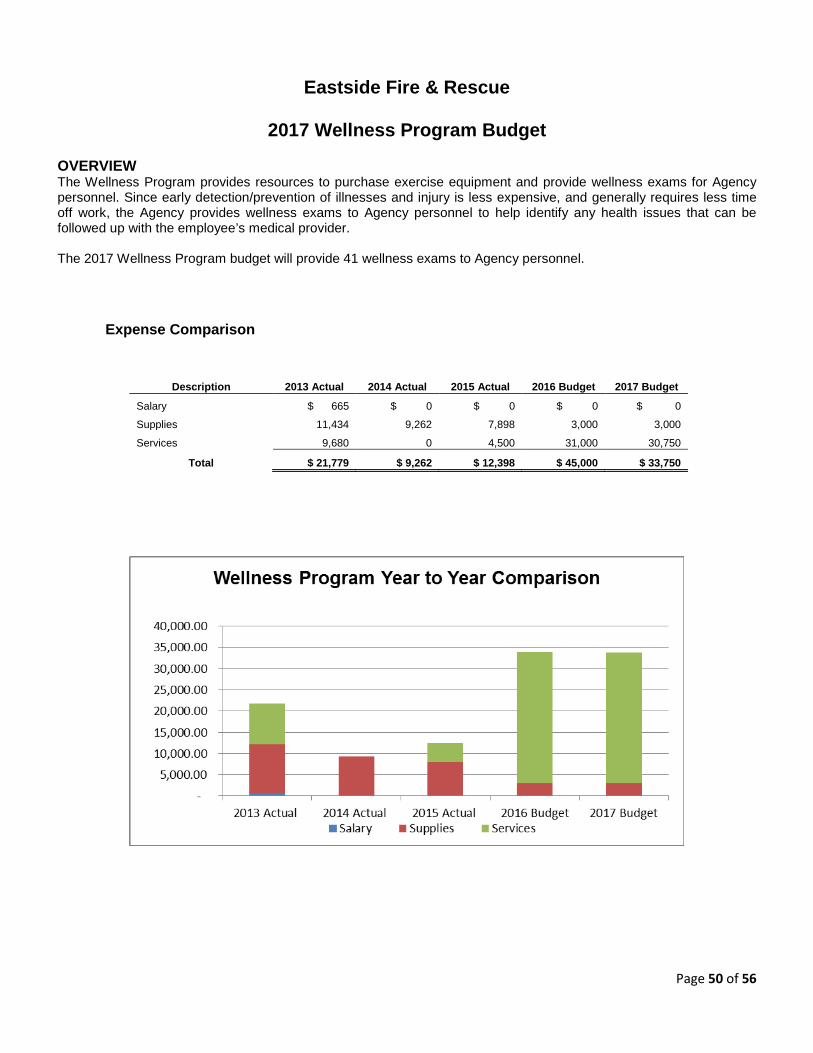
2017 Wellness Program Budget OVERVIEW The Wellness Program provides resources to purchase exercise equipment and provide wellness exams for Agency personnel. Since early detection/prevention of illnesses and injury is less expensive, and generally requires less time off work, the Agency provides wellness exams to Agency personnel to help identify any health issues that can be followed up with the employee’s medical provider. The 2017 Wellness Program budget will provide 41 wellness exams to Agency personnel.
Expense Comparison
Description 2013 Actual 2014 Actual 2015 Actual 2016 Budget 2017 Budget
Salary $ 665 $ 0 $ 0 $ 0 $ 0
Supplies 11,434 9,262 7,898 3,000 3,000
Services 9,680 0 4,500 31,000 30,750
Total $ 21,779 $ 9,262 $ 12,398 $ 45,000 $ 33,750
Page 51 of 56
Eastside Fire & Eastside Fire & Rescue
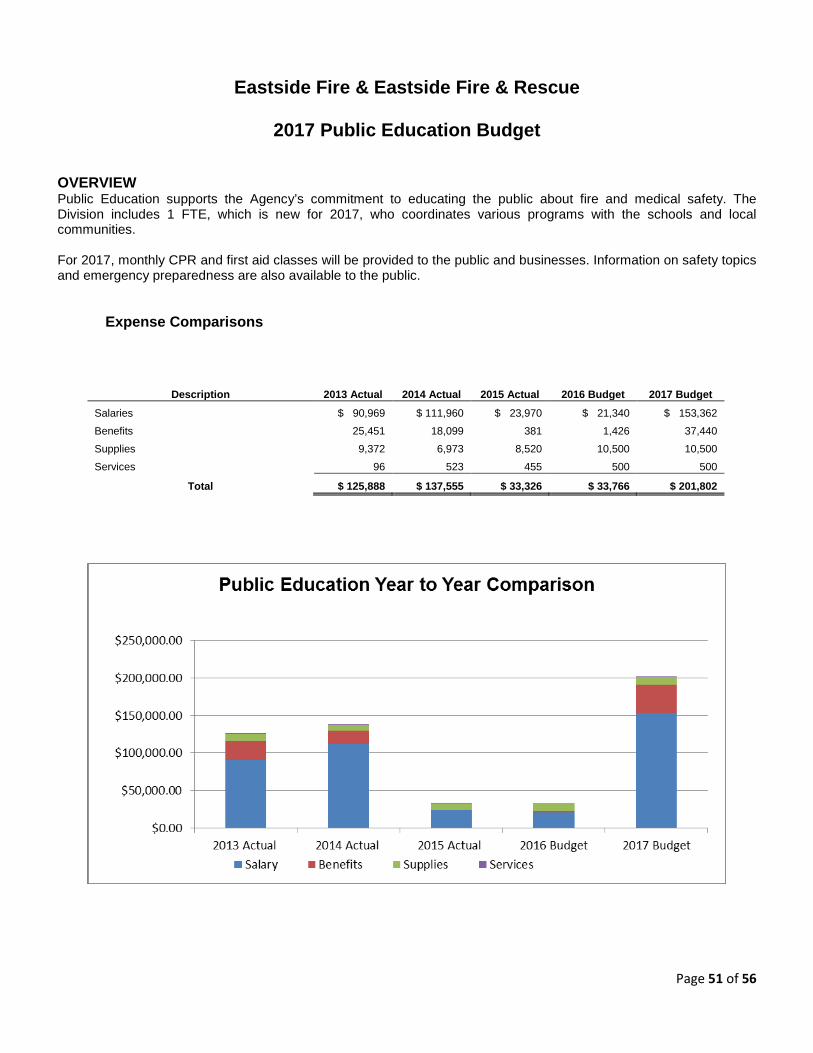
2017 Public Education Budget OVERVIEW Public Education supports the Agency’s commitment to educating the public about fire and medical safety. The Division includes 1 FTE, which is new for 2017, who coordinates various programs with the schools and local communities. For 2017, monthly CPR and first aid classes will be provided to the public and businesses. Information on safety topics and emergency preparedness are also available to the public.
Expense Comparisons
Description 2013 Actual 2014 Actual 2015 Actual 2016 Budget 2017 Budget
Salaries $ 90,969 $ 111,960 $ 23,970 $ 21,340 $ 153,362
Benefits 25,451 18,099 381 1,426 37,440
Supplies 9,372 6,973 8,520 10,500 10,500
Services 96 523 455 500 500
Total $ 125,888 $ 137,555 $ 33,326 $ 33,766 $ 201,802

Page 52 of 56
Eastside Fire & Rescue
2017 Chaplain Budget OVERVIEW The Chaplains Division provides chaplains who provide compassion, comfort, and pastoral care to those affected by emergencies and tragic situations. They serve not only firefighters and Agency personnel, but also provide assistance to patients, victims, and family members in crisis. The Chaplains are trained and serve as part of the Critical Incident Stress Management Team. The Chaplains respond, on average, to about 103 incidents a year. The 2017 budget will provide the supplies and services to maintain the program. It will continue to provide Peer Support training for all chaplains.
Expense Comparisons
Description 2013 Actual 2014 Actual 2015 Actual 2016 Budget 2017 Budget
Salaries $ 3,600 $ 3,600 $ 3,600 $ 3,600 $ 3,600
Supplies 81 142 74 100 100
Services 2,23 1,651 1,459 12,000 12,000
Total $ 5,914 $ 5,393 $ 5,133 $ 15,700 $ 15,700

Page 53 of 56
Eastside Fire & Rescue
Exhibit A Funding Model
Step 1 –Through the use of GIS software, the areas within the EF&R boundaries that each career station (a station staffed by full-time employees) responds to first (“first due area”) will be determined and merged with jurisdictional boundary data to establish Party/Station areas within EF&R. Step 2 – For this step, we download all of the parcel data from King County GIS, and then we keep only those parcels that intersect the EF&R boundaries (they are either fully or partially within). In order to minimize processing, parcels such as waterways and others that have no assessed value are then deleted. From there, the levy codes are used to more precisely define which parcels belong to which party. That is then combined with station “first due” polygons to determine which station covers each parcel.
For the preliminary funding calculations, there were 44,816 parcels within the model with a combined AV of $28,519,704,635. Specifically:
Station Parcels AV Station 71 3,454 $2,191,350,522 Station 72 3,126 $3,520,372,397 Station 73 4,101 $3,637,063,742 Station 78 5,177 $2,024,249,529 Station 81 4,359 $3,250,378,769 Station 82 7,842 $5,058,145,054 Station 83 6,667 $5,000,410,050 Station 85 3,088 $1,091,616,410 Station 87 7,002 $2,746,118,162
Total: 44,816 28,519,704,635
*Note that in the preliminary model, Klahanie parcels were assigned to Sammamish
Party Parcels AV Dist 10 10,299 $4,389,711,802 Dist 38 4,619 $1,649,575,109 Issaquah 8,190 $8,101,005,673 North Bend 2,211 $1,040,713,384 Sammamish 19,497 $13,338,698,667
Total 44,816 $28,519,704,635

Page 54 of 56
Step 3 – Now that every parcel in the model has been assigned attributes to indicate the owner of the parcel and the Station covering that parcel a simple crosstab is created. For example, for Station 87’s coverage:
Party Station 87 Percentage Dist 10 $55,829,669 2.03304% Dist 38 $1,649,575,109 60.06934% Issaquah North Bend $1,040,713,384 37.89762% Sammamish
$2,746,118,162 100%
These percentages are used to determine what portion of the Assessed Value costs for each station is paid by each party in later steps.
Steps 4, 5, and 6 – After incidents are categorized, they are plotted on a map, and assigned Party and Station coverage in the same manner that parcels are. Since Fire incidents are weighted 3-to-1 in relation to EMS incidents, the actual number of fire incidents in each Party/Station area is multiplied by 3, and then they are combined with EMS. For the preliminary funding calculations, these are the incident number breakdowns:
2014 Fire Incidents (X3) ST71 ST72 ST73 ST78 ST81 ST82 ST83 ST85 ST87 Total Dist 10 237 33 21 648 21 51 456 171 1,638 Dist 38 648 648 Issaquah 738 900 465 15 420 2,538 North Bend 516 516 Sammamish 111 450 789 681 2,031 Total 975 933 597 648 465 810 1,152 456 1,335 7,371
2014 EMS Incidents ST71 ST72 ST73 ST78 ST81 ST82 ST83 ST85 ST87 Total Dist 10 147 13 6 439 14 24 308 18 969 Dist 38 375 375 Issaquah 729 805 429 5 797 2,765 North Bend 619 619 Sammamish 60 276 572 467 1,375 Total 876 818 495 439 281 586 1,288 308 1,012 6,103
2014 Total Incidents ST71 ST72 ST73 ST78 ST81 ST82 ST83 ST85 ST87 Total Dist 10 384 46 27 1,087 35 75 764 189 2,607 Dist 38 1,023 1,023 Issaquah 1,467 1,705 894 20 1,217 5,303 North Bend 1,135 1,135 Sammamish 171 726 1,361 1,148 3,406 Total 1,851 1,751 1,092 1,087 746 1,396 2,440 764 2,347 13,474

Page 55 of 56
Those totals are then used to determine what portion of the Incident costs for each station is paid by each party in later steps.
Step 7 – With a total budget of $21,841,594, the 9 career stations each have a base cost of $2,426,844
Steps 8 & 9 – Stations 72 and 81 are set at 75% of base, which equals $1,820,133 each. That reduced cost is picked up evenly by the remaining 7 stations, raising their costs to $2,600,190 each.
Step 10 - 85% of the Station’s cost is assigned to the AV portion. So, (again using Station 87) $2,210,161 is the AV portion. Based on the parcel AV within the Station 87 area and the different party areas they fall into, the $2,210,161 is divided between the three affected parties as follows:
Party Percentage Cost Dist 10 2.03304% $44,933.45 Dist 38 60.06934% $1,327,629.17
Issaquah North Bend 37.89762% $837,598.38 Sammamish
Step 11 – 15% of the station cost is assigned to the incident portion. So, (using Station 87 as an example) $390,028 is the incident portion. Based on the incidents falling within the Station 87 area, and the different party areas they fall into, the $390,028 is divided between the three affected parties as follows:
Party Percentage Cost Dist 10 8.05283% $31,408 Dist 38 43.58756% $170,004 Issaquah North Bend 48.35961% $188,616 Sammamish
Page 56 of 56
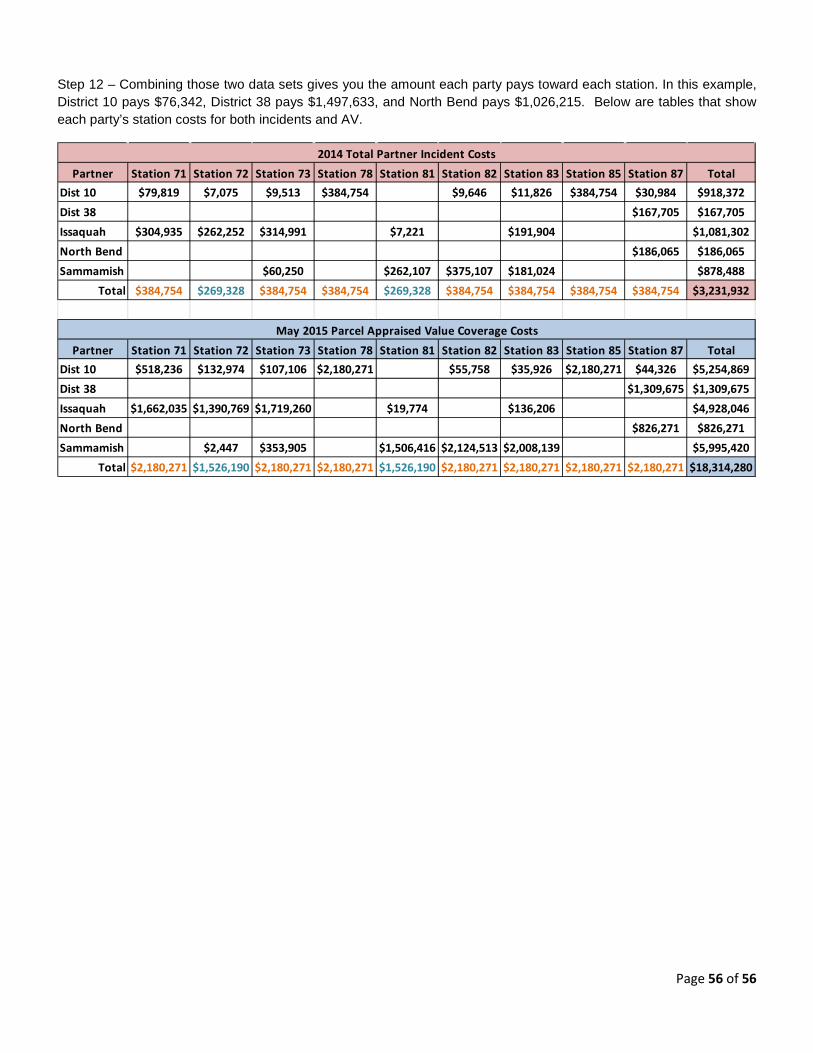
Step 12 – Combining those two data sets gives you the amount each party pays toward each station. In this example, District 10 pays $76,342, District 38 pays $1,497,633, and North Bend pays $1,026,215. Below are tables that show each party’s station costs for both incidents and AV.
Partner Station 71 Station 72 Station 73 Station 78 Station 81 Station 82 Station 83 Station 85 Station 87 TotalDist 10 $79,819 $7,075 $9,513 $384,754 $9,646 $11,826 $384,754 $30,984 $918,372Dist 38 $167,705 $167,705Issaquah $304,935 $262,252 $314,991 $7,221 $191,904 $1,081,302North Bend $186,065 $186,065Sammamish $60,250 $262,107 $375,107 $181,024 $878,488
Total $384,754 $269,328 $384,754 $384,754 $269,328 $384,754 $384,754 $384,754 $384,754 $3,231,932
Partner Station 71 Station 72 Station 73 Station 78 Station 81 Station 82 Station 83 Station 85 Station 87 TotalDist 10 $518,236 $132,974 $107,106 $2,180,271 $55,758 $35,926 $2,180,271 $44,326 $5,254,869Dist 38 $1,309,675 $1,309,675Issaquah $1,662,035 $1,390,769 $1,719,260 $19,774 $136,206 $4,928,046North Bend $826,271 $826,271Sammamish $2,447 $353,905 $1,506,416 $2,124,513 $2,008,139 $5,995,420
Total $2,180,271 $1,526,190 $2,180,271 $2,180,271 $1,526,190 $2,180,271 $2,180,271 $2,180,271 $2,180,271 $18,314,280
2014 Total Partner Incident Costs
May 2015 Parcel Appraised Value Coverage Costs