eastern berkshire fema economic development needs assessment · pdf fileeastern berkshire fema...
TRANSCRIPT

Eastern Berkshire FEMA Economic Development Needs Assessment
Thames Valley Berkshire Local Enterprise
Partnership
Final Report
September 2016


Eastern Berkshire FEMA Economic Development Needs Assessment (EDNA) Final Report Thames Valley Berkshire Local Enterprise Partnership September 2016 14793/MS/CGJ/LBa
Nathaniel Lichfield & Partners 14 Regent's Wharf All Saints Street London N1 9RL nlpplanning.com

This document is formatted for double sided printing. © Nathaniel Lichfield & Partners Ltd 2016. Trading as Nathaniel Lichfield & Partners. All Rights Reserved. Registered Office: 14 Regent's Wharf All Saints Street London N1 9RL All plans within this document produced by NLP are based upon Ordnance Survey mapping with the permission of Her Majesty’s Stationery Office. © Crown Copyright reserved. Licence number AL50684A

Eastern Berkshire FEMA : Economic Development Needs Assessment
10758685v8
Executive Summary
This Economic Development Needs Assessment (EDNA) has been prepared
by Nathaniel Lichfield & Partners on behalf of the Thames Valley Berkshire
Local Enterprise Partnership and the Berkshire authorities of Slough and
Windsor and Maidenhead. The method followed is National Planning Policy
Framework (NPPF) and Planning Practice Guidance (PPG) compliant. It
follows on from a Part 1 Study with the six Berkshire Authorities that for plan
making purposes identified three Core FEMAs with the Berkshire area.
This EDNA considers the objectively assessed economic development needs
for Slough and Windsor and Maidenhead within the Eastern Berkshire Core
FEMA over the period 2013-20361. The study considers future quantitative land
and floorspace requirements alongside related qualitative factors for individual
sectors and employment uses.
In accommodating growth needs, the EDNA notes competing pressures on
land within authorities and the footloose nature of some needs that means they
can be accommodated across individual boundaries. These factors will be
considered in line with the NPPF by the Berkshire local authorities as part of
the local plan process.
The key findings of the study are as follows:
The supply of employment space within the Eastern Berkshire FEMA is
broadly evenly split between office (B1a/b), factory (B1c/B2) and
warehousing (B8) uses. Office space is also broadly evenly split between
Windsor and Maidenhead and Slough. From an industrial perspective,
Slough accommodates the majority of stock in the FEMA.
Valuation Office Agency data underlines the dominant role that Slough
plays in terms of accommodating B class employment space in the
FEMA, particularly in regards to warehousing and distribution floorspace.
The spatial distribution of offices, factories, workshops and business
units tend to be more evenly dispersed within the FEMA, with
Maidenhead also standing out as a key location for office floorspace
outside Slough.
Over the last 10 years, the FEMA accommodated just over 40,000sq.m
of new B class development per year on average, driven by industrial
uses in Slough and office uses in Windsor and Maidenhead. After taking
into account losses of B class employment space to other uses over this
period, the net rate of B class development was positive in Slough, but
negative in Windsor and Maidenhead.
1 South Bucks is also included within the Eastern Berkshire FEMA but future economic development needs have not been
specifically assessed for this local authority as it falls outside of the TVBLEP area

Eastern Berkshire FEMA : Economic Development Needs Assessment
10758685v8
The Eastern Berkshire FEMA most closely aligns with the ‘Heathrow-
Slough-High Wycombe’ sub market area which effectively represents the
eastern end of the Thames Valley market with a distinctive industrial and
quasi-industrial character. There is also some degree of overlap with the
‘Core Thames Valley’ market area focused on the key M4 markets of
Reading, Maidenhead, Bracknell and Wokingham, with strong economic
relationships between these towns in terms of value, accessibility and
labour force.
Slough represents a significant commercial centre within the Western
Corridor, and accommodates the largest stock of industrial space in the
Thames Valley. Its office market is performing reasonably well but is still
characterised by high levels of office vacancy. Despite this, new
speculative office development is starting to occur in and around the
town centre, driven by the lack of Grade A office space, the arrival of
Crossrail in 2019 and specifically targeting the Western Corridor
corporate office market.
Windsor and Maidenhead’s main attractions for businesses are its
generally pleasant towns and quality of life factors, its good transport
accessibility, both to the M4 and rail links to London, reasonable
proximity to Heathrow Airport and a pool of highly skilled workers. The
Borough’s two main towns comprise distinct areas for the commercial
property market. Windsor is a niche location, attractive to certain higher
value firms seeking a prestige, heritage location and does not compete
with other nearby areas. In contrast, Maidenhead is part of the wider M4 /
Thames Valley property market to a greater extent, with a degree of
competition with Bracknell, Slough and Reading.
Three different scenarios of future employment space requirements have
been considered to provide a framework for considering the future
economic growth needs and B class employment space requirements in
the Eastern Berkshire FEMA during the 23 year period 2013 to 2036.
These scenarios reflect the PPG and draw upon the following:
i projections of employment growth in the main B class sectors
(labour demand) derived from economic forecasts produced by
Cambridge Econometrics which are consistent with other economic
evidence base work that has been prepared recently for Thames
Valley Berkshire;
ii consideration of past trends in completions of employment
space based on monitoring data collated by Slough Borough
Council and Royal Borough of Windsor & Maidenhead, and how
these trends might change in the future; and
iii estimating future growth of local labour supply based on
population projections for the Eastern Berkshire FEMA applied as
part of the recent Berkshire (including South Bucks) SHMA, and
the amount of jobs and employment space that this can support.

Eastern Berkshire FEMA : Economic Development Needs Assessment
10758685v8
It should be noted that the CE economic forecasts were examined as
part of the Berkshire (including South Bucks) Strategic Housing Market
Assessment (February 2016) which highlighted notable variations in the
rate of employment growth reported between historic time periods and
the forecasts. The SHMA authors consequently made some adjustments
to the overall rate of employment growth implied by the forecasts and for
some authorities (Reading, West Berkshire and Wokingham) a specific
‘economic uplift’ is added within the SHMA to the objectively assessed
housing need to account for this implied growth. Although it is not
possible to model the employment space and land requirements
associated with this adjusted growth trajectory as part of the EDNA, it is
important to be aware of the adjustments that have been made as part of
the SHMA within the context of economic evidence base alignment.
The ‘net’ B class employment space requirements related to these
different scenarios for the FEMA and individual local authority areas
within the FEMA are summarised in Table ES1 below.
Table ES1: Net Employment Space Requirements (GEA sq.m) for Eastern Berkshire FEMA by Scenario, 2013 - 2036
Uses
1. Baseline Labour
Demand
2. Past Completion
Rates
3. Labour Supply
EASTERN BERKSHIRE
FEMA
Offices (B1a/B1b) 108,800 -26,565 137,950
Industrial (B1c/B2/B8) 627,150 206,310 733,540
Total B Class Floorspace (sq.m)
735,950 179,745 871,490
SLOUGH
Offices (B1a/B1b) 58,300 -805 85,270
Industrial (B1c/B2/B8) 455,570 232,990 565,140
Total B Class Floorspace (sq.m)
513,870 232,185 650,410
WINDSOR & MAIDENHEAD
Offices (B1a/B1b) 50,500 -25,760 52,680
Industrial (B1c/B2/B8) 171,580 -26,680 168,400
Total B Class Floorspace (sq.m)
222,080 -52,440 221,080
Source: NLP analysis
After making an allowance for a safety margin and replacement of
ongoing employment floorspace losses, the total ‘gross’ B class
employment space requirement related to these different scenarios for
the FEMA ranges from 401,805sq.m to 1,117,490sq.m during the period
to 2036, which implies in broad terms a need for between 90.8ha and
251.2ha of employment land (as summarised in Table ES2 below). For
all three scenarios, the majority of this spatial requirement relates to
industrial (B1c/B2/B8) uses. Two of the three scenarios (baseline labour
demand and supply) forecast higher B class job growth than that
achieved historically across the FEMA as a whole.

Eastern Berkshire FEMA : Economic Development Needs Assessment
10758685v8
Table ES2: Gross Employment Land Requirements (ha) for Eastern Berkshire FEMA by Scenario, 2013 - 2036
Uses
1. Baseline Labour
Demand
2. Past Completion
Rates
3. Labour Supply
EASTERN BERKSHIRE
FEMA
Offices (B1a/B1b) 37.9 14.7 42.2
Industrial (B1c/B2/B8) 182.4 76.1 209.0
Total B Class Land (ha) 220.3 90.8 251.2
SLOUGH
Offices (B1a/B1b) 18.6 8.4 22.6
Industrial (B1c/B2/B8) 130.2 74.6 157.6
Total B Class Land (ha) 148.8 83.0 180.2
WINDSOR & MAIDENHEAD
Offices (B1a/B1b) 19.3 6.3 19.6
Industrial (B1c/B2/B8) 52.2 1.5 51.4
Total B Class Land (ha) 71.5 7.8 71.0
Source: NLP analysis
The net employment space requirements represent the minimum
recommended quantum of employment floorspace to plan for, and each
Local Planning Authority will need to take a view on the extent to which
additional space should be planned for over and above the net
requirements to allow for delays in development coming forward, for
replacing employment space that is lost in future and to take account of
other market signals.
The NPPF requirement to plan positively for growth means that local
authorities within the FEMA should consider planning to accommodate
the labour supply based requirement (scenario 3) to ensure that the
FEMA’s indigenous growth potential can be met. Both population and
employment growth may be constrained by lack of spatial capacity in
future.
Whilst growth needs have been identified on a FEMA wide and individual
local authority basis, there will be some degree of footloose needs that
potentially operate and can be accommodated across individual local
authority boundaries. Within the FEMA, the key commercial centres of
Slough and Maidenhead do not tend to compete with each other for
occupiers to any significant extent, with Maidenhead historically
commanding higher office rents and as a result, higher value office
occupiers compared to Slough. Whilst this market dynamic may change
in future, particularly as Slough’s Grade A office product offer improves
through the new high quality speculative development currently
underway, the distinct economic profile associated with individual
commercial centres within the FEMA suggests that the majority of
employment land requirements that have been identified for the two local
authority areas within the FEMA would ideally be accommodated within
(or near to) these local authority areas as far as possible.

Eastern Berkshire FEMA : Economic Development Needs Assessment
10758685v8
Windsor and Maidenhead’s position within both the Central and Eastern
FEMAs reflects the equally strong relationships the Borough exhibits with
both the Eastern and Central parts of Berkshire. In labour market terms,
eastern parts of the Borough share a TTWA with Slough and Heathrow,
while northern and western parts of the Borough have stronger functional
economic relationships with western M4 corridor locations such as
Reading and Wokingham. The Borough also falls within an HMA with
Slough and South Bucks according to the Berkshire (including South
Bucks) SHMA, underlining the particular strength of housing market
relationships within this eastern part of Berkshire.


Eastern Berkshire FEMA : Economic Development Needs Assessment
10758685v8
Contents
1.0 Introduction 1
Spatial Overview .............................................................................................. 3
Scope of Assessment ...................................................................................... 3
Study Methodology .......................................................................................... 4
Structure of the Report ..................................................................................... 6
2.0 Overview of Employment Space 7
Current Stock of Employment Space ............................................................... 7
Slough Development Rates............................................................................ 12
Windsor & Maidenhead Development Rates .................................................. 14
Impact of Permitted Development Rights ....................................................... 16
Summary ....................................................................................................... 17
3.0 Commercial Property Market Signals and Intelligence 19
UK Property Market Overview ........................................................................ 19
Market Geography ......................................................................................... 19
Summary ....................................................................................................... 26
4.0 Future Requirements for Employment Space 28
Methodology .................................................................................................. 28
A. Forecasts of Job Growth ............................................................................ 29
B. Past Development Rates ........................................................................... 35
C. Future Labour Supply ................................................................................ 36
Summary of Net Employment Space Requirements....................................... 39
Converting to Gross Employment Space Requirements ................................. 40
Converting to Land Requirements .................................................................. 44
Sensitivity Tests ............................................................................................. 45
Summary ....................................................................................................... 46
5.0 Policy Implications and Conclusions 48
Economic Development Needs ...................................................................... 48
Accommodating Growth ................................................................................. 50


Eastern Berkshire FEMA : Economic Development Needs Assessment
10758685v8
Appendices
Appendix 1 Executive Summary – Berkshire Functional Economic Market Area Study
(February 2016)
Appendix 2 Glossary
Appendix 3 Methodology Consultation Questions
Appendix 4 Methodology Consultation Responses Summary
Appendix 5 Emerging Findings Consultation Questions
Appendix 6 Emerging Findings Consultation Responses Summary
Appendix 7 List of Consultees
Appendix 8 VOA Floorspace Maps
Appendix 9 IDBR Business Maps
Appendix 10 Cambridge Econometrics Employment Projections - Methodology and data
sources
Appendix 11 Baseline Cambridge Econometrics Employment Projections
Appendix 12 Definition of B Class Sectors


Eastern Berkshire FEMA : Economic Development Needs Assessment
10758685v8 P1
1.0 Introduction
1.1 This Economic Development Needs Assessment (‘EDNA’) report has been
prepared by Nathaniel Lichfield & Partners (‘NLP’) on behalf of the Thames
Valley Berkshire Local Enterprise Partnership (‘TVBLEP’) and the Berkshire
authorities of Slough and Windsor and Maidenhead.
1.2 This report represents the second of a two-part study. The first part comprises
the Berkshire Functional Economic Market Area (‘FEMA’) Study2 prepared by
NLP to provide the TVBLEP and six Berkshire local authorities with an
understanding of the various economic relationships, linkages and flows which
characterise the sub-regional economy and from that the various FEMAs that
operate across Berkshire. That concluded for plan making purposes that three
Core FEMAs operate across Berkshire, with Slough and Windsor and
Maidenhead operating within an Eastern Core FEMA. The Executive Summary
of the Joint Berkshire FEMA Study is included at Appendix 1.
1.3 The functional economic geographies of the Eastern Berkshire FEMA are
however complex due to the influence of London, and the dynamic nature of
the economy as shown in Figure 1.1 below which summarises the main ‘policy
off’ relationships that characterise the FEMA study area, and how these
overlap in the sub-region and across local authority boundaries. The FEMA
Study concluded that these areas are indicative and should not be interpreted
as being definitive or fixed over time.
Figure 1.1 Functional Economic Markets – Summary Map
Source: NLP analysis, drawing upon a range of sources
1.4 For plan making purposes these relationships were overlaid to give a “best fit”
with local authority boundaries, and three core FEMAs were identified as
summarised in Table 1.1 and Figure 1.2. These FEMA areas encompass those
2 Berkshire Functional Economic Market Area Study, Nathaniel Lichfield & Partners, February 2016.

Eastern Berkshire FEMA : Economic Development Needs Assessment
P2 10758685v8
local authority areas that the evidence indicates consistently have strong inter-
relationships across a range of indicators including economic and sector
characteristics, labour market areas, housing market areas, commercial
property market areas, consumer market areas and transport and connectivity.
Table 1.1 Core Functional Market Areas
Local Authority Area Central Berkshire
FEMA Eastern Berkshire
FEMA Western
Berkshire FEMA
Bracknell Forest
Reading
Slough
West Berkshire
Windsor & Maidenhead3
Wokingham
South Bucks4
Source: NLP analysis
Figure 1.2 Core Functional Economic Market Areas (Best Fit to Local Authority Boundaries)
Source: NLP analysis, drawing on a range of sources
1.5 This second part report focuses on the future economic development needs of
Slough and Windsor & Maidenhead. These are the two Berkshire Authorities
that form the Eastern Berkshire Core FEMA along with South Bucks although
future economic development needs have not been specifically assessed for
South Bucks as it falls outside of the TVBLEP area.
3 Windsor & Maidenhead sits within two FEMAs due to the varied characteristics and economic role associated with different
parts of the Borough. 4 South Bucks is included within the Eastern Berkshire FEMA but future economic development needs have not been
specifically assessed for this local authority as it falls outside of the TVBLEP area.

Eastern Berkshire FEMA : Economic Development Needs Assessment
10758685v8 P3
1.6 Windsor and Maidenhead also forms part of the Central Berkshire Core FEMA
and second part Economic Development Needs Assessment Reports have
also been prepared to assess future economic development needs within the
Central and Western Berkshire FEMAs.
1.7 The evidence from both the ‘FEMA’ and ‘EDNA’ parts of the study will help
inform the basis for the development of economic policies through each local
authority’s future Local Plan processes. Policy formulation will also take a
pragmatic approach that recognises that the boundary of the Core FEMAs are
porous and the particular influence of Heathrow and London.
Spatial Overview
1.8 The Eastern Berkshire FEMA is located within the Eastern part of the Thames
Valley Berkshire LEP area and immediately to the west of London. For the
purposes of this study, the FEMA comprises the two Berkshire Unitary
Authority areas of Slough and Windsor and Maidenhead, as shown in Figure
1.3 below.
Figure 1.3 Spatial Context of Eastern Berkshire FEMA
Source: NLP analysis Note: settlements sized by population
Scope of Assessment
1.9 The purpose of the EDNA is to provide an understanding of the future business
needs and requirements for employment land and floorspace within the defined

Eastern Berkshire FEMA : Economic Development Needs Assessment
P4 10758685v8
Core Eastern Berkshire FEMA (subsequently referred to as the FEMA). This is
specifically considered for the group of B-class sectors outlined below5:
B1 Business (offices (B1a), research & development (B1b), light
industry (B1c));
B2 General Industrial; and
B8 Storage or Distribution (wholesale warehouses, distribution
centres).
1.10 Demand for B-class employment land and floorspace is considered in this
report, and references to “employment space” are intended to mean both these
elements. Industrial space in this report includes both manufacturing and
distribution uses. Economic needs are considered over a 23 year study period
from 2013 to 2036.
1.11 The study also considers forecasts of growth in non B-class sectors to set out
how the overall economy of the FEMA could change in the future, although
does not specifically assess the space implications of these other sectors
because they are planned for using different methodologies and considered by
other forms of technical evidence (such as a retail and leisure assessment).
1.12 It should be noted that there are a variety of factors and drivers to consider
when objectively assessing business needs for local areas. This study utilises
a combination of both quantitative and qualitative analysis to explore these
issues and synthesises these to draw overarching conclusions and
implications. An important consideration for any work of this type is that it is
inevitably a point-in-time assessment. This study has incorporated the latest
data and other evidence available at the time of preparation. The accuracy and
sources of data derived from third party sources has not been checked or
verified by NLP. A glossary of key terms is included at Appendix 2.
1.13 The scope of the study is limited to assessing the need for B-class business
space and land across the FEMA. It does not provide any assessment of the
availability and suitability of land in the area to accommodate employment
development uses either now or in the future.
Study Methodology
1.14 The assessment of future economic development needs involves three stages
as set out in Figure 1.4 below. This takes account of the requirements of the
National Planning Policy Framework (NPPF) and Planning Practice Guidance
(PPG).
5 It should be noted that activities associated with data centres (which represent a key occupier in the FEMA and in Slough in
particular) tend to be included within the Computing & Information Services sector category (data processing, hosting and related activities sub-sector) and therefore most closely align with the B1a/b use class category

Eastern Berkshire FEMA : Economic Development Needs Assessment
10758685v8 P5
Figure 1.4 Economic Development Needs Assessment Outline Methodology
Source: NLP
1.15 In order to ensure that the analysis is based on robust and credible evidence,
extensive consultation has been undertaken as part of the study with key
stakeholders including commercial property agents active in the area,
neighbouring local authorities and other organisations with an interest in
economic development across the wider sub-region.
1.16 This includes consultation undertaken at the beginning of the first part study to
gain feedback on the proposed methodology. A number of responses were
received from key stakeholders to the methodology consultation and a copy of
the methodology consultation questionnaire is included at Appendix 3. A
summary of responses, alongside an overview of how these responses have
been incorporated into the study methodology, is provided in Appendix 4.
1.17 A further consultation exercise was undertaken with stakeholders as part of
Stage C to share and invite feedback on the emerging findings and
conclusions set out in the Draft Report. A summary of the responses to this
exercise, alongside an overview of how these responses have been
incorporated into the final report, is provided in Appendix 6. A copy of the
emerging findings consultation questions is also included in Appendix 5.
1.18 A list of other stakeholders that have been consulted as part of the study is
included at Appendix 7.
Basis of Assessment
1.19 The terms of reference for this study do not require specific consideration of
the potential employment or economic impacts arising from any potential future
expansion of Heathrow Airport but assumes that the Airport continues to

Eastern Berkshire FEMA : Economic Development Needs Assessment
P6 10758685v8
operate at current capacity. Any future policy decisions regarding expansion of
Heathrow Airport may necessitate updates to the analysis and conclusions
contained in this study.
1.20 The arrival of Crossrail, which will reach Reading by 2019, represents a
significant infrastructure project of strategic importance for Berkshire. Analysis
has been previously prepared on the economic benefits associated with the
construction and operation of Crossrail; however the geographical remit of this
analysis does not extend beyond the Greater London boundary. It has
therefore not been possible to incorporate the outputs from this economic
benefits exercise into the Eastern Berkshire EDNA analysis in quantitative
terms; however some more qualitative commentary has been provided.
1.21 It should be noted that throughout the report, a number of different data
sources and datasets have been used to analyse future business needs and
requirements for employment land and floorspace within the defined FEMA.
This means that it is not always possible to make direct comparisons between
these datasets and indicators, particularly across the different constituent local
authority areas.
Structure of the Report
1.22 The remainder of the report is structured as follows:
Overview of Employment Space (Section 2.0) – analysis of the current
stock and trends of employment space across the FEMA in terms of mix
of uses, development rates, gains and losses and age of premises.
Commercial Property Market Signals and Intelligence (Section 3.0) –
a review of the sub-regional commercial property market, including the
supply of and demand for different types of employment space within the
FEMA and the needs of different market segments.
Future Requirements for Employment Space (Section 4.0) –
estimates future employment space requirements for B Class sectors
across the FEMA in quantitative terms, drawing on employment
forecasts, past take-up data and labour supply forecasts.
Policy Implications and Conclusions are identified in Section 5.0.

Eastern Berkshire FEMA : Economic Development Needs Assessment
10758685v8 P7
2.0 Overview of Employment Space
2.1 This section provides an overview of the current stock of B-Use employment
space in the Eastern Berkshire FEMA, while also summarising recent trends
and changes to the supply of this employment space. The amount of
employment land and quantity of built employment floorspace has been
considered across the three main types of employment uses (i.e. offices
[B1a/b], manufacturing [B1c/B2], and warehouse and distribution [B8]). This
analysis uses data from the following sources:
Commercial floorspace data from the ONS and various datasets from the
Valuation Office Agency (VOA);
Monitoring data on commercial space from Slough and Windsor &
Maidenhead Borough Councils; and
EGi Property Link database and other commercial property sources.
Current Stock of Employment Space
2.2 In 2012, the Eastern Berkshire FEMA contained around 2,288,000sq.m of B
class floorspace, the majority (59%) of which is characterised by industrial
(B1c/B2/B8) uses. The total stock of office floorspace6 in the FEMA increased
by 24.2% between 2000 and 2012, which was more than double the rate of
growth (11.9%) achieved across the South East as a whole. Industrial
floorspace decreased by 7.2% over this period, compared with a slight
increase of 1.8% in industrial stock across the region as a whole over the same
12 year period (Figure 2.1).
Figure 2.1 Change in B Class Floorspace in Eastern Berkshire FEMA, 2000 - 2012
Source: VOA Business Floorspace / NLP analysis
6 Defined as commercial office space (i.e. excluding office space occupied by public sector uses)
0
200
400
600
800
1,000
1,200
1,400
1,600
1,800
2000 2001 2002 2003 2004 2005 2006 2007 2008 2009 2010 2011 2012
To
tal F
loo
rsp
ac
e (
00
0's
sq
m)
Offices Industrial
+24.2%
-7.2%

Eastern Berkshire FEMA : Economic Development Needs Assessment
P8 10758685v8
2.3 Within the Eastern Berkshire FEMA, the greatest increase in office floorspace
between 2000 and 2012 was recorded in Slough in both absolute and
percentage terms. This was equivalent to an increase of 37.4%, compared with
11.7% in RBWM over this period (Figure 2.2).
Figure 2.2 Change in Office Floorspace in Eastern Berkshire FEMA, 2000 - 2012
Source: VOA Business Floorspace / NLP analysis
2.4 With regards to industrial floorspace, the overall trend in declining floorspace
recorded across the FEMA is echoed in each individual local authority area,
with RBWM recording the most significant reduction in industrial space
between 2000 and 2012 at 14.7% (Figure 2.3). The rate of decline in industrial
floorspace was slightly lower in Slough at 4.7% (Figure 2.3).
Figure 2.3 Change in Industrial Floorspace in Eastern Berkshire FEMA, 2000 - 2012
Source: VOA Business Floorspace / NLP analysis
300
350
400
450
500
550
2000 2001 2002 2003 2004 2005 2006 2007 2008 2009 2010 2011 2012
To
tal O
ffic
e F
loo
rsp
ace (
000's
sq
m) RBWM Slough
+11.7%
+37.4%
0
200
400
600
800
1,000
1,200
1,400
2000 2001 2002 2003 2004 2005 2006 2007 2008 2009 2010 2011 2012
To
tal In
du
str
ial
Flo
ors
pa
ce (
000
's s
qm
)
RBWM Slough
-4.7%
-14.7%

Eastern Berkshire FEMA : Economic Development Needs Assessment
10758685v8 P9
2.5 A breakdown of the total employment floorspace by uses in 2008 is illustrated
in Figure 2.4, including a comparison with employment space recorded in other
local authority areas surrounding the Eastern Berkshire FEMA.
Figure 2.4 Components of Employment Floorspace by Local Authority, 2008
Source: VOA 20087 / NLP analysis
2.6 This analysis indicates that the supply of employment space within the Eastern
Berkshire FEMA is broadly evenly split between office (B1a/b), factory
(B1c/B2) and warehousing (B8) uses, equivalent to 35%, 32% and 33% of total
stock respectively.
2.7 Within the FEMA, office space is also broadly evenly split between RBWM and
Slough, and this quantum of space is comparable to the nearby local authority
areas of Bracknell Forest, Wokingham and Wycombe (Figure 2.4). LB
Hillingdon stands out as recording the most significant quantum of office
floorspace in the wider sub-region at 795,000sq.m, with Surrey Heath,
Spelthorne and South Bucks recording the smallest total stock of office space.
2.8 From an industrial perspective, Slough accommodates the majority (76%) of
stock in the FEMA. LB Hillingdon represents the only local authority area in the
surrounding sub-region that records a larger stock of industrial space than
Slough, although Wycombe does not fall far behind (Figure 2.4). RBWM’s
stock of industrial space is comparable in scale to adjoining Bracknell Forest,
and is larger than nearby South Bucks, Spelthorne, Surrey Heath and
Runnymede.
7 VOA business floorspace analysis presented in this section draws upon a number of different VOA datasets – although these
have been published at different time periods (2008, 2010 and 2012), they have been used because they each provide the latest available information in a slightly different, albeit complementary, format
0
100
200
300
400
500
600
700
800
900
1,000T
ota
l F
loo
rsp
ace (
000's
sq
m) Offices Factories Warehouses

Eastern Berkshire FEMA : Economic Development Needs Assessment
P10 10758685v8
Spatial Distribution
2.9 The spatial distribution of B class employment floorspace across the Eastern
Berkshire FEMA is shown in Figure 2.5 using the latest available data from the
Valuation Office Agency (VOA). This floorspace data underlines the dominant
role that Slough plays in terms of accommodating B class employment space
in the FEMA, particularly in regards to warehousing and distribution floorspace.
The spatial distribution of offices, factories, workshops and business units tend
to be more evenly dispersed within the FEMA, with Maidenhead also standing
out as a key location for office floorspace outside Slough.
Figure 2.5 Spatial Distribution of B Class Employment Floorspace in the Eastern Berkshire FEMA, 2010
Source: VOA 2010 / NLP analysis
2.10 Outside the more substantial commercial locations of Slough and Maidenhead
in the Eastern Berkshire FEMA, the smaller commercial centres of Windsor,
Ascot and Sunninghill also accommodate a reasonable share of the floorspace
in the FEMA. However this B class employment floorspace tends to be much
smaller in scale compared to those premises supported in Slough and
Maidenhead.
2.11 Individual and more detailed VOA maps illustrating the spatial distribution of B
class employment floorspace in each of the local authorities forming the
Eastern Berkshire FEMA is included in Appendix 8.

Eastern Berkshire FEMA : Economic Development Needs Assessment
10758685v8 P11
2.12 Drawing upon Inter-Departmental Business Register (IDBR) data, the spatial
distribution of businesses in the Eastern Berkshire FEMA that operate within B
class sectors can also be illustrated (Figure 2.6). This analysis underscores
that the largest cluster of B class businesses in the FEMA are found in Slough
and Maidenhead, while smaller clusters of business are located in and around
Windsor, Ascot and Sunninghill.
Figure 2.6 Spatial Distribution of B Class Employment in the Eastern Berkshire FEMA, 2014
Source: IDBR / NLP analysis
Note: IDBR data does not record smaller businesses that fall under the VAT threshold.
2.13 The IDBR data also indicates that Slough supports substantial clusters of
industrial sectors in the Eastern Berkshire FEMA. In particular, the eastern part
of the Borough accommodates a concentration of wholesale and transport
businesses that are attracted to the location by the close proximity to Heathrow
Airport. In addition, the western part of the Borough accommodates a
significant cluster of manufacturing businesses in the FEMA, with the majority
of these businesses operating in and around Slough Trading Estate.
2.14 The office based sectors of professional services, finance & insurance, and
information & communication also tend to be most strongly concentrated in the
main commercial centres of Slough and Maidenhead. However the IDBR data
also indicates a number of larger professional services businesses are located
across the FEMA in smaller commercial locations.
2.15 Individual IDBR maps showing the spatial distribution of all businesses located
in each of the local authorities forming the Eastern Berkshire FEMA is included
in Appendix 9.
Eastern Berkshire FEMA : Economic Development Needs Assessment
P12 10758685v8
Slough Development Rates
Gross Completions
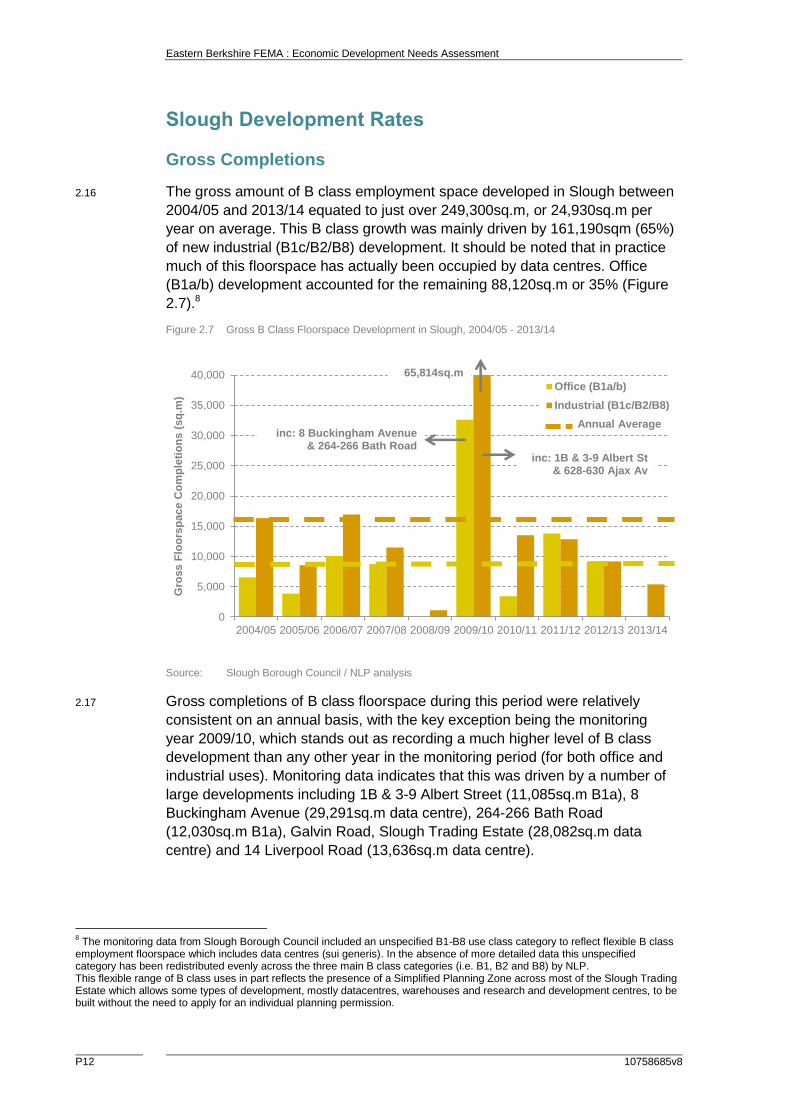
2.16 The gross amount of B class employment space developed in Slough between
2004/05 and 2013/14 equated to just over 249,300sq.m, or 24,930sq.m per
year on average. This B class growth was mainly driven by 161,190sqm (65%)
of new industrial (B1c/B2/B8) development. It should be noted that in practice
much of this floorspace has actually been occupied by data centres. Office
(B1a/b) development accounted for the remaining 88,120sq.m or 35% (Figure
2.7).8
Figure 2.7 Gross B Class Floorspace Development in Slough, 2004/05 - 2013/14
Source: Slough Borough Council / NLP analysis
2.17 Gross completions of B class floorspace during this period were relatively
consistent on an annual basis, with the key exception being the monitoring
year 2009/10, which stands out as recording a much higher level of B class
development than any other year in the monitoring period (for both office and
industrial uses). Monitoring data indicates that this was driven by a number of
large developments including 1B & 3-9 Albert Street (11,085sq.m B1a), 8
Buckingham Avenue (29,291sq.m data centre), 264-266 Bath Road
(12,030sq.m B1a), Galvin Road, Slough Trading Estate (28,082sq.m data
centre) and 14 Liverpool Road (13,636sq.m data centre).
8 The monitoring data from Slough Borough Council included an unspecified B1-B8 use class category to reflect flexible B class
employment floorspace which includes data centres (sui generis). In the absence of more detailed data this unspecified category has been redistributed evenly across the three main B class categories (i.e. B1, B2 and B8) by NLP. This flexible range of B class uses in part reflects the presence of a Simplified Planning Zone across most of the Slough Trading Estate which allows some types of development, mostly datacentres, warehouses and research and development centres, to be built without the need to apply for an individual planning permission.
0
5,000
10,000
15,000
20,000
25,000
30,000
35,000
40,000
2004/05 2005/06 2006/07 2007/08 2008/09 2009/10 2010/11 2011/12 2012/13 2013/14
Gro
ss F
loo
rsp
ac
e C
om
ple
tio
ns
(s
q.m
)
Office (B1a/b)
Industrial (B1c/B2/B8)
Annual Average
65,814sq.m
inc: 1B & 3-9 Albert St& 628-630 Ajax Av
inc: 8 Buckingham Avenue & 264-266 Bath Road
Eastern Berkshire FEMA : Economic Development Needs Assessment
10758685v8 P13
Losses of Employment Space
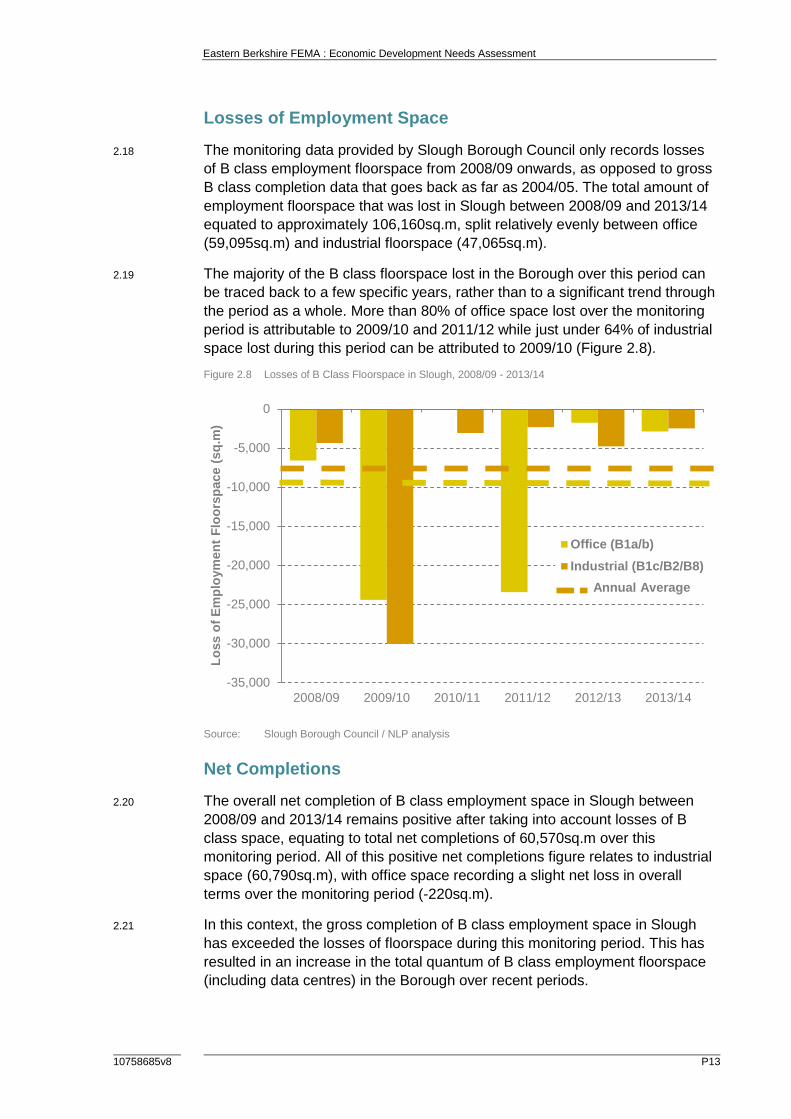
2.18 The monitoring data provided by Slough Borough Council only records losses
of B class employment floorspace from 2008/09 onwards, as opposed to gross
B class completion data that goes back as far as 2004/05. The total amount of
employment floorspace that was lost in Slough between 2008/09 and 2013/14
equated to approximately 106,160sq.m, split relatively evenly between office
(59,095sq.m) and industrial floorspace (47,065sq.m).
2.19 The majority of the B class floorspace lost in the Borough over this period can
be traced back to a few specific years, rather than to a significant trend through
the period as a whole. More than 80% of office space lost over the monitoring
period is attributable to 2009/10 and 2011/12 while just under 64% of industrial
space lost during this period can be attributed to 2009/10 (Figure 2.8).
Figure 2.8 Losses of B Class Floorspace in Slough, 2008/09 - 2013/14
Source: Slough Borough Council / NLP analysis
Net Completions
2.20 The overall net completion of B class employment space in Slough between
2008/09 and 2013/14 remains positive after taking into account losses of B
class space, equating to total net completions of 60,570sq.m over this
monitoring period. All of this positive net completions figure relates to industrial
space (60,790sq.m), with office space recording a slight net loss in overall
terms over the monitoring period (-220sq.m).
2.21 In this context, the gross completion of B class employment space in Slough
has exceeded the losses of floorspace during this monitoring period. This has
resulted in an increase in the total quantum of B class employment floorspace
(including data centres) in the Borough over recent periods.
-35,000
-30,000
-25,000
-20,000
-15,000
-10,000
-5,000
0
2008/09 2009/10 2010/11 2011/12 2012/13 2013/14
Lo
ss o
f E
mp
loym
en
t F
loo
rsp
ace (
sq
.m)
Office (B1a/b)
Industrial (B1c/B2/B8)
Annual Average

Eastern Berkshire FEMA : Economic Development Needs Assessment
P14 10758685v8
Windsor & Maidenhead Development Rates
Gross Completions
2.22 The gross quantum of B class employment space developed within Windsor &
Maidenhead between 2005/06 and 2014/15 equated to a total of 151,230sq.m,
which is equivalent to an annual average gross completion of 15,120sq.m
during this period. More than 70% of the total gross employment floorspace
developed in Windsor & Maidenhead through this period related to office uses
(106,170sq.m), whilst a total of 45,060sq.m of industrial space was developed
in the Borough over this monitoring period (Figure 2.9).9
Figure 2.9 Gross B Class Floorspace Development in Windsor & Maidenhead, 2005/06 - 2014/15
Source: Royal Borough of Windsor & Maidenhead / NLP analysis
2.23 The majority of the gross office space developed in Windsor & Maidenhead
took place between 2007/08 and 2010/11 representing about 78% of the total
office development during the monitoring period. As shown in Figure 2.9, the
most significant years of gross office completions in the Borough occurred in
2007/08 and 2008/09, when large developments of B1 space was undertaken
at Norreys Drive in Vanwall Business Park (18,380sq.m), Unit 6-16 Clivemont
Road (8,750sq.m), Horizon office building (8,350sq.m), and Former Nupetra
site on Lyndhurst Road. Similarly, more than two thirds of the industrial space
developed in Windsor & Maidenhead over the monitoring period occurred in
2006/07, 2008/09 and 2014/15.
9 The monitoring data from the Royal Borough of Windsor & Maidenhead did not disaggregate the B1 use class category by
B1a, B1b and B1c uses between 2005/06 and 2010/11, but did make the distinction from 2011/12 onwards. In the absence of more detailed data, the B1 use class category used between 2005/06 and 2010/11 has been assumed to relate to office uses (i.e. B1a and B1b) by NLP.
-
5,000
10,000
15,000
20,000
25,000
30,000
2005/06 2006/07 2007/08 2008/09 2009/10 2010/11 2011/12 2012/13 2013/14 2014/15
Gro
ss F
loo
rsp
ace C
om
ple
tio
ns
(sq
.m)
Office (B1/B1a/B1b)
Industrial (B2/B8)
Annual Average
Inc. New B1 Space at Vanwall Business Park
Inc. New B1 Space at:
- Clivemont Rd
- Horizon Office
- Lyndhurst Rd

Eastern Berkshire FEMA : Economic Development Needs Assessment
10758685v8 P15
Losses of Employment Space
2.24 Between 2005/06 and 2014/15, a total of 174,040sq.m of B class employment
floorspace was lost to other B class and non B class uses in the Borough. This
loss of employment space in Windsor & Maidenhead mostly related to losses
of office floorspace, which accounted for around 67% of total losses during the
monitoring period, while about 56,640sq.m of industrial floorspace was lost in
the Borough during this period.
2.25 As shown in Figure 2.10, the losses of B class employment space in Windsor &
Maidenhead during this period have been relatively balanced across the years.
The most significant losses of employment floorspace during this period was in
2006/07, 2008/09 and 2013/14, which accounted for just over 45% of the total
losses of employment space in the Borough over the monitoring period.
Figure 2.10 Losses of B Class Floorspace in Windsor & Maidenhead, 2005/06 - 2014/15
Source: Royal Borough of Windsor & Maidenhead / NLP analysis
Net Completions
2.26 After taking account the recorded losses of employment floorspace in Windsor
& Maidenhead, the net completions of B class floorspace in the Borough was
negative during the period 2005/06 to 2014/15. The net completions of B class
employment space in the Borough equated to a total loss of 22,810sq.m over
this period, with the net floorspace losses evenly distributed across office uses
(loss of 11,230sq.m) and industrial uses (loss of 11,580sq.m).
2.27 In this context, the losses of B class employment floorspace in Windsor &
Maidenhead has exceeded the gross completion of floorspace over this period.
This has resulted in a gradually decreasing stock of B class employment space
in the Borough over recent periods.
-30,000
-25,000
-20,000
-15,000
-10,000
-5,000
-
2005/06 2006/07 2007/08 2008/09 2009/10 2010/11 2011/12 2012/13 2013/14 2014/15
Lo
sses o
f E
mp
loym
en
t F
loo
rsp
ace (
sq
.m)
Office (B1/B1a/B1b)
Industrial (B2/B8)
Annual Average

Eastern Berkshire FEMA : Economic Development Needs Assessment
P16 10758685v8
Impact of Permitted Development Rights
2.28 In 2013, the Government announced the proposed introduction of Permitted
Development Rights (PDR) to allow for the change of use from B1a offices to
residential uses without the need to acquire planning permission from the local
planning authority. The Government has now made these PDR permanent. In
this context, PDR is expected to increase the rate of losses of office
floorspace, potentially above historic rates of floorspace losses.
2.29 An analysis of monitoring data from Slough Borough Council and the Royal
Borough of Windsor & Maidenhead indicates 12 prior approval applications for
a change of use from office to residential uses have been completed in the
Eastern Berkshire FEMA since May 2013. These developments have resulted
in an additional 74 residential units in the FEMA, including 38 units in Slough
and 36 units in Windsor & Maidenhead (Table 2.1).
Table 2.1 Summary of Permitted Development Right Completions in the Eastern Berkshire FEMA
Area PDR
Completions
Losses of Office Floorspace (sq.m) New
Homes Total
% of Stock in the Borough
Slough 5 1,900 0.4% 38
Windsor & Maidenhead 7 2,410 0.6% 36
Eastern Berkshire FEMA 12 4,310 0.5% 74
Source: Slough Borough Council / Royal Borough of Windsor & Maidenhead / NLP analysis
Note: The total stock of office floorspace in the Eastern Berkshire FEMA is based on latest available Valuation Office Agency (VOA) data in 2012.
2.30 Using monitoring data provided by Slough Borough Council and the Royal
Borough of Windsor & Maidenhead, as well as historic VOA data, it is possible
to estimate that these 12 prior approval applications have resulted in a loss of
4,310sq.m of office space in the Eastern Berkshire FEMA, which is equivalent
to a negligible loss of 0.5% of the total stock in the FEMA in 2012 (Table 2.1).
2.31 The average loss of office floorspace in the Eastern Berkshire FEMA equates
to about 360sq.m, which includes an average office floorspace loss of 380sq.m
in Slough and 340sq.m in Windsor & Maidenhead. The majority of the PDR
completions undertaken in the FEMA thus far have therefore related to smaller
office premises, although this trend in the FEMA could change in the future.
2.32 The introduction of PDR is expected to have a significant effect on the supply
of office floorspace in local authorities across the UK, particularly in those local
authorities with the highest residential land value and pressure on lower value
uses (e.g. office floorspace). With PDR now confirmed as permanent, it will be
necessary for Slough Borough Council and the Royal Borough of Windsor &
Maidenhead to carefully monitor future losses of office floorspace to determine
whether additional provision becomes necessary over and above the
requirements set out in Section 4.0.

Eastern Berkshire FEMA : Economic Development Needs Assessment
10758685v8 P17
2.33 Anecdotal feedback from Slough Borough Council indicates that a significant
number of PDR office to residential conversions are anticipated to be
completed within the Borough over the coming months and this is expected to
significantly accelerate the scale of office floorspace losses associated with
this policy within Slough over and above the scale of losses reported above,
over the short term at least.
Summary
2.34 The majority of the existing stock of B class employment space in the Eastern
Berkshire FEMA is characterised by industrial uses, accounting for about 59%
of the total stock within the FEMA. Between 2000 and 2012 the stock of office
space in the FEMA increased by 24.2%, which was more than double the rate
in the South East as a whole, while the stock of industrial space decreased by
7.2%. The most significant growth in office floorspace during the period was in
Slough, while the declining trend in industrial floorspace was evident in both
Slough and Windsor & Maidenhead. The stock of office space in the Eastern
Berkshire FEMA is also relatively evenly split between the two local authorities
although Slough does support the majority of the industrial space in the FEMA.
2.35 The spatial distribution of B class employment space in the Eastern Berkshire
FEMA emphasises the substantial role that Slough plays in terms of supporting
employment floorspace, particularly in regards to warehousing and distribution
floorspace in the eastern part of the Borough, and manufacturing floorspace in
the western part of the Borough. The stock of office floorspace in the FEMA
tends to be more dispersed compared to industrial floorspace, although Slough
and Windsor & Maidenhead do support sizeable clusters of office based firms.
Outside the more significant commercial centres of Slough and Maidenhead,
the smaller commercial locations of Windsor, Ascot and Sunninghill also
accommodate a share of B class floorspace in the FEMA.
2.36 Both Slough and Windsor & Maidenhead have registered reasonable levels of
new development during recent periods, driven by industrial/data centre uses
in Slough and office uses in Windsor & Maidenhead and driven by a small
number of large developments. At the same time, a relatively significant
amount of B class floorspace has been lost within the Eastern Berkshire FEMA
during recent periods, with most of these losses relating to office floorspace. In
this context, the analysis indicated that Slough has been gaining B class space
over recent periods with positive net completions of industrial/data centre uses,
while Windsor & Maidenhead has been losing B class space with negative net
completions of both office and industrial uses.
2.37 The recent introduction of Permitted Development Rights (PDR) for change of
use from office to residential uses has also started to have an effect within the
Eastern Berkshire FEMA, with monitoring data from Slough Borough Council
and Royal Borough of Windsor & Maidenhead indicating that 12 prior approval
applications have been completed within the FEMA thus far. These completed
prior approval applications have resulted in a loss of 4,310sq.m of office space
in the Eastern Berkshire FEMA, including 1,900sq.m in Slough and 2,410sq.m

Eastern Berkshire FEMA : Economic Development Needs Assessment
P18 10758685v8
in Windsor & Maidenhead. Although the loss of office floorspace as a result of
PDR completions has been relatively low to date, it will be important for the
Councils to continue to monitor future losses to determine whether any
additional provision becomes necessary. Over the short term, the scale of
office floorspace losses associated with PDR is expected to significantly
accelerate over the coming months in Slough as a number of prior approvals
are due to be implemented.

Eastern Berkshire FEMA : Economic Development Needs Assessment
10758685v8 P19
3.0 Commercial Property Market Signals and
Intelligence
3.1 This section provides an overview of the commercial property market in the
Eastern Berkshire FEMA, including recent trends in demand and supply. The
findings are mainly based on discussions with a number of commercial
property agents currently active in the FEMA and wider sub-region (see
Appendix 7) and where appropriate this has been supplemented with
information derived from a number of sources including commercial property
availability databases and published reports.
UK Property Market Overview
3.2 The UK economic recovery, which began in 2013, has now become firmly
entrenched, and sentiment in commercial property appears to be the most
positive it has been for many years. Improvements in market conditions have
been supported by the greater availability of real estate debt and equity
finance, occupier demand is steadily increasing, and generally rents and
capital values are broadly stable.
3.3 While central London offices are still the outperforming market segment, some
investors and developers are also looking further afield in an attempt to access
stock and achieve good returns. However, much of this activity is focusing on
the best performing locations in the South East or major provincial cities. In
more economically marginal locations, and those without a significant existing
commercial property market, there is still uncertainty and lenders and
developers are likely to remain cautious.
3.4 It should be noted that property market intelligence collated and presented
within this EDNA report pre-dates the outcome of the UK referendum on
membership of the European Union (EU) in June 2016, and therefore does not
give specific consideration for how the timing and basis for the UK’s future exit
from the EU could impact upon national or sub-regional commercial property
market dynamics.
Market Geography
Sub Regional Geography
3.5 At a sub-regional level, the major commercial property markets are spread
geographically along the M3 and M4 corridors with strong functional linkages to
Heathrow airport and the outer west London boroughs. These market corridors
can be collectively referred to as the Western Corridor and comprise a number
of significant commercial centres including Reading, Slough, Newbury and
Basingstoke.

Eastern Berkshire FEMA : Economic Development Needs Assessment
P20 10758685v8
3.6 The Western corridor is a high value area for offices, attracting some of the
highest rents within the South East. Research undertaken by CBRE10 notes
that the rental values seen in the dominant centres of the Western Corridor
(such as Maidenhead, Reading, Slough and Bracknell) suggest that these
locations are equally attractive to occupiers and this reflects the general trend
of M4 corridor towns commanding higher office rental values than the towns
along the M3, mirroring the greater attractiveness of this section of the market
to a wider range of occupiers.
3.7 The area also contains a significant concentration of industrial centres and
markets, predominantly influenced by the good transport links offered by the
M3/M4/M25 and proximity to Central London. Key Western Corridor industrial
locations include Reading, Basingstoke, Slough, High Wycombe and Newbury.
3.8 Recent market intelligence11 suggests that the trend of decentralisation from
Central London is expected to continue over the coming months as rental and
business rates growth reach record levels in the Capital and occupiers look to
cut their real estate costs. The IT sector is expected to drive this trend, with the
Thames Valley set to benefit from its highly skilled workforce in this respect.
Recent examples of office occupiers decentralising from central London
include Maersk who recently relocated their entire IT office function to
Maidenhead and the relocation of Hammerson’s back office support functions
from Mayfair to Aquis House in Reading in 2014.
3.9 Within the Western Corridor, it is possible to identify a number of specific sub
market areas, each sharing similar characteristics and trends and with a high
degree of interaction occurring within these component submarkets. These are
presented and illustrated within the Berkshire FEMA study Part One, and are
summarised below.
iv Core Thames Valley: The Core Thames Valley or ‘Upper M4’ area
focuses on the key M4 markets of Reading, Maidenhead, Bracknell and
Wokingham, and reflects the close correspondence between these towns
in terms of value, accessibility and labour force, and the area’s status as
the centre of the technology-driven business park market west of London.
Over the coming years, Reading and Maidenhead are expected to remain
the main foci for office demand, with Reading the main industrial centre.
v Thames Valley West: The Thames Valley West area constitutes the key
node at the western end of the M4 corridor. The distinction of this area
from the western corridor sub-region reflects the lower value profile in
both office and industrial markets than the M4 markets closer to London,
the quasi-industrial character of much of demand, and the linkages that
exist with areas beyond the western boundary of the South East region
towards the Swindon and Bristol area.
vi Heathrow-Slough-High Wycombe: this sub area effectively represents
the eastern end of the Thames Valley market and, in overlapping
10
CBRE, South East Regional Property Market Study, March 2007 (Note: Although this study is now a few years old, its key
conclusions on broad property market characteristics are still considered to be relevant) 11
Savills World Research, Greater London & South East Offices, Spotlight: How far are occupiers moving? January 2016

Eastern Berkshire FEMA : Economic Development Needs Assessment
10758685v8 P21
significantly with the London area, acknowledges the pervasive influence
of Heathrow Airport. While there are clear linkages with the Core Thames
Valley and little difference in terms of typical values, the industrial and
quasi-industrial character of demand in the two main markets of Slough
and High Wycombe provides a key measure of differentiation.
Figure 3.1 Functional Commercial Property Market Areas – Summary Map
Source: Berkshire Functional Economic Market Area Study, NLP February 2016
Eastern Berkshire FEMA
3.10 Within the context of these overarching commercial property sub market areas,
the Eastern Berkshire FEMA most closely aligns with the ‘Heathrow-Slough-
High Wycombe’ geography or market area with some degree of overlap with
the ‘Core Thames Valley’ market area with respect to the centres of
Maidenhead and Windsor. From a best fit to local authority boundary
perspective, the FEMA comprises two local authority areas, each of which is
considered in turn below.
Slough
3.11 Slough represents a significant commercial centre within the Western Corridor,
and accommodates the largest stock of industrial space in the Thames Valley.
A recent study undertaken on behalf of Slough Borough Council12 identifies the
Slough Trading Estate in particular as being a key asset for the Thames Valley
as a whole, as well as Slough. The Borough has a significant strength in the
logistics sector, in part due to its strategic location between the M4, M25 and
Heathrow Airport. It is home to the headquarters of a number of large,
multinational companies across a broad array of sectors.
12
Slough Business Focus Study & Strategic Response, Regeneris, May 2015

Eastern Berkshire FEMA : Economic Development Needs Assessment
P22 10758685v8
Industrial
3.12 Slough is one of the strongest performing industrial locations in the Thames
Valley and continues to attract strong levels of demand and development
activity. Demand tends to be fairly localised, with many requirements coming
from firms that are already based in or near to Slough. Requirements for larger
industrial premises tend to originate from a wider geographical area of search.
A key occupier requirement is for good yard space and security.
3.13 Local commercial property agents report strong levels of demand across all
size ranges, typically grouped into: sub 10,000sqft; 10,000-25,000sqft; and
40,000sqft and above. Particular gaps are reported in supply at the smaller end
of the size range (partly due to the lower amount of stock falling within this size
range), and also at the upper end with Slough generally unable to satisfy
requirements for industrial accommodation exceeding 40,000sq.ft in size.
These requirements tend to be displaced to nearby Reading or Heathrow
(depending upon the occupier).
3.14 The Trading Estate commands a premium in terms of rents over other Thames
Valley locations and these remain on a par or slightly cheaper than Heathrow
locations (see Table 3.1).
3.15 A reasonable supply of new industrial space has been completed over recent
years in Slough and the majority of industrial accommodation at the Trading
Estate is therefore modern and of a generally good quality. As the market has
improved older industrial stock has gradually been redeveloped and
speculative development has been coming forward and taken up very quickly.
A recent example of this is a new terrace development at 255-258 Ipswich
Road comprising of four production/warehouse units benefitting from a high
specification, with a shared yard and offices on the first floor. This development
is reported to have been fast-tracked by the estate’s Simplified Planning Zone
status which enables the fast and flexible construction of new buildings and
flexibility within and across B use classes on the Estate.
3.16 The pace of new industrial development in recent years has been overtaken by
strong levels of occupier demand, to the extent that there is reported to be a
record low level of vacancy amongst existing industrial property. Beyond the
ongoing piecemeal redevelopment by Segro of existing premises and sites,
local commercial agents consider there to be limited scope for intensification of
the site to accommodate more development in future, partly due to the
occupier requirement for lower density yard space and associated facilities on
site.
Offices
3.17 Slough accommodates a reasonably large office market which is reported to be
performing reasonably well in the current climate. It attracts a range of small,
medium and large office occupiers although the majority of the demand spans
the 15,000sq.ft (1,400sq.m) to 20,000sq.ft (1,900sq.m) floorspace range.
Eastern Berkshire FEMA : Economic Development Needs Assessment
10758685v8 P23
3.18 Following the economic downturn a few years ago, the Slough office market
has been characterised by relatively high levels of office floorspace vacancy
and whilst this has been reducing over the last couple of years as demand has
picked up, the vacancy rate is still reported to be reasonably high at around
20%. This means there is plenty of available floorspace in the market to meet
occupier needs over the short term.
3.19 The key gap in the market however is the supply of top quality Grade A office
space which is reported to be in short supply, as occupiers are increasingly
seeking high quality premises for which the Thames Valley is known for. The
current supply of office space in Slough is noted by the 2015 Business Focus
Study as consisting of a relatively high amount of Grade B and C stock; by
comparison, Reading has a large amount of prime, Grade A stock, which
means that Slough has historically struggled to attract higher value office
occupiers.
3.20 As the office demand/supply balance has tightened in Slough over recent
years, prime rental levels have been rising and are now reaching up to £27sqft
(£290sq.m) for the best quality space. This offers a cost advantage over
nearby Reading and Maidenhead as well as West London locations such as
Stockley Park and Chiswick (Table 3.1).
3.21 Despite these relatively low office rental values and the relatively high
availability of vacant office space on the market, speculative office
development is occurring within Slough. This includes the 115,000sq.ft
(10,700sq.m) Porter building opposite Slough station which is expected to be
delivered in mid-2017, 350,000sq.ft (32,500sq.m) of office space across three
buildings known as Brunel Place (next to the bus station) and a three storey
75,000sqft (7,000sq.m) refurbishment at 234 Bath Road. These ‘step change’
developments will all provide Grade A office floorspace to meet the gap in the
market for this top end space in Slough, and are reported to be targeting large
occupiers and the Western Corridor office market. The arrival of Crossrail in
2019 and the enhanced connectivity that this will provide also represents a key
driver behind this speculative development, a trend which can also be seen
further along the line in Maidenhead and Reading.

Eastern Berkshire FEMA : Economic Development Needs Assessment
P24 10758685v8
Table 3.1 Commercial Property Rents in Eastern Berkshire FEMA and Comparator locations
Location Industrial Rent Office Rent
Sqft Sq.m Sqft Sq.m
Slough £9 - £12.50 £97 - £135 £17 - £27 £183 - £290
Maidenhead £8 - £11 £86 - £118 £19 - £34 £205 - £366
Windsor £8.50 £91 £24 - £32 £258 - £344
Bracknell £9 - £10 £97 - £108 £16 - £24 £172 - £258
Reading £7.50 - £11 £80 - £120 £18 - £33 £194 – £355
Wokingham (local market)
£6.25 £67 £15 - £20 £161 - £215
Basingstoke £6 - £8 £65 - £86 £12 - £17 £129 - £183
Newbury £7 - £8.50 £75 - £91 £15 - £25 £161 - £269
High Wycombe £8 - £10 £86 - £108 £17 - £22 £183 - £237
Hounslow £9 - £12.50 £97 - £135 £14 - £21 £151 - £226
Heathrow £11 - £15 £118 - £161 £18 - £23 £194 - £248
Stockley Park n/a n/a £27 - £32 £183 - £344
Staines £8 - £12 £86 - £129 £22 - £33 £237 - £355
Brentford £8.50 - £12 £91 - £129 £20 - £27 £215 - £290
Chiswick n/a n/a £30 - £50 £323 - £538
Source: EGi Property Link / Colliers Rents Map 2016 / Consultation with local commercial property agents
3.22 The recent introduction of Permitted Development (PD) rights for change of
use from office to residential has had a strong impact on the local office market
in Slough, with around 40 office sites reported to have received prior approval
for residential conversions. These conversions have generally involved the loss
of poor quality, obsolete office stock within Slough Town Centre that doesn’t
meet modern occupier requirements. In this respect, it has had a positive effect
on the local office market by removing this redundant stock from the supply
and boosting the occupier profile of Slough, although it is anticipated that the
rate of conversions may slow down over the coming months, once the
immediate pipeline of conversions are completed and once the remaining
poorer quality stock (which had initially represented a prime candidate for
conversion) has been taken out of the portfolio.
Windsor & Maidenhead
3.23 The Borough’s main attractions for businesses are its generally pleasant towns
and quality of life factors, its good transport accessibility, both to the M4 and
rail links to London, reasonable proximity to Heathrow Airport and a pool of
highly skilled workers. Existing concentrations of firms in the IT,
telecommunications and pharmaceutical sectors attract other companies in
those sectors whilst reasonable access to the universities at Oxford and
Reading is also seen as an important factor.
3.24 The Borough’s two main towns comprise distinct areas for the commercial
property market. Windsor is a niche location, attractive to certain higher value
firms seeking a prestige, heritage location and does not compete with other
nearby areas. In contrast, Maidenhead is part of the wider M4 / Thames Valley

Eastern Berkshire FEMA : Economic Development Needs Assessment
10758685v8 P25
property market to a greater extent, with a degree of competition with
Bracknell, Slough and Reading, but with most demand coming from a more
local area within 5-10 miles. In general, both towns are perceived to be office
locations with the industrial market being much smaller.
Offices
3.25 The office market in the Borough comprises both town centre and out of town
provision, with the town centres of Windsor and Maidenhead representing the
preferred locations for many occupiers due to their good public transport
accessibility (particularly Maidenhead, which benefits from frequent and fast
rail links to London and the Capital’s workforce). However, the high reliance of
the local workforce on car transport means that out-of centre and business
park locations with good parking ratios are preferred by some firms, with
significant out-of-centre office clusters (e.g. Norreys Drive, Maidenhead) and
purpose-built business parks (e.g. Foundation Park, Maidenhead Office Park,
Vanwall Business Park). Windsor has less of this type of supply although the
Centrica offices on Maidenhead Road are an exception to this.
3.26 In Windsor, the heritage constraints mean most demand is for smaller
premises. The Sunningdale/Ascot area generally has a lower level of office
supply and is seen as a more niche market. The area contains some larger
buildings, often on former institutional sites such as the Imperial College
Science Park. In addition there is one larger estate – Ascot Business Park –
which contains high quality office and industrial space although much of the
supply in this area is from smaller converted buildings.
3.27 Maidenhead competes with other large, established office centres in the
Thames Valley such as Reading and Bracknell in terms of office firms,
although the town’s well-established IT, telecommunication and
pharmaceutical clusters mean that many potential occupiers specifically want
to locate in the town. In addition, the Borough has other advantages over these
competing locations such as Reading’s greater distance from Heathrow and
the perception of Slough as an unattractive (albeit improving) centre.
3.28 The office market in Maidenhead is generally strong and characterised by good
levels of demand. The majority of enquires for office floorspace fall between
10,000sq.ft (930sq.m) and 20,000sq.ft (1,900sq.m) in size and large enquiries
over this threshold are received from time to time. Prime rental levels in
Maidenhead vary across town centre (typically around £37.50sq.ft/ £404sq.m)
and out-of-centre (typically between £25sq.ft (£269sq.m) and £28sq.ft
(£301sq.m)) locations. The premium for space in Maidenhead town centre
reflects the connectivity benefits of this location compared to the out-of-centre
office locations which are more reliant upon private car access and therefore
draw upon a smaller pool of more localised labour.
3.29 Maidenhead represents one of very few locations within the Thames Valley
(alongside Reading and Slough) that are currently attracting new speculative
office development, reflecting its strengths as an office centre, profile as a
premium Thames Valley office location and investor confidence off the back of

Eastern Berkshire FEMA : Economic Development Needs Assessment
P26 10758685v8
infrastructure enhancements associated with Crossrail (due to arrive into
Maidenhead in 2019) and the Western Rail Link to Heathrow (expected to be
completed by the mid-2020s). This includes the Pearce Building to the north of
the town centre which offers 50,000sqft (4,600sq.m) of flexible Grade A office
space spread over seven floors. Speculative refurbishment of office space is
also taking place in Maidenhead, an example of which includes the
100,000sq.ft (9,300sq.m) refurbishment of 25 Windsor Road (previously
Observatory House).
Industrial
3.30 In general, the Borough is not perceived as a particularly strong industrial
location due to its lack of supply, development constraints, nearby competitors
such as Slough Trading Estate and high labour costs. Accordingly, the market
is localised with demand mainly for smaller industrial units typically up to 5,000
sqft (460sq.m) in size, driven by the expansion or relocation needs of local
firms, with very few firms moving in from outside of RBWM. Warehousing
premises also characterises the majority of demand for industrial space,
although again this relates to small scale space rather than strategic
distribution uses.
3.31 The supply of industrial premises is low, with a mix of premises in terms of age
across a range of industrial estates which are mainly fully developed. There is
relatively little modern space as low rents tend to make new development
unviable and there has been very little new space provided. There are a few
examples of older industrial buildings being re-clad and divided into smaller
units for flexible industrial/office uses but low rents again deter this happening
widely. Vacancy levels for industrial units are low in Maidenhead and very low
in Windsor, where there is little space.
3.32 As shown in Table 3.1, industrial rents in Maidenhead are comparable to those
of nearby centres, but higher than Reading, while Windsor offers relatively
competitive rents (albeit with limited supply).
Summary
3.33 At a sub-regional level, commercial property markets areas are centred on the
M3 and M4 strategic corridors, driven by strong functional economic linkages
to Heathrow airport and the outer west London Boroughs. These market areas
are collectively referred to as the Western Corridor and comprise a number of
sub market areas, each sharing a number of similar characteristics and trends.
3.34 The Eastern Berkshire FEMA most closely aligns with the ‘Heathrow-Slough-
High Wycombe’ sub market area which effectively represents the eastern end
of the Thames Valley market with a distinctive industrial and quasi-industrial
character. There is also some degree of overlap with the ‘Core Thames Valley’
market area focused on the key M4 markets of Reading, Maidenhead,
Bracknell and Wokingham, with strong economic relationships between these
towns in terms of value, accessibility and labour force.

Eastern Berkshire FEMA : Economic Development Needs Assessment
10758685v8 P27
3.35 Slough represents a significant commercial centre within the Western Corridor,
and accommodates the largest stock of industrial space in the Thames Valley.
Its office market is performing reasonably well but is still characterised by high
levels of office vacancy. Despite this, new speculative office development is
starting to occur in and around the town centre, driven by the lack of Grade A
office space, the arrival of Crossrail in 2019 and specifically targeting the
Western Corridor corporate office market.
3.36 RBWM’s main attractions for businesses are its generally pleasant towns and
quality of life factors, its good transport accessibility, both to the M4 and rail
links to London, reasonable proximity to Heathrow Airport and a pool of highly
skilled workers. The Borough’s two main towns comprise distinct areas for the
commercial property market. Windsor is a niche location, attractive to certain
higher value firms seeking a prestige, heritage location and does not compete
with other nearby areas. In contrast, Maidenhead is part of the wider M4 /
Thames Valley property market to a greater extent, with a degree of
competition with Bracknell, Slough and Reading.
3.37 Maidenhead represents one of very few locations within the Thames Valley
(alongside Reading and Slough) that are currently attracting new speculative
office development, reflecting its strengths as an office centre, profile as a
premium Thames Valley office location and investor confidence off the back of
infrastructure enhancements associated with Crossrail.
3.38 In general, RBWM is not perceived as a particularly strong industrial location
due to its lack of supply, development constraints, nearby competitors such as
Slough Trading Estate and high labour costs. Accordingly, the market is
localised with demand mainly for smaller industrial units and limited new
development has occurred in recent years meaning that existing supply is
relatively dated.
Eastern Berkshire FEMA : Economic Development Needs Assessment
P28 10758685v8
4.0 Future Requirements for Employment Space
4.1 This section considers future economic growth needs in the Eastern Berkshire
FEMA by drawing on several methodologies that are guided by the PPG.
These scenarios are used to inform the assessment of future employment land
needs for office and industrial (i.e. manufacturing and distribution) uses within
the FEMA.
Methodology
4.2 The NPPF requires local authorities to “set out a clear economic vision and
strategy for their area which positively and proactively encourages sustainable
economic growth” [paragraph 21]. Considering this in evidence base terms,
this should be underpinned by a “clear understanding of business needs within
the economic markets operating in and across their area” [paragraph 160].
4.3 In this context, a number of potential future economic scenarios have been
developed through this study to provide a framework for considering the future
economic growth needs and B class employment space requirements in the
Eastern Berkshire FEMA during the 23 year period 2013 to 2036. These
scenarios reflect the PPG and draw upon the following:
projections of employment growth in the main B class sectors (labour
demand) derived from economic forecasts produced by Cambridge
Econometrics which are consistent with other economic evidence base
work that has been prepared recently for Thames Valley Berkshire13;
consideration of past trends in completions of employment space
based on monitoring data collated by Slough Borough Council and Royal
Borough of Windsor & Maidenhead, and how these trends might change
in the future; and
estimating future growth of local labour supply based on population
projections for the Eastern Berkshire FEMA applied as part of the recent
Berkshire (including South Bucks) SHMA, and the amount of jobs and
employment space that this can support.
4.4 All references to employment relate to total workplace jobs.
4.5 Each of these approaches has limitations and consideration needs to be given
as to how appropriate each is to the circumstances in the Eastern Berkshire
FEMA. Further, to be robust the economic growth potential and likely demand
for employment space in the FEMA needs to be assessed under a number of
future scenarios, in order to reflect both lower and higher growth conditions
that could arise in the future.
4.6 It should also be noted that the ultimate judgement as to the level of need that
should be planned for in the Eastern Berkshire FEMA is not just quantitative,
13
This economic evidence base work includes the Thames Valley Berkshire Local Enterprise Partnership’s Strategic Economic
Plan (2015/16 - 2020/21) and the Berkshire (including South Bucks) Strategic Housing Market Assessment (February 2016).

Eastern Berkshire FEMA : Economic Development Needs Assessment
10758685v8 P29
and that there will be a number of qualitative dynamics to consider (discussed
in other sections of this study). These factors will influence the employment
space requirements that will need to be planned for and must be considered
alongside the following modelled scenarios.
A. Forecasts of Job Growth
4.7 The forecasts of employment growth in the Eastern Berkshire FEMA during the
period to 2036 were obtained from the September 2013 Cambridge
Econometrics (CE) employment projections release (Forecast Version 10918).
These projections have been used to ensure consistency and alignment with
other recent economic evidence base work that has been prepared for the
TVBLEP and Berkshire local authorities including the TVBLEP Strategic
Economic Plan and the Berkshire (including South Bucks) Strategic Housing
Market Assessment (February 2016). They are however a few years old and
therefore do not reflect the latest macro-economic outlook or assumptions.
4.8 Further information on the methodology, assumptions and data sources
applied by CE to inform their employment projections is provided in Appendix
10. The measure of employment provided by CE is workplace based jobs,
which includes full-time, part-time and self-employed roles. The projections
assume that economic growth in the local area is not constrained by supply-
side factors such as population and the supply of labour. They assume that
there will be enough labour (either locally or through commuting) with the right
skills to fill the jobs. If, in reality, the labour supply is not there to meet
projected growth in employment, growth could be slower.
SHMA Adjustment to Job Growth Forecasts
4.9 It should be noted that the CE employment projections were examined as part
of the Berkshire (including South Bucks) Strategic Housing Market
Assessment, specifically within Chapter 5 of the February 2016 final report
(‘Economic-Led Housing Needs’). This highlighted notable variations in the rate
of employment growth reported between historic time periods and the
forecasts. For this reason, GL Hearn sought to draw their own conclusions
regarding the overall rate of employment growth which can be expected over
the study period, taking account of past employment growth trends and a wider
understanding of factors which may affect future performance, in particular
where these have not been present in the ‘history.’ These conclusions are
summarised by local authority below:
Bracknell Forest: CE forecasts show growth at a level significantly
higher than Reading and Wokingham, lower growth trend based data is
therefore assumed as a proxy for future growth (0.4% growth pa);
Reading: it was deemed appropriate to boost the forecast levels of
employment growth in Reading above that forecast by CE (equivalent to
0.6% growth pa);
Slough: assumed a level of growth slightly higher than that forecast and
above historic trends (0.7% growth pa);

Eastern Berkshire FEMA : Economic Development Needs Assessment
P30 10758685v8
RBWM: the CE forecasts are deemed to represent a reasonable level of
growth (0.6% growth pa);
West Berkshire: the CE forecasts are deemed to represent a
reasonable level of growth (0.5% growth pa); and
Wokingham: assumed a level of job growth which is above the forecasts
but below the historic trends (0.8% growth pa).
4.10 These adjustments imply a different distribution of employment growth to that
seen historically and implied by the CE projections, and for some authorities
(Reading, West Berkshire and Wokingham) a specific ‘economic uplift’ is
added within the SHMA to the objectively assessed housing need to account
for this implied growth.
4.11 No detail regarding the sectoral breakdown of these adjustments to implied
future employment growth is provided by GL Hearn and it is therefore not
possible to model the employment space and land requirements associated
with this adjusted growth trajectory as part of the EDNA. It is however
important to be aware of the adjustments that have been made as part of the
SHMA within the context of economic evidence base alignment.
Scenario 1: Baseline Labour Demand
4.12 The employment forecasts obtained from CE indicate overall growth of 27,110
jobs in the Eastern Berkshire FEMA during the 23 year period to 2036 (Table
4.2), equivalent to just under 1,180 new jobs per annum on average. This
forecast growth includes 14,680 new jobs in Slough and 12,430 new jobs in
Windsor & Maidenhead. Table 4.1 shows the highest growing sectors in the
FEMA under this scenario, alongside those sectors expected to see a decline
in job numbers during this period. A full breakdown of baseline job growth by
sector is provided in Appendix 11.
4.13 This analysis indicates that administrative & supportive services; land
transport, storage & post; and computing & information services are expected
to be the main drivers of job growth in the Eastern Berkshire FEMA during the
next 23 year period, while professional services; accommodation & food
services; wholesale; and specialised construction activities are also projected
to account for a significant share of the employment growth during this period.
Sectors forecast to see the most significant employment losses through this
period include education; recreation; and public administration and defence
(Table 4.1).

Eastern Berkshire FEMA : Economic Development Needs Assessment
10758685v8 P31
Table 4.1 Highest Growing and Declining Job Sectors in the Eastern Berkshire FEMA, 2013 - 2036
Sector Use Class
Job Growth
Slo
ug
h
Win
ds
or
&
Ma
iden
he
ad
Ea
ste
rn
Be
rks
hir
e
FE
MA
Administrative & Supportive Services Part B Class +4,025 +3,075 +7,100
Land Transport, Storage & Post Part B Class +5,465 +1,275 +6,735
Computing & Information Services14
B Class +2,395 +1,720 +4,120
Professional Services B Class +1,785 +1,320 +3,105
Accommodation & Food Services Non B Class +390 +2,140 +2,530
Wholesale B Class +1,285 +1,090 +2,375
Specialised Construction Activities Part B Class +705 +1,550 +2,255
Public Administration & Defence Part B Class -350 -405 -755
Recreation Non B Class +40 -1,275 -1,240
Education Non B Class -840 -655 -1,495
Source: Cambridge Econometrics 2013 / NLP analysis
4.14 It should be noted that the majority of the sectors forecast to record the highest
growth through this period are B class sectors or part B class sectors, with only
accommodation & food services classified as being entirely non B class in
nature (in terms of the type of space typically occupied).
4.15 The overall employment change in the Eastern Berkshire FEMA resulting from
these projections is set out in Table 4.2, alongside the forecast growth in the
main B class sectors. This includes an allowance for jobs in other non B class
sectors that typically would occupy some office or industrial spaces, such as in
construction; vehicle repairs; courier services; road transport and cargo
handling; and some public administration activities (see Appendix 12).
4.16 The analysis indicates overall net job gains of 15,965 in B class sectors in the
Eastern Berkshire FEMA over the period to 2036, with strong growth in
distribution and office jobs, and a much smaller increase in manufacturing jobs.
This is in the context of overall workplace job growth of 27,110 jobs projected
for the FEMA through this period, which outside B class sectors is expected to
be in accommodation & food services and construction.
4.17 Within the FEMA, the analysis indicates growth of 9,605 B class jobs in Slough
and 6,360 B class jobs in Windsor & Maidenhead through the study period to
2036. This means that Slough is projected to support approximately 60% of the
overall B class job growth in the Eastern Berkshire FEMA during this study
14
It should be noted that activities associated with data centres (which represent a key occupier in the FEMA and in Slough in
particular) tend to be included within the Computing & Information Services sector category (data processing, hosting and related activities sub-sector)

Eastern Berkshire FEMA : Economic Development Needs Assessment
P32 10758685v8
period, while Windsor & Maidenhead will support approximately 40% of this job
growth.
4.18 Strong office job growth is forecast in both Slough and Windsor & Maidenhead
during this period, while the forecast job growth in distribution uses is most
significant in Slough. Manufacturing jobs are expected to decline by just over
820 in Slough between 2013 and 2036, with growth of just over 850
manufacturing jobs expected in Windsor & Maidenhead over this period (Table
4.2), mainly driven by projected growth within construction related activities
that typically use some manufacturing space.
Table 4.2 Forecast Job Change in the Eastern Berkshire FEMA, 2013 - 2036
Uses Number of Jobs Change
(2013 - 2036) 2013 2036
EA
ST
ER
N
BE
RK
SH
IRE
FE
MA
Offices (B1a/B1b)* 50,800 58,715 +7,915
Manufacturing (B1c/B2)** 17,040 17,070 +30
Distribution (B8)*** 22,965 30,995 +8,030
Total B Class Jobs 90,810 106,775 +15,965
Total Jobs in All Sectors 183,435 210,545 +27,110
SL
OU
GH
Offices (B1a/B1b)* 24,255 28,495 +4,240
Manufacturing (B1c/B2)** 10,185 9,360 -825
Distribution (B8)*** 16,600 22,790 +6,190
Total B Class Jobs 51,040 60,645 +9,605
Total Jobs in All Sectors 92,885 107,565 +14,680
WIN
DS
OR
&
MA
IDE
NH
EA
D Offices (B1a/B1b)* 26,545 30,220 +3,675
Manufacturing (B1c/B2)** 6,855 7,710 +855
Distribution (B8)*** 6,365 8,205 +1,840
Total B Class Jobs 39,770 46,130 +6,360
Total Jobs in All Sectors 90,550 102,980 +12,430
Source: Cambridge Econometrics 2013 / NLP analysis
Note: * Includes publishing and a proportion of government offices.
** Includes vehicle repairs and some construction activities.
*** Includes parts of transport and communication sectors that use industrial land.
4.19 The forecasts also indicate that Slough will support approximately 54% of the
overall job growth within the Eastern Berkshire FEMA, with Windsor &
Maidenhead accommodating approximately 46% of this overall job growth. In
overall terms, job growth will be split relatively evenly across the two local
authority areas within the FEMA.
4.20 The projected net increase of 15,965 B class jobs in the Eastern Berkshire
FEMA to 2036 is equivalent to an annual average increase of 695 B class jobs
during this period. This is significantly higher than the 553 B class jobs on
average each year that was recorded within the FEMA between 1996 and
2013, suggesting that B class sectors are expected to grow faster in future

Eastern Berkshire FEMA : Economic Development Needs Assessment
10758685v8 P33
compared to historically. This acceleration growth trend is driven wholly by
Slough, while the pace of B class job growth is expected to slow down in
Windsor & Maidenhead in future compared with past trends (Figure 4.1).
Figure 4.1 Historic vs Forecast Annual Job Growth in the Eastern Berkshire FEMA, 1996 - 2036
Source: Cambridge Econometrics 2013 / NLP analysis
4.21 By contrast, total workplace job growth is forecast to decelerate slightly in
future compared with the level of growth recorded in the FEMA between 1996
and 2013, with 1,178 new jobs projected to be created in the Eastern Berkshire
FEMA on average each year through the study period to 2036. This compares
with annual average total growth of 1,267 jobs in the Eastern Berkshire FEMA
between 1996 and 2013. Within the FEMA, Windsor & Maidenhead is
expected to echo this FEMA wide trend, while the rate of total job growth in
Slough is expected to accelerate in future compared with the period 1996 to
2013 (Figure 4.1).
4.22 These employment forecasts can be converted to future employment space
requirements assuming standard ratios of jobs to floorspace for different types
of B class use. To estimate employment space requirements in the FEMA, the
following average ratios have been applied to the employment forecasts for the
Eastern Berkshire FEMA:
Offices: 1 job per 12.5sq.m for general office space;
Industrial: 1 job per 43sq.m as an average for B1c and B2 uses; and
Warehousing: 1 job per 65sq.m for general, smaller scale warehousing
(assumed to account for 100% of all stock in Windsor & Maidenhead and
50% of all stock in Slough) and 1 job per 74sq.m for larger scale, lower
density units (assumed to account for 50% of all stock in Slough)15.
15
% splits between small scale and large scale warehousing is made by NLP to broadly represent the existing nature of
warehousing stock within each local authority area in the FEMA
1,267
379
888
1,178
638
540553
153
400
695
418
277
0
200
400
600
800
1,000
1,200
1,400
Eastern Berkshire FEMA Slough Windsor & Maidenhead
An
nu
al
Ch
an
ge
in
Wo
rkp
lac
e J
ob
sTotal Workplace Jobs (Historic)
Total Workplace Jobs (Future)
B Class Jobs (Historic)
B Class Jobs (Future)
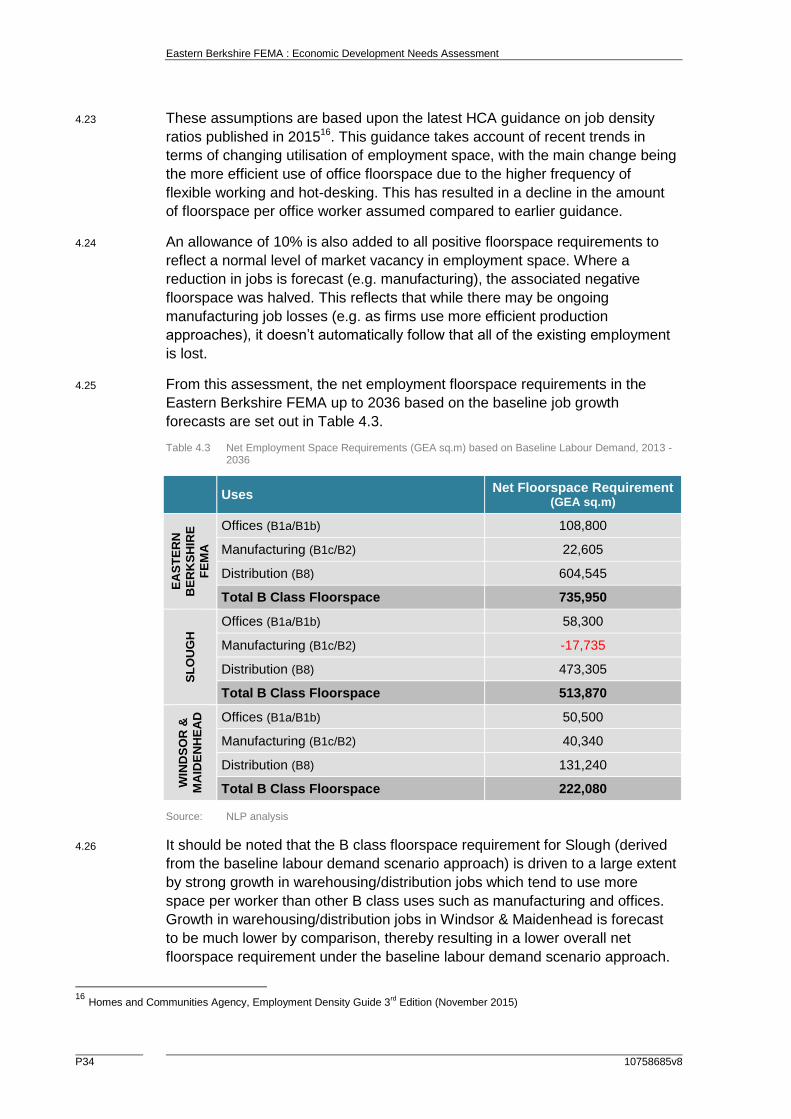
Eastern Berkshire FEMA : Economic Development Needs Assessment
P34 10758685v8
4.23 These assumptions are based upon the latest HCA guidance on job density
ratios published in 201516. This guidance takes account of recent trends in
terms of changing utilisation of employment space, with the main change being
the more efficient use of office floorspace due to the higher frequency of
flexible working and hot-desking. This has resulted in a decline in the amount
of floorspace per office worker assumed compared to earlier guidance.
4.24 An allowance of 10% is also added to all positive floorspace requirements to
reflect a normal level of market vacancy in employment space. Where a
reduction in jobs is forecast (e.g. manufacturing), the associated negative
floorspace was halved. This reflects that while there may be ongoing
manufacturing job losses (e.g. as firms use more efficient production
approaches), it doesn’t automatically follow that all of the existing employment
is lost.
4.25 From this assessment, the net employment floorspace requirements in the
Eastern Berkshire FEMA up to 2036 based on the baseline job growth
forecasts are set out in Table 4.3.
Table 4.3 Net Employment Space Requirements (GEA sq.m) based on Baseline Labour Demand, 2013 - 2036
Uses Net Floorspace Requirement
(GEA sq.m)
EA
ST
ER
N
BE
RK
SH
IRE
FE
MA
Offices (B1a/B1b) 108,800
Manufacturing (B1c/B2) 22,605
Distribution (B8) 604,545
Total B Class Floorspace 735,950
SL
OU
GH
Offices (B1a/B1b) 58,300
Manufacturing (B1c/B2) -17,735
Distribution (B8) 473,305
Total B Class Floorspace 513,870
WIN
DS
OR
&
MA
IDE
NH
EA
D
Offices (B1a/B1b) 50,500
Manufacturing (B1c/B2) 40,340
Distribution (B8) 131,240
Total B Class Floorspace 222,080
Source: NLP analysis
4.26 It should be noted that the B class floorspace requirement for Slough (derived
from the baseline labour demand scenario approach) is driven to a large extent
by strong growth in warehousing/distribution jobs which tend to use more
space per worker than other B class uses such as manufacturing and offices.
Growth in warehousing/distribution jobs in Windsor & Maidenhead is forecast
to be much lower by comparison, thereby resulting in a lower overall net
floorspace requirement under the baseline labour demand scenario approach.
16
Homes and Communities Agency, Employment Density Guide 3rd Edition (November 2015)
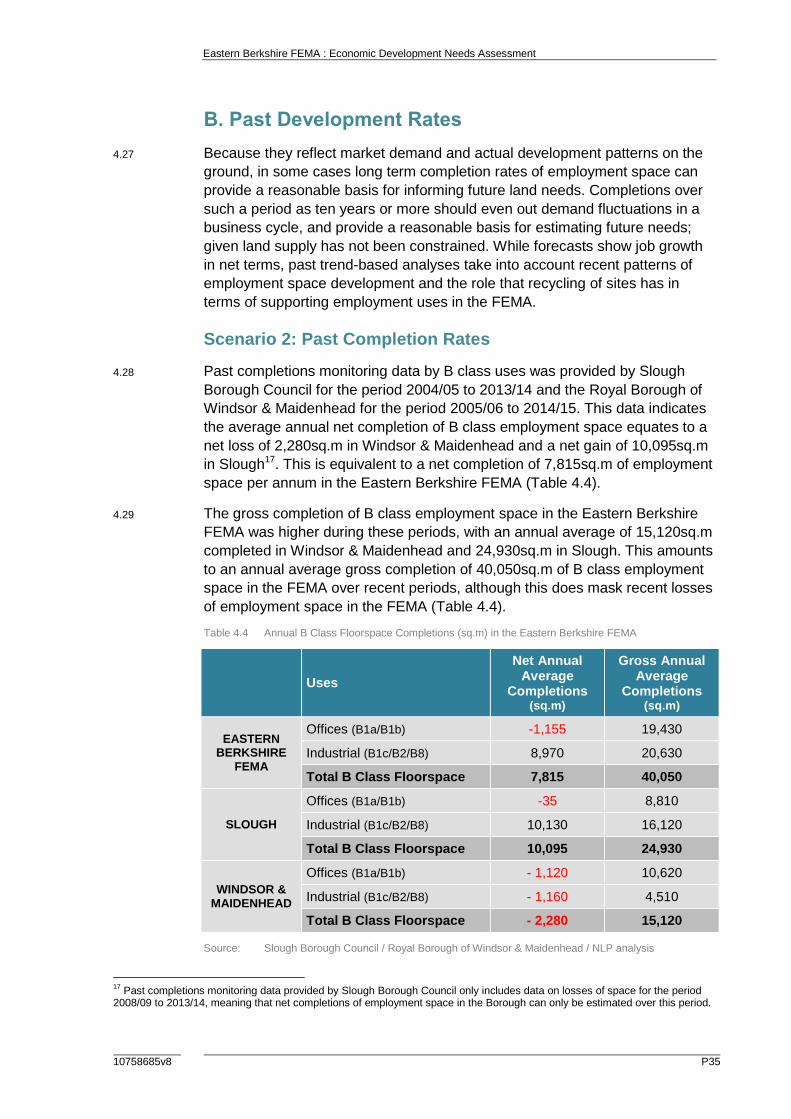
Eastern Berkshire FEMA : Economic Development Needs Assessment
10758685v8 P35
B. Past Development Rates
4.27 Because they reflect market demand and actual development patterns on the
ground, in some cases long term completion rates of employment space can
provide a reasonable basis for informing future land needs. Completions over
such a period as ten years or more should even out demand fluctuations in a
business cycle, and provide a reasonable basis for estimating future needs;
given land supply has not been constrained. While forecasts show job growth
in net terms, past trend-based analyses take into account recent patterns of
employment space development and the role that recycling of sites has in
terms of supporting employment uses in the FEMA.
Scenario 2: Past Completion Rates
4.28 Past completions monitoring data by B class uses was provided by Slough
Borough Council for the period 2004/05 to 2013/14 and the Royal Borough of
Windsor & Maidenhead for the period 2005/06 to 2014/15. This data indicates
the average annual net completion of B class employment space equates to a
net loss of 2,280sq.m in Windsor & Maidenhead and a net gain of 10,095sq.m
in Slough17. This is equivalent to a net completion of 7,815sq.m of employment
space per annum in the Eastern Berkshire FEMA (Table 4.4).
4.29 The gross completion of B class employment space in the Eastern Berkshire
FEMA was higher during these periods, with an annual average of 15,120sq.m
completed in Windsor & Maidenhead and 24,930sq.m in Slough. This amounts
to an annual average gross completion of 40,050sq.m of B class employment
space in the FEMA over recent periods, although this does mask recent losses
of employment space in the FEMA (Table 4.4).
Table 4.4 Annual B Class Floorspace Completions (sq.m) in the Eastern Berkshire FEMA
Uses
Net Annual Average
Completions (sq.m)
Gross Annual Average
Completions (sq.m)
EASTERN BERKSHIRE
FEMA
Offices (B1a/B1b) -1,155 19,430
Industrial (B1c/B2/B8) 8,970 20,630
Total B Class Floorspace 7,815 40,050
SLOUGH
Offices (B1a/B1b) -35 8,810
Industrial (B1c/B2/B8) 10,130 16,120
Total B Class Floorspace 10,095 24,930
WINDSOR & MAIDENHEAD
Offices (B1a/B1b) - 1,120 10,620
Industrial (B1c/B2/B8) - 1,160 4,510
Total B Class Floorspace - 2,280 15,120
Source: Slough Borough Council / Royal Borough of Windsor & Maidenhead / NLP analysis
17
Past completions monitoring data provided by Slough Borough Council only includes data on losses of space for the period 2008/09 to 2013/14, meaning that net completions of employment space in the Borough can only be estimated over this period.

Eastern Berkshire FEMA : Economic Development Needs Assessment
P36 10758685v8
Note: Net completions in Slough based on data from the monitoring years 2008/09 to 2013/14, while gross completions are based on data from the monitoring years 2004/05 to 2013/14
Net and gross completions in RBWM based on data from the monitoring years 2005/06 to 2014/15
4.30 One view of future growth in the Eastern Berkshire FEMA could simply assume
past completion levels continue in the future at the long term average. If it were
assumed historic net completion rates were to continue over the next 23 year
period, this would amount to a net loss of 26,565sq.m of office space, and an
increase in 206,310sq.m of industrial space by 2036, which is equivalent to a
total growth of 179,745sq.m of B class employment space (Table 4.5). The
total B class employment space requirement related to this scenario is
therefore significantly lower than that estimated under the baseline labour
demand scenario.
Table 4.5 Net Employment Space Requirements (sq.m) based on Past Completion Rates, 2013 - 2036
Uses
Assumed Net Annual
Completions (sq.m)
Net Floorspace Requirement
(sq.m)
EASTERN BERKSHIRE
FEMA
Offices (B1a/B1b) -1,155 -26,565
Industrial (B1c/B2/B8) 8,970 206,310
Total B Class Floorspace 7,815 179,745
SLOUGH
Offices (B1a/B1b) -35 -805
Industrial (B1c/B2/B8) 10,130 232,990
Total B Class Floorspace 10,095 232,185
WINDSOR & MAIDENHEAD
Offices (B1a/B1b) - 1,120 -25,760
Industrial (B1c/B2/B8) - 1,160 -26,680
Total B Class Floorspace - 2,280 -52,440
Source: NLP analysis
4.31 Using standard ratios of jobs to floorspace for the different types of B class
floorspace set out above, it is possible to estimate that around 1,255 B class
jobs would be created in the Eastern Berkshire FEMA by 2036 under the past
completions rates scenario, which is equivalent to a growth of around 55 B
class jobs each year on average during the course of the study period. Under
this scenario, it is estimated that around 3,755 B class jobs would be created in
Slough and around 2,500 B class jobs would be lost in Windsor & Maidenhead.
C. Future Labour Supply
4.32 It is also important to take into account the number of jobs and the associated
employment floorspace requirement that would be necessary to largely match
the forecast growth of the resident workforce in the FEMA. In contrast to the
other two scenario approaches, this approach focuses on the future supply of
labour rather than the demand for labour. It identifies the number of workplace
jobs that would be required to match the future supply of working-age persons,

Eastern Berkshire FEMA : Economic Development Needs Assessment
10758685v8 P37
and the amount of employment space that would be needed to support these
new jobs in the FEMA.
Scenario 3: Labour Supply
4.33 A labour supply based scenario has been considered for the Eastern Berkshire
FEMA based on population projections that have been used to inform the
Objectively Assessed Housing Need (OAN)18 for each constituent local
authority area as part of the Berkshire SHMA19.
4.34 Information on the ‘employed’ resident population growth associated with this
level of population growth has been supplied by the SHMA consultants (GL
Hearn). This implies an increase in the number of employed residents within
the FEMA from 143,360 in 2013 to 176,000 in 2036, which is equivalent to an
additional 32,640 employed residents in the Eastern Berkshire FEMA. This
includes an increase of 20,080 employed residents in Slough and 12,560
employed residents in Windsor & Maidenhead. These figures include all age
groups of the population.
4.35 An adjustment for commuting patterns has been made by NLP based on the
latest 2011 Census travel-to-work data. These commuting patterns for Slough
and Windsor & Maidenhead are assumed to remain the same for the whole of
the period to 2036, meaning that Slough is assumed to continue to operate as
a strong net importer of labour and Windsor & Maidenhead is assumed to
continue as a slight net importer of labour throughout the study period.
4.36 Table 4.6 summarises the resident and workplace labour supply resulting from
this scenario. Based on the population projections used in the Berkshire SHMA
the number of workplace jobs required to support the increase in employed
persons in the FEMA assumes that one additional job would be required for
each additional worker, whilst the proportion employed in B class sectors takes
into account the existing and forecast share of B class jobs to overall jobs in
Slough and Windsor & Maidenhead from the CE employment forecast data
(presented in Scenario 1).
4.37 This analysis results in a need for 20,170 B class jobs in the Eastern Berkshire
FEMA over the study period to 2036, which is equivalent to around 877 new B
class jobs per annum. These jobs include a requirement for 10,030 office jobs,
9,015 distribution jobs and 1,125 manufacturing jobs in the FEMA.
4.38 This scenario also suggests around 68% of the need for B class jobs in the
FEMA up to 2036 is in Slough, with 32% in Windsor & Maidenhead (Table 4.6).
18
The OAN has been derived in a slightly different way for each local authority area within Berkshire, with an ‘uplift’ added to
baseline 2012 SNPP demographic projections to account for an increased scale of London out-migration and higher level of economic growth in some, but not all, of the study area authorities 19
Berkshire (including South Bucks) Strategic Housing Market Assessment (February 2016)

Eastern Berkshire FEMA : Economic Development Needs Assessment
P38 10758685v8
Table 4.6 Forecast Labour Supply and B Class Job Change for the Eastern Berkshire FEMA, 2013 - 2036
Uses Annual Change Total Change
EA
ST
ER
N B
ER
KS
HIR
E
FE
MA
Resident Labour Supply 1,419 32,640
Workplace Labour Supply 1,535 35,305
Office Jobs (B1a/B1b) 436 10,030
Manufacturing Jobs (B1c/B2) 49 1,125
Distribution Jobs (B8) 392 9,015
Total B Class Jobs 877 20,170
SL
OU
GH
Resident Labour Supply 873 20,080
Workplace Labour Supply 970 22,320
Office Jobs (B1a/B1b) 270 6,200
Manufacturing Jobs (B1c/B2) 9 215
Distribution Jobs (B8) 316 7,260
Total B Class Jobs 595 13,675
WIN
DS
OR
&
MA
IDE
NH
EA
D
Resident Labour Supply 546 12,560
Workplace Labour Supply 565 12,985
Office Jobs (B1a/B1b) 167 3,830
Manufacturing Jobs (B1c/B2) 40 910
Distribution Jobs (B8) 76 1,755
Total B Class Jobs 282 6,495
Source: Berkshire SHMA / NLP analysis
4.39 The forecast requirement for B class employment floorspace for these B class
jobs can then be estimated by applying the same job density ratios used under
the baseline labour demand scenario, and adding a 10% allowance for normal
levels of vacancy.
4.40 The overall future employment space requirements based on meeting the B
class job needs of forecast workers in the Eastern Berkshire FEMA therefore
equates to about 871,490sq.m of B class employment space during the study
period up to 2036. These requirements include 137,950sq.m of office space,
53,110sq.m of manufacturing space and 680,430sq.m of warehousing space.
4.41 In addition, the requirements estimate a need for approximately 650,410sq.m
of B class employment space in Slough and 221,080sq.m in Windsor &
Maidenhead during the period to 2036 (Table 4.7).

Eastern Berkshire FEMA : Economic Development Needs Assessment
10758685v8 P39
Table 4.7 Net Employment Space Requirements (GEA sq.m) based on Labour Supply, 2013 - 2036
Uses Net Floorspace Requirement (GEA sq.m)
EA
ST
ER
N
BE
RK
SH
IRE
FE
MA
Offices (B1a/B1b) 137,950
Manufacturing (B1c/B2) 53,110
Distribution (B8) 680,430
Total B Class Floorspace 871,490 S
LO
UG
H
Offices (B1a/B1b) 85,270
Manufacturing (B1c/B2) 10,275
Distribution (B8) 554,865
Total B Class Floorspace 650,410
WIN
DS
OR
&
MA
IDE
NH
EA
D
Offices (B1a/B1b) 52,680
Manufacturing (B1c/B2) 42,835
Distribution (B8) 125,565
Total B Class Floorspace 221,080
Source: NLP analysis (totals rounded)
4.42 The labour supply based estimate provides a useful benchmark for comparing
with the demand scenarios. Based on the population forecasts for the Eastern
Berkshire FEMA, these estimates provide a positive space requirement for the
FEMA that is slightly higher than the baseline labour demand scenario, but
much higher than the past completions rate scenario. It should also be noted
that these are unconstrained labour supply forecasts which do not take
account of the possible shortage of land for new development.
4.43 The labour supply based scenario also provides a similar estimate for Windsor
& Maidenhead when compared with the baseline labour demand scenario,
while the estimate for Slough is slightly higher than the baseline labour
demand scenario. It provides a much higher estimate compared to the past
completions rate scenario for both local authorities.
Summary of Net Employment Space Requirements
4.44 Drawing together the results from each of the future scenarios for the Eastern
Berkshire FEMA, the net B class employment space requirements for the
FEMA over the period to 2036 are presented in Table 4.8 below.

Eastern Berkshire FEMA : Economic Development Needs Assessment
P40 10758685v8
Table 4.8 Net Employment Space Requirements (GEA sq.m) for Eastern Berkshire FEMA by Scenario, 2013 - 2036
Uses 1. Baseline
Labour Demand
2. Past Completion
Rates
3. Labour Supply
EASTERN BERKSHIRE
FEMA
Offices (B1a/B1b) 108,800 -26,565 137,950
Industrial (B1c/B2/B8) 627,150 206,310 733,540
Total B Class Floorspace (sq.m)
735,950 179,745 871,490
SLOUGH
Offices (B1a/B1b) 58,300 -805 85,270
Industrial (B1c/B2/B8) 455,570 232,990 565,140
Total B Class Floorspace (sq.m)
513,870 232,185 650,410
WINDSOR & MAIDENHEAD
Offices (B1a/B1b) 50,500 -25,760 52,680
Industrial (B1c/B2/B8) 171,580 -26,680 168,400
Total B Class Floorspace (sq.m)
222,080 -52,440 221,080
Source: NLP analysis
4.45 The net employment space requirements represent the minimum
recommended quantum of employment floorspace to plan for within the FEMA
over the study period. Each Local Planning Authority will need to take a view
on the extent to which additional space should be planned for over and above
the net requirements to allow for factors such as delays in development coming
forward, for replacing employment space that is lost in future and to take
account of other market factors (as outlined below in more detail).
Converting to Gross Employment Space Requirements
4.46 To convert the net B class employment space requirements for the Eastern
Berkshire FEMA into gross space requirements (i.e. the amount of employment
space or land that should be allocated or planned for in the FEMA), two
allowances are typically added for some additional flexibility for the purposes of
planning for future business space and to also offset anticipated future losses
of existing employment space stock in the FEMA which may be lost to other
non B uses over the course of the study period. These allowances are
considered in turn below.
Safety Margin
4.47 The application of a safety margin or ‘buffer’ is intended to allow for some
flexibility of provision (whilst avoiding over-provision of land) and reflects the
fact that there may be potential delays in some employment sites coming
forward for development in the FEMA.

Eastern Berkshire FEMA : Economic Development Needs Assessment
10758685v8 P41
4.48 The former South East of England Partnership Board (SEEPB) guidance on
employment land assessments recommends an allowance that is equivalent to
the average time for a site to gain planning permission and be built-out, which
usually amounts to two years. In absence of more up-to-date Government
guidance, this recommendation has been broadly applied for the Eastern
Berkshire FEMA. The safety margin used for industrial uses in Slough is based
on two years of average net take-up (covering the monitoring years 2008/09 to
2013/14) as recommended by the former SEEPB guidance.
4.49 However given that the net take-up of B class employment space in Windsor &
Maidenhead has been negative in recent periods the margins used are based
on one year of average gross take- up in the Borough (covering the monitoring
period 2005/06 to 2014/15). Gross take-up rather than net take-up has been
used as a proxy in order to generate a positive safety margin. This has also
been applied for office space in Slough, given that historically the average
annual net completion rate was negative.
4.50 These safety margins are outlined in Table 4.9 below and appear to be suitable
relative to the estimated scale of the assessed need for B class employment
space in the FEMA.
Table 4.9 Safety Margin Allowance (sq.m) for the Eastern Berkshire FEMA
Uses Average Annual
Completion Rates (sq.m)
Safety Margin Applied (sq.m)
EASTERN BERKSHIRE
FEMA
Offices (B1a/B1b) 19,430 19,430
Industrial (B1c/B2/B8) 14,640 24,770
SLOUGH Offices (B1a/B1b) 8,810 8,810
Industrial (B1c/B2/B8) 10,130 20,260
WINDSOR & MAIDENHEAD
Offices (B1a/B1b) 10,620 10,620
Industrial (B1c/B2/B8) 4,510 4,510
Source: NLP analysis
Note: The average annual industrial completion rate for Slough is based on net take-up rates; while for office space the average annual completion rate for Slough is based on gross take-up.
The average annual completion rate for both industrial and office uses in Windsor & Maidenhead is based on gross take-up rates given the net completion rates have been negative in the Borough over recent periods.
Replacing Future Losses
4.51 As noted above, an allowance is typically made for some replacement of
losses of existing employment space that are anticipated to occur in the FEMA
in future in order to provide some protection against the continued erosion of B
class employment space. A judgement has to be made as to the suitability and
degree to which an allowance for future losses of employment space should be
applied based on existing trends in the local commercial property market. Not
all employment floorspace losses in the future will need to be replaced as
some of this will simply reflect restructuring in the local economy, such as a
decline in the need for manufacturing space in the future.

Eastern Berkshire FEMA : Economic Development Needs Assessment
P42 10758685v8
4.52 Analysis of past completions monitoring data from Slough Borough Council
over the period 2008/09 to 2013/1420 indicates the Borough has lost an
average of 9,850sq.m of office space and 7,845sq.m of industrial space each
year over this period.
4.53 The past completions monitoring data provided by the Royal Borough of
Windsor & Maidenhead for the period 2005/06 to 2014/15 indicates the
Borough has lost an average of 11,740sq.m of office space and 5,660sq.m of
industrial space per year over this recent monitoring period. The total losses of
space in the Eastern Berkshire FEMA therefore equates to approximately
21,590sq.m of office space and 13,505sq.m of industrial space over recent
periods. As there is no way of knowing how much employment floorspace will
be lost in the FEMA in future, these past trends have been used as a proxy for
the scale of floorspace losses that are likely to occur over the study period to
2036.
4.54 Based on the consideration of a range of market dynamics in the Eastern
Berkshire FEMA, it is considered to be inappropriate to replace all office and
industrial space that will be lost in the FEMA in the future provided sufficient
new allocations are being made elsewhere. This study therefore assumes 25%
(i.e. a small and not excessive allowance) of all office losses recorded over the
past monitoring period for Slough and Windsor & Maidenhead will be replaced
up to 2036 which equates to a total replacement of 56,640sq.m of office losses
in Slough and 67,505sq.m of office losses in Windsor & Maidenhead.
4.55 In regards to industrial losses, it is assumed 25% of lost industrial space will
also need to be replaced in this period. This is equivalent to a replacement of
45,110sq.m of industrial losses in Slough and 32,545sq.m of losses in Windsor
& Maidenhead.
4.56 The total replacement of B class employment space losses within the Eastern
Berkshire FEMA therefore amounts to about 124,145sq.m of office losses and
77,655sq.m of industrial losses over the period to 2036.
4.57 These allowances do not appear to be excessive within the context of the
original net floorspace requirement. They provide a guide for the purposes of
planning for the total amount of employment land within the FEMA in future. It
does not imply that it is acceptable to lose existing employment land in policy
terms. Each of the local authorities within the FEMA will need to carefully
monitor any future losses of employment space, particularly in light of ongoing
office to residential PDR conversions which is reported to have had an impact
on the supply of office space in the FEMA.
4.58 Based on these estimated replacement allowances for office and industrial
space as well as the safety margins for flexibility identified earlier, the resultant
gross requirements for B class employment space are set out in Table 4.10
and Figure 4.2.
20
Past completions monitoring data provided by Slough Borough Council only includes data on losses of space for the period
2008/09 to 2013/14

Eastern Berkshire FEMA : Economic Development Needs Assessment
10758685v8 P43
Table 4.10 Gross Employment Space Requirement (GEA sq.m) for Eastern Berkshire FEMA by Scenario, 2013 - 2036
Uses
1. Baseline Labour
Demand
2. Past Completion
Rates
3. Labour Supply
EASTERN BERKSHIRE
FEMA
Offices (B1a/B1b) 252,375 97,580 281,525
Industrial (B1c/B2/B8) 729,575 304,225 835,965
Total B Class Floorspace (sq.m)
981,950 401,805 1,117,490
SLOUGH
Offices (B1a/B1b) 123,750 55,835 150,720
Industrial (B1c/B2/B8) 520,940 298,360 630,510
Total B Class Floorspace (sq.m)
644,690 354,195 781,230
WINDSOR & MAIDENHEAD
Offices (B1a/B1b) 128,625 41,745 130,805
Industrial (B1c/B2/B8) 208,635 5,865 205,455
Total B Class Floorspace (sq.m)
337,260 47,610 336,260
Source: NLP analysis
Note: These figures include an allowance for a safety margin and replacement of some ongoing losses of employment floorspace
4.59 The range of gross space requirements for industrial uses within the Eastern
Berkshire FEMA through the period to 2036 is relatively broad across the three
future growth scenarios, with the requirements ranging from 304,225sq.m
under the past completions rate scenario to 835,965sq.m under the labour
supply based scenario. Set against the stock of existing industrial space in the
FEMA, in 2012 the range of requirements would be equivalent to an increase
in industrial stock of between 22% and 62% over the period to 2036.
4.60 In terms of the gross requirement for office space in the Eastern Berkshire
FEMA the range of requirements is much narrower ranging from 97,580sq.m
under the past completion rates scenario to 281,525sq.m under the labour
supply scenario. These requirements are equivalent to an increase of between
10% and 30% of existing office stock in the FEMA in 2012.

Eastern Berkshire FEMA : Economic Development Needs Assessment
P44 10758685v8
Figure 4.2 Gross Employment Space Requirement (GEA sq.m) for Eastern Berkshire FEMA by Scenario, 2013 - 2036
Source: NLP analysis
Converting to Land Requirements
4.61 The gross employment space requirements for office and industrial uses
estimated for the three scenarios can then be translated to land requirements
by applying appropriate plot ratio assumptions to the gross space estimates.
The following plot ratio assumptions have been applied to the gross space
requirements to reflect development patterns in the Eastern Berkshire FEMA:
Industrial: plot ratio of 0.4 was applied so that a 1ha industrial site would
be needed to accommodate a footprint of 4,000sq.m of floorspace; and
Offices: plot ratio of 0.4 for low density, out-of-centre sites (assumed to
account for 50% of new floorspace in Slough and 50% in Windsor &
Maidenhead) and a plot ratio of 2.0 for higher density, town centre sites
(assumed to account for 50% of new floorspace in Slough and 50% in
Windsor & Maidenhead).
4.62 Based on the application of plot ratios to the estimated gross requirements for
office and industrial floorspace in the FEMA during the period to 2036, the
resultant land requirement for office and industrial uses are provided in Table
4.11 and Figure 4.3.
25
2,3
75 72
9,5
75
97
,58
0
30
4,2
25
28
1,5
25
83
5,9
65
0
100,000
200,000
300,000
400,000
500,000
600,000
700,000
800,000
900,000
Offic
e
Industr
ial
Offic
e
Industr
ial
Offic
e
Industr
ial
1. Baseline Labour Demand 2. Past Completion Rates 3. Labour Supply
Gro
ss
Flo
ors
pace
Req
uire
men
ts (
sq
.m)
Scenario

Eastern Berkshire FEMA : Economic Development Needs Assessment
10758685v8 P45
Table 4.11 Gross Employment Land Requirements (ha) for Eastern Berkshire FEMA by Scenario, 2013 - 2036
Uses
1. Baseline Labour
Demand
2. Past Completion
Rates
3. Labour Supply
EASTERN BERKSHIRE
FEMA
Offices (B1a/B1b) 37.9 14.7 42.2
Industrial (B1c/B2/B8) 182.4 76.1 209.0
Total B Class Land (ha) 220.3 90.8 251.2
SLOUGH
Offices (B1a/B1b) 18.6 8.4 22.6
Industrial (B1c/B2/B8) 130.2 74.6 157.6
Total B Class Land (ha) 148.8 83.0 180.2
WINDSOR & MAIDENHEAD
Offices (B1a/B1b) 19.3 6.3 19.6
Industrial (B1c/B2/B8) 52.2 1.5 51.4
Total B Class Land (ha) 71.5 7.8 71.0
Source: NLP analysis
Figure 4.3 Gross Employment Land Requirements (ha) for Eastern Berkshire FEMA by Scenario, 2013 - 2036
Source: NLP analysis
Sensitivity Tests
4.63 Given the breadth of potential requirements for office and industrial space in
the Eastern Berkshire FEMA from the three growth scenarios, it is important to
consider how appropriate each requirement appears to be by comparing the
forecast growth with the levels registered historically in the FEMA (Figure 4.4).
37.9
182.4
14.7
76.1
42.2
209.0
0
20
40
60
80
100
120
140
160
180
200
220
Off
ice
Ind
ustr
ial
Off
ice
Ind
ustr
ial
Off
ice
Ind
ustr
ial
1. Baseline LabourDemand
2. Past Completion Rates 3. Labour Supply
Gro
ss
La
nd
Re
qu
ire
me
nts
(h
a)
Scenario

Eastern Berkshire FEMA : Economic Development Needs Assessment
P46 10758685v8
4.64 In this way, the lowest estimate of land requirements is based on the past
completion rates scenario, which implies an increase of just 55 B class jobs
each year over the 23 year period to 2036. This implied growth includes
significant increases in industrial based jobs and a loss of office based jobs.
4.65 The highest growth estimate of land requirements for the Eastern Berkshire
FEMA is based on the labour supply scenario which implies a growth of 877 B
class jobs per annum during the period to 2036. This growth is forecast to be
split relatively evenly between industrial and office based jobs.
Figure 4.4 Annual B Class Job Growth Implied by the Scenarios for Eastern Berkshire FEMA, 2013 - 2036
Source: NLP analysis / Cambridge Econometrics 2013
Note: The estimated B class employment levels for each scenario are based upon net employment floorspace requirements and do not take into account the additional floorspace allowance in the safety margin, which is identified for planning purposes only and may not actually be developed.
4.66 The range of implied B class job growth associated with the growth scenarios
for the Eastern Berkshire FEMA compares with an annual average B class job
growth of 553 in the FEMA over the period 1996 to 2013 (as implied by
Cambridge Econometrics 2013 data). This means that two of the three
scenarios (baseline labour demand and labour supply) support a level of B
class job growth that is higher than the level of growth achieved in the FEMA
historically (Figure 4.4.).
Summary
4.67 In interpreting the outputs of this section, regard should be had to guidance
from the PPG, which states that local authorities should develop an idea of the
future economic needs of their area based on a range of data and forecasts of
quantitative and qualitative requirements. In this respect, planning for growth
should avoid relying upon using single sources of data or forecasts which tend
to rely on a number of different variables that are inevitably subject to change.
695
55
877
0
100
200
300
400
500
600
700
800
900
1. Baseline LabourDemand
2. Past Completion Rates 3. Labour Supply
Imp
lied
An
nu
al
B C
lass
Jo
b G
row
th 2
01
3-2
036
1996-2013 Annual
Average (553)

Eastern Berkshire FEMA : Economic Development Needs Assessment
10758685v8 P47
4.68 It is also important to recognise that there are inevitable uncertainties and
limitations related to modelling assumptions under any of the future scenarios
of growth considered in this study. For example, there are some inherent
limitations to the use of local level economic projections, particularly within the
context of significant recent changes within the economy. These forecasts are
regularly updated and the resulting employment outputs will change over the
study period for the Eastern Berkshire FEMA. It should also be noted that the
forecasts are unconstrained whereas past trends reflect what has actually
been delivered in recent years in the FEMA.
4.69 This assessment considered three different scenarios of future employment
space requirements in the Eastern Berkshire FEMA based upon a number of
approaches that reflect economic growth, past development patterns, and
labour supply factors. The total gross B class employment space requirement
related to these different scenarios for the FEMA (i.e. including an allowance
for a safety margin and replacement of ongoing employment floorspace losses)
range from 401,805sq.m to 1,117,490sq.m during the period to 2036, which
implies in broad terms a need for between 90.8ha and 251.2ha of employment
land. For all three scenarios, the majority of this spatial requirement relates to
industrial (B1c/B2/B8) uses. Two of the three scenarios (baseline labour
demand and supply) forecast higher B class job growth than that achieved
historically across the FEMA as a whole.
4.70 Whilst the net employment space requirements represent the minimum
recommended quantum of employment floorspace to plan for within the FEMA
over the study period, each Local Planning Authority will need to take a view
on the extent to which additional space should be planned for over and above
the net requirements to allow for factors such as delays in development coming
forward, for replacing employment space that is lost in future and to take
account of other market factors.

Eastern Berkshire FEMA : Economic Development Needs Assessment
P48 10758685v8
5.0 Policy Implications and Conclusions
5.1 This section draws together overall conclusions of the study and considers
potential policy approaches in relation to employment space for emerging
Local Plans across the Eastern Berkshire FEMA.
Economic Development Needs
5.2 A number of scenarios have been analysed in Section 4.0 to indicate the broad
scale and type of employment growth arising from different approaches to
modelling employment land needs for the Eastern Berkshire FEMA. To varying
degrees, the three scenarios reflect both indigenous needs arising within the
Eastern Berkshire FEMA as well as a degree of footloose demand which
operates across the FEMA’s boundaries from the wider Thames Valley sub-
region. In the context of the NPPF and PPG, planning policy approaches
should aim to plan positively to meet employment space needs so that the
Eastern Berkshire FEMA’s economy is not constrained, but recognising that
the FEMA has constraints in terms of land supply and competing pressures on
the limited number of development sites that are available.
5.3 The overall net floorspace requirements for the FEMA resulting from the three
scenarios range from 179,745sq.m to 871,490sq.m over the 23 year period to
2036. The equivalent gross floorspace requirements (which factor in additional
allowances for flexibility and for replacing anticipated future floorspace losses)
range from 401,805sq.m to 1,117,490sq.m over the 23 year period to 2036,
implying in broad terms a need for between 90.8ha and 251.2ha of
employment land.
5.4 The net employment space requirements represent the minimum
recommended quantum of employment floorspace to plan for within the FEMA
over the study period and each Local Planning Authority will need to take a
view on the extent to which additional space should be planned for over and
above the net requirements to allow for factors such as delays in development
coming forward, for replacing employment space that is lost in future and to
take account of other market factors.
5.5 Under Scenario 1, the CE employment projections imply that the pace of total
job growth within the Eastern Berkshire FEMA is expected to decrease slightly
in future compared with past trends, however for B class sectors specifically,
this trend is the opposite, i.e. that B class job growth is expected to accelerate
in future compared with past trends. Within the FEMA, Slough is expected to
drive the majority of job growth, with both total and B class job growth
anticipated to increase in future over and above past recorded growth. By
contrast, both total and B class job growth in Windsor & Maidenhead is
expected to slow down in future compared with past trends.
Distribution/logistics (B8) based sectors are anticipated to represent the key
driver of B class employment growth across the FEMA to 2036, and Slough is
expected to accommodate most of this growth. The lower job density

Eastern Berkshire FEMA : Economic Development Needs Assessment
10758685v8 P49
associated with distribution space results in a significantly higher employment
floorspace and land requirement for Slough, which accounts for two thirds of
the total FEMA space requirement to 2036 under Scenario 1. Office based
sectors represent the main driver of B class job growth in Windsor &
Maidenhead over the 23 year period to 2036.
5.6 The past take-up based scenario of future growth (scenario 2) results in the
lowest requirement for B class space over the next 23 years in the Eastern
Berkshire FEMA, reflecting limited levels of new employment development that
has occurred within the FEMA over recent years. This is particularly the case
for Windsor & Maidenhead which lost more B class space from its portfolio
than it gained over the last nine years, reflecting ongoing development
constraints within the Borough and pressure from other non B uses. Past take-
up in Slough has been positive in net terms, although the future scenario
based upon rolling forward this scale of development (scenario 2) results in an
overall employment space requirement that falls significantly behind the other
two economic growth scenarios (1 and 3) based on labour demand and supply.
It is therefore considered that the past take-up based scenario provides a less
robust basis for understanding objectively assessed need arising from
economic growth.
5.7 The labour supply based approach (scenario 3) generates a B class floorspace
requirement for the Eastern Berkshire FEMA which is slightly larger in scale
than the labour demand based approach (scenario 1). The requirement is
similar with regards to the mix of B class growth, dominated by industrial
(specifically warehousing/distribution) uses reflecting the fact that both
scenarios use CE employment projections to estimate the relative contribution
of B class sectors. Within the FEMA, the majority (70%) of the labour supply
requirement relates to Slough and this can be partly explained by strong
population and household growth implied by the latest SNPP (and described in
more detail in the recent Berkshire [including South Bucks] SHMA); indeed
Slough is expected to record higher population and household growth (in
percentage terms) than all of the other Berkshire authorities as well as the
South East and England. In contrast, population and household growth is
expected to be lower in Windsor & Maidenhead.
5.8 Within this context, and in light of the NPPF requirement to plan positively for
growth, local authorities within the FEMA should consider planning to
accommodate the labour supply based requirement (scenario 3) to ensure that
the FEMA’s indigenous growth potential (i.e. arising from its resident
workforce) is not constrained by lack of spatial capacity in future. It is worth
noting that the scale of economic growth associated with the labour supply
scenario is linked to the scale of new housing and associated population
growth that each local authority within the FEMA is able to deliver and support
over the study period. If for example, the objectively assessed need for
housing is not delivered or met in full, then the scale of growth amongst the
resident population anticipated to be in employment and seeking a job in the
FEMA is therefore likely to be lower.

Eastern Berkshire FEMA : Economic Development Needs Assessment
P50 10758685v8
5.9 It should be noted that the relative balance between future office and industrial
employment growth (and associated floorspace requirements) is driven to a
large extent by macro-economic trends and forecasts which are predicated on
a structural shift away from industrial sectors of the economy towards more
services and consumption related activity which tend to be more significant
users of office space. As noted previously, industrial sectors have an important
role to play in supporting the Eastern Berkshire FEMA, and this is expected to
continue in future. It is therefore important that quantitative growth forecasts
implied by the three scenarios presented within this study are considered
alongside the more qualitative feedback and local market signals on business
needs that have been identified through consultation with key property market
agents active across the sub-region.
Accommodating Growth
5.10 Whilst growth needs have been identified on a FEMA wide and individual local
authority basis, there will be some degree of footloose needs that potentially
operate and can be accommodated across individual local authority
boundaries. Analysis presented within the first part of the Berkshire Functional
Economic Market Area (‘FEMA’) Study identified a number of distinct economic
geographies and commercial property market sub-areas operating within the
TVBLEP area, including a ‘Core Thames Valley’ area focused on the key M4
markets of Reading, Maidenhead, Bracknell and Wokingham, a Slough and
West London sub area taking in Heathrow Airport as well as key commercial
centres of Slough and High Wycombe, and a ‘Thames Valley West’ sub-market
which constitutes the key node at the western end of the M4 corridor,
characterised by a lower value profile and quasi-industrial uses.
5.11 As noted in Section 3.0, the Eastern Berkshire FEMA most closely aligns with
the ‘Heathrow-Slough-High Wycombe’ geography or market area with some
degree of overlap with the ‘Core Thames Valley’ market area with respect to
the centres of Maidenhead and Windsor. Within the FEMA, the key commercial
centres of Slough and Maidenhead do not tend to compete with each other for
occupiers to any significant extent, with Maidenhead historically commanding
higher office rents and as a result, higher value office occupiers compared to
Slough, with Slough tending to capture larger, more strategic industrial
requirements and occupiers given its location and proximity to the
M25/Heathrow. Whilst this market dynamic may change in future, particularly
as Slough’s Grade A office product offer improves through the new high quality
speculative development currently underway, the distinct economic profile
associated with individual commercial centres within the FEMA suggests that
the majority of employment land requirements that have been identified for the
two local authority areas within the FEMA would ideally be accommodated
within (or near to) these local authority areas as far as possible.
5.12 To ensure a flexible and responsive policy framework, it will be necessary not
just to focus on meeting forecast quantitative requirements (which will fluctuate
over time), but to consider the opportunities and risks that flow from particular
policies for supporting economic growth. It will therefore be important that

Eastern Berkshire FEMA : Economic Development Needs Assessment
10758685v8 P51
supply-side studies and assessments undertaken as part of the Local Plan
evidence base provide a comprehensive assessment of the quality and fitness-
for-purpose of employment land supply across the FEMA alongside a more
detailed analysis of the qualitative supply-side issues identified as part of this
study within the context of overall economic needs identified by the EDNA.
Windsor & Maidenhead
5.13 When considered in terms of ‘best fit’ to local authority area, Windsor &
Maidenhead sits across two FEMAs (Central and Eastern Berkshire) due to the
varied characteristics and economic role associated with different parts of the
Borough. The Borough’s position within two FEMAs reflects the equally strong
relationships that Windsor & Maidenhead exhibits with both Eastern and
Central parts of Berkshire. In labour market terms, eastern parts of the
Borough share a TTWA with Slough and Heathrow, while northern and western
parts of the Borough have stronger functional economic relationships with
western M4 corridor locations such as Reading and Wokingham. The Borough
also falls within an HMA with Slough and South Bucks according to the
Berkshire SHMA, underlining the particular strength of housing market
relationships within this eastern part of Berkshire.
5.14 Under the baseline job growth scenario (scenario 1), the Borough is expected
to record similar levels of total job growth to the other authority area within the
Eastern Berkshire FEMA (i.e. Slough), although with much less of a role in
driving distribution related jobs. Growth in office jobs is expected to be just as
significant in Windsor & Maidenhead as it is in Slough although from a
commercial property market perspective, Windsor & Maidenhead shares
stronger inter-relationships with the ‘Core Thames Valley’ sub market area
than it does with the ‘Heathrow-Slough-High Wycombe’ sub market area, with
the key centre of Maidenhead more likely to compete for occupiers and B class
firms with locations such as Reading, Wokingham and Bracknell than with
other Eastern Berkshire FEMA locations such as Slough (in the short term at
least, notwithstanding the higher value nature of much of Slough’s upcoming
pipeline of office development).
5.15 From a functional property market area perspective therefore, and
notwithstanding the Borough also features in the Eastern Berkshire FEMA, the
Core Thames Valley sub market area (and associated Central Berkshire
FEMA) would appear to represent the most pragmatic wider spatial scale
within which to consider planning to accommodate Windsor & Maidenhead’s
economic development needs.


Eastern Berkshire FEMA : Economic Development Needs Assessment
P52 10758685v8
Appendix 1 Executive Summary – Berkshire
Functional Economic Market Area
Study (February 2016)
Berkshire Functional Economic Market Area Study: Final Report
10050901v11
Executive Summary
This report has been prepared by Nathaniel Lichfield & Partners (‘NLP’) on behalf of the Thames Valley Berkshire Local Enterprise Partnership (‘TVBLEP’) and the six Berkshire authorities of Bracknell Forest, Reading, Slough, West Berkshire, Windsor and Maidenhead and Wokingham. It establishes the various functional economic market areas that operate across Berkshire and the wider sub-region, in order to provide the six authorities and the TVBLEP with an understanding of the various economic relationships, linkages and flows which characterise the sub-regional economy.
The methodological approach adopted for this study has been informed by national Planning Practice Guidance for assessing economic development needs and investigating functional economic market areas within and across local authority boundaries, and been subject to consultation with a range of adjoining authorities and other relevant stakeholders.
A range of information and data has been drawn upon across a number of themes as summarised below:
Economic and Sector Characteristics
Berkshire has recorded strong job growth in recent years, outperforming the regional and national average. Reading and West Berkshire represent the largest economies in employment terms, and Bracknell Forest the smallest. In relative terms, Berkshire’s economy supports a strong concentration of jobs in high value telecoms, IT, professional services and utilities sectors when compared with the wider regional sector mix.
Particular clusters of professional services activity are accommodated within Bracknell Forest and Reading, while West Berkshire shares similar characteristics to adjoining Basingstoke & Deane and Wiltshire with regards to a strong representation of manufacturing employment. Wholesale employment is strongly represented along the M25/M40 distribution corridor from Slough through South Bucks up to Wycombe. Slough also shares similar employment characteristics to adjoining Hillingdon in terms of transport, admin & support given its proximity to Heathrow.
The Berkshire authorities perform unevenly across a range of labour market and business demography indicators. Slough shares a number of similar labour market and business characteristics with nearby Hillingdon, Runnymede and Wycombe, while similar characteristics can also be identified between Windsor and Maidenhead and Wokingham, particularly with regards to the size profile of firms and strong enterprise performance.

Berkshire Functional Economic Market Area Study: Final Report
10050901v11
Labour Market Areas
The functional labour market areas operating across Berkshire have been examined by assessing travel-to-work patterns in and out of the sub-region. An analysis of 2011 Census commuting flows data underlines the significant effect that Reading and West Berkshire have upon travel to work patterns in Berkshire. Slough also has a strong influence on labour market movements although these commuting relationships are just as strong with neighbouring Buckinghamshire and London as they are with Berkshire.
Census data points to a growing east-west labour market divide in Berkshire, driven by the increasing influence and draw of Heathrow in commuting terms and declining influence of Reading upon travel to work flows with more eastern parts of Berkshire. TTWAs in the west of the LEP area have remained largely unchanged over the last 10 years.
ONS analysis using 2011 Census data identified three broad TTWAs crossing the Berkshire LEP area, and these broad areas are substantiated by a more detailed local travel to work area analysis:
A Reading TTWA comprising the whole of Reading and Wokingham Boroughs as well as the majority of Bracknell Forest and parts of South Oxfordshire, West Berkshire, Windsor & Maidenhead and Hart.
A Slough and Heathrow TTWA including all of Slough Borough and parts of Windsor & Maidenhead. The majority of this TTWA falls to the east of the TVBLEP area, comprising a number of authorities including Runnymede, Spelthorne, South Bucks and the London Boroughs of Hillingdon and Kingston upon Thames.
A Newbury TTWA comprising the majority of West Berkshire District as well as parts of Wiltshire, Basingstoke and Deane and Test Valley.
In most cases, these TTWAs align reasonably well with Berkshire local authority boundaries, although Windsor & Maidenhead stands out as featuring within two separate TTWAs; the western parts of the Borough within the Reading TTWA and eastern parts within the Slough and Heathrow TTWA. There are also significant labour market flows between West Berkshire and Reading, with eastern parts of West Berkshire District falling within the Reading TTWA.
Housing Market Areas
From a housing market perspective, Berkshire is influenced by household migration and travel to work patterns from a range of surrounding authorities. Recent SHMA work undertaken on behalf of the six Berkshire authorities points to the existence of two HMAs operating across the TVBLEP area; a Western Berkshire HMA covering Bracknell Forest, Wokingham, Reading and West Berkshire; and an Eastern Berkshire HMA comprising Slough, Windsor and Maidenhead and South Bucks. This uses a “best fit” to local authority boundaries approach.

Berkshire Functional Economic Market Area Study: Final Report
10050901v11
Recent HMA analysis prepared on behalf of the four Buckinghamshire authorities identified that South Bucks falls across two separate HMAs; namely a Central Buckinghamshire HMA (comprising all of Wycombe and Chiltern Districts as well as parts of Aylesbury Vale and South Bucks) and a Reading & Slough HMA (comprising the local authorities of Bracknell Forest, Reading, Slough, West Berkshire, Windsor & Maidenhead and Wokingham, as well as South Bucks).
Since that analysis was published, South Bucks have started to progress a Joint Local Plan with Chiltern District and have commissioned new evidence to determine housing and employment requirements over the period to 2033. The latest evidence emerging from this Housing and Economic Development Needs Assessment (HEDNA) study suggests that the Joint Local Plan Area for Chiltern and South Bucks would form part of a “best fit” with a Central Bucks HMA; together with the authorities of Aylesbury Vale and Wycombe. This is noted by the study as providing the most pragmatic arrangement for establishing local planning policy, although the previously defined HMA geography (which identifies strong housing market linkages between South Bucks and Berkshire) still remains valid.
Housing market studies prepared for other authorities surrounding Berkshire defines those authorities as falling within separate HMAs, with no evidence of overlapping housing market relationships extending into Berkshire. On this basis, it is possible to conclude that two HMAs operate across the LEP area; an Eastern Berkshire HMA (which also incorporates South Bucks) and a Western Berkshire HMA.
Commercial Property Market Areas
Within Berkshire, the largest concentration of employment space is found in Slough, followed by Reading and West Berkshire. These three authorities represent the largest industrial locations in floorspace terms, while Reading and Windsor & Maidenhead record the highest amount of office space.
At a sub-regional level, commercial property markets areas are centred on the M3 and M4 strategic ‘Western corridors’, driven by strong functional economic linkages to Heathrow airport and the outer west London Boroughs. Within the Western Corridor, it is possible to identify specific sub market areas, each sharing a number of similar characteristics, trends and a high degree of interaction. This includes a Core Thames Valley or ‘Upper M4’ area focused on the key M4 markets of Reading, Maidenhead, Bracknell and Wokingham, with strong economic relationships between these towns in terms of value, accessibility and labour force.
At the eastern end of the Thames Valley lies the Slough and West London sub area, reflecting the significant influence of Heathrow Airport upon property market interactions. This sub market area also takes in the South Bucks towns of Beaconsfield and Gerrards Cross.

Berkshire Functional Economic Market Area Study: Final Report
10050901v11
The western part of the sub-region accommodates the Newbury and Swindon sub-markets, which constitute the key nodes at the western end of the M4 corridor. This property market area is characterised by a lower value profile in both office and industrial terms than the M4 markets closer to London, a quasi-industrial character in regards to much of the demand, and linkages that exist with areas beyond the western boundary of Berkshire. There is some synergy in property market terms between Newbury and Reading, and Newbury and Oxfordshire, although these linkages and property market areas are not as strong.
Consumer Market Areas
Working age population growth is expected to slow down in future across the majority of Berkshire authorities, with a number of nearby authorities across the wider sub-region anticipated to outperform the LEP area in working age population growth terms. These anticipated trends are likely to have an impact on the scale and proportion of travel-to-work and migration flows that occur to, from and within Berkshire as the balance of employment and working age population changes.
Reflecting its size and position in retail ranking terms, Reading has the largest consumer market catchment in Berkshire, which extends along the M4, M3 and M40 corridors taking in all of Berkshire as well as large parts of Oxfordshire, Buckinghamshire, Surrey and Hampshire.
Other Berkshire authorities tend to have more localised retail and consumer catchment areas, reflecting their lower order retail status and critical mass of occupiers. These generally form a broad radius around the main Berkshire centres and sit within the overarching Reading consumer catchment area, and also overlap into neighbouring counties.
Due to the overlapping and complex nature of the various consumer market areas operating across Berkshire, this analysis is most helpful for defining sub-market areas rather than overarching functional economic market areas in themselves.
Transport and Connectivity
Berkshire is located between three major east-west corridors of movement (M3, M4 and M40) and in close proximity to the M25; it therefore benefits from excellent access to motorway and trunk road networks. The LEP area is also well served by rail connections although north-south road routes are comparatively poor (with the exception of the A34 to the west of Berkshire).
Transport accessibility is strongly linked with the geography of functional economic market areas, with the strategic transport network playing a key role in shaping commercial property, labour and housing market flows. Eastern Berkshire benefits from its proximity to a network of strategic routes which plays a key role in shaping the TTWA, housing market and commercial property market areas that operate across this part of Berkshire, and linking the key commercial centres of Slough, Heathrow Airport and High Wycombe.

10050
Be
901v11
S
Fig
So
erkshire Functio
Similarly, play an imBracknell pattern is services frValley clusthat commlocalised i
These dynlargest cewestern pconnectivi
ynthesis
Based upooperate acmarket to representsdifferent fahousing mwithin andInvariablyinterpreted
gure ES1 Func
ource: NLP
nal Economic M
the M4 andmportant role
in travel to likely to be rom 2019. Wster of Read
muting patten character
namics are ntres, whicharts of Berkity.
on an assescross Berksidentify hows a ‘policy oactors ident
market areasd across Be, however, td as being e
ctional Economi
analysis, drawi
Market Area Stu
d A4 corridoe in linking work and creinforced
West Berksding, Wokin
erns and bur.
echoed by h identifies kshire in ter
ssment of thshire, it is pow well theseoff’ view of ttified within s and commrkshire, regthese area either defin
c Markets – Su
ng upon a rang
dy: Final Repor
ors as well aReading, M
commercial through thehire’s locatingham, Brasiness mov
peak drive clear distin
rms of drive
he various fossible to oe align acrothe geograpthe PPG in
mercial propgardless of aboundariesitive or nece
mmary Map
e of sources
rt
as the GreatMaidenhead
property mae operation ion away frocknell and M
vements ten
time distanctions betwtime acces
functional everlay eachss Berkshir
phical reachncluding labperty markeadministratis are indicatessarily fixe
t Western M, Wokinghaarket area tof new Croom the ‘coreMaidenhea
nd to be mo
ces from Beween easterssibility and
economic mh functionalre (Figure Eh associatedbour market et areas thative geograptive and shoed over time
Mainline am and terms. This ssrail e’ Thames d means re
erkshire’s n and road
markets that economic
ES1). This d with flows,
t operate phies. ould not be e.

Berkshire F
This not eSurreLondgreatBerkwhicwith prop
Defini
In lighelpf“bestof espolicEconauthoarearelati
Figure ES2
Source:
Functional Econ
shows thatextend far bey, Hampshdon feature ter or lesse
kshire whichh shares steastern parerty market
ng Core F
ght of the ineful for Localt fit” with the
stablishing Lcy. On this bnomic Markority bounds that the eionships.
2 Core Functio
NLP analysis
nomic Market A
t the spatial eyond the T
hire, Wiltshiwithin theser extent, alt
h consistentrong econorts of Berkst terms.
Functiona
evitably nebl Planning Aese variousLocal Plan ebasis, Figureet Areas (Faries. Thesvidence ind
onal Economic M
s, drawing upon
Area Study: Fina
extent of thTVBLEP adre, Oxfordse broad geothough the otly falls withomic relationshire) in trav
al Econo
bulous natuAuthorities ts functional evidence ane ES2 below
FEMAs) thatse core FEMdicates cons
Market Areas (B
n a range of sou
al Report
hese functiodministrativeshire, Buckinographical fonly local ain these bronships with vel-to-work,
mic Mark
re of functioto identify aeconomic m
nd for the pw identifies t represent
MAs encompsistently hav
Best Fit to Local
rces
onal econome boundary.nghamshirefunctional authority are
oad areas isBerkshire (housing an
ket Areas
onal econom pragmatic
markets withurposes of dthree core
a “best fit” wpass those ve strong in
Authority Boun
10050
mic markets. Parts of e and Greatareas to a ea outside os South Buc(and in partind commerc
mic marketsand logicalhin the contdeveloping Functional
with local local autho
nter-
ndaries)
0901v11
s do
ter
of cks, icular cial
s, it is text
ority

Berkshire Functional Economic Market Area Study: Final Report
10050901v11
The ‘Central Berkshire FEMA’ includes the authority areas of Reading, Wokingham, Bracknell Forest and Windsor & Maidenhead. This aligns with the ONS defined Reading TTWA and also the Upper M4 commercial property market area which is focused around the key M4 markets of Reading, Maidenhead, Bracknell and Wokingham, with strong economic relationships between these towns in terms of value, accessibility and labour force.
The ‘Western Berkshire FEMA’ comprises West Berkshire District and the key centre of Newbury. This area is characterised by having a relatively self-contained TTWA and tends to operate within a westward facing commercial property market constituting a key node at the western end of the M4 corridor. Whilst there is some synergy in travel to work and property market terms between Newbury and Reading, these linkages are not considered sufficiently strong to include West Berkshire within the Central Berkshire FEMA.
The ‘Eastern Berkshire FEMA’ comprises the two Berkshire authorities of Slough and Windsor & Maidenhead, alongside South Bucks. This area is consistent with the Slough and Heathrow TTWA as defined by the ONS (which comprises a number of other authority areas outside of Berkshire) as well as the Eastern Berkshire HMA. Within this FEMA, economic relationships with adjoining Buckinghamshire and West London are just as strong as they are with the rest of Berkshire and this is reflected in commercial property terms through the identification of a Slough & West London property market area. Of all three FEMAs, the Eastern Berkshire FEMA has the greatest degree of relationship and influence with areas beyond Berkshire, with South Bucks consistently standing out as sharing strong economic linkages with eastern parts of Berkshire.
Windsor & Maidenhead sits across two FEMAs (Central and Eastern Berkshire) due to the varied characteristics and economic role associated with different parts of the Borough. The Borough’s position within two FEMAs reflects the equally strong relationships that Windsor & Maidenhead exhibits with both more central parts of Berkshire as well as areas within South Bucks. In labour market terms, eastern parts of the Borough share a TTWA with Slough and Heathrow1, while northern and western parts of the Borough have stronger functional economic relationships with western M4 corridor locations such as Reading and Wokingham. The Borough also falls within an HMA with Slough and South Bucks according to the Berkshire SHMA, underlining the particular strength of housing market relationships within this eastern part of Berkshire.
1 Defined by ONS as the ‘Slough and Heathrow’ travel to work area (2011 Census based)

Berkshire Functional Economic Market Area Study: Final Report
10050901v11
Analysis undertaken as part of this study identifies evidence of interactions between the various Core FEMAs and with adjoining authorities outside of Berkshire. Whilst “best fit” areas have been defined above for the purposes of informing future plan making, it should be recognised that the boundaries of these areas are porous given the different layers of inter-relationship that exist between each area as well as across the TVBLEP area overall. It is important to continue to recognise these relationships in Duty to Cooperate terms.

Eastern Berkshire FEMA : Economic Development Needs Assessment
10758685v8 P53
Appendix 2 Glossary
B Class: Sectors or activities that typically utilise land and/or buildings for B1
Business, B2 General industrial and B8 Storage or distribution purposes, as
defined by the Town and Country Planning (Use Classes) Order 1987.
Functional Economic Market Area (FEMA): The spatial level at which local
economies and markets operate in practice.
Grade A Office Space: Office buildings classified as ‘Grade A’ are typically
brand new, recently redeveloped, or have experienced a thorough
refurbishment (typically to BREEAM standards). Grade A offices will also tend
to possess high-quality furnishings, state-of-the-art facilities, and excellent
accessibility.
By comparison, Grade B office space refers to properties that fall below the
Grade A remit, typically in terms of location, facilities and maintenance. Grade
B offices are usually maintained and finished to a good or fair standard, with
adequate facilities.
Grade C offices provide functional space for tenants looking for low rents. The
fit-out is usually much lower quality than A or B Grade properties, while internal
furnishings and decoration are usually not maintained regularly, or to a high
standard.
Gross Floorspace Completions: The total amount of new floorspace
developed or completed over the course of a given year.
National Planning Policy Framework (NPPF): The Government's
overarching planning policies for England. The framework acts as guidance for
local planning authorities and decision-takers, both in drawing up plans and
making decisions about planning applications.
National Planning Practice Guidance (NPPG): The Government's web-
based resource providing practical guidance to assist practitioners in
implementing national planning policies set out in the NPPF.
Net Floorspace Completions: The total amount of net additional floorspace
developed or completed over the course of a given year, taking into account
any loss of existing floorspace that has occurred to another use. Net
completions are calculated by subtracting losses of floorspace from gross
floorspace completions.
Objectively Assessed Housing Need (OAN): The scale and mix of housing
and the range of tenures that is likely to be needed in the housing market area
over the plan period.
Permitted Development Rights: General planning permission which has
been granted by Parliament (rather than the local authority) which enables

Eastern Berkshire FEMA : Economic Development Needs Assessment
P54 10758685v8
certain types of development or work to take place without the need to apply
for planning permission.
Plot Ratio: The ratio of a building's total floor area to the size of the piece of
land upon which it is built.
Safety Margin: An allowance for factors such as delays in some sites coming
forward for development, added to the overall requirement for employment
floorspace. It provides a degree of flexibility for the purposes of planning for
business space over a given plan period.
Small and Medium Enterprises (SMEs): A business or company that has
fewer than 250 employees.

Eastern Berkshire FEMA : Economic Development Needs Assessment
10758685v8 P55
Appendix 3 Methodology Consultation
Questions
The Thames Valley Berkshire Local Enterprise Partnership (TVBLEP), in conjunction with the sixBerkshire local authorities of Bracknell Forest, Reading, Slough, West Berkshire, the Royal Borough ofWindsor and Maidenhead and Wokingham, have recently commissioned independent planning andeconomic consultants Nathaniel Lichfield & Partners (NLP) to undertake a study to establish the variousFunctional Economic Market Areas (FEMAs) that operate across the Berkshire sub-region and theeconomic development needs that local authorities should be planning for within these FEMAs. Thework will begin by developing appropriate methodologies for undertaking the study, and then use thesemethodologies to identify the relevant FEMAs and economic development needs to 2036.
This piece of work reflects the recognition that the geographical extent of local economies do notnecessarily adhere to administrative boundaries, alongside the requirement set out in the PlanningPractice Guidance (PPG) for local authorities to consider their economic needs in relation to FunctionalEconomic Market Areas.
Evidence from this study will form the basis for the development of economic policies through each localauthority’s future local plan process(s) as well as other economic development work within and betweenthe local authorities, and the work of the LEP.
The study will be undertaken in two parts; the first will establish the FEMA(s) that each of the sixBerkshire local authorities sit within. The second part of the study will comprise an EconomicDevelopment Needs Assessment (EDNA) for each of the FEMAs identified through part one. It will usethe methodology being developed as part of this work to identify the future quantity of land or floorspace that will be required for economic development uses over the period to 2036 in each localauthority area and in each of the defined FEMA(s). This will include both a quantitative and qualitativeassessment of the need for new development.
The study represents early stage technical analysis and there will be further work to do on specific tasksand topics in due course. It should be noted that a Strategic Housing Market Assessment (SHMA) isbeing concluded on behalf of the six local authorities in Berkshire and the TVBLEP. Whilst the emergingfindings from the SHMA will feed into this work, it does not form part of this FEMA study.
NLP have prepared an outline methodology for parts one and two of the study based upon guidancefrom the PPG and from experience elsewhere. It is important that the analysis is based on robust andcredible evidence and is informed through consultation with key stakeholders including neighbouring
1. Introduction
Berkshire Functional Economic Market Area Study and Economic Development NeedsAssessment – Method Consultation

local authorities and other organisations with an interest in economic development across the wider sub-region.
We are therefore inviting your feedback and comments on the proposed methodology and would begrateful if you could spend a few minutes to complete this short survey by Wednesday 28 October. Ifyou have any queries about this survey, or would like more information about the FEMA study, pleasecontact Caroline Perkins at TVBLEP on 0118 945 0201 or [email protected].

2. Survey Participants
Berkshire Functional Economic Market Area Study and Economic Development NeedsAssessment – Method Consultation
Name
Organisation
Email Address
Phone Number
Please provide your details below so that we can better understand the context of your feedbackand comments.

Methodology Overview
3. Part One - Identifying Functional Economic Market Area(s)
Berkshire Functional Economic Market Area Study and Economic Development NeedsAssessment – Method Consultation
The identification of the FEMA(s) is proposed to involve three key stages, as set out in Figure 1 below.
Figure 1 Functional Economic Market Area Outline Methodology
STAGE 1 - REVIEW EXISTING ECONOMIC EVIDENCE
This stage would identify the context for the study by reviewing the existing evidence base associated with each of thesix Berkshire local authorities on economic development, employment, transport, housing and retail matters, as well asevidence and documents that consider growth at the sub-regional level. Example documents are listed in theMethodology Diagram above.

Any comments?
Does this represent a comprehensive suite of existing economic evidence to review?
Yes
No
Are there any other sources that could be considered?
STAGE 2 - ESTABLISHING FUNCTIONAL ECONOMIC MARKET AREA(S)
This stage would involve analysing a range of information and data to establish and spatially define the variousFunctional Economic Market Areas that operate across the Berkshire sub-region. We propose to structure this analysisacross five key themes, as shown in the Methodology Diagram above.
Yes No
A: Baseline EconomicTrends
B: Employment LandSupply
C: Travel-to-WorkFlows
D: Property MarketSignals
E: Other Economicand Market Analysis
Any comments?
Do each of the proposed themes (A to E) represent a logical and robust input to defining theFunctional Economic Market Area(s) operating across the Berkshire sub-region?

A: Baseline EconomicTrends
B: Employment LandSupply
C: Travel-to-WorkFlows
D: Property MarketSignals
E: Other Economic andMarket Analysis
Are there any other sources of data or information that could be considered?
Do you have any other comments on the proposed methodology, data sources or themes thatare proposed as part of the Berkshire Functional Economic Market Area Study?

Methodology Overview
4. Part Two - Economic Development Needs Assessment
Berkshire Functional Economic Market Area Study and Economic Development NeedsAssessment – Method Consultation
The assessment of economic development needs is proposed to involve three key stages, as set out in Figure 2 below.For the purposes of the study, ‘economic development needs’ relate to the B use class sectors, namely B1 Business(offices, research & development, light industry); B2 General Industrial; and B8 Storage or Distribution (wholesalewarehouses, distribution centres).
Figure 2 Economic Development Needs Assessment Outline Methodology
STAGE A: TAKING STOCK OF THE CURRENT POSITION

1. Evidence Base and Policy Review
This task would identify the baseline position and previous economic evidence prepared by each of the six Berkshirelocal authorities (where not already reviewed as part of Part 1). We would examine the extent to which this existingevidence aligns with current Government guidance (NPPF/PPG) and policy.
Do you have any comments on the proposed approach for this task?
2. Review of Employment Land Supply and Market Signals
This task would explore the existing stock, development trends and spatial distribution of employment space across theBerkshire sub-region and each individual local authority area within it. This will provide a detailed understanding ofrecent patterns and change within the sub-regional commercial property market, drawing on data from the ValuationOffice Agency (VOA), Council monitoring data and web-based property availability registers.
Do you have any comments on the proposed approach for this task?
3. Consultation with Commercial Property Market and Wider Economic Stakeholders
We would gather qualitative feedback on market trends, occupier/business requirements and key growth sectors from arange of stakeholders including commercial property market agents, local economic and business organisations.
Do you have any comments on the proposed approach for this task?
STAGE B: ASSESSMENT OF FUTURE DEMAND
4. Generating Economic Growth Forecasts
This task would assess the scale of future demand and growth potential of the six Berkshire local authorities andidentified FEMAs in order to quantify the amount and type of employment land needed across the main employment useclasses up to 2036, in both quantitative and qualitative terms. We propose to consider three different scenarios ofgrowth, based on labour demand, labour supply and past take-up in line with PPG guidance.
Do you have any comments on the proposed approach for this task?

5. Modelling Employment Land Requirements
For all scenarios, job growth projections would be translated into floorspace requirements using industry standard jobdensity ratios. Floorspace estimates would be converted into employment land needs using appropriate assumptions onplot ratios for different locations/types of development, based on Government guidance or any local informationavailable. A safety margin allowance will be incorporated to account for delays in development and ongoing losses ofemployment space.
Do you have any comments on the proposed approach for this task?
6. Spatial Distribution of Growth
Within the context of identified future requirements, this task would consider which locations and key sites within thesub-region are capable and suitable for accommodating this growth based upon a high level SWOT analysis of the sub-region’s commercial property market and FEMA(s).
Do you have any comments on the proposed approach for this task?
Thank you for taking the time to complete the survey.

Eastern Berkshire FEMA : Economic Development Needs Assessment
P56 10758685v8
Appendix 4 Methodology Consultation
Responses Summary
Consultation was undertaken at the beginning of the study to gain feedback on
the proposed methodology for both Part One (FEMA analysis) and Part Two
(Economic Development Needs Assessment) of the study. The summary
below incorporates responses received with regards to the Part Two EDNA
analysis only.
Responses to the methodology consultation were received from the following
consultees. Not all respondents provided written responses or comments on
the study methodology; ID reference numbers are provided below to illustrate
where comments were received.
University of Reading (ID: M1)
TFB Cinnamon Café (ID: M2)
Peasemore Parish Council (ID: M3)
Federation of Small Businesses (ID: M4)
Wraysbury Parish Council (ID: M5)
Newbury Town Council (ID: M6)
Bracknell Forest Council (Business Team) (ID: M7)
Telefonica UK (ID: M8)
Rushmoor Borough Council (ID: M9)
Enborne Parish Council (ID: M10)
Hungerford Town Council (ID: M11)
Guildford Borough Council (ID: M12)
Runnymede Borough Council (ID: M13)
Windsor and Eton town Partnership (ID: M14)

Eastern Berkshire FEMA : Economic Development Needs Assessment
10758685v8 P57
Consultation Response ID Ref NLP Comments/Response
Part Two: Economic Development Needs Assessment
STAGE A: TAKING STOCK OF THE CURRENT POSITION
1. Evidence Base and Policy Review
Do you have any comments on the proposed approach for this task?
How accurate is Government guidance and policy? M5 It represents the official benchmark for undertaking analysis of this type.
Is the data up to date, relevant and comprehensive? M6 The data that has been used is the most accurate and robust available.
Not sure if there are resources, but if there are wider consultations or surveys with the business community (instead of just partners) would be useful to get a better idea of local and regional views. This would be useful for below points as well (2. and 3.)
M7 Wider consultation with the business community falls beyond the scope of the EDNA study.
Impact of restrictions applying to A O N B s M11 Specific consideration of AONBs falls beyond the scope of the EDNA study.
If there are Local Authorities outside of Berkshire which form part of the resultant FEAs, will the existing position in these authority areas also be assessed to give a full picture of the existing picture across each identified FEA?
M13
In theory yes, however the 3 FEMAs identified by the Part One FEMA study do not extend beyond Berkshire.
2. Review of Employment Land Supply and Market Signals
Do you have any comments on the proposed approach for this task?
Do they have accurate information because I suspect for example that Slough's population data is an underestimate?
M5 The data that has been used is the most accurate and robust available.
The proposed approach prejudges the outcome of the determination of the extent of the FEA by looking at the Berkshire sub-region. This is not necessarily wrong, but it should depend on the outcome of the FEA work
M9
The study area for each of the EDNAs has been identified from the conclusions of the Part One FEMA study (i.e. that there are 3 FEMAs operating across Thames Valley Berkshire)
Same comment as above-If there are Local Authorities outside of Berkshire which form part of the resultant FEAs, will their evidence also be considered and will engagement occur with these Authorities under the DtC to give a full picture across each identified FEA?
M13 The 3 FEMAs identified by the Part One FEMA study do not extend beyond Berkshire.
3. Consultation with Commercial Property Market and Wider Economic Stakeholders
Do you have any comments on the proposed approach for this task?
Do you survey home-workers? M5
Home-workers are not specifically consulted as part of the consultation process, however the Part One FEMA study has looked at patterns and trends in home-working across the Thames Valley
This should not be focused solely on the Berkshire geographical area. For example, consideration should be given to overlap with the Blackwater Valley Market Area given that the southern section of Bracknell Forest has strong linkages with that
M9
The study area for each of the EDNAs has been identified from the conclusions of the Part One FEMA study (i.e. that there are 3 FEMAs operating across Thames

Eastern Berkshire FEMA : Economic Development Needs Assessment
P58 10758685v8
Consultation Response ID Ref NLP Comments/Response
Market Area Valley Berkshire)
No. I assume that all of the Local Authorities identified in Bracknell's draft DtC statement for economic matters (including Runnymede) will be consulted on the emerging evidence.
M13 Yes.
STAGE B: ASSESSMENT OF FUTURE DEMAND
4. Generating Economic Growth Forecasts
Do you have any comments on the proposed approach for this task?
What factors are built in for changes in employment? M5
The employment forecasts used as part of the EDNA assume that changes occur within individual sectors of the economy in line with macro-economic forecasts and how local areas have performed across different sectors in the past
There are far more requirements than land needed to facilitate/ promote/ support economic growth
M6 These other requirements fall beyond the scope of the EDNA study.
Labour demand scenarios can vary significantly, depending on the economic forecasting model that is used. Experian, Cambridge Economics and Oxford Economics could all be called upon to determine the labour supply scenario. The report should clarify which economic forecasting model has been used, and why, and caveat the outcomes accordingly
M9
Economic forecasts from Cambridge Economics have been used in the EDNAs to be consistent with other Thames Valley Berkshire evidence. This has been clarified and caveated within the report.
No. But as above, I am interested to know how you would propose to deal with the situation if Local Authorities outside of Berkshire form the identified FEAs
M13 The 3 FEMAs identified by the Part One FEMA study do not extend beyond Berkshire.
5. Modelling Employment Land Requirements
Do you have any comments on the proposed approach for this task?
Obviously externally difficult to forecast, but take visitor Tourism into consideration
M2
Tourism is not a ‘B Class’ sector so it is not possible to model land requirements as part of the EDNA. Job growth projections for the recreation sector are included within Chapter 4.0 of the report.
Again please note my comment about home working and there is nothing said about the need for better broadband access and speed and there are blackspots not least in this village.
M5 These connectivity and accessibility issues are examined by the Part One FEMA study.
It is also important to include an allowance for natural churn in the market; anything up to 10% vacancy levels is considered to be appropriate to allow turnover of commercial properties. How will the Economic Needs Assessment take into account the confirmed and forthcoming changes to PD rights relating to some B class uses? Will the report consider recommending that some core employment sites in the FEA are made the subject of Article 4 Directions to protect the housing/employment balance in the FEA over the long term planning period?
M9
A vacancy level of 10% has been allowed for within the EDNA methodology and calculations. Council monitoring data on PD rights has been analysed and presented within the EDNA report. A detailed analysis of employment sites and supply falls beyond the scope of the EDNA study.

Eastern Berkshire FEMA : Economic Development Needs Assessment
10758685v8 P59
Consultation Response ID Ref NLP Comments/Response
6. Spatial Distribution of Growth
Do you have any comments on the proposed approach for this task?
The property market does not entirely show for example the failure to meet the needs of young people. There is need for more provision for older people such as retirement villages which in themselves will provide more employment.
M5 The need for different types of housing falls beyond the scope of the EDNA study.
Same comment as above about how Local Authorities outside Berkshire would be factored in.
M13 The 3 FEMAs identified by the Part One FEMA study do not extend beyond Berkshire.

Eastern Berkshire FEMA : Economic Development Needs Assessment
P60 10758685v8
Appendix 5 Emerging Findings Consultation
Questions

The Thames Valley Berkshire Local Enterprise Partnership (TVBLEP), in conjunction with the six Berkshirelocal authorities of Bracknell Forest, Reading, Slough, West Berkshire, the Royal Borough of Windsor andMaidenhead and Wokingham have commissioned independent planning and economic consultantsNathaniel Lichfield & Partners (NLP) to undertake assessments of the economic development needs thatlocal authorities should be planning for within the Functional Economic Market Areas (FEMAs) that theyoperate in. These FEMAs were identified as a result of earlier work and are:
Western Berkshire FEMA: comprising West Berkshire.Central Berkshire FEMA: comprising Bracknell Forest, Reading, the Royal Borough of Windsor andMaidenhead and Wokingham.Eastern Berkshire FEMA: comprising Slough, the Royal Borough of Windsor and Maidenhead andSouth Bucks (future economic development needs have not been specifically assessed for SouthBucks as it falls outside of the TVBLEP area).
This consultation is on the Draft Economic Development Needs Assessment (EDNA) that has beenprepared for the Eastern Berkshire FEMA.
The EDNA study provides an assessment of the future business needs and requirements for employmentland and floorspace within the defined FEMA, focusing on the group of ‘B use class’ sectors (i.e. B1, B2and B8) which together broadly cover office and industrial (including warehousing) land uses.
The draft report includes an Executive Summary which provides an overview of the key findings andconclusions. The Eastern Berkshire EDNA report can be downloaded here.
The study has been carried out in accordance with the Planning Practice Guidance and follows amethodology that was previously consulted on with wider stakeholders. It is important that this assessmenthas been based upon robust and credible evidence, and is informed through consultations with keystakeholders including neighbouring authorities and other bodies with an interest in economic developmentacross the wider sub-region.
We are inviting your feedback and comments on the draft Eastern Berkshire EDNA and would be grateful if
Introduction
Eastern Berkshire Economic Development Needs Assessment – Draft ReportConsultation
1

you could complete this short survey by Tuesday 5th July.
Evidence from this two part study will be used, alongside other economic evidence, to inform thepreparation of economic policies in each local authority’s future local plan process(s) as well as othereconomic development work within and between the local authorities, and the work of the TVBLEP. Thestudy represents early stage technical analysis and there will be further work to do on specific tasks andtopics in due course.
If you have any queries about this survey, or would like more information about the study, please contactCaroline Perkins at TVBLEP on 0118 945 0201 or [email protected].
2

Survey Participants
Eastern Berkshire Economic Development Needs Assessment – Draft ReportConsultation
Name
Organisation
Email Address
Phone Number
1. Please provide your details below so that we can better understand the context of your feedbackand comments.
3

This page provides an opportunity to comment on the analysis undertaken in Section 2.0 of the draft study.Please refer to specific paragraph numbers where relevant.
Section 2.0: Overview of Employment Space
Eastern Berkshire Economic Development Needs Assessment – Draft ReportConsultation
2. Do you have any comments regarding the analysis of employment (i.e. B use class) space inthe Eastern Berkshire FEMA as set out in Section 2.0?
4

This page provides an opportunity to comment on the analysis undertaken in Section 3.0 of the draft study.Please refer to specific paragraph numbers where relevant.
Section 3.0: Commercial Property Market Signals and Intelligence
Eastern Berkshire Economic Development Needs Assessment – Draft ReportConsultation
3. Do you have any comments regarding the analysis of the commercial property market inthe Eastern Berkshire FEMA as set out in Section 3.0?
5

This page provides an opportunity to comment on the analysis undertaken in Section 4.0 of the draft study.Please refer to specific paragraph numbers where relevant.
Section 4.0: Future Requirements for Employment Space
Eastern Berkshire Economic Development Needs Assessment – Draft ReportConsultation
Scenario 1: BaselineLabour Demand
Scenario 2: PastCompletion Rates
Scenario 3: LabourSupply
4. Do you have any comments regarding the development of the three future economic scenariospresented in Section 4.0:
5. Do you have any comments regarding the calculation of Gross Employment Space and LandRequirements as set out in Section 4.0?
6
This page provides an opportunity to comment on the overall conclusions set out in Section 5.0, as well asto provide any other comments regarding the draft study. Please refer to specific paragraph numbers whererelevant.
Section 5.0: Policy Implications and Conclusions
Eastern Berkshire Economic Development Needs Assessment – Draft ReportConsultation
6. Do you have any comments regarding the overall conclusions of the study (including theassessment of future economic development needs) and potential policy approaches in relation toemployment space for emerging Local Plans across the Eastern Berkshire FEMA?
7. Do you have any other comments regarding the analysis undertaken for the draft EasternBerkshire Economic Development Needs Assessment?
Thank you for taking the time to provide your feedback and comments.
7

Eastern Berkshire FEMA : Economic Development Needs Assessment
10758685v8 P61
Appendix 6 Emerging Findings Consultation
Responses Summary
Responses to the emerging findings consultation were received from the following consultees. Not all respondents provided written responses or comments on the emerging study findings; ID reference numbers are provided below to illustrate where comments were received.
Surrey County Council (ID: EF1)
SEGRO (ID: EF2)
Eacotts International Limited (ID: EF3)
David Hilton (resident) (ID: EF4)
Spelthorne Borough Council (ID: EF5)
Buckinghamshire County Council (ID: EF6)
South Bucks and Chiltern District Councils (ID: EF7)
Windsor Link Railway (ID: EF8)
Wycombe District Council (ID: EF9)

Eastern Berkshire FEMA : Economic Development Needs Assessment
P62 10758685v8
Consultation Response ID Ref NLP Comments/Response
Section 2.0: Overview of Employment Space
2. Do you have any comments regarding the analysis of employment (i.e. B use class) space in the Eastern Berkshire FEMA as set out in Section 2.0?
We note the comment in section 2.0 that ‘With PDR now confirmed as permanent, it will be necessary for Slough Borough Council and the Royal Borough of Windsor & Maidenhead to carefully monitor future losses of office floorspace to determine whether additional provision becomes necessary over and above the requirements set out in Section 4.0.’. The refresh of EnterpriseM3’s Commercial Property Market Study has also concluded that there is a need to review the impact of PDR and lobby Government if necessary. The position in Eastern Berkshire is similar to the position in adjoining parts of Surrey and we would urge the Berkshire authorities to work with Surrey authorities in addressing this issue if needed.
EF1 Comment noted.
Industrial demand is at its highest SEGRO have known with voids of about 4%. This is in stark contrast to the office market and the amount of consented sites that may not be built. There is lack of available land and space for industrial property
EF2 Comment noted.
General direction of travel to be supported - the need for more B space requires the release of more land alongside the need for more residential
EF2 Comment noted.
There is a shortage of land for B uses but particularly B2 and B8
EF2 Comment noted.
Paragraph 2.33 notes that permitted development rights are expected to have a significant effect on the supply of office floorspace in Slough and as such, it is agreed that continued monitoring is important.
Spelthorne has a query regarding prior approvals and the extent to which these have been fully taken into account - in particular those that are still being implemented and might not have been reflected in the survey data. In many areas the losses of office space through permitted development rights are very significant, however the time periods over which the Slough (2004/05 to 2013/14) and RBWM (2005/06 to 2014/15) data has been collected largely misses the period in which we have seen prior approvals for offices to residential implemented.
EF5
The EDNA analysis is inevitably constrained by availability of monitoring data on office to resi PD conversions, although we have analysed the most recent monitoring data available at the time of analysis.
This commentary also draws upon the more qualitative feedback that has been obtained through consultation with economic stakeholders active in the FEMA, including commercial property market agents.
Windsor & Maidenhead should not be considered as one block. They are different towns with different problems and opportunities, which just happen to be in the same unitary authority. The ' gradual decreasing stock' of office space noted in the report only applies to the borough on average. It therefore masks the precipitous decline in office space in Windsor. This puts increased pressure on Windsor transport, which is already over-capacity and results in a town which is not being adequately planned for. Again, the 'neglible' loss of office space quoted in the report is anything but neglible from the perspective of Windsor town centre, particularly for traders who rely on office workers for custom.
EF8
Analysis of employment space trends within the EDNA is inevitably constrained by the geographical area for which data is available. However, more detailed property market commentary from an individual town perspective is provided in Chapter 3.

Eastern Berkshire FEMA : Economic Development Needs Assessment
10758685v8 P63
Consultation Response ID Ref NLP Comments/Response
Section 3.0: Commercial Property Market Signals and Intelligence
3. Do you have any comments regarding the analysis of the commercial property market in the Eastern Berkshire FEMA as set out in Section 3.0?
3.11 - it is not correct to say that the majority of requirements are localized. There are a lot of requirements which end up outside our area as there is a lack of large sites to accommodate demand. I believe the demand for industrial space will be strong across the remainder of East Berks, if space and land was available
EF2 Text at para 3.11 tweaked to reflect this comment.
Spelthorne Borough Council welcomes the fact that the Berkshire authorities have been working together across local authority boundaries to produce an Economic Development Needs Assessment due to their strong economic ties. Paragraph 3.8 and Figure 3.1 identify that in the western corridor there are several sub-markets. Given these shared ties, there needs to be cooperation and regard for other neighbouring authorities, with a recognition that boundaries are not fixed and economic activity extends beyond.
EF5 Comment noted.
Placement of Windsor in the 'upper M4' FCPMA is wrong. It is more closely linked to Slough and West London. This analysis seems to have been done for political reasons, to match political boundaries, rather than based on geographic and behavioural data.
Also, consultants should stop referring to train links as 'good'. This applies to Maidenhead but is not true for Windsor. Despite having two stations, the latter has the worst rail connections, measured by frequency of trains, seats per hour, and direct destinations accessible. Orbital connections are also surprisingly bad, with journeys to the M40 and M3 corridors in many cases impractical. Rail links to Heathrow will improve for Maidenhead and Slough with the WRAtH project but journeys other than by taxi will remain impractical for both Windsor and Ascot.
3.25 says that heritage constraints mean that demand is for smaller premises. This is confusing supply (which is heritage limited) and demand (which is not). Some mention should be made of the Alma Road office development which has planning permission and remains part of the strategic supply.
EF8
The process of defining the three Berkshire FEMAs and property market areas is described in the Part One Berkshire FEMA study which also presents the evidence that was used to inform these conclusions. This includes an assessment of transport, infrastructure and connectivity factors.
This consultation on the EDNA study specifically focuses on the economic development needs that have been identified for each of these FEMAs.
Future employment space availability falls beyond the scope of the EDNA and should be explored as part of an employment land supply side assessment.
Section 4.0: Future Requirements for Employment Space
4. Do you have any comments regarding the development of the three future economic scenarios presented in Section 4.0:
Scenario 1: Baseline Labour Demand
Paragraph 7.4 states that forecasts of employment growth were obtained from 2013 Cambridge Econometrics. Given that these forecasts are a few years old and do not reflect the latest macro-economic outlook, these figures need to be approached with caution and utilised with this delay in mind.
EF5 Comment noted. This issue has been highlighted within the EDNA.

Eastern Berkshire FEMA : Economic Development Needs Assessment
P64 10758685v8
Consultation Response ID Ref NLP Comments/Response
Scenario 2: Past Completion Rates
Paragraph 4.27 notes that the completions over such a period as 10 years or more should even out demand fluctuations in a business cycle. Given that many of the years monitored by Slough and Windsor & Maidenhead covered a period of recession, are the authorities confident that the trends in rate of completions are reflective of the whole period and are likely to continue into the future? Spelthorne has concern over the assessment of past development rates in that if development is not occupied then it becomes a less accurate measure of demand. It would be useful to see if vacancy levels in the property market remained constant through the period assessed or if this is taken into account at all.
EF5
The 10 year monitoring period does include a number of years of recession, but also a number of years of economic growth pre 2008.
The Conclusions chapter (Chapter 5) notes that the past take-up based scenario provides a less robust basis for understanding objectively assessed need arising from economic growth.
Past-take up rates is just one of a number of approaches that have been considered by the EDNA (in line with PPG guidance).
Scenario 3: Labour Supply
5. Do you have any comments regarding the calculation of Gross Employment Space and Land Requirements as set out in Section 4.0?
I am concerned about the skills gap and the need to adequately train and develop staff. If we had high skills levels that would enhance our attractiveness
EF2
This issue is considered to fall beyond the scope and remit of the EDNA and could perhaps be explored through other evidence base studies.
Paragraph 7.4 states that forecasts of employment growth were obtained from 2013 Cambridge Econometrics. Given that these forecasts are a few years old and do not reflect the latest macro-economic outlook, these figures need to be approached with caution and utilised with this delay in mind.
EF5 Comment noted. This issue has been highlighted within the EDNA.
The requirements for Windsor & Maidenhead should be separated out. Transport links between the two are not great, with a train link that is slower than cycling, and just two road links, either via the M4 or via Bray, both of which are over-capacity during commuter hours. It is not therefore sensible to treat them as one area and without a major transport intervention they cannot function as one.
EF8
Analysis of employment space requirements within the FEMA is inevitably constrained by the geographical area for which data is available (in most cases this aligns with local authority areas). This is however supplemented and triangulated with qualitative feedback on the spatial distribution of requirements which is summarised in Chapter 5 (Conclusions and Policy Implications).
Section 5.0: Policy Implications and Conclusions
6. Do you have any comments regarding the overall conclusions of the study (including the assessment of future economic development needs) and potential policy approaches in relation to employment space for emerging Local Plans across the Eastern Berkshire FEMA?
We note the overall conclusion that ‘whilst growth needs have been identified on a FEMA wide and individual local authority basis, there will be some degree of footloose needs that potentially operate and can be accommodated across individual local authority boundaries.’ In taking forward the study we would like to draw Slough Borough Council and the
EF1 Comment noted.

Eastern Berkshire FEMA : Economic Development Needs Assessment
10758685v8 P65
Consultation Response ID Ref NLP Comments/Response
Royal Borough of Windsor and Maidenhead’s attention to a study currently being carried out by Enterprise M3 to refresh its commercial property market study. The report will shortly be available to download from the Enterprise M3 website. The report summarises the demand for office and industrial space across the Enterprise M3 area some of which adjoins the Eastern Berkshire FEMA.
I see a shortage of industrial land and premises across East and Central Berkshire. This will inhibit our ability to accommodate future business growth. The demand for future offices has to be moderated. Big future drivers will be access to super-fast broadband or its equivalent for commercial space, particularly SMEs. Also need a strategy to provide adequate power into the area for future businesses
EF2
The issue of infrastructure provision is considered in more detail through the Part One Berkshire FEMA study.
Given the points raised previously regarding prior approvals and vacancy rates, the eastern Berkshire authorities should be aware that these factors have implications that could materially alter the conclusions the study has come to.
EF5 Comment noted.
The absence of intra-regional transport links (e.g. orbital around London, between Windsor & Maidenhead, Slough and Windsor, Windsor and Ascot etc) as well as inter-regional (e.g. Maidenhead to SW London) with the capacity to carry the forecast increase in employment has not been considered. This will be a major impediment to economic growth. As the LEP has no plans to address this, the forecasts therefore optimistic. Proposals such as the Windsor Link Railway which do address this demand should therefore be a part of the LEP's plans.
EF8
This is an issue that is considered to fall beyond the scope and remit of the EDNA and could perhaps be explored through other evidence base studies.
7. Do you have any other comments regarding the analysis undertaken for the draft Eastern Berkshire Economic Development Needs Assessment?
It is believed that the Economic Development Needs Assessment provides a comprehensive analysis, however there are some queries which need addressing. We wish to continue a dialogue on economic matters owing to certain functional interactions between Eastern Berkshire authorities and Spelthorne.
EF5 Comment noted.
There are several cross boundary infrastructure links and other cross boundary relationships between the Berkshire Authorities and Buckinghamshire. BCC would want to continue to be made aware of the development needs of the Berkshire Authorities as that will be an important matter for planning in Buckinghamshire.
EF6 Comment noted.
South Bucks and Chiltern District Councils have commissioned a number of studies to establish the housing and economic market area(s) to underpin our new local plan. The studies by ORS and Atkins conclude that Chiltern District falls entirely within a Central Buckinghamshire housing and economic market area comprising Chiltern, Wycombe District and part of Aylesbury Vale District. South Bucks District falls partly within the Central
EF7
The process of defining the three Berkshire FEMAs (Eastern, Central and Western) is described in the Part One Berkshire FEMA study which also presents the evidence that was used to inform these conclusions.
This consultation on the EDNA study specifically focuses on the

Eastern Berkshire FEMA : Economic Development Needs Assessment
P66 10758685v8
Consultation Response ID Ref NLP Comments/Response
Buckinghamshire housing and economic market area, and partly within a Berkshire-wide housing and economic market area with Slough and Bracknell Forest, Reading, West Berkshire, Windsor and Maidenhead and Wokingham.
Housing and economic market areas for plan-making purposes are defined on a 'best fit' basis. In most instances the best fit is based on a single local authority area. However, because South Bucks and Chiltern District Councils are preparing a joint local plan the best fit is defined based on the whole plan area. The evidence prepared on behalf of the Buckinghamshire local authorities indicates the best fit for a Chiltern and South Bucks Local Plan is the Buckinghamshire Housing Market Area and Functional Economic Market Area comprising the whole of Aylesbury Vale, Chiltern, South Bucks and Wycombe Districts.
The same evidence for the Buckinghamshire authorities also supports a single Berkshire-wide housing and economic market area comprising Slough, Bracknell Forest, Reading, West Berkshire, Windsor & Maidenhead and Wokingham. On this basis, South Bucks and Chiltern District Councils do not recognise a Berkshire housing market area geography that includes South Bucks District for plan-making purposes. Nor do we recognise a geography that defines an Eastern Berkshire Housing Market Area, whether that includes or excludes South Bucks District. We consider that the Berkshire housing market area geography is flawed and may be an unsound basis for plan-preparation.
economic development needs that have been identified for each of these FEMAs.
We also question whether a single local authority area – in this case Windsor & Maidenhead – can logically sit across two FEMAs on a best fit basis.
EF7
The rationale for concluding that Windsor & Maidenhead sits across two FEMAs is described in detail in the Part One FEMA study.
National Planning Practice Guidance (Paragraph: 035, Reference ID: 2a-035-20140306) confirms that economic development needs assessments should set out clear conclusions on the levels of quantitative and qualitative predicted need. This forms an important input to the local plan preparation process; plan makers need to consider housing and economic strategies in light of needs.
Based on this guidance, we consider that Section 5 of the draft document goes beyond the remit of an Economic Development Needs Assessment. In particular, the sections of the report on 'Accommodating Growth' and 'Windsor & Maidenhead' stray into what is properly the remit of the local making process, pre-empting that process, including Duty to Co-operate discussions. Section 5 should be edited so that its scope is limited to conclusions on forecast levels of need.
EF7
Chapter 5 of the EDNA study draws a number of conclusions and recommendations based on an objective assessment of economic development needs. It is ultimately down to each LPA to decide if and how these recommendations are taken forward through the duty to cooperate.
One comment we would like to make is in relation to the Eastern Berkshire FEMA and inclusion of High
EF9 To confirm, the Eastern Berkshire FEMA that has been defined for

Eastern Berkshire FEMA : Economic Development Needs Assessment
10758685v8 P67
Consultation Response ID Ref NLP Comments/Response
Wycombe in it. We are concerned that the identified FEMA includes High Wycombe and the reference made in the report to development needs identified in the FEMA being accommodated in these areas.
This seems to be at odds with the FEMA identified for the Central Buckinghamshire authorities and as such we would like to express our concerns on the extent of the Eastern Berkshire FEMA, it’s inclusion of High Wycombe.
the purposes of this EDNA study does not include High Wycombe town or Wycombe District. The Part One FEMA study notes that there are strong economic linkages between parts of Berkshire and the town of High Wycombe from a commercial property market perspective, although from a ‘best fit to local authority boundaries’ approach, Wycombe District is not included within any of the Berkshire FEMAs.
Eastern Berkshire FEMA : Economic Development Needs Assessment
P68 10758685v8
Appendix 7 List of Consultees
Bracknell Economic and Skills Development Partnership
Caroline Waldron, Lambert Smith Hampton
Duncan Campbell, Campbell Gordon
Gareth Osborn, SEGRO
Heather Harvey-Wood, Cushman & Wakefield
Jon Varney, Deal Varney
Matthew Battle, Thames Valley Property Forum
Neil Stokes, Martin and Pole
Nick Hardy, Page Hardy Harris
Philip Hunter, Lambert Smith Hampton
Shane Prater, Quintons Chartered Surveyors
Simon Fryer, Fryer Commercial
Steve Griffin, Pennicott

Eastern Berkshire FEMA : Economic Development Needs Assessment
10758685v8 P69
Appendix 8 VOA Floorspace Maps


Eastern Berkshire FEMA : Economic Development Needs Assessment
P70 10758685v8
Appendix 9 IDBR Business Maps


Eastern Berkshire FEMA : Economic Development Needs Assessment
10758685v8 P71
Appendix 10 Cambridge Econometrics
Employment Projections -
Methodology and data sources
Cambridge Econometrics (CE) projections are baseline economic forecasts
based on historical growth within the local area relative to the region or UK (i.e.
depending on which area it has the strongest relationship with), on an industry-
by-industry basis. The forecasts assume that those relationships continue into
the future. Thus, if an industry in the local area outperformed the industry in the
region (or the UK) as a whole in the past, then it will be assumed to also do so
in the future. Similarly, if it underperformed in the past then it will be assumed
to underperform in the future.
It is important to note that there are inherent limitations to the use of economic
forecasts of this type, particularly within the context of recent changes in the
economy. National macroeconomic assumptions are taken as the starting point
and then modelled down to the regional and local levels by reference to the
existing economic profile and sectoral composition of an area. Local level data
is less comprehensive and reliable than at national and regional levels, which
can affect how the modelling is calibrated. Similarly, top-down forecasts do not
take account of specific local factors that might influence employment growth.
However forecasts are recognised by the PPG as a valuable input to indicate
the broad scale and direction of future economic growth in different sectors,
which helps to assess the future land requirements of a local area.
At the time of preparation (September 2013), the following macroeconomic
assumptions at UK level were made by CE, representing key drivers for the
local level projections:
GDP growth of around 2.25% in 2014, following 1.5% growth in 2013,
driven by continued modest growth in household expenditure, improving
consumer confidence and growth in real incomes during 2014.
Government consumption expected to fall in 2014 as further austerity
measures take effect, although this will be outweighed by an increase in
investment as business confidence improves.
Domestic and global demand is expected to recover only slowly, which
means slower growth rates in imports and exports are predicted.
Growth in financial and business services expected to accelerate to
approximately 2.5% in 2014, with this growth remaining relatively modest
by historic standards, but will lead UK GVA growth in 2014 and will give a
boost to investment.
Slowly recovering construction sector with the information and
communication sector expected to make modest contributions to the UK
GVA levels in 2014.

Eastern Berkshire FEMA : Economic Development Needs Assessment
P72 10758685v8
Eurozone remains a risk with anaemic growth expected to continue in the
short to medium term. This means that there is likely to be weak demand
from the Eurozone for UK exports.

Eastern Berkshire FEMA : Economic Development Needs Assessment
10758685v8 P73
Appendix 11 Baseline Cambridge Econometrics
Employment Projections
Historic and forecast workplace job growth by sector taken from the economic
projections prepared by Cambridge Econometrics (2013) is summarised below.
Eastern Berkshire FEMA
Sector
Workplace Jobs in Eastern Berkshire FEMA
1996 2013 2036 Change
(2013 - 2036)
Agriculture, Forestry & Fishing 1,476 393 569 176
Extraction & Mining 37 32 10 -22
Food, Drink & Tobacco 3,651 1,904 1,290 -614
Textiles & Clothing 271 295 73 -222
Wood & Paper 1,052 229 218 -11
Printing and Recorded Media 1,588 736 917 181
Fuel Refining 9 26 19 -7
Chemicals 2,088 1,761 1,168 -593
Pharmaceuticals 261 425 293 -132
Non-Metallic Products 1,818 839 782 -57
Metal Products 2,820 810 808 -2
Computer & Electronic Products 1,991 1,305 892 -413
Machinery & Equipment 2,455 871 1,230 359
Transport Equipment 1,138 282 124 -158
Other Manufacturing 1,527 1,199 1,198 -1
Utilities 1,222 2,878 3,256 378
Construction of Buildings 2,393 2,798 4,235 1,437
Civil Engineering 990 2,656 3,922 1,266
Specialised Construction Activities 5,371 6,301 8,558 2,256
Wholesale 15,752 14,354 16,730 2,376
Retail 14,707 12,293 12,951 658
Land Transport, Storage & Post 7,965 11,876 18,612 6,736
Air & Water Transport 189 290 406 116
Accommodation & Food Services 9,877 11,178 13,706 2,528
Recreation 3,952 6,202 4,964 -1,238
Media Activities 1,394 1,825 1,537 -288
Telecoms 0 0 0 0
Computing & Information Services 9,939 20,589 24,706 4,117
Finance & Insurance 4,522 2,748 2,061 -687
Insurance & Pensions 0 0 0 0
Real Estate 1,505 3,094 3,577 483
Professional Services 14,642 19,206 22,309 3,103
Administrative & Supportive Services 14,094 17,193 24,293 7,100
Other Private Services 4,942 5,171 5,069 -102
Public Administration & Defence 4,822 4,762 4,006 -756
Education 9,862 13,080 11,586 -1,494
Health 6,935 8,114 8,993 879
Residential Care & Social Work 4,629 5,717 5,477 -240
Total (rounded) 161,885 183,435 210,545 27,110

Eastern Berkshire FEMA : Economic Development Needs Assessment
P74 10758685v8
Slough
Sector
Workplace Jobs in Slough
1996 2013 2036 Change
(2013 - 2036)
Agriculture, Forestry & Fishing 809 66 96 30
Extraction & Mining 14 8 5 -3
Food, Drink & Tobacco 3,306 1,747 1,220 -527
Textiles & Clothing 177 89 6 -83
Wood & Paper 291 158 118 -40
Printing and Recorded Media 592 399 504 105
Fuel Refining 0 0 0 0
Chemicals 1,689 1,368 972 -396
Pharmaceuticals 203 413 286 -127
Non-Metallic Products 1,585 598 552 -46
Metal Products 2,029 501 506 5
Computer & Electronic Products 1,410 844 551 -293
Machinery & Equipment 1,938 536 770 234
Transport Equipment 984 157 79 -78
Other Manufacturing 753 286 286 0
Utilities 838 1,528 1,583 55
Construction of Buildings 1,268 1,257 1,627 370
Civil Engineering 693 106 103 -3
Specialised Construction Activities 3,370 3,569 4,272 704
Wholesale 9,457 8,899 10,186 1,287
Retail 7,080 5,906 6,232 326
Land Transport, Storage & Post 6,763 9,770 15,233 5,463
Air & Water Transport 73 257 362 105
Accommodation & Food Services 3,699 3,187 3,575 388
Recreation 1,331 1,141 1,179 38
Media Activities 447 462 415 -47
Telecoms 0 0 0 0
Computing & Information Services 6,505 13,459 15,855 2,396
Finance & Insurance 1,652 1,022 756 -266
Insurance & Pensions 0 0 0 0
Real Estate 348 424 503 79
Professional Services 6,560 7,820 9,605 1,785
Administrative & Supportive Services 7,483 10,600 14,625 4,025
Other Private Services 1,485 1,663 1,594 -69
Public Administration & Defence 2,973 2,028 1,676 -352
Education 3,509 5,800 4,961 -839
Health 3,974 4,671 5,220 549
Residential Care & Social Work 1,150 2,148 2,051 -97
Total (rounded) 86,440 92,885 107,565 14,680

Eastern Berkshire FEMA : Economic Development Needs Assessment
10758685v8 P75
Windsor & Maidenhead
Sector
Workplace Jobs in Windsor & Maidenhead
1996 2013 2036 Change
(2013 - 2036)
Agriculture, Forestry & Fishing 667 327 473 146
Extraction & Mining 23 24 5 -19
Food, Drink & Tobacco 345 157 70 -87
Textiles & Clothing 94 206 67 -139
Wood & Paper 761 71 100 29
Printing and Recorded Media 996 337 413 76
Fuel Refining 9 26 19 -7
Chemicals 399 393 196 -197
Pharmaceuticals 58 12 7 -5
Non-Metallic Products 233 241 230 -11
Metal Products 791 309 302 -7
Computer & Electronic Products 581 461 341 -120
Machinery & Equipment 517 335 460 125
Transport Equipment 154 125 45 -80
Other Manufacturing 774 913 912 -1
Utilities 384 1,350 1,673 323
Construction of Buildings 1,126 1,542 2,608 1,067
Civil Engineering 296 2,551 3,819 1,269
Specialised Construction Activities 2,001 2,732 4,285 1,553
Wholesale 6,295 5,455 6,544 1,089
Retail 7,627 6,387 6,719 332
Land Transport, Storage & Post 1,202 2,106 3,379 1,273
Air & Water Transport 116 33 44 11
Accommodation & Food Services 6,178 7,991 10,131 2,140
Recreation 2,621 5,061 3,785 -1,276
Media Activities 947 1,363 1,122 -241
Telecoms 0 0 0 0
Computing & Information Services 3,434 7,130 8,851 1,721
Finance & Insurance 2,870 1,726 1,305 -421
Insurance & Pensions 0 0 0 0
Real Estate 1,157 2,670 3,074 404
Professional Services 8,082 11,386 12,704 1,318
Administrative & Supportive Services 6,611 6,593 9,668 3,075
Other Private Services 3,457 3,508 3,475 -33
Public Administration & Defence 1,849 2,734 2,330 -404
Education 6,353 7,280 6,625 -655
Health 2,961 3,443 3,773 330
Residential Care & Social Work 3,479 3,569 3,426 -143
Total (rounded) 75,450 90,550 102,980 12,430

Eastern Berkshire FEMA : Economic Development Needs Assessment
P76 10758685v8
Appendix 12 Definition of B Class Sectors
The method for apportioning workplace employment projections by sector into
B class uses is summarised below, which has drawn on the 2014 BRES data.
Sector Share of Workplace Jobs by Use Class
B1 Offices B2 Industrial B8
Warehousing
Agriculture, Forestry & Fishing Non B Class
Extraction & Mining Non B Class
Food, Drink & Tobacco 0% 100% 0%
Textiles & Clothing 0% 100% 0%
Wood & Paper 0% 100% 0%
Printing & Recorded Media 0% 100% 0%
Fuel Refining 0% 100% 0%
Chemicals 0% 100% 0%
Pharmaceuticals 0% 100% 0%
Non-Metallic Products 0% 100% 0%
Metal Products 0% 100% 0%
Computer & Electronic Products 0% 100% 0%
Machinery & Equipment 0% 100% 0%
Transport Equipment 0% 100% 0%
Other Manufacturing 0% 100% 0%
Utilities 0% 38% 0%
Construction of Buildings Non B Class
Civil Engineering Non B Class
Specialised Construction Activities 0% 53% 0%
Wholesale 0% 33% 67%
Retail Non B Class
Land Transport, Storage & Post 0% 0% 68%
Air & Water Transport Non B Class
Accommodation & Food Services Non B Class
Recreation Non B Class
Media Activities 100% 0% 0%
Computing & Information Services 100% 0% 0%
Finance & Insurance 100% 0% 0%
Real Estate 100% 0% 0%
Professional Services 100% 0% 0%
Administrative & Supportive Services 6% 0% 0%
Other Private Services Non B Class
Public Administration & Defence 10% 0% 0%
Education Non B Class
Health Non B Class
Residential Care & Social Work Non B Class