east west freight corridor trends 29 may 2014 flc wa tha1
TRANSCRIPT
East West Freight Corridor Trends
29 May 2014FLC WA
THA 1
Study aim
To test the thesis that east-west Australian freight volumes and growth rates are being reduced by an increase
in north-south freight into WA
THA FLC WA 2

Study Approach
• Review of available data on east-west corridor freight
• Examination of observed new supply chain behaviour in retail logistics sector
• Suggestions for improved freight analysis
THA FLC WA 3

Available data
• National data sources including BITRE, ABS
• Rail data from network operator
• Sea freight data from BITRE, port authorities
THA FLC WA 4
BITRE 2010Interstate Freight in Australia
• estimated freight on interstate corridors 1972-2007
• disaggregated into separate modes
• forecasts freight to 2030
THA FLC WA 5

East West Freight Task tonne kilometres
THA FLC WA 6

East West Freight Task estimated and forecast growth rates
THA FLC WA 7
East West Rail Freight Task
• Brookfield can supply high level rail data
• Gross tonne kilometres and train counts
• Otherwise data confidential to customers
• No data available on the nature of the freight
THA FLC WA 8
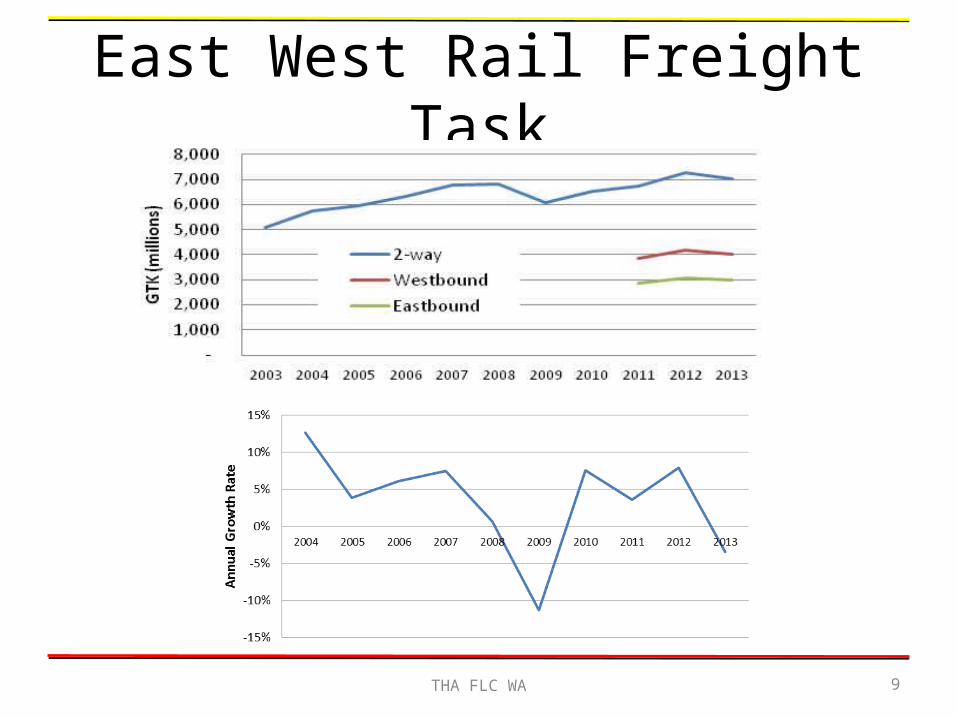
East West Rail Freight Task
THA FLC WA 9
Sea Freight Data
• BITRE annual summary of Australian Sea Freight and port activity
• Aggregated data, difficult to separate bulk from general freight
• Container freight limited to containers carried under coastal voyage permits
THA FLC WA 10
Available data limitations
• Some national time series data (ABS, BITRE etc) available but highly aggregated and questionable
• Often rely on industry surveys• Forecasts usually based on statistical techniques
rather than underlying analysis of freight generating activity
• Lack of good modal data at industry segment level (retail, manufacturing, food etc)
• Understanding container freight made complicated by large empty container volumes
THA FLC WA 11

East-west freight understanding
• East-west volumes have grown strongly since 1970s
• Rail dominates land transport, but coastal sea freight significant
• Volatile bulk minerals freight movements (especially by sea) can disguise trends in general freight (household and manufacturing)
THA FLC WA 12
Container Freight into Fremantle
• Trade data accumulated into broad industrial groupings for last 10 years
• Full International imports 272,000 TEU, growing 9% per year to 2013
• Full Coastal ‘imports’ 56,000 growing at 3.5%
• 2014 volumes estimated from ytd April
THA FLC WA 13
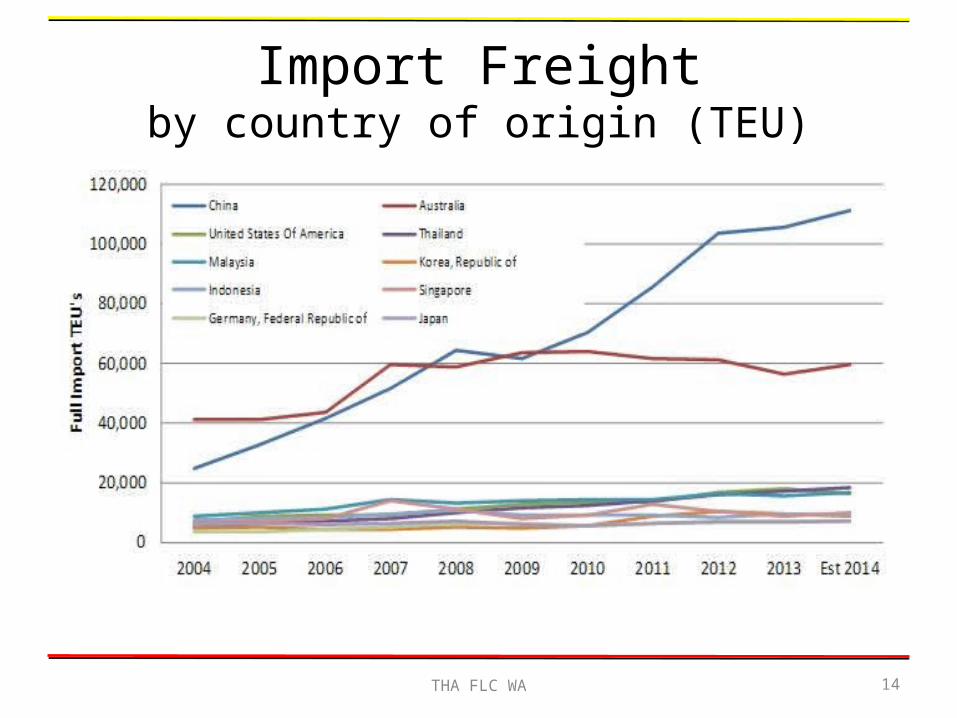
Import Freightby country of origin (TEU)
THA FLC WA 14
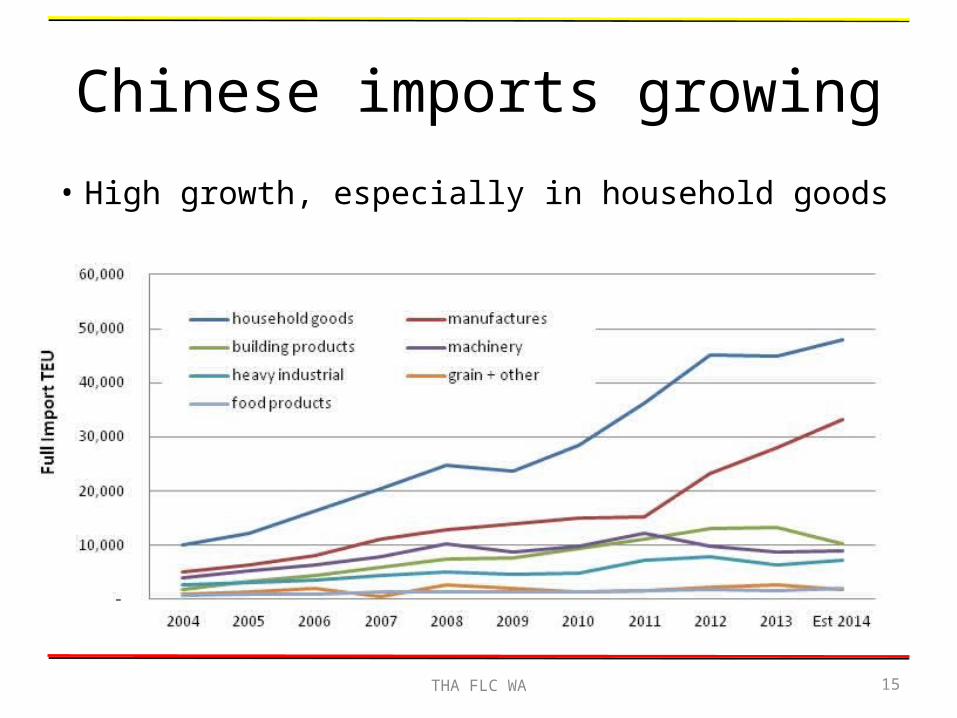
Chinese imports growing
THA FLC WA 15
• High growth, especially in household goods
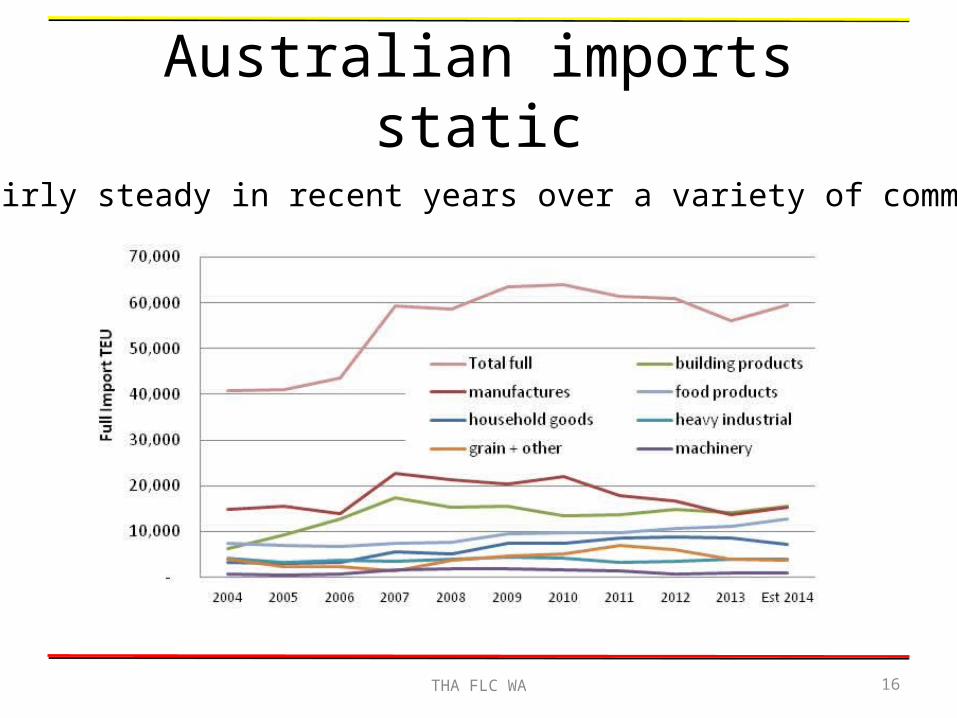
Australian imports static
THA FLC WA 16
•Trade fairly steady in recent years over a variety of commodities

East West Freight - best available estimates
THA FLC WA 17
-
1,000
2,000
3,000
4,000
5,000
6,000
7,000
8,000
9,000
10,000
2007 2008 2009 2010 2011 2012 2013
Inte
rsta
te T
on
ne
s (0
00
's)
Sea
Rail
Road
Best estimates suggest modal split: 7% sea, 62% rail, 31% road
Data woefully inadequate to identify trends in general freight

Retail Supply Chain Trends
• Two sectors:– Supermarkets and grocery– Consumer goods
• Supermarket sector highly concentrated, Coles and Woolworths controlling 73% sales (est 12k TEU pa)
• Consumer sector relies more heavily on imports and is much more disaggregated (est 60k TEU pa)
Source THA,IBIS World G4111
THA FLC WA 18

Retail Study 1 – Kmart (Sydney)
• Example of increased dependence on imports affecting supply chain
• 50,000sqm warehouse opened Eastern Creek 2003• Receiving point for all NSW supplies• Handles 400 TEU per week• Large container storage space – long supply chain• Low value high volume product• WA supplied direct from overseas to local DC• No significant interstate movements
THA FLC WA 19
Retail Study 2 - Target
• National Melbourne centred distribution model to 2013 • Replaced with regional DC model, increased imports,
potential for streamlining• Malaysian hub packs store-specific containers from
various Asian sources• Also imports from China and Bangladesh direct into
Fremantle• Reduction in east-west freight movement• CTI Logistics facility growing from 2000sqm to 30,000sqm
in 5 years
THA FLC WA 20

Target chain realignment
THA FLC WA 21
Target’s Supply Chain – 2013 Target’s Supply Chain – 2014
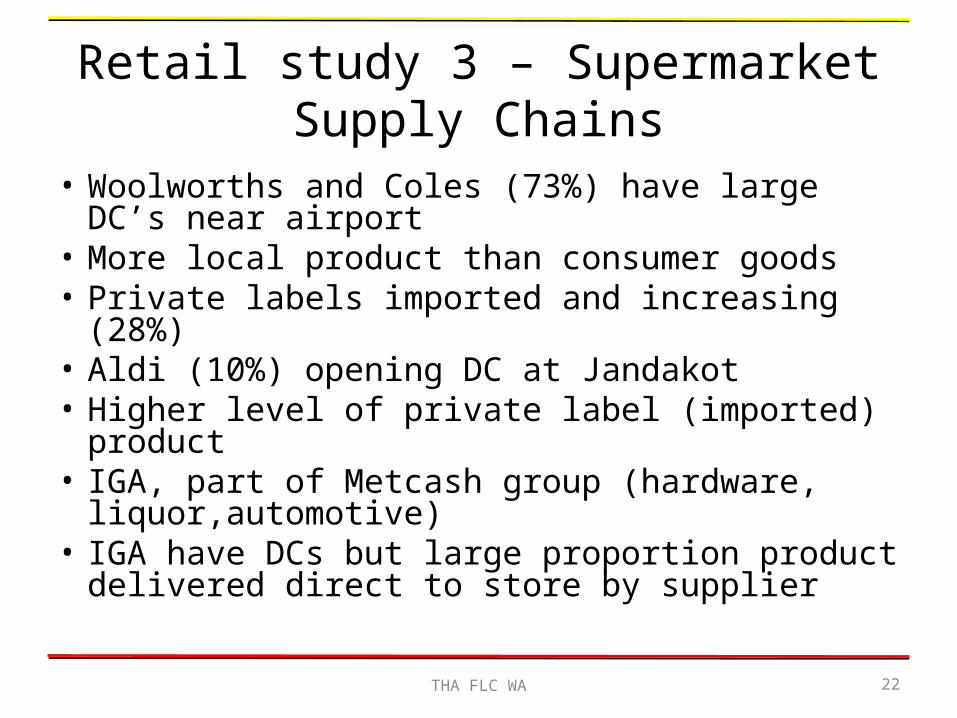
Retail study 3 – Supermarket Supply Chains
• Woolworths and Coles (73%) have large DC’s near airport
• More local product than consumer goods• Private labels imported and increasing (28%)• Aldi (10%) opening DC at Jandakot• Higher level of private label (imported) product• IGA, part of Metcash group (hardware,
liquor,automotive) • IGA have DCs but large proportion product
delivered direct to store by supplier
THA FLC WA 22
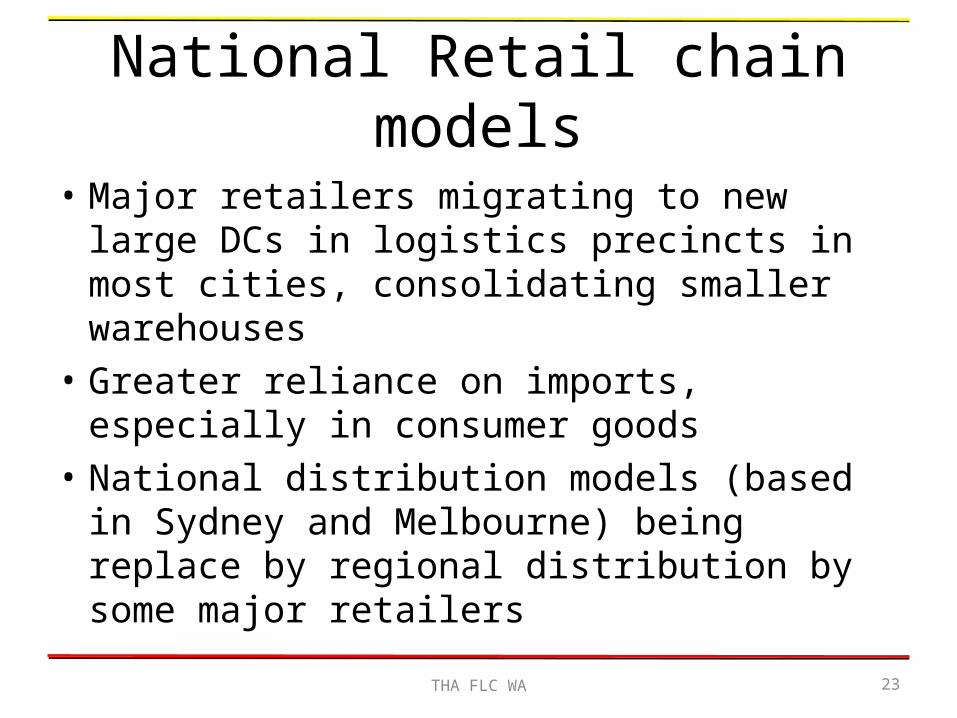
National Retail chain models
• Major retailers migrating to new large DCs in logistics precincts in most cities, consolidating smaller warehouses
• Greater reliance on imports, especially in consumer goods
• National distribution models (based in Sydney and Melbourne) being replace by regional distribution by some major retailers
THA FLC WA 23

Supply Chain Findings
• Significant reorientation around Asian supply networks for some if not all retailers
• Scale of Perth warrants move away from east coast DC model
• Potential significant impact on land use in Forrestfield/ Hazlemere
• Volumes small in overall east-west context but growing
THA FLC WA 24
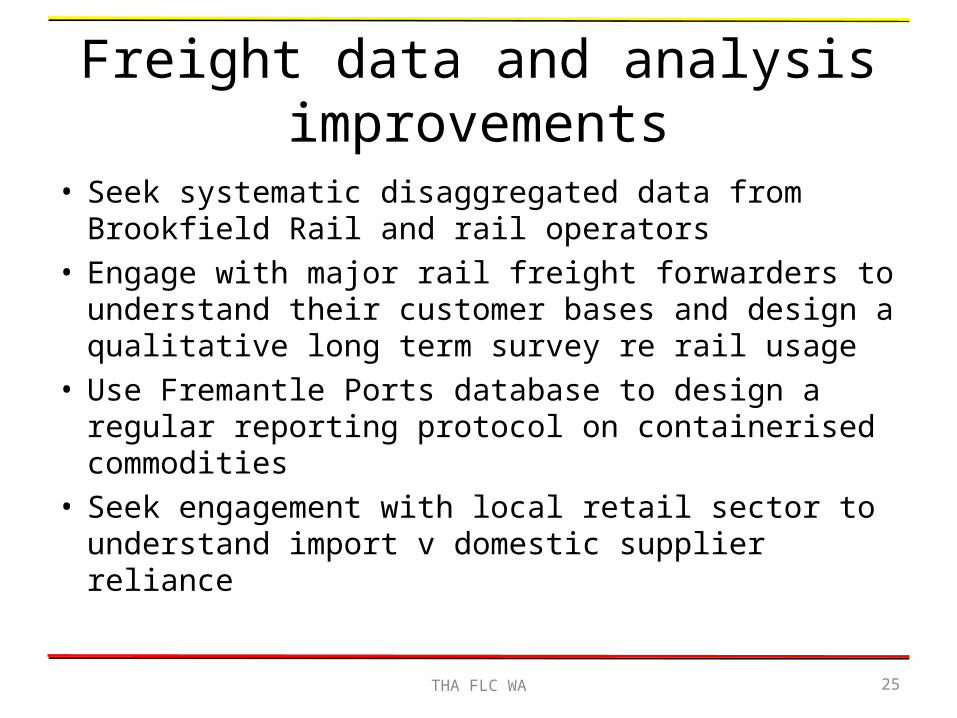
Freight data and analysis improvements
• Seek systematic disaggregated data from Brookfield Rail and rail operators
• Engage with major rail freight forwarders to understand their customer bases and design a qualitative long term survey re rail usage
• Use Fremantle Ports database to design a regular reporting protocol on containerised commodities
• Seek engagement with local retail sector to understand import v domestic supplier reliance
THA FLC WA 25