east regional biomass roadmap update workshop · the vision for bioenergy and biobased products ......
TRANSCRIPT

Click to edit Master title style
Click to edit Master title style
2
East Regional Biomass Roadmap Update Workshop
Federal Biomass RampD Technical Advisory Committee
US DOE and USDA SUNY ESF
Marx Hotel Conference Center Syracuse New York
September 19-20
1
Current status of Update Process
Biomass Vision and Roadmap Update
1
Click to edit Master title style
Click to edit Master title style
What is the Vision
bull The Vision for Bioenergy and Biobased Products in the United States was created in 2002
bull It established far-reaching goals to increase the role of biobased energy and products in our nationrsquos economy
bull It represented the collective vision of the Biomass Research and Development Technical Advisory Committee established by the Biomass RampD Act of 2000
3
Vision Update
bull The Energy Policy Act of 2005 mandated an update of the Vision and Roadmap
bull The updated Vision does not change the original 2010goals but recognizes that in some cases the US is not on track to meet them
bull The Vision makes minor changes to its 2020 and 2030 goals and establishes 2015 goals which describe the types of activities that must occur to reach that goal and move down the path to the aggressive targets for 2020 and 2030
bull Updated Vision was reviewed by 74 experts in the field including an independent peer review
bull The Vision update will be available in October 2006
4
2
Click to edit Master title style
Click to edit Master title style
5
Updated Vision Goals
6
Roadmap to this Future
3
Click to edit Master title style
Click to edit Master title style
Vision Goals relative to Other High Profile Recommendations
2010 2020 2025 2030 BIOFUELS GOALS Vision (billion gallons) 11 17 34 68 Presidents Biofuels Initiative (billion gallons) -- -- -- 60 Aspen ldquoA High Growth Strategy for Ethanolrdquo (billion gallons) -- -- 100 --
TOTAL ENERGY GOALS Vision ndash Quads 4 5 7 10 25x25 quads -- -- 32 --
BIOBASED PRODUCTS GOALS Biobased Products (billion lbs) 24 36 45 55
25xrsquo25 includes solar wind and biofuels across all sectors Committee Vision includes only biomass in transportation industrial and utility sectors It does not include residential and commercial sectors
7
Comparison of Approaches of Various National Efforts
Goal Areas
Approach Outcomes
National Biomass Initiative
Biofuels Biopower Bioproducts
Vision workshop to update goals followed by peer review (final Sept rsquo06) Three Region-specific Roadmap workshops
bullRoadmap of RampD and policy strategies and timelines (regional and national perspective) bullGuidance to RampD Board bullGuidance for annual joint USDADOE solicitation bullUsed to monitor progress by agencies
Presidentrsquos Biofuels Initiative
Cellulosic ethanol
Convened 30xrsquo30 workshop Compiling outputs from multiple strategic planning sessions
bullRampD amp policy strategies to provide basis for DOE RampD planning bullFederal Posture Plan to map agency roles
Aspen Institute
Ethanol Convened experts for 3-4 day dialogue
Generated 16 unanimous recommendations on RampD policy and incentives
25 x lsquo25 Wind Solar Biofuels
Holding planning meetings and established workgroups
Roadmap of RampD and policy recommendations (draft Oct lsquo06)
Includes National Biomass Initiative Roadmap workshops regional feedstock partnership workshops etc 8Work groups include Biofuels Electric Generation from RE Outreach amp Education RE in other Sectors amp
Natural Resources amp Wildlife
4
Click to edit Master title style
Click to edit Master title style
What is the Roadmap
bull Developed to map RampD needed to achieve original Vision goals
bull Used to guide annual joint DOEUSDA solicitation under the Biomass Initiative
bull Provides guidance to federal agencies on direction for biomass related RampD
9
Roadmap Update Process
bull Roadmap Update Workshops are planned by Regional Chairs with BCSDOE support
bull Workshops incorporate regional experts pertaining to the Roadmap categories Feedstocks Processing and Conversion Product Uses and Distribution Public Policy
10
5
Click to edit Master title style
Click to edit Master title style
Regional Roadmap Workshops
bull Update Roadmap language bull Incorporate New federalstate activities
ndash Renewable Fuels Standards bull Produce 8 million gallons of ethanol by 2012
ndash Biofuels Initiative bull Decrease cost to $107 per gallon of ethanol by 2010 bull Displace 40 billion gasoline equivalent gallons by 2030
bull Revisit path towards achieving Vision Goals bull Invitation only with regional experts
11
Roadmap Timeline
bull Midwest Regional Roadmap ndash Chair Tom Binder ADM ndash Chicago IL April 11-12 2006
bull West Regional Roadmap ndash Ralph Cavalieri Washington State ndash Sacramento CA August 8-9 2006
bull East Regional Roadmap ndash Douglas Hawkins Rohm amp Haas ndash New York September 19-20 2006
12
6
Click to edit Master title style
Click to edit Master title style
14
Why have a Roadmap
13
7
Click to edit Master title style
15
Click to edit Master title style
What role can biomass play
16
8
Click to edit Master title style
Click to edit Master title style
US Agricultural Economy and Biomass
bull Ethanol and biodiesel industry creates domestic jobs
bull Ethanol industry has grown to 81 plants in 20 states which support 147000 jobs in the UnitedStates mostly in rural communities
bull On average a 40 million gallon per year ethanol plant supports 41 full-time jobs andnearly 700 jobs throughout the entire economy
bull Cuts the trade deficit by $341 billion through 2012
(Data 82005 From httpwwweereenergygovbiomasseconomic_growthhtmltrade and ldquoHomegrown for the Homeland - Ethanol Industry Outlook for 2005rdquo)
17
Biodiesel USA
Year Production Gallons
2000 1989400
2001 6437200
2002 8814600
2003 18400000
2004 18900000
2005 100000000 18Source CCC Data Estimate
9
Click to edit Master title style
Click to edit Master title style
19
Soy Oil Price History
Source httpwwwpalmoilcomindexphpq=D1VTW1NASgIEAhEbVg9RAAsI Data from Chicago Board of Trade
US Soy Oil Consumption
bull Crop Year 2004 Approx Production 187 B lbs
bull 75 billion pounds of biodiesel derived from soy oil would represent approximately 40 of current total soy oil demand This would be 1 billion gallons or 2 of diesel demand
20
10
Click to edit Master title style
Click to edit Master title style
21 According to the EIA
The AEO2006 reference case includes only those sections of EPACT2005 (the recent Energy Bill) that establish specific tax credits incentives or standardsmdashabout 30 of the roughly 500 sections in the legislation
7317
8713
0
2000
4000
6000
8000
10000
12000
2000 2005 2010 2015 2020 2025 2030
EIA 2006US Corn Ethanol Production
PRX Ethanol Production Forecast
Energy ActRFS
Energy Information Admnistration (EIA) US DOE Annual Energy Outlook (AEO
2006 Outlook
EIA ethanol production outlook trailing presentand scheduled dry mill expansion rate In
2010 PRX forecast is higher by 1400 mil galor about 500 mil bu corn
US CORN ETHANOL PRODUCTION with PRX ESTIMATE Million gallons
PRX
RFS
PRX_EIAlongtermPRXrev 04-Jan-06
US Corn Ethanol Production
22
Corn Use ndash 1999-2015
500
2500
4500
6500
8500
10500
12500
14500
2000-2001
2003-2004
2004-2005
2005-2006
2009-2010
2013-2014
2014-2015
Use Ethanol Exports Livestock Ethanol2
11
Click to edit Master title style
Click to edit Master title style
24
Cellulosic Ethanol from Energy Crops
bull Dedicated perennial energy crop production potential
bull On Conservation Reserve Program (CRP) Acreage
bull Using switchgrass hybrid poplar willow etc
23
12
Click to edit Master title style
Click to edit Master title style
25
Switchgrass Production Areas with data available
Walsh M et al Environmental and Resource Economics 24 313ndash333 2003
26Walsh M et al Environmental and Resource Economics 24 313ndash333 2003
Hybrid Poplar Production Areas with data available
13
Click to edit Master title style
Click to edit Master title style
28
27Walsh M et al Environmental and Resource Economics 24 313ndash333 2003
Willow Production Areas with data available
14
Click to edit Master title style
Click to edit Master title style
What conversion technologies are available
29
30
Thermo-Chemical Platform
Bio-Chemical Platform
Biomass
Conditioned Gas Oils Residues Mixed Sugars Lignin amp Residues
ldquoThe Integrated Biorefineryrdquo Technology Validation and Systems
Integration
Fuels Chemicals Materials Heat amp Power
Don Richardson Office of the Biomass Program September 29 2004
The Integrated Biorefinery
15
Click to edit Master title style
Click to edit Master title style
Cellulosic Biorefinery Vision
An integratedbiorefinery makesuse of ndash Thermochemical
conversion technology
Don Richardson Office of the Biomass Program September 29 2004
ndash Biochemical conversion technology 31
ndash Existing technology
32
16
Click to edit Master title style
Click to edit Master title style
Conclusion
bull Vision for Biomass ndash long way to go bull We need a good roadmap to get us there
bull Time to get to work
33
Backup slides with additional information
34
17
Click to edit Master title style
35
Click to edit Master title style
36
Crop Yields
Energy Potential of Crops
18
Click to edit Master title style
37
Click to edit Master title style
38
19
Click to edit Master title style
39
Click to edit Master title style
40
20
Click to edit Master title style
41
US Corn Yield
Click to edit Master title style
AS OF December 2005
In operation Under construction Proposed
42
Corn Production and Use 1999-2006
0
2000
4000
6000
8000
10000
12000
1999-2000
2000-2001
2001-2002
2002-2003
2003-2004
2004-2005
2005-2006
2006-2007
Production Use
21
Click to edit Master title style
43
Click to edit Master title style
Ethanol Use Requirements
Law enacted Legislative Proposals (05-06)
44
E-10
TBD E-10
20 2012
57
E-10
E-10
2006
10 2008 10
2007 10 2010
10 2008 10
2010 10 2007
10 2010
5 2006
10 TBD
25 RF 2015
10 TBD
22
Click to edit Master title style
46
Comparative Results of Ethanol Energy Balance Studies 1995-2005
LShap
Kim
oDale
Shapouriorenz
Agri-Furi et
et alMorri Wood C
la
Shap
s ang et al
anada rabo
WaG
sk
ng et alouri et al
i
Pim
Piment
entelPatze
Piment
el k
el
30000
20000
139
126
113
0
-113
-126Net E
nerg
y Valu
e (Bt
uga
llon)
Net E
nerg
y Valu
e Rat
io
10000
0
-10000
-20000
-139-30000
1995 1996 1997 1998 1999 2000 2001 2002 2003 2004 2005
Avg NEV minus Pimentel (3) Average NEV with Pimentel
24336 Btu (132 NEV ratio) 11739 Btu (115 NEV ratio)
Calculations assume low heat value energy content of ethanol is 76330 BTUgallon Sources Office of Energy Efficiency and Renewable Energy (US Department of Energy) Dale Bruce Michigan State University presentation at World Congress on Industrial Biotechnology amp Bioprocessing Orlando Florida April 22 2005
For more information call the National Corn Growers Association at (636) 733-9004 or go to wwwncgacom
0
200
400
600
800
2004 2005 2006 2007 2008
MGYEAR
BBI International
23
Click to edit Master title style
Click to edit Master title style
48
47
Agricultural Biomass for Energy
377
446
87
87
0 200 400 600
Million dry tons per year
Grain-to-ethanol Process residues Crop residues Perennial crops
Data from ldquoBiomass as Feedstock for a Bioenergy and Bioproducts Industry The Technical Feasibility of a Billion-Ton Annual Supplyrdquo DOE and USDA April 2005
24
Click to edit Master title style
49
Click to edit Master title style
50
25

Click to edit Master title style
Click to edit Master title style
5
Updated Vision Goals
6
Roadmap to this Future
3
Click to edit Master title style
Click to edit Master title style
Vision Goals relative to Other High Profile Recommendations
2010 2020 2025 2030 BIOFUELS GOALS Vision (billion gallons) 11 17 34 68 Presidents Biofuels Initiative (billion gallons) -- -- -- 60 Aspen ldquoA High Growth Strategy for Ethanolrdquo (billion gallons) -- -- 100 --
TOTAL ENERGY GOALS Vision ndash Quads 4 5 7 10 25x25 quads -- -- 32 --
BIOBASED PRODUCTS GOALS Biobased Products (billion lbs) 24 36 45 55
25xrsquo25 includes solar wind and biofuels across all sectors Committee Vision includes only biomass in transportation industrial and utility sectors It does not include residential and commercial sectors
7
Comparison of Approaches of Various National Efforts
Goal Areas
Approach Outcomes
National Biomass Initiative
Biofuels Biopower Bioproducts
Vision workshop to update goals followed by peer review (final Sept rsquo06) Three Region-specific Roadmap workshops
bullRoadmap of RampD and policy strategies and timelines (regional and national perspective) bullGuidance to RampD Board bullGuidance for annual joint USDADOE solicitation bullUsed to monitor progress by agencies
Presidentrsquos Biofuels Initiative
Cellulosic ethanol
Convened 30xrsquo30 workshop Compiling outputs from multiple strategic planning sessions
bullRampD amp policy strategies to provide basis for DOE RampD planning bullFederal Posture Plan to map agency roles
Aspen Institute
Ethanol Convened experts for 3-4 day dialogue
Generated 16 unanimous recommendations on RampD policy and incentives
25 x lsquo25 Wind Solar Biofuels
Holding planning meetings and established workgroups
Roadmap of RampD and policy recommendations (draft Oct lsquo06)
Includes National Biomass Initiative Roadmap workshops regional feedstock partnership workshops etc 8Work groups include Biofuels Electric Generation from RE Outreach amp Education RE in other Sectors amp
Natural Resources amp Wildlife
4
Click to edit Master title style
Click to edit Master title style
What is the Roadmap
bull Developed to map RampD needed to achieve original Vision goals
bull Used to guide annual joint DOEUSDA solicitation under the Biomass Initiative
bull Provides guidance to federal agencies on direction for biomass related RampD
9
Roadmap Update Process
bull Roadmap Update Workshops are planned by Regional Chairs with BCSDOE support
bull Workshops incorporate regional experts pertaining to the Roadmap categories Feedstocks Processing and Conversion Product Uses and Distribution Public Policy
10
5
Click to edit Master title style
Click to edit Master title style
Regional Roadmap Workshops
bull Update Roadmap language bull Incorporate New federalstate activities
ndash Renewable Fuels Standards bull Produce 8 million gallons of ethanol by 2012
ndash Biofuels Initiative bull Decrease cost to $107 per gallon of ethanol by 2010 bull Displace 40 billion gasoline equivalent gallons by 2030
bull Revisit path towards achieving Vision Goals bull Invitation only with regional experts
11
Roadmap Timeline
bull Midwest Regional Roadmap ndash Chair Tom Binder ADM ndash Chicago IL April 11-12 2006
bull West Regional Roadmap ndash Ralph Cavalieri Washington State ndash Sacramento CA August 8-9 2006
bull East Regional Roadmap ndash Douglas Hawkins Rohm amp Haas ndash New York September 19-20 2006
12
6
Click to edit Master title style
Click to edit Master title style
14
Why have a Roadmap
13
7
Click to edit Master title style
15
Click to edit Master title style
What role can biomass play
16
8
Click to edit Master title style
Click to edit Master title style
US Agricultural Economy and Biomass
bull Ethanol and biodiesel industry creates domestic jobs
bull Ethanol industry has grown to 81 plants in 20 states which support 147000 jobs in the UnitedStates mostly in rural communities
bull On average a 40 million gallon per year ethanol plant supports 41 full-time jobs andnearly 700 jobs throughout the entire economy
bull Cuts the trade deficit by $341 billion through 2012
(Data 82005 From httpwwweereenergygovbiomasseconomic_growthhtmltrade and ldquoHomegrown for the Homeland - Ethanol Industry Outlook for 2005rdquo)
17
Biodiesel USA
Year Production Gallons
2000 1989400
2001 6437200
2002 8814600
2003 18400000
2004 18900000
2005 100000000 18Source CCC Data Estimate
9
Click to edit Master title style
Click to edit Master title style
19
Soy Oil Price History
Source httpwwwpalmoilcomindexphpq=D1VTW1NASgIEAhEbVg9RAAsI Data from Chicago Board of Trade
US Soy Oil Consumption
bull Crop Year 2004 Approx Production 187 B lbs
bull 75 billion pounds of biodiesel derived from soy oil would represent approximately 40 of current total soy oil demand This would be 1 billion gallons or 2 of diesel demand
20
10
Click to edit Master title style
Click to edit Master title style
21 According to the EIA
The AEO2006 reference case includes only those sections of EPACT2005 (the recent Energy Bill) that establish specific tax credits incentives or standardsmdashabout 30 of the roughly 500 sections in the legislation
7317
8713
0
2000
4000
6000
8000
10000
12000
2000 2005 2010 2015 2020 2025 2030
EIA 2006US Corn Ethanol Production
PRX Ethanol Production Forecast
Energy ActRFS
Energy Information Admnistration (EIA) US DOE Annual Energy Outlook (AEO
2006 Outlook
EIA ethanol production outlook trailing presentand scheduled dry mill expansion rate In
2010 PRX forecast is higher by 1400 mil galor about 500 mil bu corn
US CORN ETHANOL PRODUCTION with PRX ESTIMATE Million gallons
PRX
RFS
PRX_EIAlongtermPRXrev 04-Jan-06
US Corn Ethanol Production
22
Corn Use ndash 1999-2015
500
2500
4500
6500
8500
10500
12500
14500
2000-2001
2003-2004
2004-2005
2005-2006
2009-2010
2013-2014
2014-2015
Use Ethanol Exports Livestock Ethanol2
11
Click to edit Master title style
Click to edit Master title style
24
Cellulosic Ethanol from Energy Crops
bull Dedicated perennial energy crop production potential
bull On Conservation Reserve Program (CRP) Acreage
bull Using switchgrass hybrid poplar willow etc
23
12
Click to edit Master title style
Click to edit Master title style
25
Switchgrass Production Areas with data available
Walsh M et al Environmental and Resource Economics 24 313ndash333 2003
26Walsh M et al Environmental and Resource Economics 24 313ndash333 2003
Hybrid Poplar Production Areas with data available
13
Click to edit Master title style
Click to edit Master title style
28
27Walsh M et al Environmental and Resource Economics 24 313ndash333 2003
Willow Production Areas with data available
14
Click to edit Master title style
Click to edit Master title style
What conversion technologies are available
29
30
Thermo-Chemical Platform
Bio-Chemical Platform
Biomass
Conditioned Gas Oils Residues Mixed Sugars Lignin amp Residues
ldquoThe Integrated Biorefineryrdquo Technology Validation and Systems
Integration
Fuels Chemicals Materials Heat amp Power
Don Richardson Office of the Biomass Program September 29 2004
The Integrated Biorefinery
15
Click to edit Master title style
Click to edit Master title style
Cellulosic Biorefinery Vision
An integratedbiorefinery makesuse of ndash Thermochemical
conversion technology
Don Richardson Office of the Biomass Program September 29 2004
ndash Biochemical conversion technology 31
ndash Existing technology
32
16
Click to edit Master title style
Click to edit Master title style
Conclusion
bull Vision for Biomass ndash long way to go bull We need a good roadmap to get us there
bull Time to get to work
33
Backup slides with additional information
34
17
Click to edit Master title style
35
Click to edit Master title style
36
Crop Yields
Energy Potential of Crops
18
Click to edit Master title style
37
Click to edit Master title style
38
19
Click to edit Master title style
39
Click to edit Master title style
40
20
Click to edit Master title style
41
US Corn Yield
Click to edit Master title style
AS OF December 2005
In operation Under construction Proposed
42
Corn Production and Use 1999-2006
0
2000
4000
6000
8000
10000
12000
1999-2000
2000-2001
2001-2002
2002-2003
2003-2004
2004-2005
2005-2006
2006-2007
Production Use
21
Click to edit Master title style
43
Click to edit Master title style
Ethanol Use Requirements
Law enacted Legislative Proposals (05-06)
44
E-10
TBD E-10
20 2012
57
E-10
E-10
2006
10 2008 10
2007 10 2010
10 2008 10
2010 10 2007
10 2010
5 2006
10 TBD
25 RF 2015
10 TBD
22
Click to edit Master title style
46
Comparative Results of Ethanol Energy Balance Studies 1995-2005
LShap
Kim
oDale
Shapouriorenz
Agri-Furi et
et alMorri Wood C
la
Shap
s ang et al
anada rabo
WaG
sk
ng et alouri et al
i
Pim
Piment
entelPatze
Piment
el k
el
30000
20000
139
126
113
0
-113
-126Net E
nerg
y Valu
e (Bt
uga
llon)
Net E
nerg
y Valu
e Rat
io
10000
0
-10000
-20000
-139-30000
1995 1996 1997 1998 1999 2000 2001 2002 2003 2004 2005
Avg NEV minus Pimentel (3) Average NEV with Pimentel
24336 Btu (132 NEV ratio) 11739 Btu (115 NEV ratio)
Calculations assume low heat value energy content of ethanol is 76330 BTUgallon Sources Office of Energy Efficiency and Renewable Energy (US Department of Energy) Dale Bruce Michigan State University presentation at World Congress on Industrial Biotechnology amp Bioprocessing Orlando Florida April 22 2005
For more information call the National Corn Growers Association at (636) 733-9004 or go to wwwncgacom
0
200
400
600
800
2004 2005 2006 2007 2008
MGYEAR
BBI International
23
Click to edit Master title style
Click to edit Master title style
48
47
Agricultural Biomass for Energy
377
446
87
87
0 200 400 600
Million dry tons per year
Grain-to-ethanol Process residues Crop residues Perennial crops
Data from ldquoBiomass as Feedstock for a Bioenergy and Bioproducts Industry The Technical Feasibility of a Billion-Ton Annual Supplyrdquo DOE and USDA April 2005
24
Click to edit Master title style
49
Click to edit Master title style
50
25

Click to edit Master title style
Click to edit Master title style
14
Why have a Roadmap
13
7
Click to edit Master title style
15
Click to edit Master title style
What role can biomass play
16
8
Click to edit Master title style
Click to edit Master title style
US Agricultural Economy and Biomass
bull Ethanol and biodiesel industry creates domestic jobs
bull Ethanol industry has grown to 81 plants in 20 states which support 147000 jobs in the UnitedStates mostly in rural communities
bull On average a 40 million gallon per year ethanol plant supports 41 full-time jobs andnearly 700 jobs throughout the entire economy
bull Cuts the trade deficit by $341 billion through 2012
(Data 82005 From httpwwweereenergygovbiomasseconomic_growthhtmltrade and ldquoHomegrown for the Homeland - Ethanol Industry Outlook for 2005rdquo)
17
Biodiesel USA
Year Production Gallons
2000 1989400
2001 6437200
2002 8814600
2003 18400000
2004 18900000
2005 100000000 18Source CCC Data Estimate
9
Click to edit Master title style
Click to edit Master title style
19
Soy Oil Price History
Source httpwwwpalmoilcomindexphpq=D1VTW1NASgIEAhEbVg9RAAsI Data from Chicago Board of Trade
US Soy Oil Consumption
bull Crop Year 2004 Approx Production 187 B lbs
bull 75 billion pounds of biodiesel derived from soy oil would represent approximately 40 of current total soy oil demand This would be 1 billion gallons or 2 of diesel demand
20
10
Click to edit Master title style
Click to edit Master title style
21 According to the EIA
The AEO2006 reference case includes only those sections of EPACT2005 (the recent Energy Bill) that establish specific tax credits incentives or standardsmdashabout 30 of the roughly 500 sections in the legislation
7317
8713
0
2000
4000
6000
8000
10000
12000
2000 2005 2010 2015 2020 2025 2030
EIA 2006US Corn Ethanol Production
PRX Ethanol Production Forecast
Energy ActRFS
Energy Information Admnistration (EIA) US DOE Annual Energy Outlook (AEO
2006 Outlook
EIA ethanol production outlook trailing presentand scheduled dry mill expansion rate In
2010 PRX forecast is higher by 1400 mil galor about 500 mil bu corn
US CORN ETHANOL PRODUCTION with PRX ESTIMATE Million gallons
PRX
RFS
PRX_EIAlongtermPRXrev 04-Jan-06
US Corn Ethanol Production
22
Corn Use ndash 1999-2015
500
2500
4500
6500
8500
10500
12500
14500
2000-2001
2003-2004
2004-2005
2005-2006
2009-2010
2013-2014
2014-2015
Use Ethanol Exports Livestock Ethanol2
11
Click to edit Master title style
Click to edit Master title style
24
Cellulosic Ethanol from Energy Crops
bull Dedicated perennial energy crop production potential
bull On Conservation Reserve Program (CRP) Acreage
bull Using switchgrass hybrid poplar willow etc
23
12
Click to edit Master title style
Click to edit Master title style
25
Switchgrass Production Areas with data available
Walsh M et al Environmental and Resource Economics 24 313ndash333 2003
26Walsh M et al Environmental and Resource Economics 24 313ndash333 2003
Hybrid Poplar Production Areas with data available
13
Click to edit Master title style
Click to edit Master title style
28
27Walsh M et al Environmental and Resource Economics 24 313ndash333 2003
Willow Production Areas with data available
14
Click to edit Master title style
Click to edit Master title style
What conversion technologies are available
29
30
Thermo-Chemical Platform
Bio-Chemical Platform
Biomass
Conditioned Gas Oils Residues Mixed Sugars Lignin amp Residues
ldquoThe Integrated Biorefineryrdquo Technology Validation and Systems
Integration
Fuels Chemicals Materials Heat amp Power
Don Richardson Office of the Biomass Program September 29 2004
The Integrated Biorefinery
15
Click to edit Master title style
Click to edit Master title style
Cellulosic Biorefinery Vision
An integratedbiorefinery makesuse of ndash Thermochemical
conversion technology
Don Richardson Office of the Biomass Program September 29 2004
ndash Biochemical conversion technology 31
ndash Existing technology
32
16
Click to edit Master title style
Click to edit Master title style
Conclusion
bull Vision for Biomass ndash long way to go bull We need a good roadmap to get us there
bull Time to get to work
33
Backup slides with additional information
34
17
Click to edit Master title style
35
Click to edit Master title style
36
Crop Yields
Energy Potential of Crops
18
Click to edit Master title style
37
Click to edit Master title style
38
19
Click to edit Master title style
39
Click to edit Master title style
40
20
Click to edit Master title style
41
US Corn Yield
Click to edit Master title style
AS OF December 2005
In operation Under construction Proposed
42
Corn Production and Use 1999-2006
0
2000
4000
6000
8000
10000
12000
1999-2000
2000-2001
2001-2002
2002-2003
2003-2004
2004-2005
2005-2006
2006-2007
Production Use
21
Click to edit Master title style
43
Click to edit Master title style
Ethanol Use Requirements
Law enacted Legislative Proposals (05-06)
44
E-10
TBD E-10
20 2012
57
E-10
E-10
2006
10 2008 10
2007 10 2010
10 2008 10
2010 10 2007
10 2010
5 2006
10 TBD
25 RF 2015
10 TBD
22
Click to edit Master title style
46
Comparative Results of Ethanol Energy Balance Studies 1995-2005
LShap
Kim
oDale
Shapouriorenz
Agri-Furi et
et alMorri Wood C
la
Shap
s ang et al
anada rabo
WaG
sk
ng et alouri et al
i
Pim
Piment
entelPatze
Piment
el k
el
30000
20000
139
126
113
0
-113
-126Net E
nerg
y Valu
e (Bt
uga
llon)
Net E
nerg
y Valu
e Rat
io
10000
0
-10000
-20000
-139-30000
1995 1996 1997 1998 1999 2000 2001 2002 2003 2004 2005
Avg NEV minus Pimentel (3) Average NEV with Pimentel
24336 Btu (132 NEV ratio) 11739 Btu (115 NEV ratio)
Calculations assume low heat value energy content of ethanol is 76330 BTUgallon Sources Office of Energy Efficiency and Renewable Energy (US Department of Energy) Dale Bruce Michigan State University presentation at World Congress on Industrial Biotechnology amp Bioprocessing Orlando Florida April 22 2005
For more information call the National Corn Growers Association at (636) 733-9004 or go to wwwncgacom
0
200
400
600
800
2004 2005 2006 2007 2008
MGYEAR
BBI International
23
Click to edit Master title style
Click to edit Master title style
48
47
Agricultural Biomass for Energy
377
446
87
87
0 200 400 600
Million dry tons per year
Grain-to-ethanol Process residues Crop residues Perennial crops
Data from ldquoBiomass as Feedstock for a Bioenergy and Bioproducts Industry The Technical Feasibility of a Billion-Ton Annual Supplyrdquo DOE and USDA April 2005
24
Click to edit Master title style
49
Click to edit Master title style
50
25

Click to edit Master title style
15
Click to edit Master title style
What role can biomass play
16
8
Click to edit Master title style
Click to edit Master title style
US Agricultural Economy and Biomass
bull Ethanol and biodiesel industry creates domestic jobs
bull Ethanol industry has grown to 81 plants in 20 states which support 147000 jobs in the UnitedStates mostly in rural communities
bull On average a 40 million gallon per year ethanol plant supports 41 full-time jobs andnearly 700 jobs throughout the entire economy
bull Cuts the trade deficit by $341 billion through 2012
(Data 82005 From httpwwweereenergygovbiomasseconomic_growthhtmltrade and ldquoHomegrown for the Homeland - Ethanol Industry Outlook for 2005rdquo)
17
Biodiesel USA
Year Production Gallons
2000 1989400
2001 6437200
2002 8814600
2003 18400000
2004 18900000
2005 100000000 18Source CCC Data Estimate
9
Click to edit Master title style
Click to edit Master title style
19
Soy Oil Price History
Source httpwwwpalmoilcomindexphpq=D1VTW1NASgIEAhEbVg9RAAsI Data from Chicago Board of Trade
US Soy Oil Consumption
bull Crop Year 2004 Approx Production 187 B lbs
bull 75 billion pounds of biodiesel derived from soy oil would represent approximately 40 of current total soy oil demand This would be 1 billion gallons or 2 of diesel demand
20
10
Click to edit Master title style
Click to edit Master title style
21 According to the EIA
The AEO2006 reference case includes only those sections of EPACT2005 (the recent Energy Bill) that establish specific tax credits incentives or standardsmdashabout 30 of the roughly 500 sections in the legislation
7317
8713
0
2000
4000
6000
8000
10000
12000
2000 2005 2010 2015 2020 2025 2030
EIA 2006US Corn Ethanol Production
PRX Ethanol Production Forecast
Energy ActRFS
Energy Information Admnistration (EIA) US DOE Annual Energy Outlook (AEO
2006 Outlook
EIA ethanol production outlook trailing presentand scheduled dry mill expansion rate In
2010 PRX forecast is higher by 1400 mil galor about 500 mil bu corn
US CORN ETHANOL PRODUCTION with PRX ESTIMATE Million gallons
PRX
RFS
PRX_EIAlongtermPRXrev 04-Jan-06
US Corn Ethanol Production
22
Corn Use ndash 1999-2015
500
2500
4500
6500
8500
10500
12500
14500
2000-2001
2003-2004
2004-2005
2005-2006
2009-2010
2013-2014
2014-2015
Use Ethanol Exports Livestock Ethanol2
11
Click to edit Master title style
Click to edit Master title style
24
Cellulosic Ethanol from Energy Crops
bull Dedicated perennial energy crop production potential
bull On Conservation Reserve Program (CRP) Acreage
bull Using switchgrass hybrid poplar willow etc
23
12
Click to edit Master title style
Click to edit Master title style
25
Switchgrass Production Areas with data available
Walsh M et al Environmental and Resource Economics 24 313ndash333 2003
26Walsh M et al Environmental and Resource Economics 24 313ndash333 2003
Hybrid Poplar Production Areas with data available
13
Click to edit Master title style
Click to edit Master title style
28
27Walsh M et al Environmental and Resource Economics 24 313ndash333 2003
Willow Production Areas with data available
14
Click to edit Master title style
Click to edit Master title style
What conversion technologies are available
29
30
Thermo-Chemical Platform
Bio-Chemical Platform
Biomass
Conditioned Gas Oils Residues Mixed Sugars Lignin amp Residues
ldquoThe Integrated Biorefineryrdquo Technology Validation and Systems
Integration
Fuels Chemicals Materials Heat amp Power
Don Richardson Office of the Biomass Program September 29 2004
The Integrated Biorefinery
15
Click to edit Master title style
Click to edit Master title style
Cellulosic Biorefinery Vision
An integratedbiorefinery makesuse of ndash Thermochemical
conversion technology
Don Richardson Office of the Biomass Program September 29 2004
ndash Biochemical conversion technology 31
ndash Existing technology
32
16
Click to edit Master title style
Click to edit Master title style
Conclusion
bull Vision for Biomass ndash long way to go bull We need a good roadmap to get us there
bull Time to get to work
33
Backup slides with additional information
34
17
Click to edit Master title style
35
Click to edit Master title style
36
Crop Yields
Energy Potential of Crops
18
Click to edit Master title style
37
Click to edit Master title style
38
19
Click to edit Master title style
39
Click to edit Master title style
40
20
Click to edit Master title style
41
US Corn Yield
Click to edit Master title style
AS OF December 2005
In operation Under construction Proposed
42
Corn Production and Use 1999-2006
0
2000
4000
6000
8000
10000
12000
1999-2000
2000-2001
2001-2002
2002-2003
2003-2004
2004-2005
2005-2006
2006-2007
Production Use
21
Click to edit Master title style
43
Click to edit Master title style
Ethanol Use Requirements
Law enacted Legislative Proposals (05-06)
44
E-10
TBD E-10
20 2012
57
E-10
E-10
2006
10 2008 10
2007 10 2010
10 2008 10
2010 10 2007
10 2010
5 2006
10 TBD
25 RF 2015
10 TBD
22
Click to edit Master title style
46
Comparative Results of Ethanol Energy Balance Studies 1995-2005
LShap
Kim
oDale
Shapouriorenz
Agri-Furi et
et alMorri Wood C
la
Shap
s ang et al
anada rabo
WaG
sk
ng et alouri et al
i
Pim
Piment
entelPatze
Piment
el k
el
30000
20000
139
126
113
0
-113
-126Net E
nerg
y Valu
e (Bt
uga
llon)
Net E
nerg
y Valu
e Rat
io
10000
0
-10000
-20000
-139-30000
1995 1996 1997 1998 1999 2000 2001 2002 2003 2004 2005
Avg NEV minus Pimentel (3) Average NEV with Pimentel
24336 Btu (132 NEV ratio) 11739 Btu (115 NEV ratio)
Calculations assume low heat value energy content of ethanol is 76330 BTUgallon Sources Office of Energy Efficiency and Renewable Energy (US Department of Energy) Dale Bruce Michigan State University presentation at World Congress on Industrial Biotechnology amp Bioprocessing Orlando Florida April 22 2005
For more information call the National Corn Growers Association at (636) 733-9004 or go to wwwncgacom
0
200
400
600
800
2004 2005 2006 2007 2008
MGYEAR
BBI International
23
Click to edit Master title style
Click to edit Master title style
48
47
Agricultural Biomass for Energy
377
446
87
87
0 200 400 600
Million dry tons per year
Grain-to-ethanol Process residues Crop residues Perennial crops
Data from ldquoBiomass as Feedstock for a Bioenergy and Bioproducts Industry The Technical Feasibility of a Billion-Ton Annual Supplyrdquo DOE and USDA April 2005
24
Click to edit Master title style
49
Click to edit Master title style
50
25

Click to edit Master title style
Click to edit Master title style
19
Soy Oil Price History
Source httpwwwpalmoilcomindexphpq=D1VTW1NASgIEAhEbVg9RAAsI Data from Chicago Board of Trade
US Soy Oil Consumption
bull Crop Year 2004 Approx Production 187 B lbs
bull 75 billion pounds of biodiesel derived from soy oil would represent approximately 40 of current total soy oil demand This would be 1 billion gallons or 2 of diesel demand
20
10
Click to edit Master title style
Click to edit Master title style
21 According to the EIA
The AEO2006 reference case includes only those sections of EPACT2005 (the recent Energy Bill) that establish specific tax credits incentives or standardsmdashabout 30 of the roughly 500 sections in the legislation
7317
8713
0
2000
4000
6000
8000
10000
12000
2000 2005 2010 2015 2020 2025 2030
EIA 2006US Corn Ethanol Production
PRX Ethanol Production Forecast
Energy ActRFS
Energy Information Admnistration (EIA) US DOE Annual Energy Outlook (AEO
2006 Outlook
EIA ethanol production outlook trailing presentand scheduled dry mill expansion rate In
2010 PRX forecast is higher by 1400 mil galor about 500 mil bu corn
US CORN ETHANOL PRODUCTION with PRX ESTIMATE Million gallons
PRX
RFS
PRX_EIAlongtermPRXrev 04-Jan-06
US Corn Ethanol Production
22
Corn Use ndash 1999-2015
500
2500
4500
6500
8500
10500
12500
14500
2000-2001
2003-2004
2004-2005
2005-2006
2009-2010
2013-2014
2014-2015
Use Ethanol Exports Livestock Ethanol2
11
Click to edit Master title style
Click to edit Master title style
24
Cellulosic Ethanol from Energy Crops
bull Dedicated perennial energy crop production potential
bull On Conservation Reserve Program (CRP) Acreage
bull Using switchgrass hybrid poplar willow etc
23
12
Click to edit Master title style
Click to edit Master title style
25
Switchgrass Production Areas with data available
Walsh M et al Environmental and Resource Economics 24 313ndash333 2003
26Walsh M et al Environmental and Resource Economics 24 313ndash333 2003
Hybrid Poplar Production Areas with data available
13
Click to edit Master title style
Click to edit Master title style
28
27Walsh M et al Environmental and Resource Economics 24 313ndash333 2003
Willow Production Areas with data available
14
Click to edit Master title style
Click to edit Master title style
What conversion technologies are available
29
30
Thermo-Chemical Platform
Bio-Chemical Platform
Biomass
Conditioned Gas Oils Residues Mixed Sugars Lignin amp Residues
ldquoThe Integrated Biorefineryrdquo Technology Validation and Systems
Integration
Fuels Chemicals Materials Heat amp Power
Don Richardson Office of the Biomass Program September 29 2004
The Integrated Biorefinery
15
Click to edit Master title style
Click to edit Master title style
Cellulosic Biorefinery Vision
An integratedbiorefinery makesuse of ndash Thermochemical
conversion technology
Don Richardson Office of the Biomass Program September 29 2004
ndash Biochemical conversion technology 31
ndash Existing technology
32
16
Click to edit Master title style
Click to edit Master title style
Conclusion
bull Vision for Biomass ndash long way to go bull We need a good roadmap to get us there
bull Time to get to work
33
Backup slides with additional information
34
17
Click to edit Master title style
35
Click to edit Master title style
36
Crop Yields
Energy Potential of Crops
18
Click to edit Master title style
37
Click to edit Master title style
38
19
Click to edit Master title style
39
Click to edit Master title style
40
20
Click to edit Master title style
41
US Corn Yield
Click to edit Master title style
AS OF December 2005
In operation Under construction Proposed
42
Corn Production and Use 1999-2006
0
2000
4000
6000
8000
10000
12000
1999-2000
2000-2001
2001-2002
2002-2003
2003-2004
2004-2005
2005-2006
2006-2007
Production Use
21
Click to edit Master title style
43
Click to edit Master title style
Ethanol Use Requirements
Law enacted Legislative Proposals (05-06)
44
E-10
TBD E-10
20 2012
57
E-10
E-10
2006
10 2008 10
2007 10 2010
10 2008 10
2010 10 2007
10 2010
5 2006
10 TBD
25 RF 2015
10 TBD
22
Click to edit Master title style
46
Comparative Results of Ethanol Energy Balance Studies 1995-2005
LShap
Kim
oDale
Shapouriorenz
Agri-Furi et
et alMorri Wood C
la
Shap
s ang et al
anada rabo
WaG
sk
ng et alouri et al
i
Pim
Piment
entelPatze
Piment
el k
el
30000
20000
139
126
113
0
-113
-126Net E
nerg
y Valu
e (Bt
uga
llon)
Net E
nerg
y Valu
e Rat
io
10000
0
-10000
-20000
-139-30000
1995 1996 1997 1998 1999 2000 2001 2002 2003 2004 2005
Avg NEV minus Pimentel (3) Average NEV with Pimentel
24336 Btu (132 NEV ratio) 11739 Btu (115 NEV ratio)
Calculations assume low heat value energy content of ethanol is 76330 BTUgallon Sources Office of Energy Efficiency and Renewable Energy (US Department of Energy) Dale Bruce Michigan State University presentation at World Congress on Industrial Biotechnology amp Bioprocessing Orlando Florida April 22 2005
For more information call the National Corn Growers Association at (636) 733-9004 or go to wwwncgacom
0
200
400
600
800
2004 2005 2006 2007 2008
MGYEAR
BBI International
23
Click to edit Master title style
Click to edit Master title style
48
47
Agricultural Biomass for Energy
377
446
87
87
0 200 400 600
Million dry tons per year
Grain-to-ethanol Process residues Crop residues Perennial crops
Data from ldquoBiomass as Feedstock for a Bioenergy and Bioproducts Industry The Technical Feasibility of a Billion-Ton Annual Supplyrdquo DOE and USDA April 2005
24
Click to edit Master title style
49
Click to edit Master title style
50
25

Click to edit Master title style
Click to edit Master title style
24
Cellulosic Ethanol from Energy Crops
bull Dedicated perennial energy crop production potential
bull On Conservation Reserve Program (CRP) Acreage
bull Using switchgrass hybrid poplar willow etc
23
12
Click to edit Master title style
Click to edit Master title style
25
Switchgrass Production Areas with data available
Walsh M et al Environmental and Resource Economics 24 313ndash333 2003
26Walsh M et al Environmental and Resource Economics 24 313ndash333 2003
Hybrid Poplar Production Areas with data available
13
Click to edit Master title style
Click to edit Master title style
28
27Walsh M et al Environmental and Resource Economics 24 313ndash333 2003
Willow Production Areas with data available
14
Click to edit Master title style
Click to edit Master title style
What conversion technologies are available
29
30
Thermo-Chemical Platform
Bio-Chemical Platform
Biomass
Conditioned Gas Oils Residues Mixed Sugars Lignin amp Residues
ldquoThe Integrated Biorefineryrdquo Technology Validation and Systems
Integration
Fuels Chemicals Materials Heat amp Power
Don Richardson Office of the Biomass Program September 29 2004
The Integrated Biorefinery
15
Click to edit Master title style
Click to edit Master title style
Cellulosic Biorefinery Vision
An integratedbiorefinery makesuse of ndash Thermochemical
conversion technology
Don Richardson Office of the Biomass Program September 29 2004
ndash Biochemical conversion technology 31
ndash Existing technology
32
16
Click to edit Master title style
Click to edit Master title style
Conclusion
bull Vision for Biomass ndash long way to go bull We need a good roadmap to get us there
bull Time to get to work
33
Backup slides with additional information
34
17
Click to edit Master title style
35
Click to edit Master title style
36
Crop Yields
Energy Potential of Crops
18
Click to edit Master title style
37
Click to edit Master title style
38
19
Click to edit Master title style
39
Click to edit Master title style
40
20
Click to edit Master title style
41
US Corn Yield
Click to edit Master title style
AS OF December 2005
In operation Under construction Proposed
42
Corn Production and Use 1999-2006
0
2000
4000
6000
8000
10000
12000
1999-2000
2000-2001
2001-2002
2002-2003
2003-2004
2004-2005
2005-2006
2006-2007
Production Use
21
Click to edit Master title style
43
Click to edit Master title style
Ethanol Use Requirements
Law enacted Legislative Proposals (05-06)
44
E-10
TBD E-10
20 2012
57
E-10
E-10
2006
10 2008 10
2007 10 2010
10 2008 10
2010 10 2007
10 2010
5 2006
10 TBD
25 RF 2015
10 TBD
22
Click to edit Master title style
46
Comparative Results of Ethanol Energy Balance Studies 1995-2005
LShap
Kim
oDale
Shapouriorenz
Agri-Furi et
et alMorri Wood C
la
Shap
s ang et al
anada rabo
WaG
sk
ng et alouri et al
i
Pim
Piment
entelPatze
Piment
el k
el
30000
20000
139
126
113
0
-113
-126Net E
nerg
y Valu
e (Bt
uga
llon)
Net E
nerg
y Valu
e Rat
io
10000
0
-10000
-20000
-139-30000
1995 1996 1997 1998 1999 2000 2001 2002 2003 2004 2005
Avg NEV minus Pimentel (3) Average NEV with Pimentel
24336 Btu (132 NEV ratio) 11739 Btu (115 NEV ratio)
Calculations assume low heat value energy content of ethanol is 76330 BTUgallon Sources Office of Energy Efficiency and Renewable Energy (US Department of Energy) Dale Bruce Michigan State University presentation at World Congress on Industrial Biotechnology amp Bioprocessing Orlando Florida April 22 2005
For more information call the National Corn Growers Association at (636) 733-9004 or go to wwwncgacom
0
200
400
600
800
2004 2005 2006 2007 2008
MGYEAR
BBI International
23
Click to edit Master title style
Click to edit Master title style
48
47
Agricultural Biomass for Energy
377
446
87
87
0 200 400 600
Million dry tons per year
Grain-to-ethanol Process residues Crop residues Perennial crops
Data from ldquoBiomass as Feedstock for a Bioenergy and Bioproducts Industry The Technical Feasibility of a Billion-Ton Annual Supplyrdquo DOE and USDA April 2005
24
Click to edit Master title style
49
Click to edit Master title style
50
25

Click to edit Master title style
Click to edit Master title style
25
Switchgrass Production Areas with data available
Walsh M et al Environmental and Resource Economics 24 313ndash333 2003
26Walsh M et al Environmental and Resource Economics 24 313ndash333 2003
Hybrid Poplar Production Areas with data available
13
Click to edit Master title style
Click to edit Master title style
28
27Walsh M et al Environmental and Resource Economics 24 313ndash333 2003
Willow Production Areas with data available
14
Click to edit Master title style
Click to edit Master title style
What conversion technologies are available
29
30
Thermo-Chemical Platform
Bio-Chemical Platform
Biomass
Conditioned Gas Oils Residues Mixed Sugars Lignin amp Residues
ldquoThe Integrated Biorefineryrdquo Technology Validation and Systems
Integration
Fuels Chemicals Materials Heat amp Power
Don Richardson Office of the Biomass Program September 29 2004
The Integrated Biorefinery
15
Click to edit Master title style
Click to edit Master title style
Cellulosic Biorefinery Vision
An integratedbiorefinery makesuse of ndash Thermochemical
conversion technology
Don Richardson Office of the Biomass Program September 29 2004
ndash Biochemical conversion technology 31
ndash Existing technology
32
16
Click to edit Master title style
Click to edit Master title style
Conclusion
bull Vision for Biomass ndash long way to go bull We need a good roadmap to get us there
bull Time to get to work
33
Backup slides with additional information
34
17
Click to edit Master title style
35
Click to edit Master title style
36
Crop Yields
Energy Potential of Crops
18
Click to edit Master title style
37
Click to edit Master title style
38
19
Click to edit Master title style
39
Click to edit Master title style
40
20
Click to edit Master title style
41
US Corn Yield
Click to edit Master title style
AS OF December 2005
In operation Under construction Proposed
42
Corn Production and Use 1999-2006
0
2000
4000
6000
8000
10000
12000
1999-2000
2000-2001
2001-2002
2002-2003
2003-2004
2004-2005
2005-2006
2006-2007
Production Use
21
Click to edit Master title style
43
Click to edit Master title style
Ethanol Use Requirements
Law enacted Legislative Proposals (05-06)
44
E-10
TBD E-10
20 2012
57
E-10
E-10
2006
10 2008 10
2007 10 2010
10 2008 10
2010 10 2007
10 2010
5 2006
10 TBD
25 RF 2015
10 TBD
22
Click to edit Master title style
46
Comparative Results of Ethanol Energy Balance Studies 1995-2005
LShap
Kim
oDale
Shapouriorenz
Agri-Furi et
et alMorri Wood C
la
Shap
s ang et al
anada rabo
WaG
sk
ng et alouri et al
i
Pim
Piment
entelPatze
Piment
el k
el
30000
20000
139
126
113
0
-113
-126Net E
nerg
y Valu
e (Bt
uga
llon)
Net E
nerg
y Valu
e Rat
io
10000
0
-10000
-20000
-139-30000
1995 1996 1997 1998 1999 2000 2001 2002 2003 2004 2005
Avg NEV minus Pimentel (3) Average NEV with Pimentel
24336 Btu (132 NEV ratio) 11739 Btu (115 NEV ratio)
Calculations assume low heat value energy content of ethanol is 76330 BTUgallon Sources Office of Energy Efficiency and Renewable Energy (US Department of Energy) Dale Bruce Michigan State University presentation at World Congress on Industrial Biotechnology amp Bioprocessing Orlando Florida April 22 2005
For more information call the National Corn Growers Association at (636) 733-9004 or go to wwwncgacom
0
200
400
600
800
2004 2005 2006 2007 2008
MGYEAR
BBI International
23
Click to edit Master title style
Click to edit Master title style
48
47
Agricultural Biomass for Energy
377
446
87
87
0 200 400 600
Million dry tons per year
Grain-to-ethanol Process residues Crop residues Perennial crops
Data from ldquoBiomass as Feedstock for a Bioenergy and Bioproducts Industry The Technical Feasibility of a Billion-Ton Annual Supplyrdquo DOE and USDA April 2005
24
Click to edit Master title style
49
Click to edit Master title style
50
25

Click to edit Master title style
Click to edit Master title style
Conclusion
bull Vision for Biomass ndash long way to go bull We need a good roadmap to get us there
bull Time to get to work
33
Backup slides with additional information
34
17
Click to edit Master title style
35
Click to edit Master title style
36
Crop Yields
Energy Potential of Crops
18
Click to edit Master title style
37
Click to edit Master title style
38
19
Click to edit Master title style
39
Click to edit Master title style
40
20
Click to edit Master title style
41
US Corn Yield
Click to edit Master title style
AS OF December 2005
In operation Under construction Proposed
42
Corn Production and Use 1999-2006
0
2000
4000
6000
8000
10000
12000
1999-2000
2000-2001
2001-2002
2002-2003
2003-2004
2004-2005
2005-2006
2006-2007
Production Use
21
Click to edit Master title style
43
Click to edit Master title style
Ethanol Use Requirements
Law enacted Legislative Proposals (05-06)
44
E-10
TBD E-10
20 2012
57
E-10
E-10
2006
10 2008 10
2007 10 2010
10 2008 10
2010 10 2007
10 2010
5 2006
10 TBD
25 RF 2015
10 TBD
22
Click to edit Master title style
46
Comparative Results of Ethanol Energy Balance Studies 1995-2005
LShap
Kim
oDale
Shapouriorenz
Agri-Furi et
et alMorri Wood C
la
Shap
s ang et al
anada rabo
WaG
sk
ng et alouri et al
i
Pim
Piment
entelPatze
Piment
el k
el
30000
20000
139
126
113
0
-113
-126Net E
nerg
y Valu
e (Bt
uga
llon)
Net E
nerg
y Valu
e Rat
io
10000
0
-10000
-20000
-139-30000
1995 1996 1997 1998 1999 2000 2001 2002 2003 2004 2005
Avg NEV minus Pimentel (3) Average NEV with Pimentel
24336 Btu (132 NEV ratio) 11739 Btu (115 NEV ratio)
Calculations assume low heat value energy content of ethanol is 76330 BTUgallon Sources Office of Energy Efficiency and Renewable Energy (US Department of Energy) Dale Bruce Michigan State University presentation at World Congress on Industrial Biotechnology amp Bioprocessing Orlando Florida April 22 2005
For more information call the National Corn Growers Association at (636) 733-9004 or go to wwwncgacom
0
200
400
600
800
2004 2005 2006 2007 2008
MGYEAR
BBI International
23
Click to edit Master title style
Click to edit Master title style
48
47
Agricultural Biomass for Energy
377
446
87
87
0 200 400 600
Million dry tons per year
Grain-to-ethanol Process residues Crop residues Perennial crops
Data from ldquoBiomass as Feedstock for a Bioenergy and Bioproducts Industry The Technical Feasibility of a Billion-Ton Annual Supplyrdquo DOE and USDA April 2005
24
Click to edit Master title style
49
Click to edit Master title style
50
25
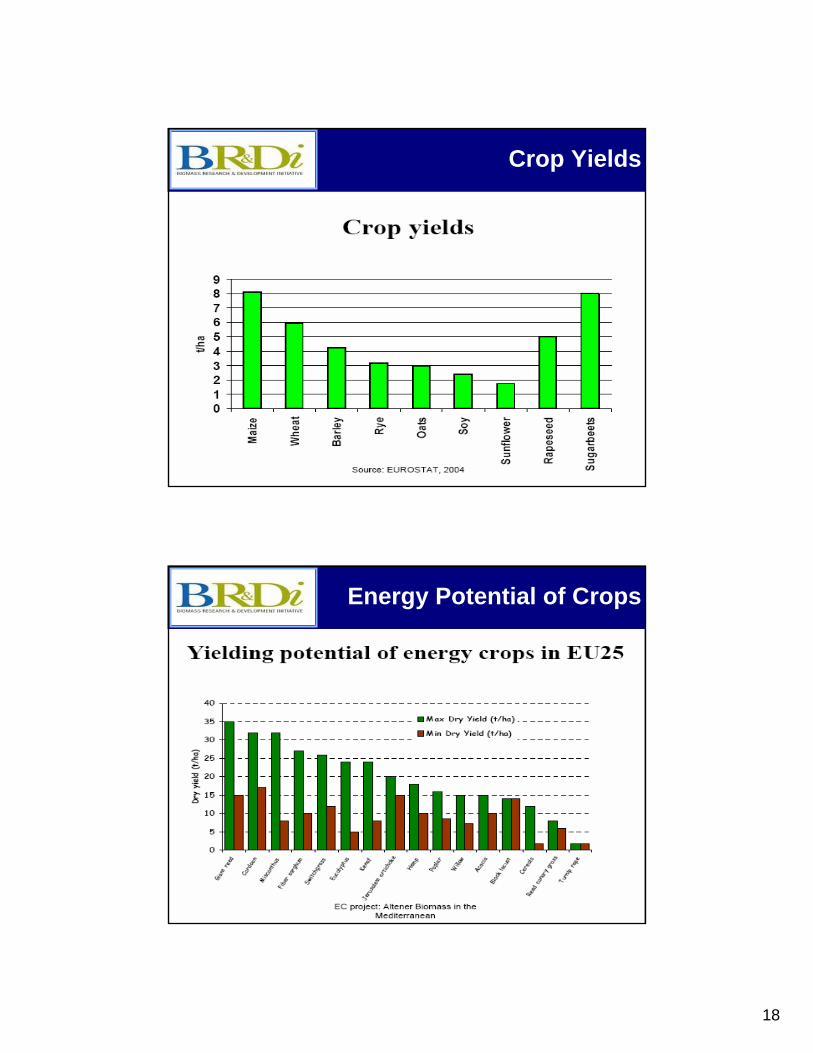
Click to edit Master title style
Click to edit Master title style
48
47
Agricultural Biomass for Energy
377
446
87
87
0 200 400 600
Million dry tons per year
Grain-to-ethanol Process residues Crop residues Perennial crops
Data from ldquoBiomass as Feedstock for a Bioenergy and Bioproducts Industry The Technical Feasibility of a Billion-Ton Annual Supplyrdquo DOE and USDA April 2005
24
Click to edit Master title style
49
Click to edit Master title style
50
25

Click to edit Master title style
49
Click to edit Master title style
50
25