east africa economic outlook - tralac
TRANSCRIPT

EAST AFRICAECONOMIC OUTLOOK
Growth and Transformation
Economic Governance and Knowledge management (ECVP)
Abidjan, March 5, 2018

2
Outline
1. Africa’s economic performance is improving2. Eastern Africa is leading the way3. Despite progress, the Region is facing serious economic challenges4. There are new opportunities for economic diversification5. Suggested policy priorities for growth and employment
3
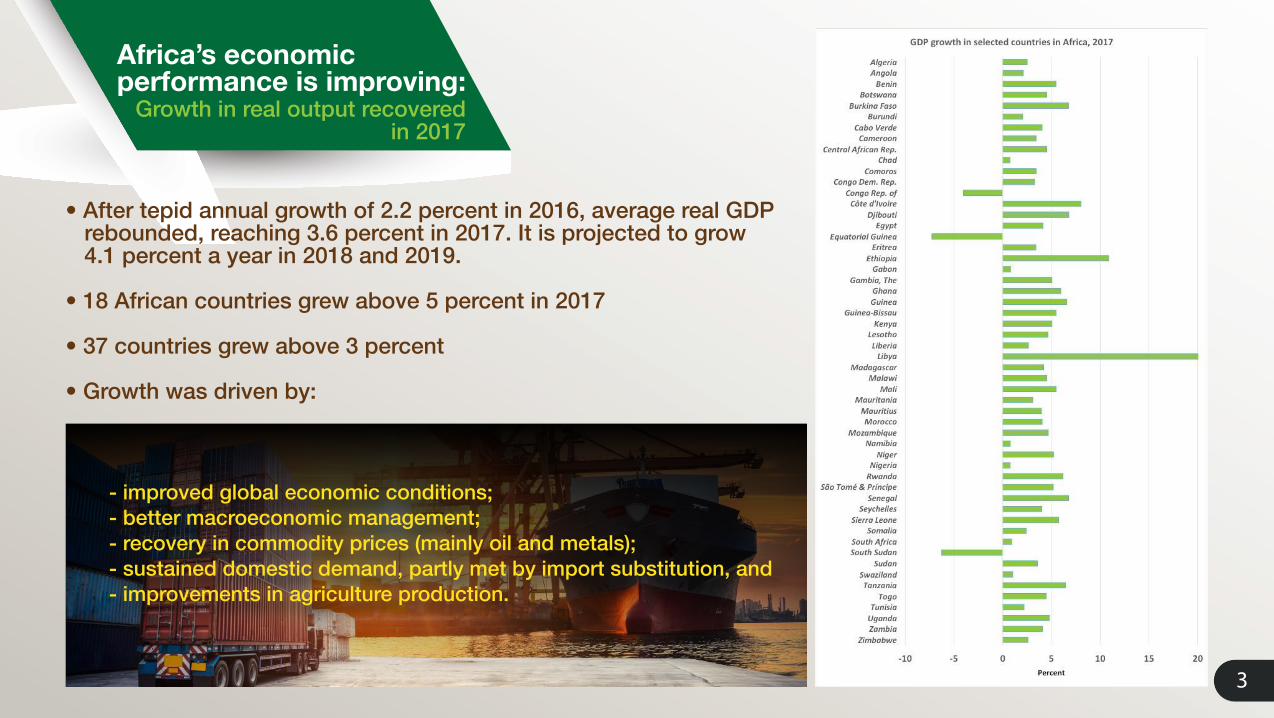
Africa’s economic performance is improving:
Growth in real output recoveredin 2017
• After tepid annual growth of 2.2 percent in 2016, average real GDP rebounded, reaching 3.6 percent in 2017. It is projected to grow 4.1 percent a year in 2018 and 2019.
• 18 African countries grew above 5 percent in 2017
• 37 countries grew above 3 percent
• Growth was driven by:
- improved global economic conditions; - better macroeconomic management; - recovery in commodity prices (mainly oil and metals); - sustained domestic demand, partly met by import substitution, and - improvements in agriculture production.

4
2. Eastern Africa is leading the way
It has been the best-performingregion in Africa Growth projections
for 2018 and 2019 look promising
2018: 5.1%2019: 4.5%
2018: 3.6%2019: 3.8%
2018: 2.4%2019: 3.0%
2018: 5.9%2019: 6.1%
2018: 2.0%2019: 2.4%
2018: 3.6%2019: 3.8%
North Africa
West Africa
Africa
East Africa
Central Africa
Southern Africa
5.8
6.5
5.2
1.9
7.3
5.95.6
5.05.9
0
1
2
3
4
5
6
7
8
2009 2010 2011 2012 2013 2014 2015 2016 2017(e)
East Africa Africa

5
East Africa’s growth is led by:
Ethiopia, Djibouti, Rwanda, Tanzania, Uganda, and Kenya
-15.0
-10.0
-5.0
0.0
5.0
10.0
15.0
Real
GDP
gro
wth
(%)
2016 2017(e) 2018(p) 2019(p)
Source: AfDB, Statistics
• Six countries led growth: Ethiopia (10.9%), Djibouti (6.8%), Tanzania (6.5%), Rwanda (6.2%), Kenya (5%), and Uganda (4.8%)
• Main sectoral drivers: agriculture (41% of East Africa’s average real GDP growth in 2017). Industry sector’s contribution has increased, notably in Ethiopia, Rwanda, and Tanzania
• Demand side drivers: household consumption and public investment

6
3. Despite progressthe region is facing
serious economic challenges
• Manufacturing is growing in some countries but still accounts for only 8.4% of GDP and 19.9% of exports on average• Like all of Africa, the region is facing severe job deficits and challenging demographics• Binding infrastructure (energy, transport, water & sanitation) & finance constraints• High domestic resource gaps, leading to high current account deficits and increasing public debt• Income inequality: top 20% of the population controls roughly 50% of income

7
Exports have declined since 2012
and 3 of the top 5 export products are not transformed
Source: UNCTAD STAT *: estimates
2012 2013 2014 2015 2016*Total Exports 23,105 24,894 24,196 21,165 19,601 United Arab Emirates 3,571 3,065 2,610 2,017 2,026 China 1,972 4,559 4,058 2,583 1,771 India 798 1,102 1,452 1,320 1,074 Switzerland 1,273 650 397 470 960
Dem. Rep. of Congo 824 856 851 713 852
Main Products Exported from East Africa
Gold, non-monetary (excluding gold ores and concentrates) 4,969 3,813 3,101 2,727 2,843
Coffee and coffee substitutes 1,848 1,484 1,549 1,533 1,458 Tea and mate 1,429 1,310 1,151 1,341 1,333 Vegetables 918 1,120 1,192 1,184 1,140
Petroleum oils, oils from bitumin. materials, crude 1,157 4,575 3,323 1,879 1,068
East Africa—Total Exports to Top 5 Destinations (Millions of US$)

8
It’s a generic Africanproblem:
There is urgent need for structural transformation to accelerate
economic diversification
Other
Textile / Apparel
Wood products
Precious Metals Minerals
Metals / Minerals
Food / Drinks
Oil
Other
Textile / Apparel
Wood products
Precious Metals Minerals
Metals / Minerals
Food / Drinks
Oil
Single most important export product, 1985
Single most important export product, 2015

9
Dependence on commodities
is reflected in low tax rates, which limit the government capacity
2000
2016

10
Debt trends must be monitored carefully
The Bank is helping with new analytical work
10
20
30
40
50
60
70
80
90
2000
2001
2002
2003
2004
2005
2006
2007
2008
2009
20102011
2012
2013
2014
2015
2016
External Debt (% of GDP)
Total Debt (% of GDP)
External Debt in a Sample of Eastern African Countries, 2016Total and External Debt Trends in Africa, 2000-2016

11
There are many opportunities
for East Africa to diversify its economies and create employment
• Upturn in commodity prices & positive FDI outlook• New markets opening up for African exports
• At the global level:
• Great examples of high-performing countries (Ethiopia, Rwanda, etc.)• Mineral (oil, natural gas) discoveries • Strong domestic demand from a growing middle class• Agricultural industrialization, light manufacturing, modern services—including tourism—are growing• New momentum for regional integration via EAC & COMESA
• At the regional level:
Hawassa Industrial Park in Ethiopia
Oil & gas discoveries in Uganda, Kenya, TZ, Ethiopia

12
There are new potential sources of financing for Africa’s infrastructure
Assets managed by African institutional investors to rise from $670b. to $1.8 trillion
Type of investor 2012 ($ billion) 2020 ($ billion) Pension funds 300 1,100 Insurance companies 200 445 Sovereign wealth funds 170 300 Total 670 1,845
In Africa, the assets managed by African institutional investors are expected to rise to $1.8 trillion by 2020 from $670 billion in 2012
Taxes$500 b.
ODA$27 b.
Remittances$63 b., $33
to SSA
FDI$59 b.
African Institutional Investors$670 b.

13
5. Suggested Policy Priorities for Growth and Employment
• Strengthen macroeconomic policies—fiscal, monetary, exchange rate—and domestic resource mobilization; Improve debt management and public investment (We will support, including with PERs)• Promote agricultural industrialization (We will support with blueprints for staple crop processing zones, special economic zones, and industrial parks—and of course, concrete projects and programs)• Accelerate diversification and attract more private funding to infrastructure projects, focusing on risk mitigation (We will support with advice on pragmatic approaches to prioritize infrastructure strategically and identify new financing instruments)• Proactive and more aggressive strategies to attract FDI (We will support with the Africa Investment Forum, knowledge products, and other instruments).

14
Expected GCI dividends: the Bank,your Bank, will be able to scale up
• Analytical and Advisory Activities, with a uniquely African perspective
• Granular research and timely policy reports (Examples: Sudan, Ethiopia, Kenya…)
• Greater awareness and consensus on issues and policy options (AEO Highlights in Kiswahili and Amharic
• Capacity building for economic policymaking (local stakeholders and thinktanks involved in our work)
• Targeted technical assistance
its production of customized knowledge and other nonlending services

Layout and Design:Communications and External Relations Department
Mahadsanid.Yakenele.
Amesegnalehu.Shukran jazira.Asanteni sana.
Merci beaucoup.Thank you.