earth wind as a possible source of lunar surface hydration
TRANSCRIPT
Earth wind as a possible source of lunar surface hydration
H. Z. Wang1,2, J. Zhang1*, Q. Q. Shi1,2*, Y. Saito3, A. W. Degeling1, I. J. Rae4, J. Liu2,
R. L. Guo5, Z. H. Yao6, A. M. Tian1, X. H. Fu1, Q.G. Zong7, J. Z. Liu8, Z. C. Ling1,
W. J. Sun9, S. C. Bai1, J. Chen1, S. T. Yao1, H. Zhang5, Y. Wei5, W. L. Liu10, L. D.
Xia1, Y. Chen1, Y. Y. Feng2, S. Y. Fu7 and Z. Y. Pu7
1Shandong Provincial Key Laboratory of Optical Astronomy and Solar-Terrestrial
Environment, Institute of Space Science, Shandong University, Weihai, Shandong,
China.
2State Key Laboratory of Space Weather, National Space Science Center (NSSC),
Chinese Academy of Sciences, Beijing, China.
3Institute of Space and Astronautical Science, Japan Aerospace Exploration Agency,
Sagamihara, Japan.
4Mullard Space Science Laboratory, University College London, Dorking, UK.
5Key Laboratory of Earth and Planetary Physics, Institute of Geology and
Geophysics, Chinese Academy of Sciences, Beijing, China.
6Laboratoire de Physique Atmosphérique et Planétaire, STAR Institute, Université de
Liège, Liège, Belgium.
7School of Earth and Space Sciences, Peking University, Beijing, China.
8Center for Lunar and Planetary Sciences, Institute of Geochemistry, Chinese
Academy of Sciences, Guiyang, China.
9Department of Climate and Space Sciences and Engineering, University of Michigan,
Ann Arbor, US.
10School of Space and Environment, Beihang University, Beijing, China.
Abstract: Understanding the sources of lunar water is crucial for studying the history
of lunar evolution, and also the solar wind interaction with the Moon and other airless
bodies. Recent observations revealed lunar hydration is very likely a surficial dynamic
process driven by solar wind. Solar wind is shielded over a period of 3-5 days as the
Moon passes through the Earth’s magnetosphere, during which a significant loss of
hydration is expected from previous works. Here we study lunar hydration inside the
magnetosphere using orbital spectral data, which unexpectedly found that the polar
surficial OH/H2O abundance remains at the same level when in the solar wind and in
the magnetosphere. We suggest that particles from the magnetosphere (Earth wind,
naturally different from solar wind) contribute to lunar hydration. From lunar orbital
plasma observations, we find the existence of optimal energy ranges, other than 1 keV
as previously thought, for surface hydration formation. These optimal energy ranges
deduced from space observations may provide strong implications for laboratory
experiments simulating lunar hydration processes.

Main Text: Recent orbital observations and laboratory analyses revealed a “wet” Moon
with various forms of lunar water (1-10). These forms of water have been proposed to
come from both indigenous and exogenous sources, including lunar interior, comets,
asteroids, solar wind, and the Earth’s magnetosphere (11-13). Therefore, understanding
the sources and formation processes of lunar water is key for studying the origin and
evolution of planetary bodies, including lunar magmatic evolution, bombardment
history, and solar wind-surface interaction on the Moon and other airless bodies.
Evidence of water from the lunar interior was found by laboratory analyses of lunar
samples, such as pyroclastic glasses, lunar melt inclusions, apatite grains, and
anorthosites (1, 9, 10, 14, 15), and was also detected in pyroclastic deposits by orbital
observations (16). In contrast, examples of exogenous origins include the episodic
delivery of water to the Moon from meteoroids and comets (17), which result in
deuterium/hydrogen (D/H) values (8, 18) that differ from lunar interior sources.
Solar wind hydrogen is considered to be another exogenous source of water (2-4, 13,
19-27). Surface water content has been found to exhibit diurnal variations, which is
interpreted to indicate a dynamic balance between a continuous source from the solar
wind and loss processes dependent on solar illumination and surface temperature (2-4,
20, 24-26). Lunar soil analysis and laboratory ion irradiation experiments provide
further evidence that solar wind hydrogen provides an exogenous source (28-31). The
interpretation from these studies is that lunar water is generated by solar wind hydrogen
implantation into the upper-most surface of lunar soil grains and forming OH bonds
and even H2O (13, 19).
During about three quarters of the lunar orbit, the Moon is immersed in solar wind that
provides a predominant proton flux at ~1 keV, with 4 % comprised of alpha particles
and other heavy ions (32). During the remaining 3-5 days of every lunation, the Moon
lies within the Earth’s magnetosphere (Fig.1A), in which most of the solar wind
particles are shielded. In the absence of other hydrogen sources, a decrease of hydration
would be expected due to surface loss processes such as thermal diffusion and
photodissociation (12, 13). However, the Earth’s magnetosphere is not empty, instead
occupied by the Earth wind whose ion constituents and energies are different from the
solar wind. The particle species in the Earth wind consist of both solar wind and
terrestrial species (i.e., H+, He+, O+, N2+, NO+, O2
+) (33-39). Particle fluxes are typically
several times lower than that in the solar wind (40), however the particle energy
distribution is significantly broader. Ions from Earth wind have been detected in the
vicinity of the Moon (41).
Therefore, the first questions that arise are whether particles from Earth wind can reach
the surface of the Moon, and whether they can contribute to lunar surface hydration as
an exogenous source, similar to the solar wind. Attempting to answer these questions,
we studied the spatial distribution and temporal variations of lunar water at high
latitudes with the Chandrayaan-1 Moon Mineralogy Mapper (M3) data, comparing and
contrasting intervals when the Moon lies inside/outside the magnetosphere.

Results: The maps of lunar surficial hydration at polar regions are presented in Fig.1
(B-C). In general, we find that there are no significant differences in OH/H2O
abundance for intervals when the Moon is located in the Earth’s magnetosphere and in
the solar wind. Then, we quantitatively studied the spatial and temporal variations of
lunar surface hydration, especially those inside/outside the Earth’s magnetosphere
using epoch analysis. The full-moon time, around which the Moon was within the
magnetosphere, are taken as zero epoch, with the previous and next new moon times
corresponding to the left- and right-hand sides. The data points are binned into 5°
latitude and 24 Earth hour intervals. As shown by Fig. 1 (B-C) and 2 (A-B), the lunar
surface OH/H2O abundance increases with latitude toward the polar regions, which is
consistent with previous studies (4, 20, 25). The anomaly indicated with the rectangle
in Fig. 2A is caused by highland materials within Goldschmidt crater (4).
The interval when the Moon is in the Earth’s magnetosphere, determined by the Kaguya
plasma and magnetic field instruments (43-45) data on February 2009, is from 2009-
02-07/10:00 to 2009-02-11/05:00 (3.8 days). It is found that the lunar OH/H2O
abundance when inside the Earth’s magnetosphere (gray shading in Fig. 2 A-B) remains
nearly the same level as those when the Moon is exposed to solar wind.
It is well known that when the Moon passes through the Earth’s magnetosphere, solar
wind incident on the Moon vanishes. To investigate the correlation between lunar
surface hydration and the incident ion energy flux, we computed the average differential
ion energy spectrum and ~ 1 keV (typical hydrogen ion energy in the solar wind)
median/inter-quartile values of ion energy flux incident on the Moon as a function of
lunar phase (0 defines “full moon” and -14/14 indicates “new moon”). This is done
using the data available from the Acceleration, Reconnection, Turbulence, and
Electrodynamics of the Moon’s Interaction with the Sun (ARTEMIS) (46, 47)
Electrostatic Analyzer (ESA) instruments (1-25000 eV) (48) from September, 2011 to
October, 2016 (As shown in Fig.2 C-D). In the computation, we excluded the periods
when the probe traversed the lunar nightside in order to avoid the influence of the lunar
wake in which the solar wind is shielded. We find that the incoming ~1 keV ion flux
when within the Earth’s magnetosphere is about two orders of magnitude lower than
that from the solar wind Fig. 2 (C-D).
Discussion: As we mentioned in the previous sections, the solar wind is thought to be
a primary source for lunar global surficial OH/H2O (3, 4, 12). The above results have
shown that the hydrogen ion energy flux at ~1 keV in the Earth’s magnetosphere is two
orders lower than that in the solar wind. Therefore, it appears contradictory that the
OH/H2O abundance at lunar polar regions remains at the same level in the two
circumstances. To resolve this issue, it is worthwhile to discuss OH/H2O formation and
loss processes in lunar surface minerals.
The bombardment of soil grains on the lunar surface by solar wind protons can produce
vacancies at crystal lattice sites, leading to the formation of amorphous rims (49). After
this sputtering process, the implanted solar wind can be temporarily trapped by
vacancies at broken chemical bonds of oxygen, forming individual OH/H2O (20).
However, the formed OH/H2O is unstable; if the strength of the interatomic attractive

potentials between the solar wind hydrogen and the regolith oxides (activation energy)
is not large enough to cause trapping, the hydrogen atoms will loiter within minerals
until diffusing back out into space. The solar wind hydrogen retention time depends on
the activation energy and lunar surface temperature; the implanted hydrogen would
effectively dwell within lunar minerals in cold regions with larger activation energy (24,
50, 51).
When the Moon passes through the Earth’s magnetosphere, the bulk of the solar wind
is shielded. If there were no other sources providing additional OH/H2O at the same
time, its abundance should decrease with time due to the diffusive losses caused by
thermal motion. The retained hydrogen in lunar minerals can be calculated using the
analytical approach given by (52), in which the surface temperature at polar regions is
280 K (measured by the M3 data) and the length of time over which the surface is
warmed in the calculation is 3.8 days (determined by the Kaguya MAP-PACE and
MAP-LMAG measurements). As shown in Fig.3A, the implanted H with activation
energy above ~0.7 eV is retained, while those with activation energy U < 0.65 eV tend
to escape, resulting in an overall reduction in retained H to 46% of the initially
implanted level (Fig.3B). Therefore, the observed reduction in solar wind hydrogen flux
while the Moon lies within the Earth’s magnetosphere should produce a significant
reduction in surface water—if the loss rate discussed above is reliable, and there are no
other hydrogen sources available. The fact that a reduction in surface OH/H2O is not
observed implies that possible sources other than solar wind might exist, e.g., large
water reservoirs at the lunar polar regions and/or the Earth wind.
First, if there are very large water reservoirs at the polar regions, the surface OH/H2O
would hardly be affected by the lack of solar wind over a few days, and then, any small
changes would be attributable to migration/diffusion of the hydrated molecules. For
instance, a high abundance of water was found within the plume impact on Cabeus
crater by the Lunar Crater Observation and Sensing Satellite (LCROSS) mission (5),
and orbital spectral albedo observations suggest that the water ice layers in these craters
are due to the extreme cold temperature (7, 53). However, the only significant reservoirs
known are highly localized and sparsely scattered, occurring within permanently
shadowed regions inside craters. Polar water could transport from reservoirs over a
wider region and lower latitudes via micrometeoroid impact vaporization and solar
wind sputtering. However, the sparsity of these sources is such that the source intensity
from this process is too low to fully account for the infrared (IR) observations (54).
Alternatively, particles from the Earth’s magnetosphere could be a primary source in
the absence of solar wind. Starukhina et al. (13) proposed that the Earth’s
magnetosphere can provide hydrogen atoms for the lunar regolith in permanently
shadowed regions because of the thermal distribution of magnetosphere plasmas; Lucey
et al. (55) also suggested that ions from the Earth’s magnetosphere can be a source of
lunar volatiles. Harada et al. (56) found that backscattered hydrogen energetic neutral
atom (ENA) flux from the Moon in the Earth’s magnetosphere plasma sheet is roughly
on the same order of magnitude as that in the solar wind, which indicates a significant
amount of Earth wind can reach the Moon.
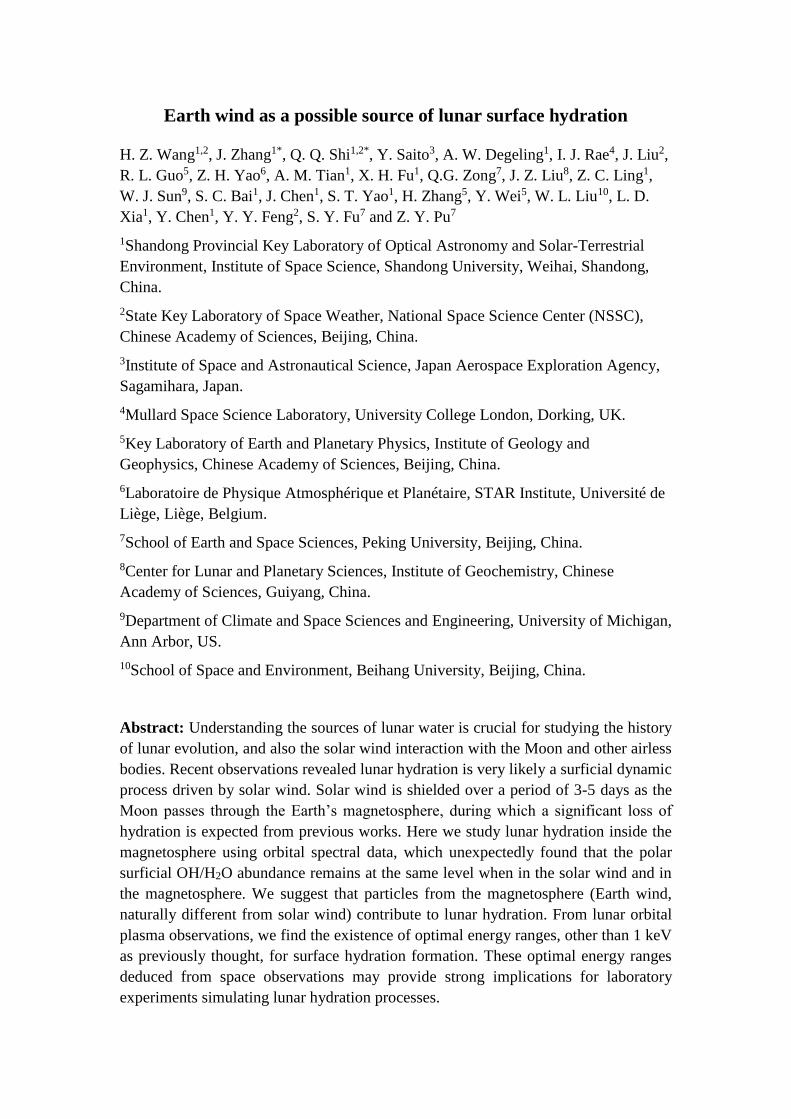
As shown in the above results, Earth wind proton energy flux at ~1 keV is about two
orders of magnitude lower than that from the solar wind (Fig.2C-D), but the OH/H2O
abundance at the lunar polar regions remains the same level in the two circumstances
(Fig.2A-B). This may indicate that protons at other energies may provide a significant
contribution to OH/H2O formation. Protons at higher energies can produce more
vacancies, e.g. 30 keV proton generates about eight vacancies per incident ion (57),
which can trap more hydrogen to form OH/H2O, while the 1 keV protons dominant in
the solar wind can only create about two vacancies per ion (52). Meanwhile, high
energy protons can produce deeper vacancy sites (28), which can hinder their diffusive
loss. On the other hand, protons at energies lower than 1 keV may be trapped more
easily by vacancies. This is because the ion-solid collision cross-section (which
describes the probability of transferring energy from ions to a solid), is inversely
proportional to the square of ion energy (58).
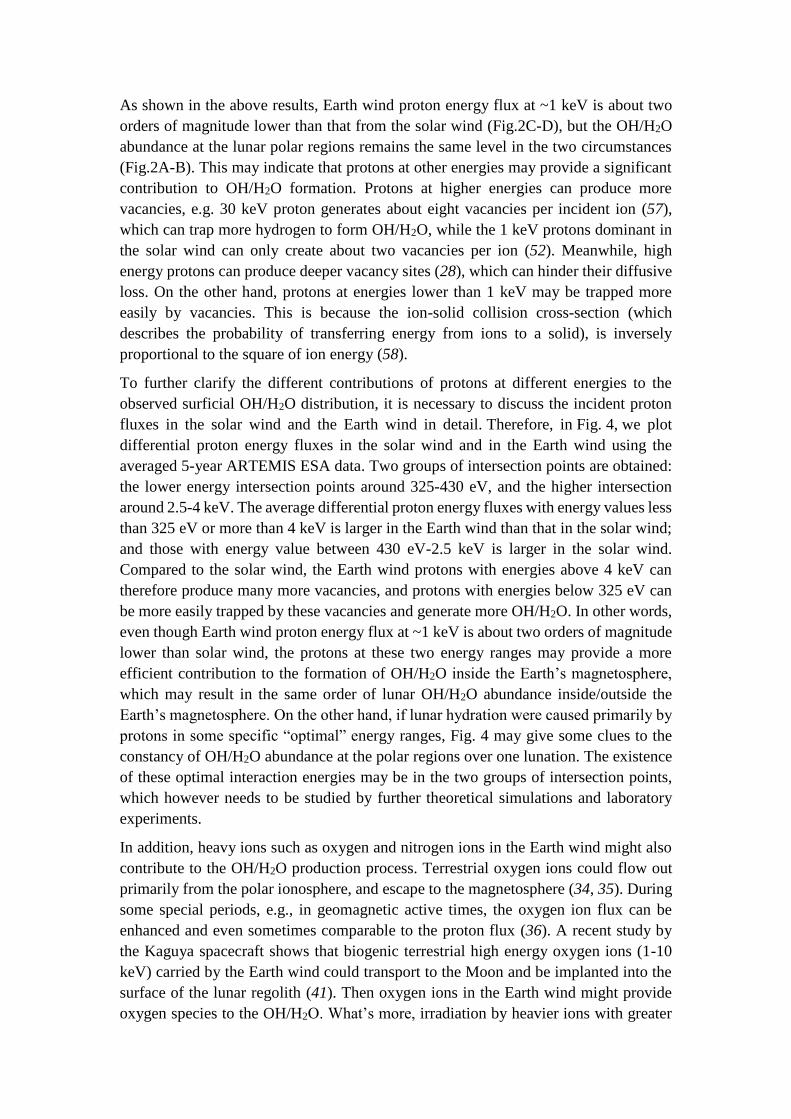
To further clarify the different contributions of protons at different energies to the
observed surficial OH/H2O distribution, it is necessary to discuss the incident proton
fluxes in the solar wind and the Earth wind in detail. Therefore, in Fig. 4, we plot
differential proton energy fluxes in the solar wind and in the Earth wind using the
averaged 5-year ARTEMIS ESA data. Two groups of intersection points are obtained:
the lower energy intersection points around 325-430 eV, and the higher intersection
around 2.5-4 keV. The average differential proton energy fluxes with energy values less
than 325 eV or more than 4 keV is larger in the Earth wind than that in the solar wind;
and those with energy value between 430 eV-2.5 keV is larger in the solar wind.
Compared to the solar wind, the Earth wind protons with energies above 4 keV can
therefore produce many more vacancies, and protons with energies below 325 eV can
be more easily trapped by these vacancies and generate more OH/H2O. In other words,
even though Earth wind proton energy flux at ~1 keV is about two orders of magnitude
lower than solar wind, the protons at these two energy ranges may provide a more
efficient contribution to the formation of OH/H2O inside the Earth’s magnetosphere,
which may result in the same order of lunar OH/H2O abundance inside/outside the
Earth’s magnetosphere. On the other hand, if lunar hydration were caused primarily by
protons in some specific “optimal” energy ranges, Fig. 4 may give some clues to the
constancy of OH/H2O abundance at the polar regions over one lunation. The existence
of these optimal interaction energies may be in the two groups of intersection points,
which however needs to be studied by further theoretical simulations and laboratory
experiments.
In addition, heavy ions such as oxygen and nitrogen ions in the Earth wind might also
contribute to the OH/H2O production process. Terrestrial oxygen ions could flow out
primarily from the polar ionosphere, and escape to the magnetosphere (34, 35). During
some special periods, e.g., in geomagnetic active times, the oxygen ion flux can be
enhanced and even sometimes comparable to the proton flux (36). A recent study by
the Kaguya spacecraft shows that biogenic terrestrial high energy oxygen ions (1-10
keV) carried by the Earth wind could transport to the Moon and be implanted into the
surface of the lunar regolith (41). Then oxygen ions in the Earth wind might provide
oxygen species to the OH/H2O. What’s more, irradiation by heavier ions with greater

incident energies would be more efficient to the sputtering process that may add more
vacancies (59). Thus, the high energy heavy ions in the Earth wind would produce more
vacancies in lunar minerals by sputtering processes, which can hold more implanted
protons to form OH/H2O.
In a case study, Hendrix et al. (60) found that the OH/H2O abundance is nearly the same
in two different locations inside/outside Earth’s magnetosphere at a mid-latitude region
using the Lunar Reconnaissance Orbiter (LRO) Lyman-Alpha Mapping Project (LAMP)
data. On the contrary, using the M3 OP2C data from a statistical study, Li et al. (61)
suggested that the shielding effect of Earth’s magnetosphere on the formation of the
lunar surficial water is pronounced at latitudes 60°- 75° S, although this effect is
obscured at lower latitudes due to compositional variations of the regolith. From their
figures, it appears that the shielding effect of the Earth’s magnetosphere tends to be
weaker above 65°S, therefore this does not conflict with our observations at the polar
regions.
The different variations of lunar OH/H2O abundance inside/outside of the Earth’s
magnetosphere at different latitudes may be related to both loss and formation processes.
As mentioned above, the thermal diffusion loss rate is higher at lower latitudes because
of its higher temperature (52). However, our calculation above shows that the loss rate
at high latitudes is significant and therefore some formation process must be involved
to maintain the same level of water abundance. In essence, solar wind protons have a
beam-like velocity distribution with a narrow thermal spread centered at the solar wind
bulk velocity. However, the protons in the Earth's magnetosphere, especially in the
plasma sheet, have a broad velocity distribution with a wide thermal spread (56, 62)
and a larger portion can reach the lunar surface (63), which may result in hydrogen
delivery to high-latitude regions more effectively. At low latitudes the diffusive loss
rate is higher and the incident Earth wind supply may not be sufficient, which may
result in the observed magnetotail shielding effect (64). This should be investigated in
future work.
Besides the Chandrayaan-1 M3, the LAMP onboard the LRO has obtained a large
amount of UV spectral data covering the entire lunar surface from 2009 to the present.
This provides an opportunity for comprehensive studies on the spatial distribution and
temporal variations of lunar water (22), and can give more evidence on its formation
mechanisms. In addition, the Chinese Chang’E-5 lunar sample-return mission is
planned to be launched in 2019. It has an infrared spectrometer with spectral range up
to 3 μm, which can also help us to study lunar surface water (OH/H2O). ARTEMIS
will concurrently provide accurate and high-resolution plasma data around the Moon
in the solar wind and in the magnetosphere.
References and Notes:
1. A. E. Saal et al., Nature 454, 192 (2008).
2. R. N. Clark, Science 326, 562 (2009).
3. J. M. Sunshine et al., Science 326, 565 (2009).

4. C. M. Pieters et al., Science 326, 568 (2009).
5. A. Colaprete et al., Science 330, 463 (2010).
6. J. W. Boyce et al., Nature 466, 466 (2010).
7. G. R. Gladstone et al., Science 330, 472 (2010).
8. J. P. Greenwood et al., Nat. Geosci. 4, 79 (2011).
9. E. H. Hauri, T. Weinreich, A. E. Saal, M. C. Rutherford, J. A. Van Orman,
Science 333, 213 (2011).
10. H. Hui, A. H. Peslier, Y. Zhang, C. R. Neal, Nat. Geosci. 6, 177 (2013).
11. K. Watson, B. C. Murray, H. Brown, J. Geophys. Res. 66, 3033 (1961).
12. J. R. Arnold, J. Geophys. Res. 84, 5659 (1979).
13. L. Starukhina, Y. Shkuratov, Icarus 147, 585 (2000).
14. F. M. McCubbin et al., Proc. Natl. Acad. Sci. U.S.A. 107, 11223 (2010).
15. A. E. Saal, E. H. Hauri, J. A. Van Orman, M. J. Rutherford, Science 340, 1317
(2013).
16. R. E. Milliken, S. Li, Nat. Geosci. 10, 561 (2017).
17. R. R. Keays et al., Science 167, 490 (1970).
18. J. J. Barnes et al., Nat. Commun. 7, 11684 (2016).
19. E. J. Zeller, L. B. Ronca, P. W. Levy, J. Geophys. Res. 71, 4855 (1966).
20. T. B. McCord et al., J. Geophys. Res. 116, E00G05 (2011).
21. G. Y. Kramer et al., J. Geophys. Res. 116, E00G18 (2011).
22. A. R. Hendrix et al., J. Geophys. Res. 117, E12001 (2012).
23. A. R. Poppe, J. S. Halekas, G. T. Delory, W. M. Farrell, J. Geophys. Res. 117,
A09105 (2012).
24. W. M. Farrell, D. M. Hurley, M. I. Zimmerman, Icarus 255, 116 (2015).
25. S. Li, R. E. Milliken, Sci. Adv. 3, e1701471 (2017).
26. C. Wöhler, A. Grumpe, A. A. Berezhnoy, V. V. Shevchenko, Sci. Adv. 3,
e1701286 (2017).
27. J. L. Bandfield, M. J. Poston, R. L. Klima, C. S. Edwards, Nat. Geosci. 11, 173
(2018).
28. Z. Djouadi et al., Astr. Astrophys. 531, A96 (2011).
29. A. S. Ichimura, A. P. Zent, R. C. Quinn, M. R. Sanchez, L. A. Taylor, Earth
Planet. Sci. Lett. 345-348, 90 (2012).
30. Y. Liu et al., Nat. Geosci. 5, 779 (2012).
31. M. J. Schaible, R. A. Baragiola, J. Geophys. Res. 119, 2017 (2014).

32. J. A. Hundhausen, Rev. Geophys. 8, 729 (1970).
33. S. P. Christon et al., Geophys. Res. Lett. 21, 3023 (1994).
34. K. Seki, R. C. Elphic, M. Hirahara, T. Terasawa, T. Mukai, Science 291, 1939
(2001).
35. Q. G. Zong et al., J. Geophys. Res. 106, 25541 (2001).
36. S. Y. Fu, Q. G. Zong, B. Wilken, Z. Y. Pu, Space Sci Rev 95, 539 (2001).
37. H. Hasegawa et al., Nature 430, 755 (2004).
38. Q. Q. Shi et al., Nat. Commun. 4, 1466 (2013).
39. A. R. Poppe, M. O. Fillingim, J. S. Halekas, J. Raeder, V. Angelopoulos,
Geophys. Res. Lett. 43, 6749 (2016).
40. R. P. Lin et al., Space Sci Rev 71, 125 (1995).
41. K. Terada et al., Nat. Astron. 1, 26 (2017).
42. S. Li, R. E. Milliken, J. Geophys. Res. 121, 2081 (2016).
43. Y. Saito et al., Earth Planets Space 60, 375 (2008).
44. Y. Saito et al., Space Sci Rev 154, 265 (2010).
45. H. Tsunakawa et al., Space Sci Rev 154, 219 (2010).
46. V. Angelopoulos, Space Sci Rev 165, 3 (2011).
47. D. G. Sibeck et al., Space Sci Rev 165, 59 (2011).
48. J. P. McFadden et al., Space Sci Rev 141, 277 (2008).
49. L. P. Keller, D. S. McKay, Geochimica et Cosmochimica Acta 61, 2331 (1997).
50. L. Starukhina, J. Geophys. Res. 106, 14701 (2001).
51. L. Starukhina, Water on the Moon: What Is Derived from the Observations?
(Springer Berlin Heidelberg, 2012), pp. 57-85.
52. W. M. Farrell, D. M. Hurley, V. J. Esposito, J. L. McLain, M. I. Zimmerman, J.
Geophys. Res. 122, 269 (2017).
53. S. Li et al., Proc. Natl. Acad. Sci. U.S.A. 115, 8907 (2018).
54. W. M. Farrell et al., Planet. Space Sci. 89, 15 (2013).
55. P. G. Lucey, Elements 5, 41 (2009).
56. Y. Harada et al., J. Geophys. Res. 119, 3573 (2014).
57. D. Fink et al., Applied Physics A 61, 381 (1995).
58. M. Nastasi, J. W. Mayer, J. K. Hirvonen, Ion-Solid Interactions: Fundamentals
and Applications., (Cambridge Univ. Press, Cambridge, U. K., 1996).
59. A. F. Barghouty, F. W. Meyer, P. R. Harris, J. H. A. Jr, Nuclear Inst & Methods
in Physics Research B 269, 1310 (2011).

60. A. R. Hendrix et al., 48th Lunar and Planetary Science Conference, abstract
2149, The Woodlands, Texas, 20 to 24 March 2017.
61. S. Li, P. G. Lucey, T. M. Orlando, 49th Lunar and Planetary Science Conference,
abstract 1575, The Woodlands, Texas, 19 to 23 March 2017.
62. W. C. Feldman et al., J. Geophys. Res. 106, 23231 (2001).
63. D. A. Hardy, H. K. Hills, J. W. Freeman, Geophys. Res. Lett. 2, 169 (1975).
64. E. Cho, Y. Yi, J. Yu, I. Hong, Y. Choi, J. Geophys. Res.123, 2110 (2018).
Acknowledgments: The authors express special thanks to W. M. Farrell and O. J.
Tucker for providing detailed calculation of evolution of distribution of activation
energy. We also gratefully thank constructive discussions with K. K. Khurana, S. Li
and M. G. Kivelson. We thank all the members of the Chandrayaan-1 M3, Kaguya
MAP-PACE and MAP-LMAG, and ARTEMIS ESA instrument teams. Funding: This
research was supported by the Key Research Program of the Chinese Academy of
Sciences (Grant NO. XDPB11), the National Natural Science Foundation of China
(Grants 41574157, 41774153, 41773065, 41490634, and 41628402), the Specialized
Research Fund for State Key Laboratories; Competing interests: Authors declare no
competing interests; and Data and materials availability: The M3 and Kaguya data
were downloaded from the Planetary Data System and the SELENE Data Archive. The
ARTEMIS data are available at http://artemis.ssl.berkeley.edu.
Supplementary Materials:
Materials and Methods

Fig. 1. (A) Lunar orbit in a lunation, indicating that during 3-5 days of every lunation,
the Moon lies within the Earth’s magnetosphere, in which the solar wind is shielded.
(B-C) Overview of lunar OH/H2O abundance (represented here by strength of 2.8
μm absorption feature) in the polar regions derived from the M3 observations
from 2009-Jan-26 to 2009-Feb-23. Red and black bars mark the duration of the Moon
in the Earth wind and solar wind, respectively. In general, we can find that there were
no significant differences in OH/H2O abundance in the Earth wind and solar wind. The
red rectangle indicates the Goldschmidt crater, in which lunar OH//H2O abundance is
anomalously high due to its material composition.

Fig. 2. OH/H2O abundance at lunar polar regions during a lunation from 26 Jan
2009 to 23 Feb 2009 and ion energy flux distribution averaged over five-year
observations. (A-B) The probability of 2.8 μm absorption depth between 0.05 and 0.2
represents the OH/H2O abundance level for each 5° latitude and 24 Earth hour bin. The
zero epoch in top two panels indicates full-moon time during the M3 observation. The
error is calculated by ε =𝑛
𝑁∗ (
√𝑛
𝑛+
√𝑁
𝑁), where n is the number of pixels with an
absorption depth greater than 0.05, and N is the number of pixels with an absorption
depth less than 0.2 in each bin. The error bar shown in the figure is scaled by a factor
of 10. We can find that the lunar surface OH/H2O abundance increases with latitude
toward the polar regions, which is consistent with previous studies (4, 20, 25), and the
anomaly indicated with blue dashed line rectangle is caused by highland materials
within Goldschmidt crater. The gray-shaded area marks the duration of the Moon in the
Earth’s magnetosphere determined by Kaguya observations. From these two panels it
is clearly seen that the OH/H2O abundance inside the Earth’s magnetosphere remains
nearly the same level as those when the Moon is exposed to solar wind. (C-D) A
superposed epoch analysis of (C) ion spectrogram and (D) ion energy flux around 1
keV as a function of lunar phase using the five-year ARTEMIS data from Sep 2011 to
October 2016, where the zero epoch in the two bottom panels indicates the full-moon
times, for five years of ARTEMIS observations. The red solid line represents the
median value of energy flux, and the black and blue solid lines represent the
upper/lower quartiles. The ion energy distribution in the magnetosphere becomes
broader and the ion energy flux around 1 keV is about two orders of magnitude lower
than that in the solar wind. This figure suggests that in the Earth wind the protons at

other energies and heavy ions may provide significant contribution to the OH/H2O
formation, see details in the text.
Fig 3. Temporal evolution of implanted hydrogen distribution with activation
energy when the sources are turned off. The results are calculated using the model
described in (52), with T = 280 K and duration Δt = 3.8 days. (A) The ratio between
the final and initial H distribution. The implanted H with activation energy above
~0.7 eV is retained, while those with U < 0.65 eV tend to escape. (B) Initial (red) and
final H (blue) distributions. The overall retained H for all activation energies is down
to 46% of those initially implanted. Therefore, possible sources other than solar wind
should exist in the Earth’s magnetosphere.
Fig 4. Differential ion energy fluxes for (A) low and (B) high energy ranges in the
solar wind and in the magnetosphere from averaged 5-year ARTEMIS ESA data.
The two groups of intersection points are around 325-430 eV and 2.5-4 keV. The
average differential proton energy fluxes with energy value less than 325 eV or more
than 4 keV are larger in the Earth wind than those in the solar wind. We can therefore
expect that the Earth wind protons at energies above 4 keV produce more vacancies,
while protons below 325 eV can be easily trapped (because of their lower energy) by
these more abundant vacancies compared to solar wind. Therefore, even though Earth
wind proton energy flux at ~1 keV is about two orders of magnitude lower than solar
wind, the protons at these two energy ranges could be a significant contribution to the
formation of OH/H2O inside the Earth’s magnetosphere. On the other hand, if lunar
hydration were caused primarily by protons in some specific “optimal” energy bands,
the existence of these optimal interaction energies may be in the two groups of
intersection points.
Materials and Methods
The M3 imaging spectrometer onboard the Chandrayaan-1 mission measures reflected
solar light by the lunar surface, covering visible and near-infrared wavelengths between
~460 nm and 3000 nm. This spectral range contains absorption features near 2.8 to 3
μm caused by OH/H2O (4). We selected the M3 data within a lunation from January 26,
2009 to February 23, 2009, while the optical period is OP1B in cold thermal operating
conditions. During this time interval the Moon stayed in the Earth’s magnetosphere for
several days around February 9, 2009 (the full moon time). Lunar near-infrared (NIR)
reflectance spectra is affected by the thermal emission radiation at wavelengths beyond
2 μm (42). In order to suppress thermal residuals in the first-order thermal corrections
of the M3 data, only the polar regions with latitude ab2ove 70° are selected due to their
lower temperatures (~ 280 K). The “bad” pixels with lower and flat reflectance spectra
are removed based on their wavelength-reflectance 2D histogram. Then, we calculated
the absorption depth around 2.8 μm as an indicator of lunar surface OH/H2O abundance,
as described in (4).