earnings presentation - xerox newsroom
TRANSCRIPT

Earnings PresentationQ4 2020 RESULTS I JANUARY 26, 2021

—
2
Forward-Looking Statements
This presentation, and other written or oral statements made from time to time by management contain “forward-looking statements” as defined in the Private Securities Litigation Reform Act of 1995. The words “anticipate”, “believe”, “estimate”, “expect”, “intend”, “will”, “should”, "targeting", "projecting", "driving" and similar expressions, as they relate to us, our performance and/or our technology, are intended to identify forward-looking statements. These statements reflect management’s current beliefs, assumptions and expectations and are subject to a number of factors that may cause actual results to differ materially. Such factors include but are not limited to: the effects of the COVID-19 pandemic on our and our customers' businesses and the duration and extent to which this will impact our future results of operations and overall financial performance; our ability to address our business challenges in order to reverse revenue declines, reduce costs and increase productivity so that we can invest in and grow our business; our ability to attract and retain key personnel; changes in economic and political conditions, trade protection measures, licensing requirements and tax laws in the United States and in the foreign countries in which we do business; the imposition of new or incremental trade protection measures such as tariffs and import or export restrictions; changes in foreign currency exchange rates; our ability to successfully develop new products, technologies and service offerings and to protect our intellectual property rights; the risk that multi-year contracts with governmental entities could be terminated prior to the end of the contract term and that civil or criminal penalties and administrative sanctions could be imposed on us if we fail to comply with the terms of such contracts and applicable law; the risk that partners, subcontractors and software vendors will not perform in a timely, quality manner; actions of competitors and our ability to promptly and effectively react to changing technologies and customer expectations; our ability to obtain adequate pricing for our products and services and to maintain and improve cost efficiency of operations, including savings from restructuring actions; the risk that confidential and/or individually identifiable information of ours, our customers, clients and employees could be inadvertently disclosed or disclosed as a result of a breach of our security systems due to cyber attacks or other intentional acts; reliance on third parties, including subcontractors, for manufacturing of products and provision of services; the exit of the United Kingdom from the European Union; our ability to manage changes in the printing environment and expand equipment placements; interest rates, cost of borrowing and access to credit markets; funding requirements associated with our employee pension and retiree health benefit plans; the risk that our operations and products may not comply with applicable worldwide regulatory requirements, particularly environmental regulations and directives and anti-corruption laws; the outcome of litigation and regulatory proceedings to which we may be a party; any impacts resulting from the restructuring of our relationship with Fujifilm Holdings Corporation; and the shared services arrangements entered into by us as part of Project Own It. Additional risks that may affect Xerox’s operations and other factors that are set forth in the “Risk Factors” section, the “Legal Proceedings” section, the “Management’s Discussion and Analysis of Financial Condition and Results of Operations” section and other sections of Xerox Holdings Corporation’s and Xerox Corporation's 2019 Annual Report on Form 10-K, as well as in Xerox Holdings Corporation's and Xerox Corporation's Quarterly Reports on Form 10-Q and Current Reports on Form 8-K filed with the SEC.
These forward-looking statements speak only as of the date of this presentation or as of the date to which they refer, and Xerox assumes no obligation to update any forward-looking statements as a result of new information or future events or developments, except as required by law.

—
3
Adj1 Earnings Per Share Revenue ($B) Adj1 Operating Margin
Free Cash Flow1 ($M) Shareholder Returns ($M)
$1.41
$3.55
$7.0
$9.1
6.6%
13.1%
$474
$1,179
2020 2020 2020
2020
2019 2019 2019
2019 2020 2019
$600
Dividends Share Repurchase
2020 % Change: (22.5)% @ AC, (22.7)% @ CC1GAAP EPS $2.78$0.84
Operating
Cash Flow $548 $1,244
Full Year 2020 Key Financial Measures
NOTE 1: FY 2019 Adj.1 Earnings Per Share, Revenue, Adj.1 Operating Margin and Free Cash Flow reflect the inclusion of the benefit from an upfront OEM license fee of $77 million, paid by Fuji
Xerox to Xerox in Q4 2019 as part of a series of transactions to restructure Xerox’s relationship with FUJIFILM Holdings Corporation.
NOTE 2: The financial results presented in these slides are from continuing operations and exclude the results of Fuji Xerox equity income and XIP, which are presented as discontinued operations.1 Adjusted Measures, Free Cash Flow and Constant Currency (CC): see Non-GAAP Financial Measures.
$300
$230
$243

—
4
Optimize operations
for simplicity
• Continuously improve operating model for greater efficiency
• Invest further in robotic process automation, augmented reality and analytics to
drive efficiencies
• Reduce complexity and choice around billing and offerings
Drive revenue
• Scale IT Services in SMB
• Grow XFS as a global payment solutions business
• Expand software offerings in enterprise content management and customer
experience
Re-energize the
innovation engine
• Revenue growth from 3D and IoT
• Launch $250M corporate venture capital fund
• Embed PARC’s AI technology into new and existing software offerings
Focus on cash flow and
increasing capital
returns
• Generate at least $500M of free cash flow
• Deploy excess capital for strategic M&A
• Opportunistic share repurchases
Strategic Initiatives to Transform Xerox

—
5
Frequently Asked QuestionsWhat has changed that makes
you confident in your guidance
for 2021?
Do you expect long-term
impacts to your business as a
result of the COVID-19
pandemic?
What structural changes are
you making to help drive
growth?
Have your capital allocation
priorities changed for 2021?
The workplace has been transformed into a
more flexible, hybrid environment. In
response, we have further expanded our
innovation investments in order to bolster
and diversify our portfolio of offerings.
Xerox continues to position itself for the
future through investments in our core print
business including Digital Services such as
Digital Mail, Capture & Content and Digital
Hub & Cloud Print, which enable work to
flow seamlessly between the office and
home.
Additionally, the hybrid work environment
has increased SMB needs for IT Services,
an area in which we achieved organic
growth and established new partnerships,
including Dell and Lenovo. This remains an
important focus area.
While the near-term economic impacts of
COVID-19 remain a headwind, we are
optimistic with regards to tailwinds later in
the year as the vaccine rollout progresses.
Within print solutions, we are strengthening
our go-to-market, pushing into higher
margin portions of the value chain, and
expanding professional services for print
management.
We are focused on taking share in Entry
and maintaining leadership in Mid and
High segments through continued
investments.
Other identified growth areas, such as IT
Services and Software are also expected
to grow organically as a result of increased
investment, secular tailwinds and
innovation.
Finally, Project Own It provides us the
flexibility to adjust our cost structure and
generate cash. The program has
generated $1.4 billion in gross cost savings
since late 2018, and we expect another
$375 million of savings in 2021.
Overall, priorities are unchanged. Our
balance sheet and liquidity are strong, with
approximately $2.7 billion of cash, cash
equivalents and restricted cash and a $1.8
billion undrawn revolver as of December
31st.
We remain committed to our shareholder
return policy (including current dividend
rate) of returning at least 50% of annual free
cash flow to shareholders, and we have
authorization to repurchase $500 million of
our shares, which we will execute
opportunistically.
We continue to assess our M&A pipeline,
including both potential tuck-in acquisitions
and strategic transactions.
Due to refinancing activities, our liquidity
remains strong as there are no bond
maturities due in 2021, providing additional
financial flexibility.
Xerox plans to stand up Software,
Financing (XFS), and Innovation (PARC)
as separate businesses within Xerox,
allowing them to focus on developing new
capabilities and sustainable growth.
PARC has made progress over the last
two years developing disruptive
technologies that we are beginning to
commercialize in 2021.
To accelerate progress further, we are
establishing a $250 million corporate
venture capital fund to invest in start-ups
and early/mid-stage growth companies
aligned with our innovation pillars and
targeted adjacencies. The corporate
venture capital fund will drive growth
through investment, commercial
partnerships and co-development of new
technologies.
We have added to our Software offerings
with the acquisition of CareAR, an
augmented reality product that provides
remote assistance and helps major
technology clients modernize field service,
customer support and other IT services.

—
6
Financial Results Summary (in millions, except per share data)
P&L Measures
Q4
2020
B/(W)
YOY
% Change
YOY
Revenue $ 1,930 $ (514)(21.0)% AC
(22.3)% CC1
Operating Income –
Adjusted1 $ 184 $ (227) (55.2)%
Other Expenses, net $ 30 $ (22) NA
Net Income $ 77 $ (189) (71.1)%
Net Income – Adjusted1 $ 122 $ (178) (59.3)%
GAAP Earnings Per Share $ 0.36 $ (0.81) (69.2)%
EPS – Adjusted1 $ 0.58 $ (0.75) (56.4)%
P&L Ratios Q4 2020 B/(W) YOY
Gross Margin 36.2% (540) bps
RD&E % 3.9% (10) bps
SAG % 22.8% (190) bps
Operating Margin – Adjusted1 9.5% (730) bps
Tax Rate – Adjusted1 29.8% (480) bps
NOTE: Q4 2019 Revenue, Gross Margin, Operating Income– Adjusted1, Operating Margin – Adjusted1, GAAP EPS, EPS-Adjusted1, Net Income, Net Income – Adjusted1, and Tax Rate –
Adjusted1 reflect the inclusion of the benefit from an upfront OEM license fee of $77 million, paid by Fuji Xerox to Xerox in Q4 2019 as part of a series of transactions to restructure Xerox’s
relationship with FUJIFILM Holdings Corporation.
1 Adjusted Measures and Constant Currency (CC): see Non-GAAP Financial Measures.

—
7
1 Non-cash add-backs include depreciation & amortization (including equipment on operating lease), provisions, stock-based compensation, defined benefit pension expense,
restructuring and asset impairment charges and gain on sales of businesses and assets. 2 Working Capital, net includes accounts receivable, accounts payable and inventory. 3 Includes equipment on operating leases (excluding its related depreciation) and finance receivables. 4 Includes other current and long-term assets and liabilities, accrued
compensation, derivative assets and liabilities, other operating, net, distributions from net income of unconsolidated affiliates and taxes. 5 Includes $2,691M of cash, cash
equivalents and restricted cash, of which $66 million was restricted. 6 Free Cash Flow: see Non-GAAP Financial Measures.
(in millions) Q4 2020 FY 2020
Pre-tax Income $ 103 $ 252
Non-cash add-backs1 180 672
Restructuring Payments (18) (81)
Pension Contributions (42) (139)
Working Capital, net2 123 112
Change in Finance Assets3 (70) 65
Other4 (41) (333)
Cash from Operations $ 235 $ 548
Cash used in Investing $ (23) $ (246)
Cash used in Financing $ (840) $ (416)
Ending Cash, Cash Equivalents and Restricted Cash5 $ 2,691 $ 2,691
Free Cash Flow6 $ 221 $ 474
Cash Flow

—
8
NOTE: Q4 2019 Post Sale, Total Revenue and Other reflect the inclusion of the benefit from an upfront OEM license fee of $77 million, paid by Fuji Xerox to Xerox in Q4 2019 as part of a series of
transactions to restructure Xerox’s relationship with FUJIFILM Holdings Corporation. 1 Constant Currency: see Non-GAAP Financial Measures. 2 Other total revenue includes sales to Fuji Xerox and licensing. 3 Mid-Range and High-End color installations exclude Fuji Xerox digital front-end
sales and reflect a mix to higher end products within each of these categories. 4 Xerox Services includes solutions and services that span from managing print to automating processes to managing
content. Our primary offerings are Intelligent Workplace Services (IWS), as well as Digital and Cloud Print Services (including centralized print services) and Communication and Marketing Solutions.
B/(W) YOY
(in millions)Q4
2020 % Mix
Q4
2020
AC
Q4
2020
CC1
Equipment $ 510 26% (17.2)% (18.8)%
Post Sale $1,420 74% (22.3)% (23.5)%
Total Revenue $1,930 100% (21.0)% (22.3)%
Americas 1,208 63% (22.6)% (22.5)%
EMEA 675 35% (10.7)% (15.1)%
Other2 47 2% (63.0)% (63.0)%
Xerox Services4 $ 715 37% (17.9)% (19.4)%
Q4 2020 FY 2020
Color B&W Color B&W
Entry A4 MFPs (22)% 28% (21)% 20%
Mid-Range (20)% (16)% (26)% (22)%
High-End (26)% (6)% (42)% (13)%
Q4 Equipment Revenue
Installs3 B/(W) YOY
Revenue
12%
64%
22%
2%
Entry
Mid-Range
High-End
Other
—
9
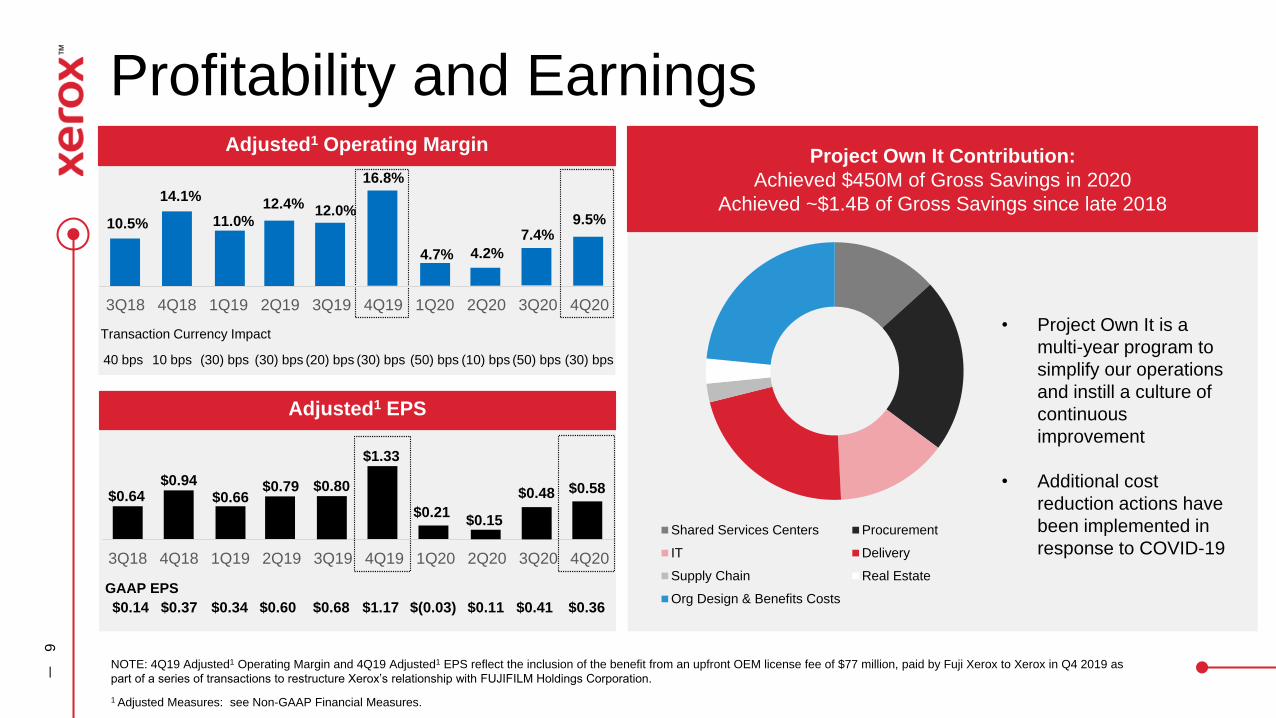
Profitability and Earnings
Shared Services Centers Procurement
IT Delivery
Supply Chain Real Estate
Org Design & Benefits Costs
Project Own It Contribution:
Achieved $450M of Gross Savings in 2020
Achieved ~$1.4B of Gross Savings since late 2018
Transaction Currency Impact
40 bps 10 bps (30) bps (30) bps (20) bps (30) bps (50) bps (10) bps (50) bps (30) bps
$0.14 $0.37 $0.34 $0.60 $0.68 $1.17 $(0.03) $0.11 $0.41 $0.36
GAAP EPS
Adjusted1 EPS
Adjusted1 Operating Margin
• Project Own It is a
multi-year program to
simplify our operations
and instill a culture of
continuous
improvement
• Additional cost
reduction actions have
been implemented in
response to COVID-19
NOTE: 4Q19 Adjusted1 Operating Margin and 4Q19 Adjusted1 EPS reflect the inclusion of the benefit from an upfront OEM license fee of $77 million, paid by Fuji Xerox to Xerox in Q4 2019 as
part of a series of transactions to restructure Xerox’s relationship with FUJIFILM Holdings Corporation.
1 Adjusted Measures: see Non-GAAP Financial Measures.
3Q18 4Q18 1Q19 2Q19 3Q19 4Q19 1Q20 2Q20 3Q20 4Q20
3Q18 4Q18 1Q19 2Q19 3Q19 4Q19 1Q20 2Q20 3Q20 4Q20
10.5%
14.1%
11.0%
12.4%12.0%
16.8%
4.7%
$0.64$0.94
$0.66$0.79 $0.80
$1.33
$0.21
4.2%
$0.15
7.4%
$0.48
9.5%
$0.58

—
Overall net global funded status at 12/31/20: ~91.7%
10
Capital Structure
• Maintain 7:1 debt to equity leverage ratio on $3.5B of
Xerox Financial Services (XFS) assets as of 12/31/2020
• Prepaid $1.1B of bonds due May 2021 with combination of
new senior unsecured notes and securitization; next
maturity of $300M in March 2022
• Ending net core cash $1.3B, netting core debt of $1.4B
with ending cash of $2.7B
Senior Unsecured Debt Maturity Ladder ($B)
1 Cash, cash equivalents and restricted cash.
Total Debt $ 4.4 $ 4.3
Less: Finance Debt (3.0) (3.3)
Core Debt 1.4 1.0
Less: Cash1 (2.7) (2.8)
Net Core Cash $ (1.3) $ (1.8)
Pension: Net Unfunded Status ($M)
Leverage
54 397 382
851
815 772
2020 2019 2018Funded Plans Unfunded Plans
$1,212 $1,154$905
Debt and Cash ($B) 12/31/2020 12/31/2019
$0.30
$1.00
$0.30
$0.75 $0.75
$0.25 $0.35
2022 2023 2024 2025 2028 2035 2039
The net deficit in funded plans of $54M includes an under-funded position for our US Primary Plans of $606M and
$552M over-funded positions, net, for our international plans (primarily in the UK).
—
11
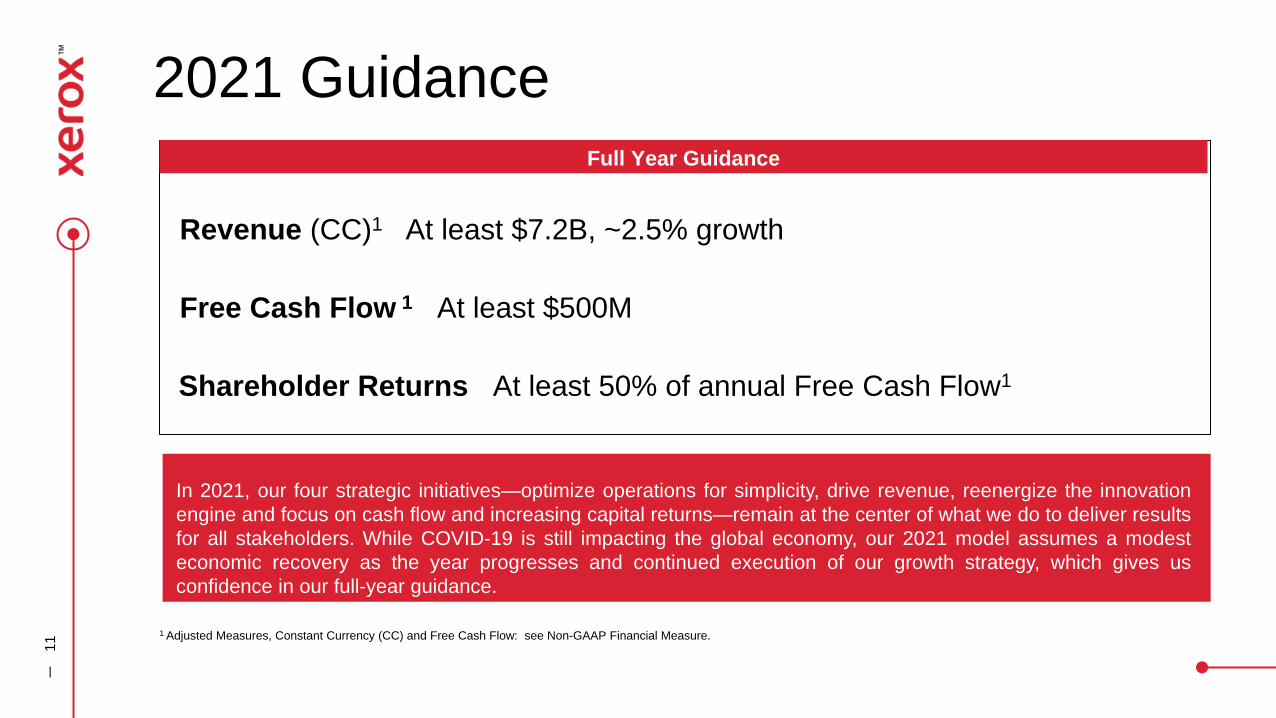
In 2021, our four strategic initiatives—optimize operations for simplicity, drive revenue, reenergize the innovation
engine and focus on cash flow and increasing capital returns—remain at the center of what we do to deliver results
for all stakeholders. While COVID-19 is still impacting the global economy, our 2021 model assumes a modest
economic recovery as the year progresses and continued execution of our growth strategy, which gives us
confidence in our full-year guidance.
2021 Guidance
1 Adjusted Measures, Constant Currency (CC) and Free Cash Flow: see Non-GAAP Financial Measure.
Revenue (CC)1 At least $7.2B, ~2.5% growth
Free Cash Flow 1 At least $500M
Shareholder Returns At least 50% of annual Free Cash Flow1
Full Year Guidance

—
Appendix
12

—
Operating Trends – Continuing Operations
1 Adjusted measures, Free Cash Flow, and Constant Currency (CC): see Non-GAAP Financial Measures.
13
2018 2019 2020
(in millions, except EPS) FY Q1 Q2 Q3 Q4 FY Q1 Q2 Q3 Q4 FY
Total Revenue $9,662 $2,180 $2,263 $2,179 $2,444 $9,066 $1,860 $1,465 $1,767 $1,930 $7,022
% Change (3.3)% (8.4)% (8.3)% (5.8)% (2.2)% (6.2)% (14.7)% (35.3)% (18.9)% (21.0)% (22.5)%
CC1 % Change (4.0)% (6.0)% (6.7)% (4.7)% (1.6)% (4.7)% (13.9)% (34.6)% (19.7)% (22.3)% (22.7)%
Adj1 Operating Margin 11.3% 11.0% 12.4% 12.0% 16.8% 13.1% 4.7% 4.2% 7.4% 9.5% 6.6%
GAAP EPS (Loss) $1.16 $0.34 $0.60 $0.68 $1.17 $2.78 $(0.03) $0.11 $0.41 $0.36 $0.84
Adj1 EPS $2.88 $0.66 $0.79 $0.80 $1.33 $3.55 $0.21 $0.15 $0.48 $0.58 $1.41
Operating Cash Flow $1,082 $222 $276 $348 $398 $1,244 $173 $34 $106 $235 $548
Free Cash Flow1 $992 $207 $260 $331 $381 $1,179 $150 $15 $88 $221 $474

—
Impact of OEM License Agreement between Xerox and Fuji Xerox
14
In November 2019, Xerox Holdings Corporation completed a series of transactions to restructure its relationship with
FUJIFILM Holdings Corporation (“FH”), including the sale of its indirect 25% equity interest in Fuji Xerox (“FX”) for
approximately $2.2 billion as well as the sale of its indirect 51% partnership interest in Xerox International Partners
(“XIP”) for approximately $23 million (collectively the “Sales”). The transactions with FH also included an OEM
license agreement by and between FX and Xerox, granting FX the right to use specific Xerox Intellectual Property
(“IP”) in providing certain named original equipment manufacturers (“OEM’s”) with products (such as printer engines)
in exchange for an upfront license fee of $77 million. The license fee was recorded within other revenues in fourth
quarter 2019. The $77 million ($58 million after-tax) OEM license had the following impact on our financial results for
the three months ended and for the year ended December 31, 2020 and 2019, respectively:

—
Non-GAAP Financial Measures
15

—
16
Non-GAAP Financial MeasuresWe have reported our financial results in accordance with generally accepted accounting principles (GAAP). In addition, we have discussed our financial results using
the non-GAAP measures described below. We believe these non-GAAP measures allow investors to better understand the trends in our business and to better
understand and compare our results. Accordingly, we believe it is necessary to adjust several reported amounts, determined in accordance with GAAP, to exclude the
effects of certain items as well as their related income tax effects.
A reconciliation of these non-GAAP financial measures to the most directly comparable financial measures calculated and presented in accordance with GAAP are set
forth below.
These non-GAAP financial measures should be viewed in addition to, and not as a substitute for, the company’s reported results prepared in accordance with GAAP.
Adjusted Earnings Measures
• Net Income and Earnings per share (EPS)
• Effective Tax Rate
The above measures were adjusted for the following items:
• Restructuring and related costs: Restructuring and related costs include restructuring and asset impairment charges as well as costs associated with our
transformation programs beyond those normally included in restructuring and asset impairment charges. Restructuring consists of costs primarily related to severance
and benefits paid to employees pursuant to formal restructuring and workforce reduction plans. Asset impairment includes costs incurred for those assets sold,
abandoned or made obsolete as a result of our restructuring actions, exiting from a business or other strategic business changes. Additional costs for our
transformation programs are primarily related to the implementation of strategic actions and initiatives and include third-party professional service costs as well as
one-time incremental costs. All of these costs can vary significantly in terms of amount and frequency based on the nature of the actions as well as the changing
needs of the business. Accordingly, due to that significant variability, we will exclude these charges since we do not believe they provide meaningful insight into our
current or past operating performance nor do we believe they are reflective of our expected future operating expenses as such charges are expected to yield future
benefits and savings with respect to our operational performance.
• Amortization of intangible assets: The amortization of intangible assets is driven by our acquisition activity which can vary in size, nature and timing as compared to
other companies within our industry and from period to period. The use of intangible assets contributed to our revenues earned during the periods presented and will
contribute to our future period revenues as well. Amortization of intangible assets will recur in future periods.

—
17
Non-GAAP Financial Measures (cont’d)
• Transaction and related costs, net: Transaction and related costs, net are costs and expenses primarily associated with certain strategic M&A projects.
These costs are primarily for third-party legal, accounting, consulting and other similar type professional services as well as potential legal settlements that
may arise in connection with those M&A transactions. These costs are considered incremental to our normal operating charges and were incurred or are
expected to be incurred solely as a result of the planned transactions. Accordingly, we are excluding these expenses from our Adjusted Earnings Measures
in order to evaluate our performance on a comparable basis.
• Non-service retirement-related costs: Our defined benefit pension and retiree health costs include several elements impacted by changes in plan assets and
obligations that are primarily driven by changes in the debt and equity markets as well as those that are predominantly legacy in nature and related to
employees who are no longer providing current service to the company (e.g. retirees and ex-employees). These elements include (i) interest cost, (ii)
expected return on plan assets, (iii) amortization of prior plan amendments, (iv) amortized actuarial gains/losses and (v) the impacts of any plan
settlements/curtailments. Accordingly, we consider these elements of our periodic retirement plan costs to be outside the operational performance of the
business or legacy costs and not necessarily indicative of current or future cash flow requirements. This approach is consistent with the classification of
these costs as non-operating in other expenses, net. Adjusted earnings will continue to include the service cost elements of our retirement costs, which is
related to current employee service as well as the cost of our defined contribution plans.
• Other discrete, unusual or infrequent items: We excluded the following items given their discrete, unusual or infrequent nature and their impact on our results
for the period:
• Contract termination costs - IT services,
• Loss on early extinguishment of debt, and
• Impacts associated with the Tax Cuts and Jobs Act (the "Tax Act") enacted in December 2017.
We believe the exclusion of these items allows investors to better understand and analyze the results for the period as compared to prior periods and expected
future trends in our business.

—
18
Non-GAAP Financial Measures (cont’d)Adjusted Operating Income/Margin
We calculate and utilize adjusted operating income and margin measures by adjusting our reported pre-tax income and margin amounts. In addition to the costs and
expenses noted as adjustments for our Adjusted Earnings measures, adjusted operating income and margin also exclude the remaining amounts included in Other
expenses, net, which are primarily non-financing interest expense and certain other non-operating costs and expenses. We exclude these amounts in order to evaluate
our current and past operating performance and to better understand the expected future trends in our business.
Constant Currency
To better understand trends in our business, we believe that it is helpful to adjust revenue to exclude the impact of changes in the translation of foreign currencies into
U.S. dollars. We refer to this adjusted revenue as “constant currency.” This impact is calculated by translating current period activity in local currency using the
comparable prior year period's currency translation rate. This impact is calculated for all countries where the functional currency is not the U.S. dollar. Management
believes the constant currency measure provides investors an additional perspective on revenue trends. Currency impact can be determined as the difference between
actual growth rates and constant currency growth rates.
Free Cash Flow
To better understand trends in our business, we believe that it is helpful to adjust operating cash flows by subtracting amounts related to capital expenditures.
Management believes this measure gives investors an additional perspective on cash flow from operating activities in excess of amounts required for reinvestment. It
provides a measure of our ability to fund acquisitions, dividends and share repurchase.
Summary:
Management believes that all of these non-GAAP financial measures provide an additional means of analyzing the current period’s results against the corresponding
prior period’s results. However, these non-GAAP financial measures should be viewed in addition to, and not as a substitute for, the company’s reported results
prepared in accordance with GAAP. Our non-GAAP financial measures are not meant to be considered in isolation or as a substitute for comparable GAAP measures
and should be read only in conjunction with our consolidated financial statements prepared in accordance with GAAP. Our management regularly uses our
supplemental non-GAAP financial measures internally to understand, manage and evaluate our business and make operating decisions. These non-GAAP measures
are among the primary factors management uses in planning for and forecasting future periods. Compensation of our executives is based in part on the performance of
our business based on these non-GAAP measures.
A reconciliation of these non-GAAP financial measures and the most directly comparable measures calculated and presented in accordance with GAAP are set forth
on the following tables:

—
Three Months Ended
December 31, 2020
Three Months Ended
December 31, 2019
Year Ended
December 31, 2020
Year Ended
December 31, 2019
(in millions, except per share amounts)
Net
Income EPS
Net
Income EPS
Net
Income EPS
Net
Income EPS
Reported(1) $ 77 $ 0.36 $ 266 $ 1.17 $ 192 $ 0.84 $ 648 $ 2.78
Adjustments:
Restructuring and related costs 29 53 93 229
Amortization of intangible assets 22 10 56 45
Transaction and related costs, net - 4 18 12
Non-service retirement-related costs (9) (3) (29) 18
Loss on early extinguishment of debt 26 - 26 -
Contract termination costs – IT services - (4) 3 (12)
Income tax on adjustments(2) (23) (22) (46) (77)
Tax Act - (4) - (35)
Adjusted $ 122 $ 0.58 $ 300 $ 1.33 $ 313 $ 1.41 $ 828 $ 3.55
Dividends on preferred stock used in adjusted EPS
calculation(3)
$ - $ - $ 14 $ -
Weighted average shares for adjusted EPS(3) 209 227 211 233
Fully diluted shares at December 31, 2020(4) 207
(1) Net income and EPS from continuing operations attributable to Xerox Holdings.
(2) Refer to Effective Tax Rate reconciliation.
(3) Average shares for the calculation of adjusted diluted EPS for the three months ended December 31, 2020, and for three months ended and year ended 2019, includes 7 million shares associated with our
Series A convertible preferred stock and therefore earnings excludes the preferred stock dividend. Average shares for the calculation of adjusted diluted EPS for the year ended December 31, 2020 excludes 7
million shares associated with our Series A convertible preferred stock and therefore earnings includes the preferred stock dividend.
(4) Represents common shares outstanding at December 31, 2020 plus potential dilutive common shares as used for the calculation of adjusted diluted EPS for the three months ended December 31, 2020
which includes shares associated with our Series A convertible preferred stock.
19
Net Income and EPS reconciliation

—
20
Effective Tax Rate reconciliation
Three Months Ended
December 31, 2020
Three Months Ended
December 31, 2019
Year Ended
December 31, 2020
Year Ended
December 31, 2019
(in millions)
Pre-Tax
Income
Income
Tax
Expense
Effective
Tax Rate
Pre-Tax
Income
Income
Tax
Expense
Effective
Tax Rate
Pre-Tax
Income
Income
Tax
Expense
Effective
Tax
Rate
Pre-Tax
Income
Income
Tax
Expense
Effective
Tax
Rate
Reported(1) $ 103 $ 28 27.2% $ 336 $ 73 21.7% $ 252 $ 64 25.4% $ 822 $ 179 21.8%
Non-GAAP Adjustments(2) 68 23 60 22 167 46 292 77
Tax Act - - - 4 - - - 35
Adjusted(3) $ 171 $ 51 29.8% $ 396 $ 99 25.0% $ 419 $ 110 26.3% $ 1,114 $ 291 26.1%
(1) Pre-tax income and income tax expense from continuing operations.
(2) Refer to Net Income and EPS reconciliation for details.
(3) The tax impact on Adjusted Pre-Tax Income from continuing operations is calculated under the same
accounting principles applied to the Reported Pre-Tax Income under ASC 740, which employs an annual
effective tax rate method to the results.

—
21
Operating Income / Margin reconciliation
Three Months Ended
December 31, 2020
Three Months Ended
December 31, 2019
Year Ended
December 31, 2020
Year Ended
December 31, 2019
(in millions) Profit Revenue Margin Profit Revenue Margin Profit Revenue Margin Profit Revenue Margin
Reported (1) $ 103 $ 1,930 5.3% $ 336 $ 2,444 13.7% $ 252 $ 7,022 3.6% $ 822 $ 9,066 9.1%
Adjustments:
Restructuring and related costs 29 53 93 229
Amortization of intangible assets 22 10 56 45
Transaction and related costs, net - 4 18 12
Other expenses, net 30 8 45 84
Adjusted $ 184 $ 1,930 9.5% $ 411 $ 2,444 16.8% $ 464 $ 7,022 6.6% $ 1,192 $ 9,066 13.1%
____________________(1) Pre-tax Income and revenue from continuing operations.

—
22
Free Cash Flow reconciliation
Three Months Ended
December 31,
Year Ended
December 31,
(in millions) 2020 2019 Change 2020 2019 Change
Reported (1) $ 235 $ 398 $ (163) $ 548 $ 1,244 $ (696)
Capital expenditures (14) (17) 3 (74) (65) (9)
Free Cash Flow $ 221 $ 381 $ (160) $ 474 $ 1,179 $ (705)
____________________(1) Net cash provided by operating activities of continuing operations.

—
23
Other Expenses, Net reconciliation
Three Months Ended Year Ended
December 31, December 31,
(in millions) 2020 2019 2020 2019
Reported $ 30 $ 8 $ 45 $ 84
Less: Non-service retirement-related costs (9) (3) (29) 18
Less: Contract termination costs – IT services - (4) 3 (12)
Less: Loss on early extinguishment of debt 26 - 26 -
Adjusted $ 13 $ 15 $ 45 $ 78

—
24
Free Cash Flow – Guidance
(in millions) FY 2021
Operating Cash Flow(1) At least $ 600
Less: capital expenditures (100)
Free Cash Flow At least $ 500
___________________________(1)Net cash provided by operating activities from continuing operations.

—
Net Income (Loss) and EPS reconciliation –historical
Q3-18 Q4-18
Year Ended
December 31, 2018 Q1-19 Q2-19 Q3-19 Q4-19
Year Ended
December 31, 2019 Q1-20 Q2-20 Q3-20
(in millions, except per share amounts)
Net
Income EPS
Net
Income EPS
Net
Income EPS
Net
Income EPS
Net
Income EPS
Net
Income EPS
Net
Income EPS
Net
Income EPS
Net
(Loss)
Income EPS
Net
Income EPS
Net
Income EPS
Reported (1) $ 39 $ 0.14 $ 91 $ 0.37 $ 306 $ 1.16 $ 84 $ 0.34 $ 141 $ 0.60 $ 157 $ 0.68 $ 266 $ 1.17 $ 648 $ 2.78 $ (2) $ (0.03) $ 27 $ 0.11 $ 90 $ 0.41
Restructuring and related costs 29 67 157 112 37 27 53 229 41 3 20
Amortization of intangible assets 12 12 48 15 11 9 10 45 11 10 13
Transaction and related costs, net (33) 5 68 - 4 4 4 12 17 7 (6)
Non-service retirement-related costs 33 67 150 13 10 (2) (3) 18 1 (8) (13)
Contract termination costs - IT services - 43 43 - - (8) (4) (12) 3 - -
Income tax on adjustments (10) (48) (116) (31) (17) (7) (22) (77) (21) (3) 1
US Tax Act 95 (6) 89 (35) - 4 (4) (35) - - -
Adjusted $ 165 $ 0.64 $ 231 $ 0.94 $ 745 $ 2.88 $ 158 $ 0.66 $ 186 $ 0.79 $ 184 $ 0.80 $ 300 $ 1.33 $ 828 $ 3.55 $ 50 $ 0.21 $ 36 $ 0.15 $ 105 $ 0.48
Dividends on preferred stock used in adjusted
EPS calculation(2) $ - $ - $ - $ - $ - $ - $ - $ - $ (4) $ 3 $ 4
Weighted average shares for adjusted EPS (2) 261 246 258 240 235 231 227 233 216 216 213
(1) Net Income (Loss) and EPS from continuing operations attributable to Xerox Holdings.
(2) For those periods that exclude the preferred stock dividend the average shares for the calculations of diluted EPS include 7 million shares associated with our Series A convertible
preferred stock, as applicable.
25

—
26
Operating Income / Margin reconciliation –historical
(in millions) Profit Revenue Margin Profit Revenue Margin Profit Revenue Margin Profit Revenue Margin Profit Revenue Margin Profit Revenue Margin Profit Revenue Margin Profit Revenue Margin
(Loss)
Profit Revenue Margin Profit Revenue Margin Profit Revenue Margin
Reported (1) 177$ 2,314$ 7.6% 124$ 2,498$ 5.0% 549$ 9,662$ 5.7% 73$ 2,180$ 3.3% 190$ 2,263$ 8.4% 223$ 2,179$ 10.2% 336$ 2,444$ 13.7% 822$ 9,066$ 9.1% (5)$ 1,860$ (0.3%) 35$ 1,465$ 2.4% 119$ 1,767$ 6.7%
Adjustments:
Restructuring and related costs 29 67 157 112 37 27 53 229 41 3 20
Amortization of intangible assets 12 12 48 15 11 9 10 45 11 10 13
Transaction and related costs, net (33) 5 68 - 4 4 4 12 17 7 (6)
Other expenses, net 57 144 271 39 38 (1) 8 84 23 7 (15)
Adjusted 242$ 2,314$ 10.5% 352$ 2,498$ 14.1% 1,093$ 9,662$ 11.3% 239$ 2,180$ 11.0% 280$ 2,263$ 12.4% 262$ 2,179$ 12.0% 411$ 2,444$ 16.8% 1,192$ 9,066$ 13.1% 87$ 1,860$ 4.7% 62$ 1,465$ 4.2% 131$ 1,767$ 7.4%
(1) Pre-Tax Income (Loss) and revenue from continuing operations.
Q3-20Q4-19
Year Ended
December 31, 2019Q3-19Q3-18 Q4-18 Q2-20Q1-20
Year Ended
December 31, 2018 Q2-19Q1-19

—
27
Free Cash Flow reconciliation – historical
Year Ended
December 31,
2018 Q1-19 Q2-19 Q3-19 Q4-19
Year Ended
December 31,
2019 Q1-20 Q2-20 Q3-20
(in millions, except per share amounts)
Reported (1) $ 1,082 $ 222 $ 276 $ 348 $ 398 $ 1,244 $ 173 $ 34 $ 106
Capital expenditures (90) (15) (16) (17) (17) (65) (23) (19) (18)
Free Cash Flow from Continuing Operations $ 992 $ 207 $ 260 $ 331 $ 381 $ 1,179 $ 150 $ 15 $ 88
__________________________________
(1) Net cash provided by operating activities from continuing operations.

© 2021 Xerox Corporation. All rights reserved. Xerox® is a trademark of Xerox Corporation in the United States and/or other countries.