xerox fourth-quarter 2016 earnings presentation...fourth quarter 2016 earnings presentation jeff...
TRANSCRIPT
Fourth Quarter
2016 Earnings
Presentation
Jeff Jacobson, CEO
Bill Osbourn, CFO
January 31, 2017
1
This presentation contains “forward-looking statements” as defined in the Private Securities Litigation Reform Act of 1995. The words “anticipate,” “believe,” “estimate,” “expect,” “intend,” “will,” “should” and similar expressions, as they relate to us, are intended to identify forward-looking statements. These statements reflect management’s current beliefs, assumptions and expectations and are subject to a number of factors that may cause actual results to differ materially. Such factors include but are not limited to: changes in economic conditions, political conditions, trade protection measures, licensing requirements and tax matters in the United States and in the foreign countries in which we do business; changes in foreign currency exchange rates; our ability to successfully develop new products, technologies and service offerings and to protect our intellectual property rights; the risk that multi-year contracts with governmental entities could be terminated prior to the end of the contract term and that civil or criminal penalties and administrative sanctions could be imposed on us if we fail to comply with the terms of such contracts and applicable law; actions of competitors and our ability to promptly and effectively react to changing technologies and customer expectations; our ability to obtain adequate pricing for our products and services and to maintain and improve cost efficiency of operations, including savings from restructuring actions; the risk that individually identifiable information of customers, clients and employees could be inadvertently disclosed or disclosed as a result of a breach of our security systems; reliance on third parties, including subcontractors, for manufacturing of products and provision of services; our ability to expand equipment placements; interest rates, cost of borrowing and access to credit markets; the risk that our products may not comply with applicable worldwide regulatory requirements, particularly environmental regulations and directives; the outcome of litigation and regulatory proceedings to which we may be a party; the potential that Xerox will not realize all of the expected benefits of the separation of its former business process outsourcing business; and other factors that are set forth in the “Risk Factors” section, the “Legal Proceedings” section, the “Management’s Discussion and Analysis of Financial Condition and Results of Operations” section and other sections of our Quarterly Reports on Form 10-Q for the quarters ended March 31, 2016, June 30, 2016 and September 30, 2016 and our 2015 Annual Report on Form 10-K filed with the Securities and Exchange Commission. Xerox assumes no obligation to update any forward-looking statements as a result of new information or future events or developments, except as required by law.
Forward Looking Statements
2
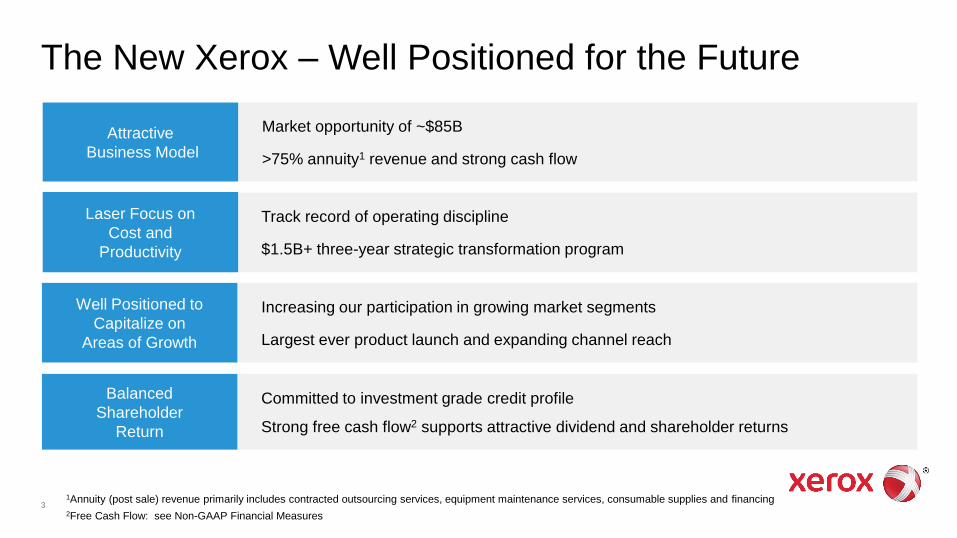
The New Xerox – Well Positioned for the Future
3
Attractive
Business Model
Laser Focus on
Cost and
Productivity
Well Positioned to
Capitalize on
Areas of Growth
Balanced
Shareholder
Return
Market opportunity of ~$85B
>75% annuity1 revenue and strong cash flow
Track record of operating discipline
$1.5B+ three-year strategic transformation program
Increasing our participation in growing market segments
Largest ever product launch and expanding channel reach
Committed to investment grade credit profile
Strong free cash flow2 supports attractive dividend and shareholder returns
1Annuity (post sale) revenue primarily includes contracted outsourcing services, equipment maintenance services, consumable supplies and financing
2Free Cash Flow: see Non-GAAP Financial Measures

2016 Highlights
• Completed separation of Conduent
• Exceeded Year 1 Strategic Transformation goal
• Streamlined operating model
• Continued recognition for innovation and market leadership
4
5
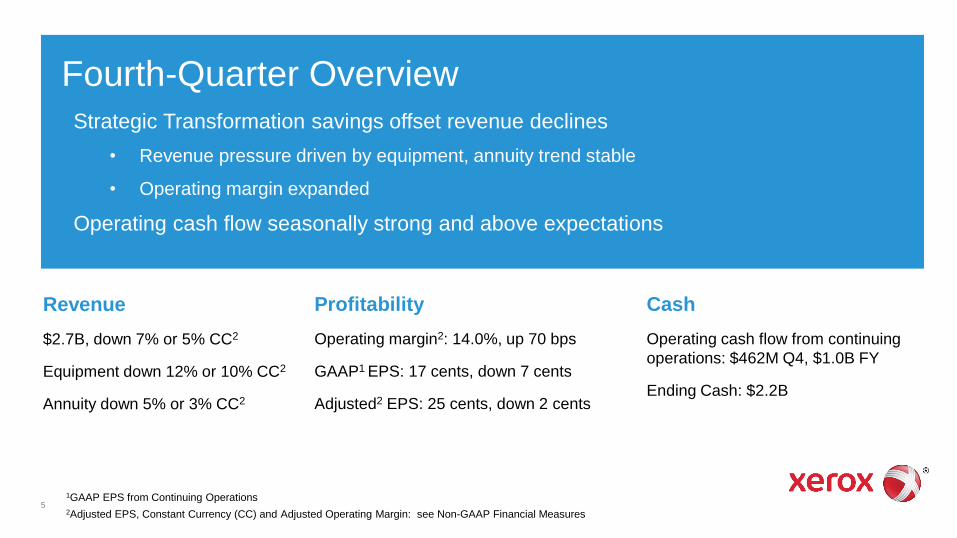
Revenue
$2.7B, down 7% or 5% CC2
Equipment down 12% or 10% CC2
Annuity down 5% or 3% CC2
Profitability
Operating margin2: 14.0%, up 70 bps
GAAP1 EPS: 17 cents, down 7 cents
Adjusted2 EPS: 25 cents, down 2 cents
Cash
Operating cash flow from continuing
operations: $462M Q4, $1.0B FY
Ending Cash: $2.2B
Fourth-Quarter Overview
Strategic Transformation savings offset revenue declines
• Revenue pressure driven by equipment, annuity trend stable
• Operating margin expanded
Operating cash flow seasonally strong and above expectations
1GAAP EPS from Continuing Operations
2Adjusted EPS, Constant Currency (CC) and Adjusted Operating Margin: see Non-GAAP Financial Measures
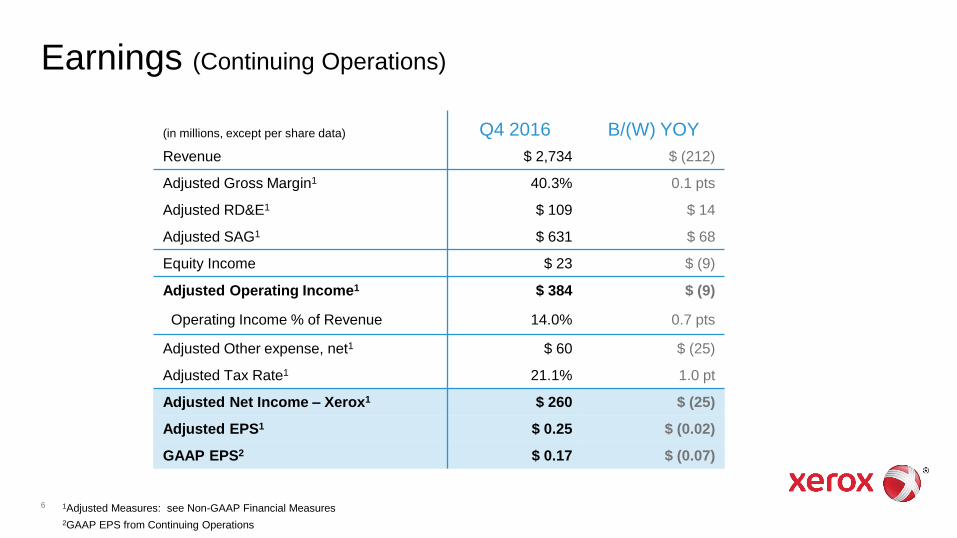
Earnings (Continuing Operations)
6
(in millions, except per share data) Q4 2016 B/(W) YOY
Revenue $ 2,734 $ (212)
Adjusted Gross Margin1 40.3% 0.1 pts
Adjusted RD&E1 $ 109 $ 14
Adjusted SAG1 $ 631 $ 68
Equity Income $ 23 $ (9)
Adjusted Operating Income1 $ 384 $ (9)
Operating Income % of Revenue 14.0% 0.7 pts
Adjusted Other expense, net1 $ 60 $ (25)
Adjusted Tax Rate1 21.1% 1.0 pt
Adjusted Net Income – Xerox1 $ 260 $ (25)
Adjusted EPS1 $ 0.25
$ (0.02)
GAAP EPS2 $ 0.17
$ (0.07)
1Adjusted Measures: see Non-GAAP Financial Measures
2GAAP EPS from Continuing Operations
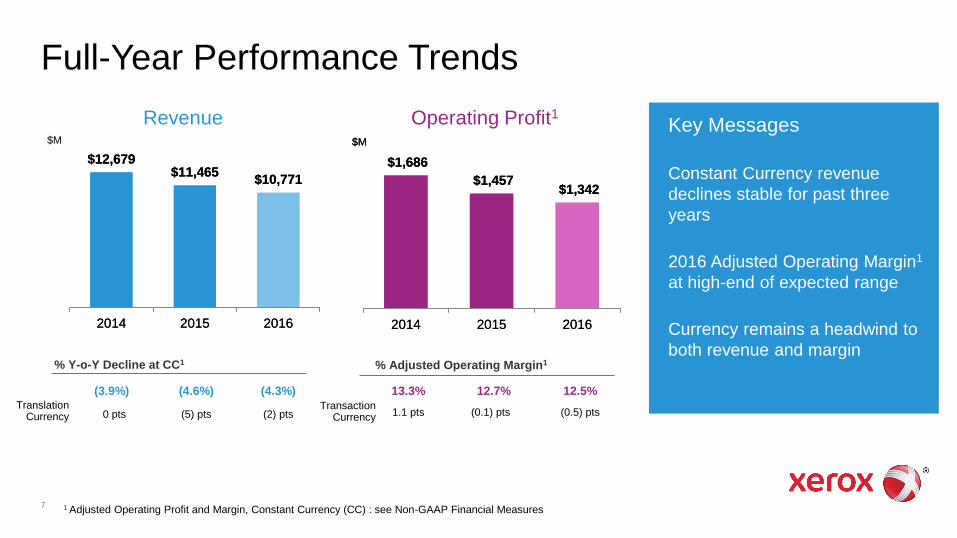
Full-Year Performance Trends
7
$1,686
$1,457 $1,342
2014 2015 2016
13.3% 12.7% 12.5%
Transaction Currency 1.1 pts (0.1) pts (0.5) pts
$12,679 $11,465
$10,771
2014 2015 2016
% Y-o-Y Decline at CC1
(4.3%) (4.6%) (3.9%)
% Adjusted Operating Margin1
Key Messages
Constant Currency revenue
declines stable for past three
years
2016 Adjusted Operating Margin1
at high-end of expected range
Currency remains a headwind to
both revenue and margin
0 pts (5) pts (2) pts
1 Adjusted Operating Profit and Margin, Constant Currency (CC) : see Non-GAAP Financial Measures
$M $M
$1,686
$1,457 $1,342
2014 2015 2016
$12,679 $11,465
$10,771
2014 2015 2016
$M
Translation Currency
Revenue Operating Profit1

Key Performance Metrics
8
Strategic Growth Areas Installs Strategic Transformation
Color B&W
(% change YOY)
Q4 FY Q4 FY
High-End 3% 16% (18)% (13)%
Mid-Range 0% 3% (13)% (16)%
Entry A4 MFDs (8)% (1)% (19)% (12)%
Q4 2016 FY 2016
Document
Outsourcing $0.8B $2.7B
YOY Growth CC1 (18)% (5)%
A4 MFPs
MPS & Workflow Automation
Color Production
2% 38%
2016 Results
YOY growth at
CC1
2016 FY Gross Savings2 $550M
2016 Target $500M
2017 Target $600M
Cumulative thru 2018 Target $1.5B+
1Constant Currency (CC): see Non-GAAP Financial Measures 2Gross savings are the year over year savings, assuming similar operating levels
Signings
30%
17% 20%
20%
13% Delivery
Cost of Production
Sales & Contracting
G&A
Supply Chain &Procurement
Sources of Productivity
2 pts
% of Revenue
in Strategic
Growth Areas
Mix shift in
2016
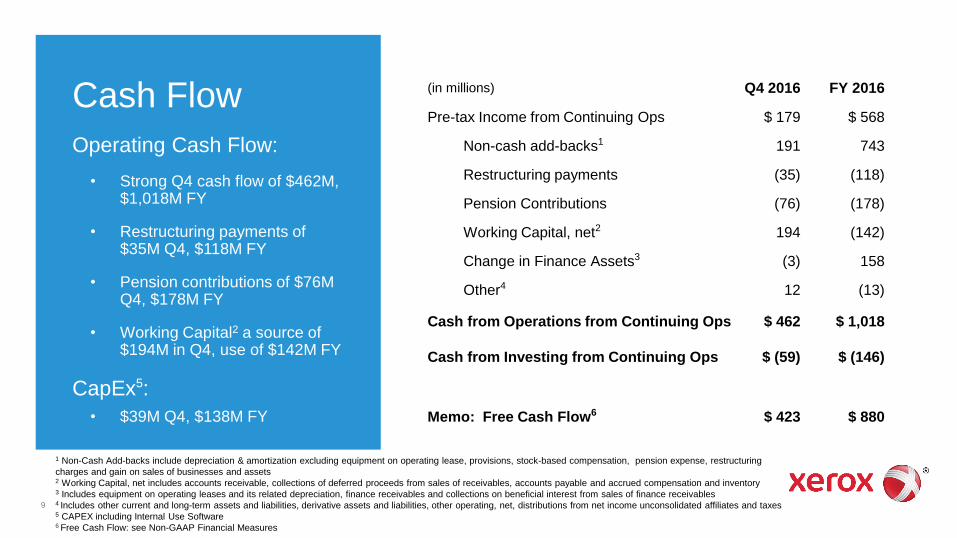
Cash Flow
Operating Cash Flow:
• Strong Q4 cash flow of $462M, $1,018M FY
• Restructuring payments of $35M Q4, $118M FY
• Pension contributions of $76M Q4, $178M FY
• Working Capital2 a source of $194M in Q4, use of $142M FY
CapEx5:
• $39M Q4, $138M FY
9
(in millions) Q4 2016 FY 2016
Pre-tax Income from Continuing Ops $ 179 $ 568
Non-cash add-backs1 191 743
Restructuring payments (35) (118)
Pension Contributions (76) (178)
Working Capital, net2 194 (142)
Change in Finance Assets3 (3) 158
Other4 12 (13)
Cash from Operations from Continuing Ops $ 462 $ 1,018
Cash from Investing from Continuing Ops $ (59) $ (146)
Memo: Free Cash Flow6 $ 423 $ 880
1 Non-Cash Add-backs include depreciation & amortization excluding equipment on operating lease, provisions, stock-based compensation, pension expense, restructuring
charges and gain on sales of businesses and assets 2 Working Capital, net includes accounts receivable, collections of deferred proceeds from sales of receivables, accounts payable and accrued compensation and inventory 3 Includes equipment on operating leases and its related depreciation, finance receivables and collections on beneficial interest from sales of finance receivables 4 Includes other current and long-term assets and liabilities, derivative assets and liabilities, other operating, net, distributions from net income unconsolidated affiliates and taxes 5 CAPEX including Internal Use Software 6 Free Cash Flow: see Non-GAAP Financial Measures

Capital Structure
10
Core debt level managed to maintain investment grade financial profile
~ 70% of Xerox pro forma debt supports finance assets
Year Ended December 31, 2016 Pro forma
(in billions) Fin. Assets Debt* Cash* Debt Cash
Financing $ 4.2 $ 3.7 $ 3.7
Core - 2.6 1.6
Total Xerox $ 4.2 $ 6.3 $ 2.2 $ 5.3 $ 1.4
Customer Financing and Leverage
• Value proposition includes leasing of Xerox equipment
• Maintain 7:1 debt to equity leverage ratio on these finance assets
Pro Forma Details
• Year end 2016 $2.6 billion core debt reflects repayment of $1 billion term loan upon separation. Pro forma core debt of $1.6
billion reflects repayment of $1B for senior notes that mature in Q1’17.
• Year end 2016 cash includes ~$1.8B cash transfer from Conduent less $1B for repayment of term loan. Pro forma cash reflects
$1 billion Q1’17 senior notes debt repayment and receipt in Jan’17 of $0.2B of separation-related cash adjustment.
*Excludes cash and debt attributable to Conduent / discontinued operations
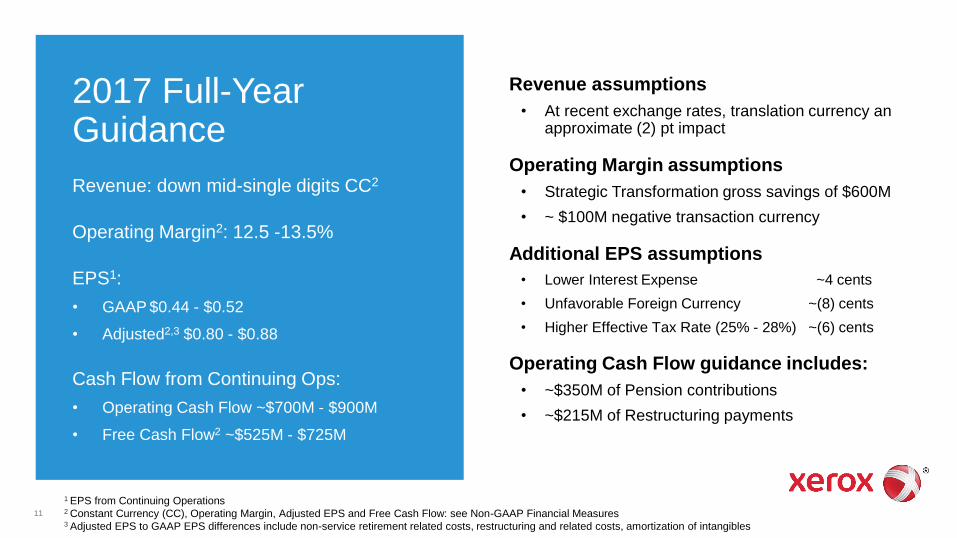
2017 Full-Year Guidance
Revenue: down mid-single digits CC2
Operating Margin2: 12.5 -13.5%
EPS1:
• GAAP $0.44 - $0.52
• Adjusted2,3 $0.80 - $0.88
Cash Flow from Continuing Ops:
• Operating Cash Flow ~$700M - $900M
• Free Cash Flow2 ~$525M - $725M
Revenue assumptions
• At recent exchange rates, translation currency an approximate (2) pt impact
Operating Margin assumptions
• Strategic Transformation gross savings of $600M
• ~ $100M negative transaction currency
Additional EPS assumptions
• Lower Interest Expense ~4 cents
• Unfavorable Foreign Currency ~(8) cents
• Higher Effective Tax Rate (25% - 28%) ~(6) cents
Operating Cash Flow guidance includes:
• ~$350M of Pension contributions
• ~$215M of Restructuring payments
1 EPS from Continuing Operations 2 Constant Currency (CC), Operating Margin, Adjusted EPS and Free Cash Flow: see Non-GAAP Financial Measures 3 Adjusted EPS to GAAP EPS differences include non-service retirement related costs, restructuring and related costs, amortization of intangibles
11
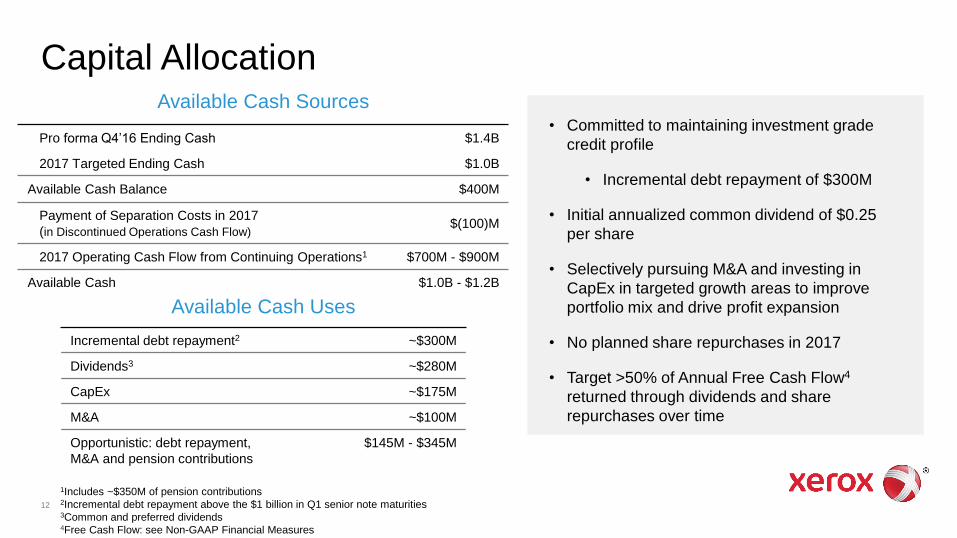
Capital Allocation
12
• Committed to maintaining investment grade
credit profile
• Incremental debt repayment of $300M
• Initial annualized common dividend of $0.25
per share
• Selectively pursuing M&A and investing in
CapEx in targeted growth areas to improve
portfolio mix and drive profit expansion
• No planned share repurchases in 2017
• Target >50% of Annual Free Cash Flow4
returned through dividends and share
repurchases over time
Pro forma Q4’16 Ending Cash $1.4B
2017 Targeted Ending Cash $1.0B
Available Cash Balance $400M
Payment of Separation Costs in 2017
(in Discontinued Operations Cash Flow) $(100)M
2017 Operating Cash Flow from Continuing Operations1 $700M - $900M
Available Cash $1.0B - $1.2B
Incremental debt repayment2 ~$300M
Dividends3 ~$280M
CapEx ~$175M
M&A ~$100M
Opportunistic: debt repayment,
M&A and pension contributions
$145M - $345M
1Includes ~$350M of pension contributions 2Incremental debt repayment above the $1 billion in Q1 senior note maturities 3Common and preferred dividends 4Free Cash Flow: see Non-GAAP Financial Measures
Available Cash Sources
Available Cash Uses
In Summary 1 A new Xerox Streamlining and re-focusing our operations to deliver innovative
products and solutions to our customers and strong returns for our
shareholders
2 2016 results Laid foundation for future with launch of Strategic Transformation
program and Strategic Growth area focus
3 2017 commitments Focused on executing our strategy, achieving our financial
objectives and building on our market leadership
13

Appendix
14
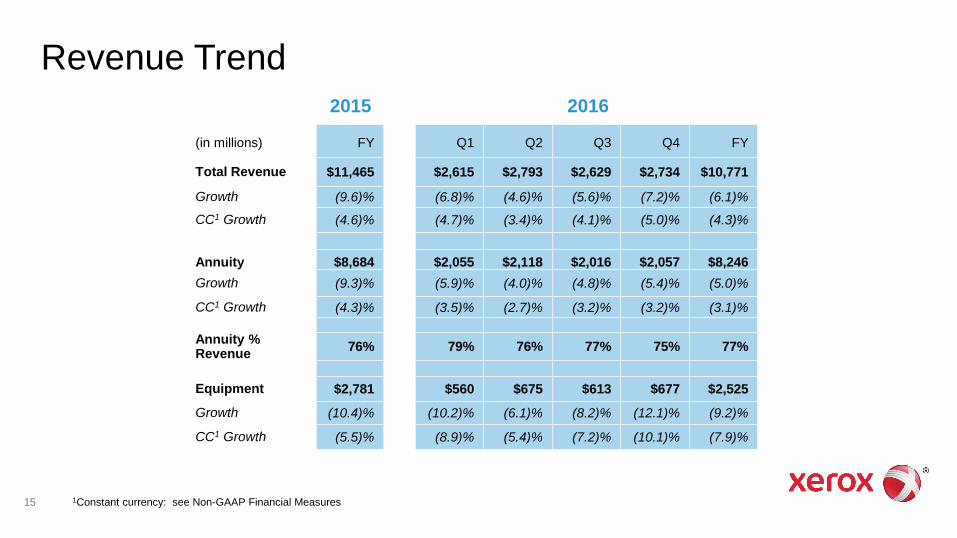
Revenue Trend
15
(in millions) FY Q1 Q2 Q3 Q4 FY
Total Revenue $11,465 $2,615 $2,793 $2,629 $2,734 $10,771
Growth (9.6)% (6.8)% (4.6)% (5.6)% (7.2)% (6.1)%
CC1 Growth (4.6)% (4.7)% (3.4)% (4.1)% (5.0)% (4.3)%
Annuity $8,684 $2,055 $2,118 $2,016 $2,057 $8,246
Growth (9.3)% (5.9)% (4.0)% (4.8)% (5.4)% (5.0)%
CC1 Growth (4.3)% (3.5)% (2.7)% (3.2)% (3.2)% (3.1)%
Annuity % Revenue
76% 79% 76% 77% 75% 77%
Equipment $2,781 $560 $675 $613 $677 $2,525
Growth (10.4)% (10.2)% (6.1)% (8.2)% (12.1)% (9.2)%
CC1 Growth (5.5)% (8.9)% (5.4)% (7.2)% (10.1)% (7.9)%
2015
1Constant currency: see Non-GAAP Financial Measures
2016
Non-GAAP Financial Measures
16
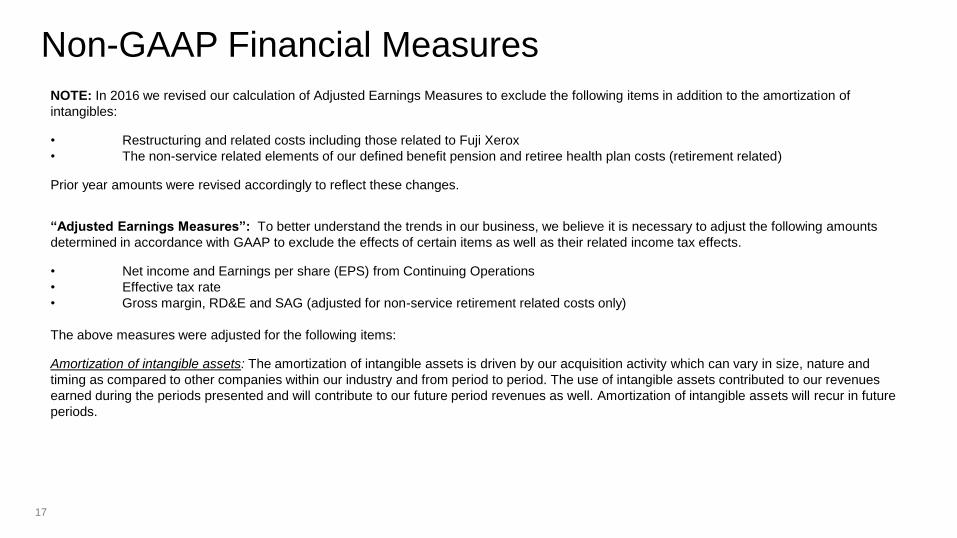
NOTE: In 2016 we revised our calculation of Adjusted Earnings Measures to exclude the following items in addition to the amortization of
intangibles:
• Restructuring and related costs including those related to Fuji Xerox
• The non-service related elements of our defined benefit pension and retiree health plan costs (retirement related)
Prior year amounts were revised accordingly to reflect these changes.
“Adjusted Earnings Measures”: To better understand the trends in our business, we believe it is necessary to adjust the following amounts
determined in accordance with GAAP to exclude the effects of certain items as well as their related income tax effects.
• Net income and Earnings per share (EPS) from Continuing Operations
• Effective tax rate
• Gross margin, RD&E and SAG (adjusted for non-service retirement related costs only)
The above measures were adjusted for the following items:
Amortization of intangible assets: The amortization of intangible assets is driven by our acquisition activity which can vary in size, nature and
timing as compared to other companies within our industry and from period to period. The use of intangible assets contributed to our revenues
earned during the periods presented and will contribute to our future period revenues as well. Amortization of intangible assets will recur in future
periods.
17
Non-GAAP Financial Measures
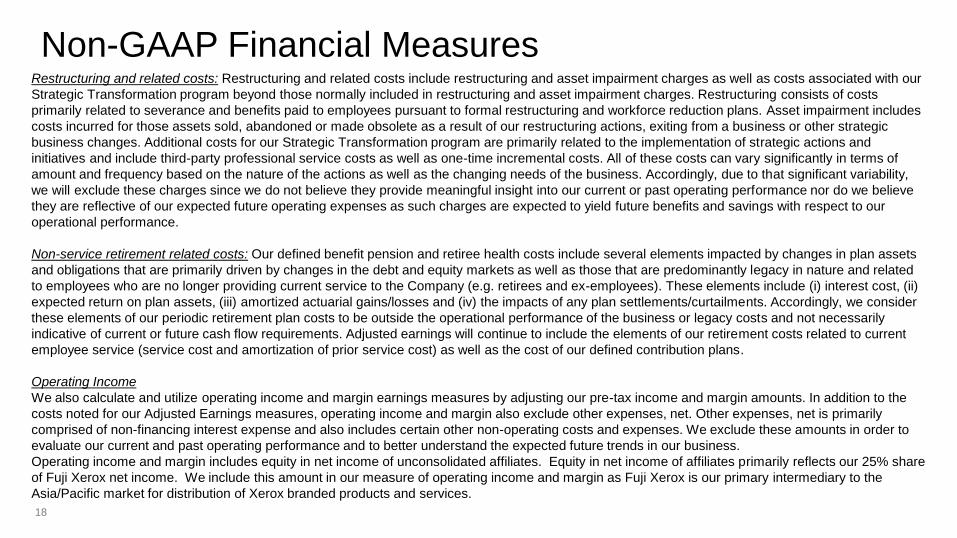
Restructuring and related costs: Restructuring and related costs include restructuring and asset impairment charges as well as costs associated with our
Strategic Transformation program beyond those normally included in restructuring and asset impairment charges. Restructuring consists of costs
primarily related to severance and benefits paid to employees pursuant to formal restructuring and workforce reduction plans. Asset impairment includes
costs incurred for those assets sold, abandoned or made obsolete as a result of our restructuring actions, exiting from a business or other strategic
business changes. Additional costs for our Strategic Transformation program are primarily related to the implementation of strategic actions and
initiatives and include third-party professional service costs as well as one-time incremental costs. All of these costs can vary significantly in terms of
amount and frequency based on the nature of the actions as well as the changing needs of the business. Accordingly, due to that significant variability,
we will exclude these charges since we do not believe they provide meaningful insight into our current or past operating performance nor do we believe
they are reflective of our expected future operating expenses as such charges are expected to yield future benefits and savings with respect to our
operational performance.
Non-service retirement related costs: Our defined benefit pension and retiree health costs include several elements impacted by changes in plan assets
and obligations that are primarily driven by changes in the debt and equity markets as well as those that are predominantly legacy in nature and related
to employees who are no longer providing current service to the Company (e.g. retirees and ex-employees). These elements include (i) interest cost, (ii)
expected return on plan assets, (iii) amortized actuarial gains/losses and (iv) the impacts of any plan settlements/curtailments. Accordingly, we consider
these elements of our periodic retirement plan costs to be outside the operational performance of the business or legacy costs and not necessarily
indicative of current or future cash flow requirements. Adjusted earnings will continue to include the elements of our retirement costs related to current
employee service (service cost and amortization of prior service cost) as well as the cost of our defined contribution plans.
Operating Income
We also calculate and utilize operating income and margin earnings measures by adjusting our pre-tax income and margin amounts. In addition to the
costs noted for our Adjusted Earnings measures, operating income and margin also exclude other expenses, net. Other expenses, net is primarily
comprised of non-financing interest expense and also includes certain other non-operating costs and expenses. We exclude these amounts in order to
evaluate our current and past operating performance and to better understand the expected future trends in our business.
Operating income and margin includes equity in net income of unconsolidated affiliates. Equity in net income of affiliates primarily reflects our 25% share
of Fuji Xerox net income. We include this amount in our measure of operating income and margin as Fuji Xerox is our primary intermediary to the
Asia/Pacific market for distribution of Xerox branded products and services.
18
Non-GAAP Financial Measures
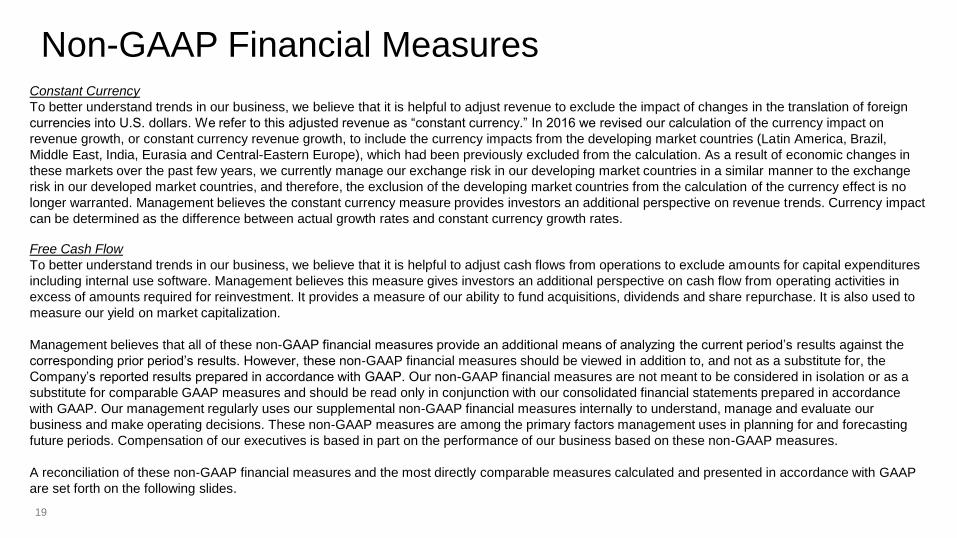
Constant Currency
To better understand trends in our business, we believe that it is helpful to adjust revenue to exclude the impact of changes in the translation of foreign
currencies into U.S. dollars. We refer to this adjusted revenue as “constant currency.” In 2016 we revised our calculation of the currency impact on
revenue growth, or constant currency revenue growth, to include the currency impacts from the developing market countries (Latin America, Brazil,
Middle East, India, Eurasia and Central-Eastern Europe), which had been previously excluded from the calculation. As a result of economic changes in
these markets over the past few years, we currently manage our exchange risk in our developing market countries in a similar manner to the exchange
risk in our developed market countries, and therefore, the exclusion of the developing market countries from the calculation of the currency effect is no
longer warranted. Management believes the constant currency measure provides investors an additional perspective on revenue trends. Currency impact
can be determined as the difference between actual growth rates and constant currency growth rates.
Free Cash Flow
To better understand trends in our business, we believe that it is helpful to adjust cash flows from operations to exclude amounts for capital expenditures
including internal use software. Management believes this measure gives investors an additional perspective on cash flow from operating activities in
excess of amounts required for reinvestment. It provides a measure of our ability to fund acquisitions, dividends and share repurchase. It is also used to
measure our yield on market capitalization.
Management believes that all of these non-GAAP financial measures provide an additional means of analyzing the current period’s results against the
corresponding prior period’s results. However, these non-GAAP financial measures should be viewed in addition to, and not as a substitute for, the
Company’s reported results prepared in accordance with GAAP. Our non-GAAP financial measures are not meant to be considered in isolation or as a
substitute for comparable GAAP measures and should be read only in conjunction with our consolidated financial statements prepared in accordance
with GAAP. Our management regularly uses our supplemental non-GAAP financial measures internally to understand, manage and evaluate our
business and make operating decisions. These non-GAAP measures are among the primary factors management uses in planning for and forecasting
future periods. Compensation of our executives is based in part on the performance of our business based on these non-GAAP measures.
A reconciliation of these non-GAAP financial measures and the most directly comparable measures calculated and presented in accordance with GAAP
are set forth on the following slides.
19
Non-GAAP Financial Measures

20
Q4/FY GAAP EPS to Adjusted EPS from Continuing Operations
(in millions, except per share amounts)
Net
Income
Diluted
EPS
Net
Income
Diluted
EPS
Net
Income
Diluted
EPS
Net
Income
Diluted
EPS
As Reported (1) $ 181 $ 0.17 $ 256 $ 0.24 $ 616 $ 0.58 $ 848 $ 0.77
Amortization of intangible assets 14 14 58 60
Restructuring and related costs - Xerox 92 (4) 264 27
Non-service retirement related costs 19 34 131 116
Income tax on adjustments (2) (46) (15) (151) (77)
Restructuring charges - Fuji Xerox - - 3 4
Adjusted 260$ $ 0.25 285$ $ 0.27 921$ $ 0.88 978$ $ 0.89
Weighted average shares - adjusted EPS (3) 1,055 1,046 1,024 1,076
Fully diluted shares at end of period (4) 1,055
(1) Net Income and EPS from continuing operations attributable to Xerox.
Three Months Ended
December 31, 2016
Three Months Ended
December 31, 2015
Year Ended
December 31, 2016
Year Ended
December 31, 2015
(2) Refer to Continuing Operations Effective Tax Rate reconciliation.
(3) Average shares for the quarterly calculations of adjusted EPS include 27 million shares associated with our Series A convertible preferred stock and therefore the related quarterly
dividend of $6 million was excluded. Average shares for the yearly calculations of adjusted EPS exclude 27 million shares associated with our Series A convertible preferred stock and
therefore the related annual dividend of $24 million was included.
(4) Represents common shares outstanding at December 31, 2016 as well as shares associated with our Series B convertible preferred stock plus dilutive potential common shares as
used for the calculation of diluted earnings per share for the fourth quarter 2016.
21
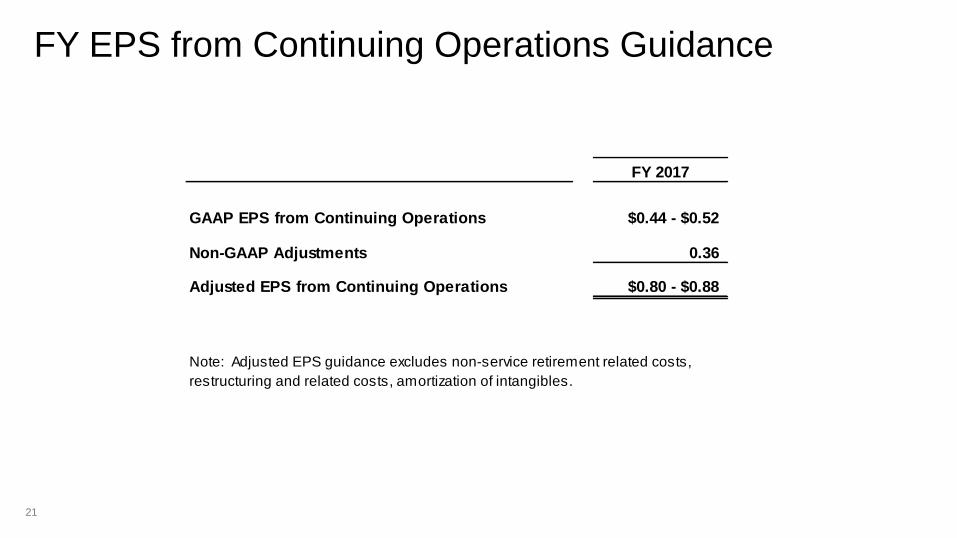
FY EPS from Continuing Operations Guidance
FY 2017
GAAP EPS from Continuing Operations $0.44 - $0.52
Non-GAAP Adjustments 0.36
Adjusted EPS from Continuing Operations $0.80 - $0.88
Note: Adjusted EPS guidance excludes non-service retirement related costs,
restructuring and related costs, amortization of intangibles.
22
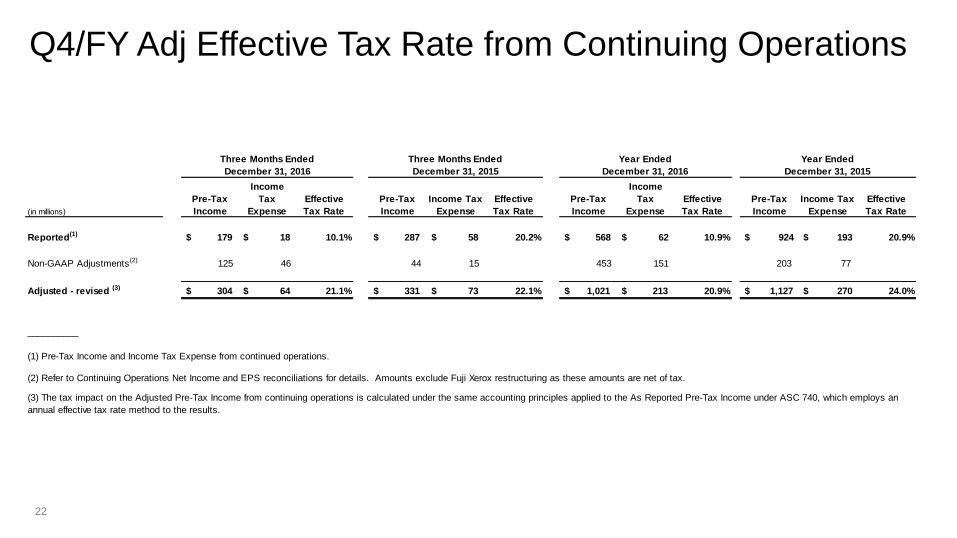
Q4/FY Adj Effective Tax Rate from Continuing Operations
(in millions)
Pre-Tax
Income
Income
Tax
Expense
Effective
Tax Rate
Pre-Tax
Income
Income Tax
Expense
Effective
Tax Rate
Pre-Tax
Income
Income
Tax
Expense
Effective
Tax Rate
Pre-Tax
Income
Income Tax
Expense
Effective
Tax Rate
Reported(1) $ 179 $ 18 10.1% $ 287 $ 58 20.2% $ 568 $ 62 10.9% $ 924 $ 193 20.9%
Non-GAAP Adjustments(2) 125 46 44 15 453 151 203 77
Adjusted - revised (3) $ 304 $ 64 21.1% $ 331 $ 73 22.1% $ 1,021 $ 213 20.9% $ 1,127 $ 270 24.0%
__________
(1) Pre-Tax Income and Income Tax Expense from continued operations.
(2) Refer to Continuing Operations Net Income and EPS reconciliations for details. Amounts exclude Fuji Xerox restructuring as these amounts are net of tax.
(3) The tax impact on the Adjusted Pre‐Tax Income from continuing operations is calculated under the same accounting principles applied to the As Reported Pre-Tax Income under ASC 740, which employs an
annual effective tax rate method to the results.
Three Months Ended
December 31, 2016
Three Months Ended
December 31, 2015
Year Ended
December 31, 2016
Year Ended
December 31, 2015
(1) Profit and revenue from continuing operations.
23
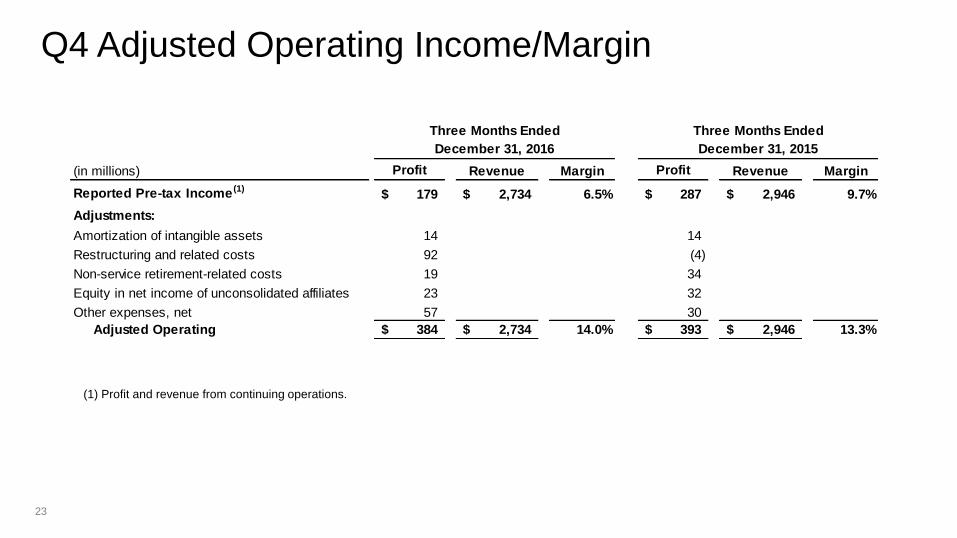
Q4 Adjusted Operating Income/Margin
(in millions) Profit Revenue Margin Profit Revenue Margin
Reported Pre-tax Income (1)179$ 2,734$ 6.5% 287$ 2,946$ 9.7%
Adjustments:
Amortization of intangible assets 14 14
Restructuring and related costs 92 (4)
Non-service retirement-related costs 19 34
Equity in net income of unconsolidated affiliates 23 32
Other expenses, net 57 30
Adjusted Operating 384$ 2,734$ 14.0% 393$ 2,946$ 13.3%
Three Months Ended Three Months Ended
December 31, 2016 December 31, 2015

(1) Profit and revenue from continuing operations.
24
FY Adjusted Operating Income/Margin
(in millions) Profit Revenue Margin Profit Revenue Margin
Reported Pre-tax Income (1)568$ 10,771$ 5.3% 924$ 11,465$ 8.1%
Adjustments:
Amortization of intangible assets 58 60
Restructuring and related costs 264 27
Non-service retirement-related costs 131 116
Equity in net income of unconsolidated affiliates 121 135
Other expenses, net 200 195
Adjusted Operating 1,342$ 10,771$ 12.5% 1,457$ 11,465$ 12.7%
December 31, 2016 December 31, 2015
Year Ended Year Ended
25
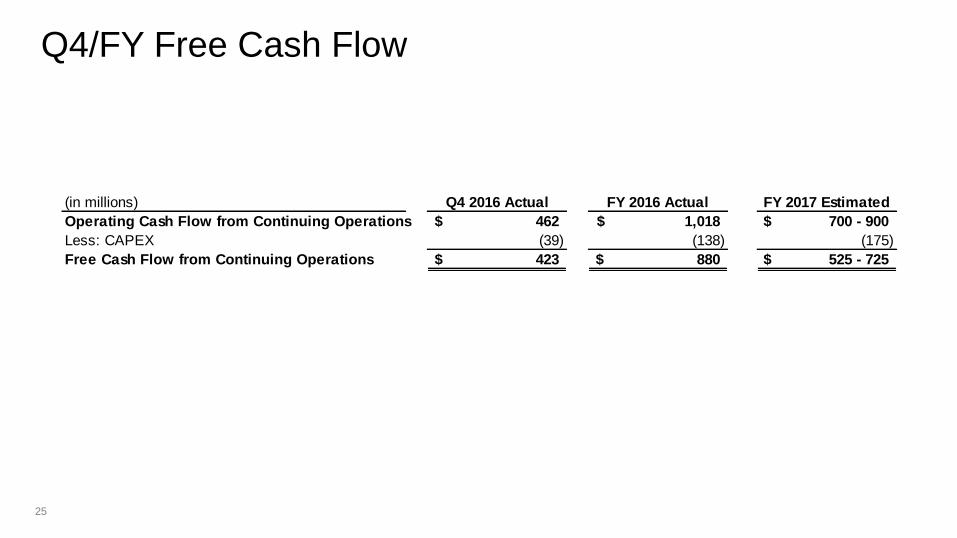
Q4/FY Free Cash Flow
(in millions) Q4 2016 Actual FY 2016 Actual FY 2017 Estimated
Operating Cash Flow from Continuing Operations 462$ 1,018$ $ 700 - 900
Less: CAPEX (39) (138) (175)
Free Cash Flow from Continuing Operations 423$ 880$ $ 525 - 725
26
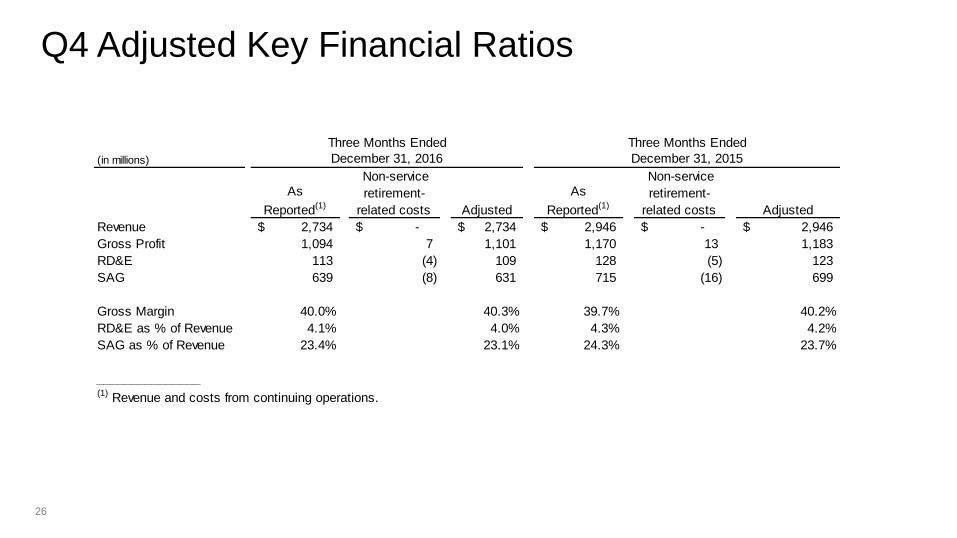
Q4 Adjusted Key Financial Ratios
(in millions)
As
Reported(1)
Non-service
retirement-
related costs Adjusted
As
Reported(1)
Non-service
retirement-
related costs Adjusted
Revenue 2,734$ -$ 2,734$ 2,946$ -$ 2,946$
Gross Profit 1,094 7 1,101 1,170 13 1,183
RD&E 113 (4) 109 128 (5) 123
SAG 639 (8) 631 715 (16) 699
Gross Margin 40.0% 40.3% 39.7% 40.2%
RD&E as % of Revenue 4.1% 4.0% 4.3% 4.2%
SAG as % of Revenue 23.4% 23.1% 24.3% 23.7%
_______________
Three Months Ended
December 31, 2016
Three Months Ended
December 31, 2015
(1) Revenue and costs from continuing operations.

27
Q4 Adjusted Other, Net
Three Months Ended Three Months Ended
(in millions) December 31, 2016 December 31, 2015
Other expenses, net - Reported 57$ 30$
Adjustment:
Net income attributable to noncontrolling interests 3 5
Other expenses, net - Adjusted 60$ 35$
© 2017 Xerox Corporation. All rights reserved. Xerox® and Xerox and Design® are trademarks of Xerox Corporation in the United States and/or other countries. 12/16 MPSPA-18EB