early vision and visual system development · 2011-01-13 · anatomy where are the visual system...
TRANSCRIPT

Early Vision andVisual System Development
Dr. James A. [email protected]
http://homepages.inf.ed.ac.uk/jbednar
CNV Spring 2011: Vision background 1

Studying the visual system (1)
The visual system can be (and is) studied using many
different techniques. In this course we will consider:
Psychophysics What is the level of human visual
performance under various different conditions?
Anatomy Where are the visual system parts located, and
what do they look like?
Gross anatomy What do the visual system organs
and tissues look like, and how are they connected?
Histology What cellular and subcellular structures
can be seen under a microscope?CNV Spring 2011: Vision background 2
Studying the visual system (2)
Physiology What is the behavior of the component parts
of the visual system?
Electrophysiology What is the electrical behavior of
neurons, measured with an electrode?
Imaging What is the behavior of a large area of the
nervous system?
Genetics Which genes control visual system
development and function, and what do they do?
CNV Spring 2011: Vision background 3
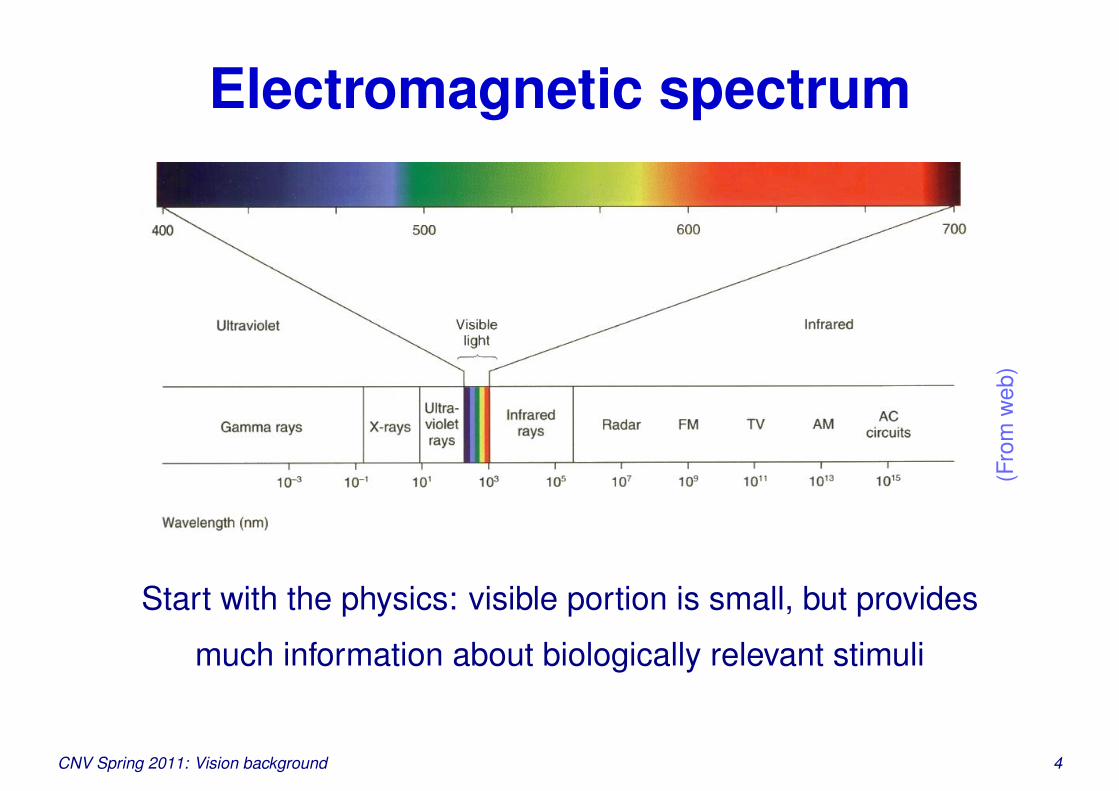
Electromagnetic spectrum
(Fro
mw
eb)
Start with the physics: visible portion is small, but provides
much information about biologically relevant stimuli
CNV Spring 2011: Vision background 4

Cone spectral sensitivities
(Dow
ling,
1987
)
Somehow we make do with sampling the visible range of
wavelengths at only three points (3 cone types)CNV Spring 2011: Vision background 5

Early visual pathways
Eye LGN V1
c ©19
94L.
Kib
iuk
Signals travel from retina, to LGN,
then to primary visual cortexCNV Spring 2011: Vision background 6
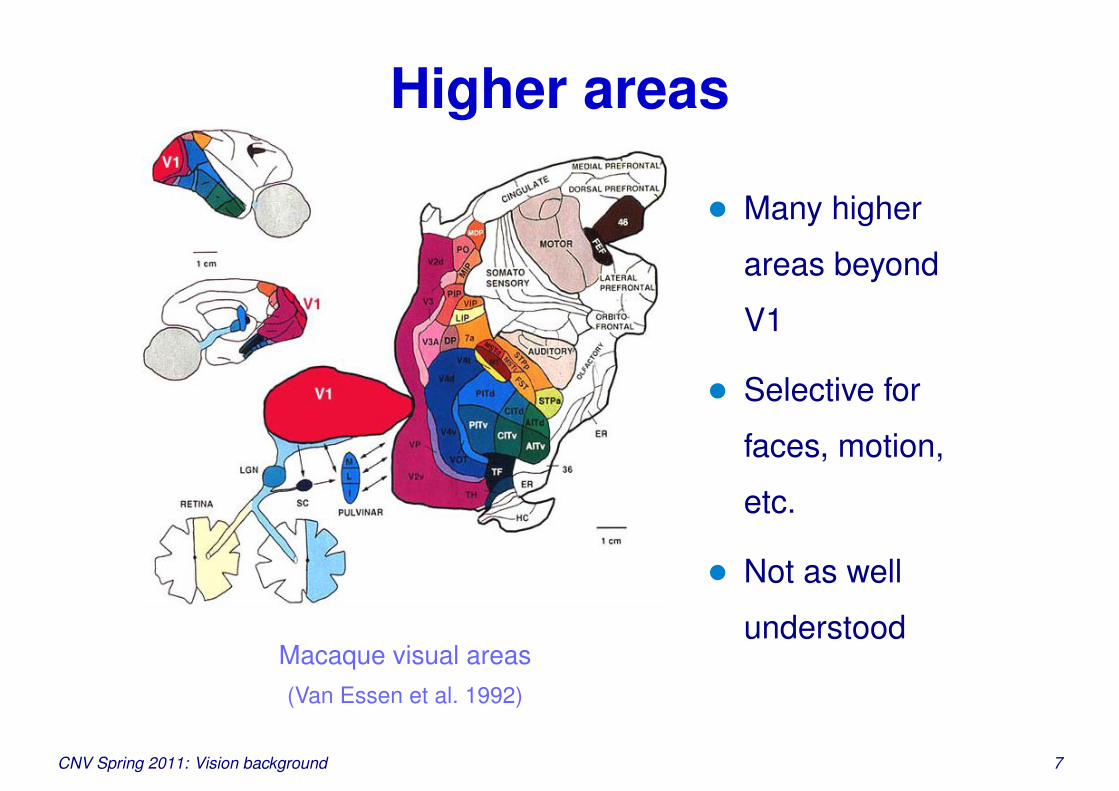
Higher areas
Macaque visual areas(Van Essen et al. 1992)
• Many higher
areas beyond
V1
• Selective for
faces, motion,
etc.
• Not as well
understood
CNV Spring 2011: Vision background 7
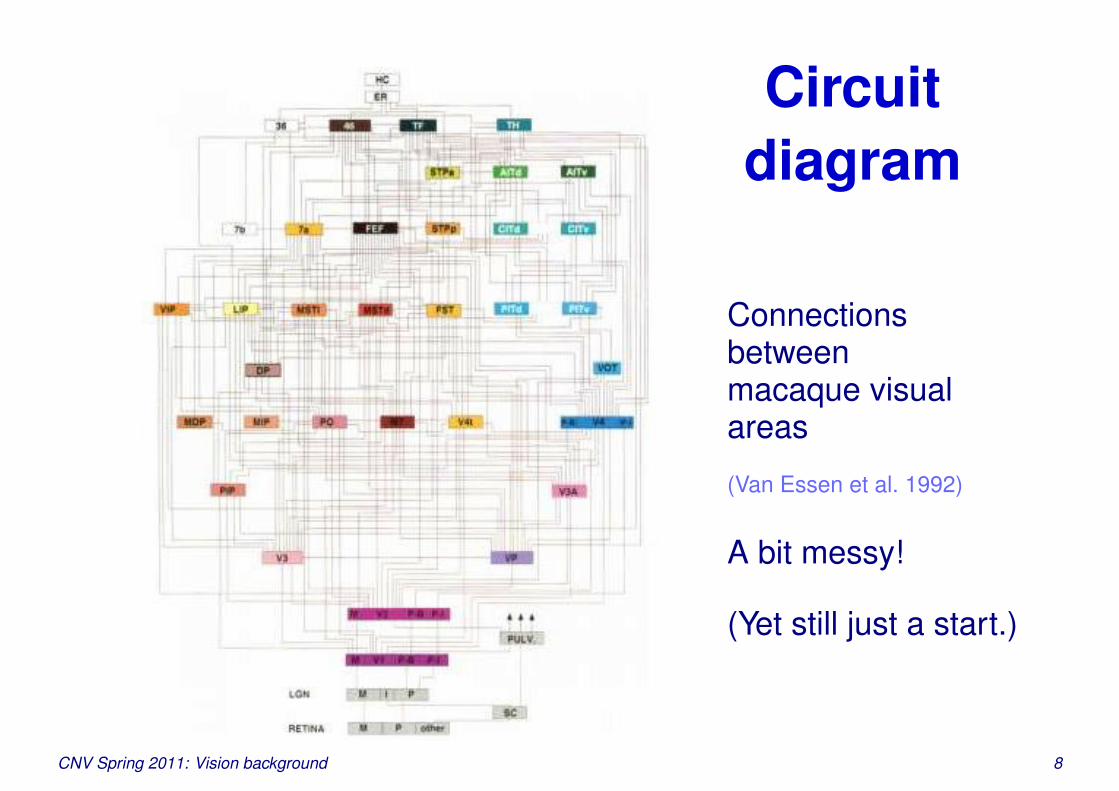
Circuitdiagram
Connectionsbetweenmacaque visualareas
(Van Essen et al. 1992)
A bit messy!
(Yet still just a start.)
CNV Spring 2011: Vision background 8
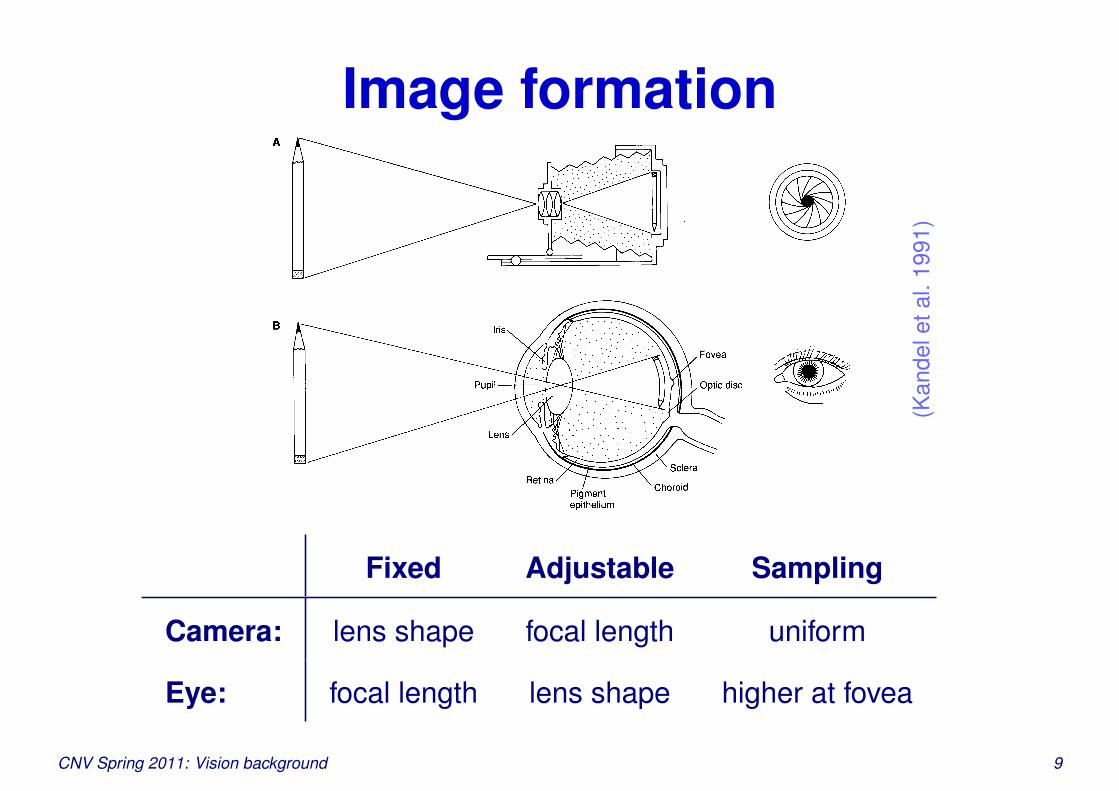
Image formation
(Kan
dele
tal.
1991
)
Fixed Adjustable Sampling
Camera: lens shape focal length uniform
Eye: focal length lens shape higher at fovea
CNV Spring 2011: Vision background 9
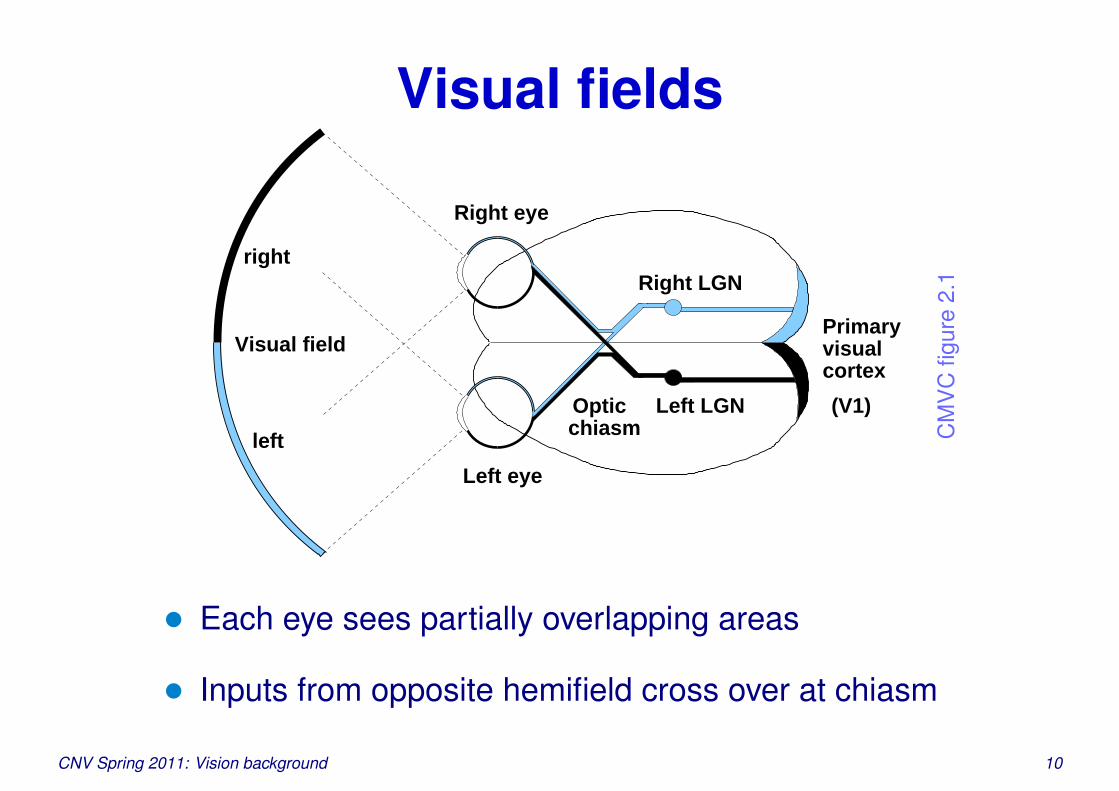
Visual fields
cortexvisualPrimary
chiasmOptic
Right eye
Left eye
Visual field
left
rightRight LGN
Left LGN (V1)
CM
VC
figur
e2.
1
• Each eye sees partially overlapping areas
• Inputs from opposite hemifield cross over at chiasm
CNV Spring 2011: Vision background 10
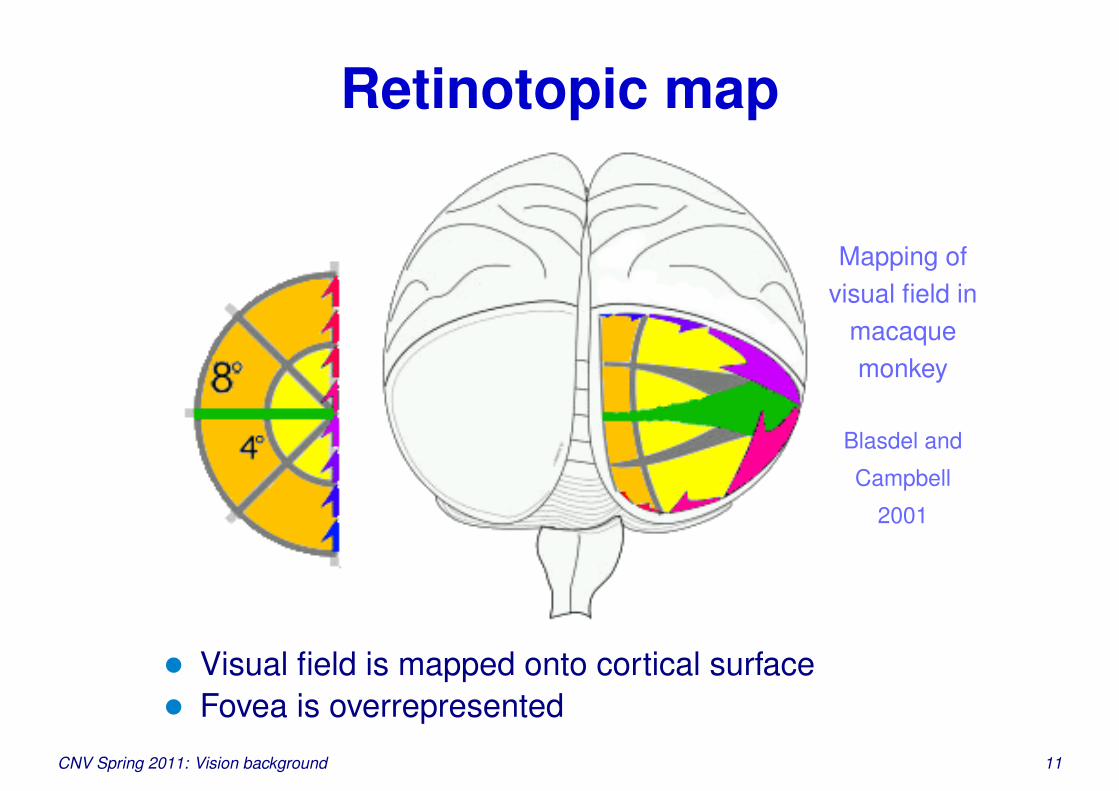
Retinotopic map
Mapping ofvisual field in
macaquemonkey
Blasdel and
Campbell
2001
• Visual field is mapped onto cortical surface• Fovea is overrepresented
CNV Spring 2011: Vision background 11
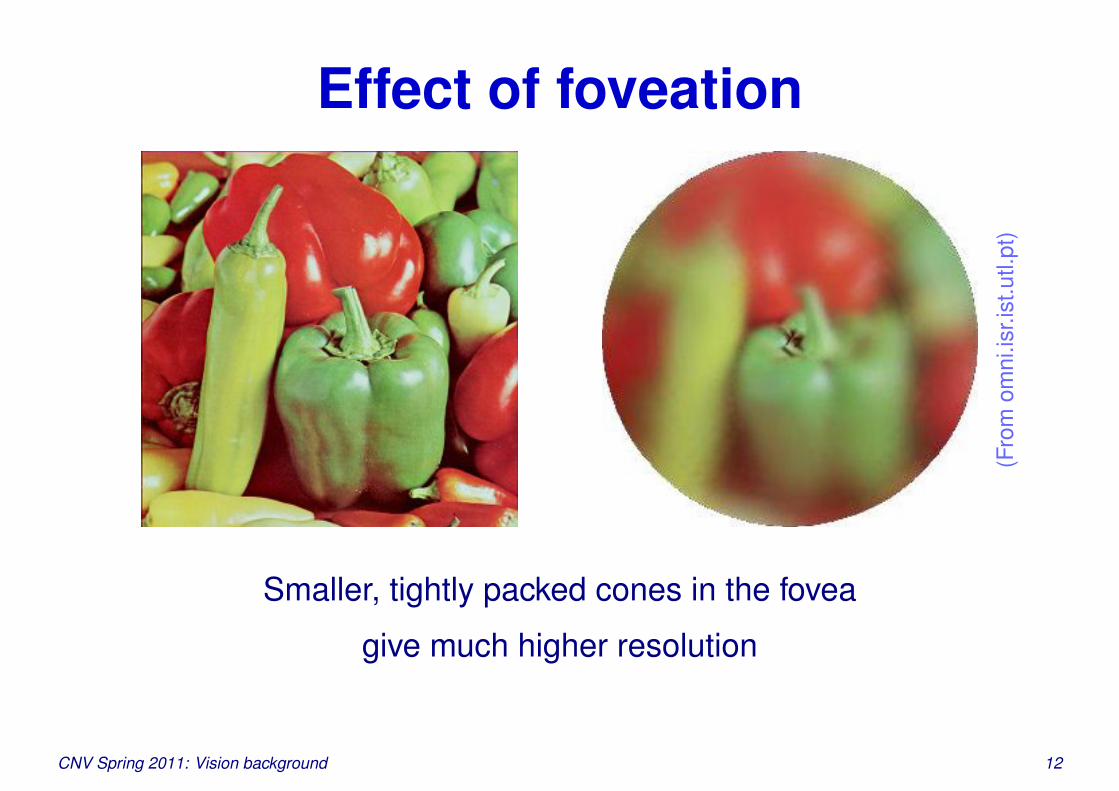
Effect of foveation
(Fro
mom
ni.is
r.ist
.utl.
pt)
Smaller, tightly packed cones in the fovea
give much higher resolution
CNV Spring 2011: Vision background 12

Retinal surface
Fovea (center ;) Periphery
(Ahn
elt&
Kol
b20
00);
nosc
ale
inor
igin
al
• Fovea: densely packed L,M cones (no rods)• No S cones in central fovea; sparse elsewhere• Cones are larger in periphery (∗: S-cones)• Cone spacing also increases, with gaps filled by rods
CNV Spring 2011: Vision background 13
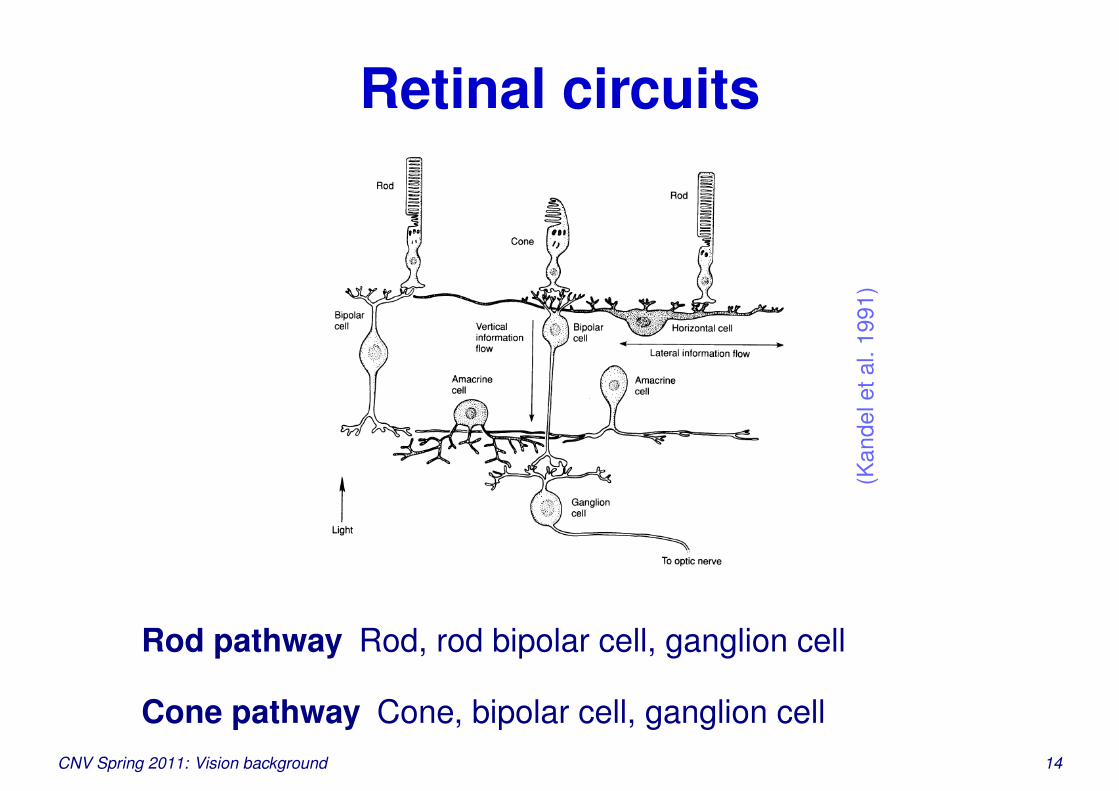
Retinal circuits
(Kan
dele
tal.
1991
)
Rod pathway Rod, rod bipolar cell, ganglion cell
Cone pathway Cone, bipolar cell, ganglion cellCNV Spring 2011: Vision background 14
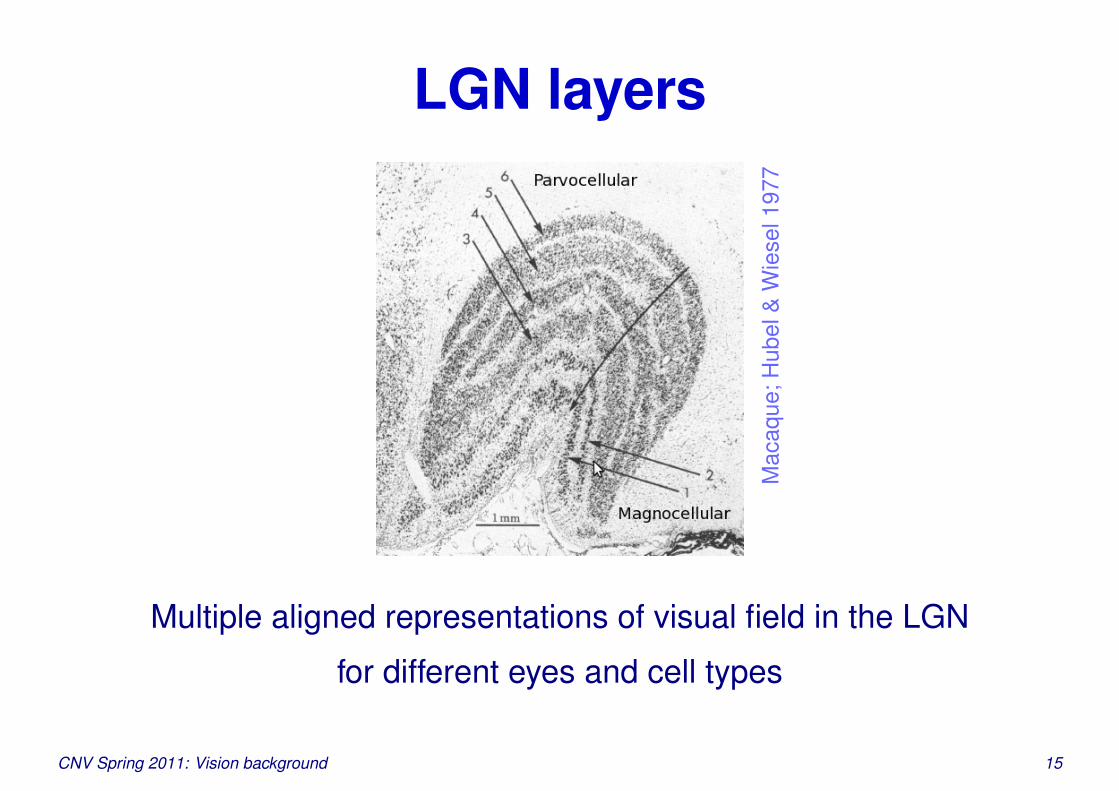
LGN layers
Mac
aque
;Hub
el&
Wie
sel1
977
Multiple aligned representations of visual field in the LGN
for different eyes and cell types
CNV Spring 2011: Vision background 15

V1 layers
(Fro
mw
ebvi
sion
.um
h.es
)
Multiple layers of cells in V1
Brodmann numberingCNV Spring 2011: Vision background 16
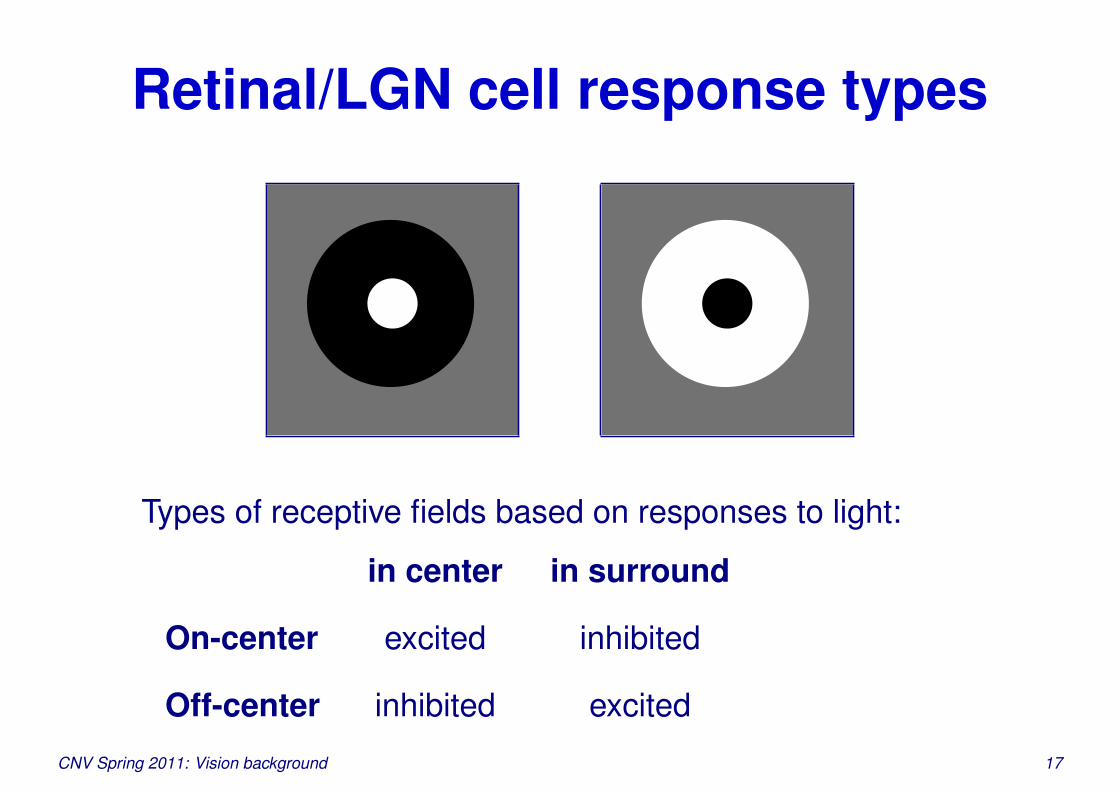
Retinal/LGN cell response types
Types of receptive fields based on responses to light:
in center in surround
On-center excited inhibited
Off-center inhibited excited
CNV Spring 2011: Vision background 17

Color-opponent retinal/LGN cells
(Fro
mw
ebex
hibi
ts.o
rg)
Red/Green cells: (+R,-G), (-R,+G), (+G,-R), (-G,+R)
Blue/Yellow cells: (+B,-Y); others?
Error: light arrows in the figure are backwards!
Organization generally consistent with random wiringCNV Spring 2011: Vision background 18

V1 simple cell responses
2-lobe simple
cell
3-lobe simple
cell
Starting in V1, only oriented patterns will cause any
significant response
Simple cells: pattern preferences can be plotted as above
CNV Spring 2011: Vision background 19
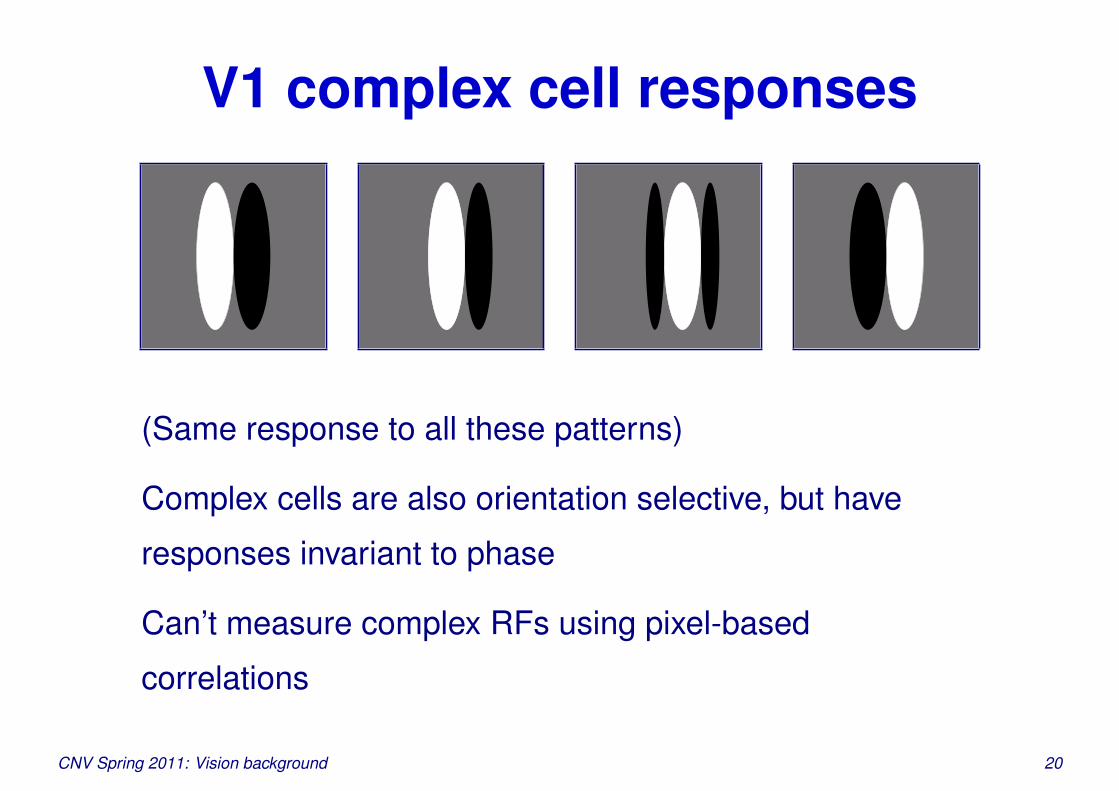
V1 complex cell responses
(Same response to all these patterns)
Complex cells are also orientation selective, but have
responses invariant to phase
Can’t measure complex RFs using pixel-based
correlations
CNV Spring 2011: Vision background 20
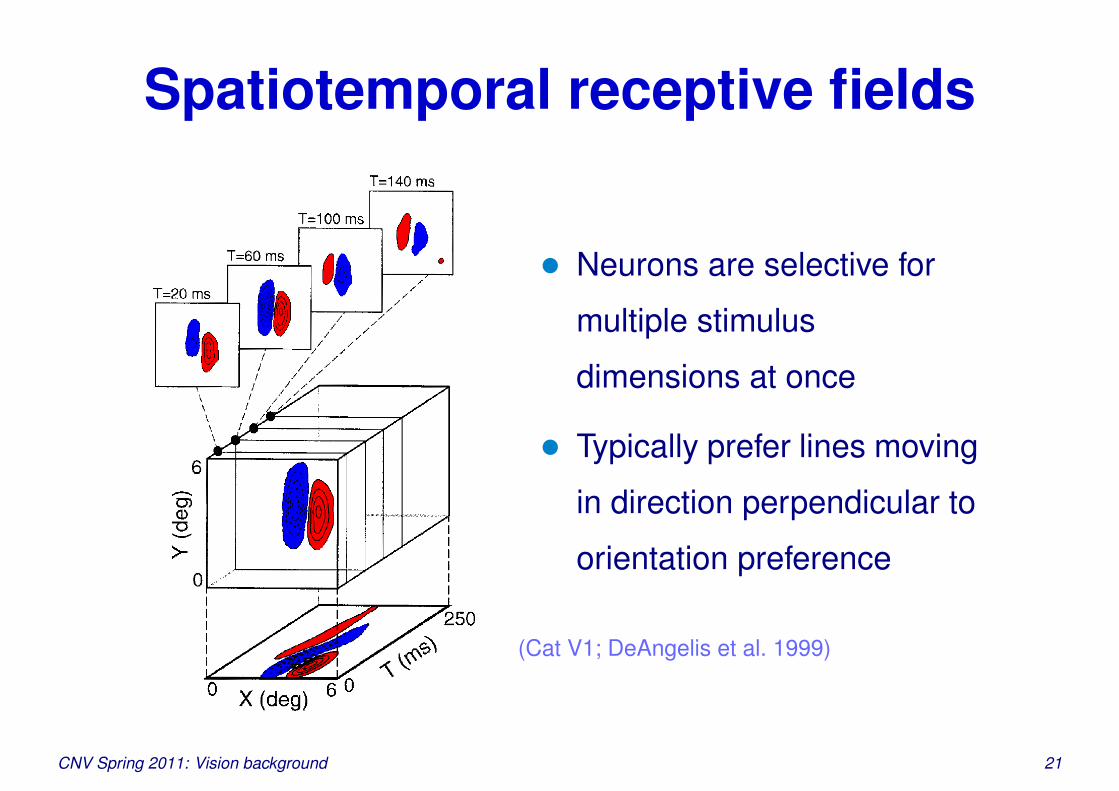
Spatiotemporal receptive fields
• Neurons are selective for
multiple stimulus
dimensions at once
• Typically prefer lines moving
in direction perpendicular to
orientation preference
(Cat V1; DeAngelis et al. 1999)
CNV Spring 2011: Vision background 21

Contrast perception
0% 3% 6% 12% 25% 100%
• Humans can detect patterns over a huge contrast range
• In the laboratory, increasing contrast above a fairly lowvalue does not aid detection
• See 2AFC (two-alternative forced-choice) test ingoogle and ROC (Receiver Operating Characteristic)in Wikipedia for more info on how such tests work
CNV Spring 2011: Vision background 22

Contrast-invariant tuning
(Sclar & Freeman 1982)
• Single-cell tuning curves
are typically Gaussian
• 5%, 20%, 80% contrasts
shown
• Peak response increases, but
• Tuning width changes little
• Contrast where peak is
reached varies by cell
CNV Spring 2011: Vision background 23

Definitions of contrast
Luminance (luminosity): Physical amount of light
Contrast: Luminance relative to background levels to
which the visual system has become adapted
Contrast is a fuzzy concept – clear only in special cases:
Weber contrast (e.g. a tiny spot on uniform background)
C = Lmax−LminLmin
Michelson contrast (e.g. a full-field sine grating):
C = Lmax−LminLmax+Lmin =
Lmax−Lmin2
Lavg
CNV Spring 2011: Vision background 24

Measuring cortical maps
CM
VC
figur
e2.
3
• Surface reflectance (or voltage-sensitive-dye
emission) changes with activity
• Measured with optical imaging
• Preferences computed as correlation between
measurement and input
CNV Spring 2011: Vision background 25

Retinotopy/orientation map0o
4o
2o
2o
4o
6o
8o
6o
8o
0o
2o
4o
6o
8o
4o
2o
6o
Tree
shre
w;B
oski
nget
al.2
002;
2×2m
m
• Tree shrew has no fovea ; isotropic map• All orientations represented for each retina location• Orientation map is smooth, with local patches
CNV Spring 2011: Vision background 26

Macaque orientation map
Mac
aque
;Bla
sdel
1992
;4×
3mm
• Macaque monkey has fovea but similar orientation map
• Retinotopic map (not measured) highly nonlinear
CNV Spring 2011: Vision background 27

Ocular dominance map in V1
Adu
ltm
onke
y;B
lasd
el19
92;4×
3mm
• Most neurons are binocular, but prefer one eye
• Eye preference alternates in stripes or patches
CNV Spring 2011: Vision background 28

Combined OR/OD map in V1
Adu
ltm
onke
y;B
lasd
el19
92;4×
3mm
• Same neurons have preference for both features
• OR has linear zones, fractures, pinwheels, saddles
• OD boundaries typically align with linear zonesCNV Spring 2011: Vision background 29

Direction map in V1
Direction preference
(3.2×2mm)
OR/Direction pref.
(1×1.4mm)
(Adu
ltfe
rret
;Wel
iky
etal
.199
6)
• Local patches prefer different directions• Single-OR patches often subdivided by direction• Other maps: spatial frequency, color, disparity
CNV Spring 2011: Vision background 30
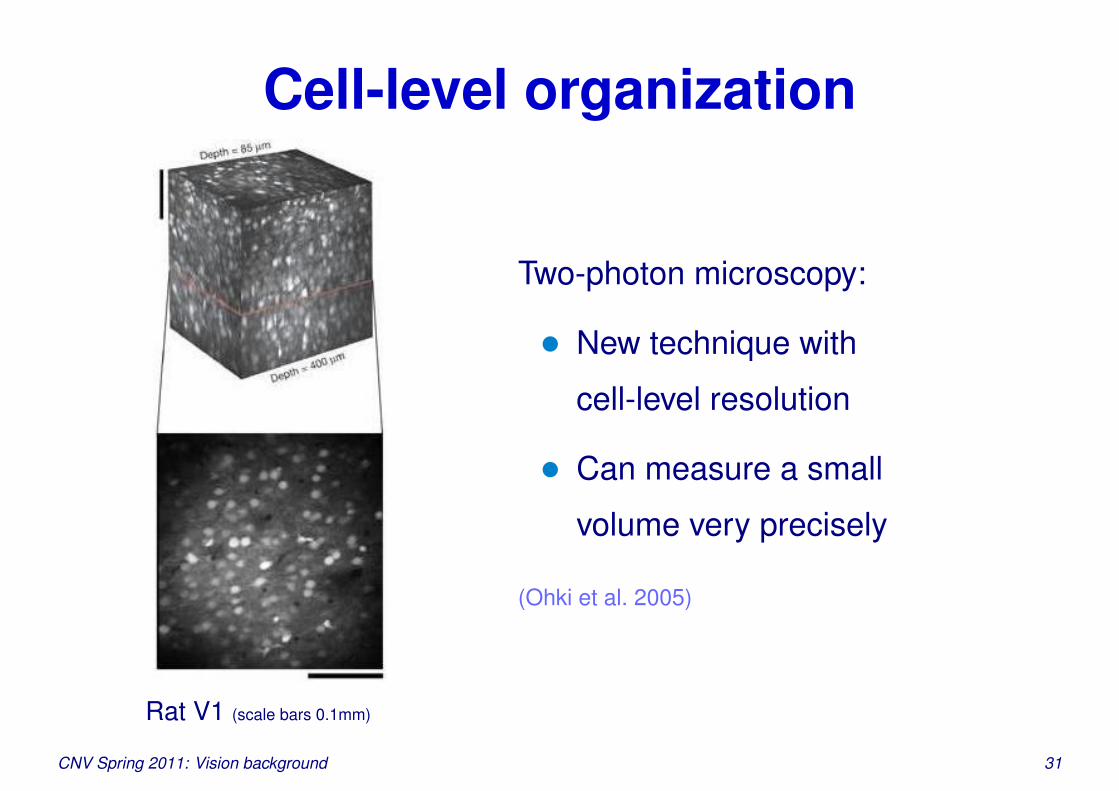
Cell-level organization
Rat V1 (scale bars 0.1mm)
Two-photon microscopy:
• New technique with
cell-level resolution
• Can measure a small
volume very precisely
(Ohki et al. 2005)
CNV Spring 2011: Vision background 31

Cell-level organization 2
Rat V1 (scale bars 0.1mm)
• Individual cells can be
tagged with feature
preference
• In rat, orientation
preferences are random
• Random also expected in
mouse, squirrel
(Ohki et al. 2005)
CNV Spring 2011: Vision background 32
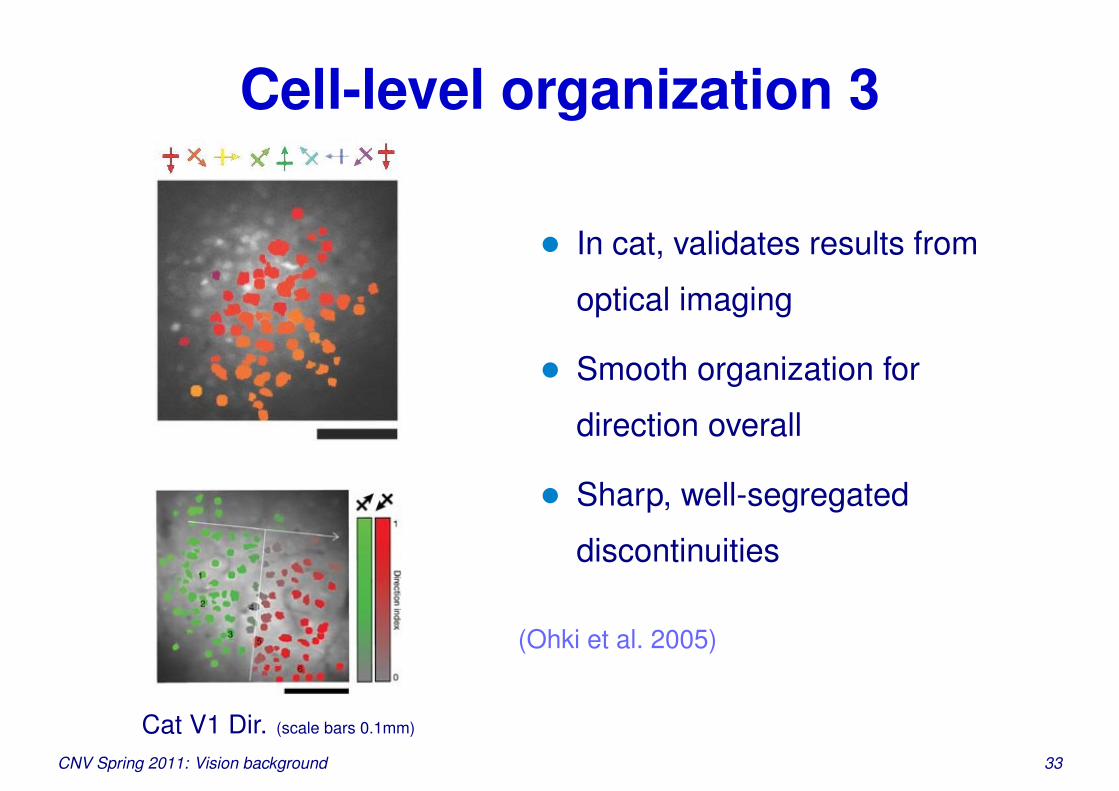
Cell-level organization 3
Cat V1 Dir. (scale bars 0.1mm)
• In cat, validates results from
optical imaging
• Smooth organization for
direction overall
• Sharp, well-segregated
discontinuities
(Ohki et al. 2005)
CNV Spring 2011: Vision background 33

Cell-level organization 4
Low-res map (2×1.2mm)
Stack of all labeled
cells (0.6×0.4mm)
• Very close match with
optical imaging results
• Stacking labeled cells from
all layers shows very strong
ordering spatially and in
across layers
• Selectivity in pinwheels
controversial; apparently
lower
(Ohki et al. 2006)CNV Spring 2011: Vision background 34

Surround modulation
10%
20%
30%
40%
Which of the contrasts at left matches the central area?CNV Spring 2011: Vision background 35
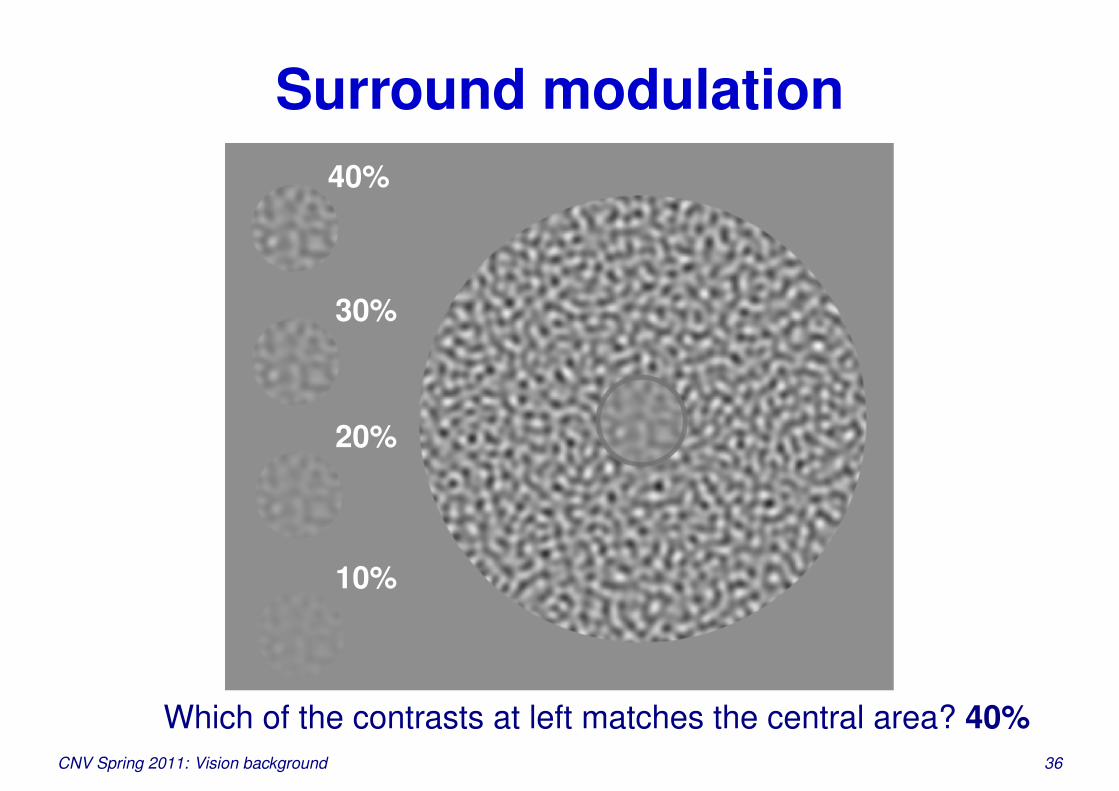
Surround modulation
10%
20%
30%
40%
Which of the contrasts at left matches the central area? 40%CNV Spring 2011: Vision background 36
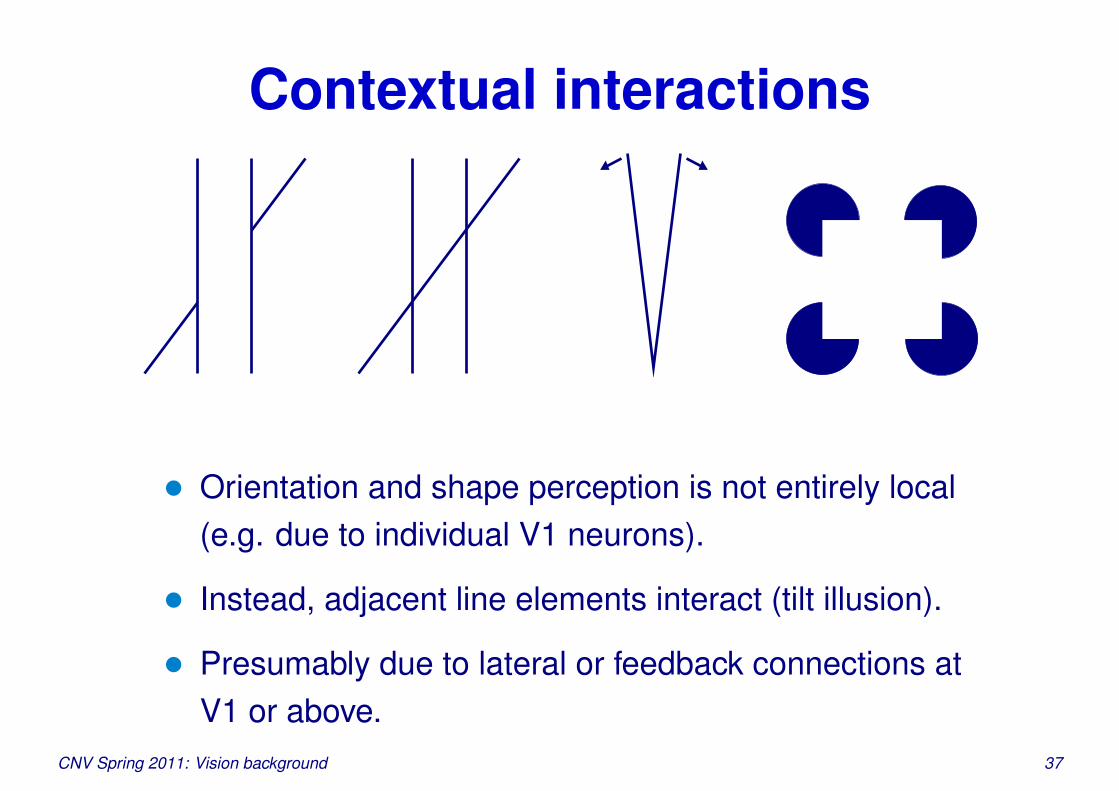
Contextual interactions
• Orientation and shape perception is not entirely local(e.g. due to individual V1 neurons).
• Instead, adjacent line elements interact (tilt illusion).
• Presumably due to lateral or feedback connections atV1 or above.
CNV Spring 2011: Vision background 37

Lateral connections
(Mac
aque
;Gilb
erte
tal.
1990
)
• Example layer 2/3 pyramidal cell
• Patchy every 1mmCNV Spring 2011: Vision background 38

Lateral connections
(2.5 mm× 2 mm in tree shrew V1; Bosking et al. 1997)
• Connections up to 8mm link to similar preferences
• Patchy structure, extend along OR preference
CNV Spring 2011: Vision background 39
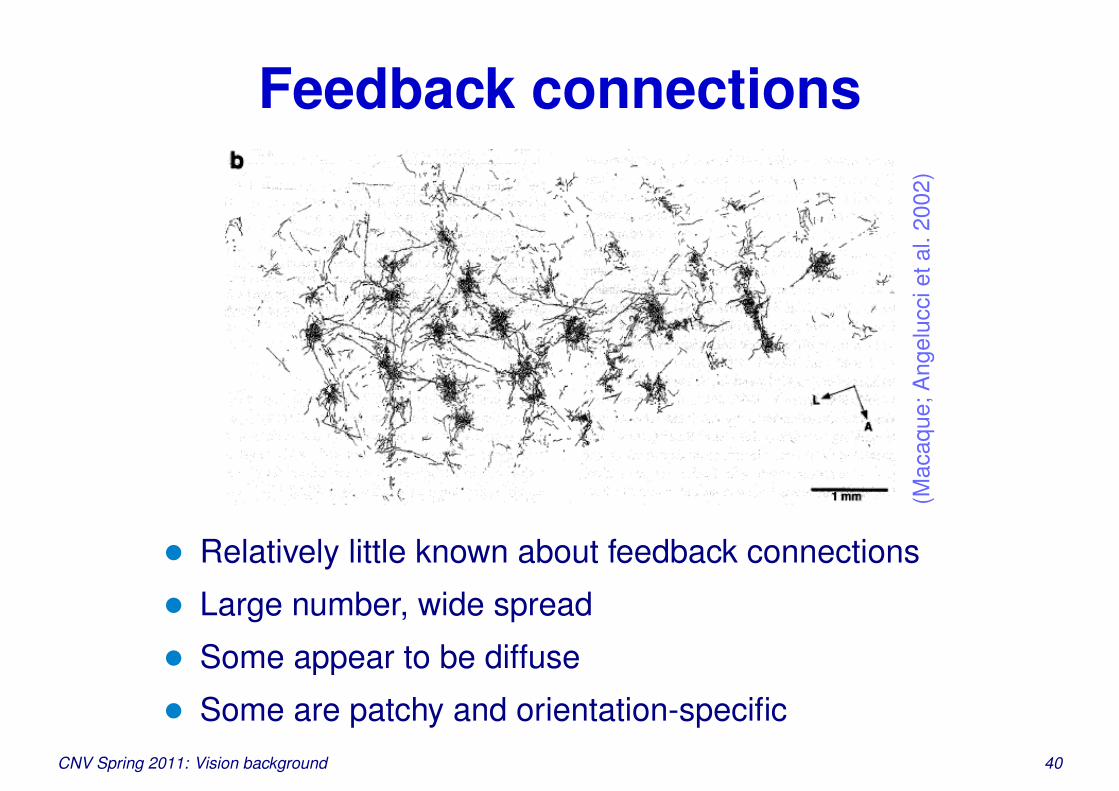
Feedback connections
(Mac
aque
;Ang
eluc
ciet
al.2
002)
• Relatively little known about feedback connections
• Large number, wide spread
• Some appear to be diffuse
• Some are patchy and orientation-specificCNV Spring 2011: Vision background 40
Visual development
Research questions:
• Where does the visual system structure come from?
• How much of the architecture is specific to vision?
• What influence does the environment have?
• How plastic is the system in the adult?
Most visual development studies focus on ferrets and cats,
whose visual systems are very immature at birth.
CNV Spring 2011: Vision background 41

Initial development
(Ziv
1996
)
• Tissues develop into eye, brain
• RGC axons grow from eye to LGN and superior
colliculus (SC) following chemical gradients
• Axons form synapses at LGN, SC
• LGN axons grow to V1, V2, etc., forming synapses
CNV Spring 2011: Vision background 42

Cortical development• Coarse cortical architecture (e.g. division into areas)
appears to be fixed after birth
• Cortical architecture similar across areas
• Much of cortical development appears driven by
different peripheral circuitry (auditory, visual, etc.)
• E.g. Sur et al. 1988-2000: auditory cortex can develop
into visual cortex
CNV Spring 2011: Vision background 43
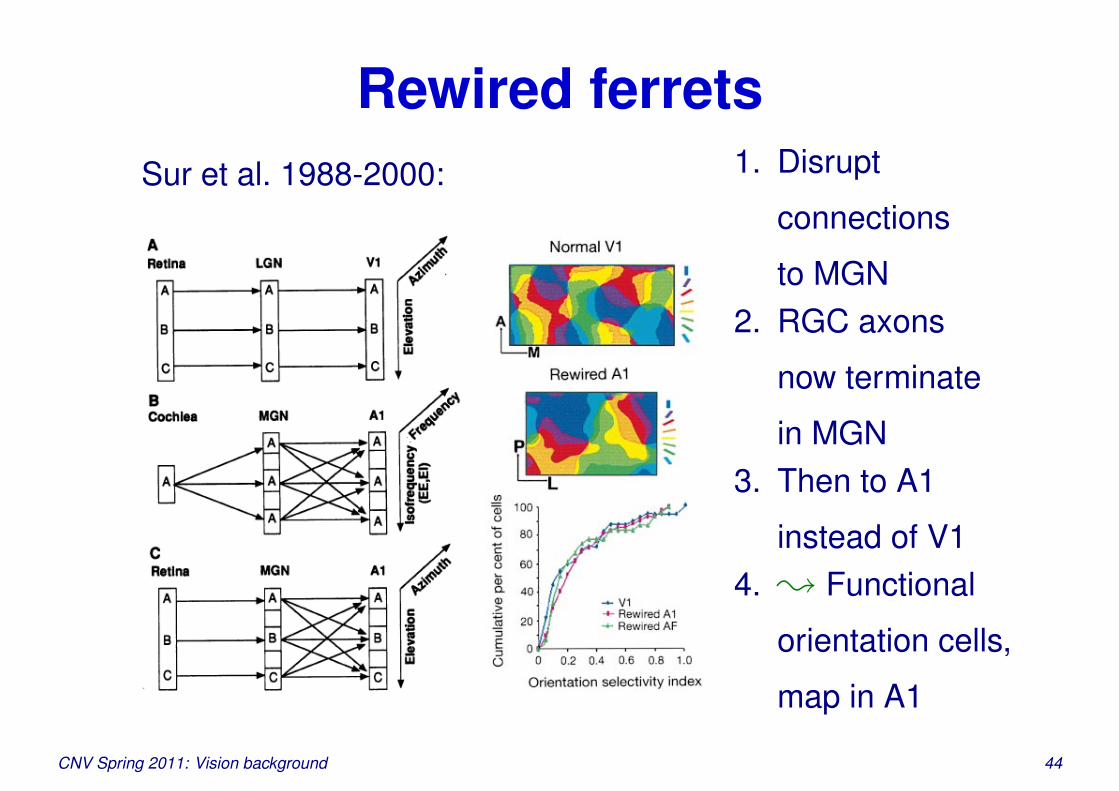
Rewired ferretsSur et al. 1988-2000: 1. Disrupt
connections
to MGN2. RGC axons
now terminate
in MGN3. Then to A1
instead of V14. ; Functional
orientation cells,
map in A1
CNV Spring 2011: Vision background 44
Human visual system at birth
• Some visual ability
• Fovea barely there
• Color vision poor
• Binocular vision difficult
– Poor control of eye movements
– Seems to develop later
• Acuity increases 25X (birth to 6 months)
CNV Spring 2011: Vision background 45
Map development
• Initial orientation, OD maps develop without visual
experience (Crair et al. 1998)
• Maps match between the eyes even without shared
visual experience (Kim & Bonhoeffer 1994)
• Experience leads to more selective neurons and maps
(Crair et al. 1998)
• Lid suture (leaving light through eyelids) during critical
period destroys maps (White et al. 2001)
; Complicated interaction between system and environment.
CNV Spring 2011: Vision background 46

OR map developmentp3
1p3
5p4
2
(Fer
ret;
Cha
pman
etal
.199
6)(a
ppro
x5m
m×
3.5m
m)
• Map not visible when
eyes first forced open
• Gradually becomes
stronger over weeks
• Shape doesn’t change
significantly
• Initial development
affected little by dark
rearing
CNV Spring 2011: Vision background 47
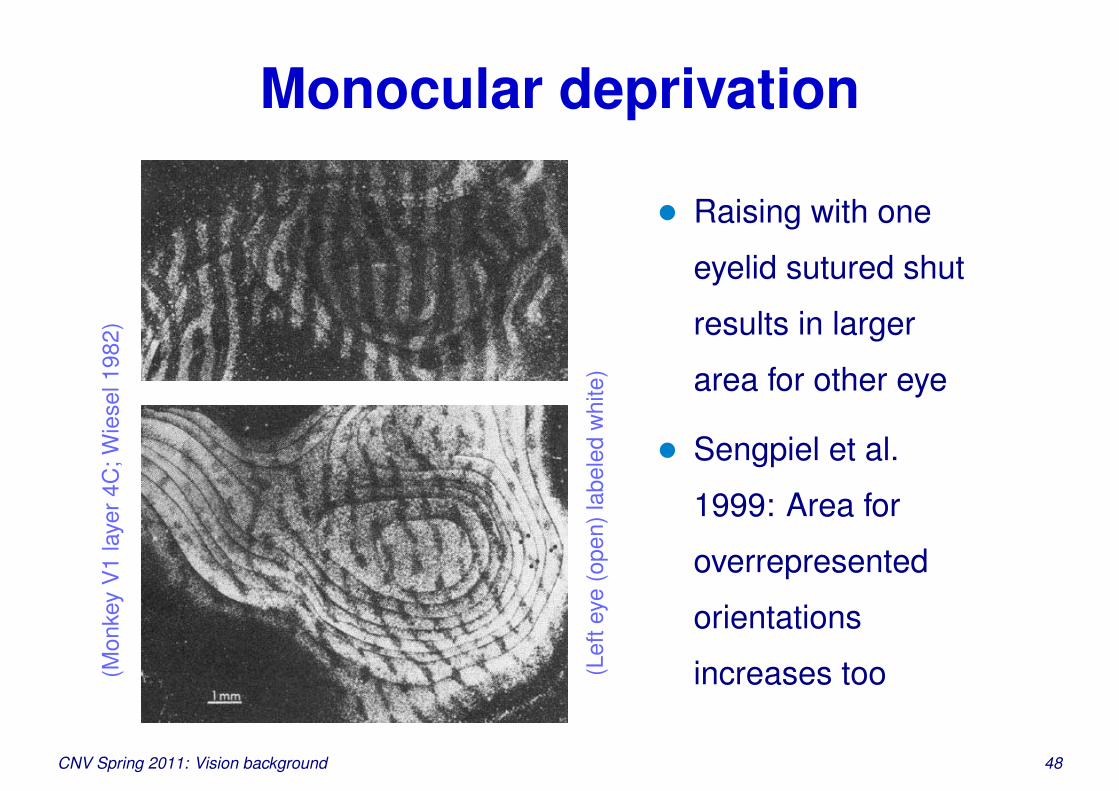
Monocular deprivation(M
onke
yV
1la
yer4
C;W
iese
l198
2)
(Lef
teye
(ope
n)la
bele
dw
hite
)
• Raising with one
eyelid sutured shut
results in larger
area for other eye
• Sengpiel et al.
1999: Area for
overrepresented
orientations
increases too
CNV Spring 2011: Vision background 48

Internally generated inputs
0.0s 1.0s 2.0s 3.0s 4.0s
0.0s 0.5s 1.0s 1.5s 2.0s
(Fel
lere
tal.
1996
,1m
m2
ferr
etre
tina)
• Retinal waves: drifting patches of spontaneous activity
• Training patterns?
CNV Spring 2011: Vision background 49

Role of spontaneous activity• Silencing of retinal waves prevents eye-specific
segregation in LGN (Huberman et al. 2003) and oculardominance columns in V1 (Huberman et al. 2006)
• Boosting in one eye disrupts LGN, but not if in both
• Disrupting retinal waves disrupts geniculocorticalmapping (Cang et al. 2005)
• Other sources of input to V1: spontaneous corticalactivity, brainstem activity
• All developing areas seem to be spontaneously active,e.g. auditory system, spinal cord
CNV Spring 2011: Vision background 50

Timeline: Cat
(Sen
gpie
l&K
ind
2002
)
CNV Spring 2011: Vision background 51

Timeline: Ferret
(Sen
gpie
l&K
ind
2002
)
CNV Spring 2011: Vision background 52

Cat vs.ferret
Should be
readable in a
printout, not
on screen
OD, Ocular dominance
MD, monocular deprivation
GC, ganglion cell
C-I, contralateral-ipsilateral
(Issa et al. 1999)
CNV Spring 2011: Vision background 53
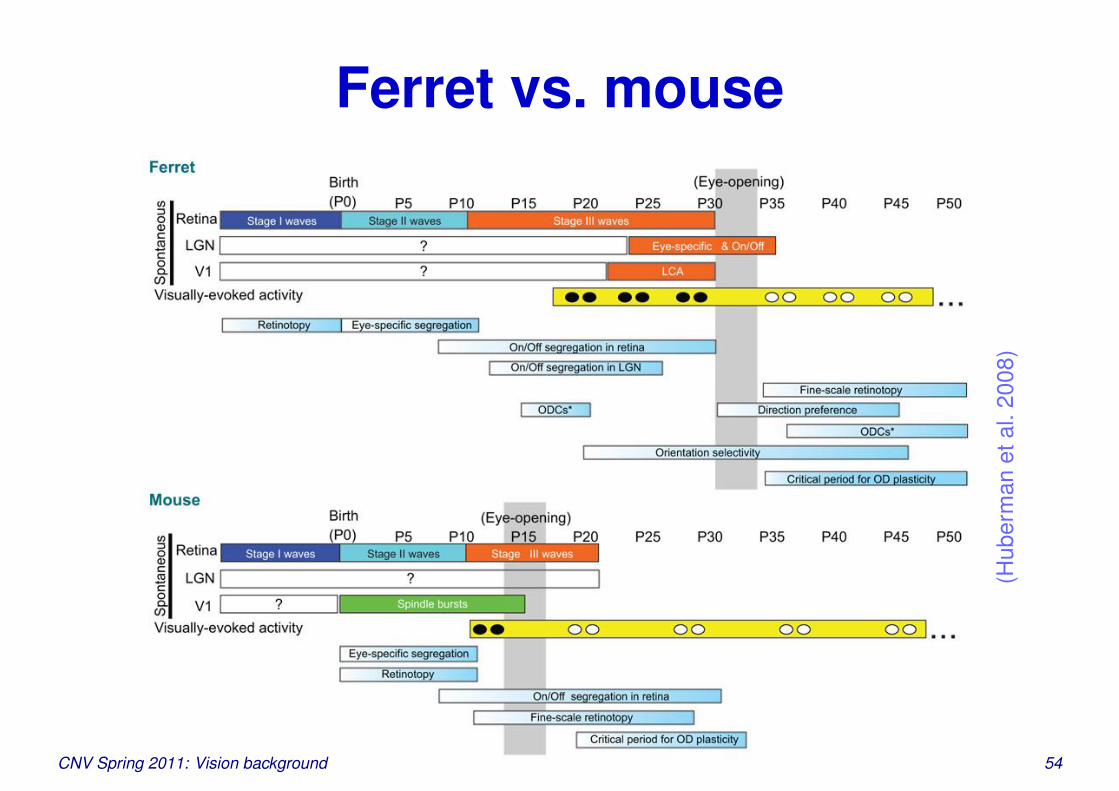
Ferret vs. mouse
(Hub
erm
anet
al.2
008)
Should be readable in a printout, not on screenCNV Spring 2011: Vision background 54

Conclusions
• Early areas well studied
• Higher areas much less so
• Little understanding of how entire system works
together
• Development also a mystery
• Lots of work to do
CNV Spring 2011: Vision background 55
ReferencesAhnelt, P. K., & Kolb, H. (2000). The mammalian photoreceptor mosaic—adaptive
design. Progress in Retinal and Eye Research, 19 (6), 711–777.
Angelucci, A., Levitt, J. B., & Lund, J. S. (2002). Anatomical origins of the classicalreceptive field and modulatory surround field of single neurons in macaquevisual cortical area V1. Progress in Brain Research, 136, 373–388.
Bosking, W. H., Crowley, J. C., & Fitzpatrick, D. (2002). Spatial coding of positionand orientation in primary visual cortex. Nature Neuroscience, 5 (9), 874–882.
Bosking, W. H., Zhang, Y., Schofield, B. R., & Fitzpatrick, D. (1997). Orientationselectivity and the arrangement of horizontal connections in tree shrew stri-ate cortex. The Journal of Neuroscience, 17 (6), 2112–2127.
CNV Spring 2011: Vision background 55

Cang, J., Renteria, R. C., Kaneko, M., Liu, X., Copenhagen, D. R., & Stryker, M. P.(2005). Development of precise maps in visual cortex requires patternedspontaneous activity in the retina. Neuron, 48 (5), 797–809.
Chapman, B., Stryker, M. P., & Bonhoeffer, T. (1996). Development of orientationpreference maps in ferret primary visual cortex. The Journal of Neuro-science, 16 (20), 6443–6453.
Crair, M. C., Gillespie, D. C., & Stryker, M. P. (1998). The role of visual experiencein the development of columns in cat visual cortex. Science, 279, 566–570.
DeAngelis, G. C., Ghose, G. M., Ohzawa, I., & Freeman, R. D. (1999). Func-tional micro-organization of primary visual cortex: Receptive field analysisof nearby neurons. The Journal of Neuroscience, 19 (10), 4046–4064.
Feller, M. B., Wellis, D. P., Stellwagen, D., Werblin, F. S., & Shatz, C. J. (1996).
CNV Spring 2011: Vision background 55
Requirement for cholinergic synaptic transmission in the propagation ofspontaneous retinal waves. Science, 272, 1182–1187.
Gilbert, C. D., Hirsch, J. A., & Wiesel, T. N. (1990). Lateral interactions in visualcortex. In The Brain (Vol. LV of Cold Spring Harbor Symposia on Quanti-tative Biology, pp. 663–677). Cold Spring Harbor, NY: Cold Spring HarborLaboratory Press.
Hubel, D. H., & Wiesel, T. N. (1977). Functional architecture of macaque visualcortex. Proceedings of the Royal Society of London Series B, 198, 1–59.
Huberman, A. D., Feller, M. B., & Chapman, B. (2008). Mechanisms underlyingdevelopment of visual maps and receptive fields. Annual Review of Neuro-science, 31, 479–509.
Huberman, A. D., Speer, C. M., & Chapman, B. (2006). Spontaneous retinal
CNV Spring 2011: Vision background 55

activity mediates development of ocular dominance columns and binocularreceptive fields in V1. Neuron, 52 (2), 247–254.
Huberman, A. D., Wang, G. Y., Liets, L. C., Collins, O. A., Chapman, B., &Chalupa, L. M. (2003). Eye-specific retinogeniculate segregation indepen-dent of normal neuronal activity. Science, 300 (5621), 994–998.
Issa, N. P., Trachtenberg, J. T., Chapman, B., Zahs, K. R., & Stryker, M. P. (1999).The critical period for ocular dominance plasticity in the ferret’s visual cor-tex. The Journal of Neuroscience, 19 (16), 6965–6978.
Kandel, E. R., Schwartz, J. H., & Jessell, T. M. (1991). Principles of Neural Sci-ence (3rd Ed.). Amsterdam: Elsevier.
Kim, D. S., & Bonhoeffer, T. (1994). Reverse occlusion leads to a precise restora-
CNV Spring 2011: Vision background 55
tion of orientation preference maps in visual cortex. Nature, 370 (6488),370–372.
Ohki, K., Chung, S., Ch’ng, Y. H., Kara, P., & Reid, R. C. (2005). Functionalimaging with cellular resolution reveals precise micro-architecture in visualcortex. Nature, 433 (7026), 597–603.
Ohki, K., Chung, S., Kara, P., Hubener, M., Bonhoeffer, T., & Reid, R. C. (2006).Highly ordered arrangement of single neurons in orientation pinwheels. Na-ture, 442 (7105), 925–928.
Sclar, G., & Freeman, R. D. (1982). Orientation selectivity in the cat’s striate cortexis invariant with stimulus contrast. Experimental Brain Research, 46, 457–461.
CNV Spring 2011: Vision background 55

Sengpiel, F., & Kind, P. C. (2002). The role of activity in development of the visualsystem. Current Biology, 12 (23), R818–R826.
Sengpiel, F., Stawinski, P., & Bonhoeffer, T. (1999). Influence of experience onorientation maps in cat visual cortex. Nature Neuroscience, 2 (8), 727–732.
Sur, M., Garraghty, P. E., & Roe, A. W. (1988). Experimentally induced visualprojections in auditory thalamus and cortex. Science, 242, 1437–1441.
Van Essen, D. C., Anderson, C. H., & Felleman, D. J. (1992). Information pro-cessing in the primate visual system: An integrated systems perspective.Science, 255, 419–423.
Weliky, M., Bosking, W. H., & Fitzpatrick, D. (1996). A systematic map of directionpreference in primary visual cortex. Nature, 379, 725–728.
CNV Spring 2011: Vision background 55

White, L. E., Coppola, D. M., & Fitzpatrick, D. (2001). The contribution of sensoryexperience to the maturation of orientation selectivity in ferret visual cortex.Nature, 411, 1049–1052.
Wiesel, T. N. (1982). Postnatal development of the visual cortex and the influenceof the environment. Nature, 299, 583–591.
CNV Spring 2011: Vision background 55