Early Tube Leak Detection: See What You Can’t Hear …boiler-wrba.org/2016Presentations/10-SteamLeakDetection.pdf• Non invasive rods weld to boiler wall • Sensor mounted on end
Early steam leak detection in power boilers, recovery boilers, feedwater heaters and Heat Recovery Steam Generators (HRSGs)
Presenter
Presentation Notes
Current AMS Installations 309+ Power Boilers (39 International) 390+ Feedwater Heaters 21 Recovery Boilers 12 HRSG’s 8000+ sensors 200+ Boilers in Surveillance Program 80+ plants 30+ Utilities 1700+ leaks cataloged in Triple 5’s database since 2004
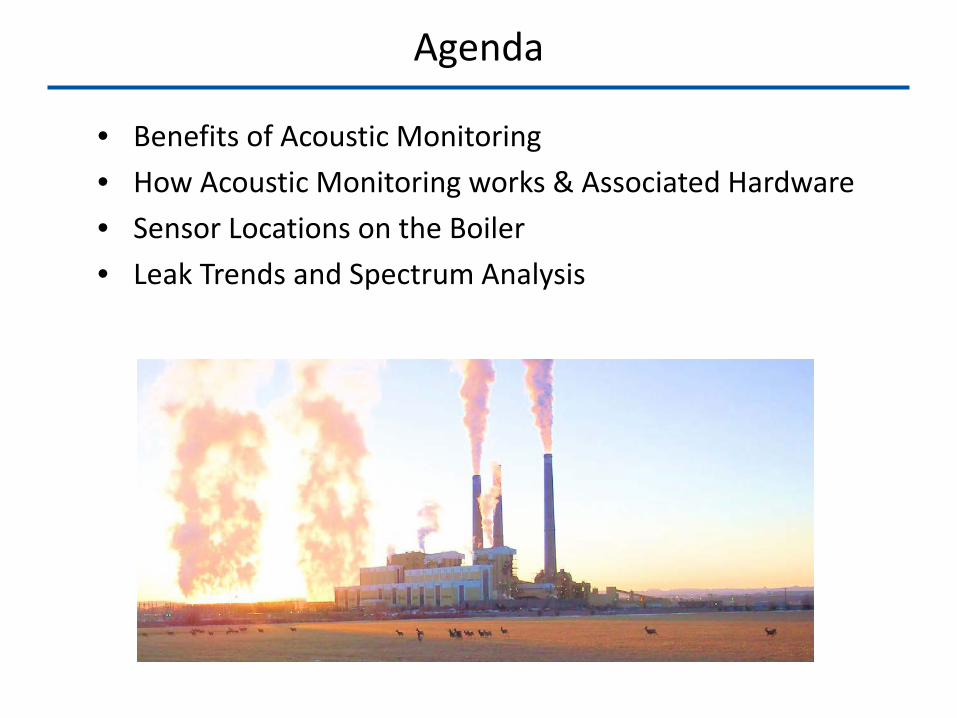
• Benefits of Acoustic Monitoring• How Acoustic Monitoring works & Associated Hardware• Sensor Locations on the Boiler• Leak Trends and Spectrum Analysis
Agenda
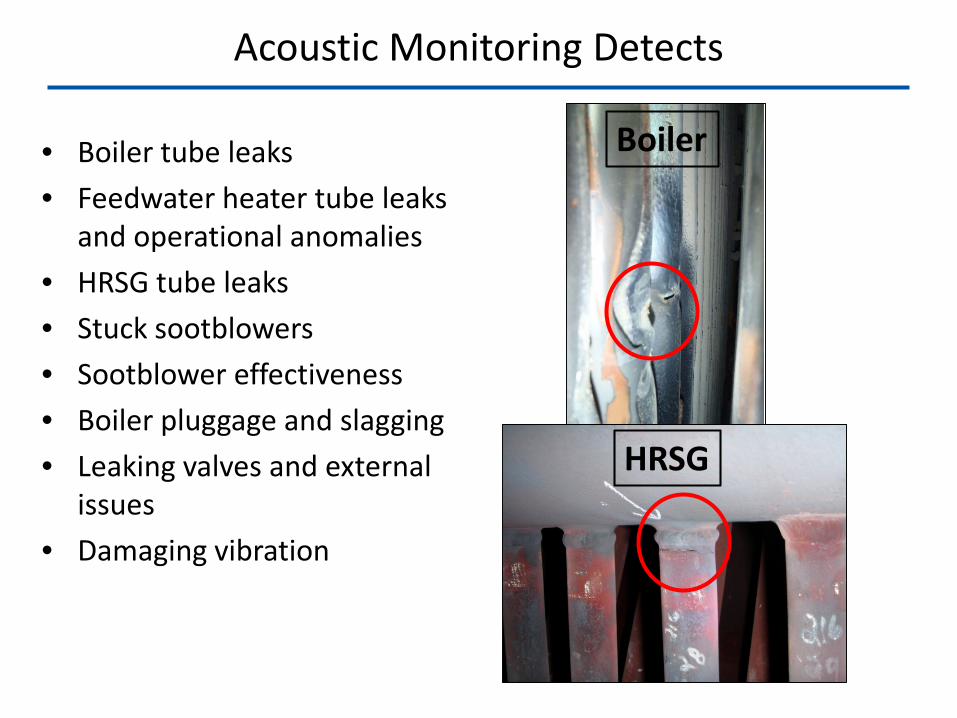
• Boiler tube leaks• Feedwater heater tube leaks
and operational anomalies• HRSG tube leaks• Stuck sootblowers• Sootblower effectiveness• Boiler pluggage and slagging• Leaking valves and external
issues• Damaging vibration
Acoustic Monitoring Detects
HRSG
Boiler
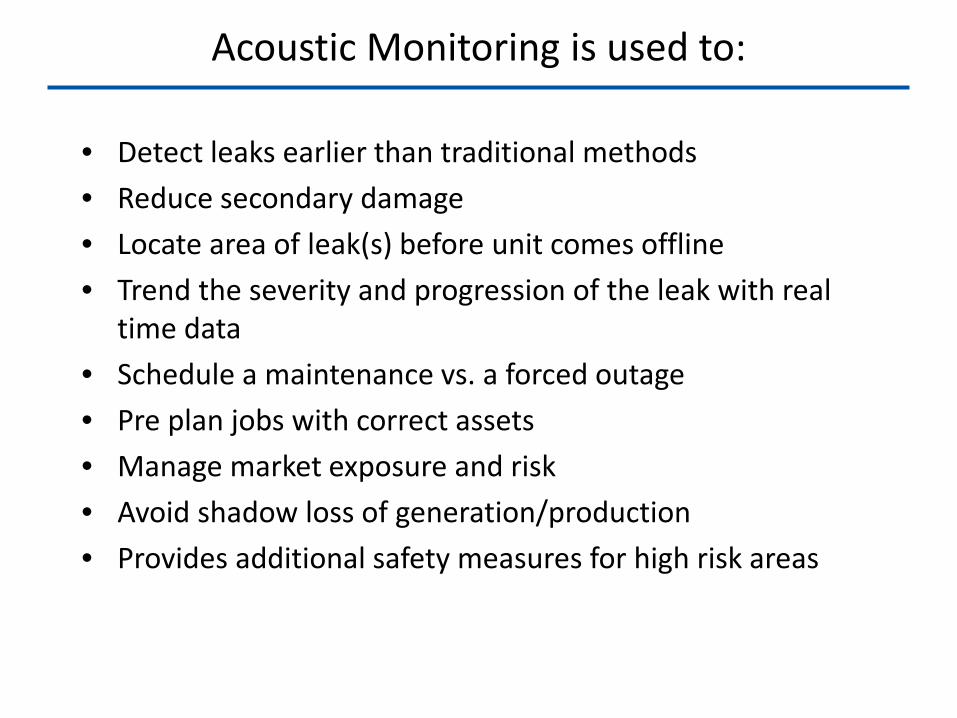
Acoustic Monitoring is used to:
• Detect leaks earlier than traditional methods• Reduce secondary damage• Locate area of leak(s) before unit comes offline• Trend the severity and progression of the leak with real
time data• Schedule a maintenance vs. a forced outage• Pre plan jobs with correct assets• Manage market exposure and risk• Avoid shadow loss of generation/production• Provides additional safety measures for high risk areas
HOW ACOUSTIC MONITORING WORKS & ASSOCIATED HARDWARE
Weld toTube
Membrane
Sounding RodWaveguide with
Sensor
BoilerWall
Leak
AcousticWavefront
in Boiler Gas
Leak
Boiler Leak Detection
Presenter
Presentation Notes
Airborne leaks - noise travels through boiler gases and strike outer wall, causing it to vibrate. Vibration transferred along rod to sensor Metalborne leaks - noise travels along fused metal pathways, again causing wall to vibrate which is transferred to rod/sensor Similar to screwdriver to listen to engine Like stethoscope Wall acts like diaphragm Sensor converts vibration to voltage, sends voltage signal to system where it is amplified, filtered, processed and displayed as a dB level
Boiler Sounding Rod Installation
• Non invasive rods weld to boiler wall• Sensor mounted on end• Covered with sensor/rod box for protection
Presenter
Presentation Notes
Sounding Rod welded to tube membrane Lagging and insulation have been cut away If no membrane, weld to peg fins, inner casing, or use waveguide plate
Feedwater Heater Sounding Rod Installation
• Non invasive rod welds to the shell at the tube sheet below the water level
• Sensor mounted on end• Covered with sensor box
for protection
Presenter
Presentation Notes
Typical installation on a HP Feedwater Heater. One sensor can monitor entire FWH.
HRSG Leak Detection
Leak
Acoustic Wave in Boiler Gas
Sounding Rod Waveguide with Sensor
Inner LinerWeld to Inner Liner
Presenter
Presentation Notes
Airborne leaks - noise travels through boiler gases and strike outer wall, causing it to vibrate. Vibration transferred along rod to sensor Metalborne leaks - noise travels along fused metal pathways, again causing wall to vibrate which is transferred to rod/sensor Similar to screwdriver to listen to engine Like stethoscope Wall acts like diaphragm Sensor converts vibration to voltage, sends voltage signal to system where it is amplified, filtered, processed and displayed as a dB level
•Non invasive rods weld to inner liner•Sensor mounted on end•Covered with sensor box for protection•Length determined based on access
HRSG Sounding Rod Installation
Presenter
Presentation Notes
Typical HRSG installation of sounding rods. Rod passes thru a pipe nipple sealed with high temperature insulation and rod is welded to inner liner. Box protects sensor.
SENSOR LOCATIONSON THE BOILER
Sensor Locations on the Boiler
Each indicates 2 sensors on opposite wallsEach indicates 3 sensors on the same wallEach indicates 2 sensors on the same wall
•Sensor locations chosen based on tube configuration and plant areas of concern
•Leak noise follows the gas flow of the unit
Presenter
Presentation Notes
Sample of Map page. Shows sensor locations along with brief text description.
Boiler Software Map
Presenter
Presentation Notes
Shows boiler with sensor and FWH locations. Also gives brief text description of locations plus elevation of sensors.
HRSG Software Map
Presenter
Presentation Notes
Map shows operators were sensors are located and color indicates signal strength. Green is normal, yellow signal has crossed the time delay alarm point and red is in alarm.
Normal Operations - baseline steady at 86dB – no tube leak
Presenter
Presentation Notes
Each sensor is tuned with unit at normal load to trend at 86dB …. the normal background noise of a boiler. Signal will follow load and should return to same amplitude for given load point.
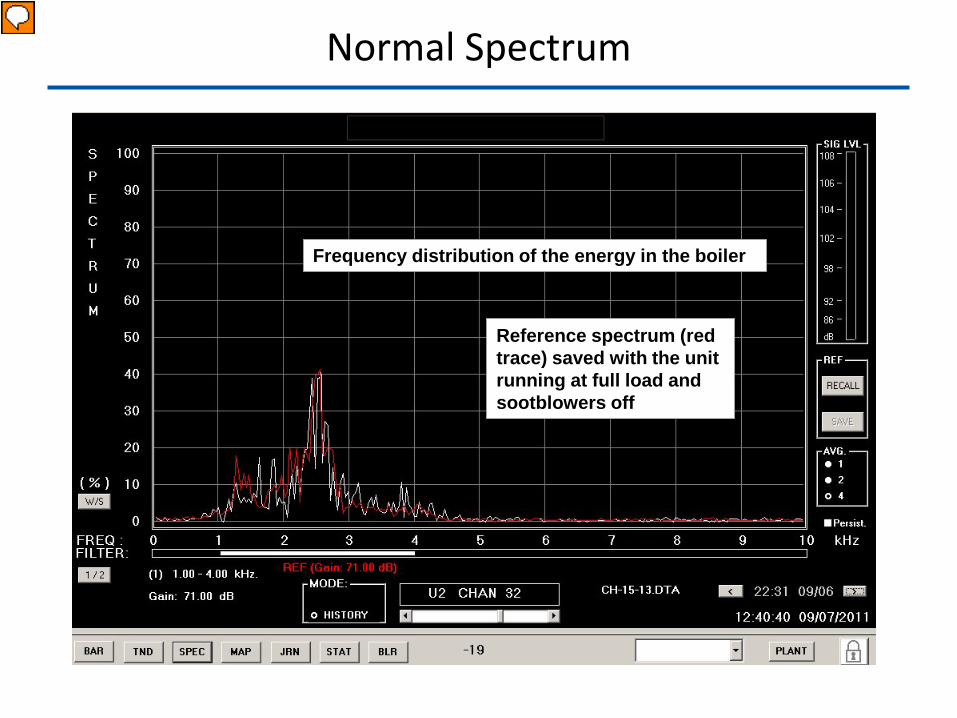
Normal Spectrum
Frequency distribution of the energy in the boiler
Reference spectrum (red trace) saved with the unit running at full load and sootblowers off
Presenter
Presentation Notes
Not only does the system trend the noise amplitude, the system displays the real time vs store reference spectrum of the frequency distribution on the noise at a determined range associated with a tube leak. Rules out noises from other sources and identifies high energy leak noises.
Group trend showing responses to a small leak and growing over time. Sensitivity is such that more than one sensor responds to a small leak and based on sensor location and signal strength identifies area of leak
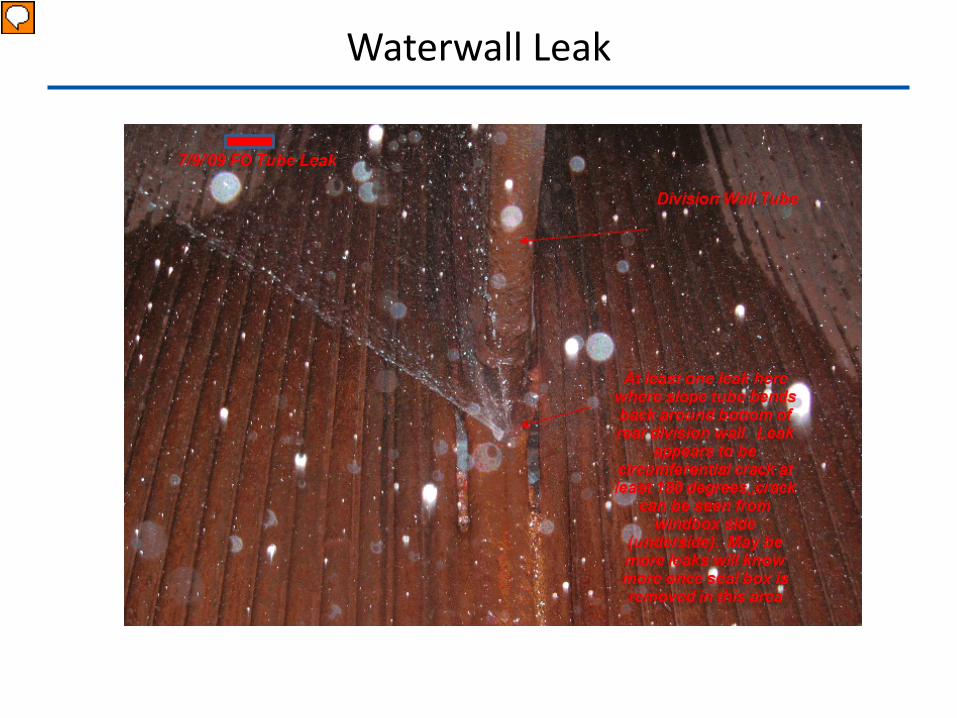
Waterwall Leak
Presenter
Presentation Notes
Actual photo of pin hole leak 12 meters from nearest sensor.
Pluggage & Reheat Leak
Reheat leak – signals increase with cycles in load
Note the difference between the trends for pluggage
versus a leak
Normal Baselines
Pluggage – shift in the baseline with erratic signal
Presenter
Presentation Notes
60 day trend of a reheat leak on the right side and pluggage on the left. Pluggage – the baseline shifts upward and the signals trend wider variation. Typically the signals don’t continue to increase. Spectrum shows cyclical narrowband noise. RH Leak - the signals gradually increase with each successive load increase. The signals gradually increase over 20.5 days. The boiler runs 2.5 days once the significant step on sensor 15 occurs. Total run time with the leak: 23 days (552 hours). Spectrum shows bell curve.
Reheat Leak Spectrum
Spectrum during leak showing increased
activity at 1-4 kHz
Reference spectrum saved during normal operations at full load
Presenter
Presentation Notes
60 day trend of a reheat leak on the right side and pluggage on the left. Pluggage – the baseline shifts upward and the signals trend wider variation. Typically the signals don’t continue to increase. Spectrum shows cyclical narrowband noise. RH Leak - the signals gradually increase with each successive load increase. The signals gradually increase over 20.5 days. The boiler runs 2.5 days once the significant step on sensor 15 occurs. Total run time with the leak: 23 days (552 hours). Spectrum shows bell curve
Pluggage Spectrum
Pluggage shows narrowband spikes in the 1-4kHz range
Reference spectrum
Presenter
Presentation Notes
Note the spikes indicating a whistle type noise associated with boiler pluggage and not a tube leak.
Pinhole Waterwall Leak
Gradual increase noted before shutdown for a planned outage
Plant confirms small waterwall leak during outage – repair made
Presenter
Presentation Notes
Quote from Surveillance report: “FYI....Unit 1 was brought O/S late Friday for the start of a 2 week planned outage. A hydro of the steam generator revealed a very small tube leak down in the south west corner of the boiler. Your analysis of Sensor #2 was right on when it was indicating a slight increase in noise levels in that area of the steam generator. “� Report 11/04/XX Trend Analysis: �UNIT 1: �*Sensor 2 (Wind Box West South) minimum levels gradually increasing since 10/26 from 80dB to 83dB. Best seen on 60 day trend. Possibly related to load. Recommend watching. �*Other trends within normal limits.
Recovery Boiler Economizer Header Leak
Mill alerted to increasing
acoustic signal
Leak confirmed and unit removed from service
Crack in handhole cap weld
Presenter
Presentation Notes
The tube leak occurred in the economizer header of a 600 ton/day, 650 psig CE Recovery Boiler, equipped with 16 metalborne waveguides and sensors. The leak began on or about December 15th. On the morning of the 20th, a Triple 5 engineer noted an increase on Sensor 12 during a regular weekly surveillance check. The engineer called the control room at the mill to alert them to the increase. Operators shut down the sootblowers while Triple 5 was live with the system. There was no change in the signal level, thus ruling out a potential sootblower problem. Levels continued to increase with time, and Sensor 12 went into alarm around 6pm on December 21st. The mill closely monitored the increasing acoustic levels over the next five days. Other monitoring by operations did not reveal any significant steam/feedwater differential, decrease in the amount of cascade dilution, or changes in draft, which would confirm the presence of a leak. During a boiler walk on December 25th, operators observed water dripping from the lagging/insulation on the rear side of the lower economizer. After removing the lagging and insulation, water was noted flowing from the casing. The decision was made to bring the unit down on December 26th. The leak was a ¼” crack in a handhole cap weld, lower economizer header, 8’ from the north side wall and approximately 3’ below Sensor 12. The increase on the Acoustic Monitoring System, Sensor 12, was the only indication of the leak.
Recovery Boiler Economizer Leak
Mill alerted to increasing
acoustic signal
Presenter
Presentation Notes
The tube leak occurred in the economizer header of a 600 ton/day, 650 psig B&W Recovery Boiler (1985), equipped with 30 metalborne waveguides and sensors.
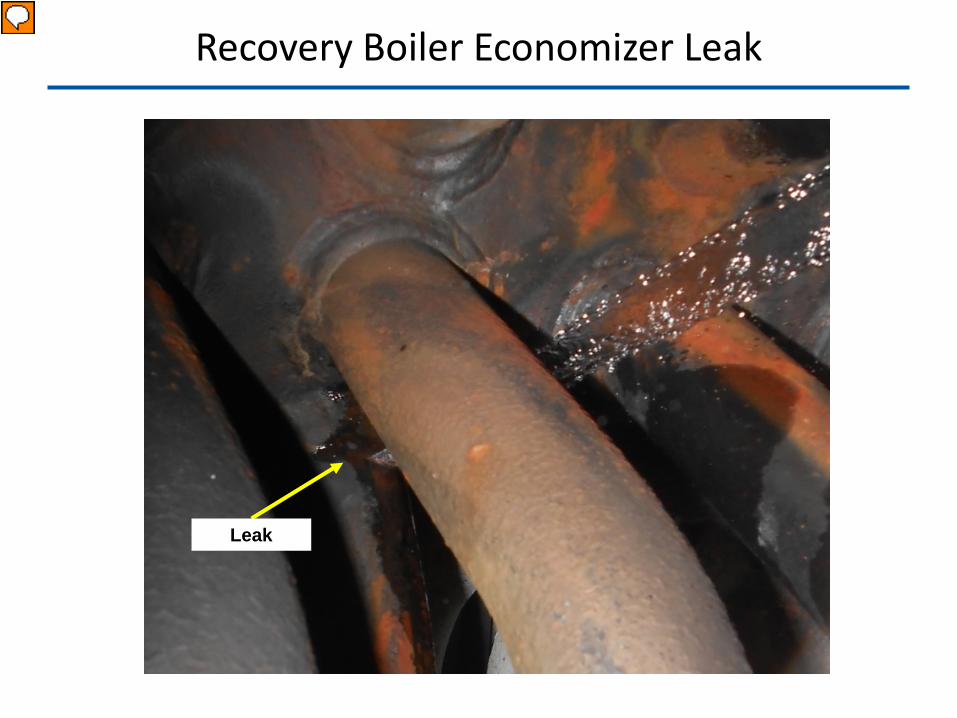
Recovery Boiler Economizer Leak
Leak
Presenter
Presentation Notes
The tube leak occurred in the economizer header of a 600 ton/day, 650 psig B&W Recovery Boiler (1985), equipped with 30 metalborne waveguides and sensors.
Heat Exchanger Leak
Plant aware of tube leak and monitoring until outage
Normal after
start-up
Presenter
Presentation Notes
60 day trend for a feedwater heater leak. The signal initially spikes to 105dB, reduces to 91dB but begins to gradually increase. Signal reached 110dB prior to shutdown. Total run time for heater with the leak: 39 days (936 hours).