early prediction of alzheimer’s disease using null ... · research article early prediction of...
TRANSCRIPT
RESEARCH ARTICLE
Early Prediction of Alzheimer’s Disease Using
Null Longitudinal Model-Based Classifiers
Giovana Gavidia-Bovadilla1, Samir Kanaan-Izquierdo1,2, Marıa Mataro-Serrat3,4,
Alexandre Perera-Lluna1,5*, for the Alzheimer’s Disease Neuroimaging Initiative
1 Department of ESAII, Universitat Politècnica de Catalunya, Barcelona, Catalonia, Spain, 2 Department of
ESAII, Center for Biomedical Engineering Research (CREB), Universitat Politècnica de Catalunya,
Barcelona, Catalonia, Spain, 3 Department of Clinical Psychology and Psychobiology, Universitat de
Barcelona, Barcelona, Catalonia, Spain, 4 Institute of Neurosciences, Universitat de Barcelona, Barcelona,
Catalonia, Spain, 5 CIBER of Bioengineering, Biomaterials and Nanomedicine (CIBER-BBN), Barcelona,
Catalonia, Spain
¶ Membership information of the Alzheimer’s Disease Neuroimaging Initiative is provided in the
Acknowledgments.
Abstract
Incipient Alzheimer’s Disease (AD) is characterized by a slow onset of clinical symptoms,
with pathological brain changes starting several years earlier. Consequently, it is necessary
to first understand and differentiate age-related changes in brain regions in the absence of
disease, and then to support early and accurate AD diagnosis. However, there is poor
understanding of the initial stage of AD; seemingly healthy elderly brains lose matter in
regions related to AD, but similar changes can also be found in non-demented subjects hav-
ing mild cognitive impairment (MCI). By using a Linear Mixed Effects approach, we modelled
the change of 166 Magnetic Resonance Imaging (MRI)-based biomarkers available at a 5-
year follow up on healthy elderly control (HC, n = 46) subjects. We hypothesized that, by
identifying their significant variant (vr) and quasi-variant (qvr) brain regions over time, it
would be possible to obtain an age-based null model, which would characterize their normal
atrophy and growth patterns as well as the correlation between these two regions. By using
the null model on those subjects who had been clinically diagnosed as HC (n = 161), MCI (n
= 209) and AD (n = 331), normal age-related changes were estimated and deviation scores
(residuals) from the observed MRI-based biomarkers were computed. Subject classifica-
tion, as well as the early prediction of conversion to MCI and AD, were addressed through
residual-based Support Vector Machines (SVM) modelling. We found reductions in most
cortical volumes and thicknesses (with evident gender differences) as well as in sub-cortical
regions, including greater atrophy in the hippocampus. The average accuracies (ACC)
recorded for men and women were: AD-HC: 94.11%, MCI-HC: 83.77% and MCI converted
to AD (cAD)-MCI non-converter (sMCI): 76.72%. Likewise, as compared to standard clinical
diagnosis methods, SVM classifiers predicted the conversion of cAD to be 1.9 years earlier
for females (ACC:72.5%) and 1.4 years earlier for males (ACC:69.0%).
PLOS ONE | DOI:10.1371/journal.pone.0168011 January 3, 2017 1 / 19
a1111111111
a1111111111
a1111111111
a1111111111
a1111111111
OPENACCESS
Citation: Gavidia-Bovadilla G, Kanaan-Izquierdo S,
Mataro-Serrat M, Perera-Lluna A, for the
Alzheimer’s Disease Neuroimaging Initiative (2017)
Early Prediction of Alzheimer’s Disease Using Null
Longitudinal Model-Based Classifiers. PLoS ONE
12(1): e0168011. doi:10.1371/journal.
pone.0168011
Editor: Kewei Chen, Banner Alzheimer’s Institute,
UNITED STATES
Received: August 12, 2016
Accepted: November 24, 2016
Published: January 3, 2017
Copyright: © 2017 Gavidia-Bovadilla et al. This is
an open access article distributed under the terms
of the Creative Commons Attribution License,
which permits unrestricted use, distribution, and
reproduction in any medium, provided the original
author and source are credited.
Data Availability Statement: All MRI-based
biomarkers, clinical and demographic
information were obtained from the Alzheimer’s
Disease Neuroimaging Initiative (ADNI)
database (adni.loni.usc.edu) and are public and
freely accessible.
Funding: This work was supported by TEC2014-
60337-R and PSI2013-47724-P grants from the
Ministerio de Economıa y Competitividad
(MINECO). CIBER of Bioengineering, Biomaterials
Introduction
AD is a disease with both brain pathological processes and clinical decline occurring gradually,
with dementia representing the last stage of many years of accumulation of these pathological
changes. Changes begin several years before the onset of clinical symptoms and there is strong
supporting evidence that it is related to the early abnormal production of β−amyloid (Aβ) pep-
tide in the Cerebrospinal fluid (CSF). β− amyloidosis and the increase of CSF- τ protein pre-
cede neuronal dysfunction and neurodegeneration; and all of these precede cognitive changes
and correlate with clinical symptom severity [1, 2]. Neurodegeneration begins with a typical
pattern of early neurofibrillary tangles in medial temporal lobe structures, mainly entorhinal
cortex and hippocampus, and subsequently extending throughout most of the temporal lobe
and the posterior cingulate. Finally, this pattern involves extensive cortical regions, especially
parietal, prefrontal and orbitofrontal; and in an advance stage, change in several brain struc-
tures correlate closely with changes in cognitive [3, 4]. In addition to the foregoing, it is known
that the apolipoprotein E (APOE) 4 allele is the most prevalent genetic risk factor for AD [5].
Carriers of 4 attain AD at an earlier age than non-carriers [1, 5]; this may be due to 4 being
involved in early Aβ plaque concentration and neuro-degeneration. However, in spite of these
findings, it is important to be clear that 4 carriers merely inherit an increased risk of develop-
ing the disease, but not all people with AD are 4 carriers, and not all 4 carriers will develop
the disease.
Indeed, to understand the specific effects of AD on brain structures, it is important to study
and differentiate their age-related changes in the absence of disease. Ageing causes changes at
all levels, from molecular to morphological, in the brain which include shrinking. Studies have
demonstrated that seemingly healthy subjects lose brain matter over time and brain age-related
changes and function are not uniform across the whole brain or over subjects. The volume of
the brain decreases with age at a rate of approximately 0.2–0.5% per year [6] and this rate
might be even greater over the age of 70 [7]. Regionally, ageing-related atrophy has been
observed across many of the cortical regions [6, 8, 9] with a prominent decline in the prefrontal
cortex and the slight decline of the temporal cortex and parahippocampal cortex [8]. Decline
has been also found in several subcortical structures including the caudate nucleus, amygdala,
cerebellum and hippocampus [6, 9], the latter being the most studied structure, with annual
atrophy rate of about 2.0% [6]. Studies on cross-sectional and longitudinal MRI have found
significant correlations between gender and cortical and subcortical regions, but there are
inconsistencies between the results [8, 9]. Finally, another factor to consider with regard to the
effects of ageing on the brain and cognition is the influence of socio-demographic characteris-
tics. Both higher levels of education or occupational attainment may act as a protective factor.
For example, studies have found that higher levels of education may increase the brain reserve,
leading to larger brain structures, which can help to counter the effects of brain atrophy [9, 10].
However, many of these age-related changes are shared by neurodegenerative diseases.
Some studies have found that cognitively normal elderly (HC) have Aβ deposition in the brain
with similar levels of the substances observed in subjects with dementia due to AD [11]. Simi-
larly, despite an increase in τ protein having been seen in AD as compared to HC, τ deposition
is found in other neurodegenerative diseases referred to as tauopathies [12]. At the macro-
scopic level, ageing has an effect on brain morphology with atrophy caused by dendritic prun-
ing and loss of synapses and neurons. Part of this atrophy occurs in areas vulnerable to AD,
while other changes have been observed in areas less characteristic of early-stage AD [6, 8, 9].
Because of the shared biochemical and morphological characteristics, it must be pointed out
that it is a complex task to discriminate some of these age-related changes in healthy elderly
subjects from subjects affected with early stage of AD.
Early Prediction of Alzheimer’s Disease Using Null Longitudinal Model-Based Classifiers
PLOS ONE | DOI:10.1371/journal.pone.0168011 January 3, 2017 2 / 19
and Nanomedicine is an initiative of ISCIII. Authors
are part of the 2014SGR-1063 consolidated
research group of the Generalitat de Catalunya,
Spain. Data collection and sharing for this project
was funded by the Alzheimer’s Disease
Neuroimaging Initiative (ADNI) (National Institutes
of Health Grant U01 AG024904) and DOD ADNI
(Department of Defense award number W81XWH-
12-2-0012). The funders had no role in study
design, data collection and analysis, decision to
publish, or preparation of the manuscript.
Competing Interests: The authors have declared
that no competing interests exist.

In clinical practice, neuropsychological tests such as, the Clinical Dementia Rating (CDR)
[13], the Mini-Mental Examination Score (MMSE) [14] and the Alzheimer’s Disease Assess-
ment Scale cognitive subscale are used to monitor AD progression or treatment efficacy. How-
ever, although these tests unquestionably reflect an important aspect of disease progression
(i.e. functional impairment), they also have several limitations such as relatively low specificity
[15] and reliability [16]. During the past few years, there has been a considerable effort to iden-
tify additional biomarkers as early indicators of pathological changes to improve the accuracy
of the clinical diagnosis of possible/probable AD and the prediction of disease progression
from Mild Cognitive Impairment (MCI) which is a symptomatic predementia phase of AD
[17]. In spite of CSF-Aβ and CSF-τ have been suggested as the most informative AD biomark-
ers [18]; several studies also suggested their combination with other features types, such as
Magnetic Resonance Imaging (MRI)-based biomarkers, to increase early prediction accuracy
[19]. Currently, neuroimaging and specifically structural MRI biomarkers support earlier and
more precise diagnosis and measurement of progression. MRI Biomarkers of atrophy of
medial temporal regions have been validated for early diagnosis of subjects at the MCI stage.
Furthermore, MRI images used to measure rates of whole-brain and hippocampal region are
considered powerful markers of progression of neurodegeneration being used as outcomes in
clinical trials [4].
Alternatively, studies based on high dimensional methods have approached the HC/MCI/
AD early prediction problem of automatically classifying brain regions and subjects from
structural MRI-based biomarkers. These biomarkers allow the careful examination of morpho-
logical changes and their correlation with the progression of cognitive impairment. Multivari-
ate techniques such as Orthogonal Partial Least Squares (OPLS), Support Vector Machine
(SVM) and Relevance Vector Machine (RVM), among others, have enabled the correlation
and variance of these biomarkers to be evaluated in a more easily interpreted way and with
greater statistical power as compared to univariate approaches. Likewise, MRI biomarkers
have been used in combination with other types of biomarkers, such as Positron Emission
Tomography (PET)-based features, CSF-based biomarkers, Genetic-based biomarkers and
socio-demographic and neuropsychological features to improve early diagnosis performance.
Recent studies have proposed an age estimation framework by training RVM for regression
(RVR) from MRI-based biomarkers of healthy subjects, which was used to estimate the age of
MCI and AD subjects and to recognize faster brain atrophy [20, 21] and to predict the conver-
sion from MCI to AD [22]. Other studies have proposed methods to calculate an MRI-based
AD severity index from cross-sectional [23] and longitudinal studies [24], where multivatiate
models based on OPLSR were built from HC and AD subject data. Models were applied to
MCI subjects for early prediction of conversion to AD through subject classification as either
healthy control-like or as AD-like. Besides the above-mentioned methods, studies have also
applied SVM algorithms to improve prediction quality by selecting the most significant brain
structures or other feature types in HC, MCI and AD subjects [3, 19, 25–29]; and to discrimi-
nate between these subject groups [3, 19, 25–28, 30, 31]. However, in spite of applied multivari-
ate techniques and the features used, all these studies are focused mainly on three classification
experiments: (1) HC vs AD, (2) HC vs MCI and (3) MCI vs AD; where the last one is mainly
directed at discriminating between the stable MCI (sMCI, MCI who had not converted to AD)
vs converted to AD (cAD, subjects who had converted to AD). For HC vs AD, the methods
mentioned achieved high accuracy values (up to 94.9% sensitivity and 96.33% specificity); and
from 78% to 85% on MCI vs AD. However, for the detection of prodromal AD (sMCI vs
cAD), the sensitivity is substantially lower (below 60%) for most methods.
In this study, we aimed to characterize the age-related changes in brain structures and to
identify the variant (vr) and quasi-variant (qvr) MRI biomarkers to build ageing-based null
Early Prediction of Alzheimer’s Disease Using Null Longitudinal Model-Based Classifiers
PLOS ONE | DOI:10.1371/journal.pone.0168011 January 3, 2017 3 / 19

models. Null models were built from identified HC subjects (n = 46) with a normal CSF-pro-
file. Most importantly, we addressed the HC/MCI/AD subject classification and the early pre-
diction of conversion to AD, by using these null models to estimate the age-related values of vrand qvr MRI biomarkers for longitudinal data of HC (n = 161), MCI (n = 209) and AD
(n = 331) subjects. Residuals were then calculated as deviation scores of observed MRI-based
biomarkers from estimated normal MRI-based biomarkers. Support vector machines (SVM)
were used to build residual-based classifiers for three experiments: MCI vs HC, AD vs MCI
and AD vs HC. The advancement for early disease prediction was calculated as the number of
years that the proposed method leads in predicting the last known subject diagnostic. Data
used in this study was obtained from the Alzheimer’s Disease Neuroimaging Initiative (ADNI)
study (adni.loni.usc.edu).
Data
ADNI cohorts
The ADNI was launched in 2003 as a public-private partnership, led by Principal Investigator
Michael W. Weiner, MD. The primary goal of ADNI has been to test whether serial MRI, PET,
other biological markers, and clinical and neuropsychological assessment can be combined to
measure the progression of MCI and AD. For up-to-date information, see www.adni-info.org.
The complete ADNI project enrolled 819 adult subjects, aged 55—90 years, and recruited
from over 50 sites across the United States and Canada. These subjects met entry criteria for a
clinical diagnostic at baseline (see S1 Appendix) of late MCI (LMCI, n = 398), early probable
AD (n = 193) and control normal (CN, n = 229) [32]. ADNI has been used by many number
of publications focused on the characterization of age-related brain changes [6, 33] and the
early prediction of conversion to AD [19, 23, 31, 34, 35]; a recent review has been published by
Weiner and colleagues in Alzheimer & Dementia journal [36]. Details about the procedures
for selection of participants and the full study protocol have been presented in [16, 37]. Also,
details of the acquisition of structural MRIs of the participants can be found in ADNI projectsite (adni.loni.usc.edu).
CSF biomarkers. The ADNI CSF-based biomarkers were measured for Aβ 1 to 42 peptide
(CSF-Aβ), total tau (CSF-τ) and τ phosphorylated at the theorine 181 P-τ181P concentrations
using the xMAP platform (Luminex Corp, Austin, Texas) and INNO-BIA AlzBio3 research-
use-only reagents. Biomarkers analysis applied by ADNI are described in detail at http://adni.
loni.usc.edu/methods/biomarker-analysis/. CSF biomarkers set was conformed by CSF-Aβand CSF-τ, in pg/mL.
MRI-based Biomarkers. MRI-based biomarkers used in this study correspond to mea-
sured of neuro-degeneration available in ADNI at 5 years follow-up. These biomarkers were
obtained with the FreeSurfer image analysis suite (version 5.1.0) developed by Martinos Centerfor Biomedical Imaging and freely available at the “Freesurfer wiki site” (http://surfer.nmr.mgh.
harvard.edu/fswiki). FreeSurfer has been used in several studies dedicated to automatically
obtaining MRI-based measures from whole brain or specific regions to sucessfully predict the
early conversion from MCI to AD subjects [19, 23, 24, 31, 34, 38, 39]. Technical details of the
FreeSurfer processing pipeline have been described in prior publications [40, 41]. Biomarkers
with missing values for most samples were discarded. Likewise, we only included the ones cor-
rectly processed and available for at least two time points. In this sense, we included an unbal-
anced longitudinal data of 166 longitudinal MRI-based biomarkers measured at multiple time
points: baseline, 6, 12, 18, 24, 36, 48 and 60 months. These biomarkers correspond to cortical
volume (CV), cortical thickness average (TA) and the volume estimates of a wide range of sub-
cortical structures (SV).
Early Prediction of Alzheimer’s Disease Using Null Longitudinal Model-Based Classifiers
PLOS ONE | DOI:10.1371/journal.pone.0168011 January 3, 2017 4 / 19
Subjects and inclusion criteria. Participants were selected from original ADNI study if
they met the following criteria (at the time of the study, April, 2015): (1) Had all selected longi-
tudinal MRI images correctly processed (2) Had completed demographic and neuropsycho-
logical data and were clinically diagnosed at each visitation. In total, longitudinal data of 747
subjects (215 CN, 366 LMCI and 166 AD) were studied. Demographic details of the studied
cohort are given in Table in S1 Table. Summaries are grouped by gender and correspond to
baseline stage. It should be noted that just 164 women and 236 men have available measures of
CSF-based biomarkers.
Methods
This study was divided into three main stages: (1) Subject classification, (2) Building the age-
ing-based null models, and (3) Residuals-based early prediction of conversion to MCI/AD and
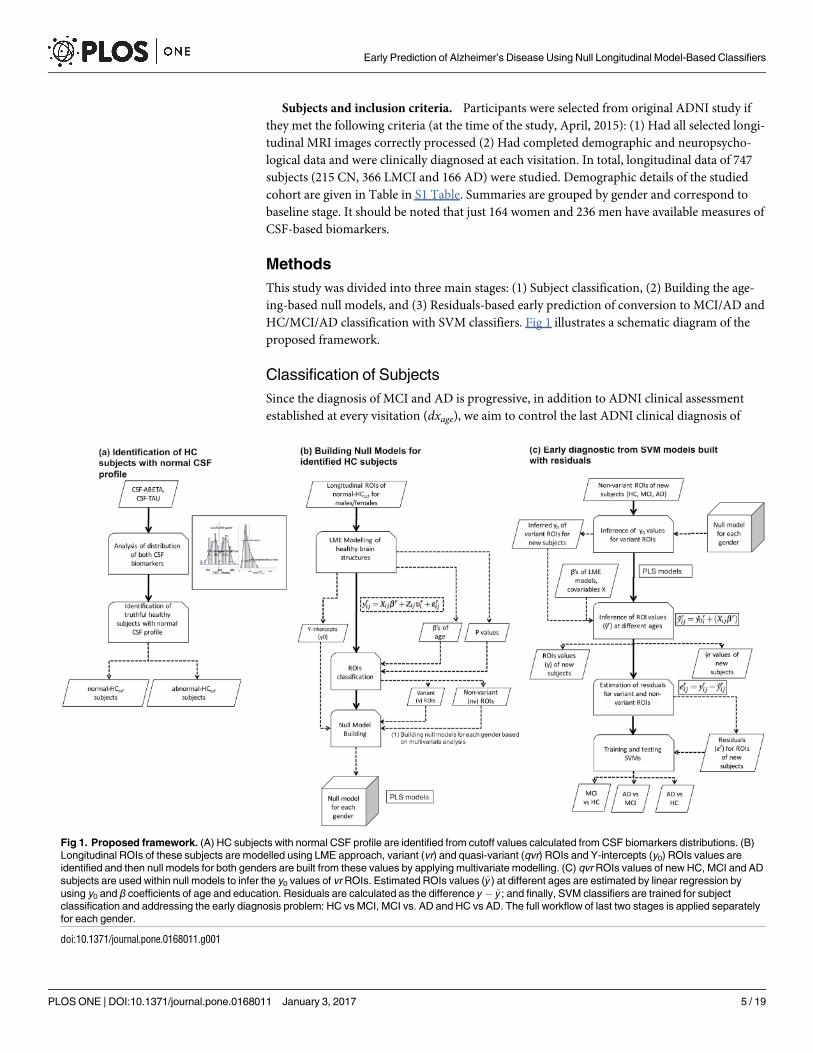
HC/MCI/AD classification with SVM classifiers. Fig 1 illustrates a schematic diagram of the
proposed framework.
Classification of Subjects
Since the diagnosis of MCI and AD is progressive, in addition to ADNI clinical assessment
established at every visitation (dxage), we aim to control the last ADNI clinical diagnosis of
Fig 1. Proposed framework. (A) HC subjects with normal CSF profile are identified from cutoff values calculated from CSF biomarkers distributions. (B)
Longitudinal ROIs of these subjects are modelled using LME approach, variant (vr) and quasi-variant (qvr) ROIs and Y-intercepts (y0) ROIs values are
identified and then null models for both genders are built from these values by applying multivariate modelling. (C) qvr ROIs values of new HC, MCI and AD
subjects are used within null models to infer the y0 values of vr ROIs. Estimated ROIs values (y) at different ages are estimated by linear regression by
using y0 and β coefficients of age and education. Residuals are calculated as the difference y y ; and finally, SVM classifiers are trained for subject
classification and addressing the early diagnosis problem: HC vs MCI, MCI vs. AD and HC vs AD. The full workflow of last two stages is applied separately
for each gender.
doi:10.1371/journal.pone.0168011.g001
Early Prediction of Alzheimer’s Disease Using Null Longitudinal Model-Based Classifiers
PLOS ONE | DOI:10.1371/journal.pone.0168011 January 3, 2017 5 / 19
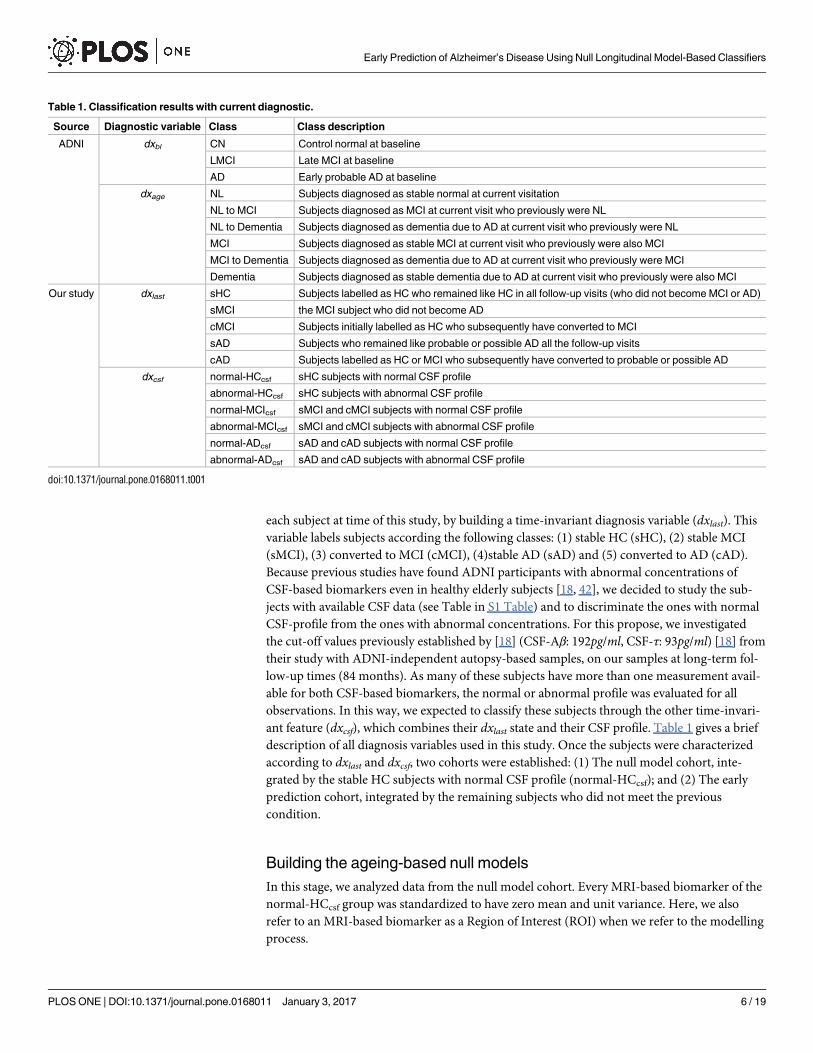
each subject at time of this study, by building a time-invariant diagnosis variable (dxlast). This
variable labels subjects according the following classes: (1) stable HC (sHC), (2) stable MCI
(sMCI), (3) converted to MCI (cMCI), (4)stable AD (sAD) and (5) converted to AD (cAD).
Because previous studies have found ADNI participants with abnormal concentrations of
CSF-based biomarkers even in healthy elderly subjects [18, 42], we decided to study the sub-
jects with available CSF data (see Table in S1 Table) and to discriminate the ones with normal
CSF-profile from the ones with abnormal concentrations. For this propose, we investigated
the cut-off values previously established by [18] (CSF-Aβ: 192pg/ml, CSF-τ: 93pg/ml) [18] from
their study with ADNI-independent autopsy-based samples, on our samples at long-term fol-
low-up times (84 months). As many of these subjects have more than one measurement avail-
able for both CSF-based biomarkers, the normal or abnormal profile was evaluated for all
observations. In this way, we expected to classify these subjects through the other time-invari-
ant feature (dxcsf), which combines their dxlast state and their CSF profile. Table 1 gives a brief
description of all diagnosis variables used in this study. Once the subjects were characterized
according to dxlast and dxcsf, two cohorts were established: (1) The null model cohort, inte-
grated by the stable HC subjects with normal CSF profile (normal-HCcsf); and (2) The early
prediction cohort, integrated by the remaining subjects who did not meet the previous
condition.
Building the ageing-based null models
In this stage, we analyzed data from the null model cohort. Every MRI-based biomarker of the
normal-HCcsf group was standardized to have zero mean and unit variance. Here, we also
refer to an MRI-based biomarker as a Region of Interest (ROI) when we refer to the modelling
process.
Table 1. Classification results with current diagnostic.
Source Diagnostic variable Class Class description
ADNI dxbl CN Control normal at baseline
LMCI Late MCI at baseline
AD Early probable AD at baseline
dxage NL Subjects diagnosed as stable normal at current visitation
NL to MCI Subjects diagnosed as MCI at current visit who previously were NL
NL to Dementia Subjects diagnosed as dementia due to AD at current visit who previously were NL
MCI Subjects diagnosed as stable MCI at current visit who previously were also MCI
MCI to Dementia Subjects diagnosed as dementia due to AD at current visit who previously were MCI
Dementia Subjects diagnosed as stable dementia due to AD at current visit who previously were also MCI
Our study dxlast sHC Subjects labelled as HC who remained like HC in all follow-up visits (who did not become MCI or AD)
sMCI the MCI subject who did not become AD
cMCI Subjects initially labelled as HC who subsequently have converted to MCI
sAD Subjects who remained like probable or possible AD all the follow-up visits
cAD Subjects labelled as HC or MCI who subsequently have converted to probable or possible AD
dxcsf normal-HCcsf sHC subjects with normal CSF profile
abnormal-HCcsf sHC subjects with abnormal CSF profile
normal-MCIcsf sMCI and cMCI subjects with normal CSF profile
abnormal-MCIcsf sMCI and cMCI subjects with abnormal CSF profile
normal-ADcsf sAD and cAD subjects with normal CSF profile
abnormal-ADcsf sAD and cAD subjects with abnormal CSF profile
doi:10.1371/journal.pone.0168011.t001
Early Prediction of Alzheimer’s Disease Using Null Longitudinal Model-Based Classifiers
PLOS ONE | DOI:10.1371/journal.pone.0168011 January 3, 2017 6 / 19

Modelling temporal change in ROIs. To visualize the between-subject and within-
group variabilities on normal-HCcsf, ROIs were represented by quartiles. The change in cor-
tical and subcortical brain regions over 5 years was calculated by applying the LME approach
for every ROI. The subject age (age) at each observation and the years of education (educ)were included as covariates in all models. Because we hypothesize that there are important
individual-level effects and believe that subjects have similar rates of change over time, we
fitted random intercepts LME models. In this type of model, the measured value of ROI rdefined as yij is assumed to have a set of parameters β, fixed across subjects. In addition, for
each individual i, a set of random parameters υi is assigned that models the deviation from
the fixed effect β. For i = 1, . . ., n, each model reads as follows:
yrij ¼ Xijbrþ Ziju
ri þ
rij ð1Þ
where, yrij is the standardized value of ROI r measured for the ith subject in the jth observation;
i = 1, . . ., n subjects, j = 1, . . ., ni available observations for subject i and r = 1, . . ., nr, nr = 166
ROIs. Xij is a ni x p design matrix, where p is the number of covariates (age, educ and the con-
stant term of 1’s) on the jth observation of ith subject. βr is the p x 1 vector of unknown fixed
effects or regressor’s coefficients, which are: br1
(coefficient for constant term or Intercept), bra
(coefficient for age) and bre (coefficient for educ). Zij is a known design matrix of size ni x q,
where q is the number of random effects for the jth observation of subject i. uri is the q × 1 vec-
tor of unknown random effects coefficients *Nq(0, ψ) for subject i measured for ROI r. rij is
the ni x1 residual vector of errors *Nni(0, σ2 λi) for the jth observation in subject i measured
for ROI k. ψ is the q × q covariance matrix for the random effects. 0, σ2 λi is the ni x ni covari-
ance matrix for the errors in subject i.LME modelling was performed using the lme4 package available for R [43]. See S1 Appendix
for further detail of the specific LME approach.
Identification of variant and quasi-variant ROIs. The predictor estimates of LME mod-
els were interpreted the same way as the coefficients from a traditional regression. For
instance, a one year increase in the regressor age corresponded to the effect of age (βa) increase
or decrease in the outcome. Taking into account the βa’s, we classified as variant (vr) ROIs the
ones that had both an annual change greater than 1% on ROI standard deviation and a signifi-
cant change at p-values 0.05. The ROIs with annual change less than or equal to 1% were
considered as quasi-variant (qvr), where all of these did not have a significant change.
Inference of variant ROIs y-intercept values from quasi-variant ROIs. The Y-intercept
value (y0) from each ROI, which represents the subject-specific ROIs measure at basal stage
(age = 0), was directly obtained from all LME models. We assumed that for healthy elderly
people, the qvr ROIs values remains basically the same along time, even at basal stage, which
is not true in the vr. We also assumed there are a strong correlation between the y0 set of
both ROI types. Therefore, we built the HC null model based on the Partial Least Squares
Regression (PLSR) algorithm [44] to infer the set of y0’s for vr ROIs in function of the set of
y0’s for qvr ROIs. PLSR is a linear algorithm particularly useful to analyze data with strongly
collinear (correlated), noisy, and numerous predictors variables, and also simultaneously
model several response variables [45]. There are several algorithms proposed to implement
the PLSR model. In this study, we use the kernel algorithm [46] available in the pls package
available for R [47]. To determine the optimal number of components to take into account,
it was used leave-one-out (LOO) cross-validation method available in this package. LOO cal-
culates potential models excluding one observation at a time. See S1 Appendix for a short
PLSR description.
Early Prediction of Alzheimer’s Disease Using Null Longitudinal Model-Based Classifiers
PLOS ONE | DOI:10.1371/journal.pone.0168011 January 3, 2017 7 / 19

Early disease prediction based on residuals
In this stage, we addressed the subject classification and early disease prediction problems
using data from the early prediction cohort (HC, MCI and AD), unused in the previous stage.
ROIs of these subjects were standardized according to the mean and standard deviation of the
null model cohort.
Inference of age-associated ROIs values for new subjects. For each subject, the y0’s of vrROIs were inferred from the y0’s of qvr ROIs using the same PLSR model described in previous
section. Once the y0 set for both ROIs types was completed, we used these values in combina-
tion with the vector of coefficients β, see Eq (1) and the observed covariates (age and educ), to
infer the expected values of each ROI (y ij) according to Eq (2). Here,the inferred value repre-
sents the value that should measure the ROI at age 6¼ 0 whether the subject is healthy or not.
yrij ¼ y0
ri þ ðXijb
rÞ ð2Þ
where y rij represents the inferred or predicted value of the rth ROI variant on the jth observation
for the ith subject. Xij is the design matrix with observed covariates at age 6¼ 0 without the con-
stant term. βr is the vector of calculated fixed effects of ROI r obtained from its LME model,
according Eq (1).
Computing the residuals of variant ROIs. In order to get a meaningful deviation value
of ROIs from an inferred healthy subject-specific trend, the difference between the estimated
(y) and the true (y) ROIs values, here called residual (e), was computed. The residuals erij for
each ROI were calculated as following:
erij ¼ yrij yrij ð3Þ
where yij and y ij are the observed and inferred values, respectively, for each ROI r measured on
the ith subject in the jth observation. The e’s for all ROIs were stored in a matrix E.
In S1 Appendix we describe a hypothetical example of how we have used the LME and
PLSR approaches to infer the ROI values at basal stage and over time; and finally, the residuals.
Diagnosis prediction using Support Vector Machines. In this stage, we used the matrix
of residuals E to address two problems. The first one was focused on the subject classification,
where the vector of class labels, used as the outcome, was the diagnostics at the time of the
visit, dxage (Table 1). The second problem was the early disease prediction, here, we trained a
classifier that predicts the future diagnosis of the subjects given their current clinical tests, i.e.
what is the expected diagnostic of the subject some years after the current visit. The vector of
class labels used to train this classifier was dxlast (Table 1). In this case, as the feature set used
was obtained in previous visits of the subject, the classifier learns to predict the future outcome
of a subject, given his present state.
For both problems, we performed three experiments focused on the binary classification
problems: (1) HC vs AD, (2) HC vs MCI and (3) MCI vs AD. The MCI vs AD experiment in
the early prediction problem was focused on addressing the problem of prodromal stage of
AD, by comparing the sMCI (stable MCI over all visitations) with the subject initially diag-
nosed as MCI who became to AD over time (cAD). Likewise, for each problem, two configura-
tions of the feature set have been tested. Let Ev be the subset of matrix E where only the
columns of either the vr ROIs or the qvr ROIs whose residuals are different from zero were
included. The first feature set used in each experiment, F1, included the residuals from matrix
Ev plus the age (age of the subject at the time of the visit). The second feature set used, F2,
includes the information in F1 together with the results from the CDR global score (CDRGLO-
BAL) and MMSE tests. The goal of testing two training sets was to assess the influence of the
Early Prediction of Alzheimer’s Disease Using Null Longitudinal Model-Based Classifiers
PLOS ONE | DOI:10.1371/journal.pone.0168011 January 3, 2017 8 / 19
neuropsychological tests in the quality of diagnostic as opposed to the use of ROI residuals
with age only.
The classification method used to carry out each experiment is a Support Vector Machine
(SVM), configured with a Gaussian radial kernel and a misclassification cost parameter C = 1.
Each experiment has been evaluated using a ten-fold cross validation with a specific constraint:
as ADNI is a longitudinal database, there may be multiple samples per subject (multiple visits).
The subjects were assigned to either the training or the test subsets, in order to perform a fair
evaluation. On each cross validation run, 60% of the subjects weren assigned to the training
subset and the remaining 40% to the test subset.
Because, it is known that the rate of atrophy increases with age, for studying the develop-
ment of our method for early disease prediction, SVM classifiers were built on age groups. The
ADNI data used to evaluate the classification for males and females are summarized in tables
in S2 and S3 Tables, respectively. These tables provide demographic information and the num-
ber of measurements and diagnoses by each age group.
Since previous studies have suggested that there are gender differences in brain atrophy
with aging [8, 9, 48–50], the full workflow in building null models and early diagnostic from
SVM models was applied separately for each gender.
Results
Healthy elderly subjects with normal CSF profile
Analysis of CSF-Aβ and CSF-τ biomarkers showed us that their distributions were not normal
for all diagnosis groups (see figure in S2 Fig). A bimodal distribution was observed in CSF-Aβlevels within each diagnosis group. CSF-τ values in CN group showed a unimodal normal dis-
tribution. We confirmed cut-off values determined by [18], classifying as normal the CSF pro-
file of subjects who fulfilled both conditions: CSF-Aβ> = 192pg/ml and CSF-τ 93pg/ml.From CSF profiles, we identified 46 normal-HCcsf, 33 normal-MCIcsf, 11 normal-ADcsf, 63
abnormal-HCcsf, 75 abnormal-MCIcsf and 172 non-ADcsf subjects. Figure in S3 Fig shows CSF-
τ concentration versus CSF-Aβ concentration for these six groups, where the blue dots repre-
sent the HC subjects with normal CSF profile used to build the null models for men and
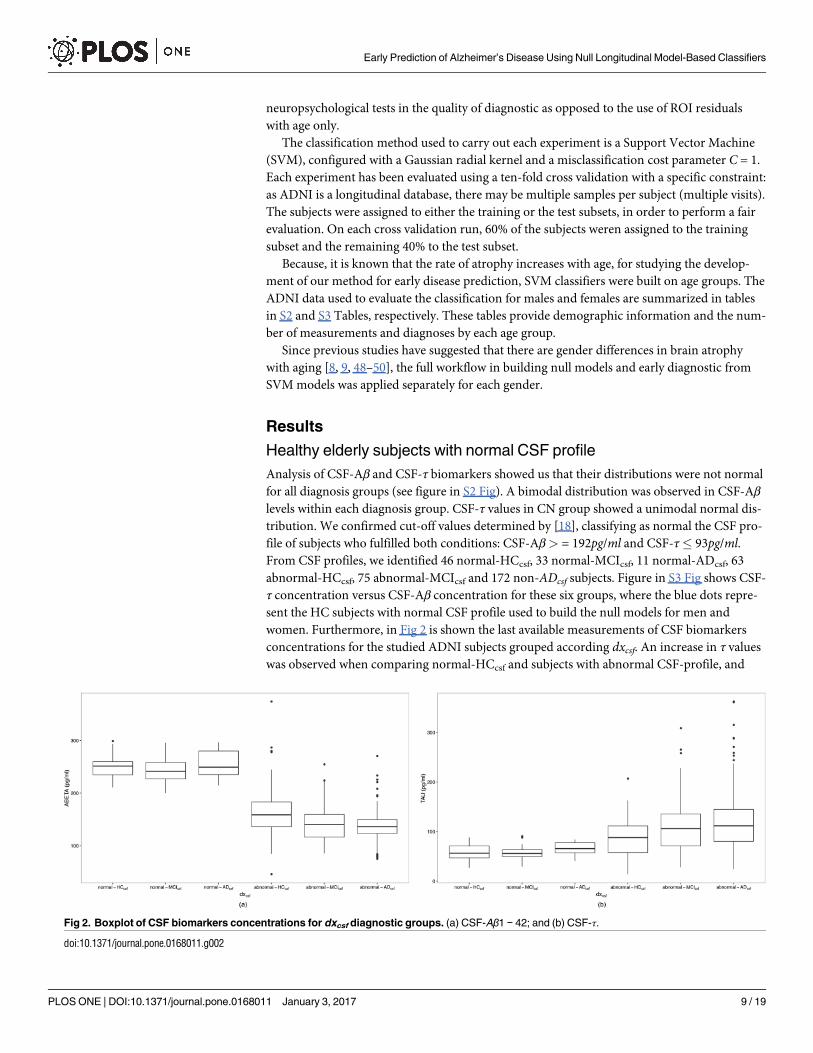
women. Furthermore, in Fig 2 is shown the last available measurements of CSF biomarkers
concentrations for the studied ADNI subjects grouped according dxcsf. An increase in τ values
was observed when comparing normal-HCcsf and subjects with abnormal CSF-profile, and
Fig 2. Boxplot of CSF biomarkers concentrations for dxcsf diagnostic groups. (a) CSF-Aβ1 − 42; and (b) CSF-τ.
doi:10.1371/journal.pone.0168011.g002
Early Prediction of Alzheimer’s Disease Using Null Longitudinal Model-Based Classifiers
PLOS ONE | DOI:10.1371/journal.pone.0168011 January 3, 2017 9 / 19

when comparing abnormal-HCcsf with MCI and AD subjects with abnormal profile. With
respect to Aβ levels, we observed a reduction of levels when comparing normal-HCcsf with
abnormal-HCcsf and the remaining groups with abnormal profile.
In total, 226 samples were available for the 46 normal-HCcsf subjects (males: 22, females:
24). Table 2 provides their demographic information at baseline. Age, education and MMSE
scores were similar across gender, but CSF concentrations and CDRGLOBAL were different
between men and women. Furthermore, only three subjects (2 males and 1 female) were carri-
ers of APOE-4 at allele 1. More detail of demographic and cognitive measures are given in S1
Appendix.
Ageing-based variant (vr) and quasi-variant (qvr) ROIs
A study of within-subject and between-subject variabilities, using the box plots representation,
showed us that there are significant between-subject variability and strong gender effect for
several ROIs; for example, the left hippocampal volume (see Figure in S4 Fig). However, for
other ROIs their change was not very evident. From LME modelling, we identified 97 vr ROIs
for males and 109 vr ROIs for females. Regarding quasi-variant ROIs, we found 69 qvr for
males and 57 qvr for females. The figure in S5 Fig shows examples of fitted LME models for
both types of ROIs within each gender. In a similar way to these examples, the βa’s of the
remaining vr ROIs were observed as being close to zero, but for qvr ROIs, their slopes were
not. The figure in S6 Fig shows the summary of ageing-associated differences of biomarkers in
men and women. The results suggest important ageing-related reductions in neocortical and
subcortical regions and ventricular expansion, with several gender-specific significances.
Reductions are observed in the most of cortical volumes and cortical thickness, where men
and women showed a similar degree of global thinning. Some of these regions showed promi-
nent atrophy while others showed a more conservative change; for example, the entorhinal vol-
ume was observed to be significantly reduced in females but not in males. In relation to the
subcortical regions, we observed several gender-specific differences, some of these are: signifi-
cant volumetric reductions in both hemispheres of hippocampal volume for both males and
females; ventricular expansion in both genders, but just the change of fourth ventricle volume
Table 2. Baseline statistical descriptors of HC subjects selected for null models building.
Female Male
N = 24 N = 22
age 71.2 75.1 77.7 (74.7± 5.3) 70.4 71.8 74.0 (72.7± 6.0)
education 65.0 70.0 80.0 (0.73± 0.09) 70.0 82.5 90.0 (0.81±0.15)
APOE-4
0 95.8% 23
2490.9% 20
22
1 4.2% 1
249.1% 2
22
MMSE 29.0 29.0 30.0 (29.25± 0.67) 28.0 29.0 30.0 (28.54± 1.50)
CDRGLOBAL
0 100% 24
2482% 18
22
0.5 0% 0
2418% 4
22
CSF-Aβ 234.9 248.5 256.0 (247.23± 20.14) 235.0 257.9 268.2 (253.22± 21.69)
CSF-τ 47.9 55.260.9 (55.41± 15.10) 47.0 59.9 73.8 (59.84± 16.83)
Values of continuous variables are represented by the lower, the median and the upper quartiles; and the
mean± standard deviation in parentheses.
doi:10.1371/journal.pone.0168011.t002
Early Prediction of Alzheimer’s Disease Using Null Longitudinal Model-Based Classifiers
PLOS ONE | DOI:10.1371/journal.pone.0168011 January 3, 2017 10 / 19
was not significant; the volume of the optic chiasm region was significantly increased in
females, but it was not significant in males; a reduction in amygdala volume was significant in
both hemispheres of the male brain but it was not significant in females; and, in general, the
volume of bilateral corpus callosum regions are observed as thinned, but without significant
differences between the genders.
Subject classification based on ROI residuals
The table in S4 Fig shows the average prediction accuracy (ACC), sensitivity (SEN) and speci-
ficity (SPE) of the test for both the F1 and F2 training set configurations. Although the perfor-
mance of models with the F2 set was the best for all cases, the experiments performed on the F1
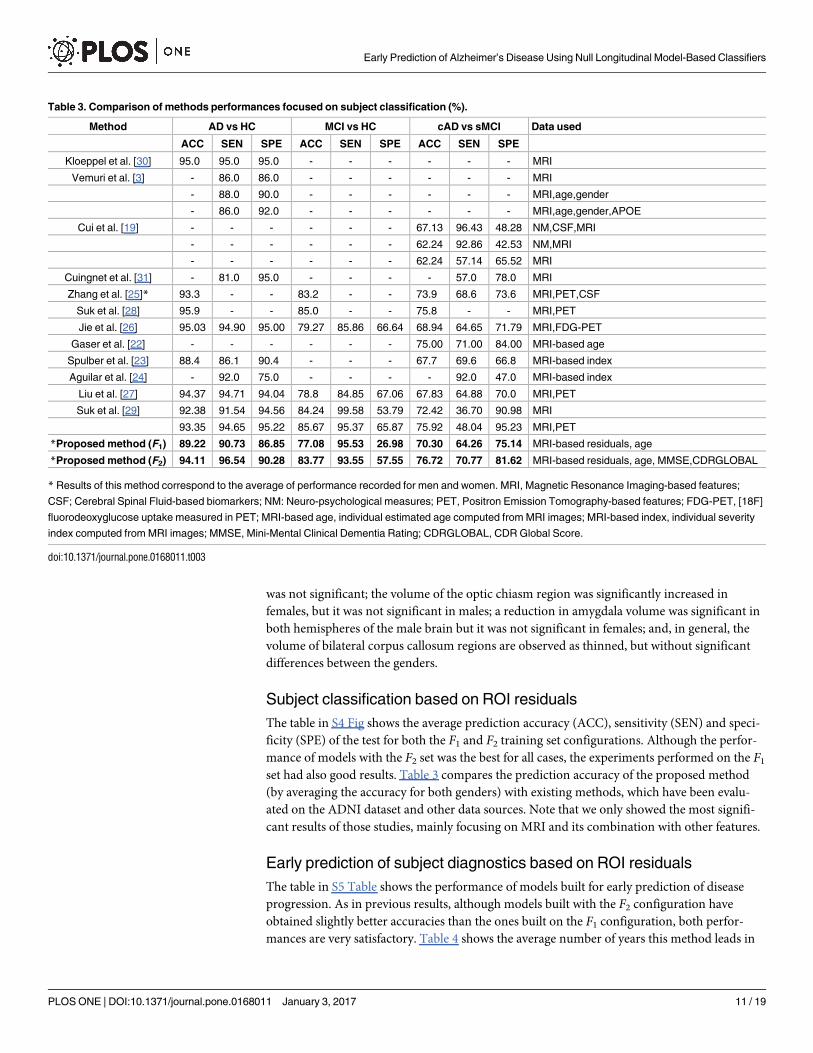
set had also good results. Table 3 compares the prediction accuracy of the proposed method
(by averaging the accuracy for both genders) with existing methods, which have been evalu-
ated on the ADNI dataset and other data sources. Note that we only showed the most signifi-
cant results of those studies, mainly focusing on MRI and its combination with other features.
Early prediction of subject diagnostics based on ROI residuals
The table in S5 Table shows the performance of models built for early prediction of disease
progression. As in previous results, although models built with the F2 configuration have
obtained slightly better accuracies than the ones built on the F1 configuration, both perfor-
mances are very satisfactory. Table 4 shows the average number of years this method leads in
Table 3. Comparison of methods performances focused on subject classification (%).
Method AD vs HC MCI vs HC cAD vs sMCI Data used
ACC SEN SPE ACC SEN SPE ACC SEN SPE
Kloeppel et al. [30] 95.0 95.0 95.0 - - - - - - MRI
Vemuri et al. [3] - 86.0 86.0 - - - - - - MRI
- 88.0 90.0 - - - - - - MRI,age,gender
- 86.0 92.0 - - - - - - MRI,age,gender,APOE
Cui et al. [19] - - - - - - 67.13 96.43 48.28 NM,CSF,MRI
- - - - - - 62.24 92.86 42.53 NM,MRI
- - - - - - 62.24 57.14 65.52 MRI
Cuingnet et al. [31] - 81.0 95.0 - - - - 57.0 78.0 MRI
Zhang et al. [25]* 93.3 - - 83.2 - - 73.9 68.6 73.6 MRI,PET,CSF
Suk et al. [28] 95.9 - - 85.0 - - 75.8 - - MRI,PET
Jie et al. [26] 95.03 94.90 95.00 79.27 85.86 66.64 68.94 64.65 71.79 MRI,FDG-PET
Gaser et al. [22] - - - - - - 75.00 71.00 84.00 MRI-based age
Spulber et al. [23] 88.4 86.1 90.4 - - - 67.7 69.6 66.8 MRI-based index
Aguilar et al. [24] - 92.0 75.0 - - - - 92.0 47.0 MRI-based index
Liu et al. [27] 94.37 94.71 94.04 78.8 84.85 67.06 67.83 64.88 70.0 MRI,PET
Suk et al. [29] 92.38 91.54 94.56 84.24 99.58 53.79 72.42 36.70 90.98 MRI
93.35 94.65 95.22 85.67 95.37 65.87 75.92 48.04 95.23 MRI,PET
*Proposed method (F1) 89.22 90.73 86.85 77.08 95.53 26.98 70.30 64.26 75.14 MRI-based residuals, age
*Proposed method (F2) 94.11 96.54 90.28 83.77 93.55 57.55 76.72 70.77 81.62 MRI-based residuals, age, MMSE,CDRGLOBAL
* Results of this method correspond to the average of performance recorded for men and women. MRI, Magnetic Resonance Imaging-based features;
CSF; Cerebral Spinal Fluid-based biomarkers; NM: Neuro-psychological measures; PET, Positron Emission Tomography-based features; FDG-PET, [18F]
fluorodeoxyglucose uptake measured in PET; MRI-based age, individual estimated age computed from MRI images; MRI-based index, individual severity
index computed from MRI images; MMSE, Mini-Mental Clinical Dementia Rating; CDRGLOBAL, CDR Global Score.
doi:10.1371/journal.pone.0168011.t003
Early Prediction of Alzheimer’s Disease Using Null Longitudinal Model-Based Classifiers
PLOS ONE | DOI:10.1371/journal.pone.0168011 January 3, 2017 11 / 19

predicting the subject diagnosis. This advancement in the prediction was only possible in sub-
jects whose dxage (diagnostic at each visitation) was different from their dxlast diagnosis (last
known diagnostic). Therefore, only these subjects were taken into account and some age
groups lack enough data to be shown in this table. For females, the prediction of conversion
from MCI to AD was up to 1.9 years earlier (60–64 age group); and for males, up to 1.73 years
earlier (80–84 age group). However, the greatest lead was obtained in the early prediction from
HC to MCI in females, this being 2.89 years earlier.
Along with the time advancement in the prediction, Table 4 also shows the average predic-
tion accuracy for that differential diagnostic stratified by gender and age group. Note that dif-
ferences between accuracies of Tables 3 and 4 are due to the last one included a few samples,
namely those that fit the conditions of five-year age group stratification and whose last known
diagnostic differs from the diagnostic at the time of the test in the given age group.
Discussion and Conclusions
This study has presented a framework for building ageing-associated null models from longi-
tudinal MRI-based biomarkers, as well as subject classification and early diagnosis from resid-
uals calculated through these null models.
Analysis of CSF biomarkers distributions allowed us to confirm the cut-offs values estab-
lished by [18] and to establish criteria for CSF profiling. We found subjects clinically diagnosed
as CN at baseline with abnormal CSF profile, which is consistent with previous studies where
the presence of possible AD pathology has been found in ADNI control subjects [18, 51, 52].
These findings may be because ADNI subject diagnosis is made independently of the CSF bio-
markers values (see S1 Appendix).
We modelled the longitudinal change of an extensive set of MRI-based biomarkers
obtained from cortical and subcortical regions. Studies have shown that early diagnosis meth-
ods using the whole brain or the whole cortex reached higher specificity (over 90%) than those
based on the specific regions like the hippocampus (from 63% to 84%) [31, 53, 54]. LME
modelling allowed to classify biomarkers as variant or quasi-variant ROIs, and to build null
models for ageing-related changes in men and women. As in previous studies [6, 8, 9], our
results (see Figure in S6 Fig) show that part of these changes occur in brain areas related with
AD. We found reductions for most thickness and volume biomarkers of cortical regions [8] in
both genders. Similar changes were also found in subcortical regions including the greater
atrophy in the hippocampus and regions of the corpus callosum.
Null models were carried out by making assumptions of correlation between the y-inter-
cepts values (at basal stage) of variant and quasi-variant ROIs, where the first ones were
explained in function of last ones using PLSR. By using these null models and LME β
Table 4. Last known diagnostic prediction advancement.
Advancement for early prediction in years
Experiment 60–64 yrs. 65–69 yrs. 70–74 yrs. 75–79 yrs. 80–84 yrs. 85–89 yrs.
Females AD vs HC 1.772 (85.73) 1.596(86.05) 1.335(86.79) 1.745(88.93) 1.523(90.21) 1.245(89.67)
MCI vs HC N/A N/A 2.888(74.42) 2.071(76.08) 2.381(78.40) N/A
AD vs MCI 1.982(69.23) 1.539(70.04) 1.307(69.55) 1.751(71.37) 1.509(72.41) 1.433(71.28)
Males AD vs HC 1.232(84.27) 1.801(85.30) 1.667(86.91) 1.327(87.75) 1.775(89.44) 1.006(89.52)
MCI vs HC 1.257(72.47) N/A 1.739(77.29) 2.529(78.32) 2.686(78.59) 1.439(79.81)
AD vs MCI 1.448(68.95) 1.697(69.44) 1.679(70.22) 1.372(71.18) 1.733(73.46) 1.011(73.06)
N/A means there are not enough samples in the age interval for binary classification. (ACC) represents the prediction accuracy of F2 method in %
doi:10.1371/journal.pone.0168011.t004
Early Prediction of Alzheimer’s Disease Using Null Longitudinal Model-Based Classifiers
PLOS ONE | DOI:10.1371/journal.pone.0168011 January 3, 2017 12 / 19
coefficients, we calculated residuals, which were established as differences between the
observed ROIs and age-related inferred ROIs. These residuals were computed for new cohort
of HC, MCI and subjects; and used for training and testing SVM models to address subject
classification and early disease prediction.
As of the date of this study, we were unable to find studies where ageing-related null models
and residuals-based classifiers were applied to early diagnosis. The performance obtained in all
experiments suggests that the proposed method of obtaining the ROI residuals and their use to
train SVM predictors is useful to support the early diagnosis problem, the fundamental chal-
lenge in AD research. LME modelling of MRI-based biomarkers was only applied by fitting
age and years of education, but future work could assess the impact of different available fea-
ture types such as other functional neuroimaging biomarkers, genetic factors, biological mark-
ers and other clinical and neuropsychological assessment.
The main contributions of the residual-based classifier presented in this paper are: (a) From
a longitudinal study of 5 years follow-up, the ability to predict the future diagnostic of the sub-
jects up to 2.88 years earlier than the standard clinical procedure. (b) Use of relatively common
clinical tests such as MRI and neuropsychological tests, as opposed to methods that rely on
more expensive or invasive tests such as PET-based, CSF-based and Genotype-based biomark-
ers. (c) HC vs AD: highest sensitivity among the state of the art methods; a classification accu-
racy of 94%, higher than all MRI-only methods except for [30]. (d) sMCI vs cAD: highest
classification accuracy among the state of the art methods. (e) In most experiments, the sensi-
tivity (the ability of a predictor to correctly classify a subject as ‘diseased’) was higher than the
specificity (the ability of predictor to correctly classify a subject as ‘disease-free’). This may be
due to the fact that ADNI clinical diagnosis is based on neuro-psychological tests, but neurode-
generation occurs many years before the onset of clinical symptoms. Possibly, residual-based
SVM predictors may determine that subjects are into early stages of disease (MCI and prodro-
mal AD) but this finding is not consistent with clinical diagnosis because the subject does not
yet present clinical symptoms. Abnormalities of CSF profile observed on several subjects diag-
nosed as HC and MCI (see Figure in S3 Fig) may support this hypothesis.
The use of MMSE and CDRGLOBAL tests (F2 method) yields significantly better results
than using the residuals alone (F1 method). These are two of the most common neuropsycho-
logical tests routinely applied to patients in the primary clinical practice. However this should
not be seen as a mere contribution of MMSE and CDRGLOBAL, as these tests on their own
have several limitations such as relatively low specificity and reliability. However, they comple-
ment and enhance the present method here without adding a significant cost or invasive clini-
cal tests.
Despite promising results, there are several limitations to our study. Firstly, data used here
correspond to research participants, who meet the inclusion and exclusion criteria established
by ADNI, and thus are not from general population. Secondly, the available observations of
CSF biomarkers do not correspond in number or time points with the available MRI-based
observations. In most cases we had just CSF values at the baseline stage, so it is impossible to
track the reliability of CSF profile at the final stages. Due to this, it is important to emphasize
that subject classifications based on CSF profile are applicable to the ADNI study subjects, but
not necessarily to individuals in other settings. Thirdly, like CSF biomarkers, we had substan-
tial missing data for MRI-based biomarkers measured for 46 HC subjects during the
60-month follow-up period. Although a LME approach can handle missing time points within
individuals, this issue may limit our ability to make inferences about the age-related changes in
these biomarkers. Finally, the proposed methodology to obtain a null model of healthy elderly
people is still at the early stages of the development and evaluation process, it is necessary to
test the null model in populations different from those used in model development.
Early Prediction of Alzheimer’s Disease Using Null Longitudinal Model-Based Classifiers
PLOS ONE | DOI:10.1371/journal.pone.0168011 January 3, 2017 13 / 19
Supporting Information
S1 Appendix. Brief Data and Methods Description.
(PDF)
S1 Fig. Example of LME modelling for hypothetical variant (vr) and quasi-variant(qvr)ROIs. HC and AD are hypothetical subjects. P1, P2 and P3 are observations of each ROI y at
three different ages (a1, a2 and a3). Black lines, healthy population regression line calculated
from LME. y0, vertical y-intercept value of healthy population. Blue and red lines, individual
regression lines estimated by assuming both as healthful. Points P1, P2 and P3, inferred y ’s for
the three ages.yHC0and yAD0
, the subject-specific y-intercepts estimated for HC and AD sub-
jects, respectively. yHC0and yAD0
of vr ROI are inferred from the yHC0and yAD0
of qvr ROI
through PLSR model. βa, slope or rate change of standard deviation of ROI per unit of age.
HC1, HC2, HC3, AD1, AD2 and AD3, the residuals of each observation with respect to the esti-
mated individual regression lines.
(PDF)
S2 Fig. Distribution of CSF-based biomarkers at follow-up 84 months. (a) CSF-Aβ. (b)
CSF-τ.4: 8 of 113 CN subjects were converted to MCI and 1 CN subject was converted to
AD. : 88 of 94 LMCI were converted to AD and 5 were re-converted to HC at follow-up visits.
Dotted vertical lines within each diagnosis are the determined cutoff concentrations.
Figure shows us that several subjects with abnormal CSF profile classified as CN by ADNI at
baseline clinical assessment were converted to MCI or AD (triangle dots) along time. Likewise,
some subjects classified like ‘LMCI’ by ADNI were converted to AD later (open circles).
(PDF)
S3 Fig. CSF-Aβ vs. CSF-τ concentration available at last subject’s observations. Dots repre-
sent the last CSF biomarker measured for subjects available at April, 2015. Vertical and hori-
zontal dashed lines split normal CSF-profile from abnormal profile. Null models for
characterization of healthy brain structures were built from samples labelled with blue dots.
(PDF)
S4 Fig. Boxplot of trajectory of left hippocampal volume for normal-HCcsf subjects. High
between-subject variability is evident, e.g., by comparing subject 099_S_0533 with subject
133_S_0488. Likewise, there is a strong indication of gender effect over hippocampal volume,
female volumes are less than the male ones. Note that we standarized every MRI-based bio-
marker to have zero mean and unit variance.
(PDF)
S5 Fig. Examples of variant and quasi-variant ROIs per normal-HCcsf subjects stratified by
gender. (a) Left hippocampal volume classified as variant (vr) ROI; where the slope of trajecto-
ries is not close to zero. (b) Left caudate volume classified as quasi-variant (qvr) ROI; where
the slope of trajectories is close to zero. Note that for both regions, the y-intercept values vary
between subjects, but the slope value of each ROI is the same for all subjects.
(PDF)
S6 Fig. Characterization of ageing-based variant (vr) and quasi-variant (qvr) ROIs. (a)
Males. (b) Females. Biomarkers are coloured according their change type: blue for vr regions
and red for the qvr ones. The size of biomarkers with significant P-value 0.05 are bigger
than the not significant. Dotted vertical lines separate the increased biomarkers (positive beta
values) from the reduced ones (negative beta values). ROIs are represented according to their
location into brain hemisphere (lh:left, rh: right or bilateral). SV: Subcortical Volume, CV:
Early Prediction of Alzheimer’s Disease Using Null Longitudinal Model-Based Classifiers
PLOS ONE | DOI:10.1371/journal.pone.0168011 January 3, 2017 14 / 19
Cortical volume, SA: Surface Area. lh: left hemisphere. rh: right hemisphere.
(PDF)
S1 Table. Statistical descriptors of studied ADNI cohort at baseline.
(PDF)
S2 Table. Statistical descriptors of males used to build the SVM.
(PDF)
S3 Table. Statistical descriptors of females used to build the SVM.
(PDF)
S4 Table. Performances of classification for current diagnostic.
(PDF)
S5 Table. Performances of classification for last known diagnostic.
(PDF)
Acknowledgments
Data collection and sharing for this project was funded by the Alzheimer’s Disease Neuroim-
aging Initiative (ADNI) (National Institutes of Health Grant U01 AG024904) and DOD ADNI
(Department of Defense award number W81XWH-12-2-0012). Data used in preparation of
this article were obtained from the ADNI (adni.loni.usc.edu). As such, the investigators within
the ADNI contributed to the design and implementation of ADNI and/or provided data but
did not participate in analysis or writing of this report. A complete listing of ADNI investiga-
tors can be found at: http://adni.loni.usc.edu/wp-content/uploads/how_to_apply/ADNI_
Acknowledgement_List.pdf. ADNI is funded by the National Institute on Aging, the National
Institute of Biomedical Imaging and Bioengineering, and through generous contributions
from the following: AbbVie, Alzheimer’s Association; Alzheimer’s Drug Discovery Founda-
tion; Araclon Biotech; BioClinica, Inc.; Biogen; Bristol-Myers Squibb Company; CereSpir,
Inc.; Cogstate; Eisai Inc.; Elan Pharmaceuticals, Inc.; Eli Lilly and Company; EuroImmun; F.
Hoffmann-La Roche Ltd and its affiliated company Genentech, Inc.; Fujirebio; GE Healthcare;
IXICO Ltd.; Janssen Alzheimer Immunotherapy Research & Development, LLC.; Johnson &
Johnson Pharmaceutical Research & Development LLC.; Lumosity; Lundbeck; Merck & Co.,
Inc.; Meso Scale Diagnostics, LLC.; NeuroRx Research; Neurotrack Technologies; Novartis
Pharmaceuticals Corporation; Pfizer Inc.; Piramal Imaging; Servier; Takeda Pharmaceutical
Company; and Transition Therapeutics. The Canadian Institutes of Health Research is provid-
ing funds to support ADNI clinical sites in Canada. Private sector contributions are facilitated
by the Foundation for the National Institutes of Health (www.fnih.org). The grantee organiza-
tion is the Northern California Institute for Research and Education, and the study is coordi-
nated by the Alzheimer’s Therapeutic Research Institute at the University of Southern
California. ADNI data are disseminated by the Laboratory for Neuro Imaging at the University
of Southern California.
Author Contributions
Conceptualization: AP GG SK.
Data curation: GG.
Formal analysis: AP GG SK.
Funding acquisition: AP.
Early Prediction of Alzheimer’s Disease Using Null Longitudinal Model-Based Classifiers
PLOS ONE | DOI:10.1371/journal.pone.0168011 January 3, 2017 15 / 19
Investigation: AP GG SK MM.
Methodology: AP GG SK.
Project administration: AP GG SK.
Resources: AP GG SK.
Software: GG SK.
Supervision: AP MM.
Validation: GG SK.
Visualization: GG SK.
Writing – original draft: AP GG SK MM.
Writing – review & editing: AP GG SK MM.
References1. Jack CR, Knopman DS, Jagust WJ, Shaw LM, Aisen PS, Weiner MW, et al. Hypothetical model of
dynamic biomarkers of the Alzheimer’s pathological cascade. Lancet Neurol. 2010 Jan; 9(1):119–128.
Available from: http://dx.doi.org/10.1016/S1474-4422(09)70299-6. PMID: 20083042
2. Dubois B, Hampel H, Feldman HH, Scheltens P, Aisen P, Andrieu S, et al. Preclinical Alzheimer’s dis-
ease: Definition, natural history, and diagnostic criteria; 2016. doi: 10.1016/j.jalz.2016.02.002 PMID:
27012484
3. Vemuri P, Gunter JL, Senjem ML, Whitwell JL, Kantarci K, Knopman DS, et al. Alzheimer’s disease
diagnosis in individual subjects using structural MR images: validation studies. Neuroimage. 2008 Feb;
39(3):1186–1197. Available from: http://dx.doi.org/10.1016/j.neuroimage.2007.09.073. PMID:
18054253
4. Frisoni GB, Fox NC, Jack CR, Scheltens P, Thompson PM. The clinical use of structural MRI in Alzhei-
mer disease. Nature reviews Neurology. 2010; 6(2):67–77. Available from: http://www.nature.com.
ezproxy.usc.edu.au:2048/nrneurol/journal/v6/n2/full/nrneurol.2009.215.html. doi: 10.1038/nrneurol.
2009.215 PMID: 20139996
5. Saykin AJ, Shen L, Foroud TM, Potkin SG, Swaminathan S, Kim S, et al. Alzheimer’s Disease Neuroim-
aging Initiative biomarkers as quantitative phenotypes: Genetics core aims, progress, and plans. Alzhei-
mer’s & dementia: the journal of the Alzheimer’s Association. 2010 may; 6(3):265–73. Available from:
http://www.pubmedcentral.nih.gov/articlerender.fcgi?artid=2868595&tool=pmcentrez&rendertype=
abstract. doi: 10.1016/j.jalz.2010.03.013 PMID: 20451875
6. Fjell AM, Walhovd KB, Fennema-Notestine C, McEvoy LK, Hagler DJ, Holland D, et al. One-year brain
atrophy evident in healthy aging. J Neurosci. 2009 Dec; 29(48):15223–15231. Available from: http://dx.
doi.org/10.1523/JNEUROSCI.3252-09.2009. PMID: 19955375
7. Peters R. Ageing and the brain. Postgraduate medical journal. 2006 feb; 82(964):84–8. Available from:
http://www.pubmedcentral.nih.gov/articlerender.fcgi?artid=2596698&tool=pmcentrez&rendertype=
abstract. doi: 10.1136/pgmj.2005.036665 PMID: 16461469
8. Salat D, Buckner RL, Snyder AZ, Greve DN, Desikan RS, Busa E, et al. Thinning of the cerebral cortex
in aging. Cerebral Cortex. 2004; 14:721–730. doi: 10.1093/cercor/bhh032 PMID: 15054051
9. Jiang J, Sachdev P, Lipnicki DM, Zhang H, Liu T, Zhu W, et al. A longitudinal study of brain atrophy over
two years in community-dwelling older individuals. Neuroimage. 2014 Feb; 86:203–211. Available from:
http://dx.doi.org/10.1016/j.neuroimage.2013.08.022. PMID: 23959201
10. Liu Y, Julkunen V, Paajanen T, Westman E, Wahlund LO, Aitken A, et al. Education increases reserve
against Alzheimer’s disease-evidence from structural MRI analysis. Neuroradiology. 2012; 54(9):929–
938. doi: 10.1007/s00234-012-1005-0 PMID: 22246242
11. Morris GP, Clark IA, Vissel B. Inconsistencies and controversies surrounding the amyloid hypothesis of
Alzheimer’s disease. Acta Neuropathol Commun. 2014; 2:135. Available from: http://dx.doi.org/10.
1186/s40478-014-0135-5. PMID: 25231068
12. Wolfe MS. The role of tau in neurodegenerative diseases and its potential as a therapeutic target. Scien-
tifica. 2012; 2012:796024. Available from: http://www.pubmedcentral.nih.gov/articlerender.fcgi?artid=
3820460&tool=pmcentrez&rendertype=abstract. doi: 10.6064/2012/796024 PMID: 24278740
Early Prediction of Alzheimer’s Disease Using Null Longitudinal Model-Based Classifiers
PLOS ONE | DOI:10.1371/journal.pone.0168011 January 3, 2017 16 / 19

13. Morris J. The Clinical Dementia Rating (CDR): current version and scoring rules. Neurology. 1993;
43:2412–2414. doi: 10.1212/WNL.43.11.2412-a PMID: 8232972
14. Folstein M, Folstein S, McHugh P. Mini-mental state. A practical method for grading the cognitive state
of patients for the clinician. Journal of Psychiatric Research. 1975; 12(3):189–198. doi: 10.1016/0022-
3956(75)90026-6 PMID: 1202204
15. Mueller SG, Weiner MW, Thal LJ, Petersen RC, Jack CR, Jagust W, et al. Ways toward an early diag-
nosis in Alzheimer’s disease: the Alzheimer’s Disease Neuroimaging Initiative (ADNI). Alzheimers
Dement. 2005 Jul; 1(1):55–66. Available from: http://dx.doi.org/10.1016/j.jalz.2005.06.003. PMID:
17476317
16. Mueller SG, Weiner MW, Thal LJ, Petersen RC, Jack C, Jagust W, et al. The Alzheimer’s disease neu-
roimaging initiative. Neuroimaging Clin N Am. 2005 Nov; 15(4):869–77, xi–xii. Available from: http://dx.
doi.org/10.1016/j.nic.2005.09.008. PMID: 16443497
17. Albert MS, DeKosky ST, Dickson D, Dubois B, Feldman HH, Fox NC, et al. The diagnosis of mild cogni-
tive impairment due to Alzheimer’s disease: recommendations from the National Institute on Aging-Alz-
heimer’s Association workgroups on diagnostic guidelines for Alzheimer’s disease. Alzheimers
Dement. 2011 May; 7(3):270–279. Available from: http://dx.doi.org/10.1016/j.jalz.2011.03.008. PMID:
21514249
18. Shaw LM, Vanderstichele H, Knapik-Czajka M, Clark CM, Aisen PS, Petersen RC, et al. Cerebrospinal
fluid biomarker signature in Alzheimer’s disease neuroimaging initiative subjects. Ann Neurol. 2009 Apr;
65(4):403–413. doi: 10.1002/ana.21610 PMID: 19296504
19. Cui Y, Liu B, Luo S, Zhen X, Fan M, Liu T, et al. Identification of conversion from mild cognitive
impairment to Alzheimer’s disease using multivariate predictors. PLoS One. 2011; 6(7):e21896. doi: 10.
1371/journal.pone.0021896 PMID: 21814561
20. Franke K, Ziegler G, Kloppel S, Gaser C. Estimating the age of healthy subjects from T1-weighted MRI
scans using kernel methods: exploring the influence of various parameters. Neuroimage. 2010 apr; 50
(3):883–92. Available from: http://www.sciencedirect.com/science/article/pii/S1053811910000108.
PMID: 20070949
21. Franke K, Gaser C. Longitudinal changes in individual BrainAGE in healthy aging, mild cognitive
impairment, and Alzheimer’s disease. Journal of Gerontopsychology and Geriatric Psychiatry. 2012; 25
(4):235–45.
22. Gaser C, Franke K, Kloppel S, Koutsouleris N, Sauer H. BrainAGE in Mild Cognitive Impaired Patients:
Predicting the Conversion to Alzheimer’s Disease. PLoS ONE. 2013; 8(6). doi: 10.1371/journal.pone.
0067346 PMID: 23826273
23. Spulber G, Simmons A, Muehlboeck JS, Mecocci P, Vellas B, Tsolaki M, et al. An MRI-based index to
measure the severity of Alzheimer’s disease-like structural pattern in subjects with mild cognitive
impairment. Journal of internal medicine. 2013 apr; 273(4):396–409. Available from: http://www.
pubmedcentral.nih.gov/articlerender.fcgi?artid=3605230&tool=pmcentrez&rendertype=abstract.
doi: 10.1111/joim.12028 PMID: 23278858
24. Aguilar C, Muehlboeck JS, Mecocci P, Vellas B, Tsolaki M, Kloszewska I, et al. Application of a MRI
based index to longitudinal atrophy change in Alzheimer disease, mild cognitive impairment and healthy
older individuals in the AddNeuroMed cohort. Frontiers in aging neuroscience. 2014 jan; 6:145. doi: 10.
3389/fnagi.2014.00145 PMID: 25071554
25. Zhang D, Shen D, Alzheimer’s Disease Neuroimaging Initiative. Multi-Modal Multi-Task Learning for
Joint Prediction of Multiple Regression and Classification Variables in Alzheimer’s Disease. Neuro-
image. 2012; 59(2):895–907. doi: 10.1016/j.neuroimage.2011.09.069 PMID: 21992749
26. Jie B, Zhang D, Cheng B, Shen D. Manifold regularized multi-task feature selection for multi-modality
classification in Alzheimer’s disease. In: Medical Image Computing and Computer-Assisted Interven-
tion–MICCAI 2013. Springer; 2013. p. 275–283. PMID: 24505676
27. Liu F, Wee CY, Chen H, Shen D. Inter-modality relationship constrained multi-modality multi-task fea-
ture selection for Alzheimer’s Disease and mild cognitive impairment identification. NeuroImage. 2014;
84:466–475. doi: 10.1016/j.neuroimage.2013.09.015 PMID: 24045077
28. Suk HI, Shen D. Deep Learning-Based Feature Representation for AD/MCI Classification. Med Image
Comput Comput Assist Interv. 2013; 16(2):583–590. PMID: 24579188
29. Suk HI, Lee SW, Shen D, Initiative ADN, et al. Hierarchical feature representation and multimodal fusion
with deep learning for AD/MCI diagnosis. NeuroImage. 2014; 101:569–582. doi: 10.1016/j.neuroimage.
2014.06.077 PMID: 25042445
30. Kloppel S, Stonnington CM, Chu C, Draganski B, Scahill RI, Rohrer JD, et al. Automatic classification of
MR scans in Alzheimer’s disease. Brain. 2008 Mar; 131(Pt 3):681–689. Available from: http://dx.doi.
org/10.1093/brain/awm319. PMID: 18202106
Early Prediction of Alzheimer’s Disease Using Null Longitudinal Model-Based Classifiers
PLOS ONE | DOI:10.1371/journal.pone.0168011 January 3, 2017 17 / 19

31. Cuingnet R, Gerardin E, Tessieras J, Auzias G, Lehericy S, Habert MO, et al. Automatic classification of
patients with Alzheimer’s disease from structural MRI: A comparison of ten methods using the ADNI
database. Multivariate Decoding and Brain Reading. 2011; 56(2):766–781. Available from: http://www.
sciencedirect.com/science/article/pii/S1053811910008578.
32. Petersen RC, Aisen PS, Beckett LA, Donohue MC, Gamst AC, Harvey DJ, et al. Alzheimer’s Disease
Neuroimaging Initiative (ADNI). Neurology. 2010; 74(3):201–209. Available from: http://www.neurology.
org/content/74/3/201.abstract. PMID: 20042704
33. Fjell AM, McEvoy L, Holland D, Dale AM, Walhovd KB, ADNI. Brain changes in older adults at very low
risk for Alzheimer’s disease. J Neurosci. 2013 May; 33(19):8237–8242. Available from: http://dx.doi.
org/10.1523/JNEUROSCI.5506-12.2013. PMID: 23658162
34. Desikan R, Cabral H, Hess C, Dillon W, Glastonbury C, Weiner M, et al. Automated MRI measures iden-
tify individuals with mild cognitive impairment and Alzheimer’s disease. Brain. 2009; 132(8):2048–2057.
doi: 10.1093/brain/awp123 PMID: 19460794
35. Desikan RS, Cabral HJ, Settecase F, Hess CP, Dillon WP, Glastonbury CM, et al. Automated MRI mea-
sures predict progression to Alzheimer’s disease. Neurobiol Aging. 2010 Aug; 31(8):1364–1374. doi:
10.1016/j.neurobiolaging.2010.04.023 PMID: 20570399
36. Weiner MW, Veitch DP, Aisen PS, Beckett LA, Cairns NJ, Green RC, et al. The Alzheimer’s Disease
Neuroimaging Initiative: A review of papers published since its inception. Alzheimer’s and Dementia.
2012; 8(1, Supplement):S1–S68. doi: 10.1016/j.jalz.2011.09.172 PMID: 22047634
37. Jack C, Bernstein M, Fox N. The Alzheimer’s Disease Neuroimaging Initiative (ADNI): MRI methods. J
Magn Reson Imaging. 2008; 27(4):685–691. doi: 10.1002/jmri.21049 PMID: 18302232
38. Dickerson BC, Bakkour A, Salat DH, Feczko E, Pacheco J, Greve DN, et al. The cortical signature of
Alzheimer’s disease: regionally specific cortical thinning relates to symptom severity in very mild to mild
AD dementia and is detectable in asymptomatic amyloid-positive individuals. Cereb Cortex. 2009 Mar;
19(3):497–510. Available from: http://dx.doi.org/10.1093/cercor/bhn113. PMID: 18632739
39. Cho Y, Seong JK, Jeong Y, Shin SY, Initiative ADN. Individual subject classification for Alzheimer’s dis-
ease based on incremental learning using a spatial frequency representation of cortical thickness data.
Neuroimage. 2012 Feb; 59(3):2217–2230. Available from: http://dx.doi.org/10.1016/j.neuroimage.
2011.09.085. PMID: 22008371
40. Desikan R, Sigonne F, Fischl B, Quinn BT, Dickerson BC, Blacker D, et al. An automated labeling sys-
tem for subdividing the human cerebral cortex on MRI scans into gyral based regions of interest. Neuro-
Image. 2006; 31(3):968–980. Available from: http://www.sciencedirect.com/science/article/pii/
S1053811906000437. PMID: 16530430
41. Fischl B. FreeSurfer. Neuroimage. 2012 Jan;Available from: http://dx.doi.org/10.1016/j.neuroimage.
2012.01.021. PMID: 22248573
42. Tosun D, Schuff N, Truran-Sacrey D, Shaw LM, Trojanowski JQ, Aisen P, et al. Relations between
brain tissue loss, CSF biomarkers, and the ApoE genetic profile: a longitudinal MRI study. Neurobiol
Aging. 2010 Aug; 31(8):1340–1354. doi: 10.1016/j.neurobiolaging.2010.04.030 PMID: 20570401
43. Bates D, Machler M, Bolker B, Walker S. Fitting Linear Mixed-Effects Models Using lme4. Journal of
Statistical Software. 2015; 67(1):1–48. doi: 10.18637/jss.v067.i01
44. Hoskuldsson A. PLS regression methods. Journal of Chemometrics. 1988; 2(3):211–228. Available
from: http://dx.doi.org/10.1002/cem.1180020306.
45. Wold S, Sjostrom M, Eriksson L. PLS-regression: a basic tool of chemometrics. Chemometrics and
Intelligent Laboratory Systems. 2001; 58(2):109–130. PLS Methods. Available from: http://www.
sciencedirect.com/science/article/pii/S0169743901001551.
46. Dayal BS, MacGregor JF. Improved PLS algorithms. Journal of Chemometrics. 1997; 11(1):73–85.
Available from: http://onlinelibrary.wiley.com/doi/10.1002/(SICI)1099-128X(199701)11:1%3C73::AID-
CEM435%3E3.0.CO;2-%23/abstract.
47. Mevik BH, Wehrens R, Liland KH. pls: Partial Least Squares and Principal Component regression;
2013. R package version 2.4-3. Available from: http://CRAN.R-project.org/package=pls.
48. Coffey CE, Lucke JF, Saxton JA, Ratcliff G, Unitas LJ, Billig B, et al. Sex differences in brain aging: a
quantitative magnetic resonance imaging study. Arch Neurol. 1998; 55(2):169–79. Available from:
http://www.ncbi.nlm.nih.gov/pubmed/9482358. doi: 10.1001/archneur.55.2.169 PMID: 9482358
49. Xu J, Kobayashi S, Yamaguchi S, Iijima K, Okada K, Yamashita K. Gender effects on age-related
changes in brain structure. AJNR Am J Neuroradiol. 2000; 21(1):112–118. PMID: 10669234
50. Kiraly A, Szabo N, Toth E, Csete G, Farago P, Kocsis K, et al. Male brain ages faster: the age and gen-
der dependence of subcortical volumes. Brain Imaging and Behavior. 2015;p. 1–10. Available from:
http://dx.doi.org/10.1007/s11682-015-9468-3. PMID: 26572143
Early Prediction of Alzheimer’s Disease Using Null Longitudinal Model-Based Classifiers
PLOS ONE | DOI:10.1371/journal.pone.0168011 January 3, 2017 18 / 19
51. Toledo JB, Xie SX, Trojanowski JQ, Shaw LM. Longitudinal change in CSF Tau and ABeta biomarkers
for up to 48 months in ADNI. Acta Neuropathologica. 2013; 126(5):659–670. doi: 10.1007/s00401-013-
1151-4 PMID: 23812320
52. De Meyer G, Shapiro F, Vanderstichele H, Vanmechelen E, Engelborghs S, De Deyn PP, et al. Diagno-
sis-independent Alzheimer disease biomarker signature in cognitively normal elderly people. Arch Neu-
rol. 2010 Aug; 67(8):949–956. doi: 10.1001/archneurol.2010.179 PMID: 20697045
53. Chupin M, Gerardin E, Cuingnet R, Boutet C, Lemieux L, Lehericy S, et al. Fully automatic hippocampus
segmentation and classification in Alzheimer’s disease and mild cognitive impairment applied on data
from ADNI. Hippocampus. 2009 Jun; 19(6):579–587. Available from: http://dx.doi.org/10.1002/hipo.
20626. PMID: 19437497
54. Das SR, Avants BB, Pluta J, Wang H, Suh JW, Weiner MW, et al. Measuring longitudinal change in the
hippocampal formation from in vivo high-resolution T2-weighted MRI. Neuroimage. 2012 Apr; 60
(2):1266–1279. Available from: http://dx.doi.org/10.1016/j.neuroimage.2012.01.098. PMID: 22306801
Early Prediction of Alzheimer’s Disease Using Null Longitudinal Model-Based Classifiers
PLOS ONE | DOI:10.1371/journal.pone.0168011 January 3, 2017 19 / 19