early mathematics assessment: validation of the short form ... · ment (rema), developed by...
TRANSCRIPT
This article was downloaded by: ["University at Buffalo Libraries"]On: 13 June 2012, At: 07:44Publisher: RoutledgeInforma Ltd Registered in England and Wales Registered Number: 1072954 Registeredoffice: Mortimer House, 37-41 Mortimer Street, London W1T 3JH, UK
Educational Psychology: AnInternational Journal of ExperimentalEducational PsychologyPublication details, including instructions for authors andsubscription information:http://www.tandfonline.com/loi/cedp20
Early mathematics assessment:validation of the short form of aprekindergarten and kindergartenmathematics measureChristina Weiland a , Christopher B. Wolfe b , Michael D. Hurwitz c
, Douglas H. Clements d , Julie H. Sarama d & Hirokazu Yoshikawae
a Harvard Graduate School of Education, Cambridge, MA, USAb Indiana University, Kokomo, IN, USAc College Board, Washington, DC, USAd Graduate School of Education, University of Buffalo,SUNYBuffalo, NY, USAe Harvard Graduate School of Education, Cambridge, MA, USA
Available online: 31 Jan 2012
To cite this article: Christina Weiland, Christopher B. Wolfe, Michael D. Hurwitz, Douglas H.Clements, Julie H. Sarama & Hirokazu Yoshikawa (2012): Early mathematics assessment: validationof the short form of a prekindergarten and kindergarten mathematics measure, EducationalPsychology: An International Journal of Experimental Educational Psychology, 32:3, 311-333
To link to this article: http://dx.doi.org/10.1080/01443410.2011.654190
PLEASE SCROLL DOWN FOR ARTICLE
Full terms and conditions of use: http://www.tandfonline.com/page/terms-and-conditions
This article may be used for research, teaching, and private study purposes. Anysubstantial or systematic reproduction, redistribution, reselling, loan, sub-licensing,systematic supply, or distribution in any form to anyone is expressly forbidden.
The publisher does not give any warranty express or implied or make any representationthat the contents will be complete or accurate or up to date. The accuracy of anyinstructions, formulae, and drug doses should be independently verified with primarysources. The publisher shall not be liable for any loss, actions, claims, proceedings,demand, or costs or damages whatsoever or howsoever caused arising directly orindirectly in connection with or arising out of the use of this material.
Dow
nloa
ded
by [
"Uni
vers
ity a
t Buf
falo
Lib
rari
es"]
at 0
7:44
13
June
201
2
Early mathematics assessment: validation of the short form of aprekindergarten and kindergarten mathematics measure
Christina Weilanda*, Christopher B. Wolfeb, Michael D. Hurwitzc, Douglas H.Clementsd, Julie H. Saramad and Hirokazu Yoshikawae
aHarvard Graduate School of Education, Cambridge, MA, USA; bIndiana University,Kokomo, IN, USA; cCollege Board, Washington, DC, USA; dGraduate School of Education,University of Buffalo, SUNY, Buffalo, NY, USA; eHarvard Graduate School of Education,Cambridge, MA, USA
(Received 17 August 2011; final version received 30 December 2011)
In recent years, there has been increased interest in improving early mathematicscurricula and instruction. Subsequently, there has also been a rise in demand forbetter early mathematics assessments, as most current measures are limited intheir content and/or their sensitivity to detect differences in early mathematicsdevelopment among young children. In this article, using data from two largesamples of diverse populations of prekindergarten and kindergarten children, weprovide evidence regarding the psychometric validity of a new theory-basedearly mathematics assessment. The new measure is the short form of a longer,validated measure. Our results suggest the short form assessment is valid forassessing prekindergarten and kindergarten children’s numeracy and geometryskills and is sensitive to differences in early mathematics development amongyoung children.
Keywords: early mathematics; prekindergarten; kindergarten; psychometrics;assessment
In recent years, there has been increasing interest in improving early mathematicscurricula and assessment. For example, Head Start, the largest publicly funded pre-school programme in the USA, is currently strengthening its mathematics curricula,while several states are implementing new early mathematics education programmes(Ginsburg, Lee, & Boyd, 2008). In explaining this spike in interest, early mathemat-ics experts have pointed to several factors. First, the US children do not fare wellin mathematics in international comparisons and gaps may begin in prekindergarten(Ginsburg et al., 2008; Sarama & Clements, 2009). Second, there is a well-devel-oped body of evidence across disciplines suggesting that children begin developingmathematical competencies in infancy as part of the natural course of development(Butterworth, 1999; Clements & Sarama, 2007a, 2007c; Ginsburg, Cannon, Eisen-band, & Pappas, 2006). This evidence has helped to dispel notions that children arenot ready to learn mathematics in prekindergarten. Third, some research suggeststhat mathematics ability at kindergarten entry is a strong predictor of later academicoutcomes, stronger even than early reading ability (Duncan et al., 2007). Finally,there is increasing concern and awareness regarding gaps in mathematics
*Corresponding author. Email: [email protected]
Educational PsychologyVol. 32, No. 3, May 2012, 311–333
ISSN 0144-3410 print/ISSN 1469-5820 online� 2012 Taylor & Francishttp://dx.doi.org/10.1080/01443410.2011.654190http://www.tandfonline.com
Dow
nloa
ded
by [
"Uni
vers
ity a
t Buf
falo
Lib
rari
es"]
at 0
7:44
13
June
201
2
achievement between children from low-resource families and their more advan-taged peers, with gaps particularly prevalent among some subgroups, such as stu-dents who are black, Hispanic or English Language Learners (Clements, Sarama, &Liu, 2008; Ginsburg et al., 2008; National Center for Education Statistics, 2000).
The increasing focus on early mathematics and demand for evidence-basedearly mathematics curricula have also created a demand for better early mathemat-ics assessments. Clements et al. (2008) review several commonly used early math-ematics instruments and point out that these measures are generally limited intheir content and/or their sensitivity to detect differences in early mathematicsdevelopment among young children. The research-based early mathematics assess-ment (REMA), developed by Clements, Sarama and Liu, is designed to addressthese gaps. The REMA is based on theory and empirical work regarding learningtrajectories in mathematics learning (Clements, 2007) and taps a broader range ofearly mathematics skills than more widely used measures. These learning trajecto-ries are defined as ‘descriptions of children’s thinking and learning in a specificmathematical domain, . . ., created with the intent of supporting children’s achieve-ment of specific goals in that mathematical domain’ (Clements & Sarama, 2004b,p. 83).
Within the REMA, learning trajectories are conceptualised within two broaddomains – number and geometric/spatial competencies. Number constructs includeverbal and object counting, subitising, number comparison and sequencing, connect-ing numerals to quantities, number composition/decomposition, adding and subtract-ing and place value. Geometric/spatial constructs include the recognition,composition/decomposition, congruence and construction of shapes, as well as spa-tial imagery, measurement and patterning.
Using three different pilot phases and extensive Rasch analysis, Clements et al.(2008) established that the REMA has excellent psychometric properties, includinggood construct validity. The REMA also showed good concurrent validity withother mathematics assessments in two different studies: one study found a .86 corre-lation between the REMA and another complete measure of preschool mathematicsachievement (Klein, Starkey, & Wakeley, 2000), while the other found correlationsbetween .62 and .76 between REMA and Woodcock-Johnson III Applied Problemsat three different time points (end of prekindergarten, end of kindergarten and endof first grade; Sarama, Clements, Wolfe, & Spitler, submitted for publication). TheREMA forms the foundation for the recently published tools for early assessmentof mathematics (TEAM; Sarama, Clements, & Wolfe, 2010), a formative assessmentdesigned for prekindergarten through fifth grade.
In this article, we extend the work of Clements et al. (2008) by validating a19-item Short Form version of the full 125-item REMA. This Short Form versionincludes items designed to tap into only the earliest learning trajectories related tomathematical development and can be used to assess prekindergarten and kinder-garten children’s numeracy and geometry skills. Although the Short Form mea-sure is limited in its use with older children, it is nonetheless a useful tool forstudies of young children and in early care settings as a formative assessment ofchild deficits and strengths in early mathematics. In the present study, we admin-istered items to two independent samples of prekindergarten and kindergartenchildren to examine the properties of the Short Form. We found it is sensitive toability differences in young children’s early mathematics skills and has strongvalidity.
312 C. Weiland et al.
Dow
nloa
ded
by [
"Uni
vers
ity a
t Buf
falo
Lib
rari
es"]
at 0
7:44
13
June
201
2
Need for new early mathematics measures
The field of early childhood education has a generous supply of achievement mea-sures, but most assess literacy. The mathematics assessments available are ofteneither lengthy (including an unsystematic amalgamation of different instruments) orshort but inadequate. For example, a commonly used instrument is the Woodcock-Johnson III (Woodcock, McGrew, & Mather, 2001), especially the Applied Prob-lems subtest. This subtest has several strengths, including assessing a wide range ofabilities and ages, reliabilities above .80, and large normative data samples.However, two national panels on preschool assessment (National Institute of ChildHealth & Human Development Forum, Washington, DC, June 2002; Center forImproving Resources in Children’s Lives Forum, Temple University, 30–31 January2003) cautioned against the sole use of the Woodcock-Johnson for assessment ofmathematical skills in preschoolers because it covers a narrow range of problems(e.g. it has multiple tasks in which children must count a proper subset, all withnumbers from 1 to 4) and jumps too quickly to advanced, formal knowledge. Inaddition, it is not based on current research of the development of mathematicalthinking, paying little attention to developmental sequences. Other assessments havesimilar limitations. For example, the Bracken Basic Concept Scale (Bracken, 1984/1998) includes several mathematical concept categories; however, the national pan-els cautioned content validity was low (including mathematically questionable itemssuch as one-dimensional ‘linear shapes’). Further, because Bracken subtests are notintended to be used separately, it can be difficult to administer or interpret resultsfor mathematical topics.
A measure more positively reviewed by the national panels is the test of earlymathematics ability (Ginsburg & Baroody, 2003). However, although the officialdescription of the instrument states that it ‘measures the mathematics performanceof children’, this is only partially true. It measures number competencies, but notsome other important mathematical skills. Even assessments that include contentother than number lack substantial coverage of geometry and measurement skills(Chernoff, Flanagan, McPhee, & Park, 2007).
Recognising the critical need for improving and expanding early math educa-tion, a recent National Research Council Report (2009) called for better and morecomprehensive measures. The REMA was developed to meet that call. However, itgrew to involve two administration sessions, often with durations of greater than30min each and discouraged its use in favour of shorter, albeit inadequate, instru-ments. The challenge, therefore, was to build a short form of the REMA that wouldcorrelate highly with the existing instrument.
Learning trajectories’ developmental progressions
A key strength of the REMA and its Short Form is that they are based onlearning trajectories. Learning trajectories (also known as developmental pro-gressions) have played a substantial role in recent theory and research (Cle-ments, Sarama, Spitler, Lange, & Wolfe, 2011; Confrey, Maloney, Nguyen,Mojica, & Myers, 2009; Wilson, 2009), as well in as the development ofstandards and curriculum (Daro et al., 2011). The ongoing work of The Com-mon Core State Standards Initiative, a joint effort by the National GovernorsAssociation Center for Best Practices and the Council of Chief State School
Educational Psychology 313
Dow
nloa
ded
by [
"Uni
vers
ity a
t Buf
falo
Lib
rari
es"]
at 0
7:44
13
June
201
2
Officers, is based to a large extent on such developmental progressions/learn-ing trajectories.
To give an example of a learning trajectory, we turn to the shape compositiontrajectory. The developmental progression for this skill was based on observationsof children’s explorations (Sarama, Clements, & Vukelic, 1996), corroborated bydata from other researchers (Mansfield & Scott, 1990; Sales, 1994; Vurpillot, 1976),and refined through a series of clinical interviews, focused observations (Clements,Sarama, & Wilson, 2001) and statistical analyses (Clements, Wilson, & Sarama,2004). Children gain abilities in this domain first by learning to compose individualgeometric shapes and then learning to combine them – initially through trial anderror and gradually by attributes – into pictures, and finally synthesise combinationsof shapes into new shapes (composite shapes). The REMA Short Form includes aseries of items that tracks this developmental progression.
Research questions
In the present study, we examine the psychometric properties of the REMA ShortForm. We address six research questions:
(1) Does a shortened set of mathematical items for 4- and 5-year-old childrentaken from a longer, validated measure fit the Rasch model?
(2) Does the Short Form differentiate students of differing ability levels?(3) Are Short Form items robust across two independent samples of 4- and
5-year-old children?(4) Does the Short Form demonstrate strong concurrent validity with the
Woodcock-Johnson Applied Problems subscale and the full REMA, andstrong discriminant validity with cognitive tests in non-mathematicsdomains?
(5) Do the Short Form items show differential item functioning (DIF) acrosssubgroups of students (home language, free/reduced lunch status, gender andgrade level)?
(6) Can a stop rule be used with the Short Form without substantial loss ofinformation?
In brief, we hypothesised that the answer to all research questions was ‘yes’,except for research question (5) where we hypothesised that the measure would notshow DIF across subgroups of students.
Method
Sample
Sample 1 for the Short Form included 1930 prekindergarten (N= 1002) and kinder-garten (N= 928) children in a large urban public school district in the north-easternUSA. Sample 1 children were tested in fall 2009 as part of a larger regression–discontinuity evaluation of the district’s 4-year-old prekindergarten programme. Allchildren in Sample 1 were either enrolled in the district’s prekindergarten pro-gramme at the time of assessment or had attended the programme in the previousyear. Prekindergarten classrooms in the district used the Building Blocks early math-ematics curriculum (Clements & Sarama, 2007b), as well as the literacy curriculumOpening the World of Learning, which is designed for full-day implementation,
314 C. Weiland et al.
Dow
nloa
ded
by [
"Uni
vers
ity a
t Buf
falo
Lib
rari
es"]
at 0
7:44
13
June
201
2
with components added to language and literacy, including mathematics, science,social studies, art and physical, social and emotional development (Schickedanz &Dickinson, 2005). As both curricula were developed for use with preschool-agedchildren, the district used other, different curricula in the kindergarten programme(specifically, Investigations for mathematics and Reading Street for literacy). Samplechildren were drawn from 67, or 85%, of the district’s elementary schools.
Sample 2 was drawn from a randomised controlled trial of the Building Blockscurriculum in two large urban school districts in the north-eastern USA beginningin the fall of 2006.1 This sample includes 1305 prekindergarten children tested priorto prekindergarten mathematics instruction and at the end of the prekindergartenyear. In total, 93% of the sample was also tested at the end of kindergarten(N= 1218). The two districts were chosen because they had ethnically diverse popu-lations, they served primarily children from low-resource communities, and studentsgenerally remained in the same schools for prekindergarten and kindergarten.Within each district, 42 participating schools were randomly assigned to one ofthree curricular conditions: business-as-usual, Building Blocks or Building Blocksenhanced condition.2 In the prekindergarten year, the Building Blocks and BuildingBlocks enhanced conditions were identical. In the kindergarten year, teachers in theenhanced condition received additional training to support children as they movedfrom prekindergarten. Specifically, these kindergarten teachers were provided accessto the Building Blocks software suite as well as professional development focusedon how to adapt their core curriculum (Investigations) to take advantage of theincreased mathematics competencies of their incoming kindergarten with priorBuilding Blocks experience. Within each prekindergarten classroom, up to 15 chil-dren were randomly selected for testing. Within the business-as-usual conditions,teachers utilised the same base curriculum of Investigations but did not receive anyprofessional development in mathematics during the intervention. Sample 1 childrenreceived the Short Form, while Sample 2 children received the full REMA.
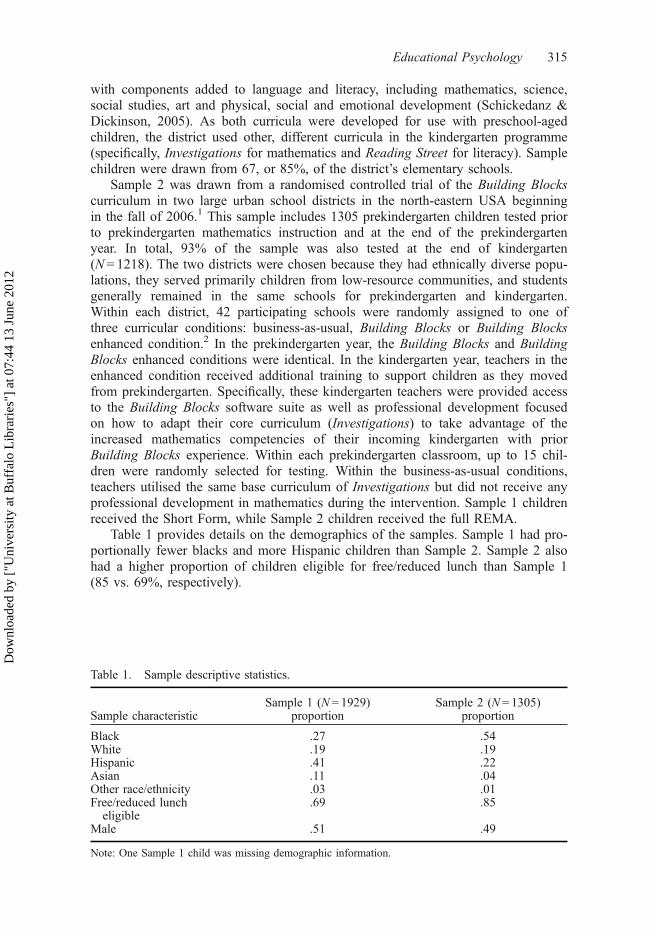
Table 1 provides details on the demographics of the samples. Sample 1 had pro-portionally fewer blacks and more Hispanic children than Sample 2. Sample 2 alsohad a higher proportion of children eligible for free/reduced lunch than Sample 1(85 vs. 69%, respectively).
Table 1. Sample descriptive statistics.
Sample characteristicSample 1 (N= 1929)
proportionSample 2 (N = 1305)
proportion
Black .27 .54White .19 .19Hispanic .41 .22Asian .11 .04Other race/ethnicity .03 .01Free/reduced luncheligible
.69 .85
Male .51 .49
Note: One Sample 1 child was missing demographic information.
Educational Psychology 315
Dow
nloa
ded
by [
"Uni
vers
ity a
t Buf
falo
Lib
rari
es"]
at 0
7:44
13
June
201
2

Development of the Short Form and content validity
Clements et al. (2008) detail the process of developing the full REMA; for brevity,we did not include full details here. In brief, their process article includes how theREMA’s content goals were determined and describes the three pilot tests used torefine test items (Clements & Sarama, 2004a, 2007a, 2007c; Sarama & Clements,2002). They also present and discuss results from submitting the measure to a Ras-ch model, with ‘mathematical competence’ as the defined latent trait. Their choiceof a Rasch model allowed them to locate children on a common ability scale with aconsistent, justifiable metric (Bond & Fox, 2007).
Items for the Short Form given to Sample 1 were selected from the full REMAitem bank. Item selection prioritised those items with adequate fit to the Raschmodel and that represented the full range of early mathematics competenciesapplicable within the prekindergarten and kindergarten periods of mathematicsdevelopment (see Tables 2 and 3 for a description of the 19 items selected, includ-ing the specific competency tapped by each item). Items selected represent thecompetencies and learning trajectories of mathematics learning that are the mostessential in prekindergarten and kindergarten children. They test the earliest levelswithin those number competencies considered fundamental mathematically, psycho-logically and educationally (e.g. CCSSO/NGA, 2010; Geary, 2006; Sarama &Clements, 2009), including recognition of number and subitising (four items),3 com-position of number (early arithmetic combinations, two items), comparing numberand sequencing (two items) and counting (both verbal and object, two items). Basicnumeral identification (one item) and arithmetic (addition; one item) were alsoincluded to capture the highest and lowest skill levels within the target population.Also included were items assessing geometry competencies, including the earliest
Table 2. Item descriptive statistics.
Item
Sample 1 Sample 2
N MeanStandarddeviation Min Max PB N Mean
Standarddeviation Min Max PB
1 1930 .94 .23 0 1 .34 2122 .94 .24 0 1 .322 1930 .96 .20 0 1 .27 2701 .89 .31 0 1 .513 1930 .85 .36 0 1 .49 2342 .77 .42 0 1 .604 1930 .26 .44 0 1 .51 1122 .43 .49 0 1 .465 1927 .06 .23 0 1 .34 1070 .18 .38 0 1 .516 1929 .74 .40 0 1 .66 2164 .81 .35 0 1 .517 1930 .79 .41 0 1 .44 2321 .71 .46 0 1 .448 1927 .49 .50 0 1 .58 2047 .48 .50 0 1 .579 1930 .32 .47 0 1 .46 1402 .53 .50 0 1 .5010 1930 .08 .28 0 1 .42 777 .14 .34 0 1 .4611 1929 .35 .48 0 1 .5912 1925 .27 .44 0 1 .35 1164 .41 .49 0 1 .4513 1929 2.71 .49 0 3 .39 3571 2.41 .58 0 3 .4714 1929 1.55 .74 0 3 .35 2741 2.08 .71 0 3 .4615 1930 1.26 .85 0 2 .61 2711 .97 .82 0 2 .6716 1929 .50 .50 0 1 .48 2281 .47 .50 0 1 .4317 1930 .39 .49 0 1 .50 101 .80 .40 0 1 .3718 1928 .15 .35 0 1 .4319 1929 .21 .41 0 1 .32 139 .38 .49 0 1 .52
Note: PB denotes point-biserial correlations between each item and the total raw score.
316 C. Weiland et al.
Dow
nloa
ded
by [
"Uni
vers
ity a
t Buf
falo
Lib
rari
es"]
at 0
7:44
13
June
201
2

trajectory levels within shape (five items) and shape composition (one item).Finally, an additional question at the lowest level of patterning was also included.
Other criteria for item selection were content, item duration and item materials.Items were selected from content areas thought to act as building blocks for latermathematics development and that are readily observable in young children (Sarama& Clements, 2009). To keep the Short Form brief and easy to administer, when twoitems showed approximately equal fit to the Rasch model, had similar difficultiesand tapped the same early mathematics trajectory, we prioritised the item with fewto no manipulative materials that required a shorter amount of administration timeover longer items or those with multiple manipulatives.
Table 3. Item descriptions, core competencies assessed and topic.
Item Description Core competency
Level of thinking in the learningtrajectory (Clements & Sarama,2009)
1 Count to five Counting – verbal Reciter (counts to five); Reciter (10)– counts to 10–20; Counter to 100– counts 21 and higher
2 Compare quantities (3and 4) and identifylarger quantity
Comparing numberand sequencing
Non-verbal comparer of similaritems
3 Subitise 3 Recognition ofnumber and subitising
Perceptual subitiser to 4
4 Subitise 10 Recognition ofnumber and subitising
Conceptual subitiser to 10
5 Subitise 15 Recognition ofnumber and subitising
Conceptual subitiser to 20
6 Match numeral to set –5
Numerals Numerals
7 Count eight objects Counting – object Corresponder8 Count four objects Recognition of
number and subitisingProducer (small numbers)
9 Hide 3, show 2, howmany?
Composition ofnumber
Composer to 4, then 5
10 Hide 4, show 6, howmany?
Composition ofnumber
Composer to 10
11 Add 7 and 5 Arithmetic (adding,subtracting,multiplying, dividing)
Make it N±
12 Which is smaller: 27or 32?
Comparing numberand sequencing
Place value comparer
13 Identify triangles Shape Shape recogniser14 Identify rhombuses Shape Identifying shape15 Use straws to make a
triangleShape Constructor of shapes from parts –
looks like for partially correct;Constructor of shapes from parts
16 Identify sides of ageometric shape
Shape Side recogniser
17 Make ABB pattern Patterning Pattern duplicator18 Identify rectangle Shape Constructor shapes from parts –
exact19 Identify triangle and
trapezoidCompose shape Shape decomposer (with help)
Educational Psychology 317
Dow
nloa
ded
by [
"Uni
vers
ity a
t Buf
falo
Lib
rari
es"]
at 0
7:44
13
June
201
2
In summary, the Short Form is based on both theory (Sarama & Clements,2009), empirical evidence regarding the development of mathematics competenciesin the prekindergarten and kindergarten periods (Clements et al., 2008, 2011),practical considerations and considerable pilot testing and psychometric analysis(Clements et al., 2008). As such, we believe that the Short Form has strong contentvalidity and is practical for use in classroom settings and in cross-sectional researchstudies.
Procedures
Sample 1 children were tested by study-trained child assessors. Assessors had toprove reliability on a full battery of tests, including the REMA Short Form, andshow good rapport/child management skills in both simulated and real testing situa-tions. All assessors were college-educated, and approximately one-third held mas-ters, degrees. On average, the Short Form took approximately 15–20min toadminister. Children were administered all 19 items unless the child did not speakEnglish well enough to continue, had a severe disability that interfered with thetesting session or displayed a behaviour problem that required the discontinuationof the testing session (N= 30 children). All children included in the sample wereable to complete at least 14 of the 19 items.
Sample 1 children were also tested on the Woodcock-Johnson Applied Problemssubscale, the Woodcock-Johnson Letter–Word Identification subscale and the Pea-body Picture Vocabulary Test-III (PPVT-III).4 The Applied Problems subscale(Woodcock et al., 2001) is a numeracy and early mathematics measure that requireschildren to perform relatively simple calculations to analyse and solve arithmeticproblems. Its test–retest reliability for 2–7-year-old children is .90 (Woodcock et al.,2001) and it has been widely used with diverse populations of young children(Gormley, Gayer, Phillips, & Dawson, 2005; Howes et al., 2008; Peisner-Feinberget al., 2001; Wong, Cook, Barnett, & Jung, 2008). The Woodcock-Johnson Letter-Word Identification subscale (Woodcock et al., 2001) is likewise a nationallynormed, widely used measure (Gormley et al., 2005; Peisner-Feinberg et al., 2001).The Letter-Word Identification subscale asks children to identify and pronounce iso-lated letters and words fluently. According to the developers, test–retest reliabilityof the Letter-Word subscale for 2–7-year-olds is .96. Children’s receptive vocabu-lary was measured using the PPVT-III (Dunn & Dunn, 1997), a nationally normedmeasure that has been widely used in diverse samples of young children (Loveet al., 2005; US Department of Health & Human Services, 2010; Wong et al.,2008). The test has excellent split-half and test–retest reliability, as well as strongqualitative and quantitative validity properties. It requires children to choose ver-bally or non-verbally which of the four pictures best represents a stimulus word.
In Sample 2, the full REMA was administered by masters’ level teachers acrosstwo videotaped testing sessions, each lasting 30–45min. Assessors had to meet 98–100% reliability, determined by exact agreement between in-house coding team andindividual assessor on administration across four assessments prior to actual data col-lection in sessions with volunteer children outside of the study. Based on the pilottesting and resultant Rasch model, items were arranged by level of difficulty andtesting was discontinued after a child answered four consecutive items incorrectly.
Seventeen of the 19 items included on the Short Form used with Sample 1 werealso used in the full REMA assessment given to prekindergarten and kindergartenstudents in Sample 2. There were two items included on the Short Form that were
318 C. Weiland et al.
Dow
nloa
ded
by [
"Uni
vers
ity a
t Buf
falo
Lib
rari
es"]
at 0
7:44
13
June
201
2

not administered to Sample 2 prekindergarten and kindergarten students. Sample 2prekindergarten and kindergarten children were not tested on these two items due totiming; these two items were not piloted until this sample of children were in firstgrade. The two items were included on the Short Form for content validity pur-poses.
Item scoring
Fifteen of the 19 items on the Short Form were scored dichotomously. One numberitem (item 6) required children to match five numeral cards to the correct cards withthat number of objects. Each correct match was scored +.2 for a total possible scoreof 1. One geometry item (item 15) involved giving children about eight short strawsof different lengths and asking them to make a triangle using the straws. A trianglewith three sides with no gaps or overlapping lines was scored as 2; a triangle withgaps and/or overlapping lines was scored as 1. Two geometry items – items 13 and14 – involved asking children to choose all the triangles or rhombuses out of a setof 26 shapes, respectively. Each shape was an item, weighted as follows (withexamples for triangles): palpable distractors (those without any overall resemblancesuch as ovals), .05; exemplars (theoretically- and empirically-determined prototypesof the class, such as an equilateral triangle), .25; variants (other members of theclass, such as obtuse triangles), .50 and distractors (non-examples that are easilyconfused with examples, such as a triangular shape missing one of the threevertices), also .50.
Analysis
As with other studies that have used the REMA instrument (Clements et al., 2008),we used the Rasch model to obtain both the item difficulty (Di) and the person abil-ity estimates (Bn). Georg Rasch, the eponymous developer of the Rasch model,introduced the concept of placing these two metrics on the same scale (Rasch,1980), allowing one to estimate the probability of answering an item correctly con-ditional on the Rasch-estimated ability score of the individual. Masters (1982)advanced Rasch’s model by allowing for ‘partial credit’ in which the outcome is nolonger dichotomous but polychotomous. Equation (1) represents the mathematicalformula used in the Rasch partial credit model, and it expresses the probability thatperson n scored a value of x on item i. This equation is adapted from Cheng, Chen,Liu, and Chen (2011), and incorporates an ability parameter, B, an item difficultyparameter, D and an additional parameter, d that expresses a change in probabilityof scoring j + 1, rather than j on item i
Pnix ¼exp
Pxj¼0 ½Bn � ðDi þ dijÞ�
Pmi
k expPk
j¼0 ½Bn � ðDi þ dijÞ�; x ¼ 0 � � �mi: ð1Þ
For the dichotomous items, Equation (1) is reduced to Equation (2) (Bond &Fox, 2007). The elegance of these formulae is that the person’s ability and item dif-ficulty values are placed on the same scale. For example, from Equation (2), anindividual with an ability of 2 logits has a 50% chance of answering correctly anitem with a difficulty of 2 logits
Educational Psychology 319
Dow
nloa
ded
by [
"Uni
vers
ity a
t Buf
falo
Lib
rari
es"]
at 0
7:44
13
June
201
2

Pnix ¼ expðxðBn � DiÞÞ1þ expðBn � DiÞ; x ¼ 0; 1: ð2Þ
The joint maximum likelihood estimation of both the person’s ability and itemdifficulty parameters in the Rasch model provides another distinct advantage oversimply assigning a person’s ability as the percent of items answered correctly. Dif-ferences in difficulties across test items suggest that the gap in ability levelsbetween an individual who answered eight items correctly and one who answerednine items correctly is not identical to the gap between an individual who answered14 items correctly and one who answered 15 items correctly. By having differentspacing between Rasch-based scores, we better reflect the true ability differencesbetween people. Using raw scores, rather than the Rasch-estimated ability levels asan outcome measure, might obscure the true impact of any study using the REMAor similar instruments to generate outcomes.
The Rasch approach has several other advantages over raw scores as well. Itallows us to place item difficulty and child proficiency on the same scale, which isboth convenient and easy to interpret. We also chose the Rasch approach because ithelps us to evaluate whether the underlying construct of early mathematics compe-tency is uni-dimensional. This is an important advantage over using raw scores,given that a major contribution of the REMA is its inclusion of a broader range ofearly mathematic competencies when compared with the more commonly usedWoodcock-Johnson Applied Problems subscale. Use of a raw score would make animplicit assumption of uni-dimensionality, whereas Rasch statistics allow us to eval-uate the tenability of that assumption. Finally, using a Rasch model best reflectshow the Short Form items were selected from the full item bank (i.e. they wereselected in part because in full REMA analysis, they showed adequate fit to theRasch model).5
Results
Descriptive statistics
Item descriptive statistics: Sample 1
As shown in Table 2, items differed in their mean scores, ranging from 96% ofSample 1 children getting an item correct (item 2) to just 6% of Sample 1 childrengetting an item correct (item 5). The average score on the multi-part numeralmatching item (item 6) was .74 out of a possible score of 1. On the triangle con-struction item (item 15), the average score was 1.26 out of a possible score of 2.The average score on the multiple category triangle item (item 13) was 2.71 out ofa possible score of 3 and the average score on the multiple category rhombus item(item 14) was 1.55 out of a possible score of 3.
Item descriptive statistics: Sample 2
Table 2 also displays the mean scores for the measured items included on the ShortForm for Sample 2. As a result of a stop rule in place during administration, thenumber of children taking each item varies in Sample 2. The range of mean scoresfor children getting an item correct spans from 94% (item 1) to 14% (item 10). The
320 C. Weiland et al.
Dow
nloa
ded
by [
"Uni
vers
ity a
t Buf
falo
Lib
rari
es"]
at 0
7:44
13
June
201
2

Table4.
Item
difficulty,standard
error,andfit(infi
tandoutfit,meansquare
residual
andstandardised)statistics.
Item
Sam
ple1
Sam
ple2
Infit
Outfit
Infit
Outfit
Difficulty
Error
Mean-square
fitstatistics(M
NSQ)
ZSTD
MNSQ
ZSTD
Difficulty
Error
MNSQ
ZSTD
MNSQ
ZTSD
1�3
.58
.11
.90
�1.25
.64
�2.40
�3.69
.10
.98
�.29
.80
�1.39
2�3
.99
.12
.95
�0.51
.86
�.71
�3.67
.08
.96
�.67
.93
�.56
3�2
.32
.07
.85
�3.64
.64
�4.01
�2.19
.06
.82
�6.23
.66
�6.29
41.28
.06
.90
�3.65
.83
�2.89
1.56
.07
.96
�1.60
.95
�1.21
53.43
.11
.90
�1.27
.57
�2.94
3.12
.09
.86
�2.73
.77
�2.76
6�1
.06
.06
.73
�9.90
.61
�8.88
�1.67
.06
.83
�4.88
.67
�5.38
7�1
.79
.06
.96
� 1.18
1.10
1.33
�1.53
.05
1.03
1.27
1.02
.48
8�.
02.05
.87
�6.36
.82
�5.08
�.15
.05
.86
�7.38
.83
�5.60
9.92
.06
.99
�.30
1.03
.61
.97
.06
.91
�4.21
.88
�3.47
102.92
.09
.83
�2.77
.55
�3.78
3.77
.11
.87
�1.75
.82
�1.49
11.73
.05
.84
�6.97
.74
�6.16
121.22
.06
1.13
4.34
1.27
4.12
1.68
.07
.97
�.99
.96
�.99
13�2
.58
.04
1.22
5.59
1.35
6.33
�2.31
.03
1.29
9.90
1.44
9.90
141.30
.04
1.46
9.90
1.46
9.90
�.41
.03
1.17
4.54
1.20
4.90
15�.
69.04
1.05
1.48
1.15
2.57
.63
.03
.86
�6.19
.83
�5.96
16�.
11.05
1.03
1.20
1.06
1.66
.90
.05
1.02
1.14
1.07
2.29
17.53
.05
.97
�1.45
1.02
.37
.37
.28
1.03
.27
.97
.02
182.18
.07
.94
�1.31
.81
�1.95
.63
.03
.86
�6.19
.83
�5.96
191.64
.06
1.13
3.54
1.34
4.13
2.61
.20
.97
�.34
.88
�.82
Educational Psychology 321
Dow
nloa
ded
by [
"Uni
vers
ity a
t Buf
falo
Lib
rari
es"]
at 0
7:44
13
June
201
2

average score on the multi-part numeral matching item (6) was .81 out of a possiblescore of 1. The average score for the triangle construction question was .97 out of apossible two points. The average score on the multiple category triangle item (13)was 2.41 out of a possible three points and the average score on the multiple cate-gory rhombus item (item 14) was 2.08 out of a possible three points.
Overall, the probability of getting a particular item correct was similar acrossthe two samples, although there were some differences. For example, for item 17,the percent correct was 39% for Sample 1 and 80% for Sample 2. Cronbach’s alphawas also similar across the two tests (Sample 1, standardised = .79; Sample 2, stand-ardised = .71), indicating reasonable internal consistency. The point-biserial correla-tions between item scores and the total raw score for both samples are shown inTable 2. Most were similar in magnitude across both samples. Differences in thestrength of the correlations between individual questions and total test scores werenoted between the samples for item 2, 5, 17 and 19 (all but 17 were stronger inSample 2, while item 17 was stronger in Sample 1).
RQ 1: Do the Short Form items adequately fit the Rasch model?
To address research question 1, we submitted data from sample children to a Raschmodel, using the Winsteps software (Linacre, 2005). Because no single fit statisticis sufficient to indicate item misfit, we examined several fit statistics, reliabilitiesand separation indices. As we explain below, the items adequately fit the Raschmodel.
We examined both infit and outfit statistics; both are measures of the meansquare error, but infit gives more weight to respondents with ability levels close toan item’s difficulty, whereas outfit is not weighted. All items in both samples hadinfit and outfit statistics under or very close to the benchmark of 1.3 for determiningadequate fit to the Rasch model (Bond & Fox, 2007).6 As shown in Table 4 and inSample 1, two items – 13 and 19 – had outfit statistics that were just over the 1.3benchmark but had adequate infit statistics. In Sample 2, item 13 had an outfit sta-tistic slightly larger than the 1.3 benchmark (1.44) but had an adequate infit statis-tic. In Sample 1, one item – item 14 – had both an outfit and an infit statistic of1.46. We retained this item, as its infit and outfit values were relatively close to thebenchmark and as its fit statistics were adequate in Sample 2.7
We also examined item reliability and person reliability statistics. Item reliabilitywas approximately 1.00, suggesting that the difficulty rank order of this study’sitems would be constant or close to constant across different samples drawn fromthe population to which we generalise. Person reliability was .76. Within Sample 2,item reliability was also approximately 1.00, while the person reliability was .68.There are no explicit benchmarks for acceptable item and person reliability statisticsthat we are aware of but we interpret the ones reported here as adequate.
RQ 2: Does the Short Form provide information about students of differingability levels?
Generally, tests should incorporate a range of item difficulties in order to obtainreliable information about children of different ability levels. As shown in Table 3,the difficulty of the 19 items in Sample 1 ranged from �3.99 logits (easiest) to3.43 logits (hardest). In Sample 2, the range was �3.69 logits (easiest) to 3.77
322 C. Weiland et al.
Dow
nloa
ded
by [
"Uni
vers
ity a
t Buf
falo
Lib
rari
es"]
at 0
7:44
13
June
201
2
(hardest). In terms of distribution within Sample 1, four items were very easy (diffi-culty less than �2 logits), five fell in the easy to average range (difficulty greaterthan �2 logits and less than 0 logits), seven items fell in the average to hard range(difficulty greater than 0 logits but less than 2 logits) and three items were veryhard (difficulty greater than 2 logits). Within Sample 2, the distribution of item dif-ficulty was identical, except that there were three which fall in the easy to averagerange (difficulty greater than �2 logits and less than 0 logits) rather than five, dueto the fact that two items were not given to Sample 2.
Notably, the items had different difficulty spacings, or distances in difficultybetween items when items are ordered by difficulty. By definition, any test does abetter job discriminating between students whose ability scores fall between moretightly spaced items than those whose ability scores fall between more looselyspaced items. Nonetheless, the unequal spacing of the Short Form test items isacceptable, given that the test is not high stakes and given its purpose as a tool forcross-sectional studies of young children and as a formative assessment of childdeficits and strengths in early mathematics. Those needing more finely tuned child-level ability estimates are encouraged to use the full REMA.
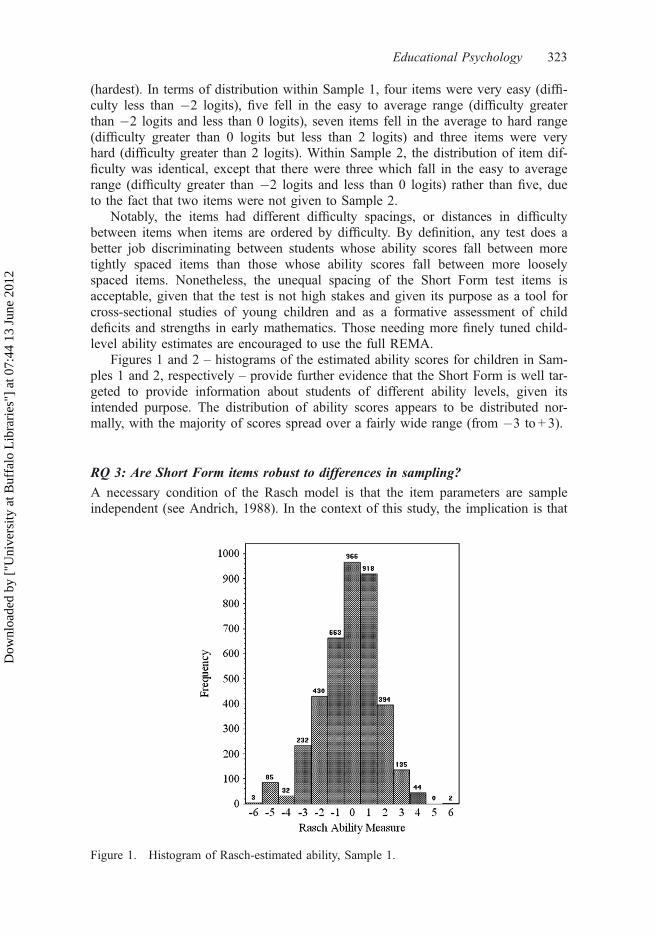
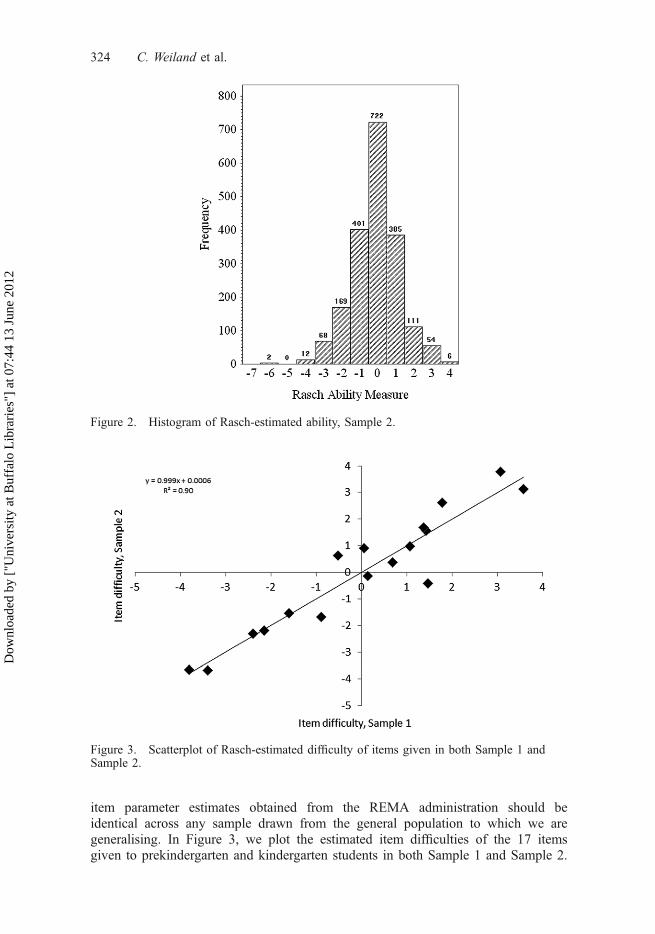
Figures 1 and 2 – histograms of the estimated ability scores for children in Sam-ples 1 and 2, respectively – provide further evidence that the Short Form is well tar-geted to provide information about students of different ability levels, given itsintended purpose. The distribution of ability scores appears to be distributed nor-mally, with the majority of scores spread over a fairly wide range (from �3 to + 3).
RQ 3: Are Short Form items robust to differences in sampling?
A necessary condition of the Rasch model is that the item parameters are sampleindependent (see Andrich, 1988). In the context of this study, the implication is that
Figure 1. Histogram of Rasch-estimated ability, Sample 1.
Educational Psychology 323
Dow
nloa
ded
by [
"Uni
vers
ity a
t Buf
falo
Lib
rari
es"]
at 0
7:44
13
June
201
2
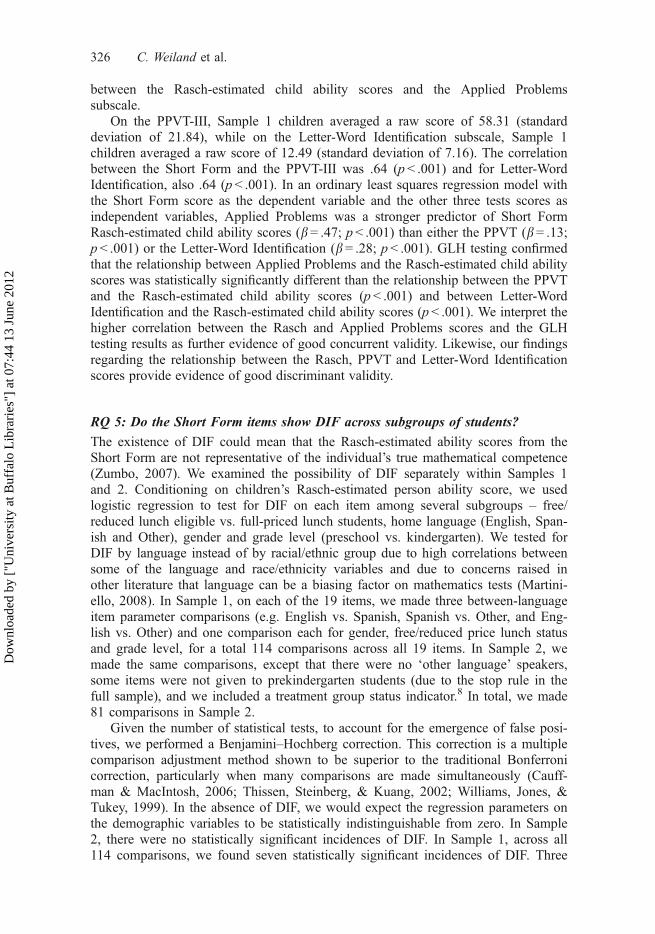
item parameter estimates obtained from the REMA administration should beidentical across any sample drawn from the general population to which we aregeneralising. In Figure 3, we plot the estimated item difficulties of the 17 itemsgiven to prekindergarten and kindergarten students in both Sample 1 and Sample 2.
Figure 2. Histogram of Rasch-estimated ability, Sample 2.
Figure 3. Scatterplot of Rasch-estimated difficulty of items given in both Sample 1 andSample 2.
324 C. Weiland et al.
Dow
nloa
ded
by [
"Uni
vers
ity a
t Buf
falo
Lib
rari
es"]
at 0
7:44
13
June
201
2

We also show a best-fit linear regression line of the relationship between the itemdifficulties in the two samples. The correlation between item difficulty estimates isvery high across the two samples (r= .95), suggesting that the item parameterestimates are indeed sample independent. We find these results particularly encour-aging, given that assessors were trained by different staff, and test items wereadministered to the samples in different years.
RQ 4: Does the Short Form demonstrate strong concurrent validity with theWoodcock-Johnson Applied Problems subscale and the full REMA and strongdiscriminant validity with non-mathematics cognitive tests?
Concurrent validity
Concurrent validity is determined by how well an assessment correlates to someother measure of the same, or similar, latent characteristic (Bond & Fox, 2007). Astrong correlation between a new assessment and an older, more established assess-ment provides additional support for the new assessment’s validity. In our work,within Sample 2, we assessed the relationship between the Short Form and thelonger full form of the REMA. Using two time points – the beginning of prekinder-garten and the end of prekindergarten– we correlated children’s Rasch-estimatedscores from the Short Form with their Rasch-estimated scores from the full REMA.In bivariate correlations, the Short Form scores evinced strong correlations with fullREMA scores within each time point: at the beginning of prekindergarten, .71(p< .001) and at the end of prekindergarten, .74 (p< .001). These results suggestedthat the Short Form has good concurrent validity with full REMA.
As a second concurrent validity check, we also correlated Rasch-estimated childability scores on the Short Form to child raw scores on the Woodcock-JohnsonApplied Problems subscale (Woodcock et al., 2001). The latter test was given tochildren only in Sample 1, in the same testing session as the Short Form test. Weexpected a moderate correlation between the two tests, given that the Short Formtaps early mathematics skills that Applied Problems does not (particularly geometry)and that Applied Problems jumps more quickly to advanced, formal knowledge(Clements et al., 2008). Sample 1 children averaged a raw score of 13.80 on theWoodcock-Johnson Applied Problems subscale (standard deviation of 5.24). Thecorrelation between children’s Applied Problems and Short Form Rasch-estimatedability scores was .74 (p< .001).
Discriminant validity
Cognitive tests tend to be moderately to highly correlated, even across domains. Toexamine discriminant validity – or the degree to which the Short Form is measuringsomething other than general cognitive ability – we also correlated our Rasch-esti-mated child ability scores to two other cognitive but non-mathematics tests given toSample 1 children in the same testing session: a language test, the (PPVT-III; Dunn& Dunn, 1997) and an early reading test, the Woodcock-Johnson Letter-WordIdentification subscale (Woodcock et al., 2001). We expected a moderate to strongcorrelation between the Rasch-estimated child ability scores and these tests butexpected that the correlations would be attenuated when compared to the correlation
Educational Psychology 325
Dow
nloa
ded
by [
"Uni
vers
ity a
t Buf
falo
Lib
rari
es"]
at 0
7:44
13
June
201
2
between the Rasch-estimated child ability scores and the Applied Problemssubscale.
On the PPVT-III, Sample 1 children averaged a raw score of 58.31 (standarddeviation of 21.84), while on the Letter-Word Identification subscale, Sample 1children averaged a raw score of 12.49 (standard deviation of 7.16). The correlationbetween the Short Form and the PPVT-III was .64 (p< .001) and for Letter-WordIdentification, also .64 (p< .001). In an ordinary least squares regression model withthe Short Form score as the dependent variable and the other three tests scores asindependent variables, Applied Problems was a stronger predictor of Short FormRasch-estimated child ability scores (b= .47; p< .001) than either the PPVT (b= .13;p< .001) or the Letter-Word Identification (b= .28; p< .001). GLH testing confirmedthat the relationship between Applied Problems and the Rasch-estimated child abilityscores was statistically significantly different than the relationship between the PPVTand the Rasch-estimated child ability scores (p< .001) and between Letter-WordIdentification and the Rasch-estimated child ability scores (p< .001). We interpret thehigher correlation between the Rasch and Applied Problems scores and the GLHtesting results as further evidence of good concurrent validity. Likewise, our findingsregarding the relationship between the Rasch, PPVT and Letter-Word Identificationscores provide evidence of good discriminant validity.
RQ 5: Do the Short Form items show DIF across subgroups of students?
The existence of DIF could mean that the Rasch-estimated ability scores from theShort Form are not representative of the individual’s true mathematical competence(Zumbo, 2007). We examined the possibility of DIF separately within Samples 1and 2. Conditioning on children’s Rasch-estimated person ability score, we usedlogistic regression to test for DIF on each item among several subgroups – free/reduced lunch eligible vs. full-priced lunch students, home language (English, Span-ish and Other), gender and grade level (preschool vs. kindergarten). We tested forDIF by language instead of by racial/ethnic group due to high correlations betweensome of the language and race/ethnicity variables and due to concerns raised inother literature that language can be a biasing factor on mathematics tests (Martini-ello, 2008). In Sample 1, on each of the 19 items, we made three between-languageitem parameter comparisons (e.g. English vs. Spanish, Spanish vs. Other, and Eng-lish vs. Other) and one comparison each for gender, free/reduced price lunch statusand grade level, for a total 114 comparisons across all 19 items. In Sample 2, wemade the same comparisons, except that there were no ‘other language’ speakers,some items were not given to prekindergarten students (due to the stop rule in thefull sample), and we included a treatment group status indicator.8 In total, we made81 comparisons in Sample 2.
Given the number of statistical tests, to account for the emergence of false posi-tives, we performed a Benjamini–Hochberg correction. This correction is a multiplecomparison adjustment method shown to be superior to the traditional Bonferronicorrection, particularly when many comparisons are made simultaneously (Cauff-man & MacIntosh, 2006; Thissen, Steinberg, & Kuang, 2002; Williams, Jones, &Tukey, 1999). In the absence of DIF, we would expect the regression parameters onthe demographic variables to be statistically indistinguishable from zero. In Sample2, there were no statistically significant incidences of DIF. In Sample 1, across all114 comparisons, we found seven statistically significant incidences of DIF. Three
326 C. Weiland et al.
Dow
nloa
ded
by [
"Uni
vers
ity a
t Buf
falo
Lib
rari
es"]
at 0
7:44
13
June
201
2
of the seven met the Bond and Fox (2007) threshold for substantively meaningfulDIF, meaning an item for which the probability that one group would get it correctvs. a comparison group was more than .5 logits, conditioning on ability. Thoseitems and comparisons were: item 1, English vs. Spanish (b= .90 logits; oddsratio = 2.45); item 2, English vs. Spanish (b= 1.17 logits; odds ratio = 3.23); item 6,prekindergarten vs. kindergarten (b =�1.18 logits; odds ratio = .31). Given thatthere were no items that showed DIF in both samples, we interpret these results asindicating that DIF in the Short Form is limited; that is, the Rasch-estimated abilityscores from the Short Form are representative of the individual’s true mathematicalcompetence. Further, we find the limited detected DIF acceptable, given that thepurpose of the assessment is to serve as an early mathematics screener and not tomake any highly consequential, high-stakes decisions about student performance,subsequent classroom placements or programme admission.
RQ 6: Could a stop rule be used with the Short Form without substantial loss ofinformation?
Stop rules are commonly used in early childhood assessments, including language,literacy and executive function tests (Dunn & Dunn, 1997; Frye, Zelazo, & Palfai,1995; Gathercole & Pickering, 2000; Woodcock et al., 2001; Zelazo, 2006). Theyhelp to prevent test-taker fatigue and feelings of frustration, which is particularlybeneficial in populations of young children, given their shorter attention spans. Thebasic principle behind their use is that, assuming items are arranged in order fromleast to most difficult, after a child misses a certain number of consecutive items,they are unlikely to get any subsequent harder items correct. Discontinuing the testthus results in little, if any, loss of information (Watson & Pelli, 1983).
The most current version of the full REMA employs a stop rule. More specifi-cally, the full REMA is divided into geometry and numeracy sections and withinthe two sections, items are ordered from least to most difficult. After the childmisses three consecutive items within a section that section is discontinued.
Because of the described advantages of stop rules, we explored whether apply-ing the same test structure and stop rule on the REMA Short Form would result inloss of information that would substantially affect Rasch-estimated ability scores.Within Sample 1,9 we divided the 19 items into geometry and numeracy sections,arranged the items within section by difficulty (least to most) and estimated the rawtotals within section with the stop rule of three in place. The mean raw scores atthe person-level for geometry and numeracy were extremely close with and withoutthe stop rule (geometry – 6.36 with and 6.39 without; numeracy – 5.93 with and6.11 without).
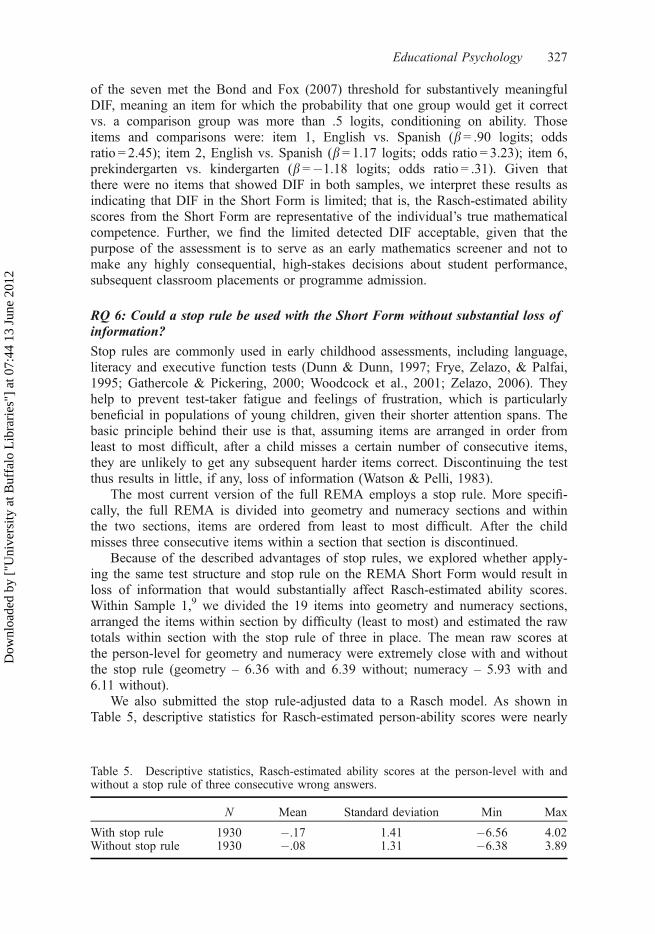
We also submitted the stop rule-adjusted data to a Rasch model. As shown inTable 5, descriptive statistics for Rasch-estimated person-ability scores were nearly
Table 5. Descriptive statistics, Rasch-estimated ability scores at the person-level with andwithout a stop rule of three consecutive wrong answers.
N Mean Standard deviation Min Max
With stop rule 1930 �.17 1.41 �6.56 4.02Without stop rule 1930 �.08 1.31 �6.38 3.89
Educational Psychology 327
Dow
nloa
ded
by [
"Uni
vers
ity a
t Buf
falo
Lib
rari
es"]
at 0
7:44
13
June
201
2
identical between the two samples. Further, person-level estimated ability scoreswith and without the stop rule showed a correlation close to 1 (r= .99; p< .001), asdid Rasch-estimated item difficulties (r= .99; p< .001).
These results suggest that dividing the REMA Short Form into geometry andnumeracy sections, ordering items by Rasch-estimated difficulty and employing astop rule of three is advantageous. Mimicking the format of the full REMA wouldbe more consistent and less confusing for users of both tests. It also would help toprevent test fatigue among young children without any substantial or important lossof information about the child’s ability.
Discussion
Early mathematics ability is a strong predictor of later academic outcomes, strongerthan early reading ability and socio-emotional skills (Duncan et al., 2007). Yet,there are few validated, short measures mathematics skills that capture more thanlimited dimensions of this domain in the early childhood period. In this article, weevaluated the psychometric validity of a short form of a new, theory-based earlymathematics assessment that taps a broader range of the mathematical competenciescritical in early childhood. Our analyses indicated the Rasch model demonstratedadequate fit to the REMA Short Form items. The Short Form also provided infor-mation about students of differing ability levels, which is important given theintended purpose of the measure. Item functioning appeared robust across samplingdifferences. Calculated ability scores showed good concurrent validity with the fullREMA and Woodcock-Johnson Applied Problems subscale and good discriminantvalidity with the Woodcock-Johnson Letter-Word Identification subscale and thePPVT. Items showed little to no evidence of DIF across subgroups (free/reducedlunch status, home language, gender and treatment group status). In sum, theREMA Short Form appears to be a psychometrically valid assessment of prekinder-garten- and kindergarten-aged children’s early mathematics skills.
Although this study was conducted in districts that were at least partially imple-menting a specific early mathematics curriculum (Building Blocks), neither theREMA nor REMA Short Form is tied to any specific curriculum. Both measuresare consistent with Common Core State Standards that apply across curricula andare based on theory and empirical research regarding the developmental progres-sions, or trajectories, of mathematics competencies in the early years. Our DIF anal-ysis provides quantitative support for this point; in our Short Form analysis, wefound only one (out of 19) statistically significant instance of DIF by treatment orcontrol status (where treatment children were all exposed to the Building Blockscurriculum) in Sample 1, and we found that DIF did not exist in Sample 2. In addi-tion, also suggesting that the measures are not overly aligned with any specific cur-riculum, in two previous research studies, the full REMA has shown excellentconcurrent validity with other early mathematics measures (Clements et al., 2011;Klein et al., 2000). In the present study, the Short Form likewise showed strongconcurrent validity with the Applied Problems subscale. Further research on its usein settings that are implementing other curricula certainly would add to its evidencebase. However, for theoretical reasons and based on empirical evidence, we contendthat the REMA and REMA Short Form are valid for use in settings, independent ofany specific curriculum. Nonetheless, a limitation of our study is that all Sample 1and two-thirds of the Sample 2 settings were implementing the same curricula.
328 C. Weiland et al.
Dow
nloa
ded
by [
"Uni
vers
ity a
t Buf
falo
Lib
rari
es"]
at 0
7:44
13
June
201
2
A notable strength of our study is that our results are derived from large, diversesamples of urban prekindergarten and kindergarten students. Many of the subgroupsincluded in our study – particularly black, Hispanic, English Language Learnersand free/reduced lunch children – are exactly those for whom achievement gaps inmathematics have been observed elsewhere and for whom observed gaps haveraised concern (Clements et al., 2008; Ginsburg et al., 2008; Magnuson & Waldfo-gel, 2008; National Center for Education Statistics, 2000). The evidence presentedin this paper suggests that the REMA Short Form is appropriate for use in diversepopulations of young children. Future research is needed, however, to confirm thatit works as well with rural and higher income populations, or children who are notin any formal preschool programme.
Given the increased interest in early mathematics education and assessment, ourresults are quite encouraging. Like its long-form parent, the REMA Short Form isone of the few measures of children’s early mathematics skills that is theory basedand includes geometry and spatial reasoning. It is relatively simple to administer,requiring a testing session of approximately 15–20min. With a stop rule, adminis-tration time would be even shorter. Thus, on a practical level, within a single testingsession, it can be combined with measures of child skills in other domains such asliteracy and language.
Outside of the research domain, the REMA Short Form may be a useful tool forformative assessment by classroom teachers during the school year. The ease andbrevity of administration, as well as its strong predictive relationship with the fullREMA, suggest the Short Form could provide a useful snapshot of developmentalmathematical competencies while also flagging students falling behind. Given class-room teachers are increasingly asked to conduct a broad range of assessments onchildren, the Short Form helps to reduce both teacher burden as well as child-test-ing fatigue. The Short Form could be used as a screening instrument for thoseentering school, or to ascertain which children in a class should be administered thefull REMA for diagnostic purposes at any time. However, additional research onthe utility of the Short Form in this context is needed. Further research is alsoneeded on using the REMA Short Form with a stop rule.
Our study makes an important contribution to the literature, given the develop-mental importance of early mathematics skills in predicting later academic outcomesand given that gaps in mathematics achievement may begin in prekindergarten.Improving child outcomes and fully understanding the effects of early educationinterventions aimed at improving children’s academic trajectories require measuresthat are both psychometrically sound and feasible, including in the importantdomain of mathematics skills. We believe the REMA Short Form is a step forwardin this direction.
Notes1. The Sample 1 school district was also the site of one of the school districts in Sample 2.
Assessment data were collected in different years.2. The overall study examined the efficacy of the Technology-enhanced, Research-based,
Instruction, Assessment, and professional Development (TRIAD) model (for more detailon TRIAD, see Clements, 2007).
3. Subitising that involves the quick recognition of small sets is perceptual subitising. TheREMA also assesses conceptual subitising, in which subsets are perceptually subitisedand then combined, all quickly and automatically, such as when a ‘12 domino’ is recog-
Educational Psychology 329
Dow
nloa
ded
by [
"Uni
vers
ity a
t Buf
falo
Lib
rari
es"]
at 0
7:44
13
June
201
2

nised (Sarama & Clements, 2009). Both are fast, automatic and accurate quantificationprocesses (not estimation nor involving explicit calculation).
4. As noted earlier, the Applied Problems subtest does not measure geometric and spatialcapacities and researchers have raised some concerns regarding the test’s appropriatenessand sensitivity in use with young children. Nonetheless, it is very widely used and weinclude in the present study for concurrent validity purposes.
5. We recognise that using the Rasch model instead of a 2- or 3-parameter model assumesthat items are equally discriminating and that the guessing parameter is zero (Weitzman,1996). While we considered using a 2- or a 3-parameter Item Response Theory (IRT)model, we chose the Rasch model, given the centrality of Rasch modelling to the devel-opment of the full REMA. Further, from a practical perspective, Rasch modelling pro-vides a simple, sample-independent conversion table from raw scores to ability scoresthat can be used by teachers and researchers who use the Short Form. By their nature,more complicated 2-parameter logistic model (PL) and 3-PL models do not have thispractical advantage. Further, while a 2- or a 3-parameter IRT model might provide moreaccurate scoring (and this is debatable in the empirical literature; see Weitzman, 2008),the Short Form’s intended purpose does not require such fine tuning.
6. An item with an infit or outfit statistic of >1.3 shows signs of underfit, meaning that itis not adequately distinguishing between children of differing abilities. Because no itemshowed inadequate infit and outfit statistics in both Samples 1 and 2, we allowed someflexibility in meeting this benchmark.
7. We report but do not interpret the standardised mean square infit and outfit statistics (‘tstandardized fit statistic (ZSTD)’ in Table 3), as these tend to reject items when the sam-ple size is large (Bond & Fox, 2007).
8. In Sample 1, treatment group status was equivalent to grade level, due to the multiplecohort design of that sample. This was not the case in Sample 2, where children withinthe same cohort were randomised to treatment/control group status.
9. We used only Sample 1 for this work because Sample 2 children took the full REMAusing a stop rule. Therefore, we are unable to use Sample 2 to determine how muchinformation was lost with the stop rule vs. without.
References
Andrich, D. (1988). Rasch models for measurement. Newbury Park, CA: Sage.Bond, T.G., & Fox, C.M. (2007). Applying the Rasch model: Fundamental measurement in
the human sciences. Mahwah, NJ: Lawrence Erlbaum.Bracken, B.A. (1984/1998). Bracken basic concept scale-revised. San Antonio, TX: The
Psychological Corporation, Harcourt Brace and Company.Butterworth, B. (1999). The mathematical brain. London: Macmillan.Cauffman, E., & MacIntosh, R. (2006). A Rasch differential item functioning analysis of the
Massachusetts Youth Screening Instrument: Identifying race and gender differential itemfunctioning among juvenile offenders. Educational and Psychological Measurement, 66(3), 502–521.
CCSSO/NGA. (2010). Common core state standards for mathematics (Vol. 2010). Washing-ton, DC: Council of Chief State School Officers and the National Governors AssociationCenter for Best Practices.
Cheng, Y., Chen, L., Liu, K, & Chen, Y. (2011). Development and psychometric evaluationof the school bullying scales: A Rasch measurement approach. Educational and Psycho-logical Measurement, 71(1), 200–216.
Chernoff, J.J., Flanagan, K.D., McPhee, C., & Park, J. (2007). Preschool: First findings fromthe third follow-up of the early childhood longitudinal study, birth cohort (ECLS-B)(NCES 2008–025). Washington, DC: National Center for Education Statistics, Instituteof Education Sciences, US Department of Education.
Clements, D.H. (2007). Curriculum research: Toward a framework for research-based curric-ula. Journal for Research in Mathematics Education, 38(1), 35–70.
Clements, D.H., & Sarama, J. (2004a). Building Blocks for early childhood mathematics.Early Childhood Research Quarterly, 19, 181–189.
330 C. Weiland et al.
Dow
nloa
ded
by [
"Uni
vers
ity a
t Buf
falo
Lib
rari
es"]
at 0
7:44
13
June
201
2
Clements, D.H., & Sarama, J. (2004b). Learning trajectories in mathematics education.Mathematical Thinking and Learning, 6, 81–89.
Clements, D.H., & Sarama, J. (2007). Effects of a preschool mathematics curriculum: Sum-mative research on the Building Blocks project. Journal for Research in MathematicsEducation, 38(2), 136–163.
Clements, D.H., & Sarama, J. (2007b). Early childhood mathematics learning. In F.K. LesterJr. (Ed.), Second handbook of research on mathematics teaching and learning (Vol. 1,pp. 461–555). New York, NY: Information Age.
Clements, D.H., & Sarama, J. (2007c). SRA real math, PreK-Building Blocks. Columbus,OH: SRA/McGraw-Hill.
Clements, D.H., Sarama, J.H., & Liu, X.H. (2008). Development of a measure of earlymathematics achievement using the Rasch model: The research-based early mathematicsassessment. Educational Psychology, 28(4), 457–482.
Clements, D.H., & Sarama, J.H. (2009). Early childhood mathematics education research:Learning trajectories for young children. New York, NY: Routledge.
Clements, D.H., Sarama, J.H., Spitler, M.E., Lange, A.A., & Wolfe, C.B. (2011). Mathemat-ics learned by young children in an intervention based on learning trajectories: A large-scale cluster randomized trial. Journal for Research in Mathematics Education, 127–166.
Clements, D.H., Sarama, J., & Wilson, D.C. (2001). Composition of geometric figures. InM. Van den Heuvel-Panhuizen (Ed.), Proceedings of the 25th Conference of the Interna-tional Group for the Psychology of Mathematics Education (Vol. 2, pp. 273–280). Utr-echt: Freudenthal Institute.
Clements, D.H., Wilson, D.C., & Sarama, J. (2004). Young children’s composition of geo-metric figures: A learning trajectory. Mathematical Thinking and Learning, 6, 163–184.
Confrey, J., Maloney, A., Nguyen, K., Mojica, G., & Myers, M. (2009). Equipartitioning/splitting as a foundation of rational number reasoning using learning trajectories. Paperpresented at the Proceedings of the 33rd Conference of the International Group for thePsychology in Mathematics Education, ThessalonikiGreece.
Daro, P., Mosher, F.A., Corcoran, T.B., Barrett, J., Battista, M.T., Clements, D.H., . . ., &Sarama, J. (2011). Learning trajectories in mathematics: A foundation for standards,curriculum, assessment, and instruction. New York, NY: Consortium for Policy Researchin Education (CPRE).
Duncan, G.J., Claessens, A., Huston, A.C., Pagani, L.S., Engel, M., Sexton, H., . . . Japel, C.(2007). School readiness and later achievement. Developmental Psychology, 43(6),1428–1446.
Dunn, L.M., & Dunn, L.M. (1997). Peabody picture vocabulary test-third edition. Bloom-ington, IN: Pearson Assessments.
Frye, D., Zelazo, P.D., & Palfai, T. (1995). Theory of mind and rule-based reasoning. Cogni-tive Development, 10(4), 483–527.
Gathercole, S.E., & Pickering, S.J. (2000). Working memory deficits in children with lowachievements in the national curriculum at 7 years of age. British Journal of EducationPsychology, 70, 177–194.
Geary, D.C. (2006). Development of mathematical understanding. In D. Kuhn, R.S. Siegler,W. Damon, & R.M. Lerner (Eds.), Handbook of child psychology: Volume 2: Cognition,perception, and language (6th ed., pp. 777–810). Hoboken, NJ: Wiley.
Ginsburg, H.P., & Baroody, A.J. (2003). Test of early mathematics ability (3rd ed.). Austin,TX: Pro-ed.
Ginsburg, H.P., Cannon, J., Eisenband, J.G., & Pappas, S. (2006). Mathematical thinkingand learning. In K. McCartney & D. Phillips (Eds.), Handbook of Early Child Develop-ment (pp. 208–229). Oxford: Blackwell.
Ginsburg, H.P., Lee, J.S., & Boyd, J.S. (2008). Mathematics education for young children:What it is and how to promote it. Social Policy Report, 22(1), 3–22.
Gormley, W.T., Gayer, T., Phillips, D., & Dawson, B. (2005). The effects of universal pre-Kon cognitive development. Developmental Psychology, 41(6), 872–884.
Howes, C., Burchinal, M., Pianta, R., Bryant, D., Early, D., Clifford, R., & Barbarin, O.(2008). Ready to learn? Children’s pre-academic achievement in pre-kindergarten pro-grams. Early Childhood Research Quarterly, 23(1), 27–50.
Educational Psychology 331
Dow
nloa
ded
by [
"Uni
vers
ity a
t Buf
falo
Lib
rari
es"]
at 0
7:44
13
June
201
2
Klein, A., Starkey, P., & Wakeley, A. (2000). Child Math Assessment: Preschool battery(CMA). Berkeley, CA: University of California.
Linacre, J.M. (2005). A user’s guide to Winsteps/Ministep Rasch-model computer program.Chicago, IL: Winsteps.com.
Love, J.M., Kisker, E.E., Ross, C., Raikes, H., Constantine, J., Boller, K., . . . Vogel, C.(2005). The effectiveness of early head start for 3-year-old children and their parents:Lessons for policy and programs. Developmental Psychology, 41(6), 885–901.
Magnuson, K., & Waldfogel, J. (2008). Steady gains and stalled progress: Inequality andthe black-white test score gap. New York, NY: Russell Sage.
Mansfield, H.M., & Scott, J. (1990). Young children solving spatial problems. In G. Booker,P. Cobb, & T.N deMendicuti (Eds.), Proceedings of the 14th Annual Conference of theInternational Group for the Psychology of Mathematics Education (Vol. 2, pp. 275–282). Oaxlepec: Internation Group for the Psychology of Mathematics Education.
Martiniello, M. (2008). Language and the performance of English-language learners in mathword problems. Harvard Educational Review, 78(2), 333–368.
Masters, G.N. (1982). A Rasch model for partial credit scoring. Psychometrika, 47, 149–174.National Center for Education Statistics. (2000). America’s kindergartners (NCES 2000070).
Washington, DC: US Government Printing Office.National Research Council. (2009). Mathematics in early childhood: Learning paths toward
excellence and equity. Washington, DC: National Academy Press.Peisner-Feinberg, E., Burchinal, M.R., Clifford, R.M., Culkin, M.L., Howes, C., Kagan, S.
L., & Yazejian, N. (2001). The relation of preschool child-care quality to children’s cog-nitive and social developmental trajectories through second grade. Child Development,72(5), 1534.
Rasch, G. (1980). Probabilistic models for some intelligence and attainment tests. Chicago,IL: University of Chicago Press.
Sales, C. (1994). A constructivist instructional project on developing geometric problemsolving abilities using pattern blocks and tangrams with young children. Cedar Falls,IA: Masters, University of Northern Iowa.
Sarama, J., & Clements, D.H. (2002). Building Blocks for young children’s mathematicaldevelopment. Journal of Educational Computing Research, 27(1&2), 93–110.
Sarama, J., & Clements, D.H. (2009). Early childhood mathematics education research:Learning trajectories for young children. New York, NY: Routledge.
Sarama, J., Clements, D.H., & Vukelic, E.B. (1996). The role of a computer manipulative infostering specific psychological/mathematical processes. In E. Jakubowski, D. Watkins,& H. Biske (Eds.), Proceedings of the 18th Annual Meeting of the North America Chap-ter of the International Group for the Psychology of Mathematics Education (Vol. 2, pp.567–572). Columbus, OH: ERIC Clearinghouse for Science, Mathematics and Environ-mental Education.
Sarama, J., Clements, D.H., & Wolfe, C.B. (2010). Tools for early mathematics assessment’instrument and manual. Columbus, OH: McGraw-Hill.
Sarama, J.H., Clements, D.H., Wolfe, C.B., & Spitler, M.E. (submitted for publication).Longitudinal evaluation of a scale-up model for teaching mathematics with trajectoriesand technologies: Persistence of effects in the third year. American Education ResearchJournal.
Schickedanz, J., & Dickinson, D. (2005). Opening the world of learning. Iowa City, IA:Pearson.
Thissen, D., Steinberg, L., & Kuang, D. (2002). Quick and easy implementation of the Ben-jamini–Hochberg procedure for controlling the false discovery rate in multiple compari-sons. Journal of Educational and Behavioral Statistics, 27, 77–83.
US Department of Health and Human Services. (2010). Head start impact study: Finalreport. Washington, DC: Administration for Children and Families, Office of Planning,Research and Evaluation.
Vurpillot, E. (1976). The visual world of the child. New York, NY: International UniversitiesPress.
Watson, A.B., & Pelli, D.G. (1983). QUEST: A Bayesian adaptive psychometric method.Perception & Psychophysics, 33, 113–120.
332 C. Weiland et al.
Dow
nloa
ded
by [
"Uni
vers
ity a
t Buf
falo
Lib
rari
es"]
at 0
7:44
13
June
201
2

Weitzman, R.A. (1996). The Rasch model plus guessing. Educational and PsychologicalMeasurement, 56, 779–790.
Weitzman, R.A. (2008). Fitting the Rasch model to account for variation in item discrimina-tion. Educational and Psychological Measurement, 69(2), 216–231.
Williams, V.S.L., Jones, L.V., & Tukey, J.W. (1999). Controlling error in multiple compari-sons, with examples from state-to-state differences in educational achievement. Journalof Educational and Behavioral Statistic, 24(1), 42–69.
Wilson, M. (2009). Measuring progressions: Assessment structures underlying a learningprogression. Journal of Research in Science Teaching, 46, 716–730.
Wong, V.C., Cook, T.D., Barnett, W.S., & Jung, K. (2008). An effectiveness-based evalua-tion of five state prekindergarten programs. Journal of Policy Analysis and Management,27(1), 122–154.
Woodcock, R.W., McGrew, K.S., & Mather, N. (2001). Woodcock-Johnson tests of achieve-ment. Itasca, IL: Riverside.
Zelazo, P.D. (2006). The dimensional change card sort (DCCS): A method of assessingexecutive function in children. Nature Protocols, 1(1), 297–301.
Zumbo, B.D. (2007). Three generations of DIF analyses: Considering where it has been,where it is now, and where it is going. Language Assessment Quarterly, 4(2), 223–233.
Educational Psychology 333
Dow
nloa
ded
by [
"Uni
vers
ity a
t Buf
falo
Lib
rari
es"]
at 0
7:44
13
June
201
2