earlier, more frequent, more dangerous: bushfires in new
TRANSCRIPT
EarliEr, morE frEquEnt, morE dangErous:BushFires in neW souTh WAles
ClimateCOuNCil.ORG.au
The Climate Council is an independent, crowd-funded organisation
providing quality information on climate change to the Australian public.
Thank you for supporting the Climate Council.
twitter.com/climatecouncil
facebook.com/climatecouncil [email protected]
climatecouncil.org.au
Published by the Climate Council of Australia limited
isBn: 978-1-925573-36-7 (print) 978-1-925573-37-4 (web)
© Climate Council of Australia ltd 2017
This work is copyright the Climate Council of Australia ltd. All material contained in this work is copyright the Climate Council of Australia ltd except where a third party source is indicated.
Climate Council of Australia ltd copyright material is licensed under the Creative Commons Attribution 3.0 Australia license. To view a copy of this license visit http://creativecommons.org.au.
You are free to copy, communicate and adapt the Climate Council of Australia ltd copyright material so long as you attribute the Climate Council of Australia ltd and the authors in the following manner:
earlier, More Frequent, More Dangerous: Bushfires in new south Wales by Professor lesley hughes and Dr David Alexander.
The authors retain sole responsibility for the contents of this report. We would like to thank Martyna Kotowska and Dylan Pursche for their assistance in preparing the report.
—
Cover image credit: “Bushfire close up at night“ by VanderWolf images, shutterstock image library.
This report is printed on 100% recycled paper.
Professor Lesley Hughes
Climate Councillor
Dr David Alexander
researcher,
Climate Council

ContentsKey Findings .................................................................................................................................................................................... 2
1. Introduction ............................................................................................................................................................................. 4
2. Bushfire Outlook 2017/2018 ................................................................................................................................................. 5
3. The Climate Change Influence on Bushfires ................................................................................................................. 8
4. Impacts of Bushfires ............................................................................................................................................................ 10
4.1 health impacts 11
4.2 economic impacts 12
4.3 environmental impacts 13
5. Future Projections of Bushfires ........................................................................................................................................14
6. Implications of Increasing Fire Activity .........................................................................................................................16
References 19
Image Credits 23
Fire Danger Rating 24
Preparing for a Bushfire in NSW 25
1CLIMATE COUNCIL
2
Key Findings
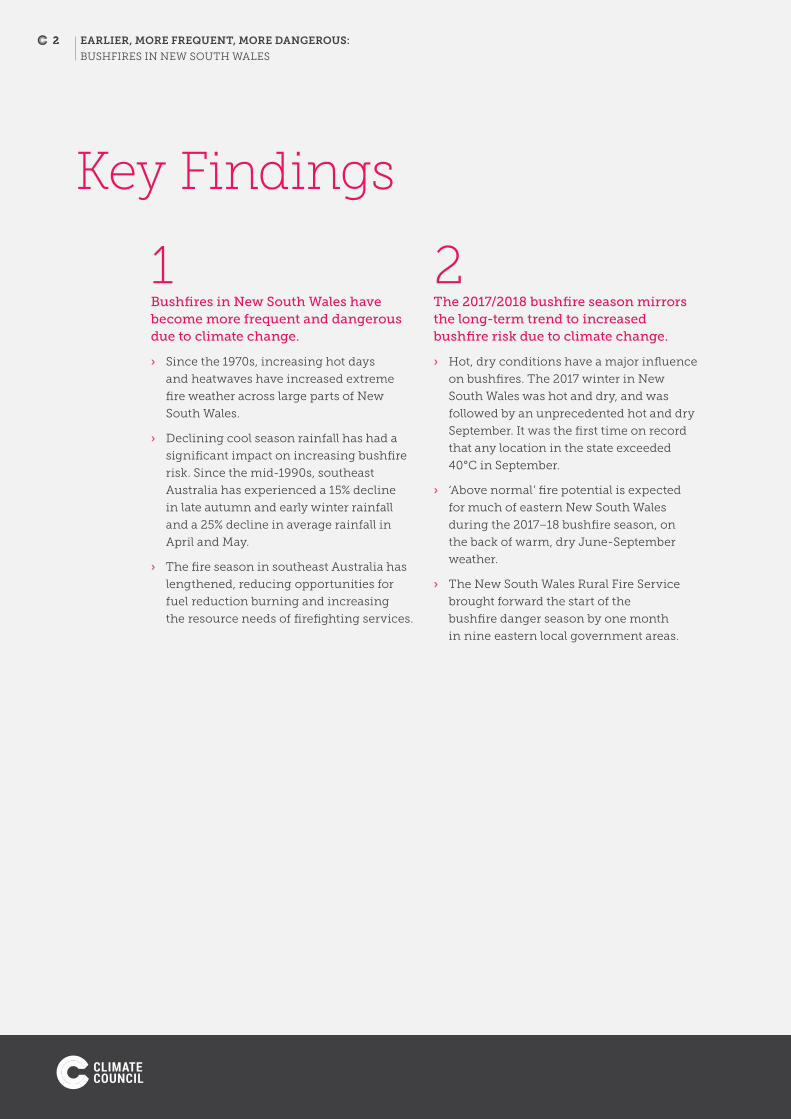
Bushfires in New South Wales have become more frequent and dangerous due to climate change.
› since the 1970s, increasing hot days
and heatwaves have increased extreme
fire weather across large parts of new
south Wales.
› Declining cool season rainfall has had a
significant impact on increasing bushfire
risk. since the mid-1990s, southeast
Australia has experienced a 15% decline
in late autumn and early winter rainfall
and a 25% decline in average rainfall in
April and May.
› The fire season in southeast Australia has
lengthened, reducing opportunities for
fuel reduction burning and increasing
the resource needs of firefighting services.
The 2017/2018 bushfire season mirrors the long-term trend to increased bushfire risk due to climate change.
› hot, dry conditions have a major influence
on bushfires. The 2017 winter in new
south Wales was hot and dry, and was
followed by an unprecedented hot and dry
september. it was the first time on record
that any location in the state exceeded
40°C in september.
› ‘Above normal’ fire potential is expected
for much of eastern new south Wales
during the 2017–18 bushfire season, on
the back of warm, dry June-september
weather.
› The new south Wales rural Fire service
brought forward the start of the
bushfire danger season by one month
in nine eastern local government areas.
1 2
2 EarliEr, morE frEquEnt, morE dangErous:
Bushfires in new south wales

key findings 3
Bushfires have a major negative impact on public health, the economy and the environment in New South Wales.
› Bushfire smoke can seriously affect
human health because it contains
respiratory irritants, as well as
inflammatory and cancer causing
chemicals. The elderly, infants and
those with chronic heart or lung diseases
are at highest risk. increasing frequency
and severity of bushfire conditions will
thus have a flow-on effect to negative
health outcomes.
› Bushfire costs in new south Wales are
likely to more than double by mid-century
to over $100 million per year. These
estimates are conservative, because
they do not factor in climate change.
› increasing fire frequency is affecting
freshwater resources, many plants and
animals, and has ongoing implications
for ecosystem health.
In the future, New South Wales is very likely to experience an increased number of days with dangerous fire weather.
› Fire severity and intensity is expected to
increase substantially in coming decades,
especially in those regions currently most
affected by bushfires.
› The increasing length of the fire season
is reducing the window of opportunity
for hazard reduction at the same time
as the need for hazard reduction is
becoming greater.
› increased resources for emergency
services and fire management agencies
will be required as fire risk increases.
› As bushfires seasons increasingly overlap
in both hemispheres, sharing resources,
for example firefighting personnel or
fire bombers, will become increasingly
impractical.
› Communities, emergency services
and health services must keep preparing
for a future with increasingly higher
bushfire risk.
› Tackling climate change through reducing
pollution from fossil fuel burning in
new south Wales and Australia is critical.
3 4
3
climatecouncil.org.au
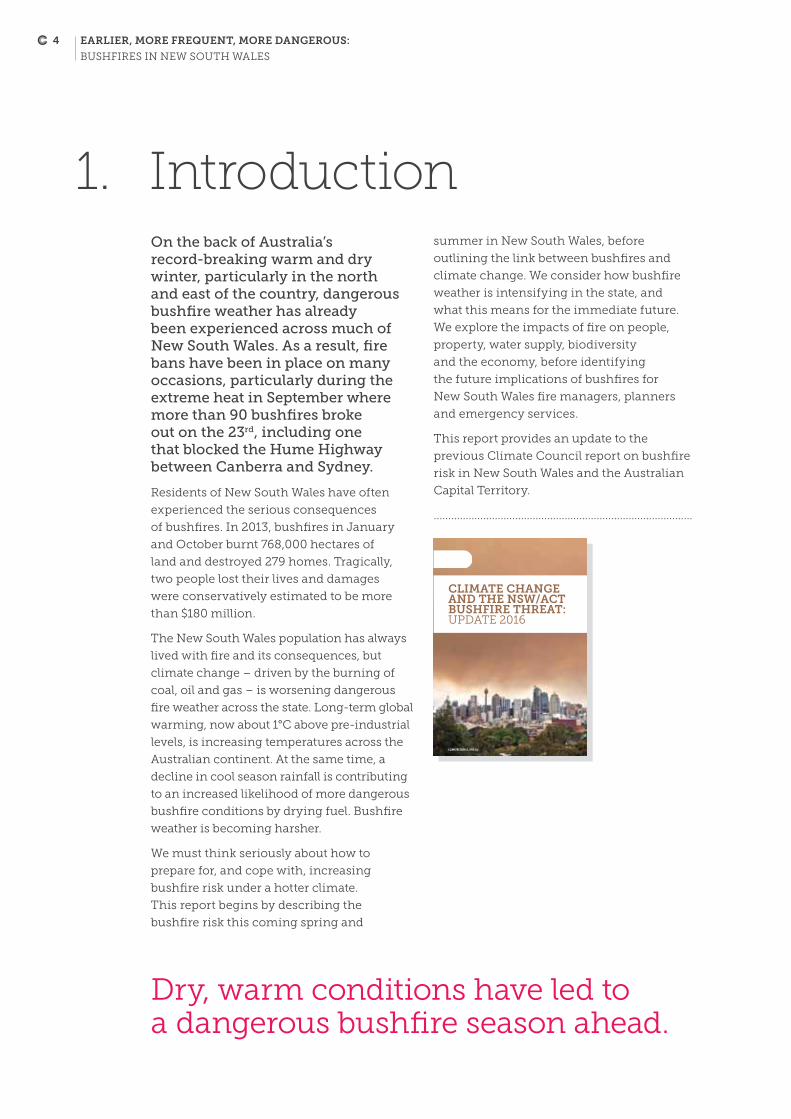
On the back of Australia’s record-breaking warm and dry winter, particularly in the north and east of the country, dangerous bushfire weather has already been experienced across much of New South Wales. As a result, fire bans have been in place on many occasions, particularly during the extreme heat in September where more than 90 bushfires broke out on the 23rd, including one that blocked the Hume Highway between Canberra and Sydney.
residents of new south Wales have often
experienced the serious consequences
of bushfires. in 2013, bushfires in January
and october burnt 768,000 hectares of
land and destroyed 279 homes. Tragically,
two people lost their lives and damages
were conservatively estimated to be more
than $180 million.
The new south Wales population has always
lived with fire and its consequences, but
climate change – driven by the burning of
coal, oil and gas – is worsening dangerous
fire weather across the state. long-term global
warming, now about 1°C above pre-industrial
levels, is increasing temperatures across the
Australian continent. At the same time, a
decline in cool season rainfall is contributing
to an increased likelihood of more dangerous
bushfire conditions by drying fuel. Bushfire
weather is becoming harsher.
We must think seriously about how to
prepare for, and cope with, increasing
bushfire risk under a hotter climate.
This report begins by describing the
bushfire risk this coming spring and
1. Introductionsummer in new south Wales, before
outlining the link between bushfires and
climate change. We consider how bushfire
weather is intensifying in the state, and
what this means for the immediate future.
We explore the impacts of fire on people,
property, water supply, biodiversity
and the economy, before identifying
the future implications of bushfires for
new south Wales fire managers, planners
and emergency services.
This report provides an update to the
previous Climate Council report on bushfire
risk in new south Wales and the Australian
Capital Territory.
.........................................................................................
Dry, warm conditions have led to a dangerous bushfire season ahead.
CLIMATE CHANGE AND THE NSW/ACT BUSHFIRE THREAT: UPDATE 2016
CLIMATECOUNCIL.ORG.AU
4 EarliEr, morE frEquEnt, morE dangErous:
Bushfires in new south wales

JuNe-SePtemBeR Climate ReCORDS Many heat and low rainfall records were
broken in new south Wales from June to
september in 2017 (Figure 1). As a result, the
hot, dry conditions have set the scene for a
dangerous bushfire season ahead. here are
a selection of records and weather details
for this period (BoM 2017a):
June:
› 38 records in regional towns across
the state were broken for the driest
June on record.
› new south Wales had its driest June
since 2002.
July:
› 35 records were broken for the hottest
July temperature on record at a number
of locations across new south Wales,
including sydney which set a record
high of 26.5°C.
› statewide rainfall for July was about
70% below the long-term July average.
2. Bushfire Outlook 2017/2018
august:
› rainfall was 44% below average.
› Maximum temperatures were 1.17°C above
average across new south Wales.
september:
› The average maximum temperature was
more than 2°C above average for the state.
› sydney had the driest start to spring
since observations began in 1858, with
observatory hill recording only 0.2 mm.
› Wanaaring in regional new south Wales
set a new state september record of 41.4°C.
no locations in the state had previously
exceeded 40°C in this month.
› new south Wales broke 61 records for low
rainfall and 76 high temperature records.
› some parts of new south Wales
experienced temperatures 16°C above
average on september 23, the state’s
overall warmest september day on record.
Data from the Bureau of Meteorology’s climate summary archives, available at: http://www.bom.gov.au/climate/current/statement_archives.shtml. More records can also be found in BoM’s special Climate statement on the september extreme heat: http://www.bom.gov.au/climate/current/statements/scs62.pdf.
Figure 1: sunset in sydney. hotter than average days, including sydney’s hottest July day marked a warm and dry winter in the city and across new south Wales.
5chapter 02
Bushfire OutlOOk 2017/2018

SeaSONal OutlOOK Fortunately, maximum temperatures appear
set to be average or below average across
much of new south Wales through to
January, according to the latest (12 october)
climate outlook from the Bureau of
Meteorology (BoM 2017b). rainfall is likely
to be average or slightly above average,
particularly in the far southeast of the state.
however, the exceptionally dry and warm
conditions that persisted through winter
has led to above normal fire potential
predicted for many areas, including sydney,
newcastle, Armidale, Port Macquarie,
Jindabyne, Batemans Bay, Tamworth and
orange, as well as the Australian Capital
Territory (Bushfire and natural hazards
CrC 2017; Figure 2).
The climate models also indicate that
the el niño southern oscillation (enso)
– a large-scale climate pattern that can
either bring dry (el niño) or wet (la niña)
conditions to the east of the country
– will be neutral for the remainder of
the year (BoM 2017b). in el niño years,
bushfire risk is typically elevated in
eastern Australia due to drier than normal
conditions. The neutral enso conditions
mean that the fire conditions projected
for this spring and summer are even
more unusual.
figure 2(a): Bushfire outlook for the 2017/2018 bushfire season. Magenta areas show above normal bushfire potential. new south Wales has above normal fire potential in the east of the state. (b) rainfall deficiencies for the June to september period. sources: Bushfire and natural hazards CrC 2017; BoM 2017c.
(a) (b)
6 EarliEr, morE frEquEnt, morE dangErous:
Bushfires in new south wales

tHe FiRe SeaSON SO FaRWarm, dry weather over winter has led to
an early start to the 2017 bushfire season
(Figure 3; Boer et al. 2017). The new south
Wales rural Fire service brought forward
the start of the bushfire danger season
to 1 september in nine eastern local
government areas, one month earlier than
usual due to the prevailing dry conditions
(nsW rFs 2017). During the peak of the
extreme heat on september 23, more than
90 bushfires were reported across the state,
with 12 total fire bans in effect (BoM 2017d).
Fire danger weather also exceeded extreme
levels at many sites across the rest of Australia
from 22–27 september, with the highest
values in inland areas (BoM 2017d).
figure 3: A hazard reduction burn being conducted by the new south Wales rural Fire service. With the bushfire season starting early, there is less opportunity to perform such preventative burns.
7chapter 02
Bushfire OutlOOk 2017/2018

A fire needs to be started (ignition), it needs something to burn (fuel), and it needs conditions that are conducive to its spread (appropriate weather). Climate change, primarily driven by the burning of fossil fuels – coal, oil and gas – can affect all of these factors in both straightforward and more complex ways.
The role of climate change in ignition is
likely to be relatively small compared to its
impact on fuel and weather, but may still be
significant. lightning accounts for ~27% of
the ignitions in the sydney region (Bradstock
2008) and the incidence of lightning is
sensitive to weather conditions, including
temperature. one modelling study has
predicted that lightning strikes in the us
could increase 12±5% for every degree of
global warming, and as much as 50% over
the coming century (romps et al. 2014).
Climate change can also affect fuel. For
example, a lack of rainfall can dry out the soil
and vegetation, making existing fuel more
combustible. Dead vegetation can dry to
a critical threshold to sustain severe fires
in a matter of a few weeks (nolan et al.
2016). The 2013 october bushfires in the
Blue Mountains provide a good example
(e.g. Figure 4). These bushfires were preceded
by the warmest september on record for
the state, the warmest 12 months on record
3. The Climate Change Influence on Bushfires
for Australia, and below average rainfall
in forested areas, leading to very dry fuels
(Bushfire CrC 2013).
But whilst climate change can affect
ignition and fuel, it is weather that is the
most important factor affecting the spread,
size and severity of bushfires (Penman et
al. 2014; Price et al. 2015; Price et al. 2016).
increasing greenhouse gas emissions from
the burning of fossil fuels, are increasing
the amount of heat in the atmosphere. in
turn, the frequency and severity of very hot
days are increasing and this is driving up
the likelihood of fire danger weather. The
latest intergovernmental Panel on Climate
Change (iPCC) report concluded with high
confidence that climate change is increasing
the number of days with very high and
extreme fire weather, particularly in southern
Australia (iPCC 2014).
since the 1970s, there has been an increase
in extreme fire weather and a lengthening of
the fire season across large parts of Australia,
particularly in southern and eastern regions,
due to increases in extreme hot days and
drying (Csiro and BoM 2016). since the
mid-1990s, southeast Australia has also
experienced a 15% decline in late autumn
and early winter rainfall, and a 25% decline
in average rainfall in April and May (Csiro
and BoM 2014).
There has been an increase in extreme fire weather in the southeast of Australia over the last 40 years.
8 EarliEr, morE frEquEnt, morE dangErous:
Bushfires in new south wales

figure 4: Firefighters using a monitor (high-capacity water gun) while fighting a fire at Mt. riverview in the Blue Mountains in october 2013.
The influence of hotter, drier weather
conditions on the likelihood of bushfire
spread is captured by changes in the Forest
Fire Danger index (FFDi), an indicator of
dangerous fire weather. Analysis of changes
in the FFDi (1973–2010) since the 1970s
has shown that extreme fire weather has
increased significantly at 16 of 38 weather
stations across Australia, with the majority
of these stations concentrated in Australia’s
southeast, with none of the stations
recording a significant decrease (Clarke et
al. 2013). These changes have been most
marked in spring, indicating a lengthening
fire season across southern Australia,
with fire weather extending into october
and March. The lengthening fire season
means that opportunities for fuel reduction
burning are decreasing (Matthews et al. 2012;
Ximenes et al. 2017).
Burning coal, oil and gas is increasing bushfire risk.

In New South Wales, bushfires have a very wide range of human and environmental impacts, including loss of life and severe health effects, damage to property, devastation of communities and effects on water and natural ecosystems (Figure 5).
4. Impacts of Bushfires
CLIMATE CHANGE IS INCREASING
BUSHFIRE RISKIN NEW SOUTH WALES
BUSHFIRE SEASONS STARTING EARLIER LASTING LONGER
8/10 OF THE HOTTEST YEARS ON RECORD SINCE 2002
77 CIVILIAN DEATHS SINCE 1901
$45 MILLION IN BUSHFIRE COSTS ANNUALLY
ECONOMIC COSTS SET TO DOUBLE BY 2050
figure 5: Climate change is increasing the bushfire risk in new south Wales.
10 EarliEr, morE frEquEnt, morE dangErous:
Bushfires in new south wales

chapter 04
Impacts of bushfIres
4.1 Health Impacts
large populations in new south Wales are
at risk from the health impacts of bushfires,
which have contributed to physical and
mental illness as well as death. Communities
in new south Wales are particularly
vulnerable because many people live close
to highly flammable native vegetation, such
as eucalyptus trees (Chen and McAneney
2010; handmer et al. 2012; Price and
Bradstock 2013). Tragically, there have been
77 known civilian fatalities in new south
Wales between 1901 and 2011 (Blanchi
et al. 2014).
Bushfire smoke can seriously affect
health because it contains respiratory
irritants as well as inflammatory and
cancer-causing chemicals (Figure 6). smoke
can be transported in the atmosphere many
kilometres from the fire front, affecting air
quality and exposing large populations to
its impacts (Bernstein and rice 2013; rea
et al. 2016). The estimated annual health
costs of bushfire smoke in sydney are also
high, at $8.2 million per annum (2011$)
(Deloitte Access economics 2014). smoke
events, whether from hazard reduction
burning or wildfire, are associated with
figure 6: Bushfire smoke from the Blue Mountains blankets sydney in 2013.
increased ambulance callouts and emergency
admissions, with immediate impacts
on people with respiratory conditions,
and lagged impacts on people with heart
conditions (Johnston et al. 2014; haikerwal
et al. 2015; salimi et al. 2017). The impacts of
bushfire smoke in the community are also
uneven, with the elderly, infants and those
with pre-existing heart or lung diseases at
higher risk (Morgan et al. 2010; liu et al. 2015).
in addition to physical health impacts, the
trauma and stress of experiencing a bushfire
can also increase depression, anxiety, and
other mental health issues, both in the
immediate aftermath of the trauma and for
months or years afterwards (McFarlane and
raphael 1984; sim 2002; Whittaker et al.
2012). Following the 2013 Blue Mountains
bushfires, mental health charity ‘Beyond
Blue’ collaborated with the Australian red
Cross to develop resources to assist bushfire
victims experiencing increases in depression
and anxiety (Beyond Blue 2013a; 2013b) and
over 100 households requested wellbeing
assistance from red Cross volunteers
(red Cross 2013).
11

4.2 Economic Impacts
The economic cost of bushfires – including
loss of life, livelihoods, property damage
and emergency services responses – is very
high. The total economic cost of bushfires
in Australia, a measure that includes insured
losses as well as broader social costs, is
estimated to be approximately $375 million
per year (2011$), a figure expected to reach
$800 million by 2050 (Deloitte Access
economics 2014).
The annual economic costs of bushfires in
new south Wales is estimated to average $45
million per annum (2011$) and by about mid-
century these costs could more than double
(Deloitte Access economics 2014). These
estimates take into account increases in the
number of households, growth in the value
of housing stock, population growth, and
increasing infrastructure density. however,
they do not incorporate increased bushfire
incident rates due to climate change and
figure 7: home destroyed in Yellow rock, during the october 2013 Blue Mountains fires.
are therefore likely to be conservative. The
full economic cost of the health impacts
of bushfires are also poorly quantified
(Bowman and Johnston 2014).
new south Wales has already experienced a
significant increase in extreme fire weather
since the 1970s, and bushfires occurring
in new south Wales from 1970–2013
have contributed to at least 40 deaths, the
destruction of nearly 800 properties and
affected over 14 million hectares of land.
indirect costs, such as impacts on local
tourism industries can also be significant.
For example, a month after the 2013 Blue
Mountains bushfires, tourism operators
estimated losses of nearly $30 million due
to declines in visitors and cancellations
alone (ABC 2013), in addition to the more
than $180 million worth of insured losses
(iCA 2016; Figure 7).
12 EarliEr, morE frEquEnt, morE dangErous:
Bushfires in new south wales
chapter 04
Impacts of bushfIres
4.3 Environmental Impacts
Fire can affect the quality and quantity of
water in catchments and have significant
impacts on ecosystems. large-scale high
intensity fires that remove vegetation expose
topsoils to erosion and increased runoff
after subsequent rainfall (leigh et al. 2015;
Zhou et al. 2015). This can increase sediment
and nutrient concentrations in nearby
waterways, potentially making water supplies
unfit for human consumption (smith et al.
2011; iPCC 2014). Fires in the sydney region
in 2002 affected the Woronora pumping
station and water filtration plants, resulting
in a community alert to boil drinking water
(WrF 2013).
Fire is a regular occurrence in many
Australian ecosystems, and many species
have evolved strategies over millions of years
to not only withstand fire, but to benefit
from it (Crisp et al. 2011; Bowman et al. 2012).
Particular fire regimes (especially specific
combinations of fire frequency and intensity)
can favour some species and disadvantage
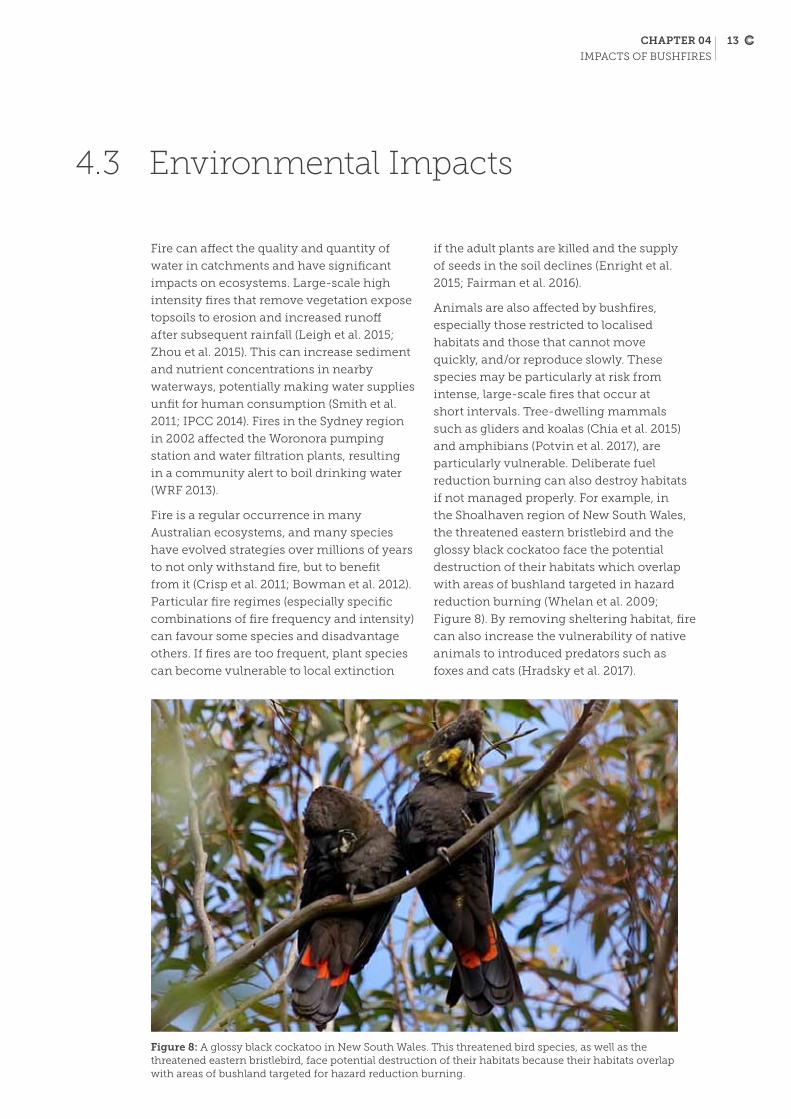
others. if fires are too frequent, plant species
can become vulnerable to local extinction
figure 8: A glossy black cockatoo in new south Wales. This threatened bird species, as well as the threatened eastern bristlebird, face potential destruction of their habitats because their habitats overlap with areas of bushland targeted for hazard reduction burning.
if the adult plants are killed and the supply
of seeds in the soil declines (enright et al.
2015; Fairman et al. 2016).
Animals are also affected by bushfires,
especially those restricted to localised
habitats and those that cannot move
quickly, and/or reproduce slowly. These
species may be particularly at risk from
intense, large-scale fires that occur at
short intervals. Tree-dwelling mammals
such as gliders and koalas (Chia et al. 2015)
and amphibians (Potvin et al. 2017), are
particularly vulnerable. Deliberate fuel
reduction burning can also destroy habitats
if not managed properly. For example, in
the shoalhaven region of new south Wales,
the threatened eastern bristlebird and the
glossy black cockatoo face the potential
destruction of their habitats which overlap
with areas of bushland targeted in hazard
reduction burning (Whelan et al. 2009;
Figure 8). By removing sheltering habitat, fire
can also increase the vulnerability of native
animals to introduced predators such as
foxes and cats (hradsky et al. 2017).
13
A number of studies on future fire activity all point in the same direction – weather conditions conducive to fire in the southeast of the continent, including New South Wales, are becoming increasingly frequent (Table 1). For example, FFDI values are expected to increase substantially by the end of the century (e.g. Clarke et al. 2011; CSIRO and BoM 2015; Clarke et al. 2016). Additionally, the number of severe fire weather days and severe fires is predicted to increase (CSIRO and BoM 2015; Zhu et al. 2015).
Future changes in the enso phenomenon
are also likely to have an influence on
fire activity. There is a strong positive
relationship between el niño events and fire
weather conditions in southeast and central
Australia (Williams and Karoly 1999; Verdon
et al. 2004; lucas 2005) and between el niño
events and actual fire activity (harris et al.
2013). it is likely that climate change is, and
will continue to, influence enso behaviour,
increasing extreme el-niño events (e.g.
1982/83, 1997/98, 2015/16) (Power et al. 2013;
Cai et al. 2014). such a change would, in turn,
increase the incidence of extreme heat and
drought (e.g. Figure 9), and thus potentially
increase fire activity in eastern Australia.
5. Future Projections of Bushfires
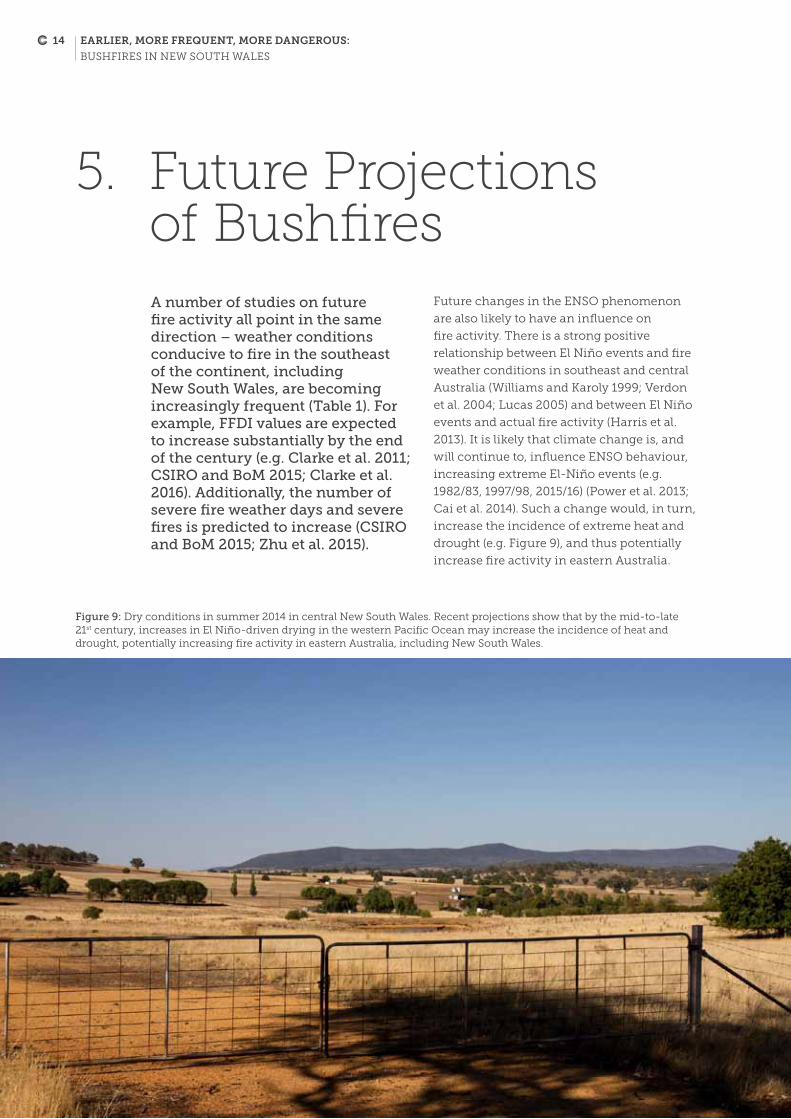
Figure 9: Dry conditions in summer 2014 in central new south Wales. recent projections show that by the mid-to-late 21st century, increases in el niño-driven drying in the western Pacific ocean may increase the incidence of heat and drought, potentially increasing fire activity in eastern Australia, including new south Wales.
14 EarliEr, morE frEquEnt, morE dangErous:
Bushfires in new south wales

chapter 05
Future projections oF bushFires
table 1: summary of projections from modelling studies aimed at projecting changes in fire risk in southeast Australia.
Study Projections
Beer and Williams (1995)
increase in FFDi with doubling of atmospheric carbon dioxide, commonly >10% across most of continent, especially in the southeast, with a few small areas showing decreases.
Williams et al. (2001)
General trend towards decreasing frequency of low and moderate fire danger rating days, but an increasing frequency of very high and in some cases extreme fire danger days.
hennessy (2007)
Potential increase of very high and extreme FFDi days in the range of 4–25% by 2020 and 15–70% by 2050.
lucas et al. (2007)
increases in annual FFDi of up to 30% by 2050 over historical levels in southeast Australia and up to a trebling in the number of days per year where the uppermost values of the index are exceeded. The largest changes are projected to occur in the arid and semi-arid interior of new south Wales and northern Victoria.
hasson et al. (2009)
Projected potential frequency of extreme events to increase from around 1 event every 2 years during the late 20th century to around 1 event per year in the middle of the 21st century, and to around 1 to 2 events per year by the end of the 21st century.
Clarke et al. (2011)
in the southeast, FFDi is projected to increase strongly by end of the 21st century, with the fire season extending in length and starting earlier.
Matthews et al. (2012)
A warming and drying climate is projected to produce drier, more flammable fuel, and to increase rate of fire spread.
Csiro and BoM (2015)
Projections of warming and drying in southern and eastern Australia will lead to increases in FFDi and a greater number of days with severe fire danger. in a business as usual scenario (worst case, driest scenario), severe fire days increase by up to 160-190% by 2090.
Zhu et al. (2015)
Projections of increased average daily FFDi in 2060–2079 compared to baseline period of 1990–2009 with spring being the season with greatest increases and western new south Wales proportionally more affected. Also project more frequent severe fires (FFDi 50–74).
Clarke et al. (2016)
Changes in climate and atmospheric Co2 are projected to increase fuel load. FFDi projections are variable depending on which climate scenario is used in modelling but overall projections are for increasing fuel load and fire weather in spring in both forested and grassland areas by the latter half of this century.
Bushfire weather is expected to become even more dangerous.
15
The population of new south Wales is
expected to grow from 7.7 million people
(as of March 2016) to 9.9 million people
by 2036 (nsW Department of Planning
and environment 2017). The steady urban
encroachment into bushland, along with
increasing fire danger weather, present
significant and growing challenges for new
south Wales. This challenge is exemplified
in greater sydney, a region considered to
be one of the most bushfire-prone areas in
Australia and home to a quarter of Australia’s
population. All areas on the periphery of
sydney are considered at risk from bushfires
(Price et al. 2015), with the risk highest for
those homes closest to bushland. in 2005,
190,000 homes in sydney were estimated
to be within 80m of a bushland boundary
(Chen 2005).
There is increasing interest in how
adaptation to an increasingly bushfire-
prone world may reduce vulnerability.
Current government initiatives centre on
planning and regulations; building designs
to reduce flammability; burying powerlines
in high risk areas and retrofitting electricity
systems; fuel management; fire detection
and suppression; improved early warning
systems; and community education
(Preston et al. 2009; Buxton et al. 2011;
o’neill and handmer 2012; King et al. 2013).
retrofitting to reduce fire vulnerability,
however, is expensive for households and
cost may be a significant disincentive
(Penman et al. 2017). The practice of
prescribed burning, where fires are lit in cool
weather to reduce the volume of fuel, can be
particularly challenging. For example, during
2012–13, the largest ever hazard reduction
burn was conducted in new south Wales,
with 330 burns carried out across 206,000 ha
of national parks (nsW Government 2014).
Fire managers are constantly faced with
balancing the need to reduce risk to life and
property whilst simultaneously conserving
biodiversity and environmental amenity, and
controlling air pollution near urban areas
(Penman et al. 2011; Williams and Bowman
2012; Altangerel and Kull 2013; Ximenes et
al. 2015; Williamson et al. 2016; holland et al.
2017). As noted above, the increasing length
of the fire season is reducing the window of
opportunity for hazard reduction at the same
time that the need for hazard reduction is
becoming greater. ongoing climate changes
is also affecting the ability of households
to prepare. For example, the dry conditions
prior to the 2013 fires in the Blue Mountains
meant that many households that relied
on dams and water tanks had limited
water available to prepare their properties
(Wilkinson and eriksen 2015).
6. Implications of Increasing Fire Activity
lengthening of the fire season reduces the opportunity for hazard reduction burns.
16 EarliEr, morE frEquEnt, morE dangErous:
Bushfires in new south wales

figure 10: Country Fire Authority firefighters in the foreground with elvis in the background – the erickson Air-Crane fire bomber – dumping of water to assist firefighters battling a blaze in Australia’s southeast. specialised firefighting aircraft like this are loaned for the bushfire seasons in both the northern and southern hemispheres each year. such aircraft are expensive to operate.
Australia’s fire and emergency services
agencies have recognised the implications
of climate change for bushfire risk and
firefighting resources for some time
(AFAC 2010). During the past decade, state
fire agencies have increasingly needed to
share suppression resources domestically
during peak demand periods. As climate
change increases the severity of bushfire
danger weather in new south Wales and
increases the fire season length, firefighting
services will be less able to rely on help from
interstate and across the world as fires occur
simultaneously (see Box 1 for implications
of the recent California wildfires). This is
a major challenge. substantially increased
resources for fire suppression and control
will be required. Most importantly, a
significant increase in the number of career
and volunteer firefighters will be needed.

While wildfires (referred to as bushfires in
Australia) are a common occurrence in
California, october 2017 has seen some of the
worst fires in the state’s history, with 40 deaths
and many missing, 5,700 homes and businesses
destroyed, and 100,000 people evacuated at the
time of publication (The Guardian 2017). The
fires spread rapidly to urban areas due to strong
winds, which followed months of record-high
temperatures and heavy winter rainfall (which
was not enough to break the prolonged drought
but did provide more fuel) (scientific American
2017; Figure 11). Generally, the risk of wildfires
in California is increasing due to increasing
extreme heat and drought, driven by climate
change (Yoon et al. 2014; Climate signals 2017).
‘Attribution’ studies, which quantify the
probability that a particular extreme weather
event was made more likely because of climate
change, reveal the impact of climate change
on worsening fire weather and the length
of fire seasons in California. For example, a
recent study on wildfires in the western united
states (us) by Abatzoglou and Williams (2016),
BOx 1: DeVaStatiNG CaliFORNia WilDFiReS: the Climate Change influence
figure 11: Destruction left by wildfires in santa rosa, California, october 2017.
has linked climate change to producing more
than half of the dryness (fuel aridity) of forests
since the 1970s, a doubling of the forest fire
area since the mid-1980s, and an increase in
the length of the fire season. Model simulations
by Barbero et al. (2015) show that the risk of
very large fires is likely to increase sixfold by
mid-century in some parts of the western us,
including California.
increasing fire season length and increasing
frequency of large fires in the us is likely
to add pressure to both Australia and the us
firefighting resources. For a number of years
now, the two countries have shared firefighting
resources, enabling states to request additional
personnel and equipment at short notice (niFC
2002). As fire seasons in the two hemispheres
increasingly overlap, such arrangements may
become increasingly impractical (handmer et
al. 2012). in particular, longer fire seasons have
implications for the availability and costs of
firefighting equipment, such as the elvis fire
bomber, leased from agencies in the northern
hemisphere (Figure 10).
18 EarliEr, morE frEquEnt, morE dangErous:
Bushfires in new south wales

references
Abatzoglou JT and Williams AP (2016) impact of anthropogenic climate change on wildfire across western us forests. Proceedings of the national Academy of the united states of America, Doi: 10.1073/pnas.1607171113.
ABC (2013) Tourism losses hit $30m after Blue Mountains bushfires. Accessed at: http://www.abc.net.au/news/2013-11-14/tourism-losses-hit-2430m-after-blue-mountainsbushfires/5090840.
AFAC (2010) Climate Change and the Fire and emergency services sector. Discussion paper prepared for the Australasian Fire and emergency service Authorities Council. Accessed at: https://wikis.utas.edu.au/download/attachments/12852129/AFAC_climate_change_discussion_paper_DrAFT_3_7_August_2009.pdf?api=v2.
Altangerel K and Kull CA (2013) The prescribed burning debate in Australia: conflicts and compatibilities. Journal of Environmental Planning and Management, 56: 103–120.
Barbero r, Abatzoglou JT, larkin nK, Kolden CA, stocks B (2015) Climate change presents increased potential for very large fires in the contiguous united states. International Journal of Wildland Fire, 24(7): 892–899.
Beer T and Williams A (1995) estimating Australian forest fire danger under conditions of doubled carbon dioxide concentrations. Climatic Change, 29: 169–188.
Bernstein As and rice MB (2013) lungs in a warming world: climate change and respiratory health. CHEST Journal, 143: 1455–59.
Beyond Blue (2013a) information for people living in bushfire affected areas. Accessed at: http://www.beyondblue.org.au/about-us/news/ news/2013/10/23/nswbushfire-victims-can-use-beyondblue-resources.
Beyond Blue (2013b) Bushfire affected Australians urged to go online for help. Accessed at: https://www.beyondblue.org.au/media/media-releases/media-releases/bushfireaffected-australians-urged-to-go-online-for-help.
Blanchi r, leonard J, haynes K, opie K, James M and de oliveira FD (2014) environmental circumstances surrounding bushfire fatalities in Australia 1901–2011 Environmental Science and Policy, 37: 192–203.
Boer M, nolan rh and Bradstock r (2017) Dry winter primes sydney Basin for early start of bushfire season. The Conversation, August 21. Accessed at: https://theconversation.com/dry-winter-primes-sydney-basin-for-early-start-of-bushfire-season-82641.
BoM (2017a) Climate summaries archive. Accessed at: http://www.bom.gov.au/climate/current/statement_archives.shtml.
BoM (2017b) Climate outlooks – monthly and seasonal. Accessed at: http://www.bom.gov.au/climate/outlooks/#/overview/summary.
BoM (2017c) 4-month rainfall deficiencies. Accessed at: http://www.bom.gov.au/climate/drought/.
BoM (2017d) special Climate statement 62 – exceptional september heat in eastern Australia. 5 october 2017. Accessed at: http://www.bom.gov.au/climate/current/statements/scs62.pdf.
Bowman D and Johnston F (2014) Bushfires, human health economics and pyrogeography. Geographical Research, 52: 340–343.
Bowman DMJs, Murphy BP, Burrows Ge and Crisp MD (2012) Fire regimes and the evolution of the Australian biota. in Flammable Australia: Fire regimes, biodiversity and ecosystems in a changing world (Bradstock rA, Gill AM, Williams rJ [eds.]), Csiro Publishing, Collingwood, ViC, pp. 27–48.
Bradstock rA (2008) effects of large fires on biodiversity in south-eastern Australia: disaster or template for diversity? International Journal of Wildland Fire, 17: 809–822.
Bushfire CrC (2013) southern Australia seasonal bushfire outlook 2013–14. Fire note issue 116. september 2013.
Bushfire and natural hazards CrC (2017) southern Australia seasonal Bushfire outlook 2017. hazard note, issue 38, november 2017. Accessed at: https://www.bnhcrc.com.au/hazardnotes/38.
Buxton M, haynes r, Mercer D and Butt A (2011) Vulnerability to bushfire risk at Melbourne’s urban fringe: The failure of regulatory land use planning. Geographical Research, 49: 1–12.
Cai W, Borlace s, lengaigne M et al. (2014) increasing frequency of extreme el niño events due to greenhouse warming. Nature Climate Change, 4: 111–116.
Chen K (2005) Counting bushfire-prone addressed in the greater sydney region. Proceedings of the symposium on Planning for natural hazards – how can we mitigate these impacts? university of Wollongong. Accessed at: http://www.riskfrontiers. com/publications/FireAus_nsW_paper.pdf.
References
19

Chen K and McAneney J (2010) Bushfire penetration into urban areas in Australia: a spatial analysis. report for the Bushfire CrC. Accessed at: http://www.bushfirecrc.com/sites/default/files/managed/resource/bushfire-penetrationurban-areas.pdf.
Chia eK, Bassett M, nimmo DG, leonard sWJ, ritchie eG, Clarke MF and Bennett AF (2015) Fire severity and fire-induced landscape heterogeneity affect arboreal mammals in fire-prone forests. Ecosphere, 6: 190, Doi: 10.1890/es15-00327.1.
Clarke h, smith Pl and Pitman AJ (2011) regional signatures of future fire weather over eastern Australia from global climate models. International Journal of Wildland Fire, 20: 550–562.
Clarke h, lucas C and smith P (2013) Changes in Australian fire weather between 1973 and 2010. International Journal of Climatology, 33: 931–944.
Clarke h, Pitman AJ, Kala J et al. (2016) An investigation of future fuel load and fire weather in Australia. Climatic Change, 139: 591–605.
Climate signals (2017) California increased Wildfire risk. Accessed at: http://www.climatesignals.org/climate-signals/california-increased-wildfire-risk.
Crisp MD, Burrows Ge, Cook lG et al. (2011) Flammable biomes dominated by eucalypts originated at the Cretaceous-Palaeogene boundary. Nature Communications, 2: 1–8.
Csiro and BoM (2014) state of the Climate 2014. Csiro and BoM, Melbourne.
Csiro and BoM (2015) Climate Change in Australia – Technical report 2015. Csiro and BoM, Melbourne.
Csiro and BoM (2016) state of the Climate 2016. Csiro and BoM, Melbourne.
Deloitte Access economics (2014) scoping study on a cost benefit analysis of bushfire mitigation. Australia Forest Products Association. Accessed at: http://ausfpa.com.au/wp-content/uploads/2016/01/AFPA-DAe-report-Amended-Final-2014-05-27.pdf.
enright nJ, Fontaine JB, Bowman DMJs et al. (2015) interval squeeze: altered fire regimes and demographic responses interact to threaten woody species persistence as climate changes. Frontiers in Ecology and Environment, 13: 265–272.
Fairman TA, nitschke Cr and Bennett lT (2016) Too much, too soon? A review of the effects of increasing wildfire frequency on tree mortality and regeneration in temperate eucalypt forests. international Journal of Wildland Fire, 25: 831–848.
haikerwal A, Akram M, Del Monaco A et al. (2015) impact of fine particulate matter (PM2.5) exposure during wildfires on cardiovascular health outcomes. Journal of the American Heart Association, 4:e001653 Doi: 10.1161/JAhA.114.001653.
handmer J, McKellar r, Mclennan B et al. (2012) national Climate Change Adaptation research Plan: emergency Management – revised 2012 edition, national Climate Change Adaptation research Facility, Gold Coast, 60 pp.
harris s, nicholls n and Tapper n (2013) Forecasting fire activity in Victoria, Australia, using antecedent climate variables and enso indices. International Journal of Wildland Fire, 23: 173–184.
hasson AeA, Mills GA, Timbal B and Walsh K (2009) Assessing the impact of climate change on extreme fire weather even over southeastern Australia. Climate Research, 39: 159–172.
hennessy KJ (2007) Fire Weather. in: Climate change in Australia: technical report 2007 (Pearce KB, holper Pn, hopkins M, Bouma WJ, Whetton Ph, hennessy KJ, Power sB [eds.]), Csiro Marine and Atmospheric research, Aspendale, Victoria, pp 90–91.
holland GJ, Clarke MF and Bennett AF (2017) Prescribed burning consumes key forest structural components: implications for landscape heterogeneity. Ecological Applications, 27: 845–858.
hradsky BA, Mildwaters C, ritchie eG et al. (2017) responses of invasive predators and native prey to a prescribed forest fire. Journal of Mammalogy, 98:835–847.
iCA (insurance Council of Australia) (2016) unpublished dataset of costs of historical disasters.
iPCC (2014) summary for Policymakers. in: Climate Change 2014: impacts, Adaptation, and Vulnerability. Contribution of Working Group ii to the Fifth Assessment report of the intergovernmental Panel on Climate Change [Field C, Barros V, Mach K, Mastrandrea M (eds.)]. Cambridge university Press, Cambridge, united Kingdom and new York, nY, usA.
Johnston Fh, Purdie s, Jalaludin B, Martin Kl, henderson sB and Morgan GG (2014) Air pollution events from forest fires and emergency department attendances in sydney, Australia 1996–2007: a case-crossover analysis. Environmental Health, 13:105.
20 EarliEr, morE frEquEnt, morE dangErous:
Bushfires in new south wales
references
King D, Ginger J, Williams s, et al. (2013) Planning, building and insuring: Adaptation of built environment to climate change induced increased intensity of natural hazards. national Climate Change Adaptation research Facility, Gold Coast, 361 pp.
leigh C, Bush A, harrison eT, ho ss, luke l, rolls rJ and ledger Me (2015) ecological effects of extreme climatic events on riverine ecosystems: insights from Australia. Freshwater Biology, 60: 2620–2638.
liu JC, Pereira G, uhi sA et al. (2015) A systematic review of the physical health impacts from non-occupational exposure to wildfire smoke. Environmental Research, 136: 120–132.
lucas C (2005) Fire weather history of south-east Australia. (Bushfire CrC) Accessed at: http://www.bushfirecrc.com/sites/default/files/managed/resource/fireweatherhistroy.pdf.
lucas C, hennessy K, Mills G and Bathols J (2007) Bushfire weather in southeast Australia: recent trends and projected climate change impacts. Bushfire CrC and Australian Bureau of Meteorology. september 2007, Consultancy report prepared for the Climate institute of Australia.
Matthews s, sullivan Al, Watson P and Williams rJ (2012) Climate Change, fuel and fire behaviour in a eucalypt forest. Global Change Biology, 18: 3212–3223.
McFarlane AC and raphael B (1984) Ash Wednesday: the effect of a fire. Australian and New Zealand Journal of Psychiatry, 18: 341–351.
Morgan G, sheppard V, Khalaj B, Ayyar A, lincoln D, Jalalundin B, Beard J, Corbett s and lumley T (2010) The effects of bushfire smoke on daily mortality and hospital admissions in sydney, Australia, 1994 to 2002. Epidemiology, 21: 47–55.
niFC (national interagency Fire Center) (2002) international Agreements – Australia. Accessed at: http:// www.nifc.gov/nicc/logistics/internationalAgreements/ Australiasupport.pdf.
nolan rh, Boer MM, resco de Dios V, Caccamo G and Bradstock rA (2016) large-scale, dynamic transformations in fuel moisture drive wildfire activity across southeastern Australia. Geophysical Research Letters, 43: 4229–4238.
nsW Department of Planning and environment (2017) Population projections. Accessed at http://www.planning.nsw.gov.au/research-and-Demography/Demography/Population-projections.
nsW rFs (new south Wales rural Fire service) (2017) nine lGAs to start Bush Fire Danger Period one month early. Media release. Accessed at: https://www.rfs.nsw.gov.au/about-us/our-districts/blue-mountains/latest-news/blue-mountains-bush-fire-danger-period-to-commence-on-september-1st-2017.
nsW Government (2014) Preparation and hazard reduction. Department of environment and heritage. Accessed at: http://www.environment.nsw.gov.au/re/prepandhazreduction.htm.
o’neill sJ and handmer J (2012) responding to bushfire risk: the need for transformative adaptation. Environmental Research Letters, 7: 014018.
Penman TD, Christie FJ, Andersen An, Bradstock rA, Cary GJ, henderson MK, Price o, Tran C, Wardle GM, Williams rJ and York A (2011) Prescribed burning: how can it work to conserve the things we value? International Journal of Wildland Fire, 20: 721–733.
Penman TD, Collins l, syphard AD, Keeley Je and Bradstock rA (2014) influence of fuels, weather and the built environment on the exposure of property to wildfire. PLoS ONE, 9: e111414.
Penman TD, eriksen C, horsey B, Green A, lemcke D, Cooper P and Bradstock r (2017) retrofitting for wildfire resilience: What is the cost? Journal of Disaster Risk Reduction, 21: 1–10.
Potvin DA, Parris KM, smith Kl, smith Date Kl, Keely CC, Bray rD, hale J, hunjan s, Austin JJ and Melville J (2017) Genetic erosion and escalating extinction risk in frogs with increasing wildfire frequency. Journal of Applied Ecology, 54: 945–954.
Power s, Delage F, Chung C, Kociuba G and Keay K (2013) robust twenty-first-century projections of el nino and related precipitation variability. Nature, 502: 541–545.
Preston B, Brooke C, Measham T, smith T and Gorddard r (2009) igniting change in local government: lessons learned from a bushfire vulnerability assessment. Mitigation and Adaptation Strategies for Global Change, 14: 251–283.
Price o, Borah r, Bradstock r, Penman T (2015) An empirical wildfire risk analysis: the probability of a fire spreading to the urban interface in sydney, Australia. International Journal of Wildland Fire, 24: 597–606.
Price o and Bradstock r (2013) landscape scale influences of forest area and housing density on house loss in the 2009 Victorian bushfires. PLoS ONE, 8: e73421.
21

Whittaker J, handmer J and Mercer D (2012) Vulnerability to bushfires in rural Australia: A case study from east Gippsland, Victoria. Journal of Rural Studies, 28: 161–173.
Wilkinson C and eriksen C (2015) Fire, water and every day life: Bushfire and household defence in a changing climate. Fire Safety Journal, 78: 102–110.
Williams AAJ and Karoly DJ (1999) extreme fire weather in Australia and the impact of the el nino-southern oscillation. Australian Meteorological Magazine, 48: 15–22.
Williams AAJ, Karoly DJ and Tapper n (2001) The sensitivity of Australian fire danger to climate change. Climatic Change, 49: 171–191.
Williams rJ and Bowman DMJs (2012) Fire futures for a megadiverse continent. New Phytologist, 196: 337–340.
Williamson GJ, Bowman DMJs, Price oF, henderson and Johnston F (2016) A transdisciplinary approach to understanding the health effects of wildfire and prescribed fire smoke regimes. Environmental Research Letters, 11: 125009.
WrF (Water research Foundation) (2013) Water quality impacts of extreme weather events. Water research Foundation, Denver, Colorado.
Ximenes F, stephens M and Brown M (2017) Mechanical fuel load reduction in Australia: a potential tool for bushfire mitigation. Australian Forestry, 80: 88–98, Doi: 10.1080/00049158.2017.1311200.
Yoon Jh, Wang ss, Gillies rr, hipps l, Kravitz B and rasch PJ (2015) extreme fire season in California: A glimpse into the future? [in “explaining extremes of 2014 from a Climate Perspective”]. Bulletin of the American Meteorological Society, 96: 55–59.
Zhou Y, Zhang Y, Vaze J, lane P and Xu s (2015) impact of bushfire and climate variability on streamflow from forested catchments in southeast Australia. Hydrological Sciences Journal, 60(7–8): 1340–1360.
Zhu Q, Yang X and Yuc Q (2015) Climate change impact on bushfire risk in new south Wales, Australia. 2015 ieee international Geoscience and remote sensing symposium (iGArss) pp 1413–1416.
Price oF, Penman T, Bradstock r and Borah r (2016) The drivers of wildfire enlargement do not exhibit scale thresholds in southeastern Australian forests. Journal of Environmental Management, 181: 208e217.
rea G, Paton-Walsh C, Turquety s, Cope M and Griffith D (2016) impact of the new south Wales fires during october 2013 on regional air quality in eastern Australia. Atmospheric Environment, 131: 150e163.
red Cross (2013) new south Wales Bushfires october 2013. Accessed at: http://www.redcross.org.au/nsw-bushfiresoct-2013.aspx.
romps DM, seeley JT, Vollaro D, Molinari J (2014) Projected increase in lightning strikes in the united states due to global warming. Science, 346: 851–854.
salimi F, henderson sB, Morgan GG, Jalaludin B and Johnston Fh (2017) Ambient particulate matter, landscape fire smoke, and emergency ambulance dispatches in sydney, Australia. Environment International, 99: 208–212.
scientific American (2017) scientists see Climate Change in California’s Wildfires. Accessed at: https://www.scientificamerican.com/article/scientists-see-climate-change-in-californias-wildfires/.
sim M (2002) Bushfires: are we doing enough to reduce the human impact? Occupational and Environmental Medicine, 59: 215–216.
smith hG, sheridan G, lane PnJ, nyman P and haydon s (2011) Wildfire effects on water quality in forest catchments: A review with implications for water supply. Journal of Hydrology, 396: 170–192.
The Guardian (2017) California wildfire death toll rises to 40 amid cluster of blazes 100 miles wide. Accessed at: https://www.theguardian.com/world/2017/oct/13/california-wildfires-crews-progress.
Verdon DC, Kiem As, Franks sW (2004) Multi-decadal variability of forest fire risk –eastern Australia. International Journal of Wildfire Fire, 13: 165–171.
Whelan rJ, Collins l and loemakr r (2009) Predicting threatened species responses to fuel reduction for asset protection. Proceedings of the Royal Society of Queensland, 115: 77–83.
22 EarliEr, morE frEquEnt, morE dangErous:
Bushfires in new south wales

iMAGe CreDiTs
Page 5: Figure 1 “sun sets over harbour Bridge: 2” by Flickr user “Dom Pates” licensed under CC BY 2.0.
Page 6: Figure 2b “4-month rainfall deficiencies” by BoM licensed under CC BY 3.0.
Page 7: Figure 3 “Belrose hazard reduction” by Flickr user nsW rFs Media services licensed under CC BY-nC-nD 2.0.
Page 9: Figure 4 “Monitor in use at Mt riverview, 20 oct 2013” by Flickr user Blue Mountains library licensed under CC BY-sA 2.0.
Page 11: Figure 6 “Bushfires from sydney” by Flickr user Chad Ajamian licensed under CC BY-nC 2.0.
Page 12: Figure 7 “Destroyed home in Yellow rock, 21 oct 2013” by Flickr user Blue Mountains library licensed under BY-sA 2.0.
Page 13: Figure 8 “Glossy Black-Cockatoo (Calyptorhynchus lathami)” by Flickr user David Cook licensed under CC BY-nC 2.0.
Page 14: Figure 9 “Weddin Mtns from Quondong rd” by Flickr user eye-of-an-eagle (i wish) licensed under CC BY-nD 2.0.
Page 17: Figure 10 “elvis” by Flickr user sascha Grant licensed under CC BY-nC-nD 2.0.
Page 18: Figure 11 “California national Guard” by Flickr user The national Guard licensed under CC BY 2.0.
Image Credits
23

Fire Danger Rating
FiRe DaNGeR RatiNG aCtiON
CataStROPHiC Fires in these conditions are uncontrollable,
unpredictable, and fast moving. People in the path of
fire will very likely be killed, and it is highly likely that
a very great number of properties will be damaged.
leaVe eaRly—DO NOt Stay Keep up to date with the situation.
extReme Fires in these conditions are uncontrollable,
unpredictable, and fast moving. People in the
path of the fire may die, and it is likely that many
properties will be destroyed.
leaVe eaRly. only stay and defend if your house has been
built specifically to withstand bushfires, and if
you are physically able, and your property has
been prepared to the very highest level. Keep
up to date with the situation.
SeVeRe Fires in these conditions will be uncontrollable and
will move quickly. There is a chance that lives will
be lost, and that property will be destroyed.
iF yOu PlaN tO leaVe, leaVe eaRly. if you plan to stay and defend property, only
do so if your property is well prepared and you
are able. Keep up to date with the situation.
VeRy HiGH Conditions in which fires are likely to be difficult
to control. Property may be damaged or destroyed
but it is unlikely that there will be any loss of life.
Monitor the situation, and be prepared to
implement your bushfire survival plan.
HiGH Conditions in which fires can most likely be
controlled, with loss of life unlikely and damage
to property to be limited.
Know your bushfire survival plan, and
monitor the situation.
lOW tO mODeRate Fires in these conditions can most likely be easily
controlled, with little risk to life or property.
ensure you have a bushfire survival plan,
know where to access up-to-date information.
source: nsW rural Fire service 2017.
Accessed at: https://www.rfs.nsw.gov.au/plan-and-prepare/fire-danger-ratings
lOW-mODeRate
HiGH
VeRy HiGH
SeVe
Re
extR
eme
CataStROPHiC

Preparing for a Bushfire in NSW
What can i do to prepare for a bushfire?
iNFORm yOuRSelFThe nsW rural Fire service has the resources available to help you prepare for a bushfire.
use these resources to inform yourself and your family.
aSSeSS yOuR leVel OF RiSKTake advantage of the great resources available to assess your risk levels to fires.
Visit: http://www.rfs.nsw.gov.au/plan-and-prepare.
maKe a BuSHFiRe SuRViVal PlaN even if your household is not at high risk from bushfire (such as suburbs over 1 km from
bushland), you should still educate yourself about bushfires, and take steps to protect yourself
and your property. Access the bushfire ready self assessment tool: www.rfs.nsw.gov.au/plan-
and-prepare.
PRePaRe yOuR PROPeRtyregardless of whether you decide to leave early or to stay and actively defend, you need to
prepare your property for bushfires. An important consideration is retrofitting older houses to
bring them in alignment with current building codes for fire risk and assessing the flammability
of your garden. use this Fire ready Kit to help recognise exactly what you need to do to prepare
your property: www.rfs.nsw.gov.au/plan-and-prepare.
PRePaRe yOuRSelF aND yOuR FamilyPreparation is not only about the physical steps you take to prepare – for example, preparing
your house and making a bushfire survival plan. Preparing yourself and your family also
involves considering your physical, mental and emotional preparedness for a bushfire and its
effects. Take the time to talk to your family and to thoroughly prepare yourself on all levels.
nsW rfs www.rfs.nsw.gov.au 1800 679 737
Bushfire survival Plan app:www.rfs.nsw.gov.au/plan-and-prepare/bush-fire-survival-plan (Available for ios and Android)
iN aN emeRGeNCy, Call tRiPle ZeRO (106 FOR PeOPle WitH a HeaRiNG OR SPeeCH imPaiRmeNt)
Key Links
000
nB: information correct as of 18/10/17
fire Watch map
myfirewatch.landgate.
wa.gov.au

The Climate Council is an independent, crowd-funded organisation
providing quality information on climate change to the Australian public.
The Climate Council is a not-for-profit organisation and does not receive any money from the Federal Government. We rely upon donations from the public. We really appreciate your contributions.
Thank you for supporting the Climate Council.
Climate
twitter.com/climatecouncil
climatecouncil.org.au/donateDONate
facebook.com/climatecouncil
climatecouncil.org.au