2019-2020 bushfires
TRANSCRIPT
2019-2020 Bushfires
Extent of impact on old growth forest
A joint report prepared by 2rog Consulting and the Natural Resources Commission –
FINAL
3/04/2020

2019-2020 Bushfires A joint report prepared by 2rog Consulting and the Natural Resources Commission – FINAL
ii
DOCUMENT CONTROL
Project name: 2019-2020 Bushfires Report name Extent of impact on old growth forest Date 3/04/2020 Version 4.1 Status FINAL Prepared by Dr Julian Wall and Dr Hanieh Saremi from 2rog Consulting;
Kylie Pfeiffer and Liam Hogg from the Natural Resources Commission
ACKNOWLEDGEMENT OF COUNTRY The Natural Resources Commission and 2rog Consulting acknowledges and pays respect to traditional owners and Aboriginal peoples. We recognise and acknowledge that traditional owners have a deep cultural, social, environmental, spiritual and economic connection to their lands and waters. We value and respect their knowledge in natural resource management and the contributions of many generations, including Elders, to this understanding and connection.
DISCLAIMER This report was prepared according to the scope, brief and project information provided by the NSW Natural Resources Commission. All findings, conclusions or recommendations in the report are based on the information provided and collected for this project. The report is for the use of the Commission only and 2rog Consulting accept no liability or responsibility for its use by other parties
COPYRIGHT This work is copyright. The Copyright Act 1968 permits fair dealing for study, research, news reporting, criticism and review. Selected passages, table or diagrams may be reproduced for such purposes provided acknowledgement of the source is included.
2019-2020 Bushfires A joint report prepared by 2rog Consulting and the Natural Resources Commission – FINAL
iii
EXECUTIVE SUMMARY
In November 2018, the Premier asked the Natural Resources Commission (the Commission) to independently oversee a program to reassess existing old growth forest mapping on coastal state forests over a period of four years. In response, the Commission developed and submitted the draft Old Growth Reassessment Framework (the framework) to the NSW Government in August 2019. The program has been on hold since August 2019 to allow Forestry Corporation of NSW to conduct further modelling of total hardwood wood supply, including hardwood plantations.
The program was initiated to address a potential reduction in wood supply resulting from stronger environmental protections in the new Coastal Integrated Forestry Operations Approval (IFOA).1 This was to address the NSW Government’s ‘twin commitments’ that the Coastal IFOA would result in no net change to wood supply and no erosion of environmental values.
The framework is designed to reassess areas currently mapped as old growth once there is a verified wood supply shortfall. Under the framework, only old growth forest ecosystems that have exceeded JANIS2 old growth and biodiversity reservation targets would be assessable. Further, to be eligible for reassessment, these areas would need to occur in state forest informal reserves or lands protected by prescriptions, not contain old growth forest and not hold special environmental values. The framework is designed to assist decision-makers ensure that all evidence is considered before any mapped old growth boundaries are adjusted.
The 2019-20 fires burnt more than 2.4 million hectares across the north coast, including over 60 percent of mapped old growth forest. The intensity of the fires varied widely. Given the extensive nature of the fires and varying impacts, the Commission sought evidence related to impacts on old growth forest that may have bearing under the framework.
The Commission engaged 2rog Consulting to map the extent of the 2019-20 fires on mapped old growth forest ecosystems. The assessment overlaid fire-scar mapping prepared by the Department of Planning, Industry and Environment (DPIE)3 with mapped old growth forest ecosystems across the North East Regional Forest Agreement (RFA) region. DPIE’s method (Google Earth Engine Burnt Area Map or GEEBAM) has not, to date, been validated with field investigations. It does not determine the recovery potential of the fire affected area.
The Commission used the 2rog Consulting spatial analysis to assess the impact on assessable areas under the assumption that protected old growth with burnt canopy would no longer be assessable under the framework. This analysis is not intended to imply that old growth forest with burnt canopy is no longer old growth or no longer protected. Rather, as a result of changes to canopy cover from the recent wildfires, it would not be possible to accurately remap severely burnt areas using remote sensing, as proposed in the draft old growth assessment methodology, which is one component under the framework.
The initial stage of this draft method uses remote sensing data from LiDAR4 and aerial photographic interpretation (API) to assess canopy cover of regrowth, mature and senescing growth stage trees, which is then used to indicate the areas of forest that are likely to be structurally mature or not for further field investigation. The 2rog Consulting spatial analysis found that over 525,000 hectares of protected old growth forest (29 percent) occur in the canopy fully or partially burnt fire-scar categories. These categories were
1 Natural Resources Commission (2018) Supplementary Advice on Coastal Integrated Forestry Operations Approval Remake Old
Growth Forests and Rainforests - North Coast State Forests. Available at: https://www.nrc.nsw.gov.au/publications. 2 Commonwealth of Australia (1997), Nationally agreed criteria for the establishment of a comprehensive, adequate and
representative reserve system for forests in Australia, a report by the Joint ANZECC / MCFFA National Forest Policy Statement
Implementation Sub-committee. 3 DPIE (2020), Understanding the impact of the 2019-20 fires, webpage available at
https://www.environment.nsw.gov.au/topics/parks-reserves-and-protected-areas/fire/park-recovery-and-rehabilitation/recovering-
from-2019-20-fires/understanding-the-impact-of-the-2019-20-fires 4 LiDAR – light detection and ranging, a remote sensing method that uses light in the form of a pulsed laser to measure ranges
(variable distances) to the Earth

2019-2020 Bushfires A joint report prepared by 2rog Consulting and the Natural Resources Commission – FINAL
iv
chosen because the burnt canopies would affect the validity and accuracy of the draft method to assess canopy cover and locate mature forest.
The Commission’s assessment found 73,600 hectares of assessable old growth forest in informal reserves and lands managed under prescription in north coast state forests. Of this, 42,600 hectares is of commercial forest ecosystem type. If burnt canopy areas are removed from the analysis to determine the assessable area, only 5,800 hectares remains assessable, of which only 3,500 hectares are commercial forest ecosystem types.
In previous advice, the Commission reported there would be an estimated shortfall of 7,600 to 8,600 cubic metres of high quality timber per year, as a result of new conditions under the Coastal IFOA related to mapping threatened ecological communities and koala protections.5 In supplementary advice, the Commission identified significant errors in old growth forest mapping and reported that 14,600 hectares of incorrectly mapped and over-target old growth in north coast state forests could meet the estimated wood supply shortfall over a twenty year period. 6
Without the impact of bushfires being considered, the assessable old growth area under the framework may yield enough timber to address the previously estimated wood supply shortfall, subject to a detailed assessment and confirmation that a wood supply shortfall exists. If burnt canopy areas are not able to be assessed under the framework, the significantly reduced assessable area would not yield the previously estimated wood supply shortfall.
Given the extent of canopy fully and partially burnt fire-scar categories, the remote sensing component of the draft old growth assessment method cannot be accurately applied. Remote sensing (LiDAR combined with API) enables a relatively rapid assessment of forest structure across large areas of forest. Without the guidance this provides on where mature forest is likely to occur, field investigations across very large areas of state forest could be used instead. However, a field survey approach would take years to implement at considerable cost. This is not considered feasible under the terms of reference for the program.
Forest recovery times cannot be estimated using the fire-scar mapping currently available. For intensely burnt forest, significant time is needed before the remote sensing component of the method could be applied. Recovery times will vary significantly depending on the forest type, the intensity of the fire and the occurrence of drought during the recovery period. At the landscape scale, post-fire recovery could take five to seven years, or potentially longer.7 Forest canopies impacted by fire are unlikely to recover within the program timeframe specified in the terms of reference (i.e. the next two years).
The program to reassess old growth forest mapping on coastal state forest can no longer proceed within the allotted timeframe and funding. The elements of the program related to verifying wood supply from coastal state forests are still relevant and could proceed.
5 Natural Resources Commission (2016), Advice on Coastal Integrated forestry Operations Approval Remake. 6 Natural Resources Commission (2018), Supplementary advice on Coastal Integrated forestry Operations Approval Remake, old
growth forests and rainforests – north coast state forests. 7 Heath JT, Chafer CJ, Bishop TFA and Van Ogtrop FF (2016) Post-Fire Recovery of Eucalypt-Dominated Vegetation Communities
in the Sydney Basin, Australia, in Fire Ecology 12, 53–79, available online at https://doi.org/10.4996/fireecology.1203053

2019-2020 Bushfires A joint report prepared by 2rog Consulting and the Natural Resources Commission – FINAL
v
TABLE OF CONTENTS
EXECUTIVE SUMMARY .........................................................................................................................III
01 INTRODUCTION .................................................................................................................................7
01.1 BACKGROUND .................................................................................................................................7 01.2 OVERVIEW OF THE ASSESSMENT ........................................................................................................7 01.3 WHAT IS OLD GROWTH FOREST? ........................................................................................................8 01.4 FIRE-SCAR DATA ..............................................................................................................................8
02 REGION OF STUDY .......................................................................................................................... 10
03 APPROACH ...................................................................................................................................... 12
OVERVIEW OF SPATIAL ANALYSIS ............................................................................................................. 12 03.1 CAR RESERVE TYPES ..................................................................................................................... 12
03.1.1 Overview ............................................................................................................................... 12 03.1.2 Step 1a – Dedicated reserves ................................................................................................ 12 03.1.3 Step 1b – Informal reserves ................................................................................................... 13 03.1.4 Step 1c – State Forest areas protected under prescription ..................................................... 13 03.1.5 Step 1d – Private conservation reserves ................................................................................ 14
03.2 STEP 2 – OLD GROWTH FOREST ...................................................................................................... 14 03.2.1 Task 2a - Total area of old growth forest ................................................................................ 14 03.2.2 Task 2b - POG with dedicated reserves ................................................................................. 14 03.2.3 Task 2c - POG within informal reserves ................................................................................. 14 03.2.4 Task 2d - POG within areas managed under prescription....................................................... 14 03.2.5 Task 2e - POG within private reserves ................................................................................... 14
04 OUTPUTS ......................................................................................................................................... 15
04.1 STEP 1 – PROTECTED AREA NETWORK (CAR RESERVE SYSTEM) ........................................................ 15 04.1.1 Overview ............................................................................................................................... 15
04.2 STEP 2 – OLD GROWTH FOREST ...................................................................................................... 16 04.2.1 Step 2a – All old growth forest (also known as candidate old growth) ..................................... 16 04.2.2 Steps 2b to 2e – Candidate old growth within the protected area network .............................. 19
05 DETERMINING ASSESSABLE AREAS OF OLD GROWTH AND THE IMPACT OF FIRES .............. 24
05.1 OVERVIEW OF ASSESSMENT ............................................................................................................ 24 05.2 POTENTIAL IMPACTS OF FIRES ON OLD GROWTH ................................................................................ 24 05.3 RESULTS OF THE ASSESSABLE AREA ASSESSMENT............................................................................. 25
APPENDIX 1: SPATIAL LAYERS AND RELEVANT METADATA .......................................................... 29
APPENDIX 2: COMMERCIAL FOREST ECOSYSTEM TYPES APPLIED IN THE ASSESSMENT ......... 30
2019-2020 Bushfires A joint report prepared by 2rog Consulting and the Natural Resources Commission – FINAL
vi
LIST OF FIGURES
FIGURE 1. PROPORTION OF UNE AND LNE AFFECTED BY 2019 BUSHFIRES .................................................... 10 FIGURE 2. REGION OF STUDY INCLUDING UNE AND LNE RFA REGIONS AND FIRE-SCAR FOOTPRINT ................. 11 FIGURE 3A PROPORTION OF FIRE-SCAR CLASSES WITHIN THE PROTECTED AREA NETWORK IN THE NORTH EAST
RFA REGIONS ................................................................................................................................... 16 FIGURE 4. PROPORTION OF FIRE-SCAR CLASSES WITHIN OLD GROWTH FORESTS IN THE NORTH EAST RFA
REGIONS ........................................................................................................................................... 17 FIGURE 5. DISTRIBUTION OF FIRE-SCAR CLASSES WITHIN ALL CANDIDATE OLD GROWTH FOREST IN THE NORTH
EAST RFA REGION ............................................................................................................................. 18 FIGURE 6. PROPORTION OF FIRE-SCAR CLASSES WITHIN POG IN THE NORTH EAST RFA REGIONS.................... 19 FIGURE 7. PROPORTION OF FIRE-SCAR CLASSES WITHIN POG IN DIFFERENT PARTS OF THE PROTECTED AREA
NETWORK IN UNE AND LNE ................................................................................................................ 22 FIGURE 8. DISTRIBUTION OF FIRE-SCAR CLASSES WITHIN POG IN THE NORTH EAST RFA REGION .................... 23
LIST OF TABLES
TABLE 1. FIRE-SCAR CLASSES DERIVED FROM GEEBAM................................................................................9 TABLE 2. FIRE-AFFECTED AREAS IN UNE AND LNE (ALL LAND TENURES) ........................................................ 10 TABLE 3. ARCGIS ANALYSES UNDERTAKEN FOR THIS PROJECT ..................................................................... 12 TABLE 4 IMPACT OF BUSHFIRES ON THE PROTECTED AREA NETWORK IN UNE AND LNE ................................... 15 TABLE 5. FIRE-AFFECTED AREAS OF CANDIDATE OLD GROWTH FOREST IN UNE AND LNE ................................ 17 TABLE 6. AREA OF FIRE-SCAR CLASSES AFFECTING POG IN THE NORTH EAST RFA REGIONS .......................... 19 TABLE 7. IMPACT OF BUSHFIRES ON PROTECTED OLD GROWTH FOREST IN DIFFERENT TYPES OF RESERVE IN UNE
AND LNE........................................................................................................................................... 20 TABLE 8: EFFECT OF 2019-20 BUSHFIRES ON CANDIDATE, PROTECTED AND ASSESSABLE OLD GROWTH WITHIN THE
NORTH EAST RFA REGION AND NORTH COAST STATE FORESTS .............................................................. 27 TABLE 9: ASSESSABLE OLD GROWTH AREAS IN NORTH COAST STATE FOREST BEFORE AND AFTER THE 2019-20
FIRES ................................................................................................................................................ 28
ABBREVIATIONS
Abbreviation Description CAR Comprehensive Adequate and Representative CCA Community Conservation Area COG Candidate old growth DPIE NSW Department of Planning, Infrastructure and Environment FCNSW Forestry Corporation of NSW FMZ Forest Management Zone GEEBAM Google Earth Engine Burnt Area Map IFOA Integrated Forestry Operations Approval LNE Lower North East NBR Normalised Burnt Ratio, modelled using GEEBAM NP National Park NPWS NSW National Parks and Wildlife Service (part of DPIE) POG Protected old growth RFA Regional Forest Agreement SCA State Conservation Area SMZ Special Management Zone SPZ Special Protection Zone UNE Upper North East

2019-2020 Bushfires A joint report prepared by 2rog Consulting and the Natural Resources Commission – FINAL
7
01 INTRODUCTION
01.1 Background
In November 2018, the Premier asked the Natural Resources Commission (the Commission) to independently oversee a program to reassess existing old growth forest mapping and associated special environmental values on coastal state forests. In response, the Commission developed and submitted the draft Old Growth Reassessment Framework (the framework) to the NSW Government in August 2019. The program has been on hold since August 2019 to allow Forestry Corporation of NSW to conduct further modelling of total hardwood wood supply, including hardwood plantations.
The program was initiated to address a potential reduction in wood supply resulting from stronger environmental protections in the new Coastal Integrated Forestry Operations Approval (IFOA).8 This was to address the NSW Government’s ‘twin commitments’ that the Coastal IFOA would result in no net change to wood supply and no erosion of environmental values.
The framework is designed to reassess areas currently mapped as old growth once there is a verified wood supply shortfall. Under the framework, only old growth forest ecosystems that have exceeded JANIS9 old growth and biodiversity reservation targets would be assessable. Further, to be eligible for reassessment, these areas would need to occur in state forest informal reserves or lands protected by prescriptions, not contain old growth forest and not hold special environmental values. The framework is designed to assist decision-makers ensure that all evidence is considered before any mapped old growth boundaries are adjusted.
The 2019-2020 bushfire season was unprecedented, with about 5.3 million hectares of land in NSW affected by fire over a 5-month period from early September 2019 to early February 202010. At the time NSW was in the grip of a serious drought, in some places the worst on record, with very dry catchments and periods of extreme heat. Consequently, some regions were severely impacted by fire, with loss of human life and billions of dollars of damage to infrastructure.
Across the north coast, the fires burnt more than 2.4 million hectares between early September and mid-December 2019, including more than 60 percent of mapped old growth forest. Given the extensive nature of the fires, the Commission sought evidence related to fire impacts on old growth forest that may have bearing under the framework.
01.2 Overview of the assessment
The Commission engaged 2rog Consulting to map the extent of the 2019-20 wildfires on mapped old growth forest ecosystems. The assessment overlaid fire-scar mapping prepared by the Department of Planning, Industry and Environment (DPIE)11 with the extent of old growth forest ecosystems across the North East RFA region. More information on the fire-scar data is provided in Section 01.4.
The Commission used the 2rog Consulting spatial analysis to assess the impact on assessable old growth areas under the framework as determined considering JANIS reservation targets. Further detail is provided in Section 05.3.
8 Natural Resources Commission (2018) Supplementary Advice on Coastal Integrated Forestry Operations Approval Remake Old
Growth Forests and Rainforests - North Coast State Forests. Available at: https://www.nrc.nsw.gov.au/publications. 9 Commonwealth of Australia (1997), Nationally agreed criteria for the establishment of a comprehensive, adequate and
representative reserve system for forests in Australia, a report by the Joint ANZECC / MCFFA National Forest Policy Statement Implementation Sub-committee.
DPIE (2020), Understanding the impact of the 2019-20 fires, webpage available at https://www.environment.nsw.gov.au/topics/parks-
reserves-and-protected-areas/fire/park-recovery-and-rehabilitation/recovering-from-2019-20-fires/understanding-the-impact-of-the-2019-20-fires
11 Ibid.

2019-2020 Bushfires A joint report prepared by 2rog Consulting and the Natural Resources Commission – FINAL
8
The fire impacts were assessed in the two North East Regional Forest Agreement (RFA) regions in northern NSW - Upper North East (UNE) and Lower North East (LNE). The Southern and Eden RFA regions were not assessed as fire mapping data was not available at the time the analysis commenced.
01.3 What is old growth forest?
Old growth forest is defined as:
“Ecologically mature forest where the effects of disturbance are now negligible”12
This definition was developed by the Joint ANZECC/MCFFA13 National Forest Policy Statement Implementation Sub-Committee (JANIS). It is an agreed national operational interpretation of the definition from the National Forest Policy Statement and is used in NSW RFAs and private native forestry.
In the 1990s, the comprehensive regional assessments (CRAs) prepared ahead of the RFAs, mapped areas of potential old growth forest across the north coast. These areas were mapped as ‘candidate’ old growth forest, as they were considered as candidates for listing as old growth forest, which warranted field investigations. While these field investigations did not occur, large areas of candidate old growth forest were protected in national parks and reserves, and special management zones declared under the NSW Forestry Act 2012.
Any areas of candidate old growth forest that occur in a protected area as defined by the JANIS comprehensive, adequate and representative (CAR) reserve system are referred to as ‘protected old growth’ in this report. The area of protected old growth, as determined through a contemporary assessment of reserves in the public and private estate, and the area of candidate old growth, as mapped during the CRAs, are used to determine the status of JANIS old growth reservation targets. The status assessment is conducted for each individual old growth forest ecosystem within the upper north east and lower north east regions separately.
Old growth forest ecosystems that have met and exceeded all JANIS old growth and biodiversity reservation targets are referred to as ‘assessable’ in this report if they occur in state forest informal reserves or lands managed under prescription. Biodiversity reservation targets relate to forest ecosystems as mapped during the CRAs, of which the old growth forest ecosystem is a subset.
In summary, the types of old growth referred to in this report are:
• candidate old growth – as mapped during the CRAs and reported in the RFAs
• protected old growth (POG) – any candidate old growth that occurs in the CAR reserve system
on public and private land
• assessable old growth – any old growth forest ecosystem that has met and exceeded the JANIS
targets for old growth and biodiversity reservation, and that occurs in state forest informal reserves
or land managed under prescription.
More information on the components of the CAR reserve system is provided in Section 03.1 and the full list of JANIS old growth and biodiversity reservation targets used in the assessment are provided in Section 05.
01.4 Fire-scar data
The NSW Department of Planning, Infrastructure and Environment (DPIE) in collaboration with the University of New South Wales has developed a rapid mapping approach to determine where wildfires in NSW have affected vegetation. It is called the Google Earth Engine Burnt Area Map (GEEBAM) and it models Normalised Burnt Ratio (NBR) from near infrared and short-wave infrared wavelengths captured
12 JANIS (1997) Nationally Agreed Criteria for the Establishment of a Comprehensive, Adequate and Representative Reserve
System for Forests in Australia, p. 14. Available at:
http://www.agriculture.gov.au/SiteCollectionDocuments/rfa/publications/nat_nac.pdf. 13 ANZECC - Australian and New Zealand Environment and Conservation Council; MCFFA - Ministerial Council on Forestry,
Fisheries and Aquaculture.
2019-2020 Bushfires A joint report prepared by 2rog Consulting and the Natural Resources Commission – FINAL
9
from a time-series of Sentinel-2 satellite imagery, including before and after images. GEEBAM provides a rapid estimate of:
• where fire skipped over an area within the fire ground, leaving it little affected
• where it burned the understorey and some of the canopy
• where it burned the canopy only
• where it appears to have burned all vegetation.
While GEEBAM predicts how severely the tree canopy has burnt, the method has not, to date, been validated with field investigations. It does not determine the recovery potential of the bushfire affected area.
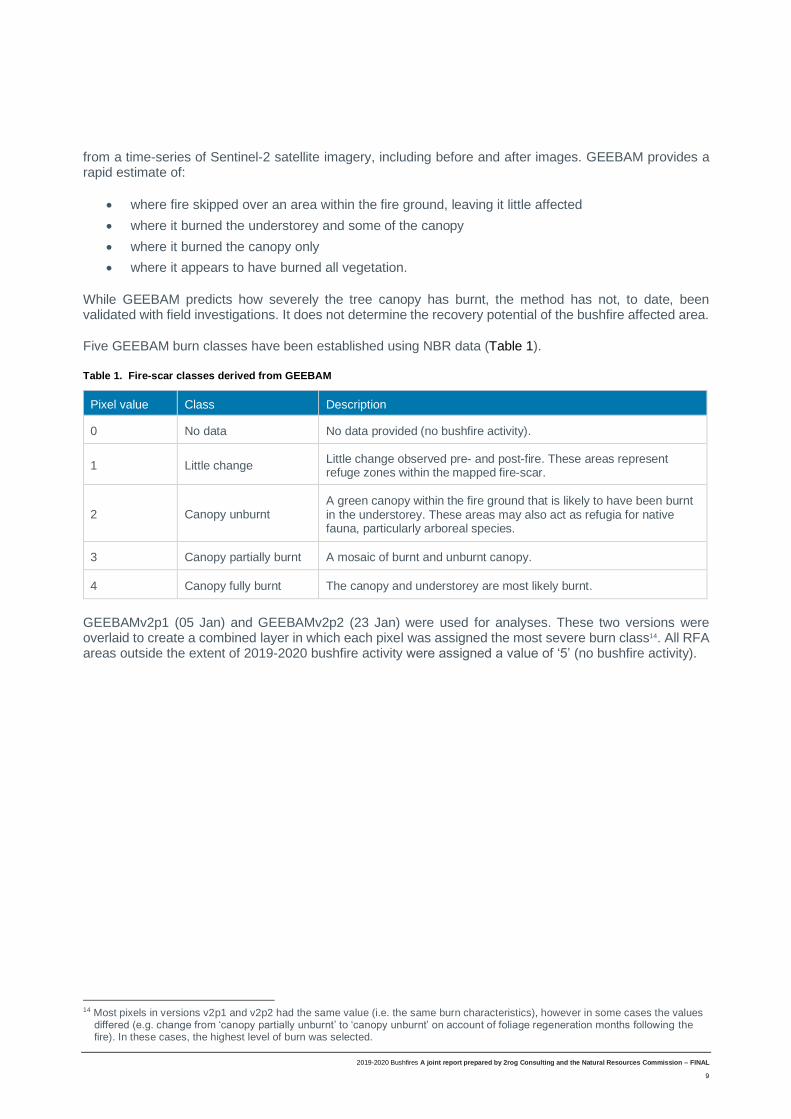
Five GEEBAM burn classes have been established using NBR data (Table 1).
Table 1. Fire-scar classes derived from GEEBAM
Pixel value Class Description
0 No data No data provided (no bushfire activity).
1 Little change Little change observed pre- and post-fire. These areas represent refuge zones within the mapped fire-scar.
2 Canopy unburnt A green canopy within the fire ground that is likely to have been burnt in the understorey. These areas may also act as refugia for native fauna, particularly arboreal species.
3 Canopy partially burnt A mosaic of burnt and unburnt canopy.
4 Canopy fully burnt The canopy and understorey are most likely burnt.
GEEBAMv2p1 (05 Jan) and GEEBAMv2p2 (23 Jan) were used for analyses. These two versions were overlaid to create a combined layer in which each pixel was assigned the most severe burn class14. All RFA areas outside the extent of 2019-2020 bushfire activity were assigned a value of ‘5’ (no bushfire activity).
14 Most pixels in versions v2p1 and v2p2 had the same value (i.e. the same burn characteristics), however in some cases the values
differed (e.g. change from ‘canopy partially unburnt’ to ‘canopy unburnt’ on account of foliage regeneration months following the fire). In these cases, the highest level of burn was selected.
2019-2020 Bushfires A joint report prepared by 2rog Consulting and the Natural Resources Commission – FINAL
10
02 REGION OF STUDY
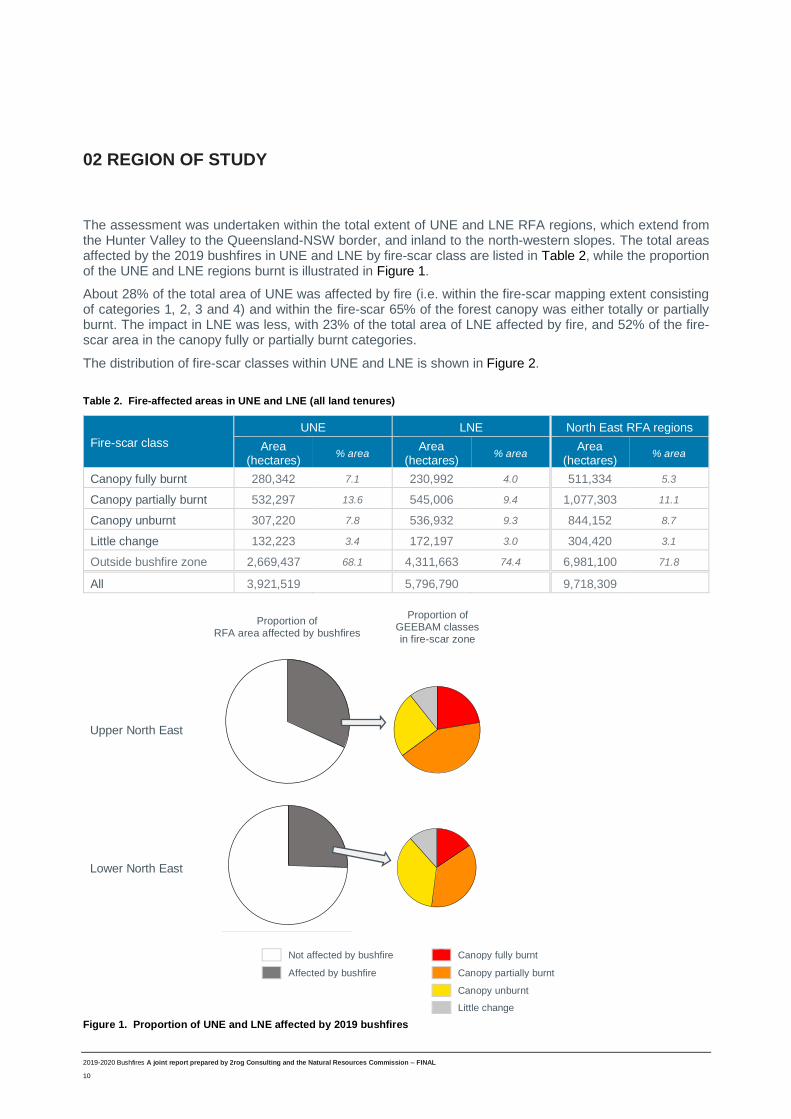
The assessment was undertaken within the total extent of UNE and LNE RFA regions, which extend from the Hunter Valley to the Queensland-NSW border, and inland to the north-western slopes. The total areas affected by the 2019 bushfires in UNE and LNE by fire-scar class are listed in Table 2, while the proportion of the UNE and LNE regions burnt is illustrated in Figure 1.
About 28% of the total area of UNE was affected by fire (i.e. within the fire-scar mapping extent consisting of categories 1, 2, 3 and 4) and within the fire-scar 65% of the forest canopy was either totally or partially burnt. The impact in LNE was less, with 23% of the total area of LNE affected by fire, and 52% of the fire-scar area in the canopy fully or partially burnt categories.
The distribution of fire-scar classes within UNE and LNE is shown in Figure 2.
Table 2. Fire-affected areas in UNE and LNE (all land tenures)
Fire-scar class
UNE LNE North East RFA regions
Area (hectares)
% area Area
(hectares) % area
Area (hectares)
% area
Canopy fully burnt 280,342 7.1 230,992 4.0 511,334 5.3
Canopy partially burnt 532,297 13.6 545,006 9.4 1,077,303 11.1
Canopy unburnt 307,220 7.8 536,932 9.3 844,152 8.7
Little change 132,223 3.4 172,197 3.0 304,420 3.1
Outside bushfire zone 2,669,437 68.1 4,311,663 74.4 6,981,100 71.8
All 3,921,519 5,796,790 9,718,309
Proportion of
RFA area affected by bushfires
Proportion of GEEBAM classes in fire-scar zone
Upper North East
Lower North East
Not affected by bushfire Canopy fully burnt
Affected by bushfire Canopy partially burnt
Canopy unburnt
Little change
Figure 1. Proportion of UNE and LNE affected by 2019 bushfires

2019-2020 Bushfires A joint report prepared by 2rog Consulting and the Natural Resources Commission – FINAL
11
Figure 2. Region of study including UNE and LNE RFA regions and fire-scar footprint
2019-2020 Bushfires A joint report prepared by 2rog Consulting and the Natural Resources Commission – FINAL
12
03 APPROACH
Overview of spatial analysis
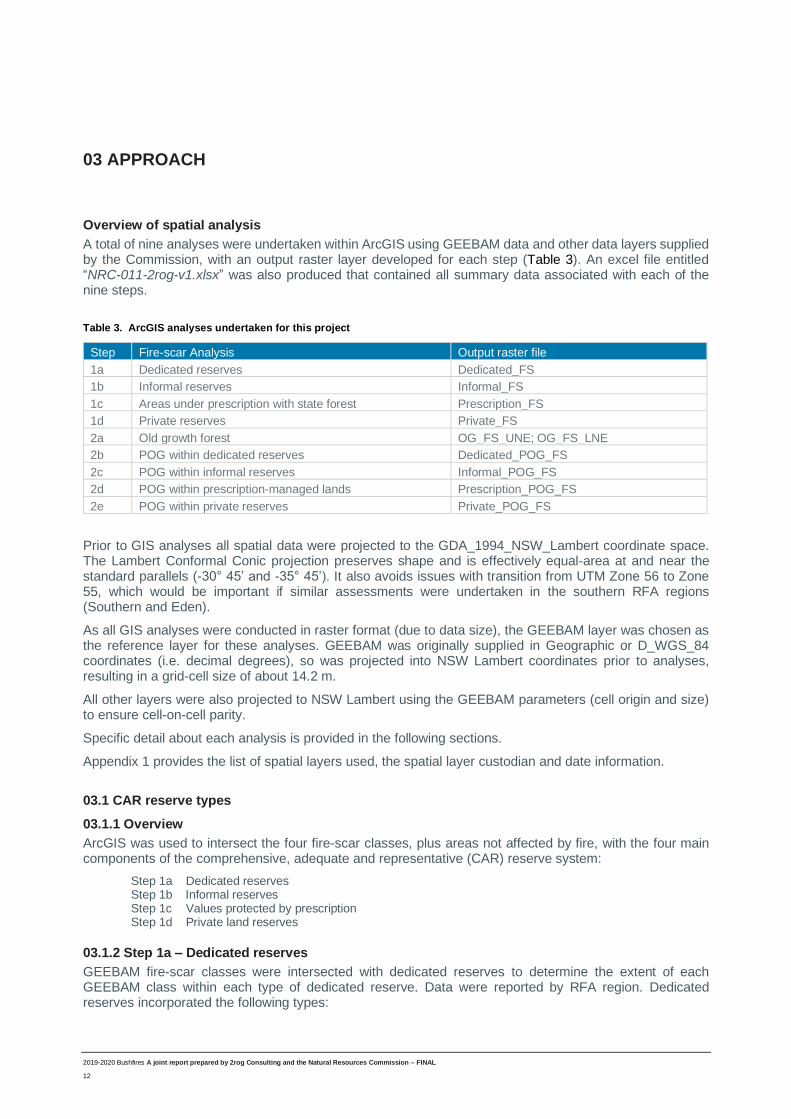
A total of nine analyses were undertaken within ArcGIS using GEEBAM data and other data layers supplied by the Commission, with an output raster layer developed for each step (Table 3). An excel file entitled “NRC-011-2rog-v1.xlsx” was also produced that contained all summary data associated with each of the nine steps.
Table 3. ArcGIS analyses undertaken for this project
Step Fire-scar Analysis Output raster file
1a Dedicated reserves Dedicated_FS
1b Informal reserves Informal_FS
1c Areas under prescription with state forest Prescription_FS
1d Private reserves Private_FS
2a Old growth forest OG_FS_UNE; OG_FS_LNE
2b POG within dedicated reserves Dedicated_POG_FS
2c POG within informal reserves Informal_POG_FS
2d POG within prescription-managed lands Prescription_POG_FS
2e POG within private reserves Private_POG_FS
Prior to GIS analyses all spatial data were projected to the GDA_1994_NSW_Lambert coordinate space. The Lambert Conformal Conic projection preserves shape and is effectively equal-area at and near the standard parallels (-30° 45’ and -35° 45’). It also avoids issues with transition from UTM Zone 56 to Zone 55, which would be important if similar assessments were undertaken in the southern RFA regions (Southern and Eden).
As all GIS analyses were conducted in raster format (due to data size), the GEEBAM layer was chosen as the reference layer for these analyses. GEEBAM was originally supplied in Geographic or D_WGS_84 coordinates (i.e. decimal degrees), so was projected into NSW Lambert coordinates prior to analyses, resulting in a grid-cell size of about 14.2 m.
All other layers were also projected to NSW Lambert using the GEEBAM parameters (cell origin and size) to ensure cell-on-cell parity.
Specific detail about each analysis is provided in the following sections.
Appendix 1 provides the list of spatial layers used, the spatial layer custodian and date information.
03.1 CAR reserve types
03.1.1 Overview
ArcGIS was used to intersect the four fire-scar classes, plus areas not affected by fire, with the four main components of the comprehensive, adequate and representative (CAR) reserve system:
Step 1a Dedicated reserves Step 1b Informal reserves Step 1c Values protected by prescription Step 1d Private land reserves
03.1.2 Step 1a – Dedicated reserves
GEEBAM fire-scar classes were intersected with dedicated reserves to determine the extent of each GEEBAM class within each type of dedicated reserve. Data were reported by RFA region. Dedicated reserves incorporated the following types:
2019-2020 Bushfires A joint report prepared by 2rog Consulting and the Natural Resources Commission – FINAL
13
NPWS-managed land
- National Park
- Nature Reserve
- Aboriginal Area
- Community Conservation Area (CCA) 1 (National Park)
- CCA2 (Aboriginal Area)
State Forest
- Forest management zone15 (FMZ) 1 Flora Reserves (Special Protection Zone (SPZ)) in state forest
03.1.3 Step 1b – Informal reserves
GEEBAM fire-scar classes were intersected with informal reserves to determine the extent of each GEEBAM class within each type of informal reserve. Data were reported by RFA region. Informal reserves incorporate the following types:
NPWS-managed land
- CCA3 (State Conservation Area) Zone
- Karst Conservation Area
- Historic Site
- Regional Park
- State Conservation Area (SCA)
State Forest
- FMZ2 patches >40 hectares and >200 m wide; or adjacent to dedicated reserves
Other
- Crown Lands managed for conservation
- Commonwealth Defence lands
03.1.4 Step 1c – State Forest areas protected under prescription
GEEBAM fire-scar classes were intersected with areas of state forest excluded from logging under prescription to determine the extent of each GEEBAM class within each type of prescription lands, which incorporate the four types listed below. Data were reported by RFA region.
- FMZ2 patches < 40 hectares and/or < 200 m wide, and not adjacent to dedicated reserves
- FMZ 3a
- FMZ 3b
- Other mapped exclusions in FMZ4 (general management zone where forestry operations are allowed).
Other mapped exclusions under the IFOA that did not overlap any areas of FMZ1, FMZ2, FMZ3a or FMZ3b were identified within the NetHarvestArea vector layer, including the following categories:
- NW Fauna temporary exclusion
- Slope30 Slope exclusion (slopes > 30 degrees)
- XB Buffer exclusion
- XF Flora exclusion
- XH Ridge/headwater habitat exclusion
- XK Rock exclusion
- XN Non-commercial type exclusions
- XO Old growth exclusion
- XR Rainforest exclusion
- XW Fauna exclusion
15 Forest management zones are defined in the publication, State Forests of NSW (1999), Managing our forests sustainably – forest
management zones in NSW state forests, operational circular 99/10.

2019-2020 Bushfires A joint report prepared by 2rog Consulting and the Natural Resources Commission – FINAL
14
03.1.5 Step 1d – Private conservation reserves
GEEBAM fire-scar classes were intersected with conservation reserves established on private land to determine the extent of each GEEBAM class within each type of private land reserve, which incorporate the five types listed below (noting they must be made under a legally binding mechanism and be in-perpetuity to be included in the CAR reserve system). Data were reported by RFA region.
- Registered property agreements
- Conservation agreements
- Biobank sites
- Conservation land covenants under the Nature Conservation Trust
- Indigenous Protected Areas
03.2 Step 2 – Old growth forest
ArcGIS was used to intersect the four fire-scar classes, and areas outside the bushfire zone, with the following old growth extents in UNE an LNE:
Task 2a Total area of old growth forest (i.e. candidate old growth – COG) Task 2b Protected old growth (POG) with dedicated reserves Task 2c POG within informal reserves Task 2d POG within areas managed under prescription Task 2e POG within private reserves
03.2.1 Task 2a - Total area of old growth forest
GEEBAM fire-scar classes were intersected with the extent of old growth forests in UNE and LNE (based on candidate old growth forest mapping developed during comprehensive regional assessments in the 1990s) to determine the extent of each GEEBAM class, and areas outside GEEBAM, within the old growth forest footprint. Data were reported by RFA region.
03.2.2 Task 2b - POG with dedicated reserves
Old growth forest ecosystem models were intersected with the fire-scar x dedicated reserve raster developed in Task 1a (Section 03.1.2) to determine the total area of POG within different classes of dedicated reserve subject to different fire-scar classes.
03.2.3 Task 2c - POG within informal reserves
Old growth forest ecosystem models were intersected with the fire-scar x informal reserve raster developed in Task 1b (Section 03.1.3) to determine the total area of POG within different classes of informal reserve subject to different fire-scar classes.
03.2.4 Task 2d - POG within areas managed under prescription
Old growth forest ecosystem models were intersected with the fire-scar x prescription-lands raster developed in Task 1c (Section 03.1.4) to determine the total area of POG within different classes of prescription-managed lands subject to different fire-scar classes.
03.2.5 Task 2e - POG within private reserves
Old growth forest ecosystem models were intersected with the fire-scar x private reserves raster developed
in Task 1d (Section 03.1.5) to determine the total area of POG within different classes of private reserves.
2019-2020 Bushfires A joint report prepared by 2rog Consulting and the Natural Resources Commission – FINAL
15
04 OUTPUTS
04.1 Step 1 – Protected area network (CAR reserve system)
04.1.1 Overview
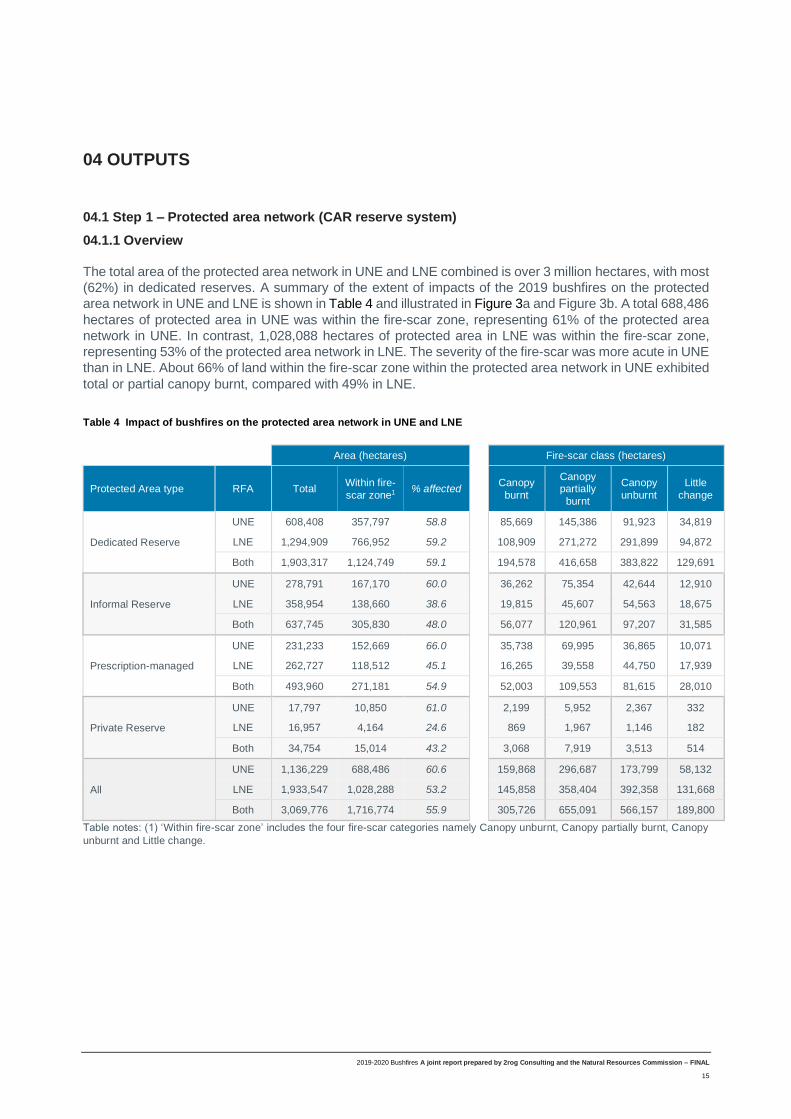
The total area of the protected area network in UNE and LNE combined is over 3 million hectares, with most
(62%) in dedicated reserves. A summary of the extent of impacts of the 2019 bushfires on the protected
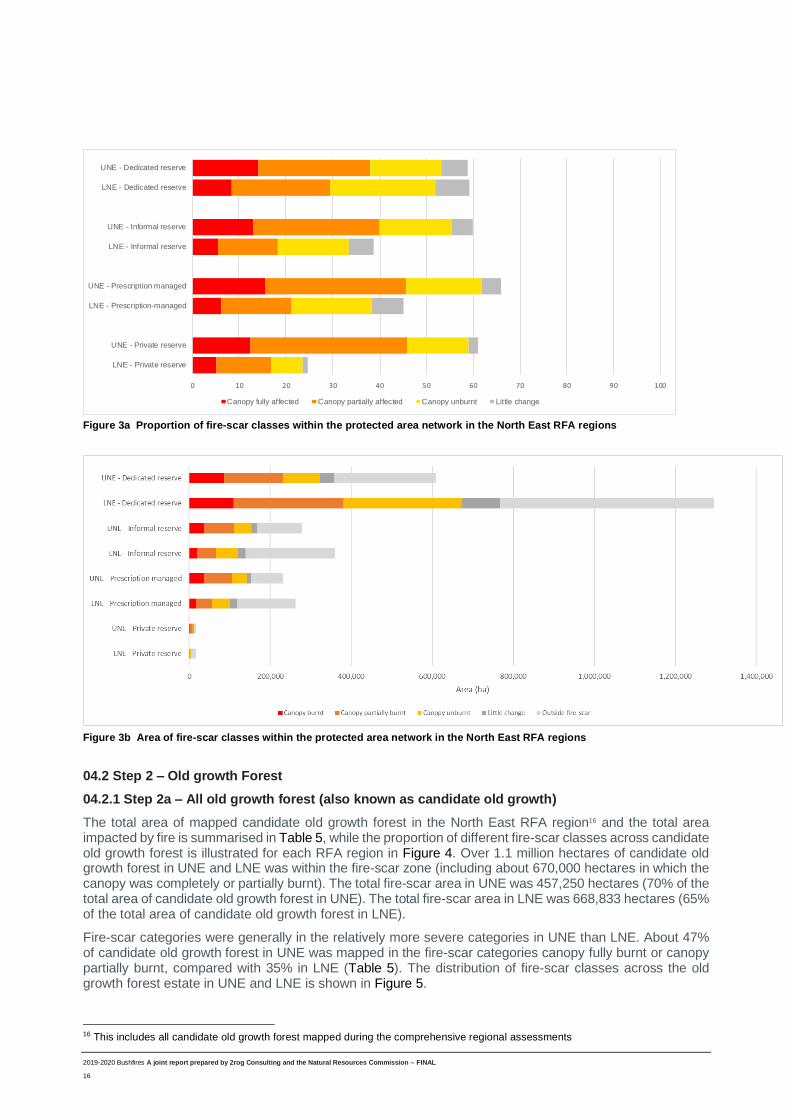
area network in UNE and LNE is shown in Table 4 and illustrated in Figure 3a and Figure 3b. A total 688,486
hectares of protected area in UNE was within the fire-scar zone, representing 61% of the protected area
network in UNE. In contrast, 1,028,088 hectares of protected area in LNE was within the fire-scar zone,
representing 53% of the protected area network in LNE. The severity of the fire-scar was more acute in UNE
than in LNE. About 66% of land within the fire-scar zone within the protected area network in UNE exhibited
total or partial canopy burnt, compared with 49% in LNE.
Table 4 Impact of bushfires on the protected area network in UNE and LNE
Area (hectares) Fire-scar class (hectares)
Protected Area type RFA Total Within fire-
scar zone1 % affected
Canopy
burnt
Canopy partially
burnt
Canopy
unburnt
Little
change
Dedicated Reserve
UNE 608,408 357,797 58.8 85,669 145,386 91,923 34,819
LNE 1,294,909 766,952 59.2 108,909 271,272 291,899 94,872
Both 1,903,317 1,124,749 59.1 194,578 416,658 383,822 129,691
Informal Reserve
UNE 278,791 167,170 60.0 36,262 75,354 42,644 12,910
LNE 358,954 138,660 38.6 19,815 45,607 54,563 18,675
Both 637,745 305,830 48.0 56,077 120,961 97,207 31,585
Prescription-managed
UNE 231,233 152,669 66.0 35,738 69,995 36,865 10,071
LNE 262,727 118,512 45.1 16,265 39,558 44,750 17,939
Both 493,960 271,181 54.9 52,003 109,553 81,615 28,010
Private Reserve
UNE 17,797 10,850 61.0 2,199 5,952 2,367 332
LNE 16,957 4,164 24.6 869 1,967 1,146 182
Both 34,754 15,014 43.2 3,068 7,919 3,513 514
All
UNE 1,136,229 688,486 60.6 159,868 296,687 173,799 58,132
LNE 1,933,547 1,028,288 53.2 145,858 358,404 392,358 131,668
Both 3,069,776 1,716,774 55.9 305,726 655,091 566,157 189,800
Table notes: (1) ‘Within fire-scar zone’ includes the four fire-scar categories namely Canopy unburnt, Canopy partially burnt, Canopy
unburnt and Little change.
2019-2020 Bushfires A joint report prepared by 2rog Consulting and the Natural Resources Commission – FINAL
16
Figure 3a Proportion of fire-scar classes within the protected area network in the North East RFA regions
Figure 3b Area of fire-scar classes within the protected area network in the North East RFA regions
04.2 Step 2 – Old growth Forest
04.2.1 Step 2a – All old growth forest (also known as candidate old growth)
The total area of mapped candidate old growth forest in the North East RFA region16 and the total area impacted by fire is summarised in Table 5, while the proportion of different fire-scar classes across candidate old growth forest is illustrated for each RFA region in Figure 4. Over 1.1 million hectares of candidate old growth forest in UNE and LNE was within the fire-scar zone (including about 670,000 hectares in which the canopy was completely or partially burnt). The total fire-scar area in UNE was 457,250 hectares (70% of the total area of candidate old growth forest in UNE). The total fire-scar area in LNE was 668,833 hectares (65% of the total area of candidate old growth forest in LNE).
Fire-scar categories were generally in the relatively more severe categories in UNE than LNE. About 47% of candidate old growth forest in UNE was mapped in the fire-scar categories canopy fully burnt or canopy partially burnt, compared with 35% in LNE (Table 5). The distribution of fire-scar classes across the old growth forest estate in UNE and LNE is shown in Figure 5.
16 This includes all candidate old growth forest mapped during the comprehensive regional assessments
0 10 20 30 40 50 60 70 80 90 100
LNE - Private reserve
UNE - Private reserve
LNE - Prescription-managed
UNE - Prescription managed
LNE - Informal reserve
UNE - Informal reserve
LNE - Dedicated reserve
UNE - Dedicated reserve
Canopy fully affected Canopy partially affected Canopy unburnt Little change

2019-2020 Bushfires A joint report prepared by 2rog Consulting and the Natural Resources Commission – FINAL
17
Table 5. Fire-affected areas of candidate old growth forest in UNE and LNE
Upper North East Lower North East North East RFA total
Fire-scar class Area
(hectares) %
Area (hectares)
% Area (hectares) %
Canopy burnt 99,746 15.2 105,980 10.3 205,726 12%
Canopy partially burnt 206,264 31.5 257,495 25 463,759 28%
Canopy unburnt 123,914 18.9 246,422 23.9 370,336 22%
Little change (refuge areas) 27,326 4.2 58,936 5.7 86,262 5%
Outside bushfire extent 197,349 30.1 361,190 35.1 558,539 33%
All 654,599 1,030,023 1,684,622
Proportion of mapped old growth forest
in fire-scar zone
Proportion of GEEBAM
classes in fire-scar zone
Upper North East
Lower North East
Not affected by bushfire Canopy fully burnt
Affected by bushfire Canopy partially burnt
Canopy unburnt
Little change
Figure 4. Proportion of fire-scar classes within old growth forests in the North East RFA regions

2019-2020 Bushfires A joint report prepared by 2rog Consulting and the Natural Resources Commission – FINAL
18
Figure 5. Distribution of fire-scar classes within all candidate old growth forest in the North East RFA region

2019-2020 Bushfires A joint report prepared by 2rog Consulting and the Natural Resources Commission – FINAL
19
04.2.2 Steps 2b to 2e – Candidate old growth within the protected area network
Overview
A total of 1.25 million hectares of candidate old growth forest is protected in the UNE and LNE regions, of which 36% occurs in UNE and 64% in LNE. Of this, about 0.91 million hectares of protected old growth (POG) (73%) was within the fires-scar zone. The area of different fire-scar classes within POG in the North East RFA regions is listed in Table 6 while the proportion of fire-scar classes is illustrated for each RFA region in Figure 6. A similar proportion of POG was within the fire-scar zone in UNE and LNE (75% and 72% respectively), however the severity of fires was greater in UNE than LNE. About 67% of the land within the fire-scar zone experienced full or partial canopy burn in UNE, compared with 53% in LNE.
Table 6. Area of fire-scar classes affecting POG in the North East RFA regions
Upper North East Lower North East North East RFA total
Fire-scar class Area
(hectares) %
Area (hectares)
% Area
(hectares) %
Canopy burnt 75,832 16.9 86,716 10.9 162,548 13%
Canopy partially burnt 147,869 32.9 214,593 26.9 362,462 29%
Canopy unburnt 91,286 20.3 220,275 27.6 311,561 25%
Little change (refuge areas) 20,469 4.6 52,659 6.6 73,128 6%
Outside bushfire extent 113,327 25.3 224,712 28.1 338,039 27%
All 448,783 798,955 1,247,738
Proportion of
protected old growth forest in fire-scar zone
Proportion of
GEEBAM classes in fire-scar zone
Upper North East
Lower North East
Not affected by bushfire Canopy fully burnt
Affected by bushfire Canopy partially burnt
Canopy unburnt
Little change
Figure 6. Proportion of fire-scar classes within POG in the North East RFA regions
2019-2020 Bushfires A joint report prepared by 2rog Consulting and the Natural Resources Commission – FINAL
20
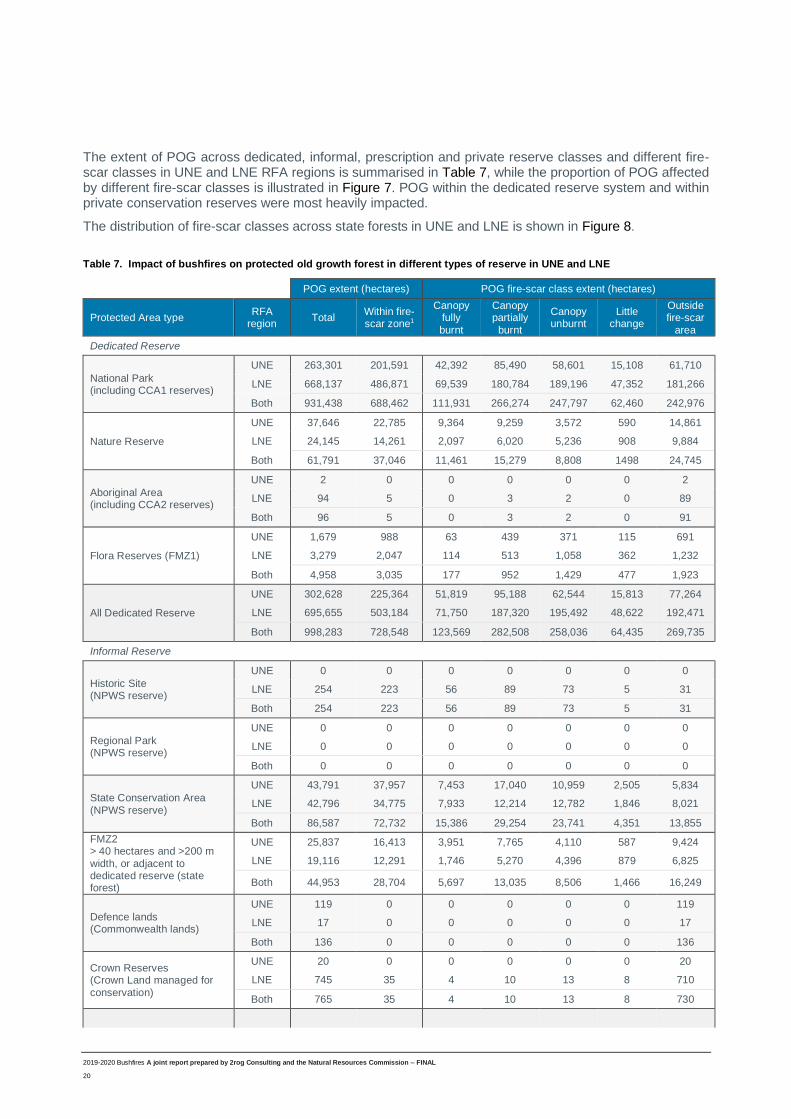
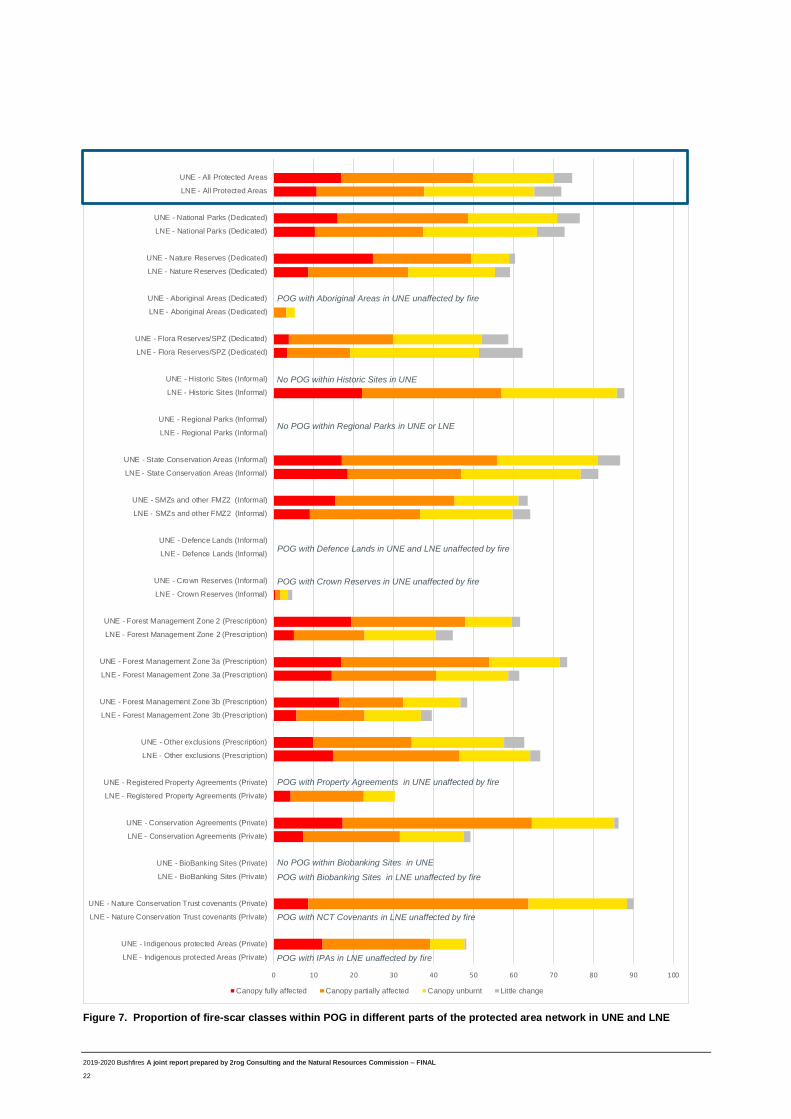
The extent of POG across dedicated, informal, prescription and private reserve classes and different fire-scar classes in UNE and LNE RFA regions is summarised in Table 7, while the proportion of POG affected by different fire-scar classes is illustrated in Figure 7. POG within the dedicated reserve system and within private conservation reserves were most heavily impacted.
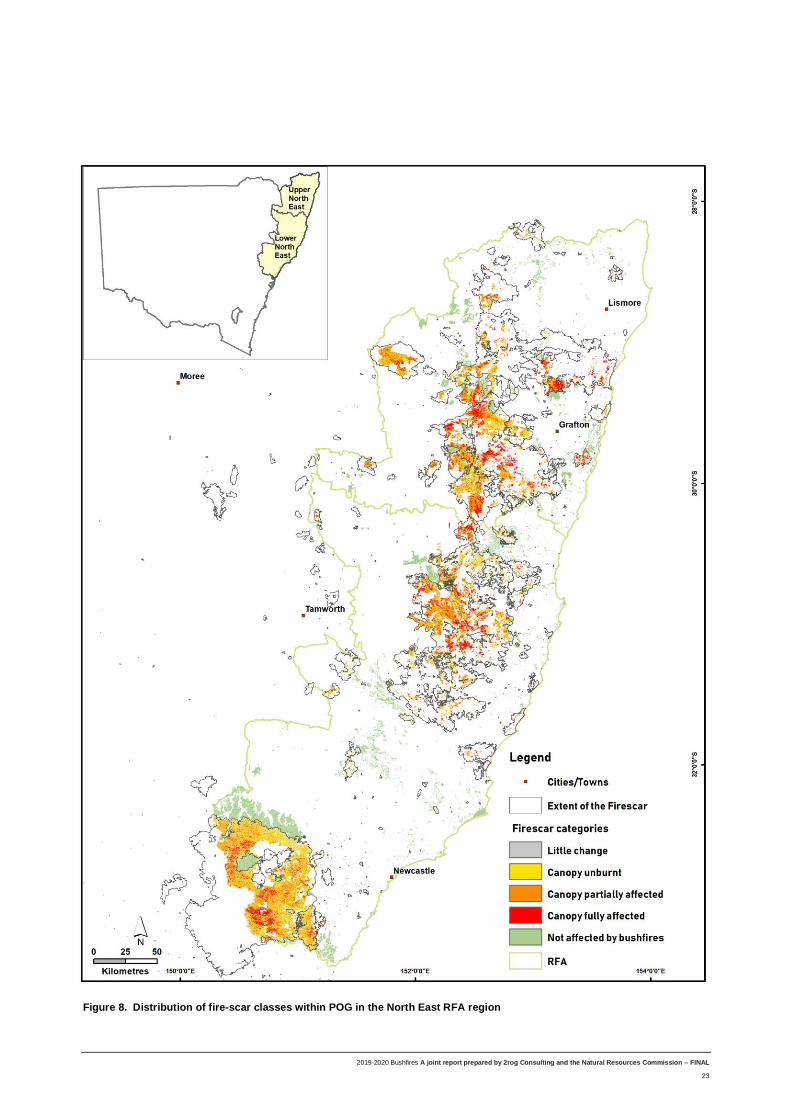
The distribution of fire-scar classes across state forests in UNE and LNE is shown in Figure 8.
Table 7. Impact of bushfires on protected old growth forest in different types of reserve in UNE and LNE
POG extent (hectares) POG fire-scar class extent (hectares)
Protected Area type RFA
region Total
Within fire-scar zone1
Canopy fully
burnt
Canopy partially
burnt
Canopy unburnt
Little change
Outside fire-scar
area
Dedicated Reserve
National Park (including CCA1 reserves)
UNE 263,301 201,591 42,392 85,490 58,601 15,108 61,710
LNE 668,137 486,871 69,539 180,784 189,196 47,352 181,266
Both 931,438 688,462 111,931 266,274 247,797 62,460 242,976
Nature Reserve
UNE 37,646 22,785 9,364 9,259 3,572 590 14,861
LNE 24,145 14,261 2,097 6,020 5,236 908 9,884
Both 61,791 37,046 11,461 15,279 8,808 1498 24,745
Aboriginal Area (including CCA2 reserves)
UNE 2 0 0 0 0 0 2
LNE 94 5 0 3 2 0 89
Both 96 5 0 3 2 0 91
Flora Reserves (FMZ1)
UNE 1,679 988 63 439 371 115 691
LNE 3,279 2,047 114 513 1,058 362 1,232
Both 4,958 3,035 177 952 1,429 477 1,923
All Dedicated Reserve
UNE 302,628 225,364 51,819 95,188 62,544 15,813 77,264
LNE 695,655 503,184 71,750 187,320 195,492 48,622 192,471
Both 998,283 728,548 123,569 282,508 258,036 64,435 269,735
Informal Reserve
Historic Site (NPWS reserve)
UNE 0 0 0 0 0 0 0
LNE 254 223 56 89 73 5 31
Both 254 223 56 89 73 5 31
Regional Park (NPWS reserve)
UNE 0 0 0 0 0 0 0
LNE 0 0 0 0 0 0 0
Both 0 0 0 0 0 0 0
State Conservation Area
(NPWS reserve)
UNE 43,791 37,957 7,453 17,040 10,959 2,505 5,834
LNE 42,796 34,775 7,933 12,214 12,782 1,846 8,021
Both 86,587 72,732 15,386 29,254 23,741 4,351 13,855
FMZ2 > 40 hectares and >200 m
width, or adjacent to dedicated reserve (state forest)
UNE 25,837 16,413 3,951 7,765 4,110 587 9,424
LNE 19,116 12,291 1,746 5,270 4,396 879 6,825
Both 44,953 28,704 5,697 13,035 8,506 1,466 16,249
Defence lands (Commonwealth lands)
UNE 119 0 0 0 0 0 119
LNE 17 0 0 0 0 0 17
Both 136 0 0 0 0 0 136
Crown Reserves (Crown Land managed for
conservation)
UNE 20 0 0 0 0 0 20
LNE 745 35 4 10 13 8 710
Both 765 35 4 10 13 8 730

2019-2020 Bushfires A joint report prepared by 2rog Consulting and the Natural Resources Commission – FINAL
21
POG extent (hectares) POG fire-scar class extent (hectares)
Protected Area type RFA
region Total
Within fire-
scar zone1
Canopy fully
burnt
Canopy partially
burnt
Canopy
unburnt
Little
change
Outside fire-scar
area
UNE 69,767 54,370 11,404 24,805 15,069 3,092 15,397
All Informal Reserve LNE 62,928 47,324 9,739 17,583 17,264 2,738 15,604
Both 132,695 101,694 21,143 42,388 32,333 5,830 31,001
Lands managed under Prescription
FMZ2 < 40 hectares or >200 m width, and not adjacent to dedicated reserve
(state forest)
UNE 3,002 1,850 586 858 345 61 1,152
LNE 1,206 541 61 213 216 51 665
Both 4,208 2,391 647 1,071 561 112 1,817
FMZ 3a
UNE 54,813 40,254 9,252 20,210 9,734 1,058 14,559
LNE 22,855 14,062 3,338 5,944 4,153 627 8,793
Both 77,668 54,316 12,590 26,154 13,887 1,685 23,352
FMZ 3b
UNE 169 82 28 27 24 3 87
LNE 190 75 11 32 27 5 115
Both 359 157 39 59 51 8 202
Other exclusions
UNE 14,093 10,276 2,207 4,898 2,774 397 3,817
LNE 13,427 8,121 1,676 3,038 2,825 582 5,306
Both 27,520 18,397 3,883 7,936 5,599 979 9,123
All Lands managed under Prescription
UNE 72,077 52,462 12,073 25,993 12,877 1,519 19,615
LNE 37,678 22,799 5,086 9,227 7,221 1,265 14,879
Both 109,755 75,261 17,159 35,220 20,098 2,784 34,494
Private reserves
Registered property agreements
UNE 96 0 0 0 0 0 96
LNE 240 73 10 44 19 0 167
Both 336 73 10 44 19 0 263
Conservation agreements
UNE 1,502 1,296 258 712 309 17 206
LNE 1,744 860 130 419 280 31 884
Both 3,246 2,156 388 1,131 589 48 1,090
Biobanking sites
UNE 0 0 0 0 0 0 0
LNE 418 0 0 0 0 0 418
Both 418 0 0 0 0 0 418
Nature Conservation Trust covenants
UNE 1,561 1,407 134 862 386 25 154
LNE 234 0 0 0 0 0 234
Both 1,795 1,407 134 862 386 25 388
Indigenous Protected Area
UNE 1,151 556 142 309 100 5 595
LNE 58 0 0 0 0 0 58
Both 1,209 556 142 309 100 5 653
All private reserves
UNE 4,310 3,259 534 1,883 795 47 1,051
LNE 2,694 933 140 463 299 31 1,761
Both 7,004 4,192 674 2,346 1,094 78 2,812
All Protected Areas
UNE 448,782 335,455 75,830 147,869 91,285 20,471 113,327
LNE 798,955 574,240 86,715 214,593 220,276 52,656 224,715
Both 1,247,737 909,695 162,545 362,462 311,561 73,127 338,042
Table notes: (1) ‘Within fire-scar zone’ includes the four fire-scar categories namely Canopy unburnt, Canopy partially burnt, Canopy unburnt and Little change.
2019-2020 Bushfires A joint report prepared by 2rog Consulting and the Natural Resources Commission – FINAL
22
Figure 7. Proportion of fire-scar classes within POG in different parts of the protected area network in UNE and LNE
0 10 20 30 40 50 60 70 80 90 100
LNE - Indigenous protected Areas (Private)
UNE - Indigenous protected Areas (Private)
LNE - Nature Conservation Trust covenants (Private)
UNE - Nature Conservation Trust covenants (Private)
LNE - BioBanking Sites (Private)
UNE - BioBanking Sites (Private)
LNE - Conservation Agreements (Private)
UNE - Conservation Agreements (Private)
LNE - Registered Property Agreements (Private)
UNE - Registered Property Agreements (Private)
LNE - Other exclusions (Prescription)
UNE - Other exclusions (Prescription)
LNE - Forest Management Zone 3b (Prescription)
UNE - Forest Management Zone 3b (Prescription)
LNE - Forest Management Zone 3a (Prescription)
UNE - Forest Management Zone 3a (Prescription)
LNE - Forest Management Zone 2 (Prescription)
UNE - Forest Management Zone 2 (Prescription)
LNE - Crown Reserves (Informal)
UNE - Crown Reserves (Informal)
LNE - Defence Lands (Informal)
UNE - Defence Lands (Informal)
LNE - SMZs and other FMZ2 (Informal)
UNE - SMZs and other FMZ2 (Informal)
LNE - State Conservation Areas (Informal)
UNE - State Conservation Areas (Informal)
LNE - Regional Parks (Informal)
UNE - Regional Parks (Informal)
LNE - Historic Sites (Informal)
UNE - Historic Sites (Informal)
LNE - Flora Reserves/SPZ (Dedicated)
UNE - Flora Reserves/SPZ (Dedicated)
LNE - Aboriginal Areas (Dedicated)
UNE - Aboriginal Areas (Dedicated)
LNE - Nature Reserves (Dedicated)
UNE - Nature Reserves (Dedicated)
LNE - National Parks (Dedicated)
UNE - National Parks (Dedicated)
LNE - All Protected Areas
UNE - All Protected Areas
Canopy fully affected Canopy partially affected Canopy unburnt Little change
No POG within Historic Sites in UNE
POG with Aboriginal Areas in UNE unaffected by fire
No POG within Regional Parks in UNE or LNE
POG with Defence Lands in UNE and LNE unaffected by fire
POG with Crown Reserves in UNE unaffected by fire
POG with Biobanking Sites in LNE unaffected by fire
No POG within Biobanking Sites in UNE
POG with NCT Covenants in LNE unaffected by fire
POG with IPAs in LNE unaffected by fire
POG with Property Agreements in UNE unaffected by fire
2019-2020 Bushfires A joint report prepared by 2rog Consulting and the Natural Resources Commission – FINAL
23
Figure 8. Distribution of fire-scar classes within POG in the North East RFA region
2019-2020 Bushfires A joint report prepared by 2rog Consulting and the Natural Resources Commission – FINAL
24
05 DETERMINING ASSESSABLE AREAS OF OLD GROWTH AND THE IMPACT OF FIRES
05.1 Overview of assessment
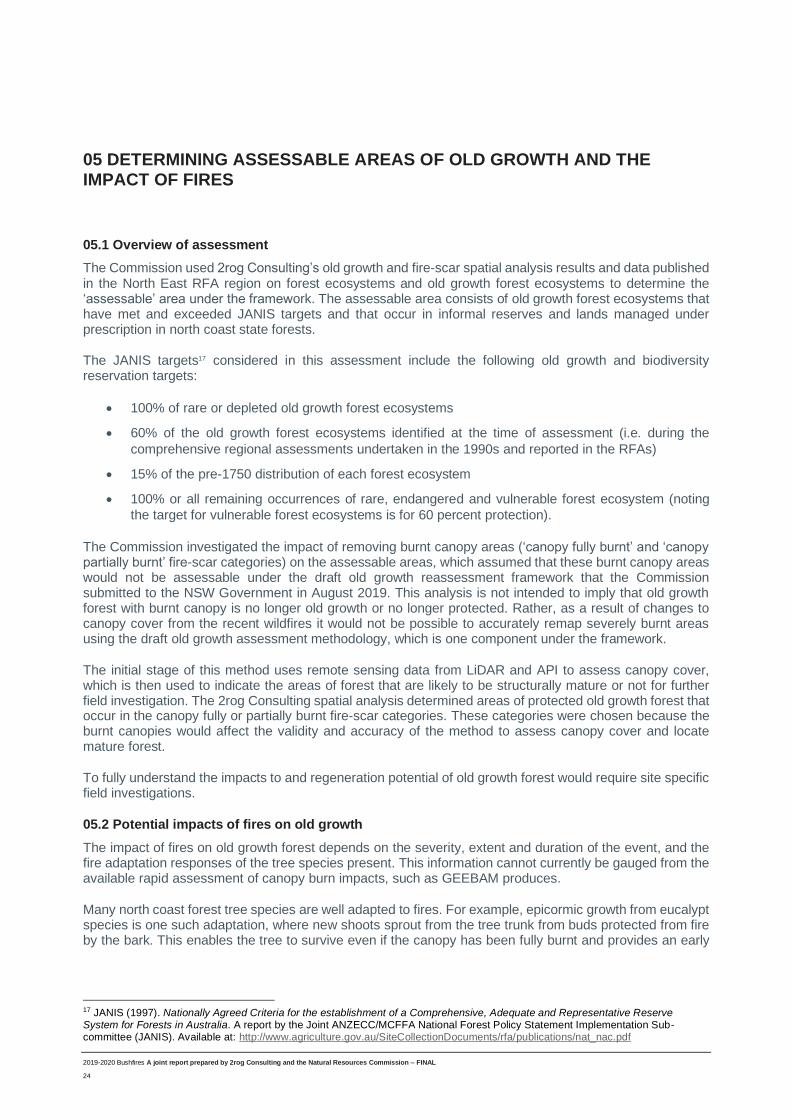
The Commission used 2rog Consulting’s old growth and fire-scar spatial analysis results and data published in the North East RFA region on forest ecosystems and old growth forest ecosystems to determine the ‘assessable’ area under the framework. The assessable area consists of old growth forest ecosystems that have met and exceeded JANIS targets and that occur in informal reserves and lands managed under prescription in north coast state forests.
The JANIS targets17 considered in this assessment include the following old growth and biodiversity reservation targets:
• 100% of rare or depleted old growth forest ecosystems
• 60% of the old growth forest ecosystems identified at the time of assessment (i.e. during the
comprehensive regional assessments undertaken in the 1990s and reported in the RFAs)
• 15% of the pre-1750 distribution of each forest ecosystem
• 100% or all remaining occurrences of rare, endangered and vulnerable forest ecosystem (noting
the target for vulnerable forest ecosystems is for 60 percent protection).
The Commission investigated the impact of removing burnt canopy areas (‘canopy fully burnt’ and ‘canopy partially burnt’ fire-scar categories) on the assessable areas, which assumed that these burnt canopy areas would not be assessable under the draft old growth reassessment framework that the Commission submitted to the NSW Government in August 2019. This analysis is not intended to imply that old growth forest with burnt canopy is no longer old growth or no longer protected. Rather, as a result of changes to canopy cover from the recent wildfires it would not be possible to accurately remap severely burnt areas using the draft old growth assessment methodology, which is one component under the framework.
The initial stage of this method uses remote sensing data from LiDAR and API to assess canopy cover, which is then used to indicate the areas of forest that are likely to be structurally mature or not for further field investigation. The 2rog Consulting spatial analysis determined areas of protected old growth forest that occur in the canopy fully or partially burnt fire-scar categories. These categories were chosen because the burnt canopies would affect the validity and accuracy of the method to assess canopy cover and locate mature forest.
To fully understand the impacts to and regeneration potential of old growth forest would require site specific field investigations.
05.2 Potential impacts of fires on old growth
The impact of fires on old growth forest depends on the severity, extent and duration of the event, and the fire adaptation responses of the tree species present. This information cannot currently be gauged from the available rapid assessment of canopy burn impacts, such as GEEBAM produces.
Many north coast forest tree species are well adapted to fires. For example, epicormic growth from eucalypt species is one such adaptation, where new shoots sprout from the tree trunk from buds protected from fire by the bark. This enables the tree to survive even if the canopy has been fully burnt and provides an early
17 JANIS (1997). Nationally Agreed Criteria for the establishment of a Comprehensive, Adequate and Representative Reserve System for Forests in Australia. A report by the Joint ANZECC/MCFFA National Forest Policy Statement Implementation Sub-committee (JANIS). Available at: http://www.agriculture.gov.au/SiteCollectionDocuments/rfa/publications/nat_nac.pdf

2019-2020 Bushfires A joint report prepared by 2rog Consulting and the Natural Resources Commission – FINAL
25
food source to many forest fauna species. Given the dynamic nature of eucalypt forests in NSW, fires are a regular feature and only a small proportion of trees that are burnt will die.
In very extreme events, living trees may die, dead standing trees may be completely burnt out, and the soil seed store may be damaged. Recovery after such events can take years and the structure and function of the forest are likely to change significantly, either temporarily or permanently. For an old growth forest, an event of this magnitude could alter the ecological characteristics that make it old growth.
Conversely, a fire event can also alter characteristics that make a forest not old growth. In a mature but disturbed forest (i.e. not old growth by definition), a wildfire may burn out the evidence of historic forestry operations, such as cut stumps, or suppress weeds. This could potentially enable the mature forest to be reclassified as old growth on field investigation.
In less extreme fire events, most north coast native forests will regenerate from burnt but living trees and recovery can be relatively quick. The regenerating forest will likely maintain its structure and function, and in some cases, fire will increase function.
Old growth forest that has not been impacted by fires (for example fire-scar categories ‘little change’ and ‘outside the fire-scar area’) will provide refugia for fauna species dependent on the structural elements of old growth forest, such as hollow bearing trees. Given the scale of fires, with more than 60 percent of candidate old growth affected, the range of fire impacts and recovery are likely to be varied. Old growth forest is a scarce forest value, and given potential impacts, any in-tact old growth forest will have an increased scarcity value.
05.3 Results of the assessable area assessment
The area of assessable old growth forest ecosystems pre-bushfires was determined to be just under 73,600 hectares, of which 42,600 hectares are commercial forest ecosystem types. If burnt canopy areas (i.e. fully and partially burnt fire-scar categories) are not able to be assessed under the framework, then the assessable area reduces to 5,800 hectares, of which 3,500 hectares are commercial forest ecosystem types.
The fire impacts on candidate, protected, and assessable old growth forest ecosystem areas by RFA region are provided in Table 8. A further breakdown by CAR reserve system components is provided in Table 9. The commercial forest ecosystem types considered in this assessment are supplied in Appendix 1.
The assessable area figure provides a theoretical upper limit on what could potentially be reassessed. There are several reasons why the assessable old growth areas may not be eligible for reassessment under the framework and/or subsequent boundary adjustment18 including the presence of:
• other mapped environmental values that require the area to remain protected (for example threatened ecological communities)
• genuine old growth forest as determined through field assessment
• special environmental values as defined under the framework and determined through field assessment
• or the area may be inaccessible to forestry operations because of steep slopes or lack of access, or uncommercial in terms of the quantity or quality of timber resources.
In previous advice, the Commission reported there would be an estimated shortfall of 7,600 to 8,600 cubic metres of high quality timber per year, resulting from new conditions under the Coastal IFOA related to mapping threatened ecological communities and koala protections.19 In supplementary advice, the Commission identified significant errors in old growth forest mapping and reported that 14,600 hectares of
18 An Act of Parliament would be required to enable boundary adjustments to mapped old growth forest to occur. 19 Natural Resources Commission (2016), Advice on Coastal Integrated forestry Operations Approval Remake.

2019-2020 Bushfires A joint report prepared by 2rog Consulting and the Natural Resources Commission – FINAL
26
incorrectly mapped and over-target old growth in north coast state forests could meet the estimated wood supply shortfall over a twenty year period. 20
Prior to the fires, the assessable area may have yielded enough timber to address the previously estimated wood supply shortfall, subject to a detailed assessment under the framework and confirmation that a wood supply shortfall exists.
If fully or partially burnt canopy areas are not able to be assessed under the framework, the significantly reduced assessable area would not yield the previously estimated wood supply shortfall.
Given the extent of canopy fully and partially burnt fire-scar categories, the remote sensing component of the draft old growth assessment method cannot be accurately applied. Remote sensing (LiDAR combined with API) enables a relatively rapid assessment of forest structure across large areas of forest. Without the guidance this provides on where mature forest is likely to occur, field investigations across very large areas of state forest could be used instead. However, a field survey approach would take years to implement at considerable cost. This is not considered feasible under the terms of reference for the program.
Forest recovery times cannot be estimated using the fire-scar mapping currently available. For intensely burnt forest, significant time is needed before the remote sensing component of the method could be applied. Recovery times will vary significantly depending on the forest type, the intensity of the fire and the occurrence of drought during the recovery period. At the landscape scale, post-fire recovery could take five to seven years, or potentially longer.21 Forest canopies impacted by fire are unlikely to recover within the program timeframe specified in the terms of reference (i.e. the next two years).
The program to reassess old growth forest mapping on coastal state forest can no longer proceed within
the allotted timeframe and funding. The elements of the program related to verifying wood supply from
coastal state forests are still relevant and could proceed.
20 Natural Resources Commission (2018), Supplementary advice on Coastal Integrated forestry Operations Approval Remake, old
growth forests and rainforests – north coast state forests. 21 Heath JT, Chafer CJ, Bishop TFA and Van Ogtrop FF (2016) Post-Fire Recovery of Eucalypt-Dominated Vegetation Communities
in the Sydney Basin, Australia, in Fire Ecology 12, 53–79, available online at https://doi.org/10.4996/fireecology.1203053

2019-2020 Bushfires A joint report prepared by 2rog Consulting and the Natural Resources Commission – FINAL
27
Table 8: Effect of 2019-20 bushfires on candidate, protected and assessable old growth within the North East RFA region
and north coast state forests
UNE LNE TOTAL
Candidate old growth forest1
Area of candidate old growth forest in North East RFA region (ha)
654,599 1,030,023 1,684,622
Area of fire-affected2 candidate old growth forest in the North East RFA region (ha)
429,924 609,897 1,039,821
Proportion of candidate old growth in North East RFA region that is fire-affected
66% 59% 62%
Protected old growth as at 2018
Area of protected old growth forest in North East RFA region
448,783 798,955 1,247,738
Area of fire-affected2 protected old growth forest in the North East RFA region (ha)
314,987 521,584 836,571
Proportion of protected old growth forest in North East RFA region that is fire-affected
70% 65% 67%
Area of protected old growth forest in north coast state forests (ha)
99,593 60,073 159,666
Area of fire affected2 protected old growth forest in north coast state forests (ha)
67,642 34,631 102,273
Proportion of protected old growth forest in north coast state forests that is fire-affected 2
68% 58% 64%
Are of protected old growth with burnt canopy (full and partial) in north coast state forests (ha)
50,284 21,956 72,240
Proportion of protected old growth in north coast state forests with fully or partially burnt canopy
50% 37% 45%
Assessable old growth forest ecosystems within informal reserves and prescription lands in state forest (hectares)3
Area of assessable old growth prior to 2019-20 bushfires (ha)
45,876 27,735 73,611
Area of assessable old growth if assume only unburnt canopy areas are assessable under the framework (ha)4
2,044 3,773 5,817
Percent reduction in assessable area 96% 86% 92%
Area of assessable old growth that is of a commercial forest ecosystem type (ha)
28,281 14,321 42,602
Area of assessable old growth that has unburnt canopy and is of a commercial forest ecosystem type (ha)
1,865 1,649 3,513
Percent reduction in assessable and commercial area
93% 88% 92%
Table notes:
1) Candidate old growth forest was mapped in the 1990s under the Comprehensive Regional Assessments
2) ‘Fire affected’ includes the fire-scar categories 1, 2 and 3 (canopy fully burnt, canopy partially burnt and canopy unburnt)
3) The CAR reserve system used for this assessment was that as at 2018
4) The burnt areas used for this assessment included canopy fully burnt and canopy partially burnt only.
2019-2020 Bushfires A joint report prepared by 2rog Consulting and the Natural Resources Commission – FINAL
28
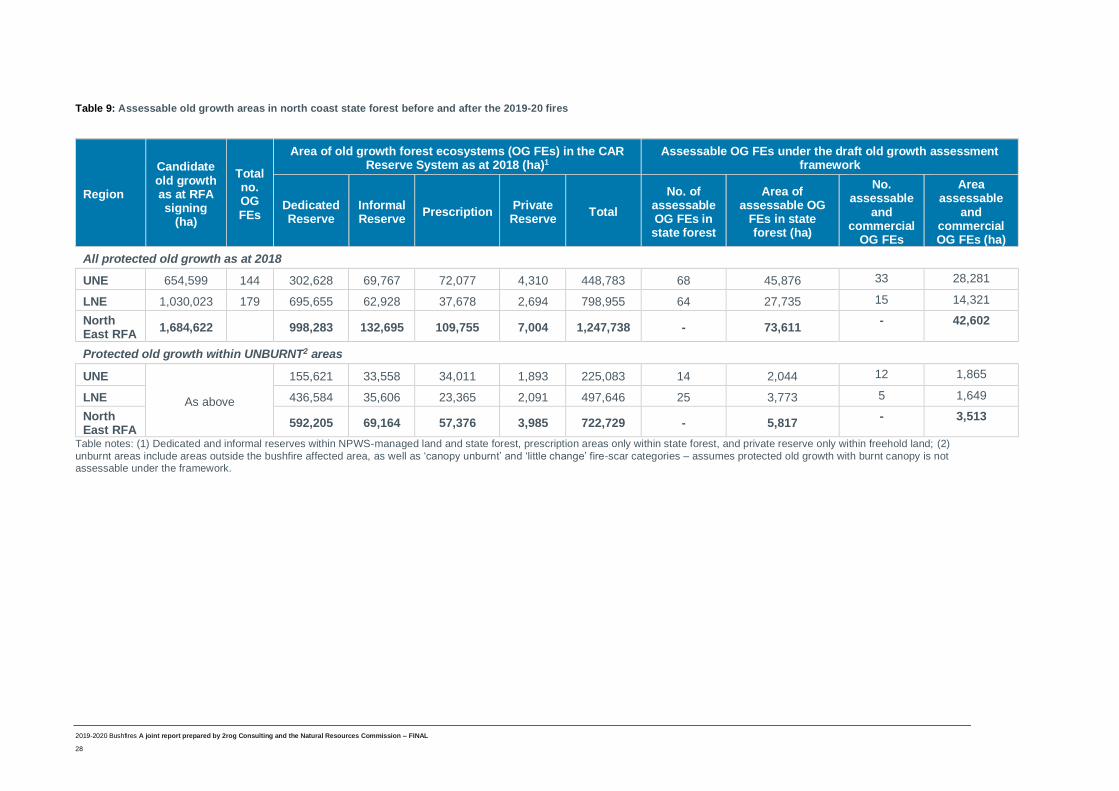
Table 9: Assessable old growth areas in north coast state forest before and after the 2019-20 fires
Region
Candidate old growth as at RFA signing
(ha)
Total no. OG FEs
Area of old growth forest ecosystems (OG FEs) in the CAR Reserve System as at 2018 (ha)1
Assessable OG FEs under the draft old growth assessment framework
Dedicated Reserve
Informal Reserve
Prescription Private Reserve
Total
No. of assessable OG FEs in state forest
Area of assessable OG
FEs in state forest (ha)
No. assessable
and commercial
OG FEs
Area assessable
and commercial OG FEs (ha)
All protected old growth as at 2018
UNE 654,599 144 302,628 69,767 72,077 4,310 448,783 68 45,876 33 28,281
LNE 1,030,023 179 695,655 62,928 37,678 2,694 798,955 64 27,735 15 14,321
North East RFA
1,684,622 998,283 132,695 109,755 7,004 1,247,738 - 73,611 - 42,602
Protected old growth within UNBURNT2 areas
UNE
As above
155,621 33,558 34,011 1,893 225,083 14 2,044 12 1,865
LNE 436,584 35,606 23,365 2,091 497,646 25 3,773 5 1,649
North East RFA
592,205 69,164 57,376 3,985 722,729 - 5,817 - 3,513
Table notes: (1) Dedicated and informal reserves within NPWS-managed land and state forest, prescription areas only within state forest, and private reserve only within freehold land; (2)
unburnt areas include areas outside the bushfire affected area, as well as ‘canopy unburnt’ and ‘little change’ fire-scar categories – assumes protected old growth with burnt canopy is not assessable under the framework.

2019-2020 Bushfires A joint report prepared by 2rog Consulting and the Natural Resources Commission – FINAL
29
APPENDIX 1: SPATIAL LAYERS AND RELEVANT METADATA
Spatial coverage Name of layer(s) Data custodian Date stamp
Fire-scar GEEBAMv2p1
GEEBAMv2p2
DPIE-EES 05 January 2020
23 January 2020
RFA regions FA_regions ABARES,
DPIE-EES
Not supplied
NPWS estate NPWS_Estate DPIE-EES 2018 v1
State Forests and FMZs FCNSW FMZ geodatabase FCNSW Jan 2018
Net Harvest Area NetHarvestArea FCNSW April 2019
Crown Lands CrownReserves Crown Lands May 2019
Defence Lands All regions (Defence_clip) ABARES Not supplied
Private Reserves ConservationAgreements
Registered Property Agreements
BiobankingSites
ConservationLandCovenants
DPIE-EES Not supplied
Indigenous Protected Areas Ipa_dedicated_May2018 DoEE May 2018
Old Growth Forest Ecosystems ogfe1_crafti
ogfe2_crafti
ABARES,
DPIE-EES
1998
Forest Ecosystems
(extant distribution)
fecraune_3882
fecralne_3883
ABARES,
DPIE-EES
1998

2019-2020 Bushfires A joint report prepared by 2rog Consulting and the Natural Resources Commission – FINAL
30
APPENDIX 2: COMMERCIAL FOREST ECOSYSTEM TYPES APPLIED IN THE ASSESSMENT
FE No Forest Ecosystem Region
26 Coastal Flooded Gum LNE
32 Dry Foothills Blackbutt-Turpentine LNE
33 Dry Foothills Spotted Gum LNE
34 Dry Grassy Blackbutt-Tallowwood LNE
36 Dry Grassy Tallowwood-Grey Gum UNE
40 Dry Heathy Sandstone Blackbutt LNE
52 Foothill Grey Gum-Ironbark-Spotted Gum LNE
55 Foothills Grey Gum-Spotted Gum LNE
59 Gorge Ironbark-Grey Gum LNE
60 Grassy New England Blackbutt-Tallowwood-Blue Gum UNE/LNE
67 High Elevation Ferny Blackbutt UNE/LNE
69 High Elevation Moist Open Tallowwood-Blue Gum UNE/LNE
70 High Elevation Open Spotted Gum LNE
71 Ironbark UNE
83 Mid Elevation Wet Blackbutt UNE/LNE
84 Mid North Coast Wet Brushbox-Tallowwood-Blue Gum UNE/LNE
89 Moist Foothills Spotted Gum LNE
90 Moist Messmate-Gum LNE
91 Moist Open Escarpment White Mahogany UNE/LNE
95 Northern Moist Blackbutt LNE
101 Northern Open Grassy Blackbutt LNE
103 Northern Wet Brushbox LNE
104 Northern Wet Tallowwood-Blue Gum LNE
105 Nymboida Tallowwood-Turpentine LNE
106 Open Coastal Brushbox LNE
107 Open Messmate-New England Blackbutt UNE
109 Open Shrubby Brushbox-Tallowwood LNE
110 Open Silvertop Stringybark-Blue Gum UNE/LNE
111 Open Silvertop Stringybark-Tallowwood UNE/LNE
135 South Coast Tallowwood-Blue Gum LNE
137 Southern Wet Sydney Blue Gum UNE
146 Tallowwood LNE
148 Very Wet New England Blackbutt-Tallowwood UNE/LNE
150 Washpool Brushbox-Tallowwood LNE
155 Wet Foothills Blackbutt-Turpentine UNE/LNE
157 Wet Shrubby Brushbox-Tallowwood UNE/LNE
158 Wet Spotted Gum-Tallowwood LNE

2019-2020 Bushfires A joint report prepared by 2rog Consulting and the Natural Resources Commission – FINAL
31
This page left intentionally blank

2019-2020 Bushfires A joint report prepared by 2rog Consulting and the Natural Resources Commission – FINAL
32