[e/2019 economic and social council - unstats.un.org · geographical location (urban/rural)1 (a)...
TRANSCRIPT

United Nations [E/2019/68]
Economic and Social Council Distr.: General
English only
High-level political forum on sustainable development
Convened under the auspices of the Economic and Social Council
Special Edition of the Sustainable Development Goals Progress Report
Report of the Secretary-General
Supplementary Information
Summary
The following information is supplementary to the Report of the Secretary-
General: Special Edition of the Sustainable Development Goals Progress Report
(E/2019/68). It contains the Statistical Annex of global and regional data for the global
indicators for the Sustainable Development Goals and targets, adopted by the
Statistical Commission at its forty-eighth session in March 2017, by the United
Nations Economic and Social Council in June 2017 and the General Assembly in July
2017. The indicators presented in the Annex are those for which data are available.
This Statistical Annex is available electronically in English at the following website:
<unstats.un.org/sdgs/>.

[E/2019/68]
Explanatory notes
Composition of regions
Except where indicated, regional groupings are based on United Nations geographical regions, with some modifications
necessary to create, to the extent possible, homogeneous groups of countries for analysis and presentation. The
information about the regional groupings used for the Special Edition of the Sustainable Development Goals Progress
Report (E/2019/68) is available at: <https://unstats.un.org/sdgs/indicators/regional-groups/>.
There is no established convention for the designation of "developed" and "developing" countries or areas in the United
Nations system. Where shown, the expression “developed regions” comprises Japan in Asia, the United States in
northern America, Australia and New Zealand in Oceania, and Europe – including Israel and Cyprus. For monitoring
indicators related to "developing countries," in general data for all countries located in "developing regions" are being
aggregated.
Methodological notes
The concepts and definitions, method of computation and other reference metadata of each indicator presented in this
document are available at the Global SDG indicators metadata repository at: <https://unstats.un.org/sdgs/metadata/>.
Symbols and conventions used in the tables
. A point is used to indicate decimals.
- A hyphen between years, for example, 2010-2015, indicates the full period involved, including
the beginning and end years.
/ A slash indicates a financial year, school year or crop year, for example, 2014/15.
… Data are not available or not applicable.
* Data are provisional, estimated or include a major revision.
A comma is used as a thousand separator; for example, 1,000 is one thousand. Subtotals and percentages in the tables
do not necessarily add to totals because of rounding.

[E/2019/68]
3
Last editted on 23/06/2019 11:43 PM
Supplementary Information
Statistical Annex: Global and regional data for Sustainable Development Goal indicators
Goal 1
End poverty in all its forms everywhere
Target 1.1
By 2030, eradicate extreme poverty for all people everywhere, currently measured as
people living on less than $1.25 a day
Indicator 1.1.1
Proportion of population below the international poverty line, by sex, age, employment status and
geographical location (urban/rural)1
(a) Proportion of population below the international poverty line of US$1.90 per day, both sexes
(Percentage)
Source: World Development Indicators database, the World Bank.
Regions 2002 2005 2010 2015
World 25.5 20.7 15.7 9.9
Sub-Saharan Africa 56.4 51.9 47.8 42.4
Northern Africa and Western Asia 5.8 5.2 3.4 4.3
Northern Africa 8.0 7.2 4.4 2.2
Western Asia 3.4 3.2 2.3 6.6
Central and Southern Asia 35.0 31.3 22.8 ...
Central Asia 38.0 31.3 15.2 7.4
Southern Asia 35.0 31.3 23.0 ...
Eastern and South-Eastern Asia 24.6 16.3 10.8 1.9
Eastern Asia 24.9 15.4 10.3 0.7
South-Eastern Asia 23.5 19.7 12.4 6.0
Latin America and the Caribbean 11.8 9.8 6.1 3.9
Oceania 13.6 12.6 9.7 8.0
Australia and New Zealand 0.9 0.5 0.5 0.7
Oceania (exc. Australia and New Zealand) ... ... 31.6 ...
Europe and Northern America 0.8 0.6 0.5 0.7
Europe 0.8 0.5 0.3 0.5
Northern America 0.8 0.9 0.9 1.1
Landlocked developing countries 48.2 41.7 34.4 30.2
Least developed countries 55.5 48.1 40.5 35.2

[E/2019/68]
(b) Proportion of employed population below the international poverty line of US$1.90 per day, both
sexes2
(Percentage)
Regions 2000 2005 2010 2015 2018
World 26.3 18.7 14.2 8.6 8.0
Sub-Saharan Africa 54.7 48.9 44.5 39.5 38.0
Northern Africa and Western Asia 3.3 2.7 1.6 2.5 3.2
Northern Africa 5.3 4.3 2.5 1.6 1.4
Western Asia 1.6 1.3 0.8 3.1 4.5
Central and Southern Asia 37.0 30.8 23.6 14.3 11.9
Central Asia 35.8 28.1 19.1 15.2 14.3
Southern Asia 37.0 30.9 23.8 14.3 11.8
Eastern and South-Eastern Asia 32.0 17.2 11.1 2.2 1.7
Eastern Asia 33.2 17.5 11.5 1.1 0.9
South-Eastern Asia 27.6 16.4 9.8 5.3 3.9
Latin America and the Caribbean 8.9 6.6 3.5 2.3 2.2
Oceania 10.8 8.5 4.8 4.0 3.8
Oceania (exc. Australia and New Zealand) 47.5 40.5 25.6 20.9 19.7
Landlocked developing countries 48.2 38.9 32.4 28.3 26.5
Least developed countries 53.0 45.2 38.2 33.2 31.5
Small island developing States 13.9 12.2 9.3 8.4 8.1
Source: ILO modelled estimates, November 2018, ILO Database of Labour Statistics (ILOSTAT), International Labour Organisation
(ILO).
(c) Proportion of employed population below the international poverty line of US$1.90 per day, both
sexes, by age3
(Percentage)
Regions 2000 2005 2010 2018
Adult Youth Adult Youth Adult Youth Adult Youth
World 25.0 32.1 17.4 24.5 13.2 19.6 7.2 13.5
Sub-Saharan Africa 53.0 59.5 47.3 53.4 43.0 49.1 36.6 42.4
Northern Africa and Western Asia 3.2 3.3 2.6 3.1 1.5 1.9 3.0 5.0
Northern Africa 5.3 5.7 4.2 4.8 2.4 2.8 1.3 1.7
Western Asia 1.6 1.5 1.3 1.5 0.8 1.1 4.1 7.0
Central and Southern Asia 36.6 38.2 30.5 31.8 23.1 25.9 11.4 14.8
Central Asia 35.3 37.7 27.8 29.3 18.8 20.2 13.9 16.4
Southern Asia 36.7 38.2 30.7 31.9 23.3 26.1 11.2 14.7
Eastern and South-Eastern Asia 30.6 38.0 16.0 23.0 10.3 15.2 1.5 2.9
Eastern Asia 31.8 39.9 16.3 23.7 10.7 16.4 0.8 1.5
South-Eastern Asia 26.2 32.6 15.2 21.1 9.3 12.3 3.6 5.2
Latin America and the Caribbean 8.3 10.7 6.1 8.3 3.4 4.0 2.2 2.2
Oceania 9.6 16.0 7.6 12.3 4.3 7.5 3.3 6.5
Oceania (exc. Australia and New Zealand) 45.5 53.2 38.5 46.9 23.8 32.0 18.2 25.1
Landlocked developing countries 46.7 52.1 37.4 42.6 30.8 36.6 24.9 30.9
Least developed countries 52.3 54.8 44.3 47.5 37.1 41.0 30.2 35.5
Small island developing States 12.9 18.8 11.4 16.7 8.9 12.1 7.7 10.9
Source: ILO modelled estimates, November 2018, ILO Database of Labour Statistics (ILOSTAT), International Labour Organisation
(ILO).

[E/2019/68]
5
Last editted on 23/06/2019 11:43 PM
(d) Proportion of employed population below the international poverty line of US$1.90 per day, by sex 2
(Percentage)
Regions 2000 2005 2010 2018
Female Male Female Male Female Male Female Male
World 27.3 25.7 19.0 18.5 14.2 14.3 8.3 7.8
Sub-Saharan Africa 56.3 53.3 50.5 47.5 46.0 43.3 39.3 36.8
Northern Africa and Western Asia 3.2 3.3 2.5 2.8 1.3 1.7 1.4 3.8
Northern Africa 5.4 5.3 3.9 4.5 1.9 2.7 1.1 1.5
Western Asia 1.9 1.5 1.5 1.3 0.8 0.8 1.6 5.5
Central and Southern Asia 42.6 35.1 35.2 29.3 25.1 23.2 13.3 11.4
Central Asia 34.2 37.0 26.7 29.2 16.8 20.8 11.9 16.1
Southern Asia 43.1 35.0 35.8 29.3 25.8 23.2 13.4 11.3
Eastern and South-Eastern Asia 32.8 31.3 17.6 16.9 11.3 10.9 1.6 1.7
Eastern Asia 33.9 32.7 17.8 17.2 11.9 11.2 0.9 0.8
South-Eastern Asia 28.5 27.0 17.0 16.0 9.6 9.9 3.8 3.9
Latin America and the Caribbean 7.9 9.4 6.2 6.8 3.5 3.5 2.3 2.2
Oceania 11.9 9.9 9.4 7.8 5.4 4.3 4.3 3.5
Oceania (exc. Australia and New Zealand) 50.5 44.9 43.9 37.7 28.5 23.1 22.1 17.6
Landlocked developing countries 48.8 47.7 39.3 38.5 32.8 32.1 27.2 25.9
Least developed countries 58.1 49.4 50.3 41.6 42.5 35.1 34.6 29.2
Small island developing States 16.5 12.2 14.3 10.8 11.0 8.2 9.6 7.1 Source: ILO modelled estimates, November 2018, ILO Database of Labour Statistics (ILOSTAT), International Labour Organisation
(ILO).
(e) Proportion of employed female population below the international poverty line of US$1.90 per day, by
age3
(Percentage)
Regions 2000 2005 2010 2018
Adult Youth Adult Youth Adult Youth Adult Youth
World 25.7 33.7 17.6 25.1 13.1 19.7 7.4 14.0
Sub-Saharan Africa 55.2 59.3 49.5 53.4 45.1 48.7 38.5 41.9
Northern Africa and Western Asia 3.2 3.2 2.5 2.6 1.3 1.3 1.3 1.9
Northern Africa 5.2 6.0 3.8 4.5 1.8 2.3 1.0 1.3
Western Asia 2.0 1.2 1.5 1.1 0.9 0.6 1.4 2.3
Central and Southern Asia 42.1 44.1 34.8 36.5 24.4 28.1 12.8 16.3
Central Asia 33.7 36.8 26.2 28.7 16.1 19.7 11.2 16.1
Southern Asia 42.7 44.5 35.4 37.0 25.1 28.7 12.9 16.3
Eastern and South-Eastern Asia 31.3 38.6 16.5 22.8 10.7 14.8 1.5 2.6
Eastern Asia 32.4 40.3 16.6 23.3 11.1 15.9 0.9 1.6
South-Eastern Asia 27.0 33.3 15.9 21.2 9.2 11.7 3.6 4.7
Latin America and the Caribbean 7.7 8.7 5.9 7.2 3.5 3.8 2.3 2.1
Oceania 10.7 16.8 8.5 13.0 4.9 7.8 3.9 6.5
Oceania (exc. Australia and New Zealand) 48.5 56.1 42.0 49.6 27.1 33.2 21.1 25.6
Landlocked developing countries 47.6 51.6 38.3 41.9 31.7 35.8 26.1 30.4
Least developed countries 57.9 58.8 49.9 51.3 42.0 43.8 33.7 37.1
Small island developing States 15.3 22.4 13.3 19.7 10.4 14.2 9.1 12.9
Source: ILO modelled estimates, November 2018, ILO Database of Labour Statistics (ILOSTAT), International Labour Organisation
(ILO).

[E/2019/68]
(f) Proportion of employed male population below the international poverty line of US$1.90 per day, by
age3
(Percentage)
Regions 2000 2005 2010 2018
Adult Youth Adult Youth Adult Youth Adult Youth
World 24.5 31.1 17.2 24.1 13.2 19.5 7.0 13.2
Sub-Saharan Africa 51.1 59.6 45.4 53.5 41.3 49.5 35.0 42.9
Northern Africa and Western Asia 3.2 3.3 2.7 3.2 1.6 2.0 3.5 5.9
Northern Africa 5.3 5.6 4.4 4.9 2.6 3.0 1.4 1.9
Western Asia 1.5 1.5 1.2 1.7 0.7 1.2 5.0 8.5
Central and Southern Asia 34.7 36.1 29.0 30.2 22.7 25.1 10.9 14.3
Central Asia 36.7 38.4 29.1 29.6 20.9 20.6 16.0 16.6
Southern Asia 34.7 36.1 29.0 30.2 22.8 25.3 10.7 14.2
Eastern and South-Eastern Asia 30.1 37.5 15.7 23.2 10.0 15.6 1.5 3.1
Eastern Asia 31.3 39.6 16.0 24.1 10.3 16.8 0.8 1.5
South-Eastern Asia 25.6 32.1 14.8 21.0 9.3 12.8 3.7 5.5
Latin America and the Caribbean 8.7 11.9 6.2 8.9 3.3 4.2 2.2 2.3
Oceania 8.7 15.4 7.0 11.8 3.7 7.3 2.9 6.6
Oceania (exc. Australia and New Zealand) 43.0 50.5 35.6 44.5 21.0 31.0 15.8 24.6
Landlocked developing countries 45.9 52.4 36.7 43.1 30.1 37.2 24.0 31.4
Least developed countries 48.4 51.9 40.4 44.6 33.8 38.8 27.6 34.3
Small island developing States 11.4 16.5 10.1 14.6 7.8 10.7 6.7 9.5
Source: ILO modelled estimates, November 2018, ILO Database of Labour Statistics (ILOSTAT), International Labour Organisation
(ILO). 1Based on the international poverty line of US$1.90 per day. 2Refers to persons aged 15 and above. 3Adults refer to persons aged 25 and above; youth refers to persons aged 15 to 24 inclusive.
Target 1.3
Implement nationally appropriate social protection systems and measures for all,
including floors, and by 2030 achieve substantial coverage of the poor and the vulnerable
Indicator 1.3.1
Proportion of population covered by social protection floors/systems, by sex, distinguishing
children, unemployed persons, older persons, persons with disabilities, pregnant women, newborns,
work-injury victims and the poor and the vulnerable
(a) Proportion of population covered by social protection floors/systems, distinguishing children, mothers
with newborns, retirees, unemployed persons, persons with disabilities and the vulnerable
(Percentage)
Regions
2016
Children1
Mothers with
newborns2
Older
persons3 Unemployed4 disabled5 Vulnerable6
World 34.9 41.1 67.9 21.8 27.8 24.7
Sub-Saharan Africa 13.1 2.37 22.7 3.0 10.67 7.1
Northern Africa and Western Asia 45.37 51.87 59.97 12.67 12.87 28.67
Northern Africa 32.17 69.1 47.07 13.87 8.47 19.77
Western Asia 61.17 33.47 72.47 11.3 17.5 37.87
Central and Southern Asia 38.87 42.0 25.8 16.77 11.0 4.3
Central Asia 43.9 42.4 90.7 14.4 94.8 40.3

[E/2019/68]
7
Last editted on 23/06/2019 11:43 PM
Regions
2016
Children1
Mothers with
newborns2
Older
persons3 Unemployed4 disabled5 Vulnerable6
Southern Asia 38.67 42.0 23.6 16.97 7.9 3.0
Eastern and South-Eastern Asia 14.4 25.5 69.3 25.1 9.27 27.1
Eastern Asia 10.8 22.5 77.3 19.5 8.7 32.5
South-Eastern Asia 20.17 32.57 31.5 43.87 10.4 13.67
Latin America and the Caribbean 56.0 53.5 70.8 12.2 59.4 39.2
Oceania 65.5 84.07 74.1 47.0 92.4 38.5
Australia and New Zealand 99.2 99.87 79.5 49.7 96.9 46.2
Oceania (exc. Australia and New
Zealand) 14.57 41.47 9.9 36.27 79.47 16.67
Europe and Northern America 92.2 95.6 97.5 44.3 95.3 60.5
Europe 93.2 93.6 96.4 49.4 94.6 71.5
Northern America 90.67 99.97 100.0 28.5 96.7 37.8
Landlocked developing countries 20.77 13.07 43.4 6.4 21.57 14.0
Small island developing States 35.1 63.67 64.37 19.37 45.17 22.47 1 Proportion of children/households receiving child/family cash benefit. 2Proportion of mothers with newborns receiving maternity cash benefit. 3Proportion of the population above statutory pensionable age receiving a pension. 4Proportion of unemployed persons receiving unemployment cash benefits. 5Proportion of the population with severe disabilities collecting disability cash benefits. 6Proportion of the vulnerable population receiving social assistance cash benefit. 7The figure is based on reported data coverage of less than 40 per cent of the population in the region, and thus should be interpreted
with caution.
Source: ILO estimates based on country data compiled through the ILO Social Security Inquiry (SSI), International Labour
Organisation (ILO).
(b) Proportion of population covered by at least one social protection benefit
(Percentage)
Regions 2016
World 45.2
Sub-Saharan Africa 12.9
Northern Africa and Western Asia 46.91
Northern Africa 39.2
Western Asia 54.9
Central and Southern Asia 15.8
Central Asia 59.31
Southern Asia 14.2
Eastern and South-Eastern Asia 58.8
Eastern Asia 64.1
South-Eastern Asia1 45.7
Latin America and the Caribbean 61.4
Oceania 71.71
Australia and New Zealand 79.6
Oceania (exc. Australia and New Zealand) 49.1
Europe and Northern America 85.7
Europe 89.3
Northern America 78.5
Landlocked developing countries 24.1

[E/2019/68]
Regions 2016
Small island developing States 56.91 1The figure is based on reported data coverage of less than 40 per cent of the population in the region, and thus should be in terpreted
with caution.
Source: ILO estimates based on country data compiled through the ILO Social Security Inquiry (SSI), International Labour
Organisation (ILO).

[E/2019/68]
9
Last editted on 23/06/2019 11:43 PM
Goal 2
End hunger, achieve food security and improved nutrition and promote
sustainable agriculture
Target 2.1
By 2030, end hunger and ensure access by all people, in particular the poor and people in
vulnerable situations, including infants, to safe, nutritious and sufficient food all year
round
Indicator 2.1.1
Prevalence of undernourishment
Prevalence of undernourishment
(Percentage)
Regions 2000 2005 2010 2015 20171
World 14.8 14.5 11.8 10.6 10.9
Sub-Saharan Africa 28.4 24.3 21.7 21.1 23.2
Northern Africa and Western Asia 8.7 8.0 7.1 9.6 10.0
Northern Africa 6.7 6.2 5.0 8.0 8.5
Western Asia 10.3 9.4 8.6 10.9 11.3
Central and Southern Asia 18.0 21.1 16.8 15.2 14.5
Central Asia 12.7 11.1 7.3 5.8 6.2
Southern Asia 18.2 21.5 17.2 15.6 14.8
Eastern and South-Eastern Asia 16.5 15.2 11.5 8.7 8.9
Eastern Asia 14.7 14.1 11.2 8.5 8.5
South-Eastern Asia 21.9 18.1 12.3 9.3 9.8
Latin America and the Caribbean 11.9 9.1 6.8 6.1 6.1
Oceania 5.4 5.5 5.2 6.3 7.0
Oceania (exc. Australia and New Zealand) … … … … …
Australia and New Zealand <2.5 <2.5 <2.5 <2.5 <2.5
Europe and Northern America <2.5 <2.5 <2.5 <2.5 <2.5
Europe <2.5 <2.5 <2.5 <2.5 <2.5
Northern America <2.5 <2.5 <2.5 <2.5 <2.5
Landlocked developing countries 31.8 26.4 22.5 21.8 22.6
Least developed countries 34.1 28.6 24.8 23.7 24.4
Small island developing States 21.7 21.0 18.2 17.4 16.8 1Projections.
Source: Food and Agriculture Organisation of the United Nations (FAO).

[E/2019/68]
Indicator 2.1.2
Prevalence of moderate or severe food insecurity in the population, based on the Food
Insecurity Experience Scale (FIES)
Prevalence of severe food insecurity
(Percentage)
Regions 2015 2016
World 8.7 (8.4 – 9.0) 9.2 (8.9 - 9.4)
Sub-Saharan Africa 26.3 (25.6 - 26.9) 29.3 (28.7 - 29.9)
Northern Africa and Western Asia 9.9 (9.5 - 10.4) 10.4 (10.0 - 10.9)
Northern Africa 10.9 (10.2 - 11.6) 11.4 (10.6 - 12.1)
Western Asia 9.1 (8.5 - 9.7) 9.6 (9.0 - 10.2)
Central and Southern Asia 11.5 (10.4 - 12.5) 10.6 (9.7 - 11.5)
Central Asia 2.1 (1.8 - 2.4) 2.6 (2.3 – 3.0)
Southern Asia 11.8 (10.7 - 12.9) 10.9 (10.0 - 11.8)
Eastern and South-Eastern Asia 2.6 (2.3 - 2.9) 3.0 (2.7 - 3.3)
Eastern Asia 0.6 (0.3 - 0.9) 0.8 (0.5 - 1.1)
South-Eastern Asia 7.8 (7.0 - 8.6) 8.7 (7.9 - 9.6)
Latin America and the Caribbean … …
Oceania … …
Australia and New Zealand 2.7 (2.1 - 3.3) 3.2 (2.5 - 4.0)
Oceania (exc. Australia and New Zealand) … …
Europe and Northern America 1.4 (1.3 - 1.5) 1.4 (1.3 - 1.5)
Europe 1.6 (1.4 - 1.7) 1.5 (1.4 - 1.6)
Northern America 1.1 (1.0 - 1.1) 1.1 (1.0 - 1.1)
Landlocked developing countries 18.4 (18.0 - 18.9) 20.2 (19.7 - 20.6)
Least developed countries … …
Small island developing States … …
Note: (1) Upper and lower bounds in parenthesis. (2) The observation values represent the 3-year averages – 2014-2016 for 2015 and
2015-2017 for 2016.
Source: Food and Agriculture Organisation of the United Nations (FAO), with data collected through the Gallup World Poll.
Target 2.2
By 2030, end all forms of malnutrition, including achieving, by 2025, the internationally
agreed targets on stunting and wasting in children under 5 years of age, and address the
nutritional needs of adolescent girls, pregnant and lactating women and older persons
Indicator 2.2.1
Prevalence of stunting (height for age <-2 standard deviation from the median of the World Health
Organisation (WHO) Child Growth Standards) among children under 5 years of age
Proportion of children under 5 years of age who are stunted (HAZ <-2)1
(Percentage)
Regions 2000 2010 2015 2018
World 32.5 (30.9 - 34.1) 26.2 (24.6 - 27.8) 23.3 (21.7 - 25.0) 21.9 (20.3 - 23.6)
Sub-Saharan Africa 40.7 (38.3 - 43.1) 35.8 (33.6 - 38.1) 33.5 (31.2 - 35.8) 32.1 (29.7 - 34.6)
Northern Africa and Western Asia 23.4 (18.1 - 28.7) 19.1 (13.3 - 24.8) 17.2 (11.4 - 23.0) 16.1 (10.3 - 22.0)
Northern Africa 23.7 (17.5 - 31.3) 19.9 (13.9 - 27.7) 18.2 (12.2 - 26.2) 17.2 (11.3 - 25.3)
Western Asia 23.1 (16.0 - 32.1) 18.3 (10.9 - 29.2) 16.2 (8.9 - 27.8) 15.1 (7.8 - 27.1)

[E/2019/68]
11
Last editted on 23/06/2019 11:43 PM
Regions 2000 2010 2015 2018
Central and Southern Asia 49.0 (44.9 - 53.2) 39.2 (34.8 - 43.6) 34.4 (29.8 - 39.1) 31.8 (27.0 - 36.6)
Central Asia 28.0 (21.2 - 36.0) 17.0 (13.6 - 21) 12.9 (10.5 - 15.8) 10.9 (8.9 - 13.3)
Southern Asia 49.7 (45.5 - 54.0) 40.0 (35.6 - 44.6) 35.4 (30.7 - 40.4) 32.7 (27.9 - 38.0)
Eastern and South-Eastern Asia2 26.5 (24.1 - 28.9) 17.5 (15.3 - 19.8) 14.3 (11.8 - 16.8) 12.8 (10.1 - 15.5)
Eastern Asia2 19.2 (17.8 - 20.6) 9.2 (8.5 - 10.0) 6.2 (5.7 - 6.8) 4.9 (4.5 - 5.3)
South-Eastern Asia 38.4 (32.6 - 44.5) 30.6 (25.2 - 36.6) 27.0 (21.1 - 33.9) 25.0 (18.8 - 32.5)
Latin America and the Caribbean 16.7 (13.3 - 20.2) 11.9 (8.7 - 15.2) 10.0 (6.9 - 13.1) 9.0 (6.0 - 12.0)
Oceania … … … …
Australia and New Zealand … … … …
Oceania (exc. Australia and New
Zealand) 36.8 (19.8 - 57.8) 37.6 (20.7 - 58.0) 37.9 (21.2 - 58.2) 38.2 (21.5 - 58.2)
Europe and Northern America … … … …
Europe … … … …
Northern America … … … …
Landlocked developing countries 44.6 (38.0 - 51.3) 36.6 (31.8 - 41.7) 32.9 (28.6 - 37.5) 30.8 (26.7 - 35.2)
Least developed countries 49.6 (45.6 - 53.7) 39.6 (37.7 - 41.6) 34.9 (32.5 - 37.3) 32.1 (29.2 - 35.3)
Small island developing States … … … … 1HAZ<-2 refers to chronic malnutrition among children aged 0 to 59 months whose height for age is below minus two standard
deviations from the median of the WHO Child Growth Standards. 2Excluding Japan
Note: Numbers in parenthesis represent a 95 per cent confidence interval .
Source: Joint Child Malnutrition Estimates (2018 Edition), United Nations Children's Fund (UNICEF), World Health Organisation
(WHO) and the World Bank Group.
Indicator 2.2.2
Prevalence of malnutrition (weight for height >+2 or <-2 standard deviation from the median of the
WHO Child Growth Standards) among children under 5 years of age, by type (wasting and
overweight)
(a) Proportion of children under 5 years of age who are moderately or severely wasted (WHZ <-2)1
(Percentage)
Regions 2018
World 7.3 (6.1 - 8.5)
Sub-Saharan Africa 6.9 (5.9 - 7.9)
Northern Africa and Western Asia 6.2 (2.9 - 9.6)
Northern Africa 8.5 (4.5 - 15.2)
Western Asia 4.0 (1.3 - 11.2)
Central and Southern Asia 14.1 (10.0 - 18.3)
Central Asia 3.6 (3.0 - 4.3)
Southern Asia 14.6 (10.8 - 19.5)
Eastern and South-Eastern Asia2 4.5 (3.4 - 5.5)
Eastern Asia2 1.7 (1.7 - 1.8)
South-Eastern Asia 8.7 (6.2 - 11.9)
Latin America and the Caribbean 1.3 (0.8 - 1.7)
Oceania …
Australia and New Zealand …
Oceania (exc. Australia and New Zealand) 9.4 (5.9 - 14.5)
Europe and Northern America …
Europe …

[E/2019/68]
Regions 2018
Northern America …
Landlocked developing countries 6.8 (5.2 - 8.9)
Least developed countries 8.5 (6.8 - 10.5)
Small island developing States … 1WHZ<-2 refers to children aged 0 to 59 months whose weight for height is below minus two standard deviations from the median of
the WHO Child Growth Standards. 2Excluding Japan
Note: Numbers in parenthesis represent a 95 per cent confidence interval.
Source: Joint Child Malnutrition Estimates (2018 Edition), United Nations Children's Fund (UNICEF), World Health Organisation
(WHO) and the World Bank Group.
(b) Proportion of children under 5 years of age who are moderately or severely overweight (WHZ >+2)1
(Percentage)
Regions 2000 2005 2010 2015 2018
World 4.9 (4.4 - 5.5) 5.1 (4.6 - 5.6) 5.4 (4.8 – 6.0) 5.7 (5.0 - 6.5) 5.9 (5.0 - 6.8)
Sub-Saharan Africa 4.4 (3.7 - 5.1) 4.2 (3.6 - 4.8) 4.1 (3.5 - 4.6) 3.9 (3.4 - 4.4) 3.9 (3.4 - 4.4)
Northern Africa and Western Asia 7.4 (4.9 - 9.9) 8 (5.0 - 11) 8.7 (4.8 - 12.5) 9.4 (4.4 - 14.3) 9.8 (4.1 - 15.6)
Northern Africa 8.1 (4.5 - 14.4) 8.8 (4.6 - 16.1) 9.4 (4.7 - 18.2) 10.2 (4.8 - 20.4) 10.6 (4.8 - 21.8)
Western Asia 6.7 (4.9 - 9.1) 7.3 (5.0 - 10.5) 7.9 (4.5 - 13.6) 8.6 (3.9 - 17.9) 9 (3.5 - 21.1)
Central and Southern Asia 2.8 (1.6 - 3.9) 2.9 (2.3 - 3.5) 3.1 (2.7 - 3.5) 3.3 (2.2 - 4.3) 3.4 (1.9 - 4.9)
Central Asia 9 (5.5 - 14.4) 9.1 (6.5 - 12.6) 9.2 (6.3 - 13.3) 9.3 (5.2 - 16.2) 9.4 (4.5 - 18.6)
Southern Asia 2.6 (1.6 - 4.1) 2.7 (2.2 - 3.4) 2.9 (2.5 - 3.3) 3.0 (2.1 - 4.3) 3.1 (1.9 - 5.1)
Eastern and South-Eastern Asia2 5.2 (4.7 - 5.7) 5.5 (4.8 - 6.1) 5.9 (4.9 - 6.9) 6.5 (4.9 - 8) 6.9 (4.9 - 8.8)
Eastern Asia2 6.4 (5.7 - 7.1) 6.4 (5.7 - 7.1) 6.3 (5.6 - 7.2) 6.3 (5.6 - 7.2) 6.3 (5.5 - 7.2)
South-Eastern Asia 3.2 (2.5 - 3.9) 4.1 (2.9 - 5.6) 5.2 (3.3 - 8.1) 6.6 (3.7 - 11.5) 7.7 (4.0 - 14.2)
Latin America and the Caribbean 6.6 (5.5 - 7.7) 6.8 (5.9 - 7.7) 7.1 (6.3 - 7.9) 7.3 (6.5 - 8.1) 7.5 (6.6 - 8.4)
Oceania … … … … …
Australia and New Zealand … … … … …
Oceania (exc. Australia and New
Zealand) 4.7 (3.3 - 6.5) 5.6 (3.9 - 8.1) 6.8 (4.6 - 9.9) 8.2 (5.4 - 12.2) 9.1 (5.9 - 13.8)
Europe and Northern America … … … … …
Europe … … … … …
Northern America … … … … …
Landlocked developing countries 3.8 (2.7 - 5.4) 3.8 (2.8 - 5.2) 3.8 (2.8 - 5.1) 3.8 (2.8 - 5.1) 3.8 (2.7 - 5.1)
Least developed countries 2.2 (1.1 - 4.4) 2.6 (1.7 - 4.0) 3.1 (2.4 - 3.9) 3.6 (2.9 - 4.4) 3.9 (2.8 - 5.3)
Small island developing States … … … … … 1WHZ >+2 refers to children aged 0 to 59 months whose weight for height is above plus two standard deviations from the median of
the WHO Child Growth Standards. 2Excluding Japan
Note: Numbers in parenthesis represent a 95 per cent confidence interval.
Source: Joint Child Malnutrition Estimates (2018 Edition), United Nations Children's Fund (UNICEF), World Health Organisation
(WHO) and the World Bank Group.

[E/2019/68]
13
Last editted on 23/06/2019 11:43 PM
Target 2.5
By 2020, maintain the genetic diversity of seeds, cultivated plants and farmed and
domesticated animals and their related wild species, including through soundly managed
and diversified seed and plant banks at the national, regional and international levels, and
promote access to and fair and equitable sharing of benefits arising from the utilization of
genetic resources and associated traditional knowledge, as internationally agreed
Indicator 2.5.1
Number of plant and animal genetic resources for food and agriculture secured in either medium-
or long-term conservation facilities
(a) Number of plant genetic resources for food and agriculture secured in either medium- or long-term
conservation facilities
(Number)
Regions 2000 2005 2010 2014 2017
World 3,386,229 4,175,111 4,742,990 5,047,817 5,309,861
Sub-Saharan Africa 138,034 167,269 181,563 187,608 193,476
Northern Africa and Western Asia 55,508 91,599 138,627 156,695 177,931
Northern Africa 6,261 34,524 76,548 90,937 109,187
Western Asia 49,247 57,075 62,079 65,758 68,744
Central and Southern Asia 288,025 393,118 433,828 458,651 484,382
Southern Asia 288,025 393,118 433,828 458,651 484,382
Eastern and South-Eastern Asia 201,076 247,030 270,857 285,490 295,484
Eastern Asia 180,725 202,158 215,792 228,294 237,061
South-Eastern Asia 20,351 44,872 55,065 57,196 58,423
Latin America and the Caribbean 235,529 265,252 307,717 354,860 372,470
Oceania 197,493 231,511 244,403 255,765 263,011
Australia and New Zealand 196,146 229,264 241,543 252,235 259,281
Oceania (exc. Australia and New
Zealand) 1,347 2,247 2,860 3,530 3,730
Europe and Northern America 1,581,069 2,043,583 2,402,577 2,554,230 2,653,142
Europe 1,025,356 1,461,845 1,749,367 1,878,023 1,959,836
Northern America 555,713 581,738 653,210 676,207 693,306
Landlocked developing countries 106,622 130,386 147,817 156,610 161,898
Least developed countries 113,222 140,152 159,136 175,604 184,287
Small island developing States 15,582 18,287 20,915 23,816 25,096 Note: Estimates based on the date of acquisition of each conserved accession as reported in 2014, 201 6, 2017 and 2018. Holdings of
the regional centres are included, as applicable.
Source: World Information and Early Warning System on Plant Genetic Resources for Food and Agriculture (WIEWS), 2018, Food
and Agriculture Organisation of the United Nations (FAO).

[E/2019/68]
(b) Number of animal genetic resources for food and agriculture secured in either medium- or long-term
conservation facilities
(Number)
Regions
2019
Number of
local breeds
(including extinct
ones)
Number of
local breeds with
genetic material stored
Number of
local breeds with
genetic material stored
sufficient to reconstitute
the breed in case of
extinction
World 7760 258 79
Sub-Saharan Africa 771 1 0
Northern Africa and Western Asia 506 8 0
Northern Africa 190 0 0
Western Asia 316 8 0
Central and Southern Asia 692 4 0
Central Asia 132 0 0
Southern Asia 560 4 0
Eastern and South-Eastern Asia 1139 4 0
Eastern Asia 772 2 0
South-Eastern Asia 367 2 0
Latin America and the Caribbean 643 13 3
Oceania 211 0 0
Australia and New Zealand 149 0 0
Oceania (exc. Australia and New
Zealand) 62 0 0
Europe and Northern America 3798 228 76
Europe 3657 228 76
Northern America 141 0 0
Landlocked developing countries 711 6 0
Least developed countries 1037 13 0
Small island developing States 1042 58 12
Source: Domestic Animal Diversity Information System (DAD-IS), 2019, Food and Agriculture Organisation of United Nations (FAO).
Indicator 2.5.2
Proportion of local breeds classified as being at risk, not at risk or at unknown level of risk of
extinction
Proportion of local breeds classified as being at risk as a share of local breeds with known level of
extinction risk
(Percentage)
Regions 2000 2005 2010 2015 2019
World ... ... ... ... ...
Sub-Saharan Africa ... ... ... ... ...
Northern Africa and Western Asia ... ... ... ... ...
Northern Africa ... ... ... ... ...
Western Asia ... ... ... ... ...
Central and Southern Asia ... ... ... ... ...
Central Asia ... ... ... ... ...
Southern Asia ... ... ... ... ...
Eastern and South-Eastern Asia ... ... ... ... ...

[E/2019/68]
15
Last editted on 23/06/2019 11:43 PM
Regions 2000 2005 2010 2015 2019
Eastern Asia ... ... ... ... ...
South-Eastern Asia ... ... ... ... ...
Latin America and the Caribbean ... ... ... ... ...
Oceania ... ... ... ... ...
Australia and New Zealand ... ... ... ... ...
Oceania (exc. Australia and New
Zealand) ... ... ... ... ...
Europe and Northern America ... ... ... ... ...
Europe 76 79 80 83 84
Northern America ... ... ... ... ...
Landlocked developing countries ... ... ... ... ...
Least developed countries ... ... ... ... ...
Small island developing States ... ... ... ... ... Source: Domestic Animal Diversity Information System (DAD-IS), Food and Agriculture Organisation of the United Nations (FAO).
Target 2.a
Increase investment, including through enhanced international cooperation, in rural
infrastructure, agricultural research and extension services, technology development and
plant and livestock gene banks in order to enhance agricultural productive capacity in
developing countries, in particular least developed countries
Indicator 2.a.1
The agriculture orientation index for government expenditures
The agriculture orientation index for government expenditures1
Regions 2001 2005 2010 2015 2017
World 0.42 0.39 0.28 0.28 0.26
Sub-Saharan Africa 0.23 0.25 0.17 0.19 0.20
Northern Africa and Western Asia 0.58 0.33 0.31 0.41 0.45
Northern Africa 1.05 0.26 0.14 0.13 0.12
Western Asia 0.53 0.56 0.41 0.55 0.61
Central and Southern Asia 0.20 0.28 0.41 0.31 0.51
Central Asia 0.38 0.58 0.92 0.54 0.38
Southern Asia 0.20 0.27 0.39 0.30 0.56
Eastern and South-Eastern Asia 0.94 0.65 0.33 0.43 0.33
Eastern Asia 1.53 1.58 0.39 0.41 0.29
South-Eastern Asia 0.50 0.33 0.22 0.50 0.42
Latin America and the Caribbean 0.27 0.23 0.18 0.33 0.26
Oceania 0.23 0.30 0.36 0.22 0.21
Australia and New Zealand 0.24 0.30 0.37 0.22 0.21
Oceania (exc. Australia and New Zealand) 0.10 0.24 0.22 0.32 0.33
Europe and Northern America 0.60 0.59 0.50 0.43 0.39
Europe 0.60 0.59 0.47 0.43 0.39
Northern America ... ... 1.10 ... ...
Landlocked developing countries 0.23 0.33 0.38 0.35 0.38
Least developed countries 0.16 0.24 0.15 0.23 0.26
Small island developing States 0.47 1.09 1.01 0.45 0.52

[E/2019/68]
1The Agriculture Orientation Index (AOI) for Government Expenditures is defined as the Agriculture Share of Government
Expenditures, divided by the Agriculture Share of GDP, where Agriculture refers to the agriculture, forestry, fishing and hun ting sector.
Note: Combined Budgetary and Central Government Expenditure.
Source: Food and Agriculture Organisation of United Nations (FAO).
Indicator 2.a.2
Total official flows (official development assistance plus other official flows) to the agriculture
sector
Total official flows (gross disbursements) to the agriculture sector
(Millions of constant 2017 United States dollars)
Regions 20001 2005 2010 2015 2017
Total official flows 7,539.0 5,263.2 10,923.2 11,351.5 12,636.8
Sub-Saharan Africa 1,919.5 1,464.9 2,691.0 3,137.8 3,692.8
Northern Africa 556.4 243.4 297.7 699.6 906.9
Western Asia 544.0 187.4 442.6 623.0 737.6
Central Asia 107.9 80.4 157.8 193.8 206.5
Southern Asia 744.5 809.9 1,897.4 2,102.4 1,726.3
Eastern Asia 333.7 353.3 357.3 413.8 481.3
South-Eastern Asia 887.4 530.0 1,543.7 940.2 1,233.0
Latin America and the Caribbean 1,704.2 794.0 1,633.8 1,172.8 1,138.2
Oceania 90.4 44.3 57.7 83.5 97.3
Europe 188.1 109.2 286.3 274.1 284.4
Landlocked developing countries 1,749.9 1,234.1 2,509.2 2,532.6 2,939.9
Least developed countries 2,146.7 1,651.4 3,316.8 3,626.7 4,101.9
Small island developing States 583.7 123.5 347.4 254.8 311.0
Residual/Unallocated ODA 462.9 646.4 1,557.9 1,710.4 2,132.6 1Based on commitments.
Note: Only the country-specific ODA are included in the regional aggregations. Unallocated ODA to multiple countries/regions are
presented in “Residual/Unallocated ODA” row.
Source: Creditor Reporting System (CRS) database, 2019, The Organisation for Economic Co-operation and Development (OECD).
Target 2.b
Correct and prevent trade restrictions and distortions in world agricultural markets,
including through the parallel elimination of all forms of agricultural export subsidies
and all export measures with equivalent effect, in accordance with the mandate of the
Doha Development Round
Indicator 2.b.1
Agricultural export subsidies
Agricultural export subsidies
(Millions of current United States dollars)
Regions 2000 2005 2010 2016
WTO member States 2,972.9 2,718.0 490.5 117.2
WTO developing member States 85.3 77.9 55.7 1.3
WTO developed member States 2,887.6 2,640.2 434.8 115.9
Note: The notification record varies from year to year, and therefore the set of countries represented in the data may differ among the
years reported, particularly in more recent periods.
Source: Notifications by WTO Members under the Agreement on Agriculture, 2019, World Trade Organisation (WTO).

[E/2019/68]
17
Last editted on 23/06/2019 11:43 PM
Target 2.c
Adopt measures to ensure the proper functioning of food commodity markets and their
derivatives and facilitate timely access to market information, including on food reserves,
in order to help limit extreme food price volatility
Indicator 2.c.1
Indicator of food price anomalies
Proportion of countries recording high/moderately high food price anomalies (Percentage)
Regions 2016 2017
World 19 15
Sub-Saharan Africa 29 12
Western Asia and Northern Africa 21 21
Western Asia 20 20
Northern Africa 25 25
Central Asia and Southern Asia 20 20
Central Asia 0 0
Southern Asia 29 29
Eastern Asia and South-Eastern Asia 29 7
Eastern Asia 25 0
South-Eastern Asia 30 10
Latin America and the Caribbean 10 7
Oceania 40 0
Australia and New Zealand 0 0
Oceania (exc. Australia and New Zealand) 40 0
Northern America and Europe 10 25
Northern America 0 0
Europe 11 26
Landlocked developing countries 33 22
Least developed countries 36 12
Small island developing States 15 12
Source: Food and Agriculture Organisation of United Nations (FAO).

[E/2019/68]
Goal 3
Ensure healthy lives and promote well-being for all at all ages
Target 3.1
By 2030, reduce the global maternal mortality ratio to less than 70 per 100,000 live births
Indicator 3.1.1
Maternal mortality ratio
Maternal mortality ratio
(Maternal deaths per 100,000 live births)
Regions 2000 2005 2010 2015
World 341 (325-370) 288 (277-310) 246 (237-271) 216 (207-249)
Sub-Saharan Africa 858 (797-956) 728 (688-803) 635 (599-717) 555 (518-664)
Northern Africa and Western Asia 166 (149-195) 142 (128-164) 117 (104-138) 105 (91-131)
Northern Africa 224 (189-274) 184 (160-219) 144 (123-175) 125 (101-162)
Western Asia 115 (99-138) 103 (88-125) 90 (74-115) 85 (68-116)
Central and Southern Asia 368 (331-418) 280 (251-318) 214 (191-249) 170 (148-209)
Central Asia 52 (48-56) 48 (44-53) 39 (33-49) 34 (27-48)
Southern Asia 377 (340-429) 288 (257-327) 221 (197-257) 176 (153-216)
Eastern and South-Eastern Asia 112 (103-125) 94 (86-104) 74 (68-86) 59 (53-72)
Eastern Asia 55 (50-63) 46 (41-52) 34 (30-39) 26 (22-32)
South-Eastern Asia 201 (179-228) 166 (148-191) 136 (120-165) 110 (95-142)
Latin America and the Caribbean 99 (96-104) 88 (84-93) 81 (77-88) 67 (64-77)
Oceania 134 (79-253) 108 (61-202) 91 (50-179) 82 (44-163)
Australia and New Zealand 9 (9-10) 8 (8-9) 8 (7-8) 7 (6-8)
Oceania (exc. Australia and New Zealand) 292 (166-559) 239 (130-455) 206 (109-418) 187 (95-381)
Europe and Northern America 18 (17-19) 16 (15-16) 14 (13-15) 13 (12-15)
Europe 21 (20-23) 17 (16-19) 14 (13-15) 13 (11-15)
Northern America 12 (11-12) 13 (13-13) 14 (13-14) 13 (11-15)
Landlocked developing countries 723 (673-802) 596 (557-667) 472 (438-545) 388 (362-470)
Least developed countries 732 (698-801) 614 (589-675) 519 (499-585) 436 (418-514)
Small island developing States 261 (223-335) 233 (196-310) 204 (171-285) 192 (159-283) Note: Numbers in parenthesis represent a 95 per cent confidence interval.
Source: Trends in maternal mortality: 1990 to 2015, estimates by World Health Organisation (WHO), United Nations Children's Fund
(UNICEF), United Nations Population Fund (UNFPA), World Bank Group and the United Nations Population Division.
Indicator 3.1.2
Proportion of births attended by skilled health personnel
Proportion of births attended by skilled health personnel
(Percentage)
Regions 2003 2009 2018
World 62.2 68.6 81.1
Sub-Saharan Africa 42.2 47.2 59.3
Northern Africa and Western Asia 70.8 79.3 89.0
Northern Africa 67.6 77.8 90.4
Western Asia 72.8 80.3 88.0
Central and Southern Asia 39.8 51.2 78.8

[E/2019/68]
19
Last editted on 23/06/2019 11:43 PM
Regions 2003 2009 2018
Central Asia 97.7 97.7 98.9
Southern Asia 38.0 49.4 78.0
Eastern and South-Eastern Asia 85.2 90.1 95.6
Eastern Asia 96.3 99.4 99.9
South-Eastern Asia 67.9 75.1 89.0
Latin America and the Caribbean 87.6 91.4 93.9
Oceania 98.4 98.1 96.7
Australia and New Zealand 99.1 98.7 96.9
Oceania (exc. Australia and New Zealand) … … …
Europe and Northern America 99.2 99.3 99.1
Europe 99.2 99.3 99.2
Northern America 99.3 99.2 99.0
Landlocked developing countries 34.1 45.6 60.3
Least developed countries 32.6 44.1 60.9
Small island developing States 69.6 70.5 76.5 Note: Figures are based on the latest country-level data available in the 2000-2005 period for 2003, 2006-2012 for 2009 and 2013-
2018 for 2018.
Source: Joint global database on skilled attendance at birth, 2019, United Nations Children's Fund (UNICEF) and World Health
Organisation (WHO).
Target 3.2
By 2030, end preventable deaths of newborns and children under 5 years of age, with all
countries aiming to reduce neonatal mortality to at least as low as 12 per 1,000 live births
and under-5 mortality to at least as low as 25 per 1,000 live births
Indicator 3.2.1
Under-five mortality rate
(a) Under-five mortality rate, both sexes
(Deaths per 1,000 live births)
Regions 2000 2005 2010 2015 2017
World 77.1 63.5 51.5 41.9 39.1
Sub-Saharan Africa 155.6 127.6 101.7 81.9 75.9
Northern Africa and Western Asia 50.7 40.7 33.1 28.6 27.2
Northern Africa 59.5 48.5 39.3 33.1 31.4
Western Asia 42.9 33.5 26.9 23.9 22.9
Central and Southern Asia 91.0 74.6 59.9 47.1 42.9
Central Asia 62.9 47.3 34.7 25.8 23.3
Southern Asia 91.9 75.5 60.9 48.0 43.7
Eastern and South-Eastern Asia 39.8 29.2 21.8 17.0 15.6
Eastern Asia 34.4 22.5 15.1 10.4 9.0
South-Eastern Asia 48.6 39.8 32.7 27.7 26.1
Latin America and the Caribbean 33.0 25.7 24.4 18.3 17.7
Oceania 33.3 31.6 27.7 24.0 22.6
Australia and New Zealand 6.4 5.9 5.0 4.1 3.8
Oceania (exc. Australia and New Zealand) 66.4 63.9 58.0 50.7 47.6
Europe and Northern America 9.6 8.1 6.8 6.1 5.7
Europe 10.4 8.2 6.6 5.7 5.3

[E/2019/68]
Regions 2000 2005 2010 2015 2017
Northern America 8.3 7.8 7.2 6.7 6.5
Landlocked developing countries 138.6 109.9 84.5 65.9 60.8
Least developed countries 137.4 110.7 89.6 71.4 66.3
Small island developing States 61.7 55.9 80.0 44.6 42.3 Source: United Nations Inter-agency Group for Child Mortality Estimation (UN IGME), 2018.
(b) Under-five mortality rate, by sex
(Deaths per 1,000 live births)
Regions 2000 2010 2017
Female Male Female Male Female Male
World 74.9 79.1 49.5 53.4 37.0 41.1
Sub-Saharan Africa 147.0 163.7 95.0 108.2 70.2 81.2
Northern Africa and Western Asia 47.6 53.7 30.6 35.4 25.0 29.2
Northern Africa 55.8 62.9 36.6 41.9 29.0 33.6
Western Asia 40.1 45.5 24.7 28.9 21.0 24.7
Central and Southern Asia 93.2 88.8 60.7 59.1 42.5 43.3
Central Asia 55.9 69.6 30.3 38.8 20.3 26.1
Southern Asia 94.4 89.4 61.9 59.9 43.4 44.0
Eastern and South-Eastern Asia 36.9 42.6 19.9 23.6 14.2 17.0
Eastern Asia 32.3 36.4 13.9 16.1 8.4 9.6
South-Eastern Asia 44.0 52.9 29.1 36.1 23.0 29.0
Latin America and the Caribbean 29.6 36.2 22.2 26.6 15.8 19.5
Oceania 30.6 35.9 25.4 30.0 20.6 24.6
Australia and New Zealand 5.7 7.1 4.5 5.5 3.5 4.2
Oceania (exc. Australia and New Zealand) 61.6 71.0 53.6 62.4 43.6 51.5
Europe and Northern America 8.5 10.6 6.1 7.5 5.2 6.3
Europe 9.2 11.6 5.9 7.3 4.8 5.8
Northern America 7.4 9.1 6.5 7.8 5.9 7.1
Landlocked developing countries 130.9 146.0 78.7 90.0 56.1 65.3
Least developed countries 130.2 144.2 83.8 95.1 61.4 71.0
Small island developing States 57.2 66.0 76.0 83.8 38.6 45.7
Source: United Nations Inter-agency Group for Child Mortality Estimation (UN IGME), 2018.
Indicator 3.2.2
Neonatal mortality rate
Neonatal mortality rate, both sexes
(Deaths per 1,000 live births)
Regions 2000 2005 2010 2015 2017
World 30.6 26.0 22.1 19.0 18.0
Sub-Saharan Africa 40.8 36.2 32.1 28.4 27.2
Northern Africa and Western Asia 23.2 19.9 16.9 14.9 14.2
Northern Africa 26.3 23.2 19.8 17.1 16.3
Western Asia 20.3 16.9 14.0 12.6 11.9
Central and Southern Asia 45.1 38.4 33.0 27.6 25.7
Central Asia 26.5 21.9 17.5 12.7 11.6
Southern Asia 45.7 38.9 33.6 28.2 26.3
Eastern and South-Eastern Asia 20.1 14.9 10.9 8.4 7.8

[E/2019/68]
21
Last editted on 23/06/2019 11:43 PM
Regions 2000 2005 2010 2015 2017
Eastern Asia 19.7 12.9 8.0 5.3 4.5
South-Eastern Asia 20.8 18.1 15.6 13.5 12.8
Latin America and the Caribbean 15.8 12.7 11.0 9.9 9.6
Oceania 13.5 13.0 11.8 10.8 10.3
Australia and New Zealand 3.5 3.2 2.8 2.4 2.3
Oceania (exc. Australia and New Zealand) 25.8 25.3 23.8 21.9 21.1
Europe and Northern America 5.2 4.4 3.7 3.3 3.1
Europe 5.5 4.3 3.5 3.1 2.9
Northern America 4.5 4.5 4.0 3.8 3.6
Landlocked developing countries 41.5 36.3 31.4 26.7 25.3
Least developed countries 41.8 36.5 31.7 27.6 26.2
Small island developing States 23.4 22.8 22.3 20.3 19.6
Source: United Nations Inter-agency Group for Child Mortality Estimation (UN IGME), 2018.
Target 3.3
By 2030, end the epidemics of AIDS, tuberculosis, malaria and neglected tropical diseases
and combat hepatitis, water-borne diseases and other communicable diseases
Indicator 3.3.1
Number of new HIV infections per 1,000 uninfected population, by sex, age and key populations
(a) Estimated HIV incidence rate, both sexes, all ages
(Per 1,000 uninfected population)
Regions 2000 2005 2010 2015 2017
World 0.49 0.40 0.33 0.27 0.25
Sub-Saharan Africa 3.55 2.63 2.00 1.44 1.25
Northern Africa and Western Asia 0.03 0.03 0.04 0.04 0.05
Northern Africa 0.03 0.04 0.04 0.04 0.04
Western Asia 0.03 0.03 0.03 0.04 0.05
Central and Southern Asia 0.17 0.10 0.09 0.08 0.07
Central Asia 0.11 0.12 0.14 0.19 0.21
Southern Asia 0.17 0.10 0.09 0.07 0.06
Eastern and South-Eastern Asia 0.10 0.11 0.09 0.08 0.08
Eastern Asia 0.05 0.05 0.04 0.04 0.04
South-Eastern Asia 0.26 0.26 0.21 0.17 0.15
Latin America and the Caribbean 0.25 0.23 0.21 0.19 0.19
Oceania 0.18 0.14 0.12 0.12 0.12
Australia and New Zealand 0.04 0.04 0.04 0.04 0.05
Oceania (exc. Australia and New Zealand) 0.68 0.47 0.37 0.37 0.35
Europe and Northern America 0.13 0.15 0.16 0.17 0.17
Europe 0.12 0.15 0.17 0.19 0.19
Northern America 0.14 0.14 0.13 0.12 0.11
Landlocked developing countries 1.90 1.33 1.13 0.78 0.66
Least developed countries 1.42 1.08 0.88 0.63 0.55
Small island developing States 0.85 0.64 0.49 0.41 0.38
Source: The Joint United Nations Programme on HIV/AIDS (UNAIDS).

[E/2019/68]
(b) Estimated HIV incidence rate, all ages, by sex
(Per 1,000 uninfected population)
Regions 2000 2005 2010 2017
Female Male Female Male Female Male Female Male
World 0.50 0.48 0.40 0.39 0.33 0.34 0.24 0.26
Sub-Saharan Africa 3.99 3.12 2.96 2.31 2.25 1.75 1.40 1.10
Northern Africa and Western Asia 0.02 0.04 0.03 0.04 0.03 0.05 0.03 0.06
Northern Africa 0.03 0.04 0.03 0.05 0.03 0.05 0.03 0.05
Western Asia 0.02 0.04 0.02 0.04 0.02 0.05 0.02 0.07
Central and Southern Asia 0.14 0.19 0.08 0.12 0.07 0.11 0.05 0.09
Central Asia 0.06 0.16 0.07 0.18 0.08 0.21 0.12 0.30
Southern Asia 0.15 0.20 0.08 0.12 0.07 0.10 0.05 0.08
Eastern and South-Eastern Asia 0.07 0.14 0.07 0.14 0.06 0.12 0.04 0.11
Eastern Asia 0.03 0.07 0.03 0.07 0.02 0.06 0.02 0.06
South-Eastern Asia 0.17 0.34 0.17 0.35 0.14 0.27 0.09 0.22
Latin America and the Caribbean 0.18 0.32 0.16 0.30 0.13 0.29 0.11 0.26
Oceania 0.17 0.19 0.12 0.15 0.10 0.13 0.10 0.14
Australia and New Zealand 0.01 0.08 0.01 0.07 0.01 0.07 0.01 0.08
Oceania (exc. Australia and New Zealand) 0.77 0.60 0.52 0.41 0.41 0.33 0.38 0.32
Europe and Northern America 0.07 0.19 0.09 0.21 0.09 0.22 0.10 0.24
Europe 0.08 0.17 0.10 0.20 0.11 0.23 0.13 0.26
Northern America 0.06 0.23 0.06 0.23 0.05 0.21 0.04 0.18
Landlocked developing countries 2.08 1.71 1.45 1.22 1.23 1.03 0.71 0.60
Least developed countries 1.60 1.24 1.22 0.95 0.98 0.78 0.61 0.48
Small island developing States 0.76 0.94 0.60 0.67 0.45 0.53 0.34 0.41
Source: The Joint United Nations Programme on HIV/AIDS (UNAIDS).
(c) Estimated HIV incidence rate, both sexes, by age
(Per 1,000 uninfected population)
Regions 2000 2005 2010 2017
Children Adults Children Adults Children Adults Children Adults
(0-14) (15-49) (0-14) (15-49) (0-14) (15-49) (0-14) (15-49)
World 0.23 0.75 0.21 0.60 0.15 0.52 0.09 0.40
Sub-Saharan Africa 1.42 6.04 1.15 4.34 0.72 3.39 0.39 2.14
Northern Africa and Western Asia 0.00 0.05 0.01 0.06 0.01 0.06 0.01 0.08
Northern Africa 0.01 0.06 0.01 0.07 0.01 0.07 0.01 0.08
Western Asia 0.00 0.05 0.00 0.05 0.00 0.06 0.00 0.09
Central and Southern Asia 0.04 0.26 0.03 0.16 0.02 0.14 0.01 0.11
Central Asia 0.01 0.19 0.01 0.20 0.01 0.24 0.01 0.36
Southern Asia 0.04 0.26 0.03 0.15 0.02 0.13 0.01 0.10
Eastern and South-Eastern Asia 0.01 0.18 0.01 0.18 0.01 0.15 0.01 0.12
Eastern Asia 0.00 0.08 0.00 0.08 0.00 0.07 0.00 0.07
South-Eastern Asia 0.03 0.44 0.03 0.45 0.03 0.35 0.03 0.27
Latin America and the Caribbean 0.05 0.43 0.04 0.39 0.03 0.36 0.02 0.33
Oceania 0.06 0.30 0.07 0.22 0.07 0.19 0.05 0.20
Australia and New Zealand 0.00 0.07 0.00 0.08 0.00 0.07 0.00 0.09
Oceania (exc. Australia and New
Zealand) 0.16 1.16 0.20 0.72 0.18 0.56 0.14 0.54
Europe and Northern America 0.01 0.24 0.01 0.27 0.01 0.29 0.01 0.33

[E/2019/68]
23
Last editted on 23/06/2019 11:43 PM
Regions 2000 2005 2010 2017
Children Adults Children Adults Children Adults Children Adults
(0-14) (15-49) (0-14) (15-49) (0-14) (15-49) (0-14) (15-49)
Europe 0.01 0.22 0.01 0.27 0.01 0.31 0.01 0.38
Northern America 0.00 0.26 0.00 0.26 0.00 0.26 0.00 0.23
Landlocked developing countries 1.03 2.93 0.71 2.06 0.49 1.82 0.22 1.10
Least developed countries 0.69 2.26 0.56 1.69 0.41 1.39 0.22 0.88
Small island developing States 0.22 1.40 0.22 1.02 0.19 0.78 0.13 0.61
Source: The Joint United Nations Programme on HIV/AIDS (UNAIDS).
Indicator 3.3.2
Tuberculosis incidence per 100,000 population
Estimated incidence of tuberculosis
(Per 100,000 population)
Regions 2000 2005 2010 2017
World 170 (142 - 201) 167 (139 - 197) 154 (129 - 181) 134 (120 - 148)
Sub-Saharan Africa 344 (307 - 381) 356 (317 - 396) 321 (288 - 354) 244 (218 - 270)
Northern Africa and Western Asia 58 (52 - 63) 52 (46 - 57) 46 (40 - 51) 36 (33 - 39)
Northern Africa 68 (57 - 80) 63 (53 - 73) 60 (49 - 71) 49 (43 - 55)
Western Asia 47 (44 - 51) 40 (38 - 43) 32 (30 - 34) 24 (23 - 26)
Central and Southern Asia 258 (147 - 369) 252 (145 - 359) 229 (134 - 324) 197 (148 - 246)
Central Asia 144 (118 - 171) 151 (125 - 177) 116 (93 - 139) 76 (63 - 89)
Southern Asia 263 (147 - 378) 255 (144 - 367) 233 (135 - 332) 201 (151 - 252)
Eastern and South-Eastern Asia 171 (148 - 194) 158 (141 - 176) 145 (130 - 160) 134 (119 - 148)
Eastern Asia 107 (83 - 132) 93 (78 - 109) 80 (70 - 90) 67 (59 - 75)
South-Eastern Asia 353 (300 - 406) 335 (285 - 385) 315 (268 - 363) 300 (254 - 347)
Latin America and the Caribbean 53 (49 - 57) 48 (44 - 52) 42 (39 - 46) 42 (39 - 45)
Oceania 88 (58 - 117) 92 (60 - 123) 94 (62 - 126) 98 (81 - 115)
Australia and New Zealand 7.0 (6.1 - 7.8) 6.5 (5.7 - 7.3) 6.8 (5.9 - 7.6) 6.9 (6.0 - 7.7)
Oceania (exc. Australia and New Zealand) 310 (199 - 421) 317 (204 - 431) 322 (206 - 438) 329 (270 - 389)
Europe and Northern America 34 (28 - 39) 31 (25 - 36) 27 (22 - 31) 19 (16 - 22)
Europe 46 (37 - 54) 42 (34 - 49) 37 (30 - 44) 26 (22 - 31)
Northern America 6.7 (5.8 - 7.5) 5.5 (4.8 - 6.2) 4.2 (3.7 - 4.8) 3.3 (2.9 - 3.7)
Landlocked developing countries 280 (242 - 318) 249 (218 - 280) 206 (181 - 232) 148 (132 - 164)
Least developed countries 297 (266 - 328) 278 (250 - 306) 254 (228 - 280) 217 (196 - 239)
Small island developing States 119 (96 - 143) 128 (104 - 152) 123 (100 - 147) 121 (108 - 135)
Note: Lower and upper bounds in parentheses.
Source: WHO Global Tuberculosis Report 2018, World Health Organisation (WHO).

[E/2019/68]
Indicator 3.3.3
Malaria incidence per 1,000 population
Malaria incidence per 1,000 population at risk
(Per 1,000 population at risk)
Regions 2000 2005 2010 2015 2017
World 78.9 80.7 71.7 59.5 59.1
Sub-Saharan Africa 325.3 321.3 271.9 221.7 216.9
Northern Africa and Western Asia 49.1 38.9 34.2 36.0 35.6
Northern Africa 61.5 48.8 26.4 36.0 35.3
Western Asia 30.1 24.0 45.7 35.9 36.1
Central and Southern Asia 21.6 20.8 16.3 9.3 7.4
Central Asia 9.1 1.1 0.0 0.0 0.0
Southern Asia 10.8 10.4 8.2 4.6 3.7
Eastern and South-Eastern Asia 5.2 4.5 5.4 2.0 1.8
Eastern Asia 0.2 0.1 0.0 0.0 0.0
South-Eastern Asia 6.3 5.5 6.4 2.3 2.1
Latin America and the Caribbean 7.3 5.6 3.3 2.2 3.7
Oceania 292.2 266.2 171.2 126.3 175.9
Australia and New Zealand 0.0 0.0 0.0 0.0 0.0
Oceania (exc. Australia and New Zealand) 292.2 266.2 171.2 126.3 175.9
Europe and Northern America 0.0 0.0 0.0 0.0 0.0
Europe 0.0 0.0 0.0 0.0 0.0
Northern America 0.0 0.0 0.0 0.0 0.0
Landlocked developing countries 253.3 245.4 223.2 176.7 178.2
Least developed countries 244.4 237.2 198.4 169.6 167.9
Small island developing States 112.5 96.4 66.6 44.7 60.8
Source: The World Malaria Report, 2018, World Health Organisation (WHO).
Indicator 3.3.4
Hepatitis B incidence per 100,000 population
Prevalence of hepatitis B surface antigen (HBsAg) in children under 5 years of age
(Percentage)
Regions 2015 2017
World 1.3 (0.9-2.2) 0.8 (0.64-1.04)
Note: Lower and upper bounds in parentheses.
Source: World Health Organisation (WHO).
Indicator 3.3.5
Number of people requiring interventions against neglected tropical diseases
Population requiring interventions against neglected tropical diseases
(Number)
Regions 2010 2015 2017
World 2,029,908,853 1,630,986,293 1,582,943,913
Sub-Saharan Africa 632,128,842 645,415,908 597,375,743
Northern Africa and Western Asia 79,518,653 39,840,824 29,628,844
Central and Southern Asia 888,716,138 624,317,141 637,099,490
Eastern and South-Eastern Asia 329,452,489 242,190,834 234,720,936

[E/2019/68]
25
Last editted on 23/06/2019 11:43 PM
Regions 2010 2015 2017
Latin America and the Caribbean 88,382,477 70,756,727 75,503,184
Australia and New Zealand 89,786 20,769 23,255
Oceania (exc. Australia and New Zealand) 10,536,459 8,439,657 8,588,353
Europe and Northern America 1,084,009 4,433 4,108
Landlocked developing countries 249,364,741 249,666,308 226,842,763
Least developed countries 662,782,809 583,843,018 522,023,818
Small island developing States 26,175,055 24,301,964 22,437,690
Source: Global Health Observatory (GHO), World Health Organisation (WHO).
Note: Data aggregated across interventions and diseases.
Target 3.4
By 2030, reduce by one third premature mortality from non-communicable diseases
through prevention and treatment and promote mental health and well-being
Indicator 3.4.1
Mortality rate attributed to cardiovascular disease, cancer, diabetes or chronic respiratory disease
(a) Probability of dying from any of cardiovascular disease, cancer, diabetes, chronic respiratory disease
between age 30 and exact age 70, both sexes
(Percentage)
Regions 2000 2005 2010 2015 2016
World 22.4 20.9 19.4 18.5 18.3
Sub-Saharan Africa 24.2 23.1 21.8 21.1 21.0
Northern Africa and Western Asia 23.8 22.5 21.1 20.1 19.8
Northern Africa 24.6 23.5 22.3 21.8 21.4
Western Asia 23.2 21.6 20.0 18.5 18.3
Central and Southern Asia 26.4 25.2 24.0 23.2 23.0
Central Asia 33.3 33.6 29.0 26.7 25.7
Southern Asia 26.1 24.8 23.9 23.0 22.9
Eastern and South-Eastern Asia 20.7 19.0 18.1 17.5 17.3
Eastern Asia 20.0 17.7 16.8 16.2 15.9
South-Eastern Asia 23.7 23.8 23.2 22.4 22.2
Latin America and the Caribbean 20.6 18.7 17.4 16.2 16.0
Oceania 16.2 14.4 13.0 12.6 12.4
Australia and New Zealand 13.6 11.7 10.3 9.5 9.3
Oceania (exc. Australia and New Zealand) 31.6 29.9 28.5 29.3 29.3
Europe and Northern America 21.8 20.2 17.1 15.8 15.6
Europe 23.2 21.9 18.4 16.6 16.3
Northern America 17.6 15.7 14.1 13.9 14.1
Landlocked developing countries 27.1 26.2 23.7 22.5 22.2
Least developed countries 24.3 23.5 22.5 21.8 21.7
Small island developing States 22.1 20.1 19.2 19.0 18.8
Source: Global Health Estimates 2016: Deaths by Cause, Age and Sex, by Country, 2000-2016, 2018, World Health Organisation
(WHO).

[E/2019/68]
(b) Probability of dying from any of cardiovascular disease, cancer, diabetes, chronic respiratory disease
between age 30 and exact age 70, by sex
(Percentage)
Regions 2000 2005 2010 2016
Female Male Female Male Female Male Female Male
World 18.6 26.4 17.4 24.5 16.0 22.8 15.0 21.6
Sub-Saharan Africa 24.3 24.2 23.1 23.1 21.5 22.2 20.5 21.6
Northern Africa and Western Asia 19.8 27.9 18.7 26.3 17.6 24.6 16.5 23.0
Northern Africa 21.5 27.8 20.6 26.5 19.7 25.1 18.8 24.0
Western Asia 18.3 27.9 17.0 26.0 15.7 24.2 14.4 22.1
Central and Southern Asia 23.5 29.1 22.5 27.8 21.2 26.8 19.8 26.1
Central Asia 25.8 41.2 25.8 41.8 22.2 36.3 19.5 32.7
Southern Asia 23.4 28.6 22.4 27.2 21.2 26.5 19.8 25.9
Eastern and South-Eastern Asia 17.2 24.2 15.8 22.1 14.8 21.4 14.0 20.5
Eastern Asia 16.3 23.4 14.6 20.7 13.6 19.8 12.9 18.8
South-Eastern Asia 20.5 27.2 20.0 27.9 19.1 27.5 18.0 26.6
Latin America and the Caribbean 17.6 23.9 15.9 21.7 14.8 20.3 13.5 18.7
Oceania 13.1 19.2 11.8 17.0 10.7 15.3 10.3 14.6
Australia and New Zealand 10.5 16.6 9.2 14.2 8.1 12.4 7.4 11.1
Oceania (exc. Australia and New Zealand) 28.1 35.1 26.4 33.4 25.2 31.9 25.4 33.3
Europe and Northern America 15.6 28.3 14.4 26.3 12.3 22.2 11.3 20.2
Europe 16.0 30.7 15.1 29.2 12.7 24.5 11.2 21.7
Northern America 14.2 21.2 12.7 18.8 11.4 17.0 11.4 16.9
Landlocked developing countries 24.4 30.0 23.4 29.3 21.2 26.5 19.6 25.1
Least developed countries 24.1 24.5 22.9 24.1 21.6 23.5 20.5 23.0
Small island developing States 19.6 24.8 17.6 22.7 16.7 21.8 16.2 21.4 Source: Global Health Estimates 2016: Deaths by Cause, Age and Sex, by Country, 2000-2016, 2018, World Health Organisation
(WHO).
Indicator 3.4.2
Suicide mortality rate
(a) Suicide rate
(Per 100,000 population)
Regions 2000 2005 2010 2015 2016
World 12.9 12.3 11.5 10.7 10.6
Sub-Saharan Africa 8.5 8.0 7.7 7.5 7.5
Northern Africa and Western Asia 4.8 4.9 5.0 4.7 4.7
Northern Africa 4.8 4.7 4.4 4.3 4.4
Western Asia 4.8 5.1 5.5 5.1 5.0
Central and Southern Asia 14.7 14.7 13.5 13.2 13.0
Central Asia 14.8 15.3 13.1 11.4 10.7
Southern Asia 14.7 14.7 13.6 13.2 13.1
Eastern and South-Eastern Asia 12.2 11.3 10.9 9.6 9.5
Eastern Asia 14.2 13.3 12.8 11.1 11.0
South-Eastern Asia 6.1 5.7 5.8 5.8 5.8
Latin America and the Caribbean 6.5 6.4 6.5 7.1 6.8
Oceania 11.7 10.8 10.7 11.5 11.1
Australia and New Zealand 13.2 12.4 12.6 13.5 13.0

[E/2019/68]
27
Last editted on 23/06/2019 11:43 PM
Regions 2000 2005 2010 2015 2016
Oceania (exc. Australia and New Zealand) 7.2 5.8 5.5 5.9 5.9
Europe and Northern America 20.3 19.5 17.6 16.5 16.4
Europe 24.2 22.9 19.6 17.4 17.1
Northern America 11.4 12.0 13.2 14.7 15.0
Landlocked developing countries 10.1 9.7 8.7 8.0 7.9
Least developed countries 7.7 7.3 6.8 6.6 6.6
Small island developing States 10.5 9.2 9.3 9.5 9.6 Source: Global Health Estimates 2016: Deaths by Cause, Age, Sex, by Country and by Region, 2000-2016, 2018, World Health
Organisation (WHO).
(b) Suicide rate, by sex
(Per 100,000 population)
Regions 2000 2005 2010 2016
Female Male Female Male Female Male Female Male
World 9.7 16.0 9.3 15.3 8.6 14.3 7.7 13.5
Sub-Saharan Africa 6.0 11.0 5.5 10.6 5.4 10.1 4.9 10.1
Northern Africa and Western Asia 2.7 6.9 2.7 7.0 2.7 7.1 2.5 6.8
Northern Africa 3.2 6.5 2.9 6.4 2.6 6.2 2.3 6.4
Western Asia 2.3 7.2 2.5 7.5 2.8 7.9 2.7 7.2
Central and Southern Asia 13.2 16.2 13.8 15.6 12.2 14.8 11.5 14.4
Central Asia 5.5 24.4 5.5 25.3 5.4 20.9 4.9 16.6
Southern Asia 13.5 15.9 14.2 15.2 12.5 14.5 11.8 14.3
Eastern and South-Eastern Asia 12.0 12.3 10.8 11.8 10.3 11.5 8.5 10.6
Eastern Asia 14.8 13.7 13.4 13.3 12.9 12.7 10.5 11.5
South-Eastern Asia 4.1 8.2 3.6 7.8 3.6 8.1 3.5 8.0
Latin America and the Caribbean 2.8 10.2 2.9 10.0 3.0 10.2 3.1 10.7
Oceania 5.6 17.8 5.5 16.0 5.7 15.8 5.9 16.3
Australia and New Zealand 5.9 20.5 6.2 18.8 6.5 18.6 6.9 19.2
Oceania (exc. Australia and New Zealand) 4.4 9.8 3.4 8.1 3.1 7.8 3.2 8.5
Europe and Northern America 8.4 33.0 8.1 31.6 7.4 28.4 7.2 26.1
Europe 9.8 39.6 9.2 37.6 8.0 32.2 7.3 27.6
Northern America 5.0 18.0 5.5 18.7 6.1 20.5 7.2 23.1
Landlocked developing countries 5.9 14.4 5.6 13.9 5.1 12.3 4.7 11.1
Least developed countries 6.0 9.4 5.7 8.8 5.3 8.3 4.8 8.3
Small island developing States 5.4 15.7 4.6 13.7 4.5 14.1 4.4 14.8 Source: Global Health Estimates 2016: Deaths by Cause, Age, Sex, by Country and by Region, 2000 -2016, 2018, World Health
Organisation (WHO).

[E/2019/68]
Target 3.5
Strengthen the prevention and treatment of substance abuse, including narcotic drug
abuse and harmful use of alcohol
Indicator 3.5.2
Harmful use of alcohol, defined according to the national context as alcohol per capita consumption
(aged 15 years and older) within a calendar year in litres of pure alcohol
Alcohol consumption per capita1
(Litres of pure alcohol)
Regions 2000 2005 2010 2015 2016
World 5.7 5.5 6.4 6.4 6.4
Sub-Saharan Africa 6.5 6.5 6.6 6.5 6.5
Northern Africa and Western Asia 1.5 1.2 1.2 1.1 1.1
Northern Africa 0.6 0.7 0.6 0.7 0.6
Western Asia 2.2 1.7 1.8 1.6 1.5
Central and Southern Asia 2.3 2.0 3.4 4.3 4.3
Central Asia 6.0 6.1 5.6 4.7 4.6
Southern Asia 2.2 1.9 3.3 4.3 4.3
Eastern and South-Eastern Asia 4.3 4.1 6.2 6.5 6.5
Eastern Asia 4.9 4.6 7.2 7.3 7.3
South-Eastern Asia 2.3 2.6 3.5 4.2 4.3
Latin America and the Caribbean 7.4 7.3 7.5 7.1 6.9
Oceania 9.6 9.9 10.1 8.7 8.6
Australia and New Zealand 11.5 11.9 12.3 10.6 10.6
Oceania (exc. Australia and New Zealand) 2.2 1.8 1.9 1.5 1.4
Europe and Northern America 12.2 12.5 11.6 10.9 10.7
Europe 13.4 13.7 12.6 11.4 11.2
Northern America 9.4 9.5 9.4 9.7 9.7
Landlocked developing countries 5.0 4.9 4.9 4.3 4.3
Least developed countries 2.5 2.7 3.1 3.1 3.0
Small island developing States 4.8 4.8 4.7 4.9 4.8
Source: Global Information System on Alcohol and Health (GISAH), 2018, World Health Organisation (WHO). 1 For persons aged 15 and above.
Target 3.6
By 2020, halve the number of global deaths and injuries from road traffic accidents
Indicator 3.6.1
Death rate due to road traffic injuries
Death rate due to road traffic injuries
(Per 100,000 population)
Regions 2000 2005 2010 2013
World 18.0 18.8 18.0 17.4
Sub-Saharan Africa 28.3 27.9 27.1 26.7
Northern Africa and Western Asia 17.9 18.1 18.4 18.2
Northern Africa 19.6 19.7 21.5 20.6
Western Asia 16.3 16.7 15.8 16.1

[E/2019/68]
29
Last editted on 23/06/2019 11:43 PM
Regions 2000 2005 2010 2013
Central and Southern Asia 16.6 17.3 17.1 16.7
Central Asia 12.9 19.4 17.8 16.9
Southern Asia 16.8 17.3 17.1 16.7
Eastern and South-Eastern Asia 18.2 19.8 18.9 17.9
Eastern Asia 17.8 19.9 18.8 17.5
South-Eastern Asia 19.5 19.5 19.3 19.0
Latin America and the Caribbean 16.5 17.2 18.7 19.2
Australia and New Zealand 9.9 8.5 6.9 5.5
Oceania (exc. Australia and New Zealand) 16.3 16.3 16.4 15.5
Europe and Northern America 14.4 14.1 10.3 9.1
Europe 14.1 13.8 9.9 8.7
Northern America 14.9 14.9 11.1 10.2
Landlocked developing countries 21.4 23.0 22.9 23.3
Least developed countries 23.4 23.7 23.8 23.9
Small island developing States 17.6 16.5 15.4 15.2 Source: Global Status Report on Road Safety 2015, World Health Organisation (WHO).
Target 3.7
By 2030, ensure universal access to sexual and reproductive health-care services,
including for family planning, information and education, and the integration of
reproductive health into national strategies and programmes
Indicator 3.7.1
Proportion of women of reproductive age (aged 15-49 years) who have their need for family
planning satisfied with modern methods
Proportion of women of reproductive age (aged 15-49 years) who have their need for family planning
satisfied with modern methods
(Percentage)
Regions 2000 2005 2010 2015 2019
World 73.5 74.8 75.3 75.4 75.7
Sub-Saharan Africa 35.9 40.4 45.6 51.6 54.7
Northern Africa and Western Asia 55.6 59.0 60.5 61.5 62.9
Northern Africa 67.0 69.5 70.6 70.9 71.7
Western Asia 45.8 49.7 51.9 53.7 55.3
Central and Southern Asia 63.9 66.9 66.7 66.3 68.0
Central Asia 74.2 75.1 75.2 75.7 76.1
Southern Asia 63.5 66.6 66.4 66.0 67.7
Eastern and South-Eastern Asia 86.3 86.3 86.4 86.4 86.3
Eastern Asia 90.1 89.9 89.9 90.0 90.1
South-Eastern Asia 70.2 72.6 73.8 74.3 74.9
Latin America and the Caribbean 76.2 79.2 81.0 82.1 82.6
Oceania 76.5 75.8 76.0 76.9 77.1
Australia and New Zealand 83.7 83.0 83.2 84.2 84.5
Oceania (exc. Australia and New Zealand) 42.3 44.8 47.1 49.2 51.1
Europe and Northern America 73.6 75.9 78.1 79.6 80.5
Europe 70.0 73.1 76.0 78.2 79.3

[E/2019/68]
Regions 2000 2005 2010 2015 2019
Northern America 81.4 82.0 82.6 82.9 83.4
Landlocked developing countries 43.8 48.3 54.1 59.4 61.9
Least developed countries 39.1 44.5 50.0 55.0 57.6
Small island developing States 67.7 68.7 70.1 69.8 70.0 Source: Estimates and Projections of Family Planning Indicators: The 2019 Revision. 2019. United Nations Population Division,
Department of Economic and Social Affairs, United Nations.
Indicator 3.7.2
Adolescent birth rate (aged 10-14 years; aged 15-19 years) per 1,000 women in that age group
Adolescent birth rate per 1,000 women aged 15-19 years
Regions 2000 2005 2010 2015 2018
World 56.0 50.6 47.5 45.2 43.9
Sub-Saharan Africa 129.6 122.4 114.4 105.9 101.4
Northern Africa and Western Asia 50.9 46.9 44.7 42.2 40.5
Northern Africa 48.5 47.2 46.0 43.7 41.6
Western Asia 53.2 46.7 43.6 40.8 39.5
Central and Southern Asia 70.0 55.5 43.7 35.0 31.8
Central Asia 34.5 25.2 25.7 25.4 24.3
Southern Asia 71.4 56.7 44.4 35.4 32.1
Eastern and South-Eastern Asia 19.4 18.6 19.5 20.7 20.8
Eastern Asia 8.7 7.4 6.6 6.2 5.9
South-Eastern Asia 43.8 44.4 45.2 45.1 44.3
Latin America and the Caribbean 80.7 74.0 68.5 64.0 61.3
Oceania 34.7 32.6 30.8 28.4 27.4
Australia and New Zealand 20.0 19.1 17.8 15.2 14.1
Oceania (exc. Australia and New Zealand) 61.9 57.3 53.5 49.7 48.0
Europe and Northern America 28.7 25.9 22.7 17.4 15.0
Europe 21.9 19.7 17.7 14.6 13.2
Northern America 44.4 38.8 31.8 22.2 18.0
Landlocked developing countries 110.5 99.9 91.5 84.3 80.6
Least developed countries 121.4 113.1 104.0 95.3 91.2
Small island developing States 69.2 63.0 58.3 53.4 51.1
Note: Estimated birth rates for women aged 10-14 years are not reported due to current data limitations.
Source: World Population Prospects: The 2017 Revision, Special aggregates , 2017, United Nations Population Division, Department
of Economic and Social Affairs, United Nations.

[E/2019/68]
31
Last editted on 23/06/2019 11:43 PM
Target 3.8
Achieve universal health coverage, including financial risk protection, access to quality
essential health-care services and access to safe, effective, quality and affordable essential
medicines and vaccines for all
Indicator 3.8.1
Coverage of essential health services (defined as the average coverage of essential services based on
tracer interventions that include reproductive, maternal, newborn and child health, infectious
diseases, non-communicable diseases and service capacity and access, among the general and the
most disadvantaged population)
Universal health coverage (UHC) service coverage index
Regions 2015
World 64
Sub-Saharan Africa 42
Northern Africa and Western Asia 65
Northern Africa 64
Western Asia 65
Central and Southern Asia 54
Central Asia 70
Southern Asia 53
Eastern and South-Eastern Asia 72
Eastern Asia 77
South-Eastern Asia 59
Latin America and the Caribbean 75
Oceania 74
Australia and New Zealand ≥80
Oceania (exc. Australia and New Zealand) 45
Europe and Northern America 77
Europe 74
Northern America ≥80
Landlocked developing countries 47
Least developed countries 42
Small island developing States 63
Source: Tracking universal health coverage: 2017 Global Monitoring Report, World Health Organisation (WHO).
Indicator 3.8.2
Proportion of population with large household expenditures on health as a share of total household
expenditure or income
(a) Proportion of population with large household expenditures on health (greater than 25 per cent) as a
share of total household expenditure or income
(Percentage)
Regions 2000 2005 2010
World 1.85 2.39 2.60
Sub-Saharan Africa 1.66 2.12 2.60
Northern Africa and Western Asia 1.25 1.30 1.58

[E/2019/68]
Regions 2000 2005 2010
Central and Southern Asia 2.05 2.18 2.98
Eastern and South-Eastern Asia 2.18 3.39 3.40
Latin America and the Caribbean 2.58 3.22 2.50
Oceania 0.46 0.43 0.53
Europe and Northern America 0.90 1.00 0.90
Europe 0.89 1.00 0.98
Northern America 1.00 0.91 0.76
Source: Global database on financial protection, World Health Organisation (WHO); Tracking Universal Health Coverage: 2017 Global
Monitoring Report, World Health Organisation (WHO) and the World Bank.
(b) Proportion of population with large household expenditures on health (greater than 10 per cent) as a
share of total household expenditure or income
(Percentage)
Regions 2000 2005 2010
World 9.66 11.43 11.72
Sub-Saharan Africa 8.66 9.67 10.32
Northern Africa and Western Asia 8.06 10.08 11.38
Central and Southern Asia 11.59 11.78 13.27
Eastern and South-Eastern Asia 9.72 13.03 13.02
Latin America and the Caribbean 13.44 17.53 14.81
Oceania 3.51 3.37 3.92
Europe and Northern America 6.20 6.50 6.40
Europe 6.51 7.01 7.22
Northern America 5.50 5.31 4.55
Source: Global database on financial protection, World Health Organisation (WHO); Tracking Universal Health Coverage: 2017 Global
Monitoring Report, World Health Organisation (WHO) and the World Bank.
Target 3.9
By 2030, substantially reduce the number of deaths and illnesses from hazardous
chemicals and air, water and soil pollution and contamination
Indicator 3.9.1
Mortality rate attributed to household and ambient air pollution
(a) Crude mortality rate attributed to household and ambient air pollution
(Per 100,000 population)
Regions
2016
Household air
pollution
Ambient air
pollution
Joint ambient and air
pollution
World 51 57 95
Sub-Saharan Africa 75 44 100
Northern Africa and Western Asia 13 44 56
Northern Africa 15 55 66
Western Asia 11 42 47
Central and Southern Asia 73 73 123
Central Asia 13 48 58
Southern Asia 75 74 126
Eastern and South-Eastern Asia 63 66 116
Eastern Asia 67 77 128

[E/2019/68]
33
Last editted on 23/06/2019 11:43 PM
Regions
2016
Household air
pollution
Ambient air
pollution
Joint ambient and air
pollution
South-Eastern Asia 54 40 85
Latin America and the Caribbean 13 26 37
Oceania 19 18 35
Australia and New Zealand … 16 16
Oceania (exc. Australia and New
Zealand) 70 24 86
Europe and Northern America 4 46 50
Europe 6 57 62
Northern America … 23 23
Source: Global Health Observatory (GHO), World Health Organisation (WHO).
(b) Age-standardized mortality rate attributed to household and ambient air pollution
(Per 100,000 population)
Regions
2016
Household air
pollution
Ambient air
pollution
Joint ambient and air
pollution
Sub-Saharan Africa 138 82 187
Northern Africa and Western Asia 22 73 86
Northern Africa 25 81 99
Western Asia 19 65 75
Central and Southern Asia 100 100 170
Central Asia 19 69 85
Southern Asia 103 102 174
Eastern and South-Eastern Asia 60 58 106
Eastern Asia 55 61 103
South-Eastern Asia 73 51 113
Latin America and the Caribbean 15 27 39
Oceania 31 17 44
Australia and New Zealand … 8 8
Oceania (exc. Australia and New
Zealand) 117 40 144
Europe and Northern America 2 23 24
Europe 3 27 30
Northern America … 13 13
Source: Global Health Observatory (GHO), World Health Organisation (WHO).

[E/2019/68]
Indicator 3.9.2
Mortality rate attributed to unsafe water, unsafe sanitation and lack of hygiene (exposure to unsafe
Water, Sanitation and Hygiene for All (WASH) services)
Mortality rate attributed to unsafe water, unsafe sanitation and lack of hygiene
(Per 100,000 population)
Regions 2016
World 11.7
Sub-Saharan Africa 48.2
Northern Africa and Western Asia 3.2
Northern Africa 4.5
Western Asia 2.0
Central and Southern Asia 16.5
Central Asia 1.0
Southern Asia 17.1
Eastern and South-Eastern Asia 2.0
Eastern Asia 0.6
South-Eastern Asia 5.5
Latin America and the Caribbean 1.7
Oceania 3.7
Australia and New Zealand 0.1
Oceania (exc. Australia and New Zealand) 13.7
Europe and Northern America 0.2
Europe 0.2
Northern America 0.2
Landlocked developing countries 32.4
Least developed countries 34.3
Small island developing States 9.0 Source: Global Health Observatory (GHO), World Health Organisation (WHO).
Indicator 3.9.3
Mortality rate attributed to unintentional poisoning
(a) Mortality rate attributed to unintentional poisonings, both sexes
(Per 100,000 population)
Regions 2000 2005 2010 2015 2016
World 2.2 1.9 1.6 1.5 1.4
Sub-Saharan Africa 3.7 3.4 3.2 2.9 2.8
Northern Africa and Western Asia 1.5 1.2 1.0 0.9 0.9
Northern Africa 1.7 1.4 1.2 1.1 1.0
Western Asia 1.3 1.0 0.9 0.8 0.8
Central and Southern Asia 4.3 3.4 2.6 2.1 2.0
Central Asia 5.4 2.4 1.6 1.4 1.3
Southern Asia 4.3 3.4 2.6 2.1 2.0
Eastern and South-Eastern Asia 1.2 1.1 1.1 1.1 1.1
Eastern Asia 1.4 1.2 1.2 1.3 1.3
South-Eastern Asia 0.8 0.7 0.6 0.6 0.5
Latin America and the Caribbean 0.7 0.6 0.5 0.5 0.4
Oceania 0.6 0.6 0.6 0.6 0.5

[E/2019/68]
35
Last editted on 23/06/2019 11:43 PM
Regions 2000 2005 2010 2015 2016
Australia and New Zealand 0.2 0.2 0.2 0.2 0.2
Oceania (exc. Australia and New Zealand) 1.9 1.9 1.7 1.6 1.5
Europe and Northern America 1.3 1.1 0.9 0.8 0.8
Europe 1.6 1.2 0.9 0.7 0.7
Northern America 0.7 0.8 0.8 0.8 0.8
Landlocked developing countries 4.1 3.1 2.7 2.4 2.3
Least developed countries 3.2 2.8 2.6 2.4 2.4
Small island developing States 1.2 1.1 1.0 1.0 0.9 Source: Global Health Estimates 2016: Deaths by Cause, Age, Sex, by Country and by Region, 2000-2016, World Health Organisation
(WHO).
(b) Mortality rate attributed to unintentional poisonings, by sex
(Per 100,000 population)
Regions 2000 2005 2010 2016
Female Male Female Male Female Male Female Male
World 1.7 2.8 1.5 2.3 1.4 1.9 1.2 1.6
Sub-Saharan Africa 2.6 4.9 2.4 4.3 2.3 4.0 2.1 3.5
Northern Africa and Western Asia 1.0 2.0 0.9 1.5 0.8 1.3 0.7 1.1
Northern Africa 1.2 2.2 1.0 1.8 0.9 1.5 0.8 1.3
Western Asia 0.8 1.7 0.8 1.3 0.7 1.1 0.6 0.9
Central and Southern Asia 3.4 5.2 2.7 4.0 2.2 2.9 1.8 2.2
Central Asia 2.5 8.4 1.3 3.6 0.9 2.3 0.8 1.9
Southern Asia 3.4 5.1 2.8 4.0 2.2 2.9 1.8 2.2
Eastern and South-Eastern Asia 1.1 1.4 1.1 1.1 1.1 1.0 1.1 1.0
Eastern Asia 1.3 1.5 1.3 1.2 1.4 1.1 1.4 1.1
South-Eastern Asia 0.5 1.0 0.5 0.9 0.4 0.9 0.4 0.7
Latin America and the Caribbean 0.5 0.9 0.4 0.7 0.4 0.6 0.3 0.6
Oceania 0.4 0.9 0.3 0.9 0.3 0.9 0.3 0.8
Australia and New Zealand 0.2 0.3 0.2 0.3 0.2 0.3 0.1 0.2
Oceania (exc. Australia and New Zealand) 0.9 2.8 0.9 2.8 0.7 2.6 0.6 2.3
Europe and Northern America 0.7 1.9 0.7 1.5 0.6 1.2 0.5 1.0
Europe 0.8 2.4 0.7 1.8 0.5 1.3 0.4 1.0
Northern America 0.5 0.8 0.7 0.9 0.8 0.9 0.8 0.9
Landlocked developing countries 2.7 5.5 2.3 4.1 2.0 3.4 1.8 2.9
Least developed countries 2.3 4.1 2.1 3.5 2.0 3.2 1.9 2.9
Small island developing States 0.9 1.5 0.8 1.3 0.8 1.3 0.7 1.1 Source: Global Health Estimates 2016: Deaths by Cause, Age, Sex, by Country and by Region, 2000 -2016, World Health Organisation
(WHO).

[E/2019/68]
Target 3.a
Strengthen the implementation of the World Health Organisation Framework Convention
on Tobacco Control in all countries, as appropriate
Indicator 3.a.1
Age-standardized prevalence of current tobacco use among persons aged 15 years and older
Age-standardized prevalence of current tobacco use among persons aged 15 years and older, by sex
(Percentage)
Regions
2000 2015 2016
Both
sexes Female Male
Both
sexes Female Male
Both
sexes Female Male
World 26.9 10.9 43.0 20.3 6.4 34.1 19.9 6.2 33.7
Sub-Saharan Africa 12.2 4.3 20.5 9.5 2.3 17.0 9.4 2.3 16.8
Northern Africa and Western Asia 22.4 8.2 36.5 21.3 4.6 37.2 21.3 4.5 37.4
Central and Southern Asia 22.5 7.4 37.0 14.1 2.3 25.6 13.7 2.1 25.0
Eastern and South-Eastern Asia 30.3 4.6 55.6 26.4 2.9 49.3 26.2 2.8 49.1
Latin America and the Caribbean 26.2 19.1 33.6 15.1 9.6 20.9 14.6 9.2 20.3
Australia and New Zealand 25.3 23.5 27.2 15.4 13.8 17.1 14.9 13.3 16.6
Oceania (exc. Australia and New
Zealand) 55.5 35.7 75.2 34.8 21.8 47.8 33.9 21.2 46.5
Europe and Northern America 35.9 27.7 44.5 28.0 22.1 34.0 27.5 21.8 33.3
Source: Department of the Prevention of Noncommunicable Diseases, World Health Organisation (WHO); Secretariat of the WHO
Framework Convention on Tobacco Control.
Target 3.b
Support the research and development of vaccines and medicines for the communicable
and non‑communicable diseases that primarily affect developing countries, provide
access to affordable essential medicines and vaccines, in accordance with the Doha
Declaration on the TRIPS Agreement and Public Health, which affirms the right of
developing countries to use to the full the provisions in the Agreement on Trade-Related
Aspects of Intellectual Property Rights regarding flexibilities to protect public health,
and, in particular, provide access to medicines for all
Indicator 3.b.1
Proportion of the target population covered by all vaccines included in their national programme
(a) Proportion of the target population with access to 3 doses of diphtheria-tetanus-pertussis (DTP3)
(Percentage)
Regions 2000 2005 2010 2015 2017
World 72 77 84 85 85
Sub-Saharan Africa 51 61 71 71 71
Northern Africa and Western Asia 85 87 91 87 88
Northern Africa 86 91 95 94 95
Western Asia 84 84 87 80 81
Central and Southern Asia 63 69 78 86 87
Central Asia 96 96 98 98 98
Southern Asia 62 69 77 86 87
Eastern and South-Eastern Asia 83 85 93 92 94

[E/2019/68]
37
Last editted on 23/06/2019 11:43 PM
Regions 2000 2005 2010 2015 2017
Eastern Asia 85 88 99 99 99
South-Eastern Asia 81 81 85 81 86
Latin America and the Caribbean 91 94 93 90 89
Oceania 79 84 84 86 84
Australia and New Zealand 90 91 92 93 95
Oceania (exc. Australia and New Zealand) 65 75 72 76 68
Europe and Northern America 94 96 94 93 93
Europe 94 96 94 91 93
Northern America 94 96 94 95 95
Landlocked developing countries 55 67 77 79 79
Least developed countries 57 70 76 80 80
Small island developing States 71 78 81 81 78
Source: WHO/UNICEF coverage estimates 2017 revision, July 2018, World Health Organisation (WHO) and United Nations
Children's Fund (UNICEF).
(b) Proportion of the target population with access to measles-containing-vaccine second-dose (MCV2)
(Percentage)
Regions 2000 2005 2010 2015 2017
World 15 30 39 59 67
Sub-Saharan Africa 3 2 3 16 23
Northern Africa and Western Asia 35 72 69 81 84
Northern Africa 52 68 56 89 90
Western Asia 18 75 81 74 79
Central and Southern Asia 6 6 11 66 75
Central Asia 92 88 78 98 99
Southern Asia 3 4 9 65 74
Eastern and South-Eastern Asia 5 56 85 84 90
Eastern Asia 2 77 99 99 99
South-Eastern Asia 10 22 63 58 75
Latin America and the Caribbean 60 56 61 72 67
Oceania 0 43 45 58 58
Australia and New Zealand 0 70 72 92 92
Oceania (exc. Australia and New Zealand) 1 8 9 10 10
Europe and Northern America 33 45 49 59 91
Europe 51 71 78 87 89
Northern America 0 0 0 8 93
Landlocked developing countries 12 12 13 26 36
Least developed countries 0 1 5 30 38
Small island developing States 6 23 26 28 35
Source: WHO/UNICEF coverage estimates 2017 revision, July 2018, World Health Organisation (WHO) and United Nations
Children's Fund (UNICEF).
(c) Proportion of the target population with access to pneumococcal conjugate 3rd dose (PCV3)
(Percentage)
Regions 2008 2010 2015 2017
World 4 11 38 44
Sub-Saharan Africa 0 3 63 66
Northern Africa and Western Asia 1 19 45 58

[E/2019/68]
Regions 2008 2010 2015 2017
Northern Africa 0 0 33 50
Western Asia 1 38 58 67
Central and Southern Asia 0 0 16 24
Central Asia 0 0 18 73
Southern Asia 0 0 16 22
Eastern and South-Eastern Asia 0 0 7 14
Eastern Asia 0 0 8 8
South-Eastern Asia 0 0 7 24
Latin America and the Caribbean 3 35 82 77
Oceania 43 53 65 75
Australia and New Zealand 75 91 93 94
Oceania (exc. Australia and New Zealand) 0 1 27 48
Europe and Northern America 40 56 62 74
Europe 12 37 45 64
Northern America 89 90 92 92
Landlocked developing countries 0 2 58 72
Least developed countries 0 1 62 75
Small island developing States 0 1 17 35
Source: WHO/UNICEF coverage estimates 2017 revision, July 2018, World Health Organisation (WHO) and United Nations
Children's Fund (UNICEF).
Indicator 3.b.2
Total net official development assistance to medical research and basic health sectors
(a) Total net official development assistance disbursements to medical research and basic health sectors
(Millions of constant 2017 United States dollars)
Regions 2010 2015 2017
Total net ODA 6,634.5 9,128.0 10,687.8
Sub-Saharan Africa 2,661.3 4,944.6 5,034.7
Northern Africa 162.0 127.0 114.2
Western Asia 267.0 270.1 735.3
Central Asia 89.7 74.5 113.5
Southern Asia 986.4 991.1 1,107.2
Eastern Asia 143.2 81.2 134.8
South-Eastern Asia 478.3 472.8 770.3
Latin America and the Caribbean 236.4 162.4 237.3
Oceania 48.5 119.0 71.0
Europe 46.8 70.7 106.6
Landlocked developing countries 1,336.5 2,068.7 2,513.0
Least developed countries 2,693.7 4,473.7 4,740.0
Small island developing States 130.4 231.2 225.4
Residual/Unallocated ODA 1,515.0 1,814.7 2,262.8 Note: Only the country-specific ODA are included in the regional aggregations. Unallocated ODA to multiple countries/regions are
presented in “Residual/Unallocated ODA” row.
Source: Creditor Reporting System (CRS) database, 2019, The Organisation for Economic Co-operation and Development (OECD).

[E/2019/68]
39
Last editted on 23/06/2019 11:43 PM
(b) Total gross official development assistance disbursement to medical research and basic heath sectors
(Millions of constant 2017 United States dollars)
Regions 2000 2005 2010 2015 2017
Total gross ODA 2,179.1 3,895.9 6,771.3 9,496.9 11,085.6
Sub-Saharan Africa 676.9 1,092.8 2,676.5 4,989.7 5,124.6
Northern Africa 63.2 114.2 163.7 133.7 123.0
Western Asia 95.5 643.8 271.1 274.1 747.8
Central Asia 20.8 42.5 91.6 76.3 116.2
Southern Asia 470.0 594.2 1,021.8 1,140.1 1,214.4
Eastern Asia 53.3 58.3 155.9 110.8 177.7
South-Eastern Asia 197.6 219.3 514.1 516.5 809.0
Latin America and the Caribbean 143.3 218.4 261.1 232.4 265.0
Oceania 133.0 62.1 50.7 123.4 71.5
Europe 43.5 41.3 47.6 74.5 112.6
Landlocked developing countries 416.8 688.6 1,348.7 2,088.5 2,550.4
Least developed countries 790.5 1,277.7 2,709.7 4,525.2 4,803.2
Small island developing States 163.5 106.9 134.8 238.2 230.9
Residual/Unallocated ODA 282.1 808.9 1,517.2 1,825.5 2,323.8 Note: Only the country-specific ODA are included in the regional aggregations. Unallocated ODA to multiple countries/regions are
presented in “Residual/Unallocated ODA” row.
Source: Creditor Reporting System (CRS) database, 2019, The Organisation for Economic Co-operation and Development (OECD).
Target 3.d
Strengthen the capacity of all countries, in particular developing countries, for early
warning, risk reduction and management of national and global health risks
Indicator 3.d.1
International Health Regulations (IHR) capacity and health emergency preparedness
Average of 13 International Health Regulations (IHR) core capacity scores
(Percentage)
Regions 20101 20151 20171 20182
World 58.0 76.4 71.3 60.4
Sub-Saharan Africa 39.5 59.7 54.9 40.8
Northern Africa and Western Asia 63.4 83.6 81.0 73.4
Northern Africa 63.4 68.5 75.7 68.2
Western Asia 63.4 87.9 83.1 75.3
Central and Southern Asia 52.4 72.0 64.0 54.8
Central Asia … 83.5 … 59.4
Southern Asia 52.4 68.7 64.0 52.2
Eastern and South-Eastern Asia 69.8 85.9 86.1 70.5
Eastern Asia 79.0 89.5 90.4 84.3
South-Eastern Asia 65.5 84.4 83.7 64.4
Latin America and the Caribbean 49.9 75.9 79.0 63.6
Oceania 54.0 76.0 69.0 57.4
Australia and New Zealand 89.5 99.0 99.0 90.0
Oceania (exc. Australia and New Zealand) 45.1 69.4 60.4 52.4
Europe and Northern America 68.7 83.6 78.5 74.2
Europe 67.9 82.4 77.2 73.1

[E/2019/68]
Regions 20101 20151 20171 20182
Northern America 79.0 98.5 100.0 95.0
Landlocked developing countries 50.5 67.1 58.0 48.3
Least developed countries 39.9 59.6 52.6 41.0
Small island developing States 46.7 67.3 66.3 52.8 1For the 2010-2017 period, the score used 1st version of the IHR monitoring questionnaire with percentage of attributes of the
following 13 core capacities : (1) National legislation, policy and financing; (2) Coordination and National Focal Point
communications; (3) Surveillance; (4) Response; (5) Preparedness; (6) Risk communica tion; (7) Human resources; (8) Laboratory; (9)
Points of entry; (10) Zoonotic events; (11) Food safety; (12) Chemical events; (13) Radionuclear emergencies. 2From year 2018 onward the scores used new version of the questionnaire – the IHR State Party Self-Assessment Annual Reporting
(SPAR) Tool – with percentage of attributes of the following 13 core capacities: (1) Legislation and financing; (2) IHR Coordination
and National Focal Point Functions; (3)Zoonotic events and the Human-Animal Health Interface; (4) Food safety; (5) Laboratory; (6)
Surveillance; (7) Human resources; (8) National Health Emergency Framework; (9) Health Service Provision; (10) Risk
communication; (11) Points of entry; (12) Chemical events; (13) Radiation emergencies.
Source: Global Health Observatory SDG Target 3.d, National and global health risks: Data tables Country data IHR Capacity Scores
2010-2018, World Health Organisation (WHO).

[E/2019/68]
41
Last editted on 23/06/2019 11:43 PM
Goal 4
Ensure inclusive and equitable quality education and promote lifelong
learning opportunities for all
Target 4.2
By 2030, ensure that all girls and boys have access to quality early childhood
development, care and pre-primary education so that they are ready for primary
education
Indicator 4.2.1
Proportion of children under 5 years of age who are developmentally on track in health, learning
and psychosocial well-being, by sex
Proportion of children aged 36-59 months who are developmentally on track in at least three of the
following domains: literacy-numeracy, physical development, social-emotional development and learning1
(Percentage)
Regions 2018
World2 (72 countries, 29 per cent population coverage) 71.2
Sub-Saharan Africa (24 countries, 57 per cent population coverage) 61.0
Small island developing States (14 countries, 67 per cent population coverage) 72.1 1The number of countries with comparable survey data included in the regional aggregations and regional population coverage of
children aged 36-59 months are presented in parentheses. 2The figure represents less than 50 per cent of the global population, and thus should be interpreted with caution.
Note: Based on the Demographic and Health Surveys (DHS), Multiple Indicator Cluster Surveys (MICS) and other national surveys
conducted in the 2010-2018 period.
Source: United Nations Children's Fund (UNICEF) global databases, 2019.
Indicator 4.2.2
Participation rate in organized learning (one year before the official primary entry age), by sex
(a) Adjusted net enrolment rate, one year before the official primary entry age, both sexes
(Percentage)
Regions 2000 2005 2010 2015 2017
World ... ... 62.7 67.8 68.9
Sub-Saharan Africa ... ... 34.9 41.6 ...
Northern Africa and Western Asia 35.0 37.6 45.8 51.1 52.2
Northern Africa 28.7 30.6 48.0 56.8 56.6
Western Asia 40.9 43.7 43.8 45.8 48.1
Central Asia ... ... 46.3 48.9 55.6
Eastern and South-Eastern Asia ... ... ... 88.0 87.1
South-Eastern Asia ... 74.4 82.4 91.7 90.8
Latin America and the Caribbean 84.3 88.1 92.2 92.6 94.6
Oceania 57.5 64.1 61.3 81.0 83.0
Australia and New Zealand 58.8 65.7 58.1 88.1 90.8
Oceania (exc. Australia and New Zealand) ... ... ... 70.3 71.5
Europe and Northern America ... 87.7 93.6 94.6 95.3
Europe 89.2 88.2 94.4 96.2 96.4
Northern America ... ... 92.2 91.6 93.4
Landlocked developing countries ... ... 34.0 42.7 45.7

[E/2019/68]
Regions 2000 2005 2010 2015 2017
Least developed countries ... ... 36.7 42.7 ...
Small island developing States 74.2 77.6 77.8 79.9 78.9 Source: UNESCO Institute for Statistics (UIS).
(b) Adjusted net enrolment rate, one year before the official primary entry age, by sex
(Percentage)
Regions 2000 2010 2017
Female Male Female Male Female Male
World ... ... 63.0 62.4 68.7 69.1
Sub-Saharan Africa ... ... 34.6 35.1 ... ...
Northern Africa and Western Asia 33.8 36.2 45.2 46.4 51.2 53.3
Northern Africa 25.9 31.4 46.7 49.3 55.3 57.8
Western Asia 41.1 40.8 43.9 43.7 47.2 48.9
Central Asia ... ... 46.7 45.9 56.3 54.9
Eastern and South-Eastern Asia ... ... ... ... 88.1 ...
South-Eastern Asia ... ... 82.5 82.2 92.3 89.3
Latin America and the Caribbean 84.8 83.9 93.0 91.5 95.4 93.8
Oceania 58.1 56.9 61.2 61.4 82.8 83.3
Australia and New Zealand 59.6 58.1 57.9 58.2 90.3 91.3
Europe and Northern America ... ... 94.0 93.2 95.6 95.1
Europe 89.3 89.0 94.4 94.4 96.3 96.5
Northern America ... ... 93.2 91.2 94.3 92.5
Landlocked developing countries ... ... 34.2 33.8 45.3 46.2
Least developed countries ... ... 36.7 36.7 ... ...
Small island developing States 74.3 74.2 77.4 78.2 78.8 78.9
Source: UNESCO Institute for Statistics (UIS).
Target 4.5
By 2030, eliminate gender disparities in education and ensure equal access to all levels of
education and vocational training for the vulnerable, including persons with disabilities,
indigenous peoples and children in vulnerable situations
Indicator 4.5.1
Parity indices (female/male, rural/urban, bottom/top wealth quintile and others such as disability
status, indigenous peoples and conflict-affected, as data become available) for all education
indicators on this list that can be disaggregated
Gender parity index of adjusted net enrolment rate, one year before the official primary entry age
(Ratio of girls to boys)
Regions 2000 2005 2010 2015 2017
World ... ... 1.01 1.00 0.99
Sub-Saharan Africa ... ... 0.99 0.99 ...
Northern Africa and Western Asia 0.93 0.96 0.98 0.96 0.96
Northern Africa 0.82 0.88 0.95 0.95 0.96
Western Asia 1.01 1.01 1.01 0.98 0.97
Central Asia ... ... 1.02 1.06 1.03
Eastern and South-Eastern Asia ... ... ... 1.01 ...

[E/2019/68]
43
Last editted on 23/06/2019 11:43 PM
Regions 2000 2005 2010 2015 2017
South-Eastern Asia ... 1.00 1.00 1.00 1.03
Latin America and the Caribbean 1.01 1.01 1.02 1.01 1.02
Oceania 1.02 1.01 1.00 1.00 0.99
Australia and New Zealand 1.03 1.01 0.99 1.00 0.99
Oceania (exc. Australia and New Zealand) ... ... ... 1.00 ...
Europe and Northern America ... 1.01 1.01 0.99 1.01
Europe 1.00 1.00 1.00 0.99 1.00
Northern America ... ... 1.02 0.98 1.02
Landlocked developing countries ... ... 1.01 1.00 0.98
Least developed countries ... ... 1.00 0.99 ...
Small island developing States 1.00 1.00 0.99 1.00 1.00
Source: UNESCO Institute for Statistics (UIS).
Target 4.a
Build and upgrade education facilities that are child, disability and gender sensitive and
provide safe, non-violent, inclusive and effective learning environments for all
Indicator 4.a.1
Proportion of schools with access to (a) electricity; (b) the Internet for pedagogical purposes; (c)
computers for pedagogical purposes; (d) adapted infrastructure and materials for students with
disabilities; (e) basic drinking water; (f) single-sex basic sanitation facilities; and (g) basic
handwashing facilities (as per the WASH indicator definitions)
(a) Proportion of schools with access to electricity, by education level
(Percentage)
Regions
2015 2017
Primary Lower
secondary
Upper
secondary Primary
Lower
secondary
Upper
secondary
World 68.4 78.9 88.8 69.1 79.5 89.5
Sub-Saharan Africa 34.3 49.1 56.0 35.1 ... ...
Northern Africa and Western Asia 94.4 97.4 93.3 95.0 97.3 97.2
Northern Africa 94.9 97.6 90.7 95.6 97.6 98.8
Western Asia ... 97.3 95.4 ... 96.9 95.8
Central and Southern Asia 51.4 66.6 87.6 51.7 67.3 88.6
Central Asia ... ... ... 100.0 99.1 ...
Southern Asia 50.4 65.1 87.1 50.7 65.8 88.2
Eastern and South-Eastern Asia ... ... ... 83.9 93.0 95.4
South-Eastern Asia ... ... ... 83.3 93.2 95.5
Latin America and the Caribbean 86.1 ... 92.4 86.5 ... 92.7
Oceania 88.4 98.4 97.9 88.3 97.6 98.6
Australia and New Zealand 97.4 99.7 99.5 97.4 99.5 99.7
Europe and Northern America 100.0 100.0 99.9 ... ... 99.9
Europe ... ... 99.8 ... 100.0 99.8
Northern America 100.0 100.0 100.0 ... ... ...
Landlocked developing countries ... ... ... 44.0 66.6 78.6

[E/2019/68]
Regions
2015 2017
Primary Lower
secondary
Upper
secondary Primary
Lower
secondary
Upper
secondary
Least developed countries 33.8 50.2 59.5 33.8 52.3 63.3
Source: UNESCO Institute for Statistics (UIS).
(b) Proportion of schools with access to the internet for pedagogical purposes, by education level
(Percentage)
Regions
2015 2017
Primary Lower
secondary
Upper
secondary Primary
Lower
secondary
Upper
secondary
World ... ... 64.5 ... ... 63.6
Sub-Saharan Africa ... ... 24.9 ... ... ...
Northern Africa and Western Asia ... 72.3 76.8 69.9 73.8 78.2
Northern Africa 62.0 65.0 70.0 63.7 66.5 70.9
Western Asia ... 78.6 82.5 ... 81.0 84.8
Central and Southern Asia ... ... 49.0 ... ... 48.2
Central Asia ... ... ... 75.7 76.3 ...
Southern Asia ... ... 47.6 ... ... 47.0
Eastern and South-Eastern Asia 53.5 71.0 ... 56.0 68.1 86.0
Eastern Asia 83.9 93.2 92.5 89.7 93.9 93.3
South-Eastern Asia 31.5 ... ... 33.3 50.7 81.6
Latin America and the Caribbean 35.5 58.8 68.7 35.5 58.0 66.3
Oceania 63.3 79.8 88.9 63.0 79.7 89.0
Australia and New Zealand 91.8 95.7 97.5 91.7 95.7 97.5
Europe and Northern America 94.9 97.7 98.2 ... ... ...
Europe ... 96.8 97.6 ... 97.2 97.9
Northern America 99.6 99.8 99.8 ... ... ...
Least developed countries 15.9 43.6 46.8 16.4 43.4 46.5
Source: UNESCO Institute for Statistics (UIS).
(c) Proportion of schools with access to computers for pedagogical purposes, by education level
(Percentage)
Regions
2015 2017
Primary Lower
secondary
Upper
secondary Primary
Lower
secondary
Upper
secondary
World 47.0 63.9 76.6 47.9 64.5 76.2
Sub-Saharan Africa ... ... 40.3 ... ... ...
Northern Africa and Western Asia ... 94.4 92.4 83.9 94.5 92.1
Northern Africa 79.6 93.7 93.2 83.2 93.9 93.3
Western Asia ... 95.0 91.7 ... 95.1 90.9
Central and Southern Asia 16.9 42.8 71.1 17.5 43.5 70.8
Central Asia ... ... ... 95.2 94.5 ...
Southern Asia 15.3 40.4 69.9 15.9 41.1 69.8
Eastern and South-Eastern Asia 64.9 79.7 82.2 65.6 78.7 81.7
Eastern Asia 87.8 96.7 92.6 91.7 97.1 92.6
South-Eastern Asia ... ... 75.9 47.9 66.3 75.2

[E/2019/68]
45
Last editted on 23/06/2019 11:43 PM
Regions
2015 2017
Primary Lower
secondary
Upper
secondary Primary
Lower
secondary
Upper
secondary
Latin America and the Caribbean 56.7 74.7 76.3 56.5 74.1 76.1
Oceania 66.1 83.0 94.5 65.8 82.8 94.5
Australia and New Zealand 92.5 96.5 98.8 92.4 96.5 98.8
Europe and Northern America 98.1 99.4 99.3 ... ... ...
Europe ... ... 99.1 ... ... 99.1
Northern America 99.8 99.9 99.9 ... ... ...
Least developed countries 22.9 44.2 48.1 23.3 ... 47.9
Source: UNESCO Institute for Statistics (UIS).
Note: Data for the “proportion of schools with access to adapted infrastructure and materials for students with disabilities ” are not
available.
(e) Proportion of schools with access to basic drinking water, by education level
(Percentage)
Regions
2015 2017
Primary Lower
secondary
Upper
secondary Primary
Lower
secondary
Upper
secondary
World 78.8 84.3 83.4 78.6 83.5 83.7
Sub-Saharan Africa ... ... 50.0 ... ... ...
Northern Africa and Western Asia ... ... 94.3 ... ... 94.5
Northern Africa ... ... 94.5 ... ... 95.1
Western Asia ... ... 94.2 ... 96.5 94.0
Central and Southern Asia 84.6 87.5 87.2 84.6 87.2 88.2
Southern Asia 84.3 86.9 86.5 84.3 86.6 87.7
Eastern and South-Eastern Asia ... 77.1 80.7 78.8 75.9 80.5
South-Eastern Asia 71.4 67.5 73.7 71.2 66.5 73.4
Oceania 72.0 87.8 88.9 71.7 87.0 88.8
Australia and New Zealand 93.7 97.4 97.5 93.6 97.2 97.4
Europe and Northern America 100.0 100.0 99.1 ... ... ...
Europe ... ... 98.8 ... 100.0 98.9
Northern America 100.0 100.0 100.0 ... ... ...
Least developed countries 58.0 58.4 53.1 58.9 58.5 54.4
Source: UNESCO Institute for Statistics (UIS).
(f) Proportion of schools with access to single-sex basic sanitation facilities, by education level
(Percentage)
Regions
2015 2017
Primary Lower
secondary
Upper
secondary Primary
Lower
secondary
Upper
secondary
World 81.9 87.1 87.2 81.5 86.5 87.1
Northern Africa and Western Asia ... 93.9 96.7 ... 94.9 97.2
Northern Africa 93.8 95.4 97.7 93.7 96.1 98.0
Western Asia ... ... 95.9 ... ... 96.4
Central and Southern Asia 83.3 91.8 90.4 82.2 91.3 90.4
Southern Asia 83.0 91.5 90.0 81.8 90.9 90.0

[E/2019/68]
Regions
2015 2017
Primary Lower
secondary
Upper
secondary Primary
Lower
secondary
Upper
secondary
Eastern and South-Eastern Asia ... ... ... 73.0 73.6 71.8
South-Eastern Asia ... ... ... 61.7 62.4 60.9
Oceania 83.9 91.8 95.7 84.1 92.0 96.5
Australia and New Zealand 96.6 98.3 99.1 96.6 98.3 99.3
Europe and Northern America 100.0 100.0 99.7 ... ... ...
Europe ... ... 99.5 ... 100.0 99.5
Northern America 100.0 100.0 100.0 ... ... ...
Least developed countries ... ... 73.7 57.4 71.6 73.0
Source: UNESCO Institute for Statistics (UIS).
(g) Proportion of schools with basic handwashing facilities, by education level
(Percentage)
Regions
2015 2017
Primary Lower
secondary
Upper
secondary Primary
Lower
secondary
Upper
secondary
World 65.2 69.1 72.9 65.6 68.9 72.5
Sub-Saharan Africa ... ... 40.1 ... ... ...
Northern Africa and Western Asia ... 99.7 99.6 ... 99.9 99.7
Northern Africa 98.0 99.9 100.0 98.3 100.0 100.0
Western Asia ... ... 99.4 ... ... 99.5
Central and Southern Asia 48.2 53.5 61.4 48.0 53.1 61.4
Southern Asia 47.1 51.4 59.6 47.0 51.0 59.8
Eastern and South-Eastern Asia ... ... ... 75.1 71.1 76.1
South-Eastern Asia ... ... ... 66.9 60.6 68.3
Oceania 72.9 86.0 88.0 72.6 85.7 88.1
Australia and New Zealand 94.0 97.0 97.3 93.9 97.0 97.3
Europe and Northern America 98.5 99.6 99.5 ... ... 99.5
Europe ... 99.4 99.4 ... 99.6 99.4
Northern America 100.0 100.0 100.0 ... ... ...
Landlocked developing countries ... ... ... 55.0 ... ...
Least developed countries 41.7 41.0 37.5 42.7 40.5 37.3
Source: UNESCO Institute for Statistics (UIS).

[E/2019/68]
47
Last editted on 23/06/2019 11:43 PM
Target 4.b
By 2020, substantially expand globally the number of scholarships available to developing
countries, in particular least developed countries, small island developing States and
African countries, for enrolment in higher education, including vocational training and
information and communications technology, technical, engineering and scientific
programmes, in developed countries and other developing countries
Indicator 4.b.1
Volume of official development assistance flows for scholarships by sector and type of study
Volume of official development assistance (gross disbursements) for scholarships
(Millions of constant 2017 United States dollars)
Regions 2006 2010 2015 2017
Total ODA 429.3 1,262.7 1,214.8 1,331.1
Sub-Saharan Africa 35.1 110.1 134.6 184.5
Northern Africa 8.7 27.3 68.0 84.5
Western Asia 25.5 47.4 71.8 96.4
Central Asia 3.5 12.2 13.3 15.9
Southern Asia 18.4 86.7 85.1 71.9
Eastern Asia 15.2 275.8 29.8 26.1
South-Eastern Asia 119.2 205.3 186.3 105.3
Latin America and the Caribbean 19.9 74.3 65.7 63.6
Oceania 39.2 48.9 62.0 50.3
Europe 5.9 16.8 54.9 66.8
Landlocked developing countries 31.3 124.8 125.2 141.5
Least developed countries 66.4 193.8 205.0 219.8
Small island developing States 49.2 84.8 94.7 83.9
Residual/Unallocated ODA 138.6 358.1 443.1 565.9
Note: Only the country-specific ODA are included in the regional aggregations. Unallocated ODA to multiple countries/regions are
presented in “Residual/Unallocated ODA” row.
Source: Creditor Reporting System (CRS) database, 2019, The Organisation for Economic Co-operation and Development (OECD).
Target 4.c
By 2030, substantially increase the supply of qualified teachers, including through
international cooperation for teacher training in developing countries, especially Least
developed countries and small island developing States
Indicator 4.c.1
Proportion of teachers in: (a) pre-primary; (b) primary; (c) lower secondary; and (d) upper
secondary education who have received at least the minimum organized teacher training (e.g.,
pedagogical training) pre-service or in-service required for teaching at the relevant level in a given
country
(a) Proportion of trained teachers in pre-primary education, both sexes
(Percentage)
Regions 2000 2005 2010 2015 2017
Sub-Saharan Africa 54.3 47.6 48.7 47.7 ...
Northern Africa and Western Asia ... 92.3 ... 84.5 84.1

[E/2019/68]
Regions 2000 2005 2010 2015 2017
Northern Africa ... 97.0 ... 83.2 82.1
Western Asia 89.0 ... ... 85.5 85.6
Central Asia ... 94.5 96.4 91.0 89.4
South-Eastern Asia ... ... 90.6 95.6 94.2
Landlocked developing countries ... 80.0 78.0 63.8 75.8
Least developed countries ... ... 58.8 53.8 61.8
Small island developing States 81.1 85.2 87.6 ... ...
Source: UNESCO Institute for Statistics (UIS).
(b) Proportion of trained teachers in primary education, both sexes
(Percentage)
Regions 2000 2005 2010 2015 2017
World ... ... ... 85.6 85.1
Sub-Saharan Africa 84.5 71.4 70.1 61.8 63.7
Northern Africa and Western Asia ... ... ... 85.8 84.4
Northern Africa ... 98.2 ... 85.7 84.4
Western Asia 94.6 ... ... 85.8 ...
Central and Southern Asia ... ... ... 73.5 71.9
Central Asia ... 93.5 96.5 99.1 98.6
Southern Asia ... ... ... 72.4 70.8
South-Eastern Asia ... ... ... 97.6 96.9
Latin America and the Caribbean ... ... 88.1 88.5 88.5
Landlocked developing countries 72.9 76.1 74.2 70.8 76.5
Least developed countries 73.5 73.1 72.5 69.2 71.8
Small island developing States 81.3 81.1 77.7 74.1 73.9
Source: UNESCO Institute for Statistics (UIS).
(c) Proportion of trained teachers in lower secondary education, both sexes
(Percentage)
Regions 2000 2005 2010 2015 2017
Sub-Saharan Africa ... ... 64.1 ... ...
Northern Africa and Western Asia ... ... ... 81.8 81.2
Northern Africa ... ... ... 79.2 77.8
Western Asia ... ... ... 83.4 ...
Central and Southern Asia ... ... ... 84.7 77.2
Central Asia ... ... ... ... 95.5
Southern Asia ... ... ... 82.8 74.0
South-Eastern Asia ... ... ... 97.7 95.5
Latin America and the Caribbean ... ... 82.5 ... ...
Landlocked developing countries ... ... ... ... 80.7
Least developed countries 70.4 65.7 66.2 62.4 59.5
Small island developing States 80.9 84.3 82.5 81.2 76.0
Source: UNESCO Institute for Statistics (UIS).

[E/2019/68]
49
Last editted on 23/06/2019 11:43 PM
(d) Proportion of trained teachers in upper secondary education, both sexes
(Percentage)
Regions 2000 2005 2010 2015 2017
Sub-Saharan Africa ... ... 54.7 ... ...
Northern Africa and Western Asia ... ... ... 79.0 ...
Northern Africa ... ... ... 76.5 77.4
Central Asia ... ... ... ... 97.6
South-Eastern Asia ... ... ... 92.3 91.6
Latin America and the Caribbean ... ... 79.8 ... ...
Landlocked developing countries ... ... ... ... 84.5
Least developed countries 54.7 52.3 50.9 52.9 57.2
Small island developing States 83.0 74.9 75.9 76.4 81.5
Source: UNESCO Institute for Statistics (UIS).
(e) Proportion of trained teachers in secondary education, both sexes
(Percentage)
Regions 2000 2005 2010 2015 2017
Sub-Saharan Africa ... 79.1 60.4 49.3 50.4
Northern Africa and Western Asia ... ... ... 80.5 ...
Northern Africa ... ... ... 77.9 77.6
Central Asia ... 89.8 95.1 94.7 96.1
South-Eastern Asia ... ... ... 95.9 94.2
Latin America and the Caribbean ... ... 81.3 80.1 79.7
Oceania (exc. Australia and New Zealand) 88.6 91.5 89.2 ... ...
Landlocked developing countries ... 86.1 84.0 81.1 82.0
Least developed countries 64.5 60.5 60.2 58.6 58.6
Small island developing States 81.8 79.8 79.0 78.7 78.7
Source: UNESCO Institute for Statistics (UIS).

[E/2019/68]
Goal 5 Achieve gender equality and empower all women and girls
Target 5.1
End all forms of discrimination against all women and girls everywhere
Indicator 5.1.1
Whether or not legal frameworks are in place to promote, enforce and monitor equality and
non‑discrimination on the basis of sex
Legal frameworks that promote, enforce and monitor gender equality
(Percentage)
Regions
Area 1:
Overarching legal
frameworks and public life
Area 2:
Violence against
women
Area 3:
Employment and
economic benefits
Area 4:
Marriage and
family
World 67.8 73.9 71.3 76.4
Note: (1) Data are derived from an assessment of country's legal frameworks completed by National Statistical Offices and/or
National Women’s Machinery, and legal practitioners/researchers on gender equality, using a questionnaire. (2) The score for each
area of law (a number between 0 and 100) represents the percentage of achievement on average for the countries in the sample
(unweighted average), per area of law. (3) 53 countries are included in the sample in 2018.
Source: United Nations Entity for Gender Equality and the Empowerment of Women (UN Women), World Bank Group, OECD
Development Centre.
Target 5.2
Eliminate all forms of violence against all women and girls in the public and private
spheres, including trafficking and sexual and other types of exploitation
Indicator 5.2.1
Proportion of ever-partnered women and girls aged 15 years and older subjected to physical, sexual
or psychological violence by a current or former intimate partner in the previous 12 months, by
form of violence and by age
Proportion of ever-partnered women and girls aged 15-49 subjected to physical and/or sexual violence by
a current or former intimate partner in the previous 12 months
(Percentage)
Regions 2017
World (106 countries, 50 per cent population coverage) 17.8
Sub-Saharan Africa (31 countries, 82 per cent population coverage) 21.5
Northern Africa and Western Asia2 (6 countries, 41 per cent population coverage) 12.3
Central and Southern Asia (7 countries, 81 per cent population coverage) 23.0
Eastern and South-Eastern Asia2 (7 countries, 13 per cent population coverage) 9.0
Latin America and the Caribbean (16 countries, 50 percent population coverage) 11.8
Oceania (exc. Australia and New Zealand) 2 (10 countries, 20 per cent population coverage) 34.7
Europe (29 countries, 74 per cent population coverage) 6.1
Landlocked developing countries (22 countries, 80 per cent population coverage) 21.8
Least developed countries (34 countries, 83 per cent population coverage) 24.3
Small island developing States (19 countries, 51 per cent population coverage) 15.5 1The number of countries with comparable survey data included in the regional aggregations and regional population coverage of

[E/2019/68]
51
Last editted on 23/06/2019 11:43 PM
women aged 15-49 are presented in parentheses. 2The figure represents less than 50 per cent of the population in the region, and thus should be interpreted with caution.
Note: Based on the Demographic and Health Surveys (DHS), Multiple Indicator Cluster Surveys (MICS) and other national surveys
conducted in the 2005-2017 period.
Source: World Health Organization (WHO), United Nations Children's Fund (UNICEF), United Nations Population Fund (UNFPA),
United Nations Office on Drugs and Crime (UNODC) and United Nations Entity for Gender Equality and the Empowerment of Women
(UN Women).
Target 5.3
Eliminate all harmful practices, such as child, early and forced marriage and female
genital mutilation
Indicator 5.3.1
Proportion of women aged 20-24 years who were married or in a union before age 15 and before age
18
(a) Proportion of women aged 20-24 years who were married or in a union before age 151
(Percentage)
Regions 2003 2008 2013 2018
World (105 countries, 77 per cent population coverage) 8.1 7.5 6.4 5.0
Sub-Saharan Africa (37 countries, 88 per cent population coverage) 14.9 15.1 14.2 11.8
Northern Africa and Western Asia (14 countries, 84 per cent population
coverage) 5.7 4.9 4.3 3.5
Northern Africa (5 countries, 95 per cent population coverage) 5.3 4.2 4.1 3.5
Western Asia (9 countries, 71 per cent population coverage) 6.2 5.7 4.5 3.4
Central and Southern Asia (10 countries, 94 per cent population coverage) 18.9 16.9 12.8 7.6
Central Asia (4 countries, 52 per cent population coverage) 0.3 0.1 0.2 0.3
Southern Asia (6 countries, 96 per cent population coverage) 19.3 17.2 13.2 7.7
South-Eastern Asia (8 countries, 94 per cent population coverage) 2.8 2.5 2.1 1.8
Latin America and the Caribbean (22 countries, 54 per cent population
coverage) 5.4 5.2 5.1 4.4
Landlocked developing countries (26 countries, 86 per cent population
coverage) 13.8 13.8 12.2 9.7
Least developed countries (38 countries, 94 per cent population coverage) 19.6 18.2 16.1 12.2
Small island developing States (17 countries, 70 per cent population
coverage) 6.7 6.9 6.5 5.7 1The number of countries with comparable survey data included in the regional aggregations and regional population coverage of
women aged 20-24 are presented in parentheses.
Note: Based on the Demographic and Health Surveys (DHS), Multiple Indicator Cluster Surveys (MICS) and other national surveys
conducted in the 2010-2018 period.
Source: United Nations Children's Fund (UNICEF) global databases, 2019.
(b) Proportion of women aged 20-24 years who were married or in a union before age 181
(Percentage)
Regions 2003 2008 2013 2018
World (105 countries, 77 per cent population coverage) 27.2 25.4 22.2 20.8
Sub-Saharan Africa (37 countries, 88 per cent population coverage) 41.8 42.2 39.6 37.2
Northern Africa and Western Asia (14 countries, 84 per cent population
coverage)
23.5 20.8 18.6 17.8
Northern Africa (5 countries, 95 per cent population coverage) 20.8 18.6 17.5 16.6

[E/2019/68]
Regions 2003 2008 2013 2018
Western Asia (9 countries, 71 per cent population coverage) 27.0 23.5 20.0 19.1
Central and Southern Asia (10 countries, 94 per cent population coverage) 52.5 47.3 38.4 29.4
Central Asia (4 countries, 52 per cent population coverage) 14.4 8.5 7.0 8.0
Southern Asia (6 countries, 96 per cent population coverage) 53.3 48.2 39.2 29.9
South-Eastern Asia (8 countries, 94 per cent population coverage) 19.7 17.7 15.7 15.2
Latin America and the Caribbean (22 countries, 54 per cent population
coverage)
24.1 25.6 24.9 24.7
Landlocked developing countries (26 countries, 86 per cent population
coverage)
43.4 42.5 37.8 35.0
Least developed countries (38 countries, 94 per cent population coverage) 50.2 49.1 45.0 39.6
Small island developing States (17 countries, 70 per cent population
coverage)
26.8 28.0 24.9 23.2
1The number of countries with comparable survey data included in the regional aggregations and regional population coverage of
women aged 20-24 are presented in parentheses.
Note: Based on the Demographic and Health Surveys (DHS), Multiple Indicator Cluster Surveys (MICS) and other national surveys
conducted in the 2010-2019 period.
Source: United Nations Children's Fund (UNICEF) global databases, 2019.
Indicator 5.3.2
Proportion of girls and women aged 15-49 years who have undergone female genital
mutilation/cutting, by age
Proportion of girls aged 15-19 who have undergone female genital mutilation/cutting1
(Percentage)
Regions 2003 2008 2013 2018
Sub-Saharan Africa (25 countries, 68 per cent population coverage) 34.8 31.8 29.3 24.5
Northern Africa (2 countries, 65 per cent population coverage) 91.5 88.8 83.0 73.9 1The number of countries with comparable survey data included in the regional aggregations and regional population coverage of
girls aged 15-19 are presented in parentheses.
Note: Based on the Demographic and Health Surveys (DHS), Multiple Indicator Cluster Surveys (MICS) and other national surveys
conducted in the 2003-2018 period.
Source: United Nations Children's Fund (UNICEF) global databases, 2019.
Target 5.5
Ensure women’s full and effective participation and equal opportunities for leadership at all
levels of decision-making in political, economic and public life
Indicator 5.5.1
Proportion of seats held by (a) women in national parliaments and (b) local governments
Proportion of seats held by women in national parliaments (single and lower chambers)
(Percentage)
Regions 2000 2005 2010 2015 2019
World 13.3 15.9 19.0 22.3 24.3
Sub-Saharan Africa 11.5 14.4 18.4 22.6 23.9
Northern Africa and Western Asia 5.3 7.5 10.9 17.2 18.7
Northern Africa 5.4 10.8 13.2 24.6 22.7
Western Asia 5.2 5.7 9.3 12.8 15.3
Central and Southern Asia 6.9 9.3 18.5 18.4 16.9
Central Asia 7.0 11.6 20.0 21.8 21.1

[E/2019/68]
53
Last editted on 23/06/2019 11:43 PM
Regions 2000 2005 2010 2015 2019
Southern Asia 6.8 8.8 18.2 17.6 15.8
Eastern and South-Eastern Asia 16.4 17.2 18.9 19.4 20.8
Eastern Asia 18.2 18.1 18.7 20.4 21.4
South-Eastern Asia 12.3 15.5 19.3 17.8 19.6
Latin America and the Caribbean 15.2 19.0 22.7 27.4 31.6
Oceania 11.3 11.2 13.2 13.2 16.3
Australia and New Zealand 25.5 26.3 30.1 28.8 34.4
Oceania (exc. Australia and New Zealand) 3.6 3.0 2.5 4.4 6.1
Europe and Northern America 16.8 20.3 22.9 26.4 29.4
Europe 16.8 20.5 23.2 26.7 29.8
Northern America 16.3 17.5 19.0 21.8 25.0
Landlocked developing countries 7.8 13.4 21.6 24.9 26.5
Least developed countries 9.3 13.1 19.3 21.7 22.9
Small island developing States 14.0 17.9 20.5 23.3 25.0
Note: The data concern single and lower chambers and are as at 1 February for 2013 – 2019, as at 31 January for 2005 and 2010,
and as at 25 January for 2000.
Source: Women in National Parliament database, 31 January 2019, Inter-Parliamentary Union (IPU).
Indicator 5.5.2
Proportion of women in managerial positions
Proportion of managerial positions held by women
(Percentage)
Regions 2000 2005 2010 2015 2018
World 25.1 26.4 26.6 26.3 27.2
Sub-Saharan Africa 27.7 26.5 28.1 29.0 29.3
Northern Africa and Western Asia 10.4 10.3 13.2 10.9 11.8
Northern Africa 9.2 9.7 12.9 7.4 7.7
Western Asia 11.8 10.9 13.4 14.8 16.0
Central and Southern Asia 12.6 13.1 12.1 13.4 14.4
Central Asia 27.2 29.6 30.4 30.2 30.3
Southern Asia 12.1 12.5 11.5 13.0 14.0
Eastern and South-Eastern Asia 22.7 24.7 26.6 28.4 30.7
Eastern Asia 17.1 19.4 22.0 24.7 26.2
South-Eastern Asia 34.7 36.8 38.8 37.0 41.1
Latin America and the Caribbean 32.0 35.3 36.6 38.4 38.5
Oceania 32.2 33.9 34.6 37.2 36.8
Australia and New Zealand 32.7 34.4 35.1 37.9 37.4
Oceania (exc. Australia and New Zealand) 23.1 24.5 25.7 26.8 27.4
Europe and Northern America 33.0 35.4 36.7 36.7 37.5
Europe 31.4 34.3 35.6 35.5 35.9
Northern America 35.0 37.0 38.3 38.3 39.4
Landlocked developing countries 26.1 27.6 28.5 29.2 28.9
Least developed countries 24.2 20.0 21.7 21.6 22.1
Small island developing States 30.3 33.2 35.6 35.7 36.5
Source: ILO modelled estimates, November 2018, ILO Database of Labour Statistics (ILOSTAT), International Labour Organization
(ILO).

[E/2019/68]
Target 5.6
Ensure universal access to sexual and reproductive health and reproductive rights as
agreed in accordance with the Programme of Action of the International Conference on
Population and Development and the Beijing Platform for Action and the outcome
documents of their review conferences
Indicator 5.6.1
Proportion of women aged 15-49 years who make their own informed decisions regarding sexual
relations, contraceptive use and reproductive health care
Proportion of women aged 15-49 years who make their own decisions regarding sexual relations,
contraceptive use and health care1
(Percentage)
Regions 2014
World2 (51 countries, 10 per cent population coverage) 56.7
Sub-Saharan Africa (35 countries, 90 per cent population coverage) 47.2
Northern Africa and Western Asia2 (2 countries, 3 per cent population coverage) 71.1
Western Asia2 (2 countries, 5 per cent population coverage) 71.1
Central and Southern Asia2 (3 countries, 2 per cent population coverage) 48.7
Central Asia2 (2 countries, 14 per cent population coverage) 51.9
Southern Asia2 (1 country, 2 per cent population coverage) 47.7
Eastern and South-Eastern Asia2 (4 countries, 5 per cent population coverage) 76.1
South-Eastern Asia2 (4 countries, 22 per cent population coverage) 76.1
Latin America and the Caribbean2 (5 countries, 6 per cent population coverage) 68.3
Europe and Northern America2 (2 countries, 5 per cent population coverage) 80.2
Europe2 (2 countries, 7 per cent population coverage) 80.2
Landlocked developing countries (17 countries, 65 per cent population coverage) 47.0
Least developed countries (30 countries, 57 per cent population coverage) 49.4
Small island developing States2 (6 countries, 36 per cent population coverage) 68.6 1The number of countries used to calculate the regional values and the population coverages are presented in parentheses. 2The figure represents less than 50 per cent of the population in the region, and thus should be interpreted with caution.
Source: UNFPA Global Database, 2019, United Nations Population Fund (UNFPA).
Target 5.c
Adopt and strengthen sound policies and enforceable legislation for the promotion of
gender equality and the empowerment of all women and girls at all levels
Indicator 5.c.1
Proportion of countries with systems to track and make public allocations for gender equality and
women’s empowerment
Proportion of countries with systems to track and make public allocations for gender equality and
women's empowerment1
(Percentage)
Regions 2018
World (69 countries and areas) 19
Sub-Saharan Africa (27 countries) 11
Northern Africa and Western Asia (7 countries) 29
Central and Southern Asia (4 countries) 75

[E/2019/68]
55
Last editted on 23/06/2019 11:43 PM
Regions 2018
Eastern and South-Eastern Asia (6 countries) 33
Latin America and the Caribbean (9 countries) 11
Oceania (exc. Australia and New Zealand) (10 countries and areas) 20
Europe and Northern America (6 countries and areas) 0 1The number of countries used to calculate the global and regional values are presented in parentheses. Population coverage is not
applicable.
Note: (1) Data are derived from an assessment of country systems to track allocations for gender equality and women ’s empowerment,
based on reporting on three criteria collected through a questionnaire; (2) The proportion represents the p ercent of reporting
countries that fully meet the three criteria for the indicator; (3) Data is collected through the Global Partnership for Effe ctive
Development Cooperation.
Source: United Nations Entity for Gender Equality and the Empowerment of Women (UN Women); United Nations Development
Programme (UNDP) and the Organisation for Economic Co-operation and Development (OECD).

[E/2019/68]
Goal 6 Ensure availability and sustainable management of water and sanitation for all
Target 6.1
By 2030, achieve universal and equitable access to safe and affordable drinking water for all
Indicator 6.1.1
Proportion of population using safely managed drinking water services
(a) Proportion of population using safely managed drinking water services
(Percentage)
Regions 2000 2005 2010 2015 2017
World 61.3 64.2 66.5 69.5 70.6
Sub-Saharan Africa 17.7 19.6 22.4 25.4 26.9
Northern Africa and Western Asia ... ... ... ... ...
Northern Africa ... ... ... ... ...
Western Asia 66.5 67.9 71.8 75.0 75.8
Central and Southern Asia 41.4 46.9 52.5 58.2 60.4
Central Asia 54.6 58.2 63.7 69.1 71.0
Southern Asia 40.3 45.9 51.5 57.2 59.4
Eastern and South-Eastern Asia ... ... ... ... ...
Eastern Asia ... ... ... ... ...
South-Eastern Asia ... ... ... ... ...
Latin America and the Caribbean 56.2 57.5 73.0 74.0 74.3
Oceania ... ... ... ... ...
Australia and New Zealand ... ... ... ... ...
Oceania (exc. Australia and New Zealand) ... ... ... ... ...
Europe and Northern America 90.3 93.5 94.5 95.2 95.3
Europe 89.6 91.0 92.4 93.3 93.4
Northern America ... 98.9 99.0 99.0 99.0
Landlocked developing countries 25.7 28.0 30.9 33.7 34.9
Least developed countries 25.1 27.0 30.2 33.5 34.7
Small island developing States ... ... ... ... ...
Source: The WHO/UNICEF Joint Monitoring Programme (JMP) for Water Supply, Sanitation and Hygiene, 2019.
(b) Proportion of population using safely managed drinking water services, by residence
(Percentage)
Regions 2000 2010 2017
Rural Urban Rural Urban Rural Urban
World 39.4 86.2 45.8 85.9 53.0 85.1
Sub-Saharan Africa 6.5 42.3 8.9 46.0 11.6 50.0
Northern Africa and Western Asia ... ... ... ... ... ...
Northern Africa ... ... ... ... ... ...
Western Asia ... ... ... ... ... ...
Central and Southern Asia 31.0 66.0 47.0 63.8 59.7 61.8
Central Asia 30.1 83.6 41.6 87.6 52.9 90.4
Southern Asia 31.0 63.0 47.1 60.7 59.9 58.5
Eastern and South-Eastern Asia ... 90.6 ... 91.5 ... 90.8

[E/2019/68]
57
Last editted on 23/06/2019 11:43 PM
Regions 2000 2010 2017
Rural Urban Rural Urban Rural Urban
Eastern Asia ... 93.9 ... 93.8 ... 93.3
South-Eastern Asia ... ... ... ... ... ...
Latin America and the Caribbean ... 82.4 39.0 82.3 41.7 82.3
Oceania ... 91.6 ... 95.3 ... 96.1
Australia and New Zealand ... 91.9 ... 95.7 ... 96.5
Oceania (exc. Australia and New Zealand) ... ... ... ... ... ...
Europe and Northern America ... 96.5 ... 96.7 ... 96.8
Europe ... ... ... ... ... ...
Northern America ... 99.6 ... 99.6 ... 99.6
Landlocked developing countries 11.8 63.6 16.2 67.3 19.8 69.3
Least developed countries 18.4 45.0 22.3 49.0 26.2 52.2
Small island developing States ... ... ... ... ... ...
Source: The WHO/UNICEF Joint Monitoring Programme (JMP) for Water Supply, Sanitation and Hygiene , 2019.
Target 6.2
By 2030, achieve access to adequate and equitable sanitation and hygiene for all and end
open defecation, paying special attention to the needs of women and girls and those in
vulnerable situations
Indicator 6.2.1
Proportion of population using (a) safely managed sanitation services and (b) a hand-
washing facility with soap and water
(a.1) Proportion of population using safely managed sanitation services
(Percentage)
Regions 2000 2005 2010 2015 2017
World 28.2 31.5 37.1 42.7 45.0
Sub-Saharan Africa 14.8 16.1 17.2 18.0 18.4
Northern Africa and Western Asia 26.2 29.2 33.2 36.5 37.5
Northern Africa ... 20.1 23.8 27.5 28.8
Western Asia 36.2 38.4 42.4 45.2 45.9
Central and Southern Asia ... ... ... ... ...
Central Asia ... ... ... ... ...
Southern Asia ... ... ... ... ...
Eastern and South-Eastern Asia 31.6 37.3 47.1 58.5 63.6
Eastern Asia 31.3 37.8 49.6 63.6 69.8
South-Eastern Asia ... ... ... ... ...
Latin America and the Caribbean 11.5 14.6 20.7 28.2 31.3
Oceania 45.9 46.4 49.2 52.0 52.9
Australia and New Zealand 60.6 61.9 66.1 70.2 71.9
Oceania (exc. Australia and New Zealand) ... ... ... ... ...
Europe and Northern America 69.4 70.2 73.6 75.6 76.2
Europe 63.4 65.5 75.6 78.1 78.9
Northern America 77.2 78.1 79.0 79.6 79.8
Landlocked developing countries ... ... ... ... ...
Least developed countries ... ... ... ... ...

[E/2019/68]
Regions 2000 2005 2010 2015 2017
Small island developing States ... ... ... ... ...
Source: The WHO/UNICEF Joint Monitoring Programme (JMP) for Water Supply, Sanitation and Hygiene , 2019.
(a.2) Proportion of population using safely managed sanitation services, by residence
(Percentage)
Regions 2000 2010 2017
Rural Urban Rural Urban Rural Urban
World 21.8 35.6 32.5 41.3 42.5 47.0
Sub-Saharan Africa 13.8 17.2 16.1 19.1 17.5 19.8
Northern Africa and Western Asia ... 39.9 ... 46.0 ... 49.4
Northern Africa ... 30.1 ... 35.7 ... 39.3
Western Asia ... 54.9 ... 60.9 ... 64.0
Central and Southern Asia 6.9 ... 25.6 ... 39.7 ...
Central Asia ... ... ... 49.0 ... 49.0
Southern Asia 5.5 ... 24.3 ... 38.7 ...
Eastern and South-Eastern Asia 27.2 27.5 37.6 56.0 52.1 71.9
Eastern Asia 26.7 34.5 38.0 59.3 56.2 78.2
South-Eastern Asia ... ... ... ... ... ...
Latin America and the Caribbean ... 14.6 ... 25.0 ... 37.0
Oceania 22.6 56.7 22.8 61.6 23.5 66.7
Australia and New Zealand ... ... ... ... ... ...
Oceania (exc. Australia and New Zealand) ... ... ... ... ... ...
Europe and Northern America ... 78.9 45.8 82.6 48.1 84.7
Europe 40.8 72.6 50.1 77.9 53.3 81.1
Northern America ... 89.1 ... 90.1 ... 90.2
Landlocked developing countries ... ... ... ... ... ...
Least developed countries 11.5 ... 17.0 ... 20.9 ...
Small island developing States ... 23.2 ... 24.4 ... ...
Source: The WHO/UNICEF Joint Monitoring Programme (JMP) for Water Supply, Sanitation and Hygiene , 2019.
(b) Proportion of population with basic handwashing facilities on premises, by residence
(Percentage)
Regions 2017
All areas Rural Urban
World 60.1 45.5 ...
Sub-Saharan Africa 25.0 17.3 36.7
Northern Africa and Western Asia 76.8 64.0 ...
Northern Africa 74.2 65.9 81.9
Western Asia ... 61.2 ...
Central and Southern Asia 58.4 47.5 78.0
Central Asia 91.8 86.9 97.0
Southern Asia 57.1 46.3 77.0
Eastern and South-Eastern Asia ... ... ...
Eastern Asia ... ... ...
South-Eastern Asia 74.4 68.9 80.3
Latin America and the Caribbean ... 59.1 ...
Oceania ... ... ...
Australia and New Zealand ... ... ...

[E/2019/68]
59
Last editted on 23/06/2019 11:43 PM
Regions 2017
All areas Rural Urban
Oceania (exc. Australia and New Zealand) ... ... ...
Europe and Northern America ... ... ...
Europe ... ... ...
Northern America ... ... ...
Landlocked developing countries 34.0 24.6 55.4
Least developed countries 27.7 21.8 39.4
Small island developing States 51.4 32.9 62.8
Source: The WHO/UNICEF Joint Monitoring Programme (JMP) for Water Supply, Sanitation and Hygiene , 2019.
Target 6.5
By 2030, implement integrated water resources management at all levels, including
through transboundary cooperation as appropriate
Indicator 6.5.1
Degree of integrated water resources management implementation (0-100)
(a) Degree of integrated water resources management implementation (0-100)
Regions 2018
World 49
Sub-Saharan Africa 40
Northern Africa and Western Asia 55
Central and Southern Asia 37
Eastern and South-Eastern Asia 53
Latin America and the Caribbean 35
Australia and New Zealand 72
Oceania (exc. Australia and New Zealand) 38
Europe and Northern America 67 Note: Based on 172 countries' response to the Integrated Water Resources Management questionnaire.
Source: United Nations Environment Programme (UNEP).
(b) Proportion of countries by integrated water resources management implementation level
(Percentage)
2018
Regions Very low Low Medium-low Medium-high High Very high
World 0.6 18.6 40.7 20.9 15.1 4.1
Sub-Saharan Africa 2.2 17.8 51.1 28.9 0.0 0.0
Northern Africa and Western Asia 0.0 4.5 45.5 27.3 18.2 4.5
Central and Southern Asia 0.0 30.0 60.0 10.0 0.0 0.0
Eastern and South-Eastern Asia 0.0 15.4 46.2 15.4 7.7 15.4
Latin America and the Caribbean 0.0 44.8 48.3 3.4 3.4 0.0
Australia and New Zealand 0.0 0.0 0.0 50.0 50.0 0.0
Oceania (exc. Australia and New Zealand) 0.0 37.5 50.0 12.5 0.0 0.0
Europe and Northern America 0.0 4.7 16.3 25.6 44.2 9.3
Note: Based on 172 countries' response to the Integrated Water Resources Management questionnaire.
Source: United Nations Environment Programme (UNEP).

[E/2019/68]
Indicator 6.5.2
Proportion of transboundary basin area with an operational arrangement for water cooperation
(a) Proportion of transboundary basin area (river and lake basins, and aquifers) with an operational
arrangement for water cooperation
(Percentage)
Transboundary basin grouping 2017-2018
River and lake basins, and aquifer1 59.2
River and lake basins component2 63.3 1Based on 67 countries out of 153 countries sharing transboundary river and lake basins and/or transboundary aquifer s. 2Based on 89 countries out of 149 countries sharing transboundary river and lake basins.
Source: Data compiled by the United Nations Economic Commission for Europe (UNECE) and the United Nations Educational,
Scientific and Cultural Organisation (UNESCO).
(b) Proportion of countries by levels of transboundary cooperation
(Percentage)
Regions Very high
(90-100)1
High
(70-90)1
Medium high
(50-70)1
Medium low
(30-50)1
Low
(10-30)1
Very low
(0-10)1
Information
provided needs
to be clarified
World 14.4 7.8 3.9 2.0 2.0 10.5 29.4
Europe and Northern
America 44.2 9.3 2.3 4.7 0.0 2.3 30.2
Sub-Saharan Africa 7.1 19.0 7.1 4.8 2.4 9.5 28.6
Latin America and the
Caribbean 4.5 0.0 9.1 0.0 0.0 31.8 13.6
Northern Africa and
Western Asia 0.0 4.8 0.0 0.0 9.5 19.0 23.8
Central and Southern
Asia 0.0 8.3 0.0 0.0 0.0 0.0 33.3
Eastern and South-
eastern Asia 0.0 0.0 0.0 0.0 0.0 8.3 25.0
Oceania 0.0 0.0 0.0 0.0 0.0 0.0 0.0 1Levels of transboundary cooperation (percentage)
Note: Based on 107 countries' responses in 2017-2018 to the SDG 6.5.2 questionnaire.
Source: Data compiled by the United Nations Economic Commission for Europe (UNECE) and the United Nations Educational,
Scientific and Cultural Organisation (UNESCO).
Target 6.6
By 2020 protect and restore water-related ecosystems, including mountains, forests,
wetlands, rivers, aquifers and lakes
Indicator 6.6.1
Change in the extent of water-related ecosystems over time
(a) Water Body Extent (permanent)
(Percentage)
Regions 2005 2010 2015 2016
World 2.06 2.08 2.08 2.09
Sub-Saharan Africa 1.10 1.09 1.10 1.10
Northern Africa and Western Asia 0.78 0.79 0.80 0.80
Northern Africa 0.12 0.12 0.12 0.12
Western Asia 1.88 1.92 1.94 1.95
Central and Southern Asia 3.47 3.41 3.31 3.30

[E/2019/68]
61
Last editted on 23/06/2019 11:43 PM
Regions 2005 2010 2015 2016
Central Asia 7.03 6.82 6.58 6.57
Southern Asia 1.28 1.31 1.30 1.30
Eastern and South-Eastern Asia 1.19 1.23 1.26 1.26
Eastern Asia 1.11 1.15 1.19 1.19
South-Eastern Asia 1.41 1.45 1.46 1.45
Latin America and the Caribbean 1.15 1.16 1.14 1.15
Oceania 0.31 0.30 0.33 0.33
Australia and New Zealand 0.26 0.24 0.27 0.27
Oceania (exc. Australia and New Zealand) 1.09 1.12 1.18 1.18
Europe and Northern America 3.75 3.82 3.83 3.85
Europe 2.95 3.04 3.07 3.09
Northern America 4.71 4.74 4.74 4.75
Landlocked developing countries 2.94 2.89 2.84 2.84
Least developed countries 1.07 1.07 1.07 1.07
Small island developing States 1.16 1.19 1.24 1.24
Source: United Nations Environment Programme (UNEP).
(b) Water Body Extent (permanent or maybe permanent)
(Percentage)
Regions 2005 2010 2015 2016
World 2.11 2.11 2.10 2.10
Sub-Saharan Africa 1.10 1.10 1.10 1.10
Northern Africa and Western Asia 0.81 0.81 0.81 0.81
Northern Africa 0.12 0.12 0.12 0.12
Western Asia 1.98 1.98 1.98 1.98
Central and Southern Asia 3.56 3.49 3.38 3.36
Central Asia 7.25 7.01 6.75 6.71
Southern Asia 1.30 1.33 1.31 1.30
Eastern and South-Eastern Asia 1.20 1.23 1.27 1.26
Eastern Asia 1.12 1.15 1.19 1.19
South-Eastern Asia 1.42 1.46 1.48 1.47
Latin America and the Caribbean 1.16 1.17 1.15 1.15
Oceania 0.32 0.31 0.34 0.33
Australia and New Zealand 0.26 0.24 0.27 0.27
Oceania (exc. Australia and New Zealand) 1.21 1.26 1.27 1.24
Europe and Northern America 3.86 3.87 3.87 3.88
Europe 3.11 3.13 3.12 3.13
Northern America 4.75 4.76 4.77 4.77
Landlocked developing countries 3.03 2.96 2.89 2.89
Least developed countries 1.08 1.07 1.08 1.07
Small island developing States 1.22 1.26 1.28 1.27
Source: United Nations Environment Programme (UNEP).

[E/2019/68]
Target 6.a
By 2030, expand international cooperation and capacity-building support to developing
countries in water- and sanitation-related activities and programmes, including water
harvesting, desalination, water efficiency, wastewater treatment, recycling and reuse
technologies
Indicator 6.a.1
Amount of water- and sanitation-related official development assistance that is part of a
government-coordinated spending plan
Total official development assistance (gross disbursements) for water supply and sanitation
(Millions of constant 2017 United States dollars)
Regions 20001 2005 2010 2015 2017
Total ODA 5,779.3 5,444.0 7,273.5 8,839.3 8,846.6
Sub-Saharan Africa 966.4 1,152.2 1,962.5 2,437.4 2,583.8
Northern Africa 415.3 397.3 519.6 847.3 497.1
Western Asia 540.7 1,486.4 775.9 1,086.9 1,293.6
Central Asia 38.8 51.9 85.8 168.2 101.3
Southern Asia 433.2 697.0 1,065.6 1,368.1 1,639.7
Eastern Asia 972.0 525.5 354.6 207.7 102.2
South-Eastern Asia 999.0 365.0 975.9 1,141.7 1,038.4
Latin America and the Caribbean 997.3 394.7 768.4 532.7 691.5
Oceania 26.8 10.7 38.6 66.7 83.4
Europe 251.1 107.8 168.1 291.4 234.3
Landlocked developing countries 881.3 859.4 1,284.3 1,679.3 2,047.6
Least developed countries 1,121.2 1,244.7 2,140.1 2,690.6 2,915.9
Small island developing States 173.9 97.6 189.1 236.7 279.8
Residual/Unallocated ODA 138.8 255.5 558.3 691.2 581.3 1Based on commitments.
Note: Only the country-specific ODA are included in the regional aggregations. Unallocated ODA to multiple countries/regions are
presented in “Residual/Unallocated ODA” row.
Source: Creditor Reporting System (CRS) database, 2019, The Organisation for Economic Co-operation and Development (OECD).
Target 6.b
Support and strengthen the participation of local communities in improving water and
sanitation management
Indicator 6.b.1
Proportion of local administrative units with established and operational policies and procedures
for participation of local communities in water and sanitation management
(a) Proportion of countries with clearly defined procedures in law or policy for participation by service
users and communities in planning programs in rural drinking-water supply
(Percentage)
Regions 2010 2012 2014 2017 2019
World 87.5 90.7 83.0 87.8 75.4
Sub-Saharan Africa 88.5 88.6 86.1 96.0 75.0
Northern Africa and Western Asia 50.0 87.5 90.0 100.0 ...

[E/2019/68]
63
Last editted on 23/06/2019 11:43 PM
Regions 2010 2012 2014 2017 2019
Northern Africa 50.0 100.0 100.0 ... ...
Western Asia ... 80.0 85.7 100.0 ...
Central and Southern Asia 66.7 100.0 75.0 80.0 ...
Central Asia 0.0 100.0 100.0 33.3 33.3
Southern Asia 100.0 100.0 66.7 100.0 ...
Eastern and South-Eastern Asia 100.0 100.0 88.9 100.0 81.8
Eastern Asia 100.0 100.0 100.0 100.0 100.0
South-Eastern Asia 100.0 100.0 87.5 100.0 75.0
Latin America and the Caribbean 100.0 77.8 93.8 81.8 68.0
Oceania ... 100.0 25.0 50.0 ...
Oceania (exc. Australia and New Zealand) ... 100.0 25.0 50.0 57.1
Europe and Northern America ... ... 71.4 100.0 ...
Europe ... ... 71.4 100.0 ...
Landlocked developing countries 81.3 95.8 96.2 86.4 84.6
Least developed countries 84.6 94.6 89.5 96.4 77.5
Small island developing States 100.0 100.0 40.0 64.3 47.8
Source: Key indicators of the UN-Water Global Analysis and Assessment of Sanitation and Drinking-Water (GLAAS), World Health
Organisation (WHO).
(b) Proportion of countries with clearly defined procedures in law or policy for participation by service
users and communities in planning programs in water resources planning and management
(Percentage)
Regions 2017 2019
World 82.9 70.2
Sub-Saharan Africa 88.0 72.5
Northern Africa and Western Asia 100.0 ...
Northern Africa ... ...
Western Asia 100.0 ...
Central and Southern Asia 90.0 ...
Central Asia 66.7 66.7
Southern Asia 100.0 ...
Eastern and South-Eastern Asia 90.0 45.5
Eastern Asia 50.0 33.3
South-Eastern Asia 100.0 50.0
Latin America and the Caribbean 77.3 72.0
Oceania 50.0 ...
Australia and New Zealand ... ...
Oceania (exc. Australia and New Zealand) 50.0 28.6
Europe and Northern America 83.3 ...
Europe 83.3 ...
Northern America ... ...
Landlocked developing countries 86.4 84.6
Least developed countries 85.7 70.0
Small island developing States 57.1 39.1
Source: Key indicators of the UN-Water Global Analysis and Assessment of Sanitation and Drinking-Water (GLAAS), World Health
Organisation (WHO).

[E/2019/68]
(c) Proportion of countries with a high level of users and communities participating in planning programs
in rural drinking-water supply
(Percentage)
Regions 2014 2017 2019
World 22.3 20.7 33.3
Sub-Saharan Africa 22.2 24.0 37.5
Northern Africa and Western Asia 10.0 33.3 ...
Northern Africa 33.3 ... ...
Western Asia 0.0 33.3 ...
Central and Southern Asia 41.7 20.0 ...
Central Asia 33.3 0.0 0.0
Southern Asia 44.4 28.6 ...
Eastern and South-Eastern Asia 22.2 10.0 0.0
Eastern Asia 0.0 0.0 0.0
South-Eastern Asia 25.0 12.5 0.0
Latin America and the Caribbean 18.8 18.2 32.0
Oceania 50.0 33.3 ...
Australia and New Zealand ... ... ...
Oceania (exc. Australia and New Zealand) 50.0 33.3 28.6
Europe and Northern America 0.0 16.7 ...
Europe 0.0 16.7 ...
Northern America ... ... ...
Landlocked developing countries 30.8 36.4 38.5
Least developed countries 28.9 32.1 35.0
Small island developing States 20.0 21.4 17.4
Source: Key indicators of the UN-Water Global Analysis and Assessment of Sanitation and Drinking-Water (GLAAS), World Health
Organisation (WHO).
(d) Proportion of countries with a high level of users and communities participating in planning
programs in water resources planning and management
(Percentage)
Regions 2017 2019
World 8.5 31.6
Sub-Saharan Africa 8.0 40.0
Northern Africa and Western Asia 0.0 ...
Western Asia 0.0 ...
Central and Southern Asia 10.0 ...
Central Asia 0.0 66.7
Southern Asia 14.3 ...
Eastern and South-Eastern Asia 0.0 9.1
Eastern Asia 0.0 0.0
South-Eastern Asia 0.0 12.5
Latin America and the Caribbean 9.1 20.0
Oceania 16.7 ...
Oceania (exc. Australia and New Zealand) 16.7 0.0
Europe and Northern America 16.7 ...
Europe 16.7 ...
Landlocked developing countries 13.6 50.0
Least developed countries 7.1 27.5

[E/2019/68]
65
Last editted on 23/06/2019 11:43 PM
Regions 2017 2019
Small island developing States 7.1 8.7
Source: Key indicators of the UN-Water Global Analysis and Assessment of Sanitation and Drinking-Water (GLAAS), World Health
Organisation (WHO).

[E/2019/68]
Goal 7 Ensure access to affordable, reliable, sustainable and modern energy for all
Target 7.1
By 2030, ensure universal access to affordable, reliable and modern energy services
Indicator 7.1.1
Proportion of population with access to electricity
(a) Proportion of population with access to electricity
(Percentage)
Regions 2000 2005 2010 2015 2017
World 77.8 80.2 83.2 86.7 88.8
Sub-Saharan Africa 25.3 29.2 33.4 38.9 43.9
Northern Africa and Western Asia 87.1 89.7 91.4 93.7 94.5
Northern Africa 81.1 85.0 86.7 90.5 91.6
Western Asia 92.6 93.9 95.6 96.6 97.1
Central and Southern Asia 60.0 67.0 75.1 85.8 90.8
Central Asia 99.3 99.5 99.5 100.0 99.9
Southern Asia 58.5 65.8 74.2 85.2 90.4
Eastern and South-Eastern Asia 91.2 93.2 95.8 97.3 98.0
Eastern Asia 95.6 97.1 98.6 99.0 99.1
South-Eastern Asia 78.6 82.8 88.6 93.0 95.3
Latin America and the Caribbean 91.8 93.6 95.9 97.3 98.2
Oceania 81.2 82.5 82.3 87.5 89.7
Australia and New Zealand 100.0 100.0 100.0 100.0 100.0
Oceania (exc. Australia and New Zealand) 29.0 35.6 36.1 55.6 63.4
Europe and Northern America 100.0 100.0 100.0 100.0 100.0
Europe 100.0 100.0 100.0 100.0 100.0
Northern America 100.0 100.0 100.0 100.0 100.0
Landlocked developing countries 34.5 37.2 44.5 49.1 56.3
Least developed countries 19.9 26.0 33.4 42.9 51.1
Small island developing States 71.0 72.4 74.4 79.2 81.7
Source: The World Bank, 2019.
(b) Proportion of population with access to electricity, by residence
(Percentage)
Regions 2000 2010 2017
Rural Urban Rural Urban Rural Urban
World 63.3 94.4 70.0 95.8 78.6 97.4
Sub-Saharan Africa 9.1 61.0 14.4 69.1 21.6 78.7
Northern Africa and Western Asia 73.8 97.4 81.2 98.3 87.3 99.1
Northern Africa 67.5 95.7 77.4 95.9 85.3 98.0
Western Asia 82.1 98.5 86.4 99.8 90.2 99.9
Central and Southern Asia 47.5 90.2 65.4 94.7 86.0 99.4
Central Asia 98.9 99.8 99.0 99.9 99.9 99.9
Southern Asia 46.0 89.6 64.4 94.5 85.5 99.4
Eastern and South-Eastern Asia 87.0 97.1 93.0 98.5 96.5 99.0
Eastern Asia 93.9 98.1 98.4 98.7 99.1 99.0

[E/2019/68]
67
Last editted on 23/06/2019 11:43 PM
Regions 2000 2010 2017
Rural Urban Rural Urban Rural Urban
South-Eastern Asia 69.0 94.2 81.4 97.7 91.6 99.0
Latin America and the Caribbean 71.5 98.4 83.9 99.2 92.0 99.7
Oceania 44.7 98.1 47.8 98.4 69.8 98.9
Australia and New Zealand 100.0 100.0 100.0 100.0 100.0 100.0
Oceania (exc. Australia and New Zealand) 13.7 79.2 21.9 83.3 55.8 88.5
Europe and Northern America 100.0 100.0 100.0 100.0 100.0 100.0
Europe 100.0 100.0 100.0 100.0 100.0 100.0
Northern America 100.0 100.0 100.0 100.0 100.0 100.0
Landlocked developing countries 20.4 76.8 30.2 80.3 42.7 87.6
Least developed countries 8.5 56.4 19.6 68.8 37.8 79.0
Small island developing States 41.3 94.1 46.5 93.2 60.9 94.8
Source: The World Bank, 2019.
Indicator 7.1.2
Proportion of population with primary reliance on clean fuels and technology
Proportion of population with primary reliance on clean fuels and technology
(Percentage)
Regions 2000 2005 2010 2015 2017
World 50 53 57 60 61
Sub-Saharan Africa 9 10 11 13 14
Northern Africa and Western Asia 78 84 87 89 90
Northern Africa 71 77 81 84 86
Western Asia 84 89 92 93 94
Central and Southern Asia 26 32 38 44 46
Central Asia 75 81 87 90 91
Southern Asia 24 30 36 43 45
Eastern and South-Eastern Asia 46 50 55 59 61
Eastern Asia 54 56 59 61 62
South-Eastern Asia 23 33 45 56 60
Latin America and the Caribbean 78 82 85 87 88
Oceania 78 78 78 78 78
Australia and New Zealand >95 >95 >95 >95 >95
Oceania (exc. Australia and New Zealand) 11 13 14 16 17
Europe and Northern America >95 >95 >95 >95 >95
Europe 94 >95 >95 >95 >95
Northern America >95 >95 >95 >95 >95
Landlocked developing countries 23 24 25 27 27
Small island developing States 51 53 55 56 57
Source: Global Health Observatory (GHO), World Health Organisation (WHO).

[E/2019/68]
Target 7.2
By 2030, increase substantially the share of renewable energy in the global energy mix
Indicator 7.2.1
Renewable energy share in the total final energy consumption
Renewable energy share in the total final energy consumption
(Percentage)
Regions 2000 2005 2010 2015 2016
World 17.3 16.3 16.6 17.2 17.5
Sub-Saharan Africa 72.7 70.9 71.6 69.3 69.5
Northern Africa and Western Asia 8.4 7.6 6.2 5.6 5.6
Northern Africa 15.0 13.7 11.2 10.3 10.0
Western Asia 6.1 5.3 4.5 4.0 4.1
Central and Southern Asia 37.8 34.8 30.7 27.3 27.1
Central Asia 3.9 4.1 3.4 3.5 3.6
Southern Asia 43.0 39.3 34.1 30.0 29.5
Eastern and South-Eastern Asia 23.4 16.9 13.8 14.0 14.3
Eastern Asia 20.0 13.7 10.7 11.0 11.4
South-Eastern Asia 38.6 33.8 31.7 30.0 30.0
Latin America and the Caribbean 28.2 28.4 28.6 28.2 28.8
Oceania 13.2 11.7 12.7 13.4 13.8
Australia and New Zealand 11.4 10.0 11.3 12.1 12.6
Oceania (exc. Australia and New Zealand) 48.5 42.3 39.1 36.1 35.1
Europe and Northern America 7.4 7.9 10.0 12.1 12.3
Europe 7.4 8.1 10.9 13.4 13.5
Northern America 7.3 7.7 9.1 10.8 11.1
Landlocked developing countries 44.3 44.5 43.9 44.8 45.0
Least developed countries 84.0 81.2 76.9 73.9 73.2
Small island developing States 24.0 21.1 17.6 18.3 17.6
Source: IEA (2018), World Energy Balances; Energy Balances, UN Statistics Division (2018).
Target 7.3
By 2030, double the global rate of improvement in energy efficiency
Indicator 7.3.1
Energy intensity measured in terms of primary energy and gross domestic product (GDP)
Energy intensity level of primary energy
(Megajoules per constant 2011 purchasing power parity [PPP] GDP)
Regions 2000 2005 2010 2015 2016
World 6.6 6.3 5.9 5.3 5.1
Sub-Saharan Africa 10.3 8.9 8.0 7.2 7.3
Northern Africa and Western Asia 4.3 4.3 4.6 4.4 4.3
Northern Africa 3.9 4.1 3.8 3.9 3.9
Western Asia 4.5 4.4 4.9 4.6 4.4
Central and Southern Asia 7.0 6.3 5.7 5.1 4.9
Central Asia 17.6 13.5 11.0 8.9 8.7
Southern Asia 6.4 5.8 5.4 4.9 4.7

[E/2019/68]
69
Last editted on 23/06/2019 11:43 PM
Regions 2000 2005 2010 2015 2016
Eastern and South-Eastern Asia 7.1 7.2 6.6 5.6 5.4
Eastern Asia 7.6 7.8 7.2 6.1 5.7
South-Eastern Asia 5.3 5.0 4.5 4.0 4.0
Latin America and the Caribbean 4.1 4.1 4.0 3.8 3.8
Oceania 6.7 5.9 5.8 5.1 5.1
Australia and New Zealand 6.7 5.9 5.8 5.0 5.1
Oceania (exc. Australia and New Zealand) 5.8 6.4 5.6 5.8 5.6
Europe and Northern America 6.6 6.1 5.6 5.0 4.9
Europe 6.0 5.5 5.1 4.5 4.5
Northern America 7.5 6.8 6.2 5.6 5.4
Landlocked developing countries 13.3 11.1 8.8 7.5 7.5
Least developed countries 8.5 7.4 6.3 5.9 5.9
Small island developing States 4.0 3.8 3.5 3.1 3.0
Source: IEA (2018), World Energy Balances; Energy Balances, UN Statistics Division (2018); World Bank, World Development
Indicators.

[E/2019/68]
Goal 8 Promote sustained, inclusive and sustainable economic growth, full and productive employment and decent work for all
Target 8.1
Sustain per capita economic growth in accordance with national circumstances and, in
particular, at least 7 per cent gross domestic product growth per annum in the Least
developed countries
Indicator 8.1.1
Annual growth rate of real GDP per capita
Annual growth rate of real GDP per capita
(Percentage)
Regions 2000 2005 2010 2015 2017
World 3.0 2.6 3.0 1.6 1.9
Sub-Saharan Africa 0.7 3.3 2.8 0.0 -0.3
Northern Africa and Western Asia 4.2 4.5 3.3 1.8 1.2
Northern Africa 2.4 3.9 2.8 0.7 2.2
Western Asia 4.5 4.5 3.2 2.0 1.0
Central and Southern Asia 2.6 5.2 5.8 4.6 4.7
Central Asia 7.1 7.8 5.8 1.6 3.1
Southern Asia 2.3 5.0 5.8 4.8 4.8
Eastern and South-Eastern Asia 4.1 4.4 6.8 3.6 4.1
Eastern Asia 4.3 4.6 6.9 3.8 4.3
South-Eastern Asia 4.4 4.4 6.5 3.4 4.0
Latin America and the Caribbean 2.2 3.0 4.5 -1.5 -0.2
Oceania 0.6 1.3 0.6 1.5 1.4
Australia and New Zealand 0.9 1.4 0.6 1.6 1.6
Oceania (exc. Australia and New Zealand) -1.4 0.9 3.7 2.8 -1.0
Europe and Northern America 3.9 2.6 2.0 1.9 2.0
Europe 4.2 2.3 2.1 1.7 2.2
Northern America 3.1 2.6 1.7 2.0 1.6
Landlocked developing countries 2.2 6.3 4.7 1.0 2.1
Least developed countries 1.7 5.5 3.7 1.4 2.1
Small island developing States 4.1 3.8 6.0 1.4 1.0 Source: National Accounts Statistics: Analysis of Main Aggregates, United Nations Statistics Division (UNSD), Department of
Economic and Social Affairs, United Nations.

[E/2019/68]
71
Last editted on 23/06/2019 11:43 PM
Target 8.2
Achieve higher levels of economic productivity through diversification, technological
upgrading and innovation, including through a focus on high-value added and labour-
intensive sectors
Indicator 8.2.1
Annual growth rate of real GDP per employed person
Annual growth rate of real GDP per employed person
(Percentage)
Regions 2000 2005 2010 2015 2018
World 2.6 2.1 3.3 1.6 2.1
Sub-Saharan Africa 0.5 2.2 3.1 0.1 0.3
Northern Africa and Western Asia 4.7 3.3 1.5 2.1 1.4
Northern Africa 2.6 2.8 1.6 3.3 2.1
Western Asia 5.4 3.2 0.7 0.9 1.3
Central and Southern Asia 2.2 4.9 7.2 4.0 4.8
Central Asia 5.1 5.5 5.0 1.7 3.5
Southern Asia 2.0 4.8 7.4 4.2 4.9
Eastern and South-Eastern Asia 3.7 4.5 6.8 3.8 4.2
Eastern Asia 3.8 4.4 7.2 3.9 4.5
South-Eastern Asia 3.8 4.9 5.5 3.7 3.7
Latin America and the Caribbean 1.6 1.5 4.0 -1.5 0.5
Oceania 1.0 0.5 0.6 0.8 1.1
Australia and New Zealand 1.2 -0.3 -0.1 0.8 1.2
Oceania (exc. Australia and New Zealand) -0.9 4.6 6.4 1.6 1.3
Europe and Northern America 2.6 1.4 2.7 1.3 2.0
Europe 2.6 1.1 2.5 1.2 1.9
Northern America 2.5 1.7 2.9 1.2 2.0
Landlocked developing countries 1.4 5.2 4.6 0.7 1.6
Least developed countries 1.5 5.7 2.8 0.6 2.2
Small island developing States 3.6 3.2 5.7 0.2 0.8 Note: Data on labour productivity is measured by GDP in constant United States dollars based on 2010 prices.
Source: ILO modelled estimates, November 2018, ILO Database of Labour Statistics (ILOSTAT), International Labour Organisation
(ILO).

[E/2019/68]
Target 8.3
Promote development-oriented policies that support productive activities, decent job
creation, entrepreneurship, creativity and innovation, and encourage the formalization
and growth of micro-, small- and medium-sized enterprises, including through access to
financial services
Indicator 8.3.1
Proportion of informal employment in non‑agriculture employment, by sex
Proportion of informal employment in non‑agriculture employment, by sex
(Percentage)
Regions 2016
Both sexes Female Male
World 50.5 46.4 53.1
Sub-Saharan Africa 76.7 82.9 71.5
Northern Africa and Western Asia 47.2 34.8 50.7
Northern Africa 56.4 41.7 59.8
Western Asia 38.7 30.9 41.3
Central and Southern Asia 76.0 73.1 76.7
Central Asia 45.1 37.5 50.0
Southern Asia 77.6 76.9 77.6
Eastern and South-Eastern Asia 53.1 50.8 54.6
Eastern Asia 49.5 46.7 51.3
South-Eastern Asia 67.4 66.8 67.9
Latin America and the Caribbean 49.0 51.8 46.8
Europe and Northern America 18.7 17.3 19.9
Europe 19.2 17.4 20.8
Northern America 17.7 17.1 18.3
Landlocked developing countries 66.0 68.0 64.7
Least developed countries 79.2 84.9 76.0
Source: ILO harmonized estimates based on country-level microdata, International Labour Organisation (ILO).
Target 8.4
Improve progressively, through 2030, global resource efficiency in consumption and
production and endeavour to decouple economic growth from environmental degradation,
in accordance with the 10-Year Framework of Programmes on Sustainable Consumption
and Production, with developed countries taking the lead
Indicator 8.4.1
Material footprint, material footprint per capita, and material footprint per GDP 1
(a) Material footprint
(Millions of tonnes)
Regions 2000 2005 2010 2015 2017
World 53,826.4 64,573.2 76,532.8 87,435.2 91,973.9
Source: Environment Live database, United Nations Environment Programme (UNEP); Global Material Flows Database,
International Resource Panel.

[E/2019/68]
73
Last editted on 23/06/2019 11:43 PM
(b) Material footprint per capita
(Tonnes per capita)
Regions 2000 2005 2010 2015 2017
World 8.8 9.9 11.0 11.8 12.2
Source: Environment Live database, United Nations Environment Programme (UNEP); Global Material Flows Database,
International Resource Panel.
(c) Material footprint per unit of GDP
(Kilograms per unit of constant 2010 United States dollars)
Regions 2000 2005 2010 2015 2017
World 1.08 1.12 1.16 1.16 1.16
Source: Environment Live database, United Nations Environment Programme (UNEP); Global Material Flows Database,
International Resource Panel. 1Material footprint (MF) is the attribution of global material extraction to final domestic demand of a country. It is ca lculated as the
raw material equivalent of imports plus domestic extraction minus raw material equivalents of exports.
Indicator 8.4.2
Domestic material consumption, domestic material consumption per capita, and domestic material
consumption per GDP
(a) Domestic material consumption
(Millions of tonnes)
Regions 2000 2005 2010 2015 2017
World 53,032 63,395 75,456 83,979 88,180
Sub-Saharan Africa 2,455 3,006 3,637 3,945 4,172
Northern Africa and Western Asia 2,568 3,289 4,819 5,177 5,611
Northern Africa 963 1,192 1,851 1,662 1,815
Western Asia 1,651 2,152 3,032 3,581 3,865
Central and Southern Asia 5,999 7,115 8,806 10,576 11,181
Central Asia 530 675 793 941 996
Southern Asia 5,468 6,440 8,013 9,635 10,185
Eastern and South-Eastern Asia 17,356 23,349 33,397 39,528 42,480
Eastern Asia 14,246 19,371 28,352 34,414 37,016
South-Eastern Asia 3,063 3,923 4,981 5,047 5,395
Latin America and the Caribbean 4,625 5,209 6,092 6,538 6,820
Oceania 1,054 1,108 1,092 1,130 1,140
Australia and New Zealand 964 1,025 997 1,032 1,041
Europe and Northern America 18,976 20,319 17,613 17,086 16,776
Europe 9,618 10,566 9,726 9,702 9,685
Northern America 9,358 9,753 7,887 7,383 7,091
Landlocked developing countries 1,454 1,855 2,320 2,757 2,946
Least developed countries 1,699 … 3,096 3,162 3,421
Small island developing States … … 501 545 547
Source: Environment Live database, United Nations Environment Programme (UNEP); Global Material Flows Database,
International Resource Panel.

[E/2019/68]
(b) Domestic material consumption per capita
(Tonnes)
Regions 2000 2005 2010 2015 2017
World 8.63 9.69 10.84 11.37 11.68
Sub-Saharan Africa 3.81 4.08 4.30 4.07 4.08
Northern Africa and Western Asia 7.29 8.49 11.22 10.93 11.43
Northern Africa 5.58 6.35 9.06 7.38 7.77
Western Asia 8.93 10.46 13.03 13.87 14.44
Central and Southern Asia 3.98 4.33 4.98 5.59 5.76
Central Asia 9.54 11.49 12.55 13.69 14.06
Southern Asia 3.76 4.07 4.70 5.28 5.45
Eastern and South-Eastern Asia 8.59 11.12 15.34 17.53 18.61
Eastern Asia 9.56 12.64 18.03 21.35 22.79
South-Eastern Asia 5.84 6.98 8.34 7.95 8.32
Latin America and the Caribbean 8.80 9.27 10.19 10.34 10.56
Oceania 33.74 33.00 29.82 28.58 28.01
Australia and New Zealand 42.05 42.05 37.65 36.32 35.69
Europe and Northern America 18.25 19.21 16.31 15.58 15.21
Europe 13.23 14.47 13.19 13.10 13.05
Northern America 29.91 29.78 23.00 20.74 19.63
Landlocked developing countries 4.34 4.91 5.45 5.74 5.85
Least developed countries 2.55 ... 3.64 3.30 3.41
Small island developing States ... ... 7.92 8.13 8.00
Source: Environment Live database, United Nations Environment Programme (UNEP); Global Material Flows Database,
International Resource Panel.
(c) Domestic material consumption per GDP
(Kilograms per constant 2010 United States dollars)
Regions 2000 2005 2010 2015 2017
World 1.07 1.09 1.15 1.11 1.11
Sub-Saharan Africa 3.26 2.86 2.76 2.43 2.48
Northern Africa and Western Asia 1.25 1.21 1.50 1.33 1.36
Northern Africa 2.35 1.81 2.58 2.50 2.54
Western Asia 0.99 1.04 1.20 1.10 1.12
Central and Southern Asia 3.96 3.47 3.19 2.97 2.76
Central Asia 5.12 4.28 3.59 3.16 3.10
Southern Asia 3.88 3.40 3.15 2.95 2.73
Eastern and South-Eastern Asia 1.79 1.96 2.20 2.07 2.04
Eastern Asia 1.68 1.87 2.15 2.09 2.06
South-Eastern Asia 2.58 2.57 2.51 2.00 1.94
Latin America and the Caribbean 1.18 1.17 1.14 1.11 1.16
Oceania 0.96 0.85 0.74 0.66 0.64
Australia and New Zealand 0.90 0.81 0.69 0.62 0.60
Europe and Northern America 0.62 0.59 0.48 0.43 0.41
Europe 0.57 0.56 0.49 0.46 0.44
Northern America 0.67 0.61 0.47 0.40 0.37
Landlocked developing countries 5.58 4.48 4.21 3.84 3.82
Least developed countries 4.90 ... 4.20 3.78 3.79

[E/2019/68]
75
Last editted on 23/06/2019 11:43 PM
Regions 2000 2005 2010 2015 2017
Small island developing States ... ... 0.85 0.80 0.78
Source: Environment Live database, United Nations Environment Programme (UNEP); Global Material Flows Database,
International Resource Panel.
Target 8.5
By 2030, achieve full and productive employment and decent work for all women and
men, including for young people and persons with disabilities, and equal pay for work of
equal value
Indicator 8.5.2
Unemployment rate, by sex, age and persons with disabilities1,2
(a) Unemployment rate, both sexes3
(Percentage)
Regions 2000 2005 2010 2015 2018
World 5.5 5.6 5.5 5.2 5.0
Sub-Saharan Africa 7.4 6.8 6.1 5.9 5.9
Northern Africa and Western Asia 11.4 11.0 9.4 10.0 9.9
Northern Africa 15.4 12.9 10.2 12.4 11.8
Western Asia 7.9 9.3 8.8 8.3 8.5
Central and Southern Asia 3.4 3.6 3.0 3.4 3.2
Central Asia 12.1 7.9 6.1 5.7 5.6
Southern Asia 3.0 3.4 2.8 3.3 3.1
Eastern and South-Eastern Asia 3.6 4.5 4.2 4.1 3.9
Eastern Asia 3.5 4.5 4.5 4.5 4.2
South-Eastern Asia 3.9 4.4 3.3 2.9 2.8
Latin America and the Caribbean 9.2 7.9 7.0 6.6 8.0
Oceania 5.8 4.6 5.1 5.5 4.9
Australia and New Zealand 6.3 4.8 5.4 5.9 5.2
Oceania (exc. Australia and New Zealand) 4.1 3.5 3.4 3.8 3.5
Europe and Northern America 8.1 7.6 9.2 7.6 5.8
Europe 9.9 8.7 9.1 8.6 6.7
Northern America 4.3 5.3 9.5 5.5 4.2
Landlocked developing countries 6.2 5.2 4.7 4.0 3.9
Least developed countries 4.7 4.8 4.3 4.1 4.0
Small island developing States 6.8 7.1 7.3 7.2 6.6
Source: ILO modelled estimates, November 2018, ILO Database of Labour Statistics (ILOSTAT), International Labour Organisation
(ILO).
(b) Unemployment rate, both sexes, by age4
(Percentage)
Regions 2000 2005 2010 2018
Youth Adult Youth Adult Youth Adult Youth Adult
World 11.5 4.0 11.9 4.1 11.6 4.2 11.8 3.8
Sub-Saharan Africa 12.0 5.6 11.2 5.2 10.1 4.7 9.8 4.7
Northern Africa and Western Asia 24.6 7.6 24.0 7.4 21.7 6.6 23.9 7.3
Northern Africa 31.2 10.4 28.6 8.3 24.0 6.7 29.9 8.5
Western Asia 18.9 5.2 19.6 6.7 19.6 6.4 19.6 6.5

[E/2019/68]
Regions 2000 2005 2010 2018
Youth Adult Youth Adult Youth Adult Youth Adult
Central and Southern Asia 8.7 1.7 8.9 2.0 8.3 1.6 9.9 1.9
Central Asia 18.9 9.5 13.3 6.4 9.8 5.2 9.8 4.9
Southern Asia 8.3 1.4 8.7 1.8 8.3 1.5 9.9 1.8
Eastern and South-Eastern Asia 8.9 2.5 10.4 3.2 9.7 3.1 10.0 3.1
Eastern Asia 8.2 2.7 9.5 3.4 9.8 3.6 10.1 3.6
South-Eastern Asia 10.8 1.9 12.9 2.2 9.6 1.8 9.9 1.5
Latin America and the Caribbean 16.1 6.8 15.9 5.6 14.4 5.2 17.9 6.0
Oceania 11.6 4.5 9.5 3.3 11.2 3.7 10.9 3.7
Australia and New Zealand 13.3 4.9 10.5 3.5 12.4 3.9 12.2 4.0
Oceania (exc. Australia and New Zealand) 7.4 2.9 6.7 2.5 6.9 2.4 7.1 2.4
Europe and Northern America 15.3 6.8 15.5 6.3 19.1 7.9 12.4 5.1
Europe 18.1 8.4 18.2 7.4 19.9 7.8 15.6 5.8
Northern America 10.7 3.2 11.3 4.1 17.9 8.0 8.5 3.5
Landlocked developing countries 8.9 4.9 7.8 4.2 7.1 3.7 6.3 3.0
Least developed countries 8.5 3.1 8.3 3.4 7.4 3.2 7.5 2.8
Small island developing States 14.3 5.1 15.5 5.3 16.0 5.6 15.3 5.1
Source: ILO modelled estimates, November 2018, ILO Database of Labour Statistics (ILOSTAT), International Labour Organisation
(ILO).
(c) Unemployment rate, by sex3
(Percentage)
Regions 2000 2005 2010 2018
Female Male Female Male Female Male Female Male
World 5.9 5.2 6.2 5.3 5.9 5.2 5.4 4.7
Sub-Saharan Africa 8.0 6.9 7.5 6.3 6.5 5.8 6.2 5.6
Northern Africa and Western Asia 14.3 10.4 15.3 9.7 15.3 7.6 16.1 7.9
Northern Africa 21.0 13.8 20.0 10.9 19.5 7.5 20.8 9.1
Western Asia 9.4 7.4 11.5 8.6 12.0 7.7 12.9 7.0
Central and Southern Asia 3.6 3.3 4.9 3.1 3.9 2.6 4.6 2.8
Central Asia 12.3 11.9 8.1 7.7 6.2 6.1 5.6 5.7
Southern Asia 2.9 3.0 4.6 3.0 3.7 2.5 4.5 2.7
Eastern and South-Eastern Asia 3.2 3.8 4.1 4.7 3.8 4.5 3.4 4.2
Eastern Asia 3.0 3.8 3.9 4.9 3.9 5.0 3.7 4.6
South-Eastern Asia 4.1 3.9 4.9 4.1 3.4 3.2 2.7 2.9
Latin America and the Caribbean 11.5 7.7 10.1 6.5 8.8 5.9 9.6 7.0
Oceania 5.4 6.0 4.6 4.5 5.1 5.0 4.9 4.9
Australia and New Zealand 6.1 6.4 5.0 4.7 5.6 5.3 5.3 5.2
Oceania (exc. Australia and New Zealand) 3.5 4.6 3.1 3.9 2.9 3.8 2.8 4.0
Europe and Northern America 8.6 7.6 7.8 7.3 8.7 9.7 5.8 5.8
Europe 10.7 9.2 9.1 8.3 8.8 9.3 6.7 6.6
Northern America 4.4 4.2 5.2 5.3 8.5 10.3 4.0 4.3
Landlocked developing countries 6.6 5.9 5.6 4.9 5.2 4.2 4.3 3.5
Least developed countries 4.9 4.6 5.3 4.5 4.8 4.0 4.4 3.6
Small island developing States 8.5 5.7 8.6 6.0 8.6 6.3 8.0 5.6
Source: ILO modelled estimates, November 2018, ILO Database of Labour Statistics (ILOSTAT), International Labour Organisation
(ILO).

[E/2019/68]
77
Last editted on 23/06/2019 11:43 PM
(d) Unemployment rate, female, by age4
(Percentage)
Regions 2000 2005 2010 2018
Youth Adult Youth Adult Youth Adult Youth Adult
World 11.4 4.4 12.6 4.6 12.1 4.5 12.4 4.3
Sub-Saharan Africa 12.3 6.3 11.6 5.9 10.4 5.1 10.0 5.0
Northern Africa and Western Asia 27.2 9.6 30.8 10.3 32.8 10.9 32.5 12.8
Northern Africa 37.8 13.9 39.0 12.9 41.9 13.1 40.8 16.3
Western Asia 17.6 6.7 22.7 8.4 24.4 9.2 25.8 10.6
Central and Southern Asia 8.6 2.0 10.9 3.1 9.4 2.5 11.9 3.2
Central Asia 21.9 9.9 13.8 6.7 9.9 5.3 9.8 4.9
Southern Asia 7.8 1.3 10.7 2.8 9.4 2.3 12.1 3.0
Eastern and South-Eastern Asia 7.4 2.2 9.7 2.8 9.0 2.8 9.4 2.7
Eastern Asia 6.3 2.2 8.4 2.9 8.6 3.0 9.0 3.1
South-Eastern Asia 10.6 1.9 13.8 2.4 9.9 1.8 10.2 1.3
Latin America and the Caribbean 20.9 8.5 20.4 7.2 18.1 6.5 21.8 7.2
Oceania 10.1 4.1 9.3 3.4 10.8 3.8 9.8 3.8
Australia and New Zealand 11.4 4.7 10.3 3.7 12.1 4.2 10.9 4.3
Oceania (exc. Australia and New Zealand) 6.9 2.1 6.4 1.9 6.4 1.9 6.4 1.7
Europe and Northern America 15.8 7.4 15.2 6.7 17.6 7.5 11.4 5.2
Europe 20.1 9.3 18.5 7.8 19.2 7.6 15.0 6.0
Northern America 9.1 3.4 10.1 4.3 15.3 7.3 7.3 3.4
Landlocked developing countries 9.6 5.4 8.1 4.5 7.6 4.2 6.9 3.4
Least developed countries 8.5 3.3 8.6 3.9 7.8 3.6 7.7 3.2
Small island developing States 16.6 6.5 18.4 6.5 18.9 6.6 18.7 6.2
Source: ILO modelled estimates, November 2018, ILO Database of Labour Statistics (ILOSTAT), International Labour Organisation
(ILO).
(e) Unemployment rate, male, by age4
(Percentage)
Regions 2000 2005 2010 2018
Youth Adult Youth Adult Youth Adult Youth Adult
World 11.1 3.7 11.4 3.7 11.3 3.9 11.5 3.5
Sub-Saharan Africa 11.7 5.1 10.9 4.6 9.9 4.5 9.7 4.3
Northern Africa and Western Asia 22.4 7.0 21.6 6.6 18.0 5.3 20.9 5.6
Northern Africa 28.8 9.5 24.7 7.1 18.0 4.9 25.8 6.2
Western Asia 16.6 4.8 18.6 6.1 18.0 5.6 17.5 5.1
Central and Southern Asia 8.5 1.7 8.2 1.6 8.0 1.3 9.3 1.5
Central Asia 21.0 9.3 13.1 6.2 9.8 5.1 9.9 4.8
Southern Asia 8.2 1.4 8.0 1.4 7.9 1.2 9.3 1.4
Eastern and South-Eastern Asia 8.8 2.7 11.0 3.4 10.3 3.4 10.5 3.4
Eastern Asia 8.0 3.0 10.6 3.8 10.7 4.0 11.0 4.0
South-Eastern Asia 10.9 1.8 12.2 2.0 9.4 1.7 9.8 1.6
Latin America and the Caribbean 14.1 5.7 13.0 4.6 12.0 4.3 15.3 5.2
Oceania 11.7 4.7 9.7 3.3 11.4 3.6 11.9 3.6
Australia and New Zealand 13.2 5.0 10.6 3.4 12.6 3.7 13.4 3.7
Oceania (exc. Australia and New Zealand) 8.1 3.4 7.1 2.9 7.3 2.8 7.8 3.0
Europe and Northern America 15.5 6.3 15.9 6.0 20.3 8.2 13.2 5.0
Europe 18.7 7.7 17.9 7.0 20.4 7.9 16.0 5.7

[E/2019/68]
Regions 2000 2005 2010 2018
Youth Adult Youth Adult Youth Adult Youth Adult
Northern America 10.0 3.1 12.4 4.0 20.2 8.7 9.7 3.5
Landlocked developing countries 9.1 4.6 7.5 3.9 6.6 3.3 5.7 2.7
Least developed countries 8.7 2.9 8.1 3.1 7.1 2.9 7.3 2.4
Small island developing States 12.3 4.2 13.4 4.5 13.9 4.9 12.9 4.3
Source: ILO modelled estimates, November 2018, ILO Database of Labour Statistics (ILOSTAT), International Labour Organisation
(ILO). 1 Unemployment rate is calculated as the number of unemployed persons expressed as a percentage of the labour force, where
unemployed persons are those who, during the short reference period, were not in employment, were available and seeking
employment. 2 Statistics on the labour force status of individuals disaggregated by their disability status are not available at the g lobal and regional
levels at this stage. 3 Refers to persons aged 15 and above. 4 Adults refer to persons aged 25 and above; youth refers to persons aged 15 to 24 inclusive.
Target 8.6
By 2020, substantially reduce the proportion of youth not in employment, education or
training
Indicator 8.6.1
Proportion of youth (aged 15-24 years) not in education, employment or training
Proportion of youth (aged 15-24 years) not in education, employment or training, both sexes
(Percentage)
Regions 2005 2010 2015 2018
World 23.3 22.0 21.4 21.3
Sub-Saharan Africa 21.1 20.5 20.2 20.4
Northern Africa and Western Asia 31.2 29.2 26.8 26.6
Northern Africa 30.9 29.8 26.9 26.8
Western Asia 31.5 28.6 26.8 26.5
Central and Southern Asia 30.7 28.1 27.5 27.2
Central Asia 19.5 17.8 17.8 17.8
Southern Asia 31.1 28.5 27.8 27.5
Eastern and South-Eastern Asia 20.0 18.5 17.3 17.0
Eastern Asia 19.2 17.8 16.7 16.2
South-Eastern Asia 22.0 20.1 18.6 18.2
Latin America and the Caribbean 20.9 20.1 20.8 21.5
Oceania 14.2 16.3 15.8 15.5
Australia and New Zealand 10.8 11.7 10.0 9.2
Oceania (exc. Australia and New Zealand) 21.0 25.7 26.8 26.4
Europe and Northern America 15.0 15.6 13.6 12.3
Europe 14.3 13.7 12.6 11.7
Northern America 16.4 19.3 15.3 13.2
Landlocked developing countries 19.7 17.3 16.6 17.1
Least developed countries 23.2 21.7 21.3 21.0
Small island developing States 24.2 23.9 24.8 24.5
Source: ILO modelled estimates, November 2018, ILO Database of Labour Statistics (ILOSTAT), International Labour Organisation
(ILO).

[E/2019/68]
79
Last editted on 23/06/2019 11:43 PM
Proportion of youth (aged 15-24 years) not in education, employment or training, by sex
(Percentage)
Regions 2005 2010 2015 2018
Female Male Female Male Female Male Female Male
World 33.5 13.5 31.6 12.9 30.7 12.6 30.4 12.7
Sub-Saharan Africa 26.1 16.0 25.4 15.7 25.0 15.5 25.1 15.9
Northern Africa and Western Asia 43.5 19.2 42.5 16.5 37.7 16.5 37.7 16.3
Northern Africa 42.2 19.8 43.5 16.5 35.8 18.3 35.7 18.3
Western Asia 44.8 18.7 41.5 16.4 39.4 15.0 39.4 14.6
Central and Southern Asia 53.1 9.7 48.0 9.5 46.6 9.9 45.7 10.3
Central Asia 23.0 16.2 21.6 14.1 21.8 13.9 22.0 13.7
Southern Asia 54.3 9.4 49.1 9.3 47.5 9.7 46.5 10.2
Eastern and South-Eastern Asia 25.2 15.2 23.8 13.4 22.4 12.7 22.1 12.2
Eastern Asia 23.9 14.9 22.9 13.0 21.5 12.3 21.2 11.9
South-Eastern Asia 28.2 15.9 26.1 14.4 24.1 13.3 23.7 12.9
Latin America and the Caribbean 29.6 12.4 28.0 12.3 28.9 13.0 28.9 14.4
Oceania 16.1 12.4 17.7 14.9 17.1 14.7 16.5 14.5
Australia and New Zealand 12.4 9.2 12.6 10.8 10.7 9.4 9.5 9.0
Oceania (exc. Australia and New
Zealand) 23.4 18.7 28.2 23.3 29.1 24.5 28.8 24.0
Europe and Northern America 16.9 13.2 16.6 14.6 14.4 12.9 13.0 11.6
Europe 16.2 12.5 15.1 12.3 13.4 11.9 12.5 11.0
Northern America 18.3 14.7 19.6 19.1 16.0 14.7 13.9 12.6
Landlocked developing countries 24.7 14.7 22.5 12.1 21.6 11.6 22.0 12.3
Least developed countries 32.7 13.7 29.5 13.9 29.3 13.4 28.6 13.5
Small island developing States 30.6 18.0 29.7 18.2 30.8 19.0 30.8 18.5
Source: ILO modelled estimates, November 2018, ILO Database of Labour Statistics (ILOSTAT), International Labour Organisation
(ILO).
Target 8.10
Strengthen the capacity of domestic financial institutions to encourage and expand access
to banking, insurance and financial services for all
Indicator 8.10.1
(a) Number of commercial bank branches per 100,000 adults and (b) number of automated teller
machines (ATMs) per 100,000 adults
(a) Number of commercial bank branches per 100,000 adults1
(Percentage)
Regions 2010 2015 2017
World 14.5 15.0 14.8
Sub-Saharan Africa 4.1 4.9 5.0
Northern Africa and Western Asia 10.5 11.1 10.7
Central and Southern Asia 10.7 13.6 14.5
Eastern and South-Eastern Asia 9.5 11.3 11.3
Latin America and the Caribbean 15.3 16.6 15.8
Oceania 25.6 23.3 23.6
Europe and Northern America 34.9 30.7 28.6
Landlocked developing countries 7.3 8.1 9.1

[E/2019/68]
Least developed countries 3.5 4.8 5.3
Small island developing States 8.3 8.6 8.3 1Adults refer to persons aged 15 and above.
Source: Financial Access Survey (FAS), Statistics Department, International Monetary Fund (IMF)
(b) Number of automated teller machines (ATMs) per 100,000 adults1
(Per 100,000 adults)
Regions 2010 2015 2017
World 44.9 64.6 66.5
Sub-Saharan Africa 9.0 12.2 12.2
Northern Africa and Western Asia 24.2 34.1 35.3
Central and Southern Asia 8.1 19.6 22.3
Eastern and South-Eastern Asia 37.4 76.8 81.8
Latin America and the Caribbean 65.7 73.8 71.4
Oceania 122.3 118.6 117.0
Europe and Northern America 122.2 142.1 144.1
Landlocked developing countries 8.3 12.0 13.5
Least developed countries 2.3 5.1 5.8
Small island developing States 23.4 27.2 29.1 1Adults refer to persons aged 15 and above.
Source: Financial Access Survey (FAS), Statistics Department, International Monetary Fund (IMF)
Indicator 8.10.2
Proportion of adults (15 years and older) with an account at a bank or other financial institution or
with a mobile-money-service provider
Proportion of adults (15 years and older) with an account at a bank or other financial institution or with
a mobile-money-service provider, by sex
(Percentage)
Regions 2017
Total Female Male
World 68.5 64.8 72.3
Sub-Saharan Africa 42.6 36.9 48.4
Northern Africa and Western Asia 43.2 31.9 54.2
Northern Africa 32.5 22.2 43.3
Western Asia 59.8 48.5 69.9
Central and Southern Asia 69.7 64.6 74.8
Central Asia 44.4 43.3 45.6
Southern Asia 70.7 65.5 75.8
Eastern and South-Eastern Asia 73.1 70.9 75.4
Eastern Asia 82.4 79.2 85.5
South-Eastern Asia 47.6 48.7 46.3
Latin America and the Caribbean 55.1 52.0 58.6
Oceania 99.5 99.2 99.7
Australia and New Zealand 99.5 99.2 99.7
Europe and Northern America 88.9 87.9 89.9
Europe 86.5 85.4 87.8
Northern America 93.8 93.4 94.2
Landlocked developing countries 38.9 34.7 43.4

[E/2019/68]
81
Last editted on 23/06/2019 11:43 PM
Regions 2017
Total Female Male
Least developed countries 37.1 30.5 44.0
Small island developing States 60.3 58.0 62.8
Source: World Development Indicators database, the World Bank.
Target 8.a
Increase Aid for Trade support for developing countries, in particular least developed
countries, including through the Enhanced Integrated Framework for Trade-related
Technical Assistance to Least developed countries.
Indicator 8.a.1
Aid for trade commitments and disbursements
(a) Total official development assistance for trade, commitments
(Millions of constant 2017 United States dollars)
Regions 2006 2010 2015 2017
World 25,541.4 40,599.1 56,268.7 57,783.8
Sub-Saharan Africa 5,740.0 10,888.0 13,806.7 15,393.4
Northern Africa 1,562.4 3,644.5 3,478.8 3,781.7
Western Asia 3,690.5 2,918.1 4,037.6 4,213.8
Central Asia 252.3 1,002.5 1,066.3 1,125.6
Southern Asia 4,315.4 7,113.2 9,525.0 11,489.1
Eastern Asia 689.6 846.4 941.3 441.4
South-Eastern Asia 2,565.5 3,492.0 10,939.5 6,368.5
Latin America and the Caribbean 1,439.2 2,645.2 3,810.9 4,230.4
Oceania 3,333.0 372.6 821.9 718.7
Europe 964.2 1,385.9 1,244.8 1,450.1
Landlocked developing countries 4,809.3 8,085.5 9,066.7 9,372.2
Least developed countries 6,776.0 12,578.5 17,984.5 18,787.2
Small island developing States 667.4 1,160.7 1,800.1 1,661.3
Residual/Unallocated ODA 3,968.7 6,256.4 6,499.5 8,437.0
Note: Only the country-specific ODA are included in the regional aggregations. Unallocated ODA to multiple countries/regions are
presented in “Residual/Unallocated ODA” row.
Source: Creditor Reporting System (CRS) database, 2019, The Organisation for Economic Co-operation and Development (OECD).
(b) Total official development assistance for trade, disbursements
(Millions of constant 2017 United States dollars)
Regions 2006 2010 2015 2017
World 19,571.7 30,288.0 40,864.2 43,066.9
Sub-Saharan Africa 4,290.8 6,862.1 10,074.8 9,974.2
Northern Africa 1,114.0 2,271.1 2,568.1 3,408.1
Western Asia 4,036.8 2,414.9 3,862.9 4,069.6
Central Asia 177.8 377.4 688.7 811.0
Southern Asia 2,757.8 5,313.3 7,665.6 8,169.5
Eastern Asia 730.2 583.7 539.2 585.4
South-Eastern Asia 2,413.7 3,374.5 4,611.9 4,752.8
Latin America and the Caribbean 966.4 2,363.5 2,612.3 2,813.3
Oceania 151.5 290.3 480.9 511.2

[E/2019/68]
Regions 2006 2010 2015 2017
Europe 674.9 913.2 1,305.0 1,213.3
Landlocked developing countries 3,342.7 5,831.4 6,369.9 7,214.5
Least developed countries 4,917.0 8,589.1 10,775.9 12,175.5
Small island developing States 394.6 1,120.7 1,101.9 1,056.3
Residual/Unallocated ODA 2,249.5 5,477.3 6,327.4 6,680.7
Note: Only the country-specific ODA are included in the regional aggregations. Unallocated ODA to multiple countries/regions are
presented in “Residual/Unallocated ODA” row.
Source: Creditor Reporting System (CRS) database, 2019, The Organisation for Economic Co-operation and Development (OECD).

[E/2019/68]
83
Last editted on 23/06/2019 11:43 PM
Goal 9 Build resilient infrastructure, promote inclusive and sustainable industrialization and foster innovation
Target 9.1
Develop quality, reliable, sustainable and resilient infrastructure, including regional and
trans-border infrastructure, to support economic development and human well-being,
with a focus on affordable and equitable access for all
Indicator 9.1.2
Passenger and freight volumes, by mode of transport
(a) Passenger volume, by mode of transport
(Millions of passenger-kilometres)
Regions 2017
Air Rail Road
World 7,699,420.2 5,567,451.6 22,908,332.8
Sub-Saharan Africa 102,923.3 30,720.2 1,141,897.6
Northern Africa and Western Asia 950,301.0 50,185.7 1,884,381.0
Northern Africa 58,707.5 2,924.7 719,376.3
Western Asia 891,593.5 47,261.0 1,165,004.8
Central and Southern Asia 286,030.7 944,283.8 3,390,472.5
Central Asia 24,209.8 1,123.0 205,191.9
Southern Asia 261,820.9 943,160.8 3,185,280.6
Eastern and South-Eastern Asia 2,144,841.3 3,632,296.9 6,162,727.3
Eastern Asia 1,539,597.5 1,902,246.5 5,394,947.8
South-Eastern Asia 605,243.8 1,730,050.4 767,779.5
Latin America and the Caribbean 395,113.5 57,483.4 3,186,080.8
Oceania 197,725.8 28,975.6 147,073.2
Australia and New Zealand 189,630.3 27,066.0 117,209.0
Oceania (exc. Australia and New Zealand) 8,095.5 1,909.6 29,864.3
Europe and Northern America 3,622,484.6 823,505.9 6,995,700.3
Europe 1,853,740.1 736,372.2 5,117,673.2
Northern America 1,768,744.5 87,133.8 1,878,027.2
Landlocked developing countries 74,926.8 42,831.1 606,516.2
Least developed countries 60,625.0 155,099.3 954,480.1
Small island developing States 160,994.1 126,993.5 451,465.5
Source: International Civil Aviation Organisation (ICAO); the International Transport Forum at the OECD (ITF-OECD).

[E/2019/68]
(b) Freight volumes, by mode of transport
(Millions of freight tonnes-kilometres)
2017
Air Rail Road
World 223,729.5 10,679,522.0 21,539,785.9
Sub-Saharan Africa 3,619.4 165,817.5 396,071.8
Northern Africa and Western Asia 36,711.1 58,881.7 686,803.4
Northern Africa 548.1 21,262.1 106,381.0
Western Asia 36,163.0 37,619.7 580,422.4
Central and Southern Asia 3,519.1 991,029.2 3,113,056.1
Central Asia 186.0 293,061.5 238,422.8
Southern Asia 3,333.1 697,967.7 2,874,633.3
Eastern and South-Eastern Asia 79,903.1 2,662,626.3 8,425,705.5
Eastern Asia 66,834.5 2,617,437.8 7,601,716.5
South-Eastern Asia 13,068.6 45,188.4 823,989.0
Latin America and the Caribbean 5,981.2 513,746.9 1,917,483.7
Oceania 3,465.3 429,160.2 283,429.7
Australia and New Zealand 3,318.5 429,160.2 278,893.8
Oceania (exc. Australia and New Zealand) 146.8 0.0 4,535.8
Europe and Northern America 90,530.3 5,858,260.2 6,717,235.6
Europe 46,097.8 2,812,485.9 3,222,571.1
Northern America 44,432.5 3,045,774.3 3,494,664.5
Landlocked developing countries 3,148.3 340,210.5 416,379.3
Least developed countries 2,367.0 35,287.1 205,048.4
Small island developing States 7,479.9 1,229.4 50,267.5
Source: International Civil Aviation Organisation (ICAO); the International Transport Forum at the OECD (ITF -OECD).
Target 9.2
Promote inclusive and sustainable industrialization and, by 2030, significantly raise
industry’s share of employment and gross domestic product, in line with national
circumstances, and double its share in Least developed countries
Indicator 9.2.1
Manufacturing value added as a proportion of GDP and per capita
(a) Manufacturing value added share in GDP at constant 2010 United States dollars
(Percentage)
Regions 2000 2005 2010 2015 2018
World 15.3 15.5 15.9 16.2 16.5
Sub-Saharan Africa 11.2 10.1 9.6 10.2 10.1
Northern Africa and Western Asia 10.8 10.9 11.2 11.5 11.7
Northern Africa 11.9 11.1 11.3 11.4 11.0
Western Asia 10.5 10.8 11.1 11.5 11.8
Central and Southern Asia 13.6 14.3 15.3 15.8 16.1
Central Asia 17.9 15.9 15.7 15.5 15.2
Southern Asia 13.3 14.2 15.3 15.8 16.2
Eastern and South-Eastern Asia 22.0 23.3 25.6 26.2 26.5
Eastern Asia 21.7 23.2 26.0 26.9 27.1

[E/2019/68]
85
Last editted on 23/06/2019 11:43 PM
Regions 2000 2005 2010 2015 2018
South-Eastern Asia 23.6 23.9 22.7 22.0 22.0
Latin America and the Caribbean 16.0 15.7 14.3 13.1 12.8
Oceania 9.8 8.9 7.7 6.4 6.3
Australia and New Zealand 9.8 9.0 7.8 6.4 6.3
Oceania (exc. Australia and New Zealand) 7.4 7.5 6.6 6.2 5.3
Europe and Northern America 13.8 13.4 13.0 13.0 13.0
Europe 14.5 14.2 13.8 14.3 14.6
Northern America 12.9 12.5 12.0 11.4 11.2
Landlocked developing countries 13.7 12.5 11.5 11.5 11.3
Least developed countries 10.6 10.4 10.5 11.8 12.7
Small island developing States 22.7 22.7 21.3 19.2 18.4
Source: UNIDO MVA 2019 Database, United Nations Industrial Development Organisation (UNIDO).
(b) Manufacturing value added per capita at constant 2010 United States dollars
(Constant 2010 United States dollars)
Regions 2000 2005 2010 2015 2018
World 1,250.8 1,377.1 1,509.0 1,662.6 1,778.2
Sub-Saharan Africa 129.9 138.1 147.2 169.0 164.5
Northern Africa and Western Asia 664.8 761.8 811.6 935.9 986.7
Northern Africa 306.1 332.0 358.0 347.0 357.3
Western Asia 945.9 1,088.8 1,208.9 1,448.4 1,535.1
Central and Southern Asia 130.5 171.7 237.6 296.9 351.8
Central Asia 333.3 426.4 549.7 670.4 706.2
Southern Asia 122.7 162.2 226.0 282.8 338.3
Eastern and South-Eastern Asia 1,051.6 1,320.4 1,784.1 2,214.2 2,510.8
Eastern Asia 1,233.3 1,566.4 2,175.6 2,742.3 3,125.9
South-Eastern Asia 535.4 649.2 753.4 873.2 981.3
Latin America and the Caribbean 1,192.2 1,247.6 1,279.3 1,229.1 1,160.7
Oceania 3,471.0 3,492.0 3,151.2 2,748.9 2,799.5
Australia and New Zealand 4,577.0 4,654.2 4,220.8 3,694.1 3,794.3
Oceania (exc. Australia and New Zealand) 256.3 264.9 244.2 244.8 207.7
Europe and Northern America 4,081.9 4,403.5 4,372.2 4,658.7 4,938.5
Europe 3,344.2 3,652.9 3,696.7 4,059.5 4,373.2
Northern America 5,796.1 6,076.2 5,823.8 5,905.0 6,091.7
Landlocked developing countries 108.2 125.2 147.7 172.4 178.0
Least developed countries 50.7 59.8 78.5 99.8 113.5
Small island developing States 1,647.3 1,849.1 1,987.9 1,948.7 1,904.1
Source: UNIDO MVA 2019 Database, United Nations Industrial Development Organisation (UNIDO).

[E/2019/68]
Indicator 9.2.2
Manufacturing employment as a proportion of total employment
Manufacturing employment as a proportion of total employment
(Percentage)
Regions 2000 2005 2010 2015 2018
World 15.3 15.0 14.6 14.7 14.2
Sub-Saharan Africa 6.8 6.5 6.3 6.2 6.2
Northern Africa and Western Asia 11.8 11.8 11.6 11.4 11.1
Northern Africa 11.8 11.3 11.6 11.0 11.2
Western Asia 11.8 12.3 11.6 11.6 11.1
Central and Southern Asia 10.8 12.1 11.6 12.5 12.1
Central Asia 10.2 10.0 9.7 9.2 9.1
Southern Asia 10.9 12.1 11.7 12.6 12.2
Eastern and South-Eastern Asia 18.7 18.9 19.4 20.0 19.4
Eastern Asia 20.6 20.7 21.6 22.2 21.4
South-Eastern Asia 12.0 12.6 12.5 13.6 13.9
Latin America and the Caribbean 14.5 13.9 13.0 12.6 12.2
Oceania 10.5 9.3 8.2 7.6 6.6
Australia and New Zealand 12.7 11.0 9.4 8.7 7.6
Oceania (exc. Australia and New Zealand) 3.0 3.1 3.3 2.8 2.7
Europe and Northern America 18.1 16.2 14.0 13.6 13.3
Europe 19.6 18.0 15.4 15.0 14.8
Northern America 15.2 12.6 10.9 10.8 10.3
Landlocked developing countries 6.3 6.3 6.4 6.4 6.4
Least developed countries 5.7 6.4 7.0 7.4 7.4
Small island developing States 10.8 10.0 9.1 8.0 7.9
Source: ILO modelled estimates, November 2018, ILO Database of Labour Statistics (ILOSTAT), International Labour Organisation
(ILO).
Target 9.4
By 2030, upgrade infrastructure and retrofit industries to make them sustainable, with
increased resource-use efficiency and greater adoption of clean and environmentally
sound technologies and industrial processes, with all countries taking action in
accordance with their respective capabilities
Indicator 9.4.1
CO2 emission per unit of value added
(a) Total CO2 emissions - Fuel Combustion1
(Millions of tonnes of CO2 – MtCO2)
Regions 2000 2005 2010 2015 2016
World 23,223 27,070 30,490 32,276 32,314
Sub-Saharan Africa 408 524 591 673 683
Northern Africa and Western Asia 1,116 1,383 1,775 2,096 2,132
Northern Africa 251 334 405 468 475
Western Asia 865 1,050 1,370 1,627 1,657
Central and Southern Asia 1,595 1,973 2,659 3,223 3,295

[E/2019/68]
87
Last editted on 23/06/2019 11:43 PM
Regions 2000 2005 2010 2015 2016
Central Asia 269 319 384 397 398
Southern Asia 1,326 1,653 2,275 2,826 2,896
Eastern and South-Eastern Asia 5,473 8,042 10,606 12,216 12,217
Eastern Asia 4,776 7,156 9,552 10,921 10,881
South-Eastern Asia 697 886 1,054 1,295 1,336
Latin America and the Caribbean 1,189 1,323 1,529 1,661 1,630
Oceania 371 416 430 425 438
Australia and New Zealand 364 406 419 410 423
Oceania (exc. Australia and New Zealand) 7 11 10 15 15
Europe and Northern America 11,999 12,154 11,515 10,529 10,413
Europe 5,753 5,911 5,633 5,068 5,039
Northern America 6,246 6,243 5,882 5,461 5,374
Landlocked developing countries 360 418 486 530 538
Least developed countries 88 125 175 242 269
Small island developing States 118 121 134 135 133 1CO2 Fuel Combustion represents total CO2 emissions from fuel combustion.
Source: CO2 emissions from fuel combustion, 2018. International Energy Agency (IEA).
(b) CO2 emission per GDP, PPP
(Kilogrammes of CO2 per constant 2010 United States dollars)
Regions 2000 2005 2010 2015 2016
World 0.38 0.37 0.35 0.31 0.30
Sub-Saharan Africa 0.27 0.26 0.23 0.20 0.20
Northern Africa and Western Asia 0.26 0.26 0.27 0.26 0.26
Northern Africa 0.21 0.22 0.21 0.23 0.22
Western Asia 0.28 0.27 0.29 0.27 0.27
Central and Southern Asia 0.36 0.33 0.31 0.29 0.28
Central Asia 1.09 0.86 0.74 0.57 0.55
Southern Asia 0.31 0.29 0.29 0.27 0.26
Eastern and South-Eastern Asia 0.42 0.46 0.44 0.38 0.37
Eastern Asia 0.47 0.53 0.50 0.43 0.41
South-Eastern Asia 0.23 0.23 0.21 0.20 0.20
Latin America and the Caribbean 0.21 0.20 0.19 0.19 0.19
Oceania 0.45 0.42 0.38 0.33 0.33
Australia and New Zealand 0.46 0.43 0.39 0.33 0.33
Oceania (exc. Australia and New Zealand) 0.23 0.30 0.24 0.28 0.28
Europe and Northern America 0.39 0.34 0.31 0.26 0.25
Europe 0.33 0.30 0.27 0.23 0.22
Northern America 0.45 0.40 0.36 0.30 0.29
Landlocked developing countries 0.66 0.55 0.45 0.36 0.36
Least developed countries 0.11 0.11 0.11 0.12 0.13
Small island developing States 0.25 0.21 0.17 0.15 0.14
Note: Regional estimates are calculated using CO2 Fuel Combustion emissions (CO2FCOMB) and GDP calculated using purchasing
power parities.
Source: CO2 emissions from fuel combustion, 2018. International Energy Agency (IEA).

[E/2019/68]
(c) CO2 emission per unit of manufacturing value added
(Kilogrammes of CO2 per constant 2010 United States dollars)
Regions 2000 2005 2010 2015 2016
World 0.49 0.53 0.56 0.49 0.47
Sub-Saharan Africa 0.65 0.62 0.55 0.48 0.47
Northern Africa and Western Asia 1.04 0.94 0.96 0.82 0.78
Northern Africa 0.92 1.00 0.77 0.63 0.63
Western Asia 1.07 0.93 1.01 0.86 0.81
Central and Southern Asia 1.49 1.36 1.46 1.27 1.23
Central Asia 1.90 2.05 1.91 1.23 1.19
Southern Asia 1.45 1.30 1.41 1.28 1.23
Eastern and South-Eastern Asia 0.65 0.88 0.84 0.69 0.64
Eastern Asia 0.67 0.93 0.88 0.72 0.66
South-Eastern Asia 0.51 0.54 0.52 0.47 0.44
Latin America and the Caribbean 0.41 0.39 0.41 0.37 0.35
Oceania 0.45 0.39 0.34 0.37 0.34
Australia and New Zealand 0.44 0.38 0.33 0.35 0.32
Oceania (exc. Australia and New Zealand) 1.11 1.12 0.97 1.23 1.22
Europe and Northern America 0.34 0.27 0.25 0.20 0.20
Europe 0.34 0.29 0.25 0.20 0.20
Northern America 0.35 0.26 0.25 0.21 0.21
Landlocked developing countries 1.58 1.62 1.54 1.07 1.04
Least developed countries 0.53 0.48 0.48 0.47 0.40
Small island developing States 0.43 0.35 0.39 0.37 0.36
Source: UNIDO MVA 2019 Database and IEA CO2 Emissions from Fuel Combustion Statistics 2018, United Nations Industrial
Development Organisation (UNIDO) and International Energy Agency (IEA).
Target 9.5
Enhance scientific research, upgrade the technological capabilities of industrial sectors in
all countries, in particular developing countries, including, by 2030, encouraging
innovation and substantially increasing the number of research and development workers
per 1 million people and public and private research and development spending
Indicator 9.5.1
Research and development (R&D) expenditure as a proportion of GDP
Research and development (R&D) expenditure as a proportion of GDP
(Percentage)
Regions 2000 2005 2010 2015 2016
World 1.52 1.53 1.62 1.69 1.68
Sub-Saharan Africa 0.37 0.40 0.39 0.41 0.42
Northern Africa and Western Asia 0.58 0.60 0.66 0.76 0.77
Northern Africa 0.29 0.32 0.45 0.61 0.61
Western Asia 0.70 0.71 0.74 0.81 0.83
Central and Southern Asia 0.57 0.67 0.67 0.52 0.52
Central Asia 0.22 0.26 0.16 0.18 0.16
Southern Asia 0.59 0.69 0.70 0.55 0.55
Eastern and South-Eastern Asia 1.51 1.68 1.83 2.06 2.07
Eastern Asia 1.85 2.04 2.17 2.41 2.42

[E/2019/68]
89
Last editted on 23/06/2019 11:43 PM
Regions 2000 2005 2010 2015 2016
South-Eastern Asia 0.56 0.64 0.75 0.85 0.87
Latin America and the Caribbean 0.53 0.55 0.66 0.72 0.66
Oceania 1.46 1.84 2.16 1.77 1.77
Australia and New Zealand 1.50 1.90 2.23 1.84 1.84
Europe and Northern America 2.05 2.00 2.17 2.22 2.21
Europe 1.60 1.59 1.75 1.85 1.83
Northern America 2.56 2.46 2.66 2.65 2.65
Landlocked developing countries 0.24 0.24 0.22 0.24 0.24
Least developed countries 0.20 0.19 0.22 0.24 0.23
Small island developing States 0.80 0.96 0.98 1.07 1.03
Source: UNESCO Institute for Statistics (UIS).
Indicator 9.5.2
Researchers (in full-time equivalent) per million inhabitants
Researchers (in full-time equivalent) per million inhabitants
Regions 2000 2005 2010 2015 2016
World 804.3 903.3 1,017.7 1,151.0 1,162.7
Sub-Saharan Africa 63.0 71.2 80.6 90.6 91.5
Northern Africa and Western Asia 535.1 555.7 618.6 803.4 830.8
Northern Africa 469.3 469.3 497.7 688.3 716.8
Western Asia 596.4 634.7 724.8 903.8 930.3
Central and Southern Asia 130.9 151.6 175.7 232.7 232.1
Central Asia 457.2 469.6 398.6 510.8 490.9
Southern Asia 118.4 139.8 167.4 222.2 222.3
Eastern and South-Eastern Asia 691.6 877.9 1,141.4 1,384.3 1,426.5
Eastern Asia 842.7 1,087.3 1,397.8 1,687.2 1,733.9
South-Eastern Asia 279.5 328.9 491.2 642.5 678.8
Latin America and the Caribbean 280.4 358.8 426.1 493.1 502.2
Oceania 2,465.2 2,938.5 3,228.9 3,250.4 3,246.1
Australia and New Zealand 3,294.8 3,982.2 4,402.1 4,460.4 4,460.6
Europe and Northern America 2,768.9 3,054.4 3,292.4 3,646.2 3,661.6
Europe 2,459.5 2,729.2 2,982.5 3,314.5 3,335.3
Northern America 3,488.0 3,779.2 3,958.5 4,336.2 4,336.3
Landlocked developing countries 140.1 139.2 132.3 152.2 146.4
Least developed countries 42.5 47.6 56.3 62.6 63.2
Small island developing States 494.7 605.1 718.7 807.6 839.4
Source: UNESCO Institute for Statistics (UIS).

[E/2019/68]
Target 9.a
Facilitate sustainable and resilient infrastructure development in developing countries
through enhanced financial, technological and technical support to African countries,
least developed countries, landlocked developing countries and small island developing
States
Indicator 9.a.1
Total official international support (official development assistance plus other official
flows) to infrastructure
Total official flows (gross disbursements) for infrastructure
(Millions of constant 2017 United States dollars)
Regions 20001 2005 2010 2015 2017
Total official flows 22,869.9 16,844.3 44,425.6 58,391.4 58,924.5
Sub-Saharan Africa 3,024.5 2,949.2 5,641.8 8,693.0 9,286.3
Northern Africa 1,097.7 1,038.6 3,563.9 3,712.2 5,124.3
Western Asia 2,385.9 2,960.9 6,177.7 6,840.3 6,479.9
Central Asia 397.4 159.6 1,386.3 1,488.3 1,248.4
Southern Asia 4,433.7 3,345.6 8,261.2 9,267.5 11,597.0
Eastern Asia 2,402.3 1,370.9 2,437.3 2,556.7 2,812.1
South-Eastern Asia 3,383.8 1,925.4 3,503.1 9,916.1 6,547.9
Latin America and the Caribbean 3,264.6 1,445.8 6,601.7 8,301.3 8,518.0
Oceania 256.9 136.8 240.8 703.5 583.0
Europe 805.0 720.9 3,068.3 3,009.3 2,169.8
Landlocked developing countries 2,128.2 2,288.9 5,283.9 5,751.8 6,887.7
Least developed countries 3,484.6 3,412.9 5,703.9 7,814.2 9,690.8
Small island developing States 634.7 298.7 1,158.2 1,634.4 1,111.5
Residual/Unallocated ODA 1,417.9 790.6 3,543.5 3,903.1 4,557.9 1Based on commitments.
Note (1): Total official flows include Official Development Assistance (ODA) and Other Official Flows (OOF).
Note (2): Only the country-specific ODA are included in the regional aggregations. Unallocated ODA to multiple countries/regions
are presented in “Residual/Unallocated ODA” row.
Source: Creditor Reporting System (CRS) database, 2019, The Organisation for Economic Co-operation and Development (OECD).
Target 9.b
Support domestic technology development, research and innovation in developing
countries, including by ensuring a conducive policy environment for, inter alia, industrial
diversification and value addition to commodities
Indicator 9.b.1
Proportion of medium and high-tech industry value added in total value added
Proportion of medium and high-tech industry value added in total value added
(Percentage)
Regions 2000 2005 2010 2015 2016
World 40.5 42.1 43.7 44.5 44.7
Sub-Saharan Africa 18.5 18.5 16.8 14.9 14.9
Northern Africa and Western Asia 29.3 30.6 32.2 34.5 34.8
Northern Africa 24.7 23.4 22.9 25.2 26.3

[E/2019/68]
91
Last editted on 23/06/2019 11:43 PM
Regions 2000 2005 2010 2015 2016
Western Asia 30.6 32.5 34.4 36.3 36.4
Central and Southern Asia 29.4 30.2 34.8 34.1 34.2
Central Asia 6.9 7.0 7.6 8.5 7.7
Southern Asia 31.2 31.9 36.4 35.5 35.6
Eastern and South-Eastern Asia 46.7 47.6 47.6 47.3 47.7
Eastern Asia 48.4 48.9 48.3 47.7 48.2
South-Eastern Asia 39.3 41.6 43.8 44.5 44.7
Latin America and the Caribbean 27.3 30.1 31.9 30.9 30.5
Oceania 24.9 25.7 26.7 25.5 25.7
Australia and New Zealand 25.3 26.1 26.8 25.9 26.1
Oceania (exc. Australia and New Zealand) 1.5 1.7 7.9 1.9 1.9
Europe and Northern America 41.6 43.3 45.7 47.5 47.4
Europe 42.2 43.5 45.3 47.2 47.4
Northern America 40.7 43.1 46.1 48.0 47.5
Landlocked developing countries 18.3 8.7 9.9 10.5 9.9
Least developed countries 7.9 8.0 9.1 9.6 10.4
Small island developing States 54.7 56.8 60.8 58.5 59.0
Source: Estimates based on the INDSTAT 2, ISIC Revision 3 database, United Nations Industrial Development Organisation
(UNIDO).
Target 9.c
Significantly increase access to information and communications technology and strive to
provide universal and affordable access to the Internet in Least developed countries by
2020
Indicator 9.c.1
Proportion of population covered by a mobile network, by technology
(a) Proportion of the population covered by at least a 2G mobile network
(Percentage)
Regions 2000 2005 2010 2015 2017
World 56.8 73.5 87.7 94.9 95.8
Sub-Saharan Africa 24.8 51.8 69.8 86.6 84.6
Northern Africa and Western Asia 62.4 82.3 94.2 96.1 97.6
Northern Africa 66.4 74.1 94.0 96.4 97.1
Western Asia 60.2 89.6 94.4 95.8 98.2
Central and Southern Asia 21.7 39.2 79.5 94.0 96.1
Central Asia 30.0 60.6 86.9 89.8 96.7
Southern Asia 21.7 38.4 79.2 94.2 96.1
Eastern and South-Eastern Asia 60.9 90.8 92.1 97.7 98.9
Eastern Asia 55.9 93.4 98.0 99.5 99.5
South-Eastern Asia 84.3 81.3 76.0 93.0 97.3
Latin America and the Caribbean 81.2 89.2 95.1 93.0 95.0
Oceania 92.0 95.8 97.4 96.2 96.6
Australia and New Zealand 95.8 98.0 98.7 98.8 99.2
Oceania (exc. Australia and New Zealand) 36.4 62.6 78.3 89.3 90.1
Europe and Northern America 96.1 98.7 99.5 98.3 98.6

[E/2019/68]
Regions 2000 2005 2010 2015 2017
Europe 94.9 98.6 99.4 97.5 98.0
Northern America 98.1 98.8 99.7 99.8 99.8
Landlocked developing countries 31.1 45.4 60.5 88.9 88.2
Least developed countries 24.9 51.8 64.1 86.8 84.7
Small island developing States 57.8 80.7 85.8 89.8 88.7
Source: Data based on the World Telecommunication/ICT Indicators Database, 2018, International Telecommunication Union (ITU).
(b) Proportion of the population covered by at least a 3G mobile network
(Percentage)
Regions 2010 2015 2017
World 41.6 78.7 87.8
Sub-Saharan Africa 21.6 51.3 60.5
Northern Africa and Western Asia 50.2 80.6 90.2
Northern Africa 66.8 75.4 87.0
Western Asia 34.4 85.2 92.9
Central and Southern Asia … 68.6 84.8
Central Asia … 54.5 80.2
Southern Asia … 69.2 84.9
Eastern and South-Eastern Asia 77.8 89.1 97.1
Eastern Asia 95.7 95.6 98.2
South-Eastern Asia 67.7 72.2 94.2
Latin America and the Caribbean 64.9 86.7 91.1
Oceania 97.2 87.9 90.2
Australia and New Zealand 98.7 98.8 99.2
Oceania (exc. Australia and New Zealand) 24.8 59.7 67.2
Europe and Northern America 85.9 93.2 96.1
Europe 78.6 90.0 94.2
Northern America 98.4 99.8 99.8
Landlocked developing countries 26.8 49.7 59.9
Least developed countries 22.9 53.7 64.2
Small island developing States 76.8 62.4 72.0
Source: Data based on the World Telecommunication/ICT Indicators Database, 2018, International Telecommunication Union (ITU).
(c) Proportion of the population covered by at least a 4G mobile network
(Percentage)
Regions 2015 2017
World 44.4 76.1
Sub-Saharan Africa 15.8 27.5
Northern Africa and Western Asia 17.9 58.0
Northern Africa 7.0 56.7
Western Asia 27.3 59.2
Central and Southern Asia 12.0 79.3
Central Asia 31.1 57.8
Southern Asia 11.3 80.2
Eastern and South-Eastern Asia 66.0 92.8
Eastern Asia 85.5 96.5
South-Eastern Asia 15.7 83.6
Latin America and the Caribbean 57.8 74.1

[E/2019/68]
93
Last editted on 23/06/2019 11:43 PM
Regions 2015 2017
Oceania 75.8 85.2
Australia and New Zealand 93.0 98.2
Oceania (exc. Australia and New Zealand) 31.4 52.0
Europe and Northern America 83.9 89.5
Europe 76.4 84.5
Northern America 99.4 99.7
Landlocked developing countries 12.4 25.0
Least developed countries 15.5 23.7
Small island developing States 34.6 51.4
Source: Data based on the World Telecommunication/ICT Indicators Database, 2018, International Telecommunication Union (ITU).

[E/2019/68]
Goal 10 Reduce inequality within and among countries
Target 10.4
Adopt policies, especially fiscal, wage and social protection policies, and progressively
achieve greater equality
Indicator 10.4.1
Labour share of GDP, comprising wages and social protection transfers
Labour share of GDP
(Percentage)
Regions 2005 2010 2015 2017
World 53.1 52.2 51.8 51.4
Sub-Saharan Africa 50.9 50.7 52.7 52.5
Northern Africa and Western Asia 34.5 34.2 35.8 36.3
Northern Africa 40.5 38.8 40.3 39.7
Central and Southern Asia 49.7 50.0 46.3 45.8
Southern Asia 49.9 50.2 46.5 46.1
Latin America and the Caribbean 48.3 49.0 51.1 50.5
Europe and Northern America 58.9 59.0 57.9 57.6
Europe 57.6 58.7 56.7 56.6
Northern America 60.7 59.4 59.3 58.8
Source: ILO modelled estimates, June 2019, ILO Database of Labour Statistics (ILOSTAT), International Labour Organisation (ILO).
Target 10.6
Ensure enhanced representation and voice for developing countries in decision-making in
global international economic and financial institutions in order to deliver more effective,
credible, accountable and legitimate institutions
Indicator 10.6.1
Proportion of members and voting rights of developing countries in international organisations
(a) Proportion of developing countries in the membership of international organisations
(Percentage)
International Organisations 2000 2005 2010 2015 2018
African Development Bank 77.9 77.9 77.9 77.5 ...
Asian Development Bank 69.5 68.8 68.7 68.7 ...
Financial Stability Board ... ... 50.0 50.0 50.0
Inter-American Development Bank 58.7 59.6 60.4 60.4 ...
International Bank for Reconstruction and Development 75.3 75.0 74.3 74.5 74.6
International Finance Corporation 74.9 74.7 74.2 74.5 74.5
International Monetary Fund 74.7 74.6 74.2 74.5 74.6
UN Economic and Social Council 63.0 68.5 64.8 64.8 66.7
UN General Assembly 74.6 74.3 74.0 74.1 74.1
UN Security Council 53.3 46.7 53.3 53.3 ...
World Trade Organisation 72.1 71.1 71.2 71.3 72.0
Note: There is no established convention for the designation of "developed" and "developing" countries or areas in the United Natio ns

[E/2019/68]
95
Last editted on 23/06/2019 11:43 PM
system. In common practice, Japan in Asia, Canada and the United States in northern America, Australia and New Zealand in
Oceania, and Europe with Israel and Cyprus are considered "developed" regions or areas. Until a definition of developing countries is
agreed, aggregated data for this indicator will provisionally include all countries located in "developing regions" for the p urposes of
monitoring indicators related to "developing countries".
Source: Data compiled by the Financing for Development Office (FFDO), Department of Economic and Social Affairs, United Nations
(b) Proportion of developing countries in the voting rights at international organisations
(Percentage)
International Organisations 2000 2005 2010 2015 2018
African Development Bank 62.7 63.4 63.9 62.8 ...
Asian Development Bank 58.3 57.9 53.8 58.1 ...
Financial Stability Board ... ... 38.5 43.9 43.9
Inter-American Development Bank 50.1 50.1 50.1 50.1 ...
International Bank for Reconstruction and Development 38.2 38.1 38.1 38.1 39.7
International Finance Corporation 30.1 30.1 30.1 32.2 32.1
International Monetary Fund 31.3 32.1 33.4 35.2 37.7
UN Economic and Social Council 63.0 68.5 64.8 64.8 66.7
UN General Assembly 74.6 74.3 74.0 74.1 74.1
UN Security Council 53.3 46.7 53.3 53.3 ...
World Trade Organisation 72.1 71.1 71.2 71.3 72.0
Note: There is no established convention for the designation of "developed" and "developing" countries or areas in the United Natio ns
system. In common practice, Japan in Asia, Canada and the United States in northern America, Australia and New Zealand in
Oceania, and Europe with Israel and Cyprus are considered "developed" regions or areas. Until a definition of developing countries is
agreed, aggregated data for this indicator will provisionally include all countries located in "developing regions" for th e purposes of
monitoring indicators related to "developing countries".
Source: Data compiled by the Financing for Development Office (FFDO), Department of Economic and Social Affairs, United
Nations.
Target 10.a
Implement the principle of special and differential treatment for developing countries, in
particular least developed countries, in accordance with World Trade Organisation
agreements
Indicator 10.a.1
Proportion of tariff lines applied to imports from Least developed countries and developing
countries with zero-tariff
Proportion of tariff lines applied to imports from Least developed countries and developing countries
with zero-tariff
(Percentage)
Regions Type of product 2005 2010 2015 2017
Least developed countries
All products 47.8 53.6 63.5 65.6
Agriculture products 57.6 64.1 68.7 73.3
Arms 29.4 25.0 40.4 53.1
Clothing 37.3 39.0 41.0 44.4
Industrial 48.5 55.6 71.9 74.4
Oil 69.8 84.1 91.5 90.6
Textiles 42.2 51.2 59.5 62.5
Developing countries All products 40.5 43.8 49.2 50.8
Agriculture products 45.6 46.6 50.3 53.1

[E/2019/68]
Regions Type of product 2005 2010 2015 2017
Arms 47.5 43.8 43.2 46.4
Clothing 23.9 27.7 32.5 36.0
Industrial 42.7 45.9 51.7 53.0
Oil 68.8 77.3 82.4 83.8
Textiles 28.3 34.4 40.2 42.8
Note: There is no established convention for the designation of "developed" and "developing" countries or areas in the United Natio ns
system. In common practice, Japan in Asia, Canada and the United States in northern America, Australia and New Zealand in
Oceania, and Europe with Israel and Cyprus are considered "developed" regions or areas. Until a definition of developing countries is
agreed, aggregated data for this indicator will provisionally include all countries located in "developing regions" for th e purposes of
monitoring indicators related to "developing countries".
Source: International Trade Centre (ITC), United Nations Conference on Trade and Development (UNCTAD) and World Trade
Organisation (WTO).

[E/2019/68]
97
Last editted on 23/06/2019 11:43 PM
Target 10.b
Encourage official development assistance and financial flows, including foreign direct
investment, to States where the need is greatest, least developed countries, African
countries, small island developing States and landlocked developing countries, in
accordance with their national plans and programmes
Indicator 10.b.1
Total resource flows for development, by recipient and donor countries and type of flow
(e.g. official development assistance, foreign direct investment and other flows)
Total resource flows (net disbursements) for development
(Millions of current United States dollars)
Regions 2000 2005 2010 2015 2017
Total resource flows 134,019.8 290,067.1 524,264.8 320,354.2 413,963.7
Sub-Saharan Africa 10,477.4 45,059.2 49,041.0 71,258.1 61,958.0
Northern Africa 4,475.1 8,480.9 14,091.4 18,478.3 12,257.4
Western Asia 12,419.3 41,484.6 24,328.9 35,099.2 39,236.4
Central Asia 1,789.6 2,517.8 2,673.0 9,151.2 -963.7
Southern Asia 4,191.6 23,071.8 40,312.4 25,616.5 38,174.4
Eastern Asia 1,145.5 23,674.0 50,709.0 18,858.3 37,513.1
South-Eastern Asia 4,524.7 27,468.1 31,743.9 31,405.7 31,080.8
Latin America and the Caribbean 43,346.6 56,917.1 97,500.8 97,371.4 56,816.5
Oceania 833.5 3,995.6 7,549.4 1,911.2 2,714.6
Europe 5,698.4 15,713.3 7,740.7 2,896.3 8,173.5
Landlocked developing countries 8,933.5 18,471.7 28,615.1 38,219.1 31,449.2
Least developed countries 13,115.4 25,372.1 46,302.2 48,470.9 55,369.3
Small island developing States 4,177.0 5,523.5 22,306.8 5,978.2 10,594.8
Residual/Unallocated ODA 45,118.1 41,684.6 198,574.4 8,308.1 127,002.7
Note: (1) Total resource flows include Official Development Assistance (ODA), Other Official Flows (OOF) and private flows.
(2) Only the country-specific aids are included in the regional aggregations. Unallocated aids to multiple countries/regions are
presented in “Residual/Unallocated aid” row.
Source: DAC Statistics database, 2019, The Organisation for Economic Co-operation and Development (OECD).
Target 10.c
By 2030, reduce to less than 3 per cent the transaction costs of migrant remittances and
eliminate remittance corridors with costs higher than 5 per cent
Indicator 10.c.1 Remittance costs as a proportion of the amount remitted
Remittance costs as a proportion of the amount remitted
(Percentage)
Regions 2011 2015 2018
World 9.3 7.5 6.9
Sub-Saharan Africa 12.4 9.8 9.0
Northern Africa and Western Asia 7.2 7.5 6.8
Central and Southern Asia 5.7 5.4 5.4
Eastern and South-Eastern Asia 8.4 7.4 6.9

[E/2019/68]
Regions 2011 2015 2018
Latin America and the Caribbean 7.7 6.3 5.9
Oceania (exc. Australia and New Zealand) 13.4 10.1 9.6
Europe and Northern America 7.8 6.6 6.7
Source: World Development Indicators database, the World Bank.

[E/2019/68]
99
Last editted on 23/06/2019 11:43 PM
Goal 11 Make cities and human settlements inclusive, safe, resilient and sustainable
Target 11.1
By 2030, ensure access for all to adequate, safe and affordable housing and basic services
and upgrade slums
Indicator 11.1.1
Proportion of urban population living in slums, informal settlements or inadequate housing
Proportion of urban population living in slums1
(Percentage)
Regions 2000 2014 2016 2018
World 28 23 23 24
Sub-Saharan Africa 65 56 56 56
Northern Africa and Western Asia 23 22 23 26
Central and Southern Asia 46 32 32 31
Eastern and South-Eastern Asia 38 28 28 27
Latin America and the Caribbean 29 21 21 21
Oceania (exc. Australia and New Zealand) 24 24 24 24
Australia and New Zealand 0.03 0.03 0.03 0.03
Europe and Northern America 0.1 0.1 0.1 0.1 1Represented by the urban population living in households with at least one of the following four characteristics: lack of acc ess to
improved drinking water; lack of access to improved sanitation; overcrowding (three or more persons per room); and dwellings made
of non-durable material.
Source: United Nations Human Settlements Programme (UN-Habitat).
Target 11.6
By 2030, reduce the adverse per capita environmental impact of cities, including by
paying special attention to air quality and municipal and other waste management
Indicator 11.6.1
Proportion of urban solid waste regularly collected and with adequate final discharge out of total
urban solid waste generated, by cities
Municipal Solid Waste collection coverage
(Percentage)
Regions 2017 2018
World 74.2 78.6
Sub-Saharan Africa 43.4 42.2
Northern Africa and Western Asia 73.5 77.2
Central and Southern Asia 66.7 74.7
Eastern and South-Eastern Asia 72.0 73.2
Latin America and the Caribbean 80.4 78.2
Oceania (exc. Australia and New Zealand) … 60.5
Australia and New Zealand 94.0 99.0
Europe and Northern America 89.6 95.1
Note: Municipal Solid Waste (MSW) collection coverage is defined as the amount MSW collected as a proportion of total MSW
generated.

[E/2019/68]
Source: United Nations Human Settlements Programme (UN-Habitat).
Indicator 11.6.2 Annual mean levels of fine particulate matter (e.g. PM2.5 and PM10) in cities (population weighted)
Mean annual concentration of fine suspended particles with a diameter of 2.5 microns or less (PM2.5), by
residence
(Micrograms per cubic meter)
Regions 2016
Urban All areas
World 39.6 38.5
Sub-Saharan Africa 35.5 36.1
Northern Africa and Western Asia 51.3 50.9
Northern Africa 55.2 55.4
Western Asia 47.8 46.9
Central and Southern Asia 62.8 60.4
Central Asia 25.5 22.4
Southern Asia 64.2 61.9
Eastern and South-Eastern Asia 39.6 38.3
Eastern Asia 46.7 45.1
South-Eastern Asia 21.8 21.2
Latin America and the Caribbean 16.8 15.8
Oceania 8.2 8.0
Australia and New Zealand 7.1 7.0
Oceania (exc. Australia and New Zealand) 11.3 10.8
Europe and Northern America 12.0 11.5
Europe 14.2 13.5
Northern America 7.5 7.3
Source: Global Health Observatory (GHO), World Health Organisation (WHO).

[E/2019/68]
101
Last editted on 23/06/2019 11:43 PM
Goal 12 Ensure sustainable consumption and production patterns
Target 12.1
Implement the 10-Year Framework of Programmes on Sustainable Consumption and
Production Patterns, all countries taking action, with developed countries taking the lead,
taking into account the development and capabilities of developing countries
Indicator 12.1.1
Number of countries with sustainable consumption and production (SCP) national action plans or
SCP mainstreamed as a priority or a target into national policies
Countries with sustainable consumption and production (SCP) national action plans or SCP
mainstreamed as a priority or target into national policies (Number)
Regions 2017
World 71
Sub-Saharan Africa 14
Northern Africa and Western Asia 9
Central and Southern Asia 5
Eastern and South-Eastern Asia 8
Latin America and the Caribbean 14
Europe and Northern America 21
Source: Environment Live database, United Nations Environment Programme (UNEP) and 10YFP Secretariat.
Target 12.2
By 2030, achieve the sustainable management and efficient use of natural resources
Indicator 12.2.1
Material footprint, material footprint per capita, and material footprint per GDP 1
(a) Material footprint
(Millions of tonnes)
Regions 2000 2005 2010 2015 2017
World 53,826.4 64,573.2 76,532.8 87,435.2 91,973.9
Source: Environment Live database, United Nations Environment Programme (UNEP); Global Material Flows Database,
International Resource Panel.
(b) Material footprint per capita
(Tonnes per capita)
Regions 2000 2005 2010 2015 2017
World 8.8 9.9 11.0 11.8 12.2
Source: Environment Live database, United Nations Environment Programme (UNEP); Global Material Flows Database,
International Resource Panel.
(c) Material footprint per unit of GDP
(Kilograms per unit of constant 2010 United States dollars)

[E/2019/68]
Regions 2000 2005 2010 2015 2017
World 1.08 1.12 1.16 1.16 1.16
Source: Environment Live database, United Nations Environment Programme (UNEP); Global Material Flows Database,
International Resource Panel. 1Material footprint (MF) is the attribution of global material extraction to final domestic demand of a country. It is calculated as the
raw material equivalent of imports plus domestic extraction minus raw material equivalents of exports.
Indicator 12.2.2
Domestic material consumption, domestic material consumption per capita, and domestic material
consumption per GDP1
(a) Domestic material consumption
(Millions of tonnes)
Regions 2000 2005 2010 2015 2017
World 53,032 63,395 75,456 83,979 88,180
Sub-Saharan Africa 2,455 3,006 3,637 3,945 4,172
Northern Africa and Western Asia 2,568 3,289 4,819 5,177 5,611
Northern Africa 963 1,192 1,851 1,662 1,815
Western Asia 1,651 2,152 3,032 3,581 3,865
Central and Southern Asia 5,999 7,115 8,806 10,576 11,181
Central Asia 530 675 793 941 996
Southern Asia 5,468 6,440 8,013 9,635 10,185
Eastern and South-Eastern Asia 17,356 23,349 33,397 39,528 42,480
Eastern Asia 14,246 19,371 28,352 34,414 37,016
South-Eastern Asia 3,063 3,923 4,981 5,047 5,395
Latin America and the Caribbean 4,625 5,209 6,092 6,538 6,820
Oceania 1,054 1,108 1,092 1,130 1,140
Australia and New Zealand 964 1,025 997 1,032 1,041
Europe and Northern America 18,976 20,319 17,613 17,086 16,776
Europe 9,618 10,566 9,726 9,702 9,685
Northern America 9,358 9,753 7,887 7,383 7,091
Landlocked developing countries 1,454 1,855 2,320 2,757 2,946
Least developed countries 1,699 … 3,096 3,162 3,421
Small island developing States … … 501 545 547
Source: Environment Live database, United Nations Environment Programme (UNEP); Global Material Flows Database,
International Resource Panel.
(b) Domestic material consumption per capita
(Tonnes)
Regions 2000 2005 2010 2015 2017
World 8.63 9.69 10.84 11.37 11.68
Sub-Saharan Africa 3.81 4.08 4.30 4.07 4.08
Northern Africa and Western Asia 7.29 8.49 11.22 10.93 11.43
Northern Africa 5.58 6.35 9.06 7.38 7.77
Western Asia 8.93 10.46 13.03 13.87 14.44
Central and Southern Asia 3.98 4.33 4.98 5.59 5.76
Central Asia 9.54 11.49 12.55 13.69 14.06
Southern Asia 3.76 4.07 4.70 5.28 5.45
Eastern and South-Eastern Asia 8.59 11.12 15.34 17.53 18.61
Eastern Asia 9.56 12.64 18.03 21.35 22.79

[E/2019/68]
103
Last editted on 23/06/2019 11:43 PM
Regions 2000 2005 2010 2015 2017
South-Eastern Asia 5.84 6.98 8.34 7.95 8.32
Latin America and the Caribbean 8.80 9.27 10.19 10.34 10.56
Oceania 33.74 33.00 29.82 28.58 28.01
Australia and New Zealand 42.05 42.05 37.65 36.32 35.69
Europe and Northern America 18.25 19.21 16.31 15.58 15.21
Europe 13.23 14.47 13.19 13.10 13.05
Northern America 29.91 29.78 23.00 20.74 19.63
Landlocked developing countries 4.34 4.91 5.45 5.74 5.85
Least developed countries 2.55 ... 3.64 3.30 3.41
Small island developing States ... ... 7.92 8.13 8.00
Source: Environment Live database, United Nations Environment Programme (UNEP); Global Material Flows Database,
International Resource Panel.
(c) Domestic material consumption per GDP
(Kilograms per constant 2010 United States dollars)
Regions 2000 2005 2010 2015 2017
World 1.07 1.09 1.15 1.11 1.11
Sub-Saharan Africa 3.26 2.86 2.76 2.43 2.48
Northern Africa and Western Asia 1.25 1.21 1.50 1.33 1.36
Northern Africa 2.35 1.81 2.58 2.50 2.54
Western Asia 0.99 1.04 1.20 1.10 1.12
Central and Southern Asia 3.96 3.47 3.19 2.97 2.76
Central Asia 5.12 4.28 3.59 3.16 3.10
Southern Asia 3.88 3.40 3.15 2.95 2.73
Eastern and South-Eastern Asia 1.79 1.96 2.20 2.07 2.04
Eastern Asia 1.68 1.87 2.15 2.09 2.06
South-Eastern Asia 2.58 2.57 2.51 2.00 1.94
Latin America and the Caribbean 1.18 1.17 1.14 1.11 1.16
Oceania 0.96 0.85 0.74 0.66 0.64
Australia and New Zealand 0.90 0.81 0.69 0.62 0.60
Europe and Northern America 0.62 0.59 0.48 0.43 0.41
Europe 0.57 0.56 0.49 0.46 0.44
Northern America 0.67 0.61 0.47 0.40 0.37
Landlocked developing countries 5.58 4.48 4.21 3.84 3.82
Least developed countries 4.90 ... 4.20 3.78 3.79
Small island developing States ... ... 0.85 0.80 0.78
Source: Environment Live database, United Nations Environment Programme (UNEP); Global Material Flows Database,
International Resource Panel.
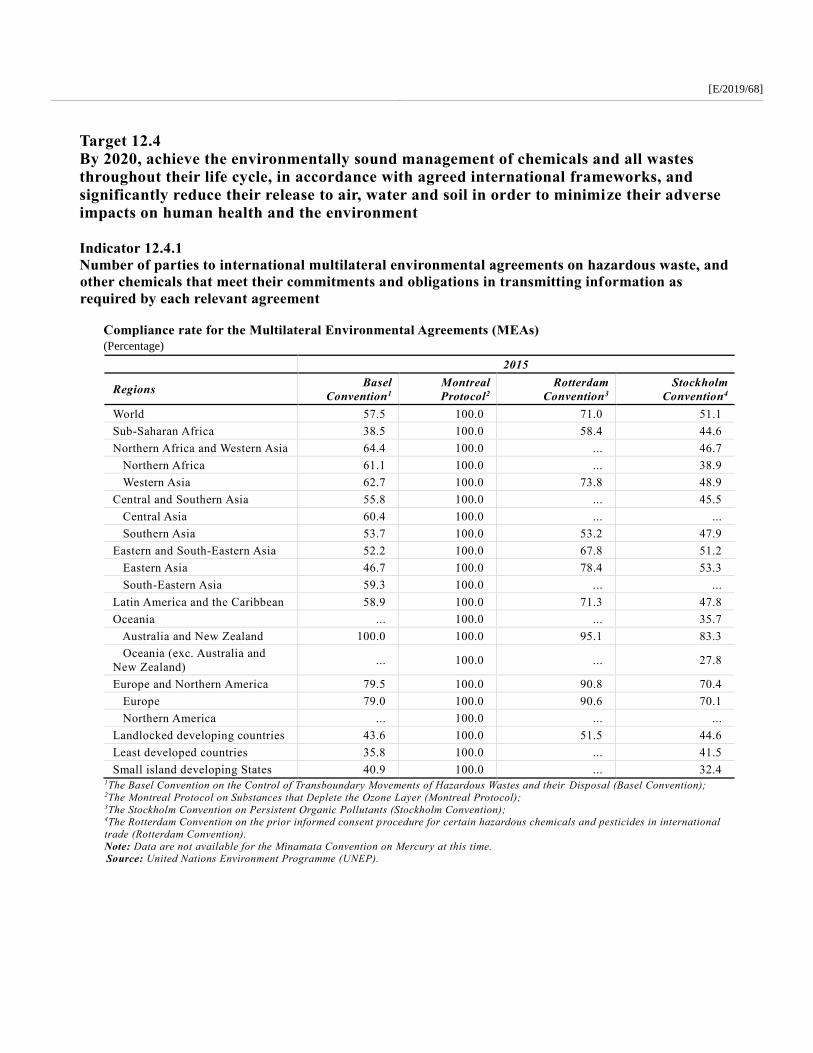
[E/2019/68]
Target 12.4
By 2020, achieve the environmentally sound management of chemicals and all wastes
throughout their life cycle, in accordance with agreed international frameworks, and
significantly reduce their release to air, water and soil in order to minimize their adverse
impacts on human health and the environment
Indicator 12.4.1
Number of parties to international multilateral environmental agreements on hazardous waste, and
other chemicals that meet their commitments and obligations in transmitting information as
required by each relevant agreement
Compliance rate for the Multilateral Environmental Agreements (MEAs)
(Percentage)
2015
Regions Basel
Convention1
Montreal
Protocol2 Rotterdam
Convention3 Stockholm
Convention4
World 57.5 100.0 71.0 51.1
Sub-Saharan Africa 38.5 100.0 58.4 44.6
Northern Africa and Western Asia 64.4 100.0 ... 46.7
Northern Africa 61.1 100.0 ... 38.9
Western Asia 62.7 100.0 73.8 48.9
Central and Southern Asia 55.8 100.0 ... 45.5
Central Asia 60.4 100.0 ... ...
Southern Asia 53.7 100.0 53.2 47.9
Eastern and South-Eastern Asia 52.2 100.0 67.8 51.2
Eastern Asia 46.7 100.0 78.4 53.3
South-Eastern Asia 59.3 100.0 ... ...
Latin America and the Caribbean 58.9 100.0 71.3 47.8
Oceania ... 100.0 ... 35.7
Australia and New Zealand 100.0 100.0 95.1 83.3
Oceania (exc. Australia and
New Zealand) ... 100.0 ... 27.8
Europe and Northern America 79.5 100.0 90.8 70.4
Europe 79.0 100.0 90.6 70.1
Northern America ... 100.0 ... ...
Landlocked developing countries 43.6 100.0 51.5 44.6
Least developed countries 35.8 100.0 ... 41.5
Small island developing States 40.9 100.0 ... 32.4 1The Basel Convention on the Control of Transboundary Movements of Hazardous Wastes and their Disposal (Basel Convention); 2The Montreal Protocol on Substances that Deplete the Ozone Layer (Montreal Protocol); 3The Stockholm Convention on Persistent Organic Pollutants (Stockholm Convention); 4The Rotterdam Convention on the prior informed consent procedure for certain hazardous chemicals and pesticides in international
trade (Rotterdam Convention).
Note: Data are not available for the Minamata Convention on Mercury at this time. Source: United Nations Environment Programme (UNEP).

[E/2019/68]
105
Last editted on 23/06/2019 11:43 PM
Target 12.c
Rationalize inefficient fossil-fuel subsidies that encourage wasteful consumption by
removing market distortions, in accordance with national circumstances, including by
restructuring taxation and phasing out those harmful subsidies, where they exist, to
reflect their environmental impacts, taking fully into account the specific needs and
conditions of developing countries and minimizing the possible adverse impacts on their
development in a manner that protects the poor and the affected communities
Indicator 12.c.1
Amount of fossil-fuel subsidies per unit of GDP (production and consumption) and as a proportion
of total national expenditure on fossil fuels
Fossil-fuel pre-tax subsidies (consumption and production) as a proportion of total GDP (Percentage)
Regions 2013 2015
World 0.77 0.43
Sub-Saharan Africa 1.44 1.02
Northern Africa and Western Asia 3.85 1.92
Northern Africa 6.74 3.17
Western Asia 3.22 1.65
Central and Southern Asia 5.02 2.77
Central Asia 6.14 4.42
Southern Asia 4.91 2.62
Eastern and South-Eastern Asia 0.35 0.06
Eastern Asia 0.04 0.00
South-Eastern Asia 2.32 0.45
Latin America and the Caribbean 1.79 0.98
Oceania 0.05 0.05
Australia and New Zealand 0.05 0.05
Europe and Northern America 0.17 0.16
Europe 0.25 0.23
Northern America 0.07 0.07
Landlocked developing countries 4.22 3.06
Least developed countries … 1.22 Source: Environment Live database, United Nations Environment Programme (UNEP)

[E/2019/68]
Goal 13
Take urgent action to combat climate change and its impacts
Target 13.1
Strengthen resilience and adaptive capacity to climate-related hazards and natural
disasters in all countries
Indicator 13.1.1
Number of deaths, missing persons and directly affected persons attributed to disasters per 100,000
population
Number of deaths and missing persons attributed to disasters, by hazard type
Hazard Type 1990-2017
Geo-physical 380,825
Tsunami 216,280
Earthquake 161,981
Other geo-physical 2,564
Meteorological 212,381
Storm 168,430
Rains 34,319
Cold or heat wave 9,527
Other meteorological 105
Hydrological 144,355
Flood 109,110
Landslide 31,780
Other Hydrological 3,465
Biological 78,324
Climatological 8,620
Technological 74,287
Others 2,349
Unclassified (under Sendai Framework Monitoring)
56,640
Source: The United Nations Office for Disaster Risk Reduction (UNISDR)

[E/2019/68]
107
Last editted on 23/06/2019 11:43 PM
Proxy indicators The work on methodological development of indicators 13.2.1, 13.3.1, 13.3.2, 13.a.1 and 13.b.1 as defined in the
global indicator framework is still ongoing, and thus data are not yet available. A list of proxy indicators for
immediate use to monitoring targets was approved by the 50th Session of the Statistical Co mmission.
Target 13.2
Integrate climate change measures into national policies, strategies and planning
Aggregate GHG emissions for non-Annex I Parties1,2 (PG CO₂ equivalent)
2000 2005 2010 2012
Non-Annex I parties
Under UNFCCC 13.04 13.46 17.02 18.51
1 As at 15 April 2019. 2 Non-Annex I parties are the parties to the United Nations Framework Convention on Climate Change (UNFCCC) not listed in Annex
I of the Convention and are mostly low-income developing countries.
Note: The comparison of emission trends between Annex I and non-Annex I countries should be undertaken with caution owing to the
difference in the reporting requirements for Annex I and non-Annex I Parties under the UNFCCC (annual vs. periodical), as well as to
the availability of data for most non-Annex I Parties (developing countries report information only for some specific years in the
period 1994-2012 and not for the complete period).
Source: The United Nations Framework Convention on Climate Change (UNFCCC)
Aggregate GHG emissions for Annex I Parties1 (GT CO₂ equivalent)
2000 2005 2010 2015 2017
Annex I parties
Under UNFCCC 17.89 18.27 17.42 16.71 16.65
1 As at 15 April 2019.
Note: The comparison of emission trends between Annex I and non-Annex I countries should be undertaken with caution owing to the
difference in the reporting requirements for Annex I and non-Annex I Parties under the UNFCCC (annual vs. periodical), as well as to
the availability of data for most non-Annex I Parties (developing countries report information only for some specific years in the
period 1994-2012 and not for the complete period).
Source: The United Nations Framework Convention on Climate Change (UNFCCC)
Number of Parties to the Paris Agreement under the United Nations Framework Convention on Climate
Change and Number of nationally determined contributions (NDCs)
20191
Total number of Parties that ratified the Paris Agreement 186
Total number of Parties that communicated their first nationally determined contributions (NDCs) 183
Total number of Parties that communicated their second nationally determined contributions (NDCs) 1 1 As of May 2019.
Source: The United Nations Framework Convention on Climate Change (UNFCCC)

[E/2019/68]
Goal 14 Conserve and sustainably use the oceans, seas and marine resources for sustainable development
Target 14.4
By 2020, effectively regulate harvesting and end overfishing, illegal, unreported and
unregulated fishing and destructive fishing practices and implement science-based
management plans, in order to restore fish stocks in the shortest time feasible, at least to
levels that can produce maximum sustainable yield as determined by their biological
characteristics
Indicator 14.4.1
Proportion of fish stocks within biologically sustainable levels
Proportion of fish stocks within biologically sustainable levels1
(Percentage)
2000 2004 2011 2013 2015
World 72.6 75.6 71.3 68.6 66.9
Atlantic, Eastern Central ... ... 52.4 53.5 57.1
Atlantic, Northeast ... ... 84.6 78.6 73.5
Atlantic, Northwest ... ... 72.4 69.0 73.9
Atlantic, Southeast ... ... 50.0 58.6 67.6
Atlantic, Southwest ... ... 45.0 50.0 41.2
Atlantic, Western Central ... ... 63.3 55.6 60.3
Indian Ocean, Eastern ... ... 89.7 84.8 73.1
Indian Ocean, Western ... ... 75.0 66.7 66.7
Mediterranean and Black Sea ... ... 48.0 40.6 37.8
Pacific, Eastern Central ... ... 90.9 90.9 86.7
Pacific, Northeast ... ... 88.0 86.2 85.7
Pacific, Northwest ... ... 78.9 76.2 82.7
Pacific, Southeast ... ... 63.6 58.3 38.5
Pacific, Southwest ... ... 84.0 87.5 74.1
Pacific, Western Central ... ... 86.1 77.5 82.6 1Within biologically sustainable levels means that the abundance of world fish stock is at or higher than the level that can p roduce the
maximum sustainable yield.
Source: Food and Agriculture Organisation of United Nations (FAO).
Target 14.5
By 2020, conserve at least 10 per cent of coastal and marine areas, consistent with
national and international law and based on the best available scientific information
Indicator 14.5.1
Coverage of protected areas in relation to marine areas
(a) Coverage of protected areas in relation to marine areas (Exclusive Economic Zones)1
(Percentage)
Regions 2000 2005 2010 2015 2018
World 2.23 3.15 7.27 11.99 17.16
Sub-Saharan Africa 0.21 0.26 4.75 8.87 19.17

[E/2019/68]
109
Last editted on 23/06/2019 11:43 PM
Regions 2000 2005 2010 2015 2018
Northern Africa and Western Asia 0.58 0.68 1.22 1.24 1.30
Central and Southern Asia 0.28 0.32 0.35 0.39 0.39
Eastern and South-Eastern Asia 2.59 2.82 3.32 3.67 3.81
Latin America and the Caribbean 1.40 2.03 3.56 8.85 20.14
Australia and New Zealand 3.09 4.42 13.17 34.09 34.09
Oceania (exc. Australia and New Zealand) 0.21 0.27 6.80 15.55 22.11
Europe and Northern America 5.52 8.24 12.76 13.40 14.26
Landlocked developing countries 1.38 1.49 1.81 1.81 1.81
Least developed countries 0.24 0.36 3.68 3.82 3.89
Small island developing States 0.24 0.40 2.49 7.88 13.62 1The Exclusive Economic Zone (EEZ) comprises an area which extends either from the coast, or in federal systems from the seawa rd
boundaries of the constituent states (3 to 12 nautical miles, in most cases) to 200 nautical miles (370 kilometres) off the c oast.
Source: UNEP-WCMC (2018), Protected Planet: The World Database on Protected Areas (WDPA) [On-line], December 2018, United
Nations Environment Programme's World Conservation Monitoring Centre (UNEP-WCMC) and International Union for Conservation
of Nature (IUCN).
(b) Average proportion of marine Key Biodiversity Areas (KBAs) covered by protected areas 1
(Percentage)
Regions 2000 2005 2010 2015 2018
World 31.2 36.4 41.1 44.8 45.7
Sub-Saharan Africa 23.4 25.5 34.1 37.9 39.7
Northern Africa and Western Asia 9.5 13.7 21.2 24.1 24.8
Northern Africa 12.3 23.0 29.8 36.6 37.7
Western Asia 8.3 9.9 17.7 19.0 19.6
Central and Southern Asia 37.8 41.5 43.0 43.1 43.1
Southern Asia 37.8 41.5 43.0 43.1 43.1
Eastern and South-Eastern Asia 27.3 31.3 33.6 36.8 37.8
Eastern Asia 38.2 43.8 44.3 47.8 47.8
South-Eastern Asia 17.2 19.9 23.8 26.7 28.6
Latin America and the Caribbean 24.9 30.1 34.1 38.1 39.3
Oceania 21.0 23.3 30.9 35.1 35.9
Australia and New Zealand 42.6 45.9 50.4 56.4 56.7
Oceania (exc. Australia and New Zealand) 6.1 8.0 17.6 20.6 21.8
Europe and Northern America 45.5 53.5 58.1 62.0 63.0
Europe 49.3 58.6 63.2 68.6 69.7
Northern America 37.3 42.5 46.8 47.4 48.3
Least developed countries 12.5 14.2 22.4 23.6 25.9
Small island developing States 9.5 12.6 18.5 22.4 22.8 1Based on the spatial overlap between polygons for Key Biodiversity Areas from the World Database of key Biodiversity Areas and
polygons for protected areas from the World Database on Protected Areas.
Note: Figures for each region are calculated as the proportion of each Key Biodiversity Area covered by protected areas, averaged
(i.e. calculated as the mean) across all Key Biodiversity Areas within the region.
Source: United Nations Environment Programme's World Conservation Monitoring Centre (UNEP -WCMC) in collaboration with
BirdLife International, International Union for Conservation of Nature (IUCN).

[E/2019/68]
Target 14.6
14.6 By 2020, prohibit certain forms of fisheries subsidies which contribute to
overcapacity and overfishing, eliminate subsidies that contribute to illegal, unreported
and unregulated fishing and refrain from introducing new such subsidies, recognizing
that appropriate and effective special and differential treatment for developing and Least
developed countries should be an integral part of the World Trade Organization fisheries
subsidies negotiation
Indicator 14.6.1
Degree of implementation of international instruments aiming to combat illegal, unreported and
unregulated fishing
Progress by regions in the degree of implementation of international instruments aiming to combat
illegal, unreported and unregulated fishing
(Levels of implementation1)
Regions 2018
World 3
Sub-Saharan Africa 4
Northern Africa and Western Asia 3
Northern Africa 3
Western Asia 4
Central and Southern Asia 3
Central Asia 2
Southern Asia 4
Eastern and South-Eastern Asia 4
Eastern Asia 5
South-Eastern Asia 4
Latin America and the Caribbean 3
Oceania 4
Australia and New Zealand 5
Oceania (exc. Australia and New Zealand) 4
Europe and Northern America 5
Europe 5
Northern America 5
Landlocked developing countries 2
Least developed countries 3
Small island developing States 3 1The value 1 represents very low level, 2 as low level, 3 as medium level, 4 as high level and 5 as very high level of implementation of
international instruments aiming to combat illegal, unreported and unregulated fishing.
Source: Data based on a country self-reported questionnaire on the implementation of the Code of Conduct for Responsible Fisheries,
Food and Agriculture Organisation of the United Nations (FAO).

[E/2019/68]
111
Last editted on 23/06/2019 11:43 PM
Target 14.b
Provide access for small-scale artisanal fishers to marine resources and markets
Indicator 14.b.1
Degree of application of a legal/regulatory/ policy/institutional framework which recognizes and
protects access rights for small-scale fisheries
Degree of application of a legal/regulatory/policy/institutional framework which recognizes and protects
access rights for small-scale fisheries
(Levels of implementation1)
Regions 2018
World 3
Sub-Saharan Africa 4
Northern Africa and Western Asia 4
Northern Africa 4
Western Asia 3
Central and Southern Asia 3
Central Asia 3
Southern Asia 4
Eastern and South-Eastern Asia 4
Eastern Asia 3
South-Eastern Asia 4
Latin America and the Caribbean 4
Oceania 3
Australia and New Zealand 3
Oceania (exc. Australia and New Zealand) 4
Europe and Northern America 4
Europe 4
Northern America 4
Landlocked developing countries 4
Least developed countries 4
Small island developing States 4 1The value 1 represents very low level, 2 as low level, 3 as medium level, 4 as high level and 5 as very high level of implementation of
international instruments aiming to combat illegal, unreported and unregulated fishing.
Source: Data based on a country self-reported questionnaire on the implementation of the Code of Conduct for Responsible Fisheries,
Food and Agriculture Organisation of the United Nations (FAO).

[E/2019/68]
Goal 15 Protect, restore and promote sustainable use of terrestrial ecosystems, sustainably manage forests, combat desertification, and halt and reverse land degradation and halt biodiversity loss
Target 15.1
By 2020, ensure the conservation, restoration and sustainable use of terrestrial and inland
freshwater ecosystems and their services, in particular forests, wetlands, mountains and
drylands, in line with obligations under international agreements
Indicator 15.1.1
Forest area as a proportion of total land area
Forest area as a proportion of total land area
(Percentage)
Regions 2000 2005 2010 2015
World 31.1 30.9 30.8 30.7
Sub-Saharan Africa 29.0 28.3 27.5 26.9
Northern Africa and Western Asia 3.8 3.8 3.9 3.8
Northern Africa 3.8 3.8 3.8 3.7
Western Asia 3.7 3.8 4.0 4.1
Central and Southern Asia 9.7 10.0 10.2 10.2
Central Asia 3.0 3.1 3.0 3.0
Southern Asia 13.8 14.3 14.6 14.7
Eastern and South-Eastern Asia 28.2 28.9 29.2 29.4
Eastern Asia 19.6 20.9 21.7 22.2
South-Eastern Asia 50.9 50.0 49.4 48.6
Latin America and the Caribbean 49.1 47.9 47.0 46.4
Oceania 20.9 20.8 20.3 20.4
Australia and New Zealand 17.5 17.3 16.8 17.0
Oceania (exc. Australia and New Zealand) 71.5 71.5 71.4 71.4
Europe and Northern America 40.5 40.6 40.9 41.0
Europe 45.3 45.4 45.8 45.9
Northern America 34.9 35.0 35.2 35.2
Landlocked developing countries 17.2 16.7 16.3 15.8
Least developed countries 28.9 28.2 27.6 27.0
Small island developing States 68.2 68.4 68.6 68.8
Source: Global Forest Resources Assessment and FAOSTAT Database, Food and Agriculture Organisation of the United Nations
(FAO).

[E/2019/68]
113
Last editted on 23/06/2019 11:43 PM
Indicator 15.1.2
Proportion of important sites for terrestrial and freshwater biodiversity that are covered by
protected areas, by ecosystem type
(a) Mean percentage area of each important site (Key Biodiversity Area) for terrestrial biodiversity that
is covered by protected areas1
(Percentage)
Regions 2000 2005 2010 2015 2018
World 33.1 39.2 43.6 45.8 46.1
Sub-Saharan Africa 31.5 34.8 40.0 41.5 41.9
Northern Africa and Western Asia 11.2 14.9 18.8 23.2 23.5
Northern Africa 14.7 22.6 26.9 39.8 40.1
Western Asia 10.0 12.4 16.2 17.9 18.3
Central and Southern Asia 23.6 24.7 26.4 28.4 28.4
Central Asia 12.0 12.3 15.6 16.3 16.3
Southern Asia 27.1 28.5 29.7 32.0 32.0
Eastern and South-Eastern Asia 28.4 33.9 37.0 39.1 39.6
Eastern Asia 34.4 40.0 41.9 43.2 43.4
South-Eastern Asia 22.5 27.9 32.2 35.1 35.9
Latin America and the Caribbean 25.9 31.0 34.2 36.1 36.7
Oceania 22.2 25.1 31.6 35.6 36.3
Australia and New Zealand 33.9 37.6 43.7 49.9 50.4
Oceania (exc. Australia and New Zealand) 7.5 9.6 16.7 18.0 18.7
Europe and Northern America 45.4 54.8 60.4 62.2 62.3
Europe 47.5 58.1 64.1 66.1 66.2
Northern America 33.2 36.1 38.9 39.6 40.0
Landlocked developing countries 29.0 32.6 35.8 36.5 36.6
Least developed countries 28.4 31.9 35.4 35.8 36.3
Small island developing States 12.0 17.6 23.2 25.3 25.4 1Based on the spatial overlap between polygons for Key Biodiversity Areas from the World Database of Key Biodiversity Areas and
polygons for protected areas from the World Database on Protected Areas.
Note: Figures for each region are calculated as the proportion of each Key Biodiversity Area covered by protected areas, averaged
(i.e., calculated as the mean) across all Key Biodiversity Areas within the region.
Source: United Nations Environment Programme's World Conservation Monitoring Centre (UNEP -WCMC) in collaboration with
BirdLife International, International Union for Conservation of Nature (IUCN).
(b) Mean percentage area of each important site (Key Biodiversity Area) for freshwater biodiversity that
is covered by protected areas1
(Percentage)
Regions 2000 2005 2010 2015 2018
World 30.5 37.7 41.3 43.1 43.2
Sub-Saharan Africa 34.0 41.4 46.1 47.8 48.1
Northern Africa and Western Asia 7.2 11.7 13.1 19.1 19.1
Northern Africa 12.6 25.8 29.6 50.9 50.9
Western Asia 5.6 7.6 8.3 9.7 9.7
Central and Southern Asia 16.3 18.1 20.5 21.1 21.1
Central Asia 10.2 10.7 15.9 16.9 16.9
Southern Asia 20.0 22.6 23.2 23.6 23.6
Eastern and South-Eastern Asia 27.9 34.0 35.7 37.3 37.6
Eastern Asia 29.7 35.6 37.3 38.6 39.1

[E/2019/68]
Regions 2000 2005 2010 2015 2018
South-Eastern Asia 23.8 30.3 31.9 34.2 34.2
Latin America and the Caribbean 21.9 26.8 32.0 35.3 36.0
Oceania 21.3 25.7 28.8 33.4 33.7
Australia and New Zealand 21.6 26.1 29.2 33.9 34.1
Oceania (exc. Australia and New Zealand) 0.0 0.1 0.1 0.1 0.1
Europe and Northern America 39.4 49.0 53.4 54.7 54.7
Europe 42.2 52.7 57.5 58.9 58.9
Northern America 19.1 22.7 24.2 24.3 24.5
Landlocked developing countries 22.0 27.1 31.0 31.9 32.2
Least developed countries 28.8 35.7 39.3 39.4 39.6
Small island developing States 6.5 18.1 25.8 25.9 25.9 1Based on the spatial overlap between polygons for Key Biodiversity Areas from the World Database of Key Biodiversity Areas and
polygons for protected areas from the World Database on Protected Areas.
Note: Figures for each region are calculated as the proportion of each Key Biodiversity Area covered by protected areas, averaged
(i.e., calculated as the mean) across all Key Biodiversity Areas within the region.
Source: United Nations Environment Programme's World Conservation Monitoring Centre (UNEP-WCMC) in collaboration with
BirdLife International and International Union for Conservation of Nature (IUCN).
Target 15.2
By 2020, promote the implementation of sustainable management of all types of forests,
halt deforestation, restore degraded forests and substantially increase afforestation and
reforestation globally
Indicator 15.2.1
Progress towards sustainable forest management
(a) Forest area net change rate
(Percentage)
Regions 2000-2005 2006-2010 2011-2015
World -0.12 -0.09 -0.09
Sub-Saharan Africa -0.51 -0.55 -0.47
Northern Africa and Western Asia 0.05 0.25 -0.07
Northern Africa -0.28 -0.09 -0.56
Western Asia 0.60 0.81 0.68
Central and Southern Asia 0.64 0.32 0.11
Central Asia 0.11 -0.40 -0.16
Southern Asia 0.71 0.41 0.15
Eastern and South-Eastern Asia 0.49 0.27 0.12
Eastern Asia 1.29 0.71 0.52
South-Eastern Asia -0.35 -0.23 -0.36
Latin America and the Caribbean -0.49 -0.37 -0.23
Oceania -0.13 -0.51 0.18
Australia and New Zealand -0.17 -0.66 0.23
Oceania (exc. Australia and New Zealand) 0.00 -0.01 -0.01
Europe and Northern America 0.03 0.16 0.04
Europe 0.04 0.19 0.04
Northern America 0.03 0.11 0.03
Landlocked developing countries -0.55 -0.53 -0.55
Least developed countries -0.46 -0.46 -0.45

[E/2019/68]
115
Last editted on 23/06/2019 11:43 PM
Regions 2000-2005 2006-2010 2011-2015
Small island developing States 0.06 0.05 0.06
Source: Global Forest Resources Assessment, Food and Agriculture Organisation of the United Nations (FAO).
(b) Above-ground biomass density in forest
(Tonnes per hectare)
Regions 2000 2005 2010 2015
World 127.7 127.2 126.9 127.3
Sub-Saharan Africa 162.6 163.1 164.0 164.9
Northern Africa and Western Asia 123.6 117.9 118.0 119.8
Northern Africa 142.0 133.3 131.6 131.8
Western Asia 87.6 89.4 93.9 99.5
Central and Southern Asia 54.7 55.0 55.8 52.1
Central Asia 25.3 26.0 24.5 27.5
Southern Asia 58.7 58.8 59.8 55.1
Eastern and South-Eastern Asia 117.6 111.9 107.9 104.9
Eastern Asia 48.9 49.2 52.2 53.9
South-Eastern Asia 177.0 171.5 163.4 158.2
Latin America and the Caribbean 188.5 189.1 189.9 192.1
Oceania 269.5 270.2 271.4 272.3
Australia and New Zealand 207.8 211.0 216.0 220.0
Oceania (exc. Australia and New Zealand) 286.4 286.5 286.6 286.7
Europe and Northern America 72.4 74.1 75.6 77.0
Europe 68.1 69.3 70.4 72.0
Northern America 86.4 89.8 92.3 93.3
Landlocked developing countries 107.7 108.2 108.9 109.6
Least developed countries 152.9 152.9 153.3 153.9
Small island developing States 301.2 301.0 298.8 297.9
Source: Global Forest Resources Assessment, Food and Agriculture Organisation of the United Nations (FAO).
(c) Proportion of forest area within legally established protected areas
(Percentage)
Regions 2000 2005 2010 2015
World 12.4 14.3 15.6 16.1
Sub-Saharan Africa 15.5 15.9 16.6 17.7
Northern Africa and Western Asia 10.1 13.9 14.4 14.5
Northern Africa 12.6 18.3 19.0 19.1
Western Asia 5.5 6.0 6.1 6.3
Central and Southern Asia 18.1 21.3 21.9 22.0
Central Asia 7.2 8.8 7.8 7.8
Southern Asia 18.7 22.0 22.6 22.8
Eastern and South-Eastern Asia 17.5 20.5 21.1 22.3
Eastern Asia 10.0 13.4 14.7 15.1
South-Eastern Asia 26.5 29.2 28.9 31.0
Latin America and the Caribbean 24.5 29.6 33.2 33.6
Oceania 9.0 10.9 12.0 14.4
Australia and New Zealand 11.2 13.6 15.2 17.2
Oceania (exc. Australia and New Zealand) 1.7 1.7 1.0 5.0

[E/2019/68]
Regions 2000 2005 2010 2015
Europe and Northern America 4.9 5.5 6.0 6.1
Europe 3.5 3.8 4.2 4.3
Northern America 7.1 7.9 8.7 8.6
Landlocked developing countries 28.0 27.5 26.9 25.8
Least developed countries 12.5 14.5 13.6 15.7
Small island developing States 4.3 4.6 6.8 8.9
Source: Global Forest Resources Assessment, Food and Agriculture Organisation of the United Nations (FAO).
(d) Proportion of forest area with a long-term management plan
(Percentage)
Regions 2000 2005 2010
World 51.01 54.00 56.61
Sub-Saharan Africa 9.37 10.72 20.29
Northern Africa and Western Asia 51.72 56.53 62.55
Northern Africa 20.55 27.22 36.79
Western Asia 67.29 71.18 75.42
Central and Southern Asia 41.63 43.89 45.73
Central Asia 86.86 89.61 89.41
Southern Asia 38.84 41.08 43.04
Eastern and South-Eastern Asia 44.89 64.45 68.87
Eastern Asia 33.02 56.96 63.03
South-Eastern Asia 82.38 88.08 87.29
Latin America and the Caribbean 12.80 14.03 16.51
Oceania 23.14 23.48 24.08
Australia and New Zealand 23.61 23.96 24.57
Oceania (exc. Australia and New Zealand) 0.26 0.26 0.27
Europe and Northern America 88.60 89.07 89.55
Europe 96.22 96.30 96.39
Northern America 64.38 66.08 67.79
Landlocked developing countries 13.58 15.45 18.76
Least developed countries 16.79 18.77 27.02
Small island developing States 27.12 29.58 34.65
Source: Global Forest Resources Assessment, Food and Agriculture Organisation of the United Nations (FAO).
(e) Forest area certified under an independently verified certification scheme
(Thousands of hectares)
Regions 2000 2005 2010 2015 2018
World 36,541.0 239,415.0 337,443.8 393,809.6 422,519.9
Sub-Saharan Africa 1,112.4 2,327.9 7,346.5 6,348.4 7,003.8
Northern Africa and Western Asia 0.0 0.0 20.3 2,359.5 2,396.9
Northern Africa 0.0 0.0 20.3 0.0 0.0
Western Asia 0.0 0.0 0.0 2,359.5 2,396.9
Central and Southern Asia 17.5 31.9 38.0 833.6 539.0
Central Asia 0.0 0.0 0.0 0.0 0.3
Southern Asia 17.5 31.9 38.0 833.6 538.7
Eastern and South-Eastern Asia 272.4 872.7 5,628.3 17,005.2 22,054.3
Eastern Asia 12.4 704.2 2,805.1 8,813.7 9,946.3
South-Eastern Asia 260.0 168.5 2,823.2 8,191.5 12,108.0

[E/2019/68]
117
Last editted on 23/06/2019 11:43 PM
Regions 2000 2005 2010 2015 2018
Latin America and the Caribbean 1,598.1 8,471.5 13,935.6 14,146.9 15,439.6
Oceania 25.4 6,646.2 11,096.2 12,031.6 10,344.7
Australia and New Zealand 19.7 6,579.4 11,093.5 11,843.1 10,182.3
Oceania (exc. Australia and New Zealand) 5.7 66.8 2.7 188.5 162.4
Europe and Northern America 33,515.2 221,064.8 299,378.9 341,084.4 364,741.6
Europe 31,205.2 83,346.7 109,105.9 143,487.0 155,025.1
Northern America 2,309.9 137,718.2 190,273.0 197,597.4 209,716.5
Landlocked developing countries 595.6 1,490.3 2,103.4 1,202.0 1,206.7
Least developed countries 1.4 245.1 411.5 452.1 383.6
Small island developing States 110.6 171.6 568.4 703.8 777.9
Source: Global Forest Resources Assessment, Food and Agriculture Organisation of the United Nations (FAO).
Indicator 15.3.1
Proportion of land that is degraded over total land area
Proportion of land that is degraded over total land area
Regions
Degraded land area
(km2)
Total land area
(km2)
Share of
degraded
land
(percentage)
World 23,962,509 119,681,858 20.0
Sub-Saharan Africa 4,950,699 22,107,557 22.4
Northern Africa and Western Asia 847,523 12,211,454 6.9
Northern Africa 432,119 7,720,758 5.6
Western Asia 415,405 4,490,696 9.3
Central and Southern Asia 2,950,693 10,557,737 27.9
Central Asia 1,383,958 3,940,962 35.1
Southern Asia 1,566,735 6,616,775 23.7
Eastern and South-Eastern Asia 3,942,095 16,140,899 24.4
Eastern Asia 2,888,889 11,731,466 24.6
South-Eastern Asia 1,053,205 4,409,432 23.9
Latin America and the Caribbean1 5,257,898 19,809,979 26.5
Oceania2 2,978,078 8,391,420 35.5
Australia and New Zealand ... ... ...
Oceania (exc. Australia and New
Zealand) ... ... ...
Europe and Northern America3 3,035,523 30,462,812 10.0
Europe ... ... ...
Northern America ... ... ...
Landlocked developing countries 3,835,033 16,734,270 22.9
Least developed countries 3,453,498 20,354,573 17.0
Small island developing States ... ... ... 1Excluding the islands of the Caribbean. 2Including Papua New Guinea, Australia and New Zealand but excluding the islands of Oceania. 3Excluding USA and Switzerland. Note: Regional data are based on the country-level data submitted in UNCCD 2018 national reports from 123 countries and estimates
prepared by UNCCD based on global data sources.
Source: United Nations Convention to Combat Desertification (UNCCD).

[E/2019/68]
Target 15.4
By 2030, ensure the conservation of mountain ecosystems, including their biodiversity, in
order to enhance their capacity to provide benefits that are essential for sustainable
development
Indicator 15.4.1
Coverage by protected areas of important sites for mountain biodiversity
Mean percentage area of each important site (Key Biodiversity Area) for mountain biodiversity that is
covered by protected areas1
(Percentage)
Regions 2000 2005 2010 2015 2018
World 32.9 37.8 42.3 44.4 44.7
Sub-Saharan Africa 34.4 37.0 41.1 42.0 42.1
Northern Africa and Western Asia 10.6 13.6 17.3 20.4 20.6
Northern Africa 13.5 20.8 22.9 37.0 37.0
Western Asia 10.1 12.2 16.2 17.2 17.4
Central and Southern Asia 28.9 29.5 30.7 34.0 34.0
Central Asia 21.8 22.5 22.5 22.6 22.6
Southern Asia 30.1 30.7 32.1 35.9 35.9
Eastern and South-Eastern Asia 32.5 39.0 43.0 44.8 45.2
Eastern Asia 37.9 44.1 46.5 47.4 47.4
South-Eastern Asia 27.4 34.2 39.7 42.4 43.1
Latin America and the Caribbean 28.8 33.5 36.8 38.4 39.3
Oceania 16.2 17.8 26.1 30.3 30.5
Australia and New Zealand 32.2 34.3 40.4 51.1 51.3
Oceania (exc. Australia and New Zealand) 6.2 7.4 17.0 17.0 17.3
Europe and Northern America 47.7 55.4 62.1 64.1 64.2
Europe 50.0 58.5 65.8 67.9 68.0
Northern America 31.1 33.6 36.0 37.3 38.2
Landlocked developing countries 38.1 40.0 42.4 42.9 42.9
Least developed countries 34.4 37.6 40.8 41.1 41.1
Small island developing States 11.5 17.8 27.7 28.2 28.4 1Based on the spatial overlap between polygons for Key Biodiversity Areas from the World Database of Key Biodiversity Areas and
polygons for protected areas from the World Database on Protected Areas
Note: Figures for each region are calculated as the proportion of each Key Biodiversity Area covered by protected areas, averaged
(i.e., calculated as the mean) across all Key Biodiversity Areas within the region.
Source: United Nations Environment Programme's World Conservation Monitoring Centre (UNEP -WCMC) in collaboration with
BirdLife International and International Union for Conservation of Nature (IUCN).
Indicator 15.4.2
Mountain Green Cover Index
Mountain Green Cover Index
Regions 2017
Sub-Saharan Africa 89.5
Northern Africa and Western Asia 60.3
Northern Africa 46.5
Western Asia 67.6
Central and Southern Asia 64.5

[E/2019/68]
119
Last editted on 23/06/2019 11:43 PM
Regions 2017
Central Asia 31.2
Southern Asia 68.9
Eastern and South-Eastern Asia 70.5
Eastern Asia 62.7
South-Eastern Asia 98.2
Latin America and the Caribbean 82.8
Australia and New Zealand 94.9
Oceania (exc. Australia and New Zealand) 98.3
Europe and Northern America 76.7
Northern America 69.9
Landlocked developing countries 72.0
Least developed countries 82.4
Source: Food and Agriculture Organisation of the United Nations (FAO).
Target 15.5
Take urgent and significant action to reduce the degradation of natural habitats, halt the
loss of biodiversity and, by 2020, protect and prevent the extinction of threatened species
Indicator 15.5.1
Red List Index
Red List Index1,2
Regions 2000 2010 2015 2019
World 0.80 (0.80-0.81) 0.77 (0.75-0.77) 0.75 (0.73-0.77) 0.73 (0.70-0.77)
Sub-Saharan Africa 0.80 (0.80-0.81) 0.77 (0.75-0.78) 0.75 (0.72-0.77) 0.74 (0.70-0.77)
Northern Africa and Western Asia 0.88 (0.88-0.89) 0.85 (0.84-0.86) 0.84 (0.81-0.86) 0.83 (0.79-0.86)
Northern Africa 0.92 (0.91-0.93) 0.89 (0.88-0.90) 0.88 (0.86-0.90) 0.87 (0.84-0.90)
Western Asia 0.86 (0.85-0.87) 0.83 (0.82-0.84) 0.82 (0.78-0.84) 0.81 (0.77-0.84)
Central and Southern Asia 0.75 (0.74-0.77) 0.71 (0.70-0.72) 0.69 (0.66-0.71) 0.67 (0.64-0.71)
Central Asia 0.94 (0.90-0.94) 0.94 (0.88-0.95) 0.94 (0.87-0.96) 0.93 (0.86-0.96)
Southern Asia 0.75 (0.73-0.76) 0.70 (0.69-0.71) 0.68 (0.65-0.70) 0.67 (0.63-0.70)
Eastern and South-Eastern Asia 0.80 (0.79-0.81) 0.76 (0.74-0.76) 0.73 (0.71-0.75) 0.71 (0.67-0.75)
Eastern Asia 0.81 (0.80-0.81) 0.77 (0.75-0.78) 0.75 (0.72-0.77) 0.73 (0.70-0.77)
South-Eastern Asia 0.80 (0.79-0.81) 0.75 (0.74-0.76) 0.73 (0.70-0.75) 0.71 (0.67-0.75)
Latin America and the Caribbean 0.78 (0.77-0.78) 0.76 (0.75-0.76) 0.75 (0.73-0.76) 0.74 (0.72-0.75)
Oceania 0.86 (0.86-0.87) 0.83 (0.82-0.84) 0.81 (0.79-0.83) 0.80 (0.77-0.83)
Australia and New Zealand 0.87 (0.86-0.87) 0.84 (0.82-0.84) 0.82 (0.80-0.84) 0.81 (0.77-0.83)
Oceania (exc. Australia and New Zealand) 0.86 (0.85-0.87) 0.82 (0.81-0.83) 0.80 (0.78-0.82) 0.78 (0.75-0.81)
Europe and Northern America 0.87 (0.86-0.87) 0.85 (0.84-0.86) 0.85 (0.83-0.86) 0.84 (0.82-0.86)
Europe 0.90 (0.90-0.91) 0.87 (0.86-0.88) 0.86 (0.83-0.88) 0.84 (0.80-0.88)
Northern America 0.86 (0.85-0.86) 0.85 (0.84-0.86) 0.85 (0.83-0.86) 0.84 (0.82-0.86)
Landlocked developing countries 0.81 (0.81-0.81) 0.80 (0.80-0.80) 0.80 (0.79-0.80) 0.79 (0.79-0.80)
Least developed countries 0.83 (0.82-0.83) 0.79 (0.78-0.80) 0.77 (0.75-0.79) 0.76 (0.72-0.79)
Small island developing States 0.77 (0.77-0.78) 0.74 (0.73-0.75) 0.72 (0.70-0.74) 0.71 (0.67-0.73) 1The Red List Index for each region represents an index of aggregate survival probability (the inverse of extinction risk) for all birds,
mammals, amphibians, corals and cycads occurring within the region, weighted by the fraction of each species ’ distribution occurring
within the region. It shows how adequately species are conserved or not in the region relative to its potential contribution to global
species conservation.

[E/2019/68]
2Lower and upper confidence intervals in parentheses.
Source: IUCN Red List Index, International Union for Conservation of Nature (IUCN) in collaboration with BirdLife International.
Target 15.6
Promote fair and equitable sharing of the benefits arising from the utilization of genetic
resources and promote appropriate access to such resources, as internationally agreed
Indicator 15.6.1
Number of countries that have adopted legislative, administrative and policy frameworks to ensure
fair and equitable sharing of benefits
(a) Number of countries that have legislative, administrative and policy framework or measures reported
to the Access and Benefit-Sharing Clearing-House1
Regions 2015
Measures
2018
Measures
World 5 61
Sub-Saharan Africa 1 17
Northern Africa and Western Asia 0 3
Northern Africa 0 2
Western Asia 0 1
Central and Southern Asia 1 2
Central Asia 0 0
Southern Asia 1 2
Eastern and South-Eastern Asia 1 3
Eastern Asia 0 1
South-Eastern Asia 1 2
Latin America and the Caribbean 2 12
Oceania 0 0
Australia and New Zealand 0 0
Oceania (exc. Australia and New Zealand) 0 0
Europe and Northern America 0 23
Europe 0 23
Northern America 0 0
Landlocked developing countries 0 9
Least developed countries 0 14
Small island developing States 0 2 1As of February 2019.
Source: Secretariat of the Convention on Biological Diversity (CBD) and the Access and Benefit-sharing Clearing-House.
(b) Number of countries that have legislative, administrative and policy framework or measures reported
through the Online Reporting System on Compliance of the International Treaty on Plant Genetic
Resources for Food and Agriculture (PGRFA)
Regions 2016 2017 2018
World 12 23 45
Sub-Saharan Africa 1 4 10
Northern Africa and Western Asia 1 3 4
Northern Africa 1 1 2
Western Asia 0 1 1
Central and Southern Asia 0 1 3
Central Asia 0 0 0

[E/2019/68]
121
Last editted on 23/06/2019 11:43 PM
Regions 2016 2017 2018
Southern Asia 0 1 3
Eastern and South-Eastern Asia 0 2 3
Eastern Asia 0 1 1
South-Eastern Asia 0 1 2
Latin America and the Caribbean 2 2 10
Oceania 0 0 1
Australia and New Zealand 0 0 1
Oceania (exc. Australia and New Zealand) 0 0 0
Europe and Northern America 8 11 14
Europe 8 10 12
Northern America 0 1 2
Landlocked developing countries 1 6 10
Least developed countries 0 4 10
Small island developing States 1 1 2
Source: Secretariat of the Convention on Biological Diversity (CBD).
(c) Number of countries that are Parties to the Nagoya Protocol1
Regions 2015 2018
World 69 115
Sub-Saharan Africa 28 41
Northern Africa and Western Asia 5 8
Northern Africa 2 2
Western Asia 3 6
Central and Southern Asia 6 8
Central Asia 3 3
Southern Asia 3 5
Eastern and South-Eastern Asia 7 11
Eastern Asia 1 2
South-Eastern Asia 6 9
Latin America and the Caribbean 9 15
Oceania 5 7
Australia and New Zealand 0 0
Oceania (exc. Australia and New Zealand) 5 7
Europe and Northern America 9 25
Europe 9 25
Northern America 0 0
Landlocked developing countries 15 24
Least developed countries 25 38
Small island developing States 12 17 1As of February 2019.
Source: Secretariat of the Convention on Biological Diversity (CBD).
(d) Number of countries that are contracting Parties to the International Treaty on Plant Genetic
Resources for Food and Agriculture (PGRFA)
Regions 2016 2017 2018
World 126 135 144
Sub-Saharan Africa 37 38 38

[E/2019/68]
Regions 2016 2017 2018
Northern Africa and Western Asia 18 19 19
Northern Africa 6 6 6
Western Asia 12 13 13
Central and Southern Asia 9 10 10
Central Asia 1 1 1
Southern Asia 8 9 9
Eastern and South-Eastern Asia 8 9 10
Eastern Asia 2 3 4
South-Eastern Asia 6 6 6
Latin America and the Caribbean 16 16 21
Oceania 6 9 10
Australia and New Zealand 1 1 1
Oceania (exc. Australia and New Zealand) 5 8 9
Europe and Northern America 32 34 36
Europe 31 33 34
Northern America 1 1 2
Landlocked developing countries 20 22 24
Least developed countries 37 37 38
Small island developing States 14 17 20
Source: Secretariat of the Convention on Biological Diversity (CBD).
(e) Total reported number of Standard Material Transfer Agreements (SMTAs) transferring plant genetic
resources for food and agriculture
Regions 2012 2015 2018
World 34374 58855 72518
Sub-Saharan Africa 1331 2553 4280
Northern Africa 6714 12885 13029
Western Asia 1002 1872 3145
Central and Southern Asia 1465 2689 5086
Central Asia 0 0 0
Southern Asia 1465 2689 5086
Eastern and South-Eastern Asia 3814 6509 8895
Eastern Asia 0 310 777
South-Eastern Asia 3814 6199 8118
Latin America and the Caribbean 12528 18481 20876
Oceania 1 34 34
Australia and New Zealand 0 0 0
Oceania (exc. Australia and New Zealand) 1 34 34
Europe and Northern America 7519 13832 17173
Europe 6878 12784 15952
Northern America 641 1048 1221
Landlocked developing countries 1233 2180 3380
Least developed countries 750 1373 1781
Small island developing States 1 34 34
Source: Secretariat of the Convention on Biological Diversity (CBD) in collaboration with Food and Agriculture Organisation of the
United Nations (FAO).

[E/2019/68]
123
Last editted on 23/06/2019 11:43 PM
Target 15.a
Mobilize and significantly increase financial resources from all sources to conserve and
sustainably use biodiversity and ecosystems
Indicator 15.a.1
Official development assistance and public expenditure on conservation and sustainable
use of biodiversity and ecosystems
Total official development assistance commitments on conservation and sustainable use of biodiversity
and ecosystems (Millions of constant 2017 United States dollars)
Regions 2005 2010 2015 2017
Total ODA 4,902.5 11,742.7 17,694.8 17,358.3
Sub-Saharan Africa 468.0 1,122.2 2,355.9 2,127.2
Northern Africa 93.2 101.3 121.1 303.3
Western Asia 67.8 75.7 1,097.7 265.4
Central Asia 5.9 9.8 0.8 10.3
Southern Asia 396.4 706.0 356.5 527.6
Eastern Asia 593.5 231.1 181.2 178.5
South-Eastern Asia 140.9 434.0 374.8 367.6
Latin America and the Caribbean 278.2 1,230.4 1,227.8 1,467.5
Oceania 18.9 120.5 46.5 122.9
Europe 7.1 48.7 1,000.2 180.9
Landlocked developing countries 240.0 1,062.3 964.0 1,320.8
Least developed countries 479.5 1,421.5 2,025.0 2,062.5
Small island developing States 124.4 507.4 241.8 254.5
Residual/Unallocated ODA 2,832.5 7,662.9 10,932.4 11,807.1
Note: Only the country-specific ODA are included in the regional aggregations. Unallocated ODA to multiple countries/regions are
presented in “Residual/Unallocated ODA” row.
Source: Creditor Reporting System (CRS) database, 2019, The Organisation for Economic Co-operation and Development (OECD).

[E/2019/68]
Goal 16
Promote peaceful and inclusive societies for sustainable development, provide
access to justice for all and build effective, accountable and inclusive
institutions at all levels
Target 16.1
Significantly reduce all forms of violence and related death rates everywhere
Indicator 16.1.1
Number of victims of intentional homicide per 100,000 population, by sex and age
Number of victims of intentional homicide per 100,000 population
(Per 100,000 population)
Regions 2000 2005 2010 2015 2017
World 6.8 6.3 6.1 6.0 6.1
Sub-Saharan Africa 16.4 15.2 14.6 14.6 14.8
Northern Africa and Western Asia 3.0 3.4 3.2 3.5 3.5
Central and Southern Asia 4.6 4.1 4.1 3.5 3.5
Eastern and South-Eastern Asia 2.3 1.8 1.5 1.2 1.1
Latin America and the Caribbean 21.0 19.8 22.2 22.6 24.0
Australia and New Zealand 1.8 1.3 1.0 1.0 0.9
Oceania (exc. Australia and New Zealand) 6.7 7.8 8.0 7.9 7.9
Europe and Northern America 7.0 6.1 4.2 3.8 3.6
Source: United Nations Office on Drugs and Crime (UNODC).
Target 16.2
End abuse, exploitation, trafficking and all forms of violence against and torture of
children
Indicator 16.2.1
Proportion of children aged 1-17 years who experienced any physical punishment and/or
psychological aggression by caregivers in the past month
Proportion of children aged 1-14 years who experienced any physical punishment and/or psychological
aggression by caregivers in the past month1
(Percentage)
Regions 2018
World2 (83 countries, 31 per cent with population coverage) 78.7
Sub-Saharan Africa (26 countries, 59 per cent with population coverage) 83.2
Northern Africa and Western Asia (14 countries, 76 per cent with population coverage) 84.0
Northern Africa (5 countries, 98 per cent with population coverage) 85.1
Western Asia (9 countries, 55 per cent with population coverage) 82.2
Central Asia (4 countries, 57 per cent with population coverage) 55.4
Landlocked developing countries (23 countries, 62 per cent with population coverage) 75.2
Least developed countries (30 countries, 63 per cent with population coverage) 79.8
Small island developing States (16 countries, 68 per cent with population coverage) 69.4 1The number of countries with comparable survey data included in the regional aggregations and regional population coverage of
children aged 1-14 are presented in parentheses. 2The figure represents less than 50 per cent of the global population, and thus should be interpreted with caution.
Note: Based on the Demographic and Health Surveys (DHS), Multiple Indicator Cluster Surveys (MICS) and other nationally

[E/2019/68]
125
Last editted on 23/06/2019 11:43 PM
representative surveys conducted in the 2006-2018 period.
Source: United Nations Children’s Fund (UNICEF) global databases, 2019.
Indicator 16.2.3
Proportion of young women and men aged 18‑29 years who experienced sexual violence by age 18
Proportion of women aged 18‑29 years who experienced sexual violence by age 181
(Percentage)
Regions 2017
World2 (46 countries, 40 per cent population coverage) 3.0
Sub-Saharan Africa (25 countries, 76 per cent population coverage) 6.0
Central and Southern Asia (5 countries, 81 per cent population coverage) 1.5
Southern Asia (4 countries, 83 per cent population coverage) 1.6
Landlocked developing countries (13 countries, 66 per cent population coverage) 4.2
Least developed countries (25 countries, 77 per cent population coverage) 4.8 1The number of countries with comparable survey data included in the regional aggregations and regional population coverage of
women aged 18-29 are presented in parentheses. 2The figure represents less than 50 per cent of the global population, and thus should be interpreted with caution.
Note: Based on the Demographic and Health Surveys (DHS) conducted in the 2005-2017 period.
Source: United Nations Children’s Fund (UNICEF) global databases, 2019.
Target 16.3
Promote the rule of law at the national and international levels and ensure equal access to
justice for all
Indicator 16.3.2
Unsentenced detainees as a proportion of overall prison population
Unsentenced detainees as a proportion of overall prison population
(Percentage)
Regions 2003-2005 2012-2014 2015-2017
World 31.9 29.7 30.1
Sub-Saharan Africa 44.2 41.0 40.0
Northern Africa and Western Asia 43.9 23.1 22.7
Central and Southern Asia 68.0 59.6 62.7
Eastern and South-Eastern Asia 31.7 29.3 30.2
Latin America and the Caribbean 40.9 42.6 40.3
Australia and New Zealand 20.0 21.8 28.5
Oceania (exc. Australia and New Zealand) 27.5 32.0 35.7
Europe and Northern America 22.2 19.2 18.9
Note: Figures are the averages for 3 years (2003-2005, 2012-2014, 2015-2017).
Source: United Nations Survey on Crime Trends and Operations of Criminal Justice Systems, United Nations Office on Drugs and
Crime (UNODC); World Prison Brief-Institute for Criminal Policy Research (WPB-ICPR).

[E/2019/68]
Target 16.5
Substantially reduce corruption and bribery in all their forms
Indicator 16.5.2
Proportion of businesses that had at least one contact with a public official and that paid a bribe to
a public official, or were asked for a bribe by those public officials during the previous 12 months
Bribery incidence (proportion of firms experiencing at least one bribe payment request)1
(Percentage)
Regions 2018
World 19.3
Sub-Saharan Africa 23.6
Northern Africa and Western Asia 21.2
Northern Africa 19.5
Western Asia 21.8
Central and Southern Asia 32.5
Central Asia 37.3
Southern Asia 29.3
Eastern and South-Eastern Asia 32.3
Eastern Asia 25.2
South-Eastern Asia 33.5
Latin America and the Caribbean 9.7
Oceania 21.8
Oceania (exc. Australia and New Zealand) 21.8
Europe and Northern America 11.2
Europe 11.2
Landlocked developing countries 22.6
Least developed countries 28.9
Small island developing States 14.4 1Regional averages are computed by taking a simple average of country-level point estimates. For each country, only the latest
available year of survey data in the 2006-2018 period is used in this computation.
Source: World Development Indicators database, the World Bank
Target 16.8
Broaden and strengthen the participation of developing countries in the institutions of
global governance
Indicator 16.8.1
Proportion of members and voting rights of developing countries in international organisations
(a) Proportion of developing countries in the membership of international organisations
(Percentage)
International Organisations 2000 2005 2010 2015 2018
African Development Bank 77.9 77.9 77.9 77.5 ...
Asian Development Bank 69.5 68.8 68.7 68.7 ...
Financial Stability Board ... ... 50.0 50.0 50.0
Inter-American Development Bank 58.7 59.6 60.4 60.4 ...
International Bank for Reconstruction and Development 75.3 75.0 74.3 74.5 74.6
International Finance Corporation 74.9 74.7 74.2 74.5 74.5

[E/2019/68]
127
Last editted on 23/06/2019 11:43 PM
International Organisations 2000 2005 2010 2015 2018
International Monetary Fund 74.7 74.6 74.2 74.5 74.6
UN Economic and Social Council 63.0 68.5 64.8 64.8 66.7
UN General Assembly 74.6 74.3 74.0 74.1 74.1
UN Security Council 53.3 46.7 53.3 53.3 ...
World Trade Organisation 72.1 71.1 71.2 71.3 72.0
Note: There is no established convention for the designation of "developed" and "developing" countries or areas in the United Natio ns
system. In common practice, Japan in Asia, Canada and the United States in northern America, Australia and New Zealand in
Oceania, and Europe with Israel and Cyprus are considered "developed" regions or areas. Until a definition of developing countries is
agreed, aggregated data for this indicator will provisionally include all countries located in "developing regions" for the p urposes of
monitoring indicators related to "developing countries".
Source: Data compiled by the Financing for Development Office (FFDO), Department of Economic and Social Affairs, United Nations
(b) Proportion of developing countries in the voting rights at international organisations
(Percentage)
International Organisations 2000 2005 2010 2015 2018
African Development Bank 62.7 63.4 63.9 62.8 ...
Asian Development Bank 58.3 57.9 53.8 58.1 ...
Financial Stability Board ... ... 38.5 43.9 43.9
Inter-American Development Bank 50.1 50.1 50.1 50.1 ...
International Bank for Reconstruction and Development 38.2 38.1 38.1 38.1 39.7
International Finance Corporation 30.1 30.1 30.1 32.2 32.1
International Monetary Fund 31.3 32.1 33.4 35.2 37.7
UN Economic and Social Council 63.0 68.5 64.8 64.8 66.7
UN General Assembly 74.6 74.3 74.0 74.1 74.1
UN Security Council 53.3 46.7 53.3 53.3 ...
World Trade Organisation 72.1 71.1 71.2 71.3 72.0
Note: There is no established convention for the designation of "developed" and "developing" countries or areas in the United Natio ns
system. In common practice, Japan in Asia, Canada and the United States in northern America, Australia and New Zealand in
Oceania, and Europe with Israel and Cyprus are considered "developed" regions or areas. Until a definition of developing coun tries is
agreed, aggregated data for this indicator will provisionally include all countries located in "developing regions" for th e purposes of
monitoring indicators related to "developing countries".
Source: Data compiled by the Financing for Development Office (FFDO), Department of Economic and Social Affairs, United
Nations.
Target 16.9
By 2030, provide legal identity for all, including birth registration
Indicator 16.9.1
Proportion of children under 5 years of age whose births have been registered with a civil authority,
by age
Proportion of children under 5 years of age whose births have been registered1
(Percentage)
Regions 2018
World (161 countries, 84 per cent population coverage) 72.8
Sub-Saharan Africa (43 countries, 98 per cent population coverage) 45.6
Northern Africa and Western Asia (17 countries, 87 per cent population coverage) 89.1
Northern Africa (5 countries, 98 per cent population coverage) 92.0
Western Asia (12 countries, 76 per cent population coverage) 85.4
Central and Southern Asia (11 countries, 97 per cent population coverage) 68.0

[E/2019/68]
Regions 2018
Central Asia (4 countries, 59 per cent population coverage) 98.3
Southern Asia (7 countries, 99 per cent population coverage) 67.2
South-Eastern Asia (8 countries, 95 per cent population coverage) 82.2
Latin America and the Caribbean (28 countries, 100 per cent population coverage) 94.2
Oceania (9 countries, 64 per cent population coverage) 98.0
Australia and New Zealand (2 countries, 100 per cent population coverage) 100.0
Europe and Northern America (43 countries, 98 per cent population coverage) 100.0
Europe (41 countries, 97 per cent population coverage) 100.0
Northern America (2 countries, 100 per cent population coverage) 100.0
Landlocked developing countries (30 countries, 95 per cent population coverage) 41.5
Least developed countries (43 countries, 98 per cent population coverage) 40.0
Small island developing States (23 countries, 73 per cent population coverage) 83.5 1The number of countries with comparable data included in the regional aggregations and regional population coverage of children
under age 5 are presented in parentheses.
Note: Based on the Demographic and Health Surveys (DHS), Multiple Indicator Cluster Surveys (MICS), other national surveys,
censuses and vital registration systems conducted in the 2010-2018 period.
Source: United Nations Children’s Fund (UNICEF) global databases, 2019.
Target 16.10
Ensure public access to information and protect fundamental freedoms, in accordance
with national legislation and international agreements
Indicator 16.10.1
Number of verified cases of killing, kidnapping, enforced disappearance, arbitrary detention and
torture of journalists, associated media personnel, trade unionists and human rights advocates in
the previous 12 months
Number of cases of killings of human rights defenders, journalists and trade unionists
Regions 20151 20162 20173 20184
Female Male Female Male Female Male Female Male
World 49 314 49 351 50 325 39 358 1Incidents that occurred from 1 Jan to 31 December 2015. 2Incidents that occurred from 1 Jan to 31 December 2016. 3Incidents that occurred from 1 Jan to 31 December 2017. 4Incidents that occurred from 1 Jan to 31 October 2018.
Note: Data compiled as of 28 February 2019.
Source: The Office of the United Nations High Commissioner for Human Rights (OHCHR) in collaboration with the United Nations
Educational, Scientific and Cultural Organisation (UNESCO) and the International Labour Organisation of the United Nations (ILO).
Indicator 16.10.2
Number of countries that adopt and implement constitutional, statutory and/or policy guarantees
for public access to information
Number of countries that adopt and implement constitutional, statutory and/or policy guarantees for
public access to information
(Number)
Regions 2019
World 125
Northern Africa and Western Asia 12
Central and Southern Asia 12
Eastern and South-Eastern Asia 9

[E/2019/68]
129
Last editted on 23/06/2019 11:43 PM
Regions 2019
Latin America and the Caribbean 23
Australia and New Zealand 2
Oceania (exc. Australia and New Zealand) 4
Europe and Northern America 43
Landlocked developing countries 21
Least developed countries 20
Small island developing States 16
Note: Data as of 28 February 2019. Reference year represents the year of data compilation.
Source: Data compiled by the United Nations Educational, Scientific and Cultural Organization (UNESCO) .
Target 16.a
Strengthen relevant national institutions, including through international cooperation, for
building capacity at all levels, in particular in developing countries, to prevent violence
and combat terrorism and crime
Indicator 16.a.1
Existence of independent national human rights institutions in compliance with the Paris Principles
(a) Proportion of countries with independent National Human Rights Institutions in compliance with the
Paris Principles
(Percentage)
Regions 2000 2005 2010 2015 2018
World 16.2 27.9 32.9 35.5 39.1
Sub-Saharan Africa 18.8 35.4 27.1 33.3 39.6
Northern Africa and Western Asia 8.3 12.5 33.3 33.3 29.2
Central and Southern Asia 7.1 14.3 21.4 21.4 28.6
Southern Asia 11.1 22.2 33.3 33.3 44.4
Eastern and South-Eastern Asia 11.8 35.3 41.2 35.3 35.3
South-Eastern Asia 18.2 36.4 45.5 36.4 36.4
Latin America and the Caribbean 23.5 32.4 41.2 41.2 41.2
Australia and New Zealand 100.0 100.0 100.0 100.0 100.0
Oceania (exc. Australia and New Zealand) 8.3 8.3 0.0 0.0 8.3
Europe and Northern America 15.2 28.3 39.1 45.7 52.2
Landlocked developing countries 12.5 31.3 34.4 34.4 37.5
Least developed countries 12.5 22.9 20.8 27.1 31.3
Small island developing States 2.6 5.3 5.3 7.9 10.5
Source: The Office of the United Nations High Commissioner for Human Rights (OHCHR) in collaboration with the Global Alliance
of National Human Rights Institutions (GANHRI).
(b) Proportion of countries that applied for accreditation as independent National Human Rights
Institutions in compliance with the Paris Principles
(Percentage)
Regions 2000 2005 2010 2015 2018
World 21.3 35.5 45.2 54.3 59.9
Sub-Saharan Africa 18.8 39.6 41.7 47.9 57.1
Northern Africa and Western Asia 8.3 12.5 41.7 58.3 62.5
Central and Southern Asia 21.4 28.6 42.9 71.4 71.4
Southern Asia 33.3 44.4 66.7 77.8 77.8

[E/2019/68]
Regions 2000 2005 2010 2015 2018
Eastern and South-Eastern Asia 17.7 41.2 47.1 52.9 52.9
South-Eastern Asia 18.2 36.4 45.5 54.5 54.5
Latin America and the Caribbean 26.5 41.2 50.0 52.9 55.9
Australia and New Zealand 100.0 100.0 100.0 100.0 100.0
Oceania (exc. Australia and New Zealand) 8.3 8.3 0.0 0.0 8.3
Europe and Northern America 28.3 43.5 56.5 67.4 73.9
Landlocked developing countries 12.5 34.4 43.8 59.4 65.6
Least developed countries 12.5 27.1 31.3 43.8 50.0
Small island developing States 2.6 10.5 15.8 18.4 21.1
Source: The Office of the United Nations High Commissioner for Human Rights (OHCHR) in collaboration with the Global Alliance
of National Human Rights Institutions (GANHRI).

[E/2019/68]
131
Last editted on 23/06/2019 11:43 PM
Goal 17 Strengthen the means of implementation and revitalize the Global Partnership for Sustainable Development
Target 17.1
Strengthen domestic resource mobilization, including through international support to
developing countries, to improve domestic capacity for tax and other revenue collection
Indicator 17.1.1
Total government revenue as a proportion of GDP, by source
Total government revenue as a proportion of GDP, by source
(Percentage)
Regions 2000 2010 2015 2017
Tax non-
Tax Tax
non-
Tax Tax
non-
Tax Tax
non-
Tax
World 17.9 7.7 17.7 11.1 18.4 10.6 19.4 10.3
Sub-Saharan Africa 17.4 7.0 15.2 9.6 17.7 6.0 16.9 5.0
Northern Africa and Western Asia 19.1 8.8 16.2 12.3 13.6 8.9 18.7 7.3
Northern Africa 23.4 3.5 19.3 4.7 13.9 4.7 21.7 4.6
Western Asia 14.7 14.0 13.0 19.9 13.3 13.1 15.7 10.1
Central and Southern Asia 11.2 5.7 14.1 11.8 15.4 10.6 15.9 10.5
Central Asia 13.2 1.9 17.3 6.7 19.4 9.6 18.5 9.6
Southern Asia 9.2 9.5 10.8 16.9 11.4 11.6 13.3 11.3
Eastern and South-Eastern Asia 14.2 6.3 17.0 6.5 15.6 9.4 16.8 9.8
Eastern Asia 14.5 8.4 20.4 8.8 19.2 10.6 21.5 11.8
South-eastern Asia 13.9 4.3 13.6 4.2 12.0 8.2 12.0 7.8
Latin America and the Caribbean 18.1 6.5 17.6 8.0 18.5 6.6 18.7 7.5
Oceania 20.2 5.3 21.4 15.5 23.7 18.4 24.4 18.6
Australia and New Zealand 27.8 4.4 26.5 7.0 28.6 6.7 28.6 6.5
Oceania (exc. Australia and New
Zealand) 12.6 6.3 16.2 24.0 18.9 30.1 20.3 30.6
Europe and Northern America 25.4 14.4 22.7 14.2 24.1 14.2 24.6 13.2
Europe 24.6 15.7 23.4 16.8 24.2 16.7 24.7 14.8
Northern America 26.1 13.0 22.0 11.7 24.0 11.8 24.5 11.6
Landlocked developing countries 6.0 3.6 13.0 11.1 14.7 8.8 14.8 8.0
Least developed countries 3.5 2.9 11.1 10.6 11.6 10.5 11.5 8.9
Small island developing countries 8.9 4.0 15.9 10.6 16.9 14.7 16.9 15.0
Source: Government Finance Statistics (GFS) Database classified according to the Government Finance Statistics Manual 2014
(GFSM 2014) revenue classification, International Monetary Fund (IMF).
Indicator 17.1.2
Proportion of domestic budget funded by domestic taxes
Proportion of domestic budget funded by domestic taxes
(Percentage of GDP)
Regions 2000 2005 2010 2015 2017
World 69.4 68.9 63.8 64.0 65.9
Sub-Saharan Africa 75.5 63.3 60.7 65.4 66.7

[E/2019/68]
Regions 2000 2005 2010 2015 2017
Northern Africa and Western Asia 65.0 63.5 54.9 55.2 64.2
Northern Africa 89.3 78.8 67.4 64.7 73.2
Western Asia 40.8 48.2 42.4 45.7 55.1
Central and Southern Asia 66.9 66.5 74.0 64.5 61.3
Central Asia 88.4 85.8 95.7 68.6 63.8
Southern Asia 45.3 47.3 52.4 60.5 58.9
Eastern and South-Eastern Asia 66.0 75.2 81.4 68.9 73.0
Eastern Asia 52.6 71.2 88.1 74.6 80.2
South-eastern Asia 79.4 79.1 74.7 63.2 65.7
Latin America and the Caribbean 69.4 72.3 66.3 69.9 68.5
Oceania 76.3 78.8 57.4 64.1 65.7
Australia and New Zealand 89.9 79.6 70.2 77.8 80.8
Oceania (exc. Australia and New Zealand) 62.7 78.1 44.7 50.4 50.7
Europe and Northern America 66.5 62.3 52.0 59.8 61.8
Europe 60.4 60.4 52.3 56.9 60.0
Northern America 72.5 64.1 51.7 62.6 63.6
Landlocked developing countries 57.5 55.4 57.0 59.7 58.9
Least developed countries 52.9 53.5 54.3 56.6 56.0
Small island developing countries 72.3 72.1 63.1 65.0 65.0
Source: Government Finance Statistics (GFS) Database classified according to the Government Finance Statistics Manual 2014
(GFSM 2014) revenue classification, International Monetary Fund (IMF).
Target 17.2
Developed countries to implement fully their official development assistance
commitments, including the commitment by many developed countries to achieve the
target of 0.7 per cent of gross national income for official development assistance
(ODA/GNI) to developing countries and 0.15 to 0.20 per cent of ODA/GNI to Least
developed countries; ODA providers are encouraged to consider setting a target to
provide at least 0.20 per cent of ODA/GNI to least developed countries
Indicator 17.2.1
Net official development assistance, total and to least developed countries, as a proportion of the
Organisation for Economic Cooperation and Development (OECD) Development Assistance
Committee donors’ gross national income (GNI)
Total net official development assistance (ODA) from DAC donors
(Billions of constant 2017 United States dollars)
Regions 2000 2005 2010 2017 2018
Total net ODA 72.9 118.1 122.9 147.2 143.2*
Total net ODA to landlocked developing countries 11.1 16.2 22.6 24.7 …
Total net ODA to least developed countries 19.1 28.1 41.8 42.8 …
Total net ODA to small island developing states 3.0 3.0 6.4 3.9 …
* Preliminary data.
Note: The Development Assistance Committee (DAC) of the OECD measures the headline ODA data as of 2018 on a grant equivalent
basis. See here for more details: http://www.oecd.org/dac/financing-sustainable-development/development-finance-
standards/officialdevelopmentassistancedefinitionandcoverage.htm
Source: DAC Statistics database, 2019, The Organisation for Economic Co-operation and Development (OECD).
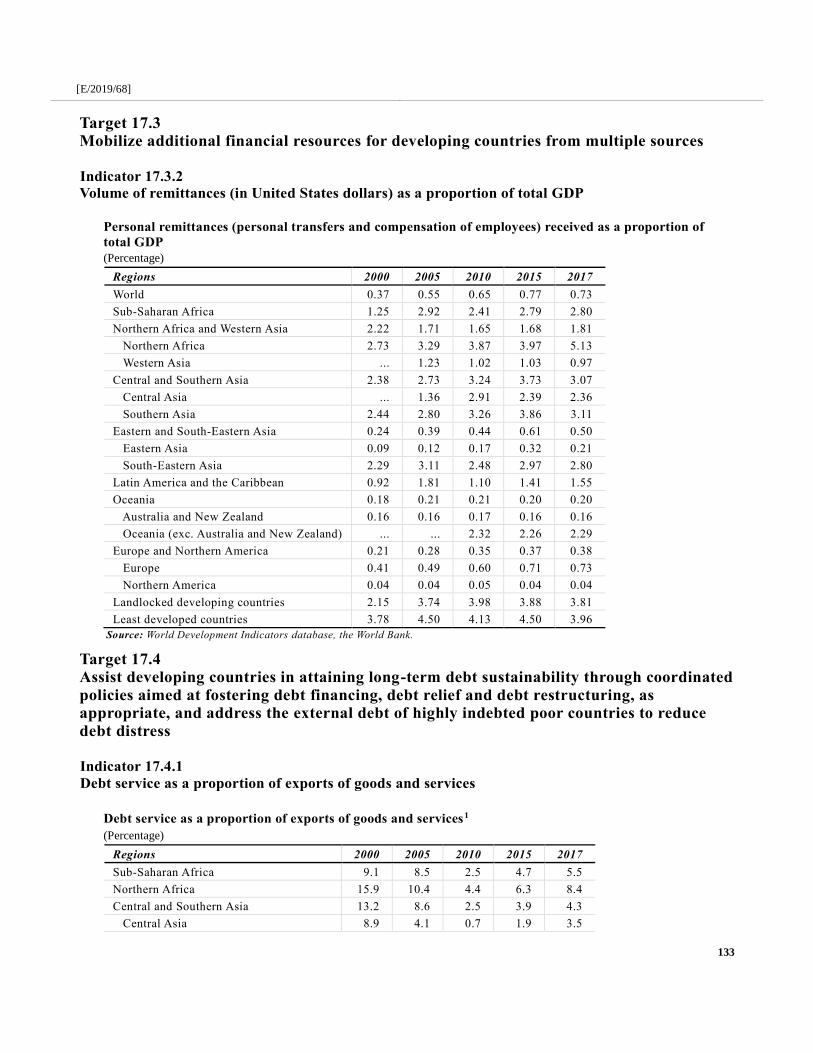
[E/2019/68]
133
Last editted on 23/06/2019 11:43 PM
Target 17.3
Mobilize additional financial resources for developing countries from multiple sources
Indicator 17.3.2
Volume of remittances (in United States dollars) as a proportion of total GDP
Personal remittances (personal transfers and compensation of employees) received as a proportion of
total GDP
(Percentage)
Regions 2000 2005 2010 2015 2017
World 0.37 0.55 0.65 0.77 0.73
Sub-Saharan Africa 1.25 2.92 2.41 2.79 2.80
Northern Africa and Western Asia 2.22 1.71 1.65 1.68 1.81
Northern Africa 2.73 3.29 3.87 3.97 5.13
Western Asia ... 1.23 1.02 1.03 0.97
Central and Southern Asia 2.38 2.73 3.24 3.73 3.07
Central Asia ... 1.36 2.91 2.39 2.36
Southern Asia 2.44 2.80 3.26 3.86 3.11
Eastern and South-Eastern Asia 0.24 0.39 0.44 0.61 0.50
Eastern Asia 0.09 0.12 0.17 0.32 0.21
South-Eastern Asia 2.29 3.11 2.48 2.97 2.80
Latin America and the Caribbean 0.92 1.81 1.10 1.41 1.55
Oceania 0.18 0.21 0.21 0.20 0.20
Australia and New Zealand 0.16 0.16 0.17 0.16 0.16
Oceania (exc. Australia and New Zealand) ... ... 2.32 2.26 2.29
Europe and Northern America 0.21 0.28 0.35 0.37 0.38
Europe 0.41 0.49 0.60 0.71 0.73
Northern America 0.04 0.04 0.05 0.04 0.04
Landlocked developing countries 2.15 3.74 3.98 3.88 3.81
Least developed countries 3.78 4.50 4.13 4.50 3.96
Source: World Development Indicators database, the World Bank.
Target 17.4
Assist developing countries in attaining long-term debt sustainability through coordinated
policies aimed at fostering debt financing, debt relief and debt restructuring, as
appropriate, and address the external debt of highly indebted poor countries to reduce
debt distress
Indicator 17.4.1
Debt service as a proportion of exports of goods and services
Debt service as a proportion of exports of goods and services1
(Percentage)
Regions 2000 2005 2010 2015 2017
Sub-Saharan Africa 9.1 8.5 2.5 4.7 5.5
Northern Africa 15.9 10.4 4.4 6.3 8.4
Central and Southern Asia 13.2 8.6 2.5 3.9 4.3
Central Asia 8.9 4.1 0.7 1.9 3.5

[E/2019/68]
Regions 2000 2005 2010 2015 2017
Southern Asia 13.6 9.4 2.8 4.1 4.3
Latin America and the Caribbean 19.7 15.9 6.5 8.9 9.8
Oceania (exc. Australia and New Zealand) 6.0 ... ... 3.7 1.7
Landlocked developing countries 8.2 4.5 1.6 3.9 5.2
Least developed countries 12.4 7.0 3.6 7.1 6.5 1Data cover only long-term public and publicly guaranteed debt and repayments (repurchases and charges) to the International
Monetary Fund (IMF).
Source: World Development Indicators database, the World Bank.
Target 17.6
Enhance North-South, South-South and triangular regional and international cooperation
on and access to science, technology and innovation and enhance knowledge-sharing on
mutually agreed terms, including through improved coordination among existing
mechanisms, in particular at the United Nations level, and through a global technology
facilitation mechanism
Indicator 17.6.2
Fixed Internet broadband subscriptions per 100 inhabitants, by speed
(a) Fixed Internet broadband subscriptions per 100 inhabitants
(Subscriptions per 100 inhabitants)
Regions 2005 2010 2015 2017
World 3.68 7.74 11.48 13.65
Sub-Saharan Africa 0.04 0.19 0.38 0.33
Northern Africa and Western Asia 1.04 3.90 7.01 8.57
Northern Africa 0.30 1.68 3.52 4.70
Western Asia 1.83 5.84 10.54 11.93
Central and Southern Asia 0.10 0.82 1.88 2.32
Central Asia 0.03 1.61 6.27 8.70
Southern Asia 0.10 0.79 1.71 2.08
Eastern and South-Eastern Asia 3.88 9.22 16.48 21.94
Eastern Asia 5.18 11.79 21.39 28.64
South-Eastern Asia 0.38 2.42 4.02 5.17
Latin America and the Caribbean 1.57 6.68 10.63 11.92
Oceania 8.71 18.41 21.40 23.85
Australia and New Zealand 9.48 24.92 29.14 32.60
Oceania (exc. Australia and New Zealand) 1.17 1.13 1.44 1.46
Europe and Northern America 11.56 23.66 29.56 31.73
Europe 7.51 21.72 28.18 30.48
Northern America 17.58 27.82 32.41 34.27
Landlocked developing countries 0.03 0.61 1.92 2.26
Least developed countries 0.01 0.11 0.75 0.97
Small island developing States 3.36 5.75 6.41 6.79
Source: Data based on the World Telecommunication/ICT Indicators Database, International Telecommunication Union (ITU)

[E/2019/68]
135
Last editted on 23/06/2019 11:43 PM
(b) Fixed Internet broadband subscriptions per 100 inhabitants, by speed
(Subscriptions per 100 inhabitants)
Regions
256 kbit/s to less
than 2 Mbit/s
subscriptions
2 Mbit/s to less than
10 Mbit/s
subscriptions
Equal to or above
10 Mbit/s
subscriptions
2015 2017 2015 2017 2015 2017
World 0.87 0.58 3.88 1.84 8.36 11.87
Sub-Saharan Africa 0.19 0.12 0.29 0.17 0.10 0.09
Northern Africa and Western Asia 1.97 2.12 2.65 2.49 2.99 3.73
Northern Africa 2.20 1.95 1.78 1.88 0.13 0.81
Western Asia 1.76 2.28 3.48 3.11 5.71 6.36
Central and Southern Asia 0.96 0.50 0.74 1.14 0.19 0.69
Central Asia 3.55 3.49 1.81 4.01 2.05 3.29
Southern Asia 0.89 0.41 0.71 1.05 0.13 0.61
Eastern and South-Eastern Asia 0.23 0.21 6.66 0.92 12.62 21.31
Eastern Asia 0.19 0.08 7.26 1.03 13.88 27.46
South-Eastern Asia 0.60 0.61 1.32 0.61 1.34 2.90
Latin America and the Caribbean 2.84 1.88 4.93 4.76 3.83 5.74
Oceania 0.58 0.05 7.51 0.22 40.16 46.08
Australia and New Zealand 0.47 ... 7.78 0.05 42.15 48.37
Oceania (exc. Australia and New
Zealand) 3.02 1.25 1.51 3.78 3.52 3.55
Europe and Northern America 0.77 0.40 6.28 4.19 22.97 26.90
Europe 0.83 0.45 6.07 3.92 21.89 25.77
Northern America 0.63 0.31 6.71 4.74 25.06 29.22
Landlocked developing countries 0.96 0.83 0.67 0.81 0.59 0.66
Least developed countries 0.56 0.31 0.27 0.65 0.12 0.14
Small island developing States 3.10 1.30 4.55 3.02 8.02 5.41
Source: Data based on the World Telecommunication/ICT Indicators Database, International Telecommunication Union (ITU)
Target 17.8
Fully operationalize the technology bank and science, technology and innovation capacity-
building mechanism for Least developed countries by 2017 and enhance the use of
enabling technology, in particular information and communications technology
Indicator 17.8.1
Proportion of individuals using the Internet
Proportion of individuals using the Internet
(Percentage)
Regions 2000 2005 2010 2015 2017
World 6.7 15.6 28.7 42.8 48.6
Sub-Saharan Africa 0.5 2.1 6.5 17.7 21.8
Northern Africa and Western Asia 2.1 10.4 28.8 45.2 54.5
Northern Africa 0.6 9.6 24.6 38.9 45.5
Western Asia 3.6 11.1 32.4 50.7 62.4
Central and Southern Asia 0.5 2.8 8.0 24.9 32.2
Central Asia 0.5 3.3 18.5 43.8 51.0
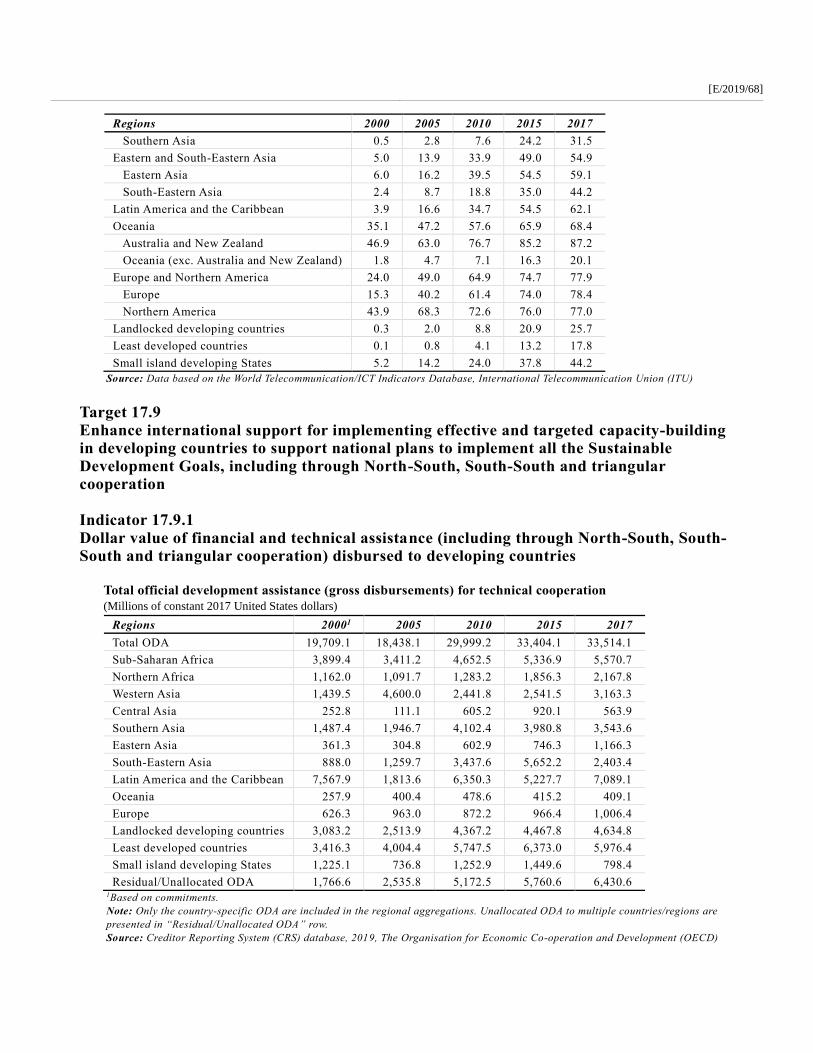
[E/2019/68]
Regions 2000 2005 2010 2015 2017
Southern Asia 0.5 2.8 7.6 24.2 31.5
Eastern and South-Eastern Asia 5.0 13.9 33.9 49.0 54.9
Eastern Asia 6.0 16.2 39.5 54.5 59.1
South-Eastern Asia 2.4 8.7 18.8 35.0 44.2
Latin America and the Caribbean 3.9 16.6 34.7 54.5 62.1
Oceania 35.1 47.2 57.6 65.9 68.4
Australia and New Zealand 46.9 63.0 76.7 85.2 87.2
Oceania (exc. Australia and New Zealand) 1.8 4.7 7.1 16.3 20.1
Europe and Northern America 24.0 49.0 64.9 74.7 77.9
Europe 15.3 40.2 61.4 74.0 78.4
Northern America 43.9 68.3 72.6 76.0 77.0
Landlocked developing countries 0.3 2.0 8.8 20.9 25.7
Least developed countries 0.1 0.8 4.1 13.2 17.8
Small island developing States 5.2 14.2 24.0 37.8 44.2 Source: Data based on the World Telecommunication/ICT Indicators Database, International Telecommunication Union (ITU)
Target 17.9
Enhance international support for implementing effective and targeted capacity-building
in developing countries to support national plans to implement all the Sustainable
Development Goals, including through North-South, South-South and triangular
cooperation
Indicator 17.9.1
Dollar value of financial and technical assistance (including through North-South, South-
South and triangular cooperation) disbursed to developing countries
Total official development assistance (gross disbursements) for technical cooperation
(Millions of constant 2017 United States dollars)
Regions 20001 2005 2010 2015 2017
Total ODA 19,709.1 18,438.1 29,999.2 33,404.1 33,514.1
Sub-Saharan Africa 3,899.4 3,411.2 4,652.5 5,336.9 5,570.7
Northern Africa 1,162.0 1,091.7 1,283.2 1,856.3 2,167.8
Western Asia 1,439.5 4,600.0 2,441.8 2,541.5 3,163.3
Central Asia 252.8 111.1 605.2 920.1 563.9
Southern Asia 1,487.4 1,946.7 4,102.4 3,980.8 3,543.6
Eastern Asia 361.3 304.8 602.9 746.3 1,166.3
South-Eastern Asia 888.0 1,259.7 3,437.6 5,652.2 2,403.4
Latin America and the Caribbean 7,567.9 1,813.6 6,350.3 5,227.7 7,089.1
Oceania 257.9 400.4 478.6 415.2 409.1
Europe 626.3 963.0 872.2 966.4 1,006.4
Landlocked developing countries 3,083.2 2,513.9 4,367.2 4,467.8 4,634.8
Least developed countries 3,416.3 4,004.4 5,747.5 6,373.0 5,976.4
Small island developing States 1,225.1 736.8 1,252.9 1,449.6 798.4
Residual/Unallocated ODA 1,766.6 2,535.8 5,172.5 5,760.6 6,430.6 1Based on commitments.
Note: Only the country-specific ODA are included in the regional aggregations. Unallocated ODA to multiple countries/regions are
presented in “Residual/Unallocated ODA” row.
Source: Creditor Reporting System (CRS) database, 2019, The Organisation for Economic Co-operation and Development (OECD)

[E/2019/68]
137
Last editted on 23/06/2019 11:43 PM
Target 17.10
Promote a universal, rules-based, open, non‑discriminatory and equitable multilateral
trading system under the World Trade Organisation, including through the conclusion of
negotiations under its Doha Development Agenda
Indicator 17.10.1
Worldwide weighted tariff-average
(a) Worldwide weighted tariff-average of all products
(Percentage)
Regions Preferential1 MFN2
2005 2010 2015 2017 2005 2010 2015 2017
World 3.2 2.5 2.5 2.2 4.5 3.5 3.7 3.4
Sub-Saharan Africa 8.3 8.0 7.4 7.1 9.4 8.8 8.5 8.5
Northern Africa and Western Asia 5.1 5.0 4.2 3.7 6.8 6.6 6.0 5.9
Northern Africa 10.9 9.9 6.5 5.4 13.5 12.2 11.0 10.4
Western Asia 3.5 3.6 3.6 3.3 5.0 5.0 4.8 4.8
Central and Southern Asia 12.8 7.7 8.7 7.2 13.4 8.1 9.2 8.1
Central Asia 3.9 5.7 6.3 2.8 7.8 9.1 8.9 3.2
Southern Asia 13.9 7.8 8.9 7.5 14.0 8.0 9.2 8.4
Eastern and South-Eastern Asia 3.5 3.2 3.2 2.6 3.9 3.8 4.9 4.3
Eastern Asia 3.7 3.4 3.6 3.0 3.9 3.8 5.2 4.1
Latin America and the Caribbean 5.0 5.2 4.1 3.7 10.8 10.7 7.3 7.1
Oceania 2.8 2.7 1.9 1.1 3.6 3.4 2.9 2.8
Australia and New Zealand 2.6 2.6 1.7 0.8 3.3 3.3 2.7 2.6
Oceania (exc. Australia and New
Zealand) 8.6 6.2 7.0 11.9 10.0 7.1 7.4 12.6
Europe and Northern America 1.9 1.2 1.2 1.1 3.2 1.8 1.8 1.8
Europe 2.3 1.1 0.9 0.9 3.8 1.6 1.5 1.5
Northern America 1.6 1.5 1.6 1.5 2.6 2.4 2.7 2.6
Landlocked developing countries 5.7 6.3 6.1 5.3 9.0 8.9 8.9 7.4
Least developed countries 9.9 9.2 8.8 7.8 11.1 10.3 10.6 9.6
Small island developing States 1.8 1.4 1.8 1.5 1.9 1.9 2.1 1.9 1Under the preferential status.
2Under the most-favoured-nation status.
Source: International Trade Centre (ITC), United Nations Conference on Trade and Development (UNCTAD) and World Trade
Organisation (WTO).
(b) Worldwide weighted tariff-average of agriculture products
(Percentage)
Regions Preferential1 MFN2
2005 2010 2015 2017 2005 2010 2015 2017
World 12.9 7.4 7.0 6.2 16.2 9.7 9.5 9.5
Sub-Saharan Africa 11.8 10.8 11.0 11.7 14.6 13.0 13.6 15.1
Northern Africa and Western Asia 11.8 12.1 10.8 11.1 13.9 14.0 12.5 13.6
Northern Africa 13.7 16.3 9.8 8.9 16.1 18.3 11.5 11.2
Western Asia 10.9 10.2 11.2 12.0 12.7 12.1 13.0 14.6
Central and Southern Asia 27.1 19.6 22.5 14.6 28.6 21.1 24.0 16.8

[E/2019/68]
Regions Preferential1 MFN2
2005 2010 2015 2017 2005 2010 2015 2017
Central Asia 8.6 6.2 7.2 3.3 16.7 14.6 14.0 5.1
Southern Asia 29.3 21.0 23.7 15.4 30.1 21.8 24.9 17.5
Eastern and South-Eastern Asia 21.8 15.6 12.9 12.0 22.6 16.9 16.1 18.9
Eastern Asia 25.1 17.8 15.2 14.1 25.4 18.6 18.0 18.3
Latin America and the Caribbean 6.1 5.7 5.7 4.2 20.7 21.2 16.3 13.6
Oceania 2.5 2.5 2.2 2.4 4.0 3.8 3.6 3.9
Australia and New Zealand 1.5 1.4 1.1 1.0 3.1 2.8 2.6 2.6
Oceania (exc. Australia and New
Zealand) 9.8 11.5 12.0 24.1 10.8 12.3 12.4 24.6
Europe and Northern America 8.7 3.3 2.6 2.4 11.7 4.8 4.0 3.9
Europe 12.2 3.4 2.5 2.3 16.0 4.6 3.6 3.4
Northern America 3.9 2.8 3.1 3.0 5.9 5.6 5.6 5.5
Landlocked developing countries 8.1 7.6 7.0 6.7 13.9 13.3 12.8 11.3
Least developed countries 9.6 9.2 9.6 8.2 11.3 11.0 12.2 10.5
Small island developing States 7.5 5.8 7.2 6.5 8.6 7.6 9.3 8.9 1Under the preferential status.
2Under the most-favoured-nation status.
Source: International Trade Centre (ITC), United Nations Conference on Trade and Development (UNCTAD) and World Trade
Organisation (WTO).
(c) Worldwide weighted tariff-average of arms
(Percentage)
Regions Preferential1 MFN2
2005 2010 2015 2017 2005 2010 2015 2017
World 5.0 2.8 2.8 2.7 5.5 3.4 3.6 3.4
Sub-Saharan Africa 18.8 15.6 16.6 14.4 19.0 15.7 16.9 15.4
Northern Africa and Western Asia 6.2 7.1 4.7 6.4 6.5 7.6 6.2 7.8
Northern Africa 24.6 9.7 8.7 24.0 25.7 10.3 16.8 27.5
Western Asia 4.8 4.7 4.1 3.3 5.0 4.9 4.7 4.4
Central and Southern Asia 35.6 17.9 10.4 10.8 35.6 19.0 14.8 10.9
Central Asia 14.4 5.1 5.0 14.5 6.2 5.0
Southern Asia 35.7 18.4 13.5 10.8 35.7 19.5 20.4 10.9
Eastern and South-Eastern Asia 3.7 6.0 5.1 5.5 3.7 7.3 6.3 6.3
Eastern Asia 3.1 3.2 2.0 1.3 3.1 3.2 2.2 1.5
Latin America and the Caribbean 13.7 13.0 8.1 8.5 16.9 15.8 12.0 14.6
Oceania 0.5 0.5 1.1 0.7 0.7 0.8 1.6 1.3
Australia and New Zealand 0.4 0.3 0.6 0.3 0.6 0.6 1.1 0.8
Oceania (exc. Australia and New
Zealand) 18.5 19.8 26.2 30.0 19.4 20.8 26.3 30.2
Europe and Northern America 0.8 0.7 0.8 0.8 1.4 1.0 1.3 1.3
Europe 1.5 0.8 0.5 0.5 2.4 1.1 0.8 0.9
Northern America 0.6 0.6 1.0 0.9 1.1 1.0 1.6 1.5
Landlocked developing countries 25.9 13.2 18.9 16.2 26.5 14.0 21.0 17.5
Least developed countries 25.4 20.3 21.7 19.4 25.7 20.8 23.6 20.6
Small island developing States 18.1 18.7 17.9 20.8 18.3 19.0 19.7 21.1 1Under the preferential status.
2Under the most-favoured-nation status.
Source: International Trade Centre (ITC), United Nations Conference on Trade and Development (UNCTAD) and World Trade
Organisation (WTO).

[E/2019/68]
139
Last editted on 23/06/2019 11:43 PM
(d) Worldwide weighted tariff-average of clothing
(Percentage)
Regions Preferential1 MFN2
2005 2010 2015 2017 2005 2010 2015 2017
World 9.2 7.6 7.3 6.6 13.0 10.3 10.7 10.6
Sub-Saharan Africa 31.6 29.3 23.1 23.6 38.3 31.7 26.9 27.9
Northern Africa and Western Asia 10.4 8.6 7.6 6.5 12.7 11.3 9.3 9.3
Northern Africa 27.3 23.5 17.9 18.7 31.4 28.5 23.1 29.3
Western Asia 6.0 5.9 5.9 4.9 7.8 8.2 6.9 6.7
Central and Southern Asia 22.2 18.1 17.9 15.4 23.0 18.5 19.1 16.6
Central Asia 10.6 12.4 17.1 7.2 12.1 12.6 17.7 7.8
Southern Asia 27.8 22.8 18.5 18.2 28.3 23.3 20.2 19.6
Eastern and South-Eastern Asia 5.9 6.0 5.0 4.7 6.6 6.9 8.0 8.6
Eastern Asia 5.9 6.0 5.2 4.8 6.4 6.7 8.0 8.4
Latin America and the Caribbean 12.5 16.9 15.8 14.2 22.7 22.1 20.7 18.7
Oceania 15.3 15.3 4.0 1.2 16.4 16.3 5.9 5.7
Australia and New Zealand 15.2 15.3 3.8 1.0 16.3 16.2 5.6 5.6
Oceania (exc. Australia and New
Zealand) 18.3 20.3 21.4 15.8 19.5 21.0 21.7 15.9
Europe and Northern America 9.6 7.1 7.2 6.5 14.0 10.1 10.8 10.5
Europe 4.9 4.1 3.6 3.4 11.5 6.8 7.0 7.2
Northern America 14.0 12.9 13.4 13.0 16.4 16.7 17.5 17.5
Landlocked developing countries 22.8 14.6 17.4 14.0 33.1 16.8 19.8 16.3
Least developed countries 25.3 20.2 19.5 22.5 28.2 22.4 21.2 24.4
Small island developing States 5.5 4.8 5.1 4.6 5.7 5.2 5.2 4.9 1Under the preferential status.
2Under the most-favoured-nation status.
Source: International Trade Centre (ITC), United Nations Conference on Trade and Development (UNCTAD) and World Trade
Organisation (WTO).
(e) Worldwide weighted tariff-average of industrial products
(Percentage)
Regions Preferential1 MFN2
2005 2010 2015 2017 2005 2010 2015 2017
World 2.5 2.1 2.0 1.7 3.7 2.9 3.1 2.7
Sub-Saharan Africa 7.9 7.7 6.8 6.1 8.8 8.3 7.7 7.2
Northern Africa and Western Asia 4.1 4.1 3.2 2.6 5.7 5.5 5.0 4.7
Northern Africa 9.6 8.4 5.7 4.5 11.9 10.8 10.9 10.0
Western Asia 2.8 2.9 2.6 2.2 4.3 4.2 3.7 3.5
Central and Southern Asia 11.4 8.0 8.1 7.1 11.8 8.4 8.5 8.0
Central Asia 3.4 5.6 5.5 2.5 6.8 8.4 7.7 2.7
Southern Asia 12.4 8.3 8.3 7.4 12.4 8.4 8.6 8.3
Eastern and South-Eastern Asia 2.4 2.6 2.6 2.0 2.8 3.2 4.2 3.2
Eastern Asia 2.5 2.8 2.9 2.2 2.6 3.1 4.5 3.1
Latin America and the Caribbean 4.9 5.0 3.7 3.5 9.9 9.7 6.2 6.2
Oceania 2.6 2.5 1.9 1.0 3.4 3.3 2.8 2.7
Australia and New Zealand 2.4 2.4 1.7 0.9 3.1 3.1 2.6 2.6

[E/2019/68]
Regions Preferential1 MFN2
2005 2010 2015 2017 2005 2010 2015 2017
Oceania (exc. Australia and New
Zealand) 8.2 5.2 5.7 8.5 9.8 6.1 6.1 9.3
Europe and Northern America 1.3 0.8 0.8 0.8 2.4 1.3 1.3 1.3
Europe 1.6 0.8 0.7 0.7 2.9 1.1 1.0 1.1
Northern America 0.9 1.0 1.0 0.9 1.9 1.7 1.8 1.8
Landlocked developing countries 5.0 5.9 5.6 4.8 7.8 8.1 8.0 6.4
Least developed countries 9.4 8.6 7.9 6.8 10.5 9.7 9.6 8.4
Small island developing States 1.5 1.1 1.4 1.2 1.6 1.6 1.6 1.5 1Under the preferential status.
2Under the most-favoured-nation status.
Source: International Trade Centre (ITC), United Nations Conference on Trade and Development (UNCTAD) and World Trade
Organisation (WTO).
(f) Worldwide weighted tariff-average of oil
(Percentage)
Regions Preferential1 MFN2
2005 2010 2015 2017 2005 2010 2015 2017
World 0.5 0.3 0.3 0.2 0.6 0.3 0.3 0.3
Sub-Saharan Africa 0.6 2.1 0.9 0.5 0.7 2.1 0.9 0.5
Northern Africa and Western Asia 1.3 0.2 0.1 0.0 2.7 1.5 1.1 1.4
Northern Africa 4.1 1.1 0.2 0.0 8.6 5.3 0.6 0.1
Western Asia 0.0 0.0 0.0 0.0 0.0 0.5 1.9 2.7
Central and Southern Asia 3.3 0.0 0.1 0.1 4.5 0.1 0.2 0.1
Central Asia 0.0 0.0 0.0 0.0 6.3 3.3 20.0 0.0
Southern Asia 4.1 0.0 0.1 0.1 4.1 0.0 0.1 0.1
Eastern and South-Eastern Asia 1.3 0.7 0.6 0.5 1.3 0.7 0.6 0.6
Eastern Asia 1.4 0.7 0.6 0.6 1.4 0.7 0.6 0.6
Latin America and the Caribbean 1.1 0.1 0.0 0.0 2.7 1.3 1.2 1.4
Oceania 0.0 0.0 0.0 0.0 0.0 0.0 0.0 0.0
Australia and New Zealand 0.0 0.0 0.0 0.0 0.0 0.0 0.0 0.0
Oceania (exc. Australia and New
Zealand) 4.0 0.0 0.0 4.2 4.0 0.0 0.0 4.2
Europe and Northern America 0.0 0.0 0.0 0.0 0.2 0.1 0.0 0.0
Europe 0.0 0.0 0.0 0.0 0.2 0.0 0.0 0.0
Northern America 0.1 0.1 0.0 0.0 0.1 0.1 0.1 0.0
Landlocked developing countries 0.0 2.1 3.9 4.6 3.9 4.3 6.6 4.7
Least developed countries 3.7 3.1 2.1 2.9 3.7 3.3 2.1 3.0
Small island developing States 0.0 0.1 0.0 0.0 0.0 0.1 0.0 0.0 1Under the preferential status.
2Under the most-favoured-nation status.
Source: International Trade Centre (ITC), United Nations Conference on Trade and Development (UNCTAD) and World Trade
Organisation (WTO).
(g) Worldwide weighted tariff-average of textile
(Percentage)
Regions Preferential1 MFN2
2005 2010 2015 2017 2005 2010 2015 2017
World 6.8 5.2 4.9 4.5 9.3 6.7 6.8 6.7
Sub-Saharan Africa 15.1 14.4 14.1 13.9 17.0 15.3 15.5 15.4

[E/2019/68]
141
Last editted on 23/06/2019 11:43 PM
Regions Preferential1 MFN2
2005 2010 2015 2017 2005 2010 2015 2017
Northern Africa and Western Asia 9.1 6.5 4.7 4.3 11.7 8.6 7.3 7.2
Northern Africa 22.6 13.4 6.4 6.0 26.9 16.6 12.1 11.8
Western Asia 3.8 3.7 4.0 3.5 5.6 5.3 5.3 5.0
Central and Southern Asia 17.6 14.5 15.7 14.3 18.0 14.9 16.0 15.2
Central Asia 11.7 13.0 14.1 5.6 16.6 15.0 15.5 6.1
Southern Asia 18.0 14.6 15.8 14.8 18.1 14.9 16.1 15.7
Eastern and South-Eastern Asia 7.5 4.6 3.8 3.4 8.6 6.2 6.8 7.2
Eastern Asia 5.7 4.3 3.7 3.4 6.6 5.4 5.7 5.9
Latin America and the Caribbean 6.8 10.0 8.4 8.2 14.0 15.5 12.0 12.0
Oceania 5.7 6.1 3.4 1.3 7.0 7.0 4.6 4.6
Australia and New Zealand 5.7 6.0 3.2 1.2 6.9 6.9 4.4 4.5
Oceania (exc. Australia and New
Zealand) 7.0 8.4 8.6 7.4 8.1 9.3 9.1 8.1
Europe and Northern America 4.9 3.5 3.4 3.2 7.5 4.5 4.6 4.5
Europe 3.3 2.2 1.9 1.9 6.7 3.2 3.2 3.2
Northern America 6.5 6.7 6.7 6.4 8.3 7.9 7.6 7.5
Landlocked developing countries 9.7 10.6 11.1 9.1 13.8 13.4 13.7 11.2
Least developed countries 13.7 15.8 13.8 14.5 14.7 16.4 15.6 16.7
Small island developing States 3.0 3.8 3.6 3.3 3.2 4.1 3.8 3.9 1Under the preferential status.
2Under the most-favoured-nation status.
Source: International Trade Centre (ITC), United Nations Conference on Trade and Development (UNCTAD) and World Trade
Organisation (WTO).
Target 17.11
Significantly increase the exports of developing countries, in particular with a view to
doubling the Least developed countries’ share of global exports by 2020
Indicator 17.11.1
Developing countries’ and Least developed countries’ share of global exports
(a) Share of global services exports
(Percentage)
Regions 2000 2005 2010 2015 2017
Sub-Saharan Africa 1.08 1.15 1.20 1.20 1.19
Northern Africa and Western Asia 4.90 4.87 5.08 5.75 5.80
Northern Africa 1.10 1.16 1.23 0.85 0.85
Western Asia 3.80 3.70 3.85 4.89 4.95
Central and Southern Asia 1.61 2.60 3.85 4.12 4.32
Central Asia 0.20 0.17 0.23 0.31 0.28
Southern Asia 2.85 4.86 7.24 7.62 8.09
Eastern and South-Eastern Asia 15.56 15.76 18.94 19.90 19.61
Eastern Asia 11.35 11.46 13.45 13.34 12.86
South-Eastern Asia 8.40 8.59 10.98 13.12 13.48
Latin America and the Caribbean 8.34 7.03 6.93 6.99 6.93
Oceania 1.71 1.71 1.71 1.47 1.59

[E/2019/68]
Regions 2000 2005 2010 2015 2017
Australia and New Zealand 1.65 1.59 1.62 1.40 1.51
Oceania (exc. Australia and New Zealand) 0.12 0.23 0.17 0.15 0.16
Europe and Northern America 71.06 70.40 65.76 64.07 64.02
Europe 49.70 54.05 49.40 47.15 47.78
Northern America 21.01 16.35 16.36 16.93 16.24
Landlocked developing countries 0.51 0.50 0.69 0.81 0.79
Least developed countries 0.46 0.45 0.62 0.77 0.74
Small island developing States 2.76 2.94 3.57 4.12 4.03
Source: International Trade Centre (ITC), United Nations Conference on Trade and Development (UNCTAD) and World Trade
Organisation (WTO).
(b) Share of global merchandise exports
(Percentage)
Regions 2000 2005 2010 2015 2017
Sub-Saharan Africa 1.44 1.85 2.25 1.72 1.70
Northern Africa and Western Asia 5.05 6.54 7.37 6.62 6.42
Northern Africa 0.85 1.11 1.16 0.64 0.64
Western Asia 4.19 5.42 6.21 5.98 5.78
Central and Southern Asia 1.68 2.17 3.01 2.83 2.99
Central Asia 0.24 0.37 0.53 0.42 0.39
Southern Asia 1.44 1.80 2.48 2.41 2.61
Eastern and South-Eastern Asia 26.17 26.60 29.71 32.63 32.34
Eastern Asia 19.51 20.35 22.85 25.60 24.92
South-Eastern Asia 6.67 6.25 6.86 7.02 7.42
Latin America and the Caribbean 5.70 5.58 5.82 5.58 5.62
Oceania 1.28 1.28 1.65 1.41 1.59
Australia and New Zealand 1.20 1.22 1.59 1.34 1.52
Oceania (exc. Australia and New Zealand) 0.08 0.06 0.06 0.07 0.07
Europe and Northern America 58.68 55.98 50.19 49.21 49.33
Europe 42.27 43.96 39.29 37.63 38.22
Northern America 16.41 12.02 10.90 11.58 11.11
Landlocked developing countries 0.53 0.74 1.08 0.94 0.91
Least developed countries 0.56 0.78 1.06 0.93 0.99
Small island developing States 2.56 2.55 2.58 2.38 2.37
Source: International Trade Centre (ITC), United Nations Conference on Trade and Development (UNCTAD) and World Trade
Organisation (WTO).
(c) Share of global service imports
(Percentage)
Regions 2000 2005 2010 2015 2017
Sub-Saharan Africa 1.69 1.99 2.80 2.43 2.19
Northern Africa and Western Asia 5.67 5.69 7.35 8.00 7.58
Northern Africa 0.89 0.96 1.19 0.95 0.90
Western Asia 4.77 4.73 6.15 7.05 6.67
Central and Southern Asia 2.39 3.67 4.40 3.78 4.20
Central Asia 0.27 0.41 0.43 0.36 0.32
Southern Asia 4.24 6.53 7.95 6.84 7.76
Eastern and South-Eastern Asia 21.44 19.70 20.72 24.45 24.32
Eastern Asia 15.90 14.32 14.78 17.70 17.71

[E/2019/68]
143
Last editted on 23/06/2019 11:43 PM
Regions 2000 2005 2010 2015 2017
South-Eastern Asia 11.10 10.76 11.88 13.50 13.22
Latin America and the Caribbean 9.44 7.46 9.14 8.87 8.41
Oceania 1.65 1.73 1.92 1.64 1.64
Australia and New Zealand 1.56 1.59 1.77 1.55 1.56
Oceania (exc. Australia and New Zealand) 0.17 0.29 0.30 0.17 0.17
Europe and Northern America 62.29 63.49 58.24 55.27 55.86
Europe 45.56 49.32 44.98 43.01 43.41
Northern America 16.56 14.17 13.26 12.25 12.45
Landlocked developing countries 0.71 0.94 1.13 1.24 1.16
Least developed countries 0.88 1.09 1.60 1.55 1.42
Small island developing States 2.59 2.76 3.24 3.99 3.85
Source: International Trade Centre (ITC), United Nations Conference on Trade and Development (UNCTAD) and World Trade
Organisation (WTO).
(d) Share of global merchandise imports
(Percentage)
Regions 2000 2005 2010 2015 2017
Sub-Saharan Africa 1.21 1.55 1.95 2.15 1.89
Northern Africa and Western Asia 4.00 4.82 5.89 6.89 6.39
Northern Africa 0.74 0.83 1.16 1.17 1.08
Western Asia 3.26 3.99 4.73 5.72 5.31
Central and Southern Asia 1.59 2.44 3.62 3.67 3.91
Central Asia 0.16 0.24 0.33 0.34 0.30
Southern Asia 1.42 2.20 3.29 3.33 3.60
Eastern and South-Eastern Asia 22.62 23.49 27.09 27.99 28.46
Eastern Asia 16.90 17.90 20.91 21.42 21.46
South-Eastern Asia 5.72 5.59 6.18 6.57 7.00
Latin America and the Caribbean 5.84 4.99 5.81 6.17 5.63
Oceania 1.38 1.50 1.60 1.54 1.57
Australia and New Zealand 1.28 1.41 1.51 1.47 1.49
Oceania (exc. Australia and New Zealand) 0.09 0.09 0.09 0.07 0.07
Europe and Northern America 63.36 61.20 54.04 51.59 52.16
Europe 40.74 42.14 38.64 35.15 36.31
Northern America 22.62 19.06 15.40 16.44 15.85
Landlocked developing countries 0.55 0.70 0.98 1.12 1.06
Least developed countries 0.65 0.81 1.10 1.43 1.39
Small island developing States 2.68 2.42 2.52 2.28 2.29
Source: International Trade Centre (ITC), United Nations Conference on Trade and Development (UNCTAD) and World Trade
Organisation (WTO).

[E/2019/68]
Target 17.12
Realize timely implementation of duty-free and quota-free market access on a lasting
basis for all Least developed countries, consistent with World Trade Organisation
decisions, including by ensuring that preferential rules of origin applicable to imports
from Least developed countries are transparent and simple, and contribute to facilitating
market access
Indicator 17.12.1 Average tariffs faced by developing countries, least developed countries and small island developing States
(a) Average tariff applied by developed countries on key products from developing countries, least
developed countries, landlocked developing countries and small island developing States, under the Most-
favoured-nation (MFN) status
(Percentage)
Regions Type of product 2000 2005 2010 2015 2017
Developing countries
All products 2.55 2.31 2.00 2.13 2.16
Agriculture products 10.71 11.16 10.45 9.09 9.03
Arms 1.57 1.54 1.73 1.83 1.66
Clothing 13.17 11.78 11.72 11.62 11.45
Industrial products 2.33 2.11 1.79 1.94 1.98
Oil 0.30 0.17 0.00 0.00 0.00
Textiles 8.30 7.24 7.11 7.10 7.14
Landlocked developing countries
All products 2.17 2.03 1.88 1.67 1.66
Agriculture products 9.90 10.19 10.07 6.58 6.55
Arms 1.25 1.29 1.27 1.67 1.50
Clothing 16.67 11.63 11.53 11.46 11.29
Industrial products 1.62 1.60 1.45 1.36 1.35
Oil 0.30 0.17 0.00 0.00 0.00
Textiles 6.05 5.71 5.63 5.59 5.50
Least developed countries
All products 3.55 3.30 3.15 3.11 3.12
Agriculture products 5.60 5.94 6.10 4.69 4.65
Arms 2.29 1.97 1.97 1.99 1.59
Clothing 13.47 12.02 11.93 11.85 11.67
Industrial products 2.18 2.10 1.94 1.93 1.98
Oil 0.30 0.17 0.00 0.00 0.00
Textiles 6.80 6.27 6.20 6.07 5.98
Small island developing States
All products 1.36 1.29 1.20 1.17 1.34
Agriculture products 19.02 17.18 16.67 7.00 7.01
Arms 0.95 0.83 0.83 0.83 0.74
Clothing 13.07 11.96 11.88 11.76 11.58
Industrial products 1.09 1.04 0.96 0.99 1.17
Oil 0.30 0.17 0.00 0.00 0.00
Textiles 7.50 7.01 6.88 6.76 6.69
Note: There is no established convention for the designation of "developed" and "developing" countries or areas in the United Natio ns
system. In common practice, Japan in Asia, Canada and the United States in northern America, Australia and New Zealand in
Oceania, and Europe with Israel and Cyprus are considered "developed" regions or areas. Until a definition of developing countries is
agreed, aggregated data for this indicator will provisionally include all countries located in "developing regions" for the p urposes of
monitoring indicators related to "developing countries".
Source: International Trade Centre (ITC), United Nations Conference on Trade and Development (UNCTAD) and World Trade
Organisation (WTO).

[E/2019/68]
145
Last editted on 23/06/2019 11:43 PM
(b) Average tariff applied by developed countries on key products from developing countries, least
developed countries, landlocked developing countries and small island developing States, under the
preferential status (Percentage)
Regions Type of product 2000 2005 2010 2015 2017
Developing countries
All products 1.64 1.32 1.05 1.15 1.18
Agriculture products 9.21 8.82 7.34 6.55 6.52
Arms 0.92 0.80 0.97 0.92 0.88
Clothing 10.79 8.36 8.01 7.71 7.50
Industrial products 1.43 1.14 0.88 1.00 1.04
Oil 0.29 0.17 0.00 0.00 0.00
Textiles 6.57 5.30 5.03 4.94 4.96
Landlocked developing countries
All products 1.15 0.95 0.73 0.77 0.79
Agriculture products 8.61 7.99 4.54 3.05 3.08
Arms 0.99 1.03 0.64 0.52 0.54
Clothing 12.20 4.86 4.77 5.31 4.92
Industrial products 0.58 0.61 0.53 0.62 0.65
Oil 0.30 0.17 0.00 0.00 0.00
Textiles 4.58 3.16 3.06 3.11 2.99
Least developed countries
All products 1.54 1.18 1.11 1.16 1.10
Agriculture products 4.25 3.65 1.89 1.55 1.45
Arms 0.95 0.82 0.87 0.88 0.73
Clothing 7.79 5.97 6.25 5.96 5.76
Industrial products 0.54 0.41 0.33 0.46 0.41
Oil 0.22 0.17 0.00 0.00 0.00
Textiles 3.86 2.69 2.61 2.50 2.35
Small island developing States
All products 0.95 0.60 0.43 0.40 0.69
Agriculture products 15.24 12.82 6.13 3.03 3.25
Arms 0.85 0.15 0.15 0.15 0.20
Clothing 8.34 2.52 2.46 2.54 2.54
Industrial products 0.76 0.50 0.37 0.36 0.65
Oil 0.30 0.17 0.00 0.00 0.00
Textiles 4.13 3.19 1.88 1.81 1.83
Note: There is no established convention for the designation of "developed" and "developing" countries or areas in the United Natio ns
system. In common practice, Japan in Asia, Canada and the United States in northern America, Australia and New Zealand in
Oceania, and Europe with Israel and Cyprus are considered "developed" regions or areas. Until a definition of developing countries is
agreed, aggregated data for this indicator will provisionally include all countries located in "developing regions" for the p urposes of
monitoring indicators related to "developing countries".
Source: International Trade Centre (ITC), United Nations Conference on Trade and Development (UNCTAD) and World Trade
Organisation (WTO).

[E/2019/68]
Target 17.15
Respect each country’s policy space and leadership to establish and implement policies
for poverty eradication and sustainable development
Indicator 17.15.1
Extent of use of country-owned results frameworks and planning tools by providers of development
cooperation
Extent of use of country-owned results frameworks and planning tools by providers of development
cooperation
(Percentage)
Proportion of new development
interventions drawn from
country-led result frameworks
Proportion of results indicators
drawn from country-led results
frameworks
Proportion of results indicators
which will be monitored using
government sources and
monitoring systems
2016 2018 2016 2018 2016 2018
All bilateral
providers 83 76 57 52 51 44
Source: Organisation for Economic Co-operation and Development (OECD) and United Nations Development Programme (UNDP).
Target 17.16
Enhance the Global Partnership for Sustainable Development, complemented by multi -
stakeholder partnerships that mobilize and share knowledge, expertise, technology and
financial resources, to support the achievement of the Sustainable Development Goals in
all countries, in particular developing countries
Indicator 17.16.1
Number of countries reporting progress in multi-stakeholder development effectiveness monitoring
frameworks that support the achievement of the sustainable development goals
Proportion of countries reporting progress in multi-stakeholder development effectiveness monitoring
frameworks that support the achievement of the sustainable development goals
(Percentage)
Proportion of countries
making progress
Proportion of countries
with no progress
Countries providing
development cooperation
53
(20 out of 38 countries assessed)
47
Countries receiving
development cooperation
41
(31 out of 76 countries assessed)
59
Note: Progress is assessed by comparing results for countries participating in the 2018 monitoring exercise of the Global Partnersh ip
for Effective Development Co-operation with the latest measurement available for each specific country. The Global Partnership
monitoring exercise is the tool used by development stakeholders to jointly assess the effectiveness of development cooperati on.
Source: Organisation for Economic Co-operation and Development (OECD) and United Nations Development Programme (UNDP).

[E/2019/68]
147
Last editted on 23/06/2019 11:43 PM
Target 17.18
By 2020, enhance capacity-building support to developing countries, including for Least
developed countries and small island developing States, to increase significantly the
availability of high-quality, timely and reliable data disaggregated by income, gender, age,
race, ethnicity, migratory status, disability, geographic location and other characteristics
relevant in national contexts
Indicator 17.18.2
Number of countries that have national statistical legislation that complies with the Fundamental
Principles of Official Statistics
Number of countries that have national statistical legislation that complies with the Fundamental
Principles of Official Statistics
(Number)
Regions 2018
World 111
Sub-Saharan Africa 22
Northern Africa and Western Asia 13
Northern Africa 4
Western Asia 9
Central and Southern Asia 7
Central Asia 3
Southern Asia 4
Eastern and South-Eastern Asia 10
Eastern Asia 5
South-Eastern Asia 5
Latin America and the Caribbean 12
Oceania 7
Australia and New Zealand 2
Oceania (exc. Australia and New Zealand) 5
Europe and Northern America 40
Europe 38
Northern America 2
Landlocked developing countries 12
Least developed countries 16
Small island developing States 10 Source: The Partnership in Statistics for Development in the 21st Century (PARIS21)

[E/2019/68]
Indicator 17.18.3
Number of countries with a national statistical plan that is fully funded and under implementation,
by source of funding
(a) Number of countries with a national statistical plan that is fully funded and under implementation
(Number)
Regions
2018
Under Implementation Fully funded and
under implementation
World 129 78
Sub-Saharan Africa 35 8
Northern Africa and Western Asia 13 10
Northern Africa 5 3
Western Asia 8 7
Central and Southern Asia 11 7
Central Asia 3 3
Southern Asia 8 4
Eastern and South-Eastern Asia 13 7
Eastern Asia 6 4
South-Eastern Asia 7 3
Latin America and the Caribbean 17 11
Oceania 5 2
Australia and New Zealand 2 2
Oceania (exc. Australia and New Zealand) 3 0
Europe and Northern America 35 33
Europe 34 32
Northern America 1 1
Landlocked developing countries 23 7
Least developed countries 30 5
Small island developing States 15 6
Source: The Partnership in Statistics for Development in the 21st Century (PARIS21)
(b) Number of countries with a national statistical plan that is under implementation, by source of
funding
(Number)
Regions 2018
Government Donors Other sources
World 119 52 21
Sub-Saharan Africa 25 21 5
Northern Africa and Western Asia 14 7 2
Northern Africa 6 4 2
Western Asia 8 3 0
Central and Southern Asia 10 7 2
Central Asia 4 3 2
Southern Asia 6 4 0
Eastern and South-Eastern Asia 9 3 0
Eastern Asia 5 2 0
South-Eastern Asia 4 1 0
Latin America and the Caribbean 17 5 3

[E/2019/68]
149
Last editted on 23/06/2019 11:43 PM
Regions 2018
Government Donors Other sources
Oceania 4 1 1
Australia and New Zealand 2 0 1
Oceania (exc. Australia and New Zealand) 2 1 0
Europe and Northern America 36 8 8
Europe 35 8 8
Northern America 1 0 0
Landlocked developing countries 19 17 4
Least developed countries 20 22 3
Small island developing States 12 4 1
Source: The Partnership in Statistics for Development in the 21st Century (PARIS21)
Target 17.19
By 2030, build on existing initiatives to develop measurements of progress on sustainable
development that complement gross domestic product, and support statistical capacity-
building in developing countries
Indicator 17.19.1
Dollar value of all resources made available to strengthen statistical capacity in developing
countries
Dollar value of all resources made available to strengthen statistical capacity
(Millions of current United States dollars)
Regions 2006 2010 2015 2016
World 214.0 448.0 590.6 623.3
Sub-Saharan Africa 62.4 79.2 280.9 166.8
Northern Africa and Western Asia 14.4 17.5 62.3 63.1
Northern Africa 6.2 3.9 12.9 55.4
Western Asia 8.2 13.6 49.3 7.6
Central and Southern Asia 15.0 148.3 17.5 10.4
Central Asia 3.6 8.7 7.5 2.7
Southern Asia 11.4 139.6 10.1 7.7
Eastern and South-Eastern Asia 20.0 15.7 23.1 7.9
Eastern Asia 5.1 1.4 6.8 0.9
South-Eastern Asia 14.8 14.4 16.3 7.0
Latin America and the Caribbean 20.0 114.8 20.7 49.3
Oceania 2.5 3.3 0.4 2.7
Oceania (exc. Australia and New Zealand) 2.5 3.3 0.4 2.7
Europe and Northern America 4.8 25.2 19.1 50.8
Europe 4.8 25.2 19.1 50.8
Landlocked developing countries 36.8 80.7 36.0 82.1
Least developed countries 62.5 106.0 176.7 135.8
Small island developing States 7.3 9.2 7.1 9.9
Note: Only country-specific commitments are included in the regional aggregations. Both country-specific commitments and
unallocated commitments to multiple countries/regions are included in the global total.
Source: 2018 Partner Report on Support to Statistics (PRESS), the Partnership in Statistics for Development in the 21st Century
(PARIS21).

[E/2019/68]
Indicator 17.19.2
Proportion of countries that (a) have conducted at least one population and housing census in the
last 10 years; and (b) have achieved 100 per cent birth registration and 80 per cent death
registration
(a) Number and proportion of countries that have conducted at least one population and housing census
in the last 10 years
Regions
Number of
censuses
conducted
2008-2017
Proportion of countries that
conducted a census
2008-2017
(Percentage)
World 212 89
Sub-Saharan Africa 41 80
Northern Africa and Western Asia 19 76
Northern Africa 5 71
Western Asia 14 78
Central and Southern Asia 12 86
Central Asia 4 80
Southern Asia 8 89
Eastern and South-Eastern Asia 18 100
Eastern Asia 7 100
South-Eastern Asia 11 100
Latin America and the Caribbean 45 90
Oceania 25 100
Australia and New Zealand 3 100
Oceania (excluding Australia and New Zealand) 22 100
Europe and Northern America 52 96
Europe 47 96
Northern America 5 100
Landlocked developing countries 26 81
Least developed countries 38 79
Small island developing States 52 98
Source: Demographic and Social Statistics Branch, United Nations Statistics Division (UNSD), Department of Economic and Social
Affairs, United Nations.
(b.1) Number and proportion of countries with birth registration data that are at least 90 per cent
complete
Regions
Number of countries
with birth registration
data that are at least
90 per cent complete,
2013-2017
Proportion of countries
with birth registration
data that are at least
90 per cent complete,
2013-2017 (Percentage)
World 143 58.1
Sub-Saharan Africa 9 17.0
Northern Africa and Western Asia 18 72.0
Northern Africa 3 42.9
Western Asia 15 83.3
Central and Southern Asia 6 42.9
Central Asia 3 60.0
Southern Asia 3 33.3
Eastern and South-Eastern Asia 9 50.0

[E/2019/68]
151
Last editted on 23/06/2019 11:43 PM
Regions
Number of countries
with birth registration
data that are at least
90 per cent complete,
2013-2017
Proportion of countries
with birth registration
data that are at least
90 per cent complete,
2013-2017 (Percentage)
Eastern Asia 5 71.4
South-Eastern Asia 4 36.4
Latin America and the Caribbean 34 66.7
Oceania 14 48.3
Australia and New Zealand 3 50.0
Oceania (exc. Australia and New Zealand) 11 47.8
Europe and Northern America 53 94.6
Europe 49 96.1
Northern America 4 80.0
Landlocked developing countries 10 31.3
Least developed countries 1 2.1
Small island developing States 35 67.3
Source: Demographic and Social Statistics Branch, United Nations Statistics Division (UNSD), Department of Economic and Social
Affairs, United Nations.
(b.2) Number and proportion of countries with death registration data that are at least 75 per cent
complete
Regions
Number of countries with
death registration data
that are at least
75 per cent complete,
2013-2017
Proportion of countries
with death registration
data that are at least
75 per cent complete,
2013-2017
(Percentage)
World 149 60.6
Sub-Saharan Africa 9 17.0
Northern Africa and Western Asia 16 64.0
Northern Africa 3 42.9
Western Asia 13 72.2
Central and Southern Asia 9 64.3
Central Asia 4 80.0
Southern Asia 5 55.6
Eastern and South-Eastern Asia 10 55.6
Eastern Asia 5 71.4
South-Eastern Asia 5 45.5
Latin America and the Caribbean 38 74.5
Oceania 14 48.3
Australia and New Zealand 3 50.0
Oceania (exc. Australia and New Zealand) 11 47.8
Europe and Northern America 53 94.6
Europe 49 96.1
Northern America 4 80.0
Landlocked developing countries 10 31.3
Least developed countries 2 4.2
Small island developing States 38 73.1
Source: Demographic and Social Statistics Branch, United Nations Statistics Division (UNSD), Department of Economic and Social
Affairs, United Nations.

[E/2019/68]