e raney (fhi 360) hugh rigby (unc) sally salisbury ... jay liebowitz (umuc), sally salisbury...
TRANSCRIPT
1

2 Guide to Monitoring and Evaluating Knowledge Management in Global Health Programs
ME &

3
Guide to Monitoring and Evaluating Knowledge Management in Global Health Programs
By Saori Ohkubo, Tara M. Sullivan, Sarah V. Harlanwith Barbara K. Timmons and Molly Strachan
Edited by Ward RinehartME &

November 2013
Authors Saori Ohkubo (JHU•CCP)
Tara M. Sullivan (JHU•CCP)
Sarah V. Harlan (JHU•CCP)
Barbara K. Timmons (MSH)
Molly Strachan (Futures)
Editor Ward Rinehart (Jura Editorial)
Cover and Layout Design Mark Beisser (JHU•CCP)
Logic Model Design Ben Peterson (JHU•CCP)
Copyeditor/Proofreader Sean Stewart (JHU•CCP)
Suggested Citation: Ohkubo, S., Sullivan, T. M., Harlan, S. V., Timmons, B. T., & Strachan, M. (2013). Guide to monitoring and evaluating knowledge management in global health programs. Baltimore, MD: Center for Communication Programs, Johns Hopkins Bloomberg School of Public Health.
http://www.globalhealthknowledge.org/sites/ghkc/files/km-monitoring-and-eval-guide.pdf
Opinions expressed herein are those of authors and do not necessarily reflect the views of USAID, or other members of GHKC or their organizations who reviewed or contributed to the Guide.
GHKC welcomes requests to translate, adapt, reprint, or otherwise reproduce the material in this document, providing the source is credited by including the suggested citation above. This work may not be used for commercial purposes. GHKC would appreciate receiving copies or electronic references to secondary uses of the Guide’s contents. Please send such references to Saori Ohkubo ([email protected]).
ISBN978-0-9894734-9-1
Contributors
Logic Model Peggy D’Adamo (USAID)
Anne Marie DiNardo (Manoff Group)
Nandita Kapadia-Kundu (JHU•CCP)
Eckhard Kleinau (RTI International)
Kavitha Nallathambi (JHU•CCP)
Ward Rinehart (Jura Editorial)
Ruwaida Salem (JHU•CCP)
Sally Salisbury (Consultant)
Joan Whelan (Core Group)
Indicators Erin Broekhuysen (JSI)
Corinne Farrell (IntraHealth)
Leah Gordon (UNC)
Cara Honzak (WWF US)
Sandra Kalscheur (FHI 360)
Theresa Norton (Jhpiego)
Laura O’Brien (MSH)
Jennifer Pearson (JSI)
Laura Raney (FHI 360)
Hugh Rigby (UNC)
Sally Salisbury (Consultant)
Contents Naheed Ahmed (JHU•CCP)
Scott Dalessandro (JHU•CCP)
Steve Goldstein (JHU•CCP)
Caroline Katz (JHSPH)
Cristi O’Connor (JHSPH)
Kavitha Nallathambi (JHU•CCP)
Angela Nash-Mercado (JHU•CCP)
Ruwaida Salem (JHU•CCP)
Rebecca Shore (JHU•CCP)
Mia Spad (JHSPH)
iii
Guide to Monitoring and Evaluating Knowledge Management in Global Health Programs
Contributors (cont’d)
Reviewers, Logic Model Nick Milton (Knoco)
Neil Pakenham-Walsh (HIFA2015)
Simone Parrish (JHU•CCP)
Ruwaida Salem (JHU•CCP)
Mona Steffen (FHI 360)
Doug Storey (JHU•CCP)
Stacey Young (USAID)
HIPNet members
Reviewers, Guide Alison Ellis (Consultant)
Willow Gerber (MSH)
Sarah Harbison (USAID)
Jay Liebowitz (UMUC)
Sally Salisbury (Consultant)
Doug Storey (JHU•CCP)
Vera Zilder (JSI)
iv

7
Acknowledgments This Guide was written by an interdependent team of writers, contributors, reviewers, and editors. It truly represents a collaborative effort of the Global Health Knowledge Collaborative (GHKC), and in particular among the members of the Monitoring and Evaluation (M&E) Task Team. This Task Team was composed of over 20 members representing various organizations with the specific objective of improving design, implementation, and measurement of knowledge management (KM) in global health programs.
We, the main authors of the Guide, feel indebted to all of the members of the GHKC. We would like to give special thanks to the following individuals, who were active participants in a series of M&E Task Team meetings, for providing important technical input into the conceptualization and development of the KM logic model: Peggy D’Adamo (USAID), Anne Marie DiNardo (Manoff Group), Nandita Kapadia-Kundu (JHU•CCP), Eckhard Kleinau (RTI International), Kavitha Nallathambi (JHU•CCP), Ward Rinehart (Jura Editorial), Sally Salisbury (Consultant), and Joan Whelan (Core Group). We would like to also thank those who reviewed and provided valuable comments on the draft version of the logic model: Nick Milton (Knoco), Neil Pakenham-Walsh (HIFA2015), Simone Parrish (JHU•CCP), Ruwaida Salem (JHU•CCP), Mona Steffen (FHI 360), Doug Storey (JHU•CCP), and Stacey Young (USAID). We are also grateful to the members of Health Information and Publications Network (HIPNet) who gave us useful feedback on our early concepts.
We would like to thank those individuals and organizations that shared with us relevant KM indicators and tools, as well as illustrative examples of how KM indicators were used: Erin Broekhuysen (JSI), Corinne Farrell (IntraHealth), Leah Gordon (UNC), Cara Honzak (WWFUS), Sandra Kalscheur (FHI 360), Theresa Norton (Jhpiego), Laura O’Brien (MSH), Jennifer Pearson (JSI), Laura Raney (FHI 360), Hugh Rigby (UNC), and Ward Rinehart (Jura Editorial). We are indebted to Sally Salisbury (Consultant) for providing us with useful comments and suggestions at numerous stages in the indicator selection process.
We would like to acknowledge content writing/review contributions to various sections of the Guide by the following individuals: Naheed Ahmed (JHU•CCP), Scott Dalessandro (JHU•CCP), Steve Goldstein (JHU•CCP), Caroline Katz (JHSPH), Kavitha Nallathambi (JHU•CCP), Angela Nash-Mercado (JHU•CCP), Cristi O’Connor (JHSPH), Ruwaida Salem (JHU•CCP), Rebecca Shore (JHU•CCP), and Mia Spad (JHSPH).
Several individuals have reviewed and provided valuable feedback and sound advice on the final draft of the Guide, bringing a wealth of experience in KM, M&E, and global health. External reviewers include: Peggy D’Adamo (USAID), Alison Ellis (Consultant), Madeline Fabic (USAID), Willow Gerber (MSH), Sarah Harbison (USAID), Jay Liebowitz (UMUC), Sally Salisbury (Consultant), Doug Storey (JHU•CCP), and Vera Zilder (JSI).
Lastly, we are extremely grateful for the support and contributions from USAID and we would like to specifically thank Peggy D’Adamo, Madeline Fabic, and Ellen Starbird for making this endeavor possible. This Guide was made possible through support from the Office of Population and Reproductive Health, Bureau for Global Health, U.S. Agency for International Development (USAID) (USAID grant number: GPO-A-OO-08-0000 6-00. Knowledge for Health Project).
v
8 Guide to Monitoring and Evaluating Knowledge Management in Global Health Programs
Acronyms
ADDIE Analysis, Design, Development, Implementation, EvaluationAG Agriculture AIDS Acquired Immune Deficiency SyndromeAIDSTAR AIDS Support and Technical Assistance ResourcesAJAX Asynchronous JavaScript and XMLAPQC American Productivity & Quality CenterCDC Centers for Disease Control and PreventionCD-ROM Compact Disc Read-Only Memory CoP Community of PracticeFAO Food and Agriculture Organization of the United NationsFP Family PlanningGAPS Global Alliance for Pre-Service EducationGHKC Global Health Knowledge CollaborativeGNH Global Newborn Health HIFA2015 Healthcare Information for All by 2015HIPNet Health Information and Publications NetworkHIPs High Impact PracticesHIV Human Immunodeficiency VirusHON The Health on the Net FoundationHONcode The Health on the Net Foundation Code of ConductHTML Hypertext Markup LanguageHTTP Hypertext Transfer ProtocolIBP Implementing Best PracticesICTs Information and Communication TechnologiesINFO Information and Knowledge for Optimal Health Project IP Internet ProtocolIR Intermediate ResultIT Information TechnologyJHSPH Johns Hopkins Bloomberg School of Public Health JHU•CCP Johns Hopkins University Center for Communication ProgramsJSI John Snow, Inc. K4Health Knowledge for Health ProjectKM Knowledge ManagementKPIs Key Performance IndicatorsLAN Local Area NetworkMSH Management Sciences for Health
vi
9
M&E Monitoring and EvaluationNCDDR National Center for the Dissemination of Disability ResearchNGO Non-Governmental OrganizationNHS National Health ServiceOECD Organization for Economic Co-operation and DevelopmentPDF Portable Document FormatPPT PowerPoint Presentation (File)PRH Population and Reproductive Health SEO Search Engine OptimizationSMART Specific, Measurable, Attainable, Relevant, Time-boundSMS Short Message ServiceSWOT Strengths, Weaknesses, Opportunities, and ThreatsTXT Text (File) UMUC University of Maryland University CollegeUNC University of North CarolinaUNDP United Nations Development ProgrammeUNFPA United Nations Population FundUNICEF United Nations Children’s FundURL Uniform Resource LocatorUSAID United States Agency for International DevelopmentVMMC Voluntary Medical Male Circumcision WHO World Health OrganizationWWF US World Wildlife Fund United States
vii

Guide to Monitoring and Evaluating Knowledge Management in Global Health Programs
Contents
CONTRIBUTORS . . . . . . . . . . . . . . . . . . . . . . . . . . . . . . . . . . . . . . . . . . . . . . . . . . . . . . . . . . iii
ACKNOWLEDGMENTS . . . . . . . . . . . . . . . . . . . . . . . . . . . . . . . . . . . . . . . . . . . . . . . . . . . . . v
ACRONYMS . . . . . . . . . . . . . . . . . . . . . . . . . . . . . . . . . . . . . . . . . . . . . . . . . . . . . . . . . . . . . . . vi
FORWARD . . . . . . . . . . . . . . . . . . . . . . . . . . . . . . . . . . . . . . . . . . . . . . . . . . . . . . . . . . . . . . . . . x
1. INTRODUCTION . . . . . . . . . . . . . . . . . . . . . . . . . . . . . . . . . . . . . . . . . . . . . . . . . . . . . . . . 1
Overview . . . . . . . . . . . . . . . . . . . . . . . . . . . . . . . . . . . . . . . . . . . . . . . . . . . . . . . . . . . . . 1
Background . . . . . . . . . . . . . . . . . . . . . . . . . . . . . . . . . . . . . . . . . . . . . . . . . . . . . . . . . . . . 2
2. INDICATORS THAT MEASURE PROCESS . . . . . . . . . . . . . . . . . . . . . . . . . . . . . . . . 17
Area 1: Knowledge assessment . . . . . . . . . . . . . . . . . . . . . . . . . . . . . . . . . . . . . . . . . . . . 18
Area 2: Knowledge generation, capture, synthesis . . . . . . . . . . . . . . . . . . . . . . . . . . . . . 22
Area 3: Knowledge sharing . . . . . . . . . . . . . . . . . . . . . . . . . . . . . . . . . . . . . . . . . . . . . . . 25
Area 4: Strengthening KM culture and capacity . . . . . . . . . . . . . . . . . . . . . . . . . . . . . . . 27
3. INDICATORS THAT MEASURE OUTPUTS REACH AND ENGAGEMENT . . . . . . . . . . . . . . . . . . . . . . . . . . . . . . . . . . . . . . . . . . . . 33
Area 1: Primary dissemination . . . . . . . . . . . . . . . . . . . . . . . . . . . . . . . . . . . . . . . . . . . . . 34
Area 2: Secondary dissemination . . . . . . . . . . . . . . . . . . . . . . . . . . . . . . . . . . . . . . . . . . . 36
Area 3: Referrals and exchange . . . . . . . . . . . . . . . . . . . . . . . . . . . . . . . . . . . . . . . . . . . . 41
4. INDICATORS THAT MEASURE OUTPUTS—USEFULNESS . . . . . . . . . . . . . . . . 45
Area 1: User satisfaction . . . . . . . . . . . . . . . . . . . . . . . . . . . . . . . . . . . . . . . . . . . . . . . . . . 46
Area 2: Quality . . . . . . . . . . . . . . . . . . . . . . . . . . . . . . . . . . . . . . . . . . . . . . . . . . . . . . . . . 48
5. INDICATORS THAT MEASURE INITIAL OUTCOMES . . . . . . . . . . . . . . . . . . . . . 53
Area 1: Learning (awareness, attitude, intention) . . . . . . . . . . . . . . . . . . . . . . . . . . . . . . 55
Area 2: Action (decision-making, policy, practice) . . . . . . . . . . . . . . . . . . . . . . . . . . . . . 58
REFERENCES . . . . . . . . . . . . . . . . . . . . . . . . . . . . . . . . . . . . . . . . . . . . . . . . . . . . . . . . . . . . . 61
GLOSSARY . . . . . . . . . . . . . . . . . . . . . . . . . . . . . . . . . . . . . . . . . . . . . . . . . . . . . . . . . . . . . . . . . 66
viii
APPENDIX
1. Consolidated List of KM M&E Indicators . . . . . . . . . . . . . . . . . . . . . . . . . . . . . . . . . 70
2. Knowledge Management Capacity Assessment Tool. . . . . . . . . . . . . . . . . . . . . . . . 79
3. Web Analytics: Recommendations and a Success Story. . . . . . . . . . . . . . . . . . . . . . 83
4. Communities of Practice: Monitoring and Evaluation. . . . . . . . . . . . . . . . . . . . . . . 87
5. Social Media: Monitoring and Evaluation. . . . . . . . . . . . . . . . . . . . . . . . . . . . . . . . . 92
6. Usability Assessment: Attributes and Methods. . . . . . . . . . . . . . . . . . . . . . . . . . . . . 96
7. System Usability Scale to Assess a KM Product. . . . . . . . . . . . . . . . . . . . . . . . . . . . 100
8. Usability Test Task Example. . . . . . . . . . . . . . . . . . . . . . . . . . . . . . . . . . . . . . . . . . . . 101
9. Illustrative Web Product User Survey . . . . . . . . . . . . . . . . . . . . . . . . . . . . . . . . . . . . 102
10. Illustrative Readership Survey . . . . . . . . . . . . . . . . . . . . . . . . . . . . . . . . . . . . . . . . . . 110
11. For Writers: Questions to Ask of an Outline . . . . . . . . . . . . . . . . . . . . . . . . . . . . . 117
12. USAID PRH Framework and Knowledge Management . . . . . . . . . . . . . . . . . . . . 118
BOX
1. Data, Information, Knowledge . . . . . . . . . . . . . . . . . . . . . . . . . . . . . . . . . . . . . . . . . 3
2. Diffusion of Innovations. . . . . . . . . . . . . . . . . . . . . . . . . . . . . . . . . . . . . . . . . . . . . . 4
3. Assess Needs, Monitor, Evaluate, and Learn. . . . . . . . . . . . . . . . . . . . . . . . . . . . . . . 11
4. Writing up a Qualitative Result. . . . . . . . . . . . . . . . . . . . . . . . . . . . . . . . . . . . . . . . . . 12
5. Courtesy Bias and Other Response Biases. . . . . . . . . . . . . . . . . . . . . . . . . . . . . . . . . 30
TABLE
1. Data Collection Methods for Knowledge Management . . . . . . . . . . . . . . . . . . . . . . 13
2. Indicators for M&E of Knowledge Management in Global Health . . . . . . . . . . . . 15
FIGURE
1. KM Activity by Category . . . . . . . . . . . . . . . . . . . . . . . . . . . . . . . . . . . . . . . . . . . . . 5
2. Logic Model . . . . . . . . . . . . . . . . . . . . . . . . . . . . . . . . . . . . . . . . . . . . . . . . . . . . . . . 6
viiii

Guide to Monitoring and Evaluating Knowledge Management in Global Health Programs
The United States Agency for International Development (USAID) believes that routinely using appropriate knowledge management (KM) tools can energize staff, increase knowledge sharing, support improved programs, and contribute to better health outcomes. In the resource-constrained environments where we work, good KM techniques can support staff learning and encourage them to share their own knowledge so that others can “connect the dots” and use that knowledge to help themselves and each other.
As we increasingly use KM approaches to support global health and development, our need to monitor and evaluate the usefulness of applying KM to our work grows. Effective monitoring and evaluation relies on the relevance of the questions asked, the quality of the data collected, the cogent analysis of the answers provided, and the ability to effectively communicate the meaning of the results. While project data, reports, and evaluations continue to be key information sources to strengthen our programming, we now understand that it is also critical to share the tacit knowledge that often explains key factors of successful programs. In our brave new world of immediate communication and technological interconnectivity, including virtual social networks, the information abundance that we experience—both tacit and explicit— makes these basic monitoring and evaluation underpinnings as important as ever.
The Guide to Monitoring and Evaluating Knowledge Management in Global Health Programs introduces standardized practices to evaluate whether KM projects, activities, and tools are effective at supporting global health and development efforts. The Guide describes the cycle of knowledge assessment, capture, generation, synthesis, and sharing, as well as how to evaluate a range of KM products, services, and tools. It offers a list of 42 indicators that program managers and evaluators can use to track the progress of their own KM activities, and instruments to measure the contribution of KM activities to health policy and program outputs and outcomes. The Guide also discusses why monitoring and evaluation of KM approaches and activities is important and provides a series of recommended techniques and tools.
As with all health interventions, continued investment in KM requires the demonstration of its value. As international donors, including USAID, strive to invest their aid budgets where they can show the greatest impact, tools such as the Guide can be used to collect relevant data to demonstrate the effectiveness of KM efforts. The Guide provides an important first step in guiding health professionals through the increasingly complex world of knowledge management.
For that reason, USAID believes in the power of KM to improve health policies and programming. Furthermore, USAID believes in the power of effective monitoring and evaluation to build evidence-based programming and policies, and appropriately direct limited resources.
Ellen StarbirdDirector, Office of Population and Reproductive HealthBureau for Global HealthUnited States Agency for International Development
FORWARD
x
1CHAPTER 1: INTRODUCTION
Overview
RATIONALE AND OBJECTIVES OF THIS GUIDE
Knowledge management (KM) is a growing strategic area in the field of global health and development. Over the past 15 years, global health professionals have come to recognize the value of KM as an approach to better share and apply knowledge and expertise at global and local levels to improve health. As a result, many of the conventional dissemination activities of health and development projects have evolved into KM activities that recognize and treat knowledge both as a resource—an input necessary to the success of activities—and as a product—a valuable output produced through experience.
As KM is a fairly new concept in global health and development, frameworks and indicators to guide KM activities in this field are limited. In 2007 the Health Information and Publications Network (HIPNet) published the Guide to Monitoring and Evaluating Health Information Products and Services. The publication offered guidance on monitoring and evaluation (M&E) with a focus on health information products and services. It included a logic model, indicators, sample instruments, and case studies. This Guide to Monitoring and Evaluating Knowledge Management in Global Health Programs aims to take that work to the next level—to provide guidance on M&E for knowledge management in international health programs. This Guide updates and expands upon the guidance provided in the 2007 version, retaining indicators that still
“work” and adding others that reflect advances in the field and expansion to areas beyond health information products and services, including participatory approaches for sharing knowledge and capturing best practices and lessons learned.
The objectives of this Guide are:
1. To define and describe knowledge and KM activities in the context of global health and development programs
2. To present a logic model that depicts the key components of KM activities and how these components interact to achieve outcomes
3. To provide a concise list of indicators to measure key aspects of KM activities
4. To provide instruments to measure the contribution of KM activities to outputs and outcomes and examples of their use
Equipped with the Guide to Monitoring and Evaluating Knowledge Management in Global Health Programs, implementers can better design, carry out, and measure the impact of their KM efforts. In a world where virtually all global health professionals are practicing KM (consciously or not), it is more important than ever to put its importance into context and gauge its contribution to health systems.
INTENDED USERS
The intended users for this Guide consist of knowledge management professionals, communication staff, M&E staff, and program managers whose health and development work involves managing and sharing knowledge. These audiences can use the Guide in all phases
CHAPTER 1INTRODUCTION
2 Guide to Monitoring and Evaluating Knowledge Management in Global Health Programs
of a KM activity—design, implementation, and M&E. This Guide may also prove useful to any program manager interested in enhancing impact through a strategy of developing, collecting, and sharing knowledge.
DEVELOPMENT OF THE GUIDE
The Global Health Knowledge Collaborative (GHKC) Monitoring and Evaluation Task Team led the work of developing this Guide. First, the Task Team developed the logic model framework (see p. 6) based on analysis of the cycle and range of KM activities in the field of global health, which are designed to produce outputs and outcomes at multiple levels. At the same time, the Task Team collected indicators from members of the GHKC. The Task Team then mapped these indicators to the logic model and consolidated them to yield a set of 42 indicators.
Experts in KM, M&E, and international health and development from the GHKC, the United States Agency for International Development (USAID), the USAID cooperating agency community, and others reviewed elements of the Guide at various points in its development. Because the indicators linked to the logic model are the foundation of the Guide, both the Task Team and the KM and M&E experts reviewed them at multiple points throughout the process, and also shared iterations of this Guide with members of the GHKC at periodic meetings to solicit feedback. USAID staff and other M&E and KM experts conducted a final review. This participatory process sought to ensure that the Guide is relevant and useful to its intended global health and development audience.
ORGANIZATION OF THE GUIDE
The Guide consists of five sections. This first section provides an introduction and background to the field of KM, the application of KM as an intervention, and the logic model that depicts the theory of change associated with KM activities. It also includes the full list of KM indicators, organized by the elements of the logic model. Following the introduction, chapters are devoted to describing each key element of the logic model and the associated indicators, as follows: Processes, Outputs, and Initial Outcomes. These chapters are further divided into sections that group similar indicators. Each indicator includes a definition, data requirements, data sources, purposes and issues, and examples. Appendices highlight specialized areas in KM, e.g., Web analytics, usability testing, and communities of practice.
Background
WHAT IS KNOWLEDGE?
Knowledge is a resource—an input necessary to the success of any organization’s activities. It is also a product—an outcome of experience that has value to others. In the business world, managers often discuss knowledge in terms of competitive advantage. By contrast, in the field of health and development, knowledge is an asset most valuable when shared. To reach health and development goals, we need to continually identify knowledge, capture it, synthesize it, share it with various counterparts, help them to use it, and help to collect and share the new knowledge generated by that experience.
Knowledge can be either explicit or tacit. Explicit knowledge is knowledge that can be effectively communicated via symbols—words and numbers, typically. Thus, it is relatively
3CHAPTER 1: INTRODUCTION
easy to capture, codify, organize, and share explicit knowledge across distances (Nonaka and Takeuchi 1995). An example of explicit knowledge is the World Health Organization’s medical eligibility criteria for contraceptive use. These criteria are available to health care providers in the form of written guidelines and checklists.
In contrast, tacit knowledge is “in people’s heads” or even in “muscle memory.” It comes largely from experience and so encompasses skills, “know-how,” perceptions, and mental models. Tacit knowledge is much harder to codify or record, and thus it is more difficult to communicate across distance and time (Nonaka and Takeuchi 1995). It is best communicated face-to-face and by demonstration. An example of tacit knowledge is how to insert a contraceptive implant properly. This skill is best learned through demonstration by and guidance from an experienced practitioner.
Both types of knowledge are important to exchange and to apply for the success of health activities. The global nature of the health community makes it necessary to meet the challenge of converting valuable tacit knowledge into explicit knowledge so that it can be shared around the world. Various KM tools have been developed to facilitate this knowledge conversion.
WHAT IS KNOWLEDGE MANAGEMENT AND HOW DID IT DEVELOP?
Knowledge management is a complex, non-linear process that relies on good processes, appropriate technology, and, most importantly, people who have the capacity and motivation to share knowledge (Milton 2005).
Knowledge management is a field that incorporates the insights of a number of disciplines including philosophy, economics, education, communication, psychology, library science, information science, information management, implementation science, information technology, and management (Lambe 2011). Because it stems from a range of disciplines, the field lacks unity in theory, practice, and measurement. As a result, while KM is gaining momentum in global health, program implementers have not consistently addressed it.
Still, knowledge management as a discipline has a traceable history. It has its philosophical roots in the work of Michael Polanyi in the 1950s (Personal Knowledge 1958). In the 1960s, economists (Arrow 1962; Machlup 1972) recognized the value of knowledge as an economic resource and showed that learning
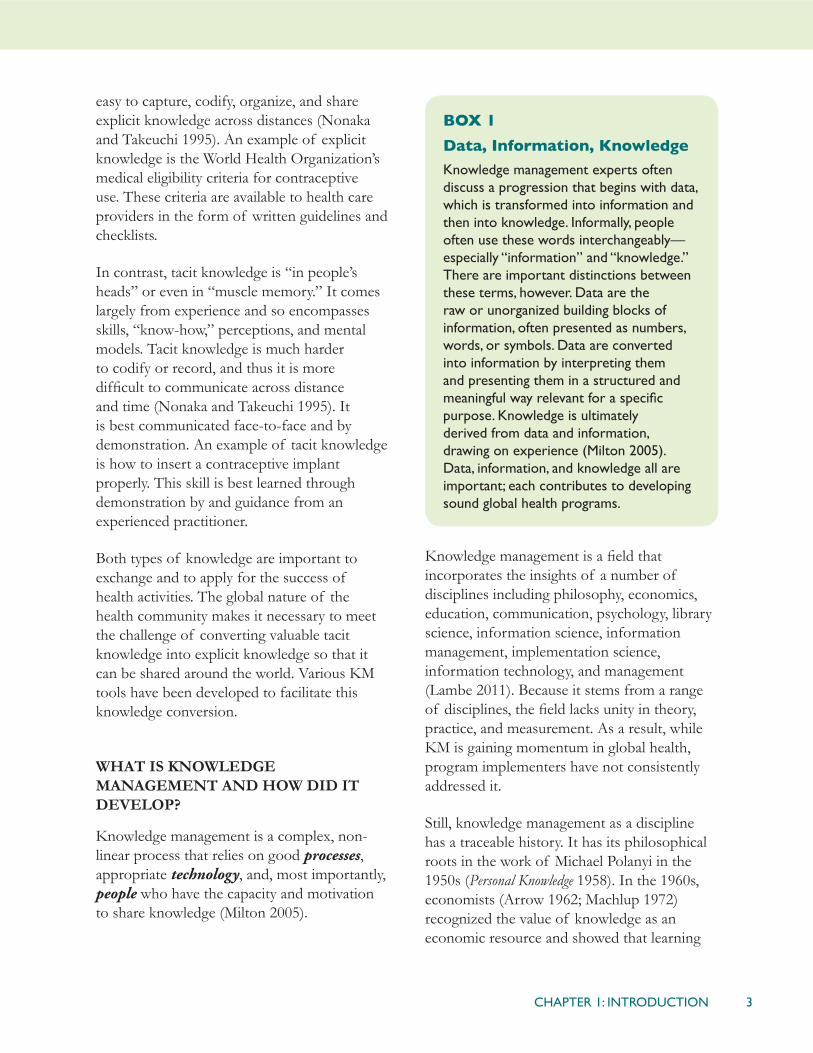
BOX 1
Data, Information, Knowledge
Knowledge management experts often discuss a progression that begins with data, which is transformed into information and then into knowledge. Informally, people often use these words interchangeably—especially “information” and “knowledge.” There are important distinctions between these terms, however. Data are the raw or unorganized building blocks of information, often presented as numbers, words, or symbols. Data are converted into information by interpreting them and presenting them in a structured and meaningful way relevant for a specific purpose. Knowledge is ultimately derived from data and information, drawing on experience (Milton 2005). Data, information, and knowledge all are important; each contributes to developing sound global health programs.
4 Guide to Monitoring and Evaluating Knowledge Management in Global Health Programs
and knowledge creation improve organizational performance (Lambe 2011). It has therefore become important to understand how knowledge can best be transferred to those who need it most. One source of answers is sociologist Everett Rogers’ theory of the diffusion of innovations.
Economists’ recognition that knowledge has value to business led in time to the development of KM as a business strategy and tool. In the 1990s, businesses began to adopt a KM perspective and to establish positions and departments responsible for KM. Soon thereafter KM began to develop as an academic discipline (Nonaka and Takeuchi 1995; Sveiby 1997). This work focused less on diffusion of knowledge and more on how large organizations can generate and capture knowledge and use it to competitive advantage.
KM entered the field of international development in the mid-1990s, beginning with the World Bank (World Bank 1999). Since then numerous international development and health organizations have adopted KM
perspectives and supported projects and activities focused on KM. An online network of KM professionals, Knowledge Management for Development (www.km4dev.org), began in 2000.
WHY IS KNOWLEDGE MANAGEMENT IMPORTANT IN GLOBAL PUBLIC HEALTH?
Throughout the world, people are literally dying for lack of information (Pakenham-Walsh 2012). Health care practitioners without the latest information cannot provide the best care, and the result can be poor health outcomes, including unnecessary loss of life. In fact, a number of health information studies have demonstrated the need for and importance of evidence-based information (Jafar et al. 2005; Nolan et al. 2001; Pakenham-Walsh 2012; Wadhwani et al. 2005; Wardlaw et al. 2006).
Health information needs assessments show that health professionals want information that is accurate, up-to-date, relevant to the local setting, and actionable (Sullivan et al. 2012). Ready access to accurate and relevant knowledge helps health practitioners make decisions and implement programs according to the latest evidence and best practices.
Organizations working in global health often have two types of useful knowledge to share. The first type is knowledge related to the various topical areas of health—for example, family planning and reproductive health. The second type is knowledge of a particular functional area that supports health goals–for example, policy and advocacy, behavior change communication, or service delivery.
No one has all the knowledge they will need to solve problems that arise in their work. Some answers are known—by someone somewhere—but the solutions have not been
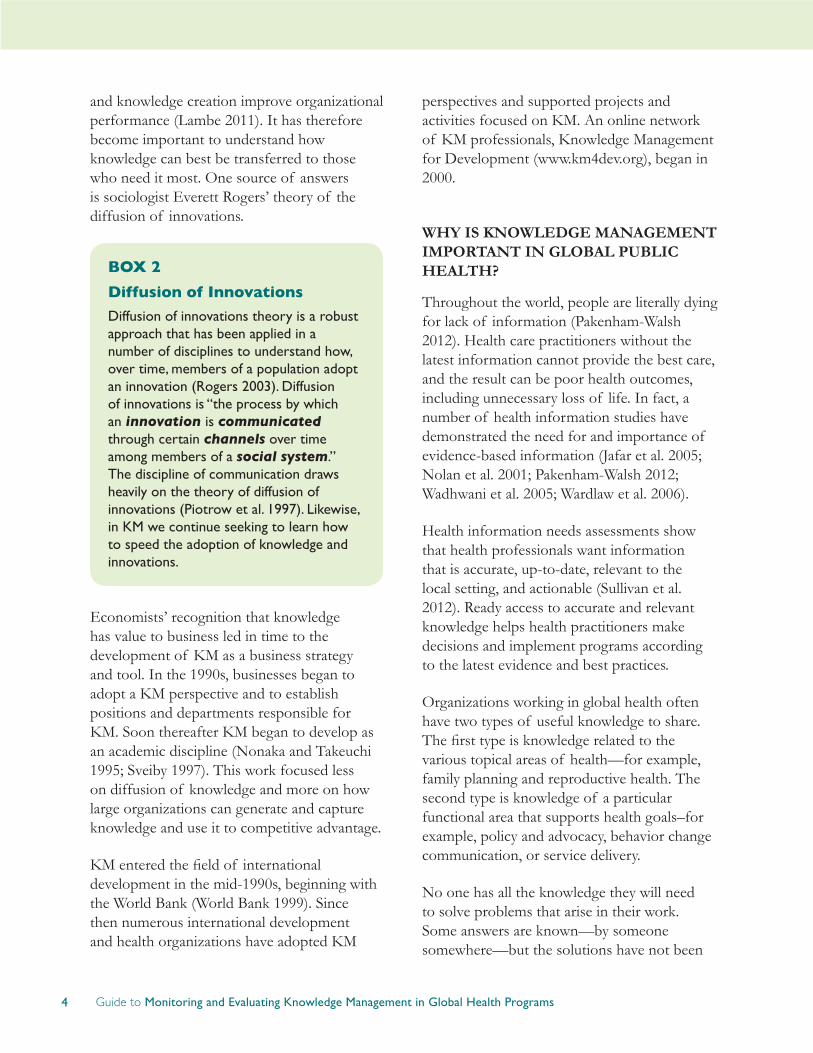
BOX 2
Diffusion of Innovations
Diffusion of innovations theory is a robust approach that has been applied in a number of disciplines to understand how, over time, members of a population adopt an innovation (Rogers 2003). Diffusion of innovations is “the process by which an innovation is communicated through certain channels over time among members of a social system.” The discipline of communication draws heavily on the theory of diffusion of innovations (Piotrow et al. 1997). Likewise, in KM we continue seeking to learn how to speed the adoption of knowledge and innovations.
5CHAPTER 1: INTRODUCTION
articulated or shared. Other knowledge has not yet been generated. Thus, KM is also about uncovering knowledge wherever it may be, while helping to develop the agenda for research to address as-yet unanswered questions.
KM links health professionals at the global, regional, and country levels, and facilitates knowledge exchange and application throughout a health system or program. Used effectively, KM activities make programs more efficient and effective, spark innovation and creativity, and empower health professionals (Kols 2004).
WHAT ARE KM ACTIVITIES?
KM activities in global health take a number of different forms. In general, however, they seek to collect knowledge, to connect people to the knowledge they need, and to facilitate learning before, during, and after program implementation (Milton 2005).
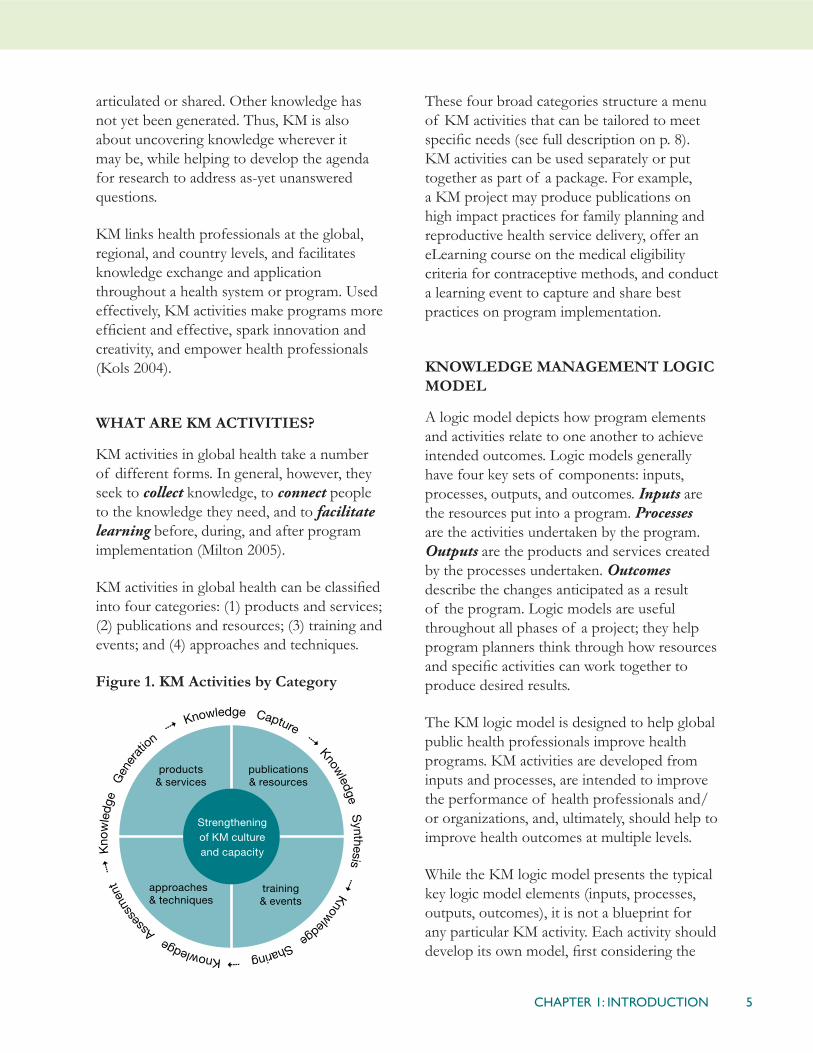
KM activities in global health can be classified into four categories: (1) products and services; (2) publications and resources; (3) training and events; and (4) approaches and techniques.
Figure 1. KM Activities by Category
These four broad categories structure a menu of KM activities that can be tailored to meet specific needs (see full description on p. 8). KM activities can be used separately or put together as part of a package. For example, a KM project may produce publications on high impact practices for family planning and reproductive health service delivery, offer an eLearning course on the medical eligibility criteria for contraceptive methods, and conduct a learning event to capture and share best practices on program implementation.
KNOWLEDGE MANAGEMENT LOGIC MODEL
A logic model depicts how program elements and activities relate to one another to achieve intended outcomes. Logic models generally have four key sets of components: inputs, processes, outputs, and outcomes. Inputs are the resources put into a program. Processes are the activities undertaken by the program. Outputs are the products and services created by the processes undertaken. Outcomes describe the changes anticipated as a result of the program. Logic models are useful throughout all phases of a project; they help program planners think through how resources and specific activities can work together to produce desired results.
The KM logic model is designed to help global public health professionals improve health programs. KM activities are developed from inputs and processes, are intended to improve the performance of health professionals and/or organizations, and, ultimately, should help to improve health outcomes at multiple levels.
While the KM logic model presents the typical key logic model elements (inputs, processes, outputs, outcomes), it is not a blueprint for any particular KM activity. Each activity should develop its own model, first considering the
6 Guide to Monitoring and Evaluating Knowledge Management in Global Health Programs
specific health situation and priorities of the setting. The goal of this Guide, and others like it, is to provide guidance on measuring the contribution of KM activities to determine which activities are most efficient and effective and in doing so justify investment in KM (Mansfield and Grunewald 2013).
PROBLEM STATEMENT
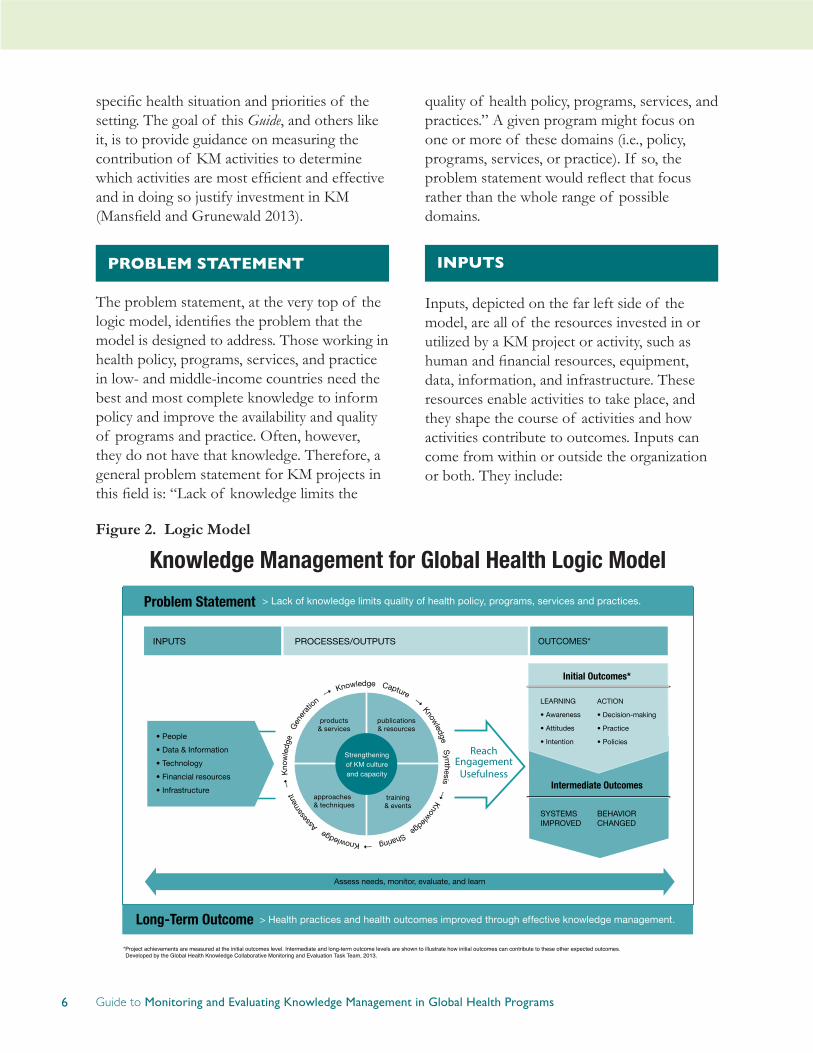
The problem statement, at the very top of the logic model, identifies the problem that the model is designed to address. Those working in health policy, programs, services, and practice in low- and middle-income countries need the best and most complete knowledge to inform policy and improve the availability and quality of programs and practice. Often, however, they do not have that knowledge. Therefore, a general problem statement for KM projects in this field is: “Lack of knowledge limits the
quality of health policy, programs, services, and practices.” A given program might focus on one or more of these domains (i.e., policy, programs, services, or practice). If so, the problem statement would reflect that focus rather than the whole range of possible domains.
INPUTS
Inputs, depicted on the far left side of the model, are all of the resources invested in or utilized by a KM project or activity, such as human and financial resources, equipment, data, information, and infrastructure. These resources enable activities to take place, and they shape the course of activities and how activities contribute to outcomes. Inputs can come from within or outside the organization or both. They include:
Figure 2. Logic Model

7CHAPTER 1: INTRODUCTION
A. People. People are the creators, sharers, and users of knowledge. As creators of knowledge, people are particularly important contributors to knowledge-based products and services. Based on their experience, individuals may create knowledge, or team members may contribute to the shared knowledge of the team. Furthermore, people can identify the tacit knowledge they possess and share it, sometimes by making it more explicit (Milton 2005).
B. Data and information. Data are the raw or unorganized building block of information, often presented as numbers, words, or symbols. People convert data into information by interpreting and presenting them in a meaningful, structured way for a specific purpose. Knowledge is ultimately derived from data and information along with direct and indirect experience and theory (Milton 2005).
C. Technology. Technology facilitates generating, capturing, organizing and storing, and exchanging knowledge. It also facilitates finding explicit knowledge. Technology tools include intranets, extranets, document management systems, databases, search engines, online communities of practice (CoP) platforms, and social networking platforms.
D. Financial resources. Adequate financial resources are necessary for successful KM initiatives. Funds are needed mostly to support people’s time devoted to KM. Funds are also needed to purchase equipment and software, for knowledge sharing events and training, to print or post publications, and to arrange face-to-face meetings.
E. Infrastructure. Infrastructure refers to structures in place that are available to support KM activities. Examples of infrastructure needed for most KM activities include office space, meeting spaces, electricity, Internet connections, a computer listserv, and a local area network (LAN).
PROCESSES
Processes define how an activity is carried out and help to determine how well it is carried out. Here, KM inputs feed into five processes that, together, constitute the knowledge cycle: (1) knowledge assessment, (2) knowledge capture, (3) knowledge generation, (4) knowledge synthesis, and (5) knowledge sharing. These five integrated knowledge processes, shown around the outside of the circle, work together to create the four key KM activities, which are the pie shapes inside the circle: (1) products and services; (2) publications and resources; (3) training and events; and (4) approaches and techniques (see full description of these KM activities on p. 8), and to build KM capacity and culture (inner circle).
The five processes of the KM cycle are described below.
A. Knowledge assessment. An effective KM process starts with identifying assets and needs for both tacit and explicit knowledge. Identifying knowledge assets and assessing knowledge needs are complementary processes. Assessing knowledge assets identifies what we know and what existing resources an organization already has in place to meet needs for knowledge and information. Assessing needs identifies what we do not know but should know. A knowledge audit
8 Guide to Monitoring and Evaluating Knowledge Management in Global Health Programs
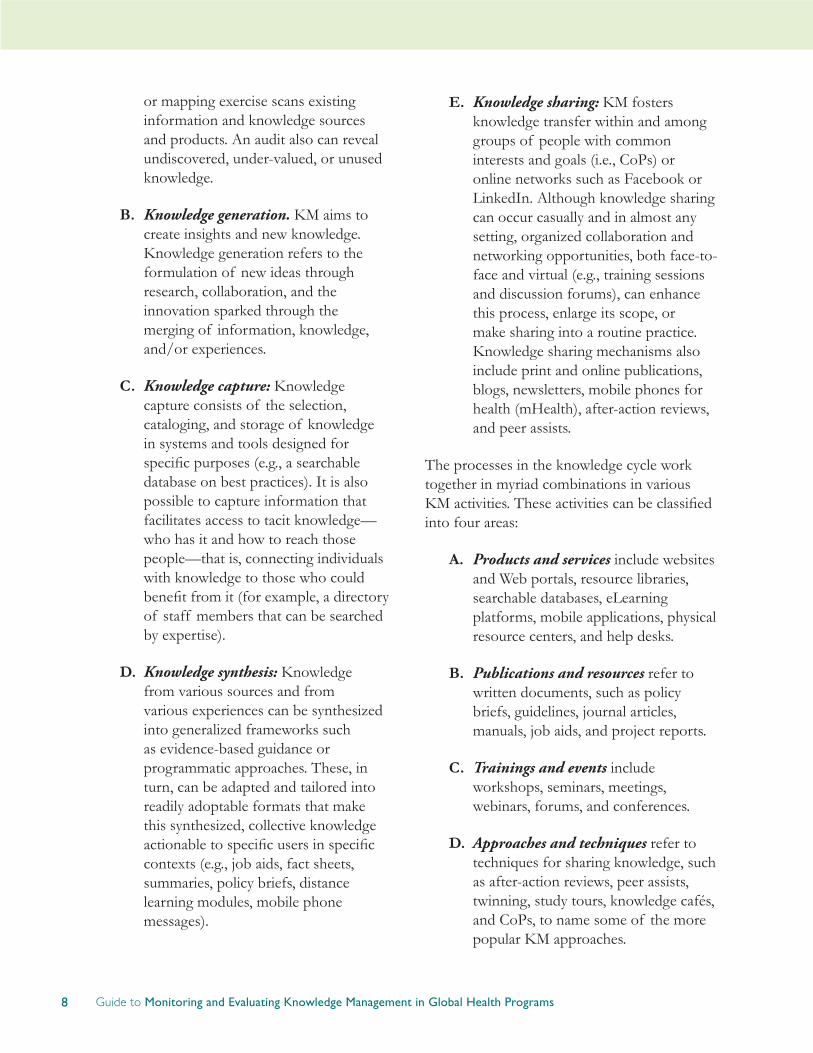
or mapping exercise scans existing information and knowledge sources and products. An audit also can reveal undiscovered, under-valued, or unused knowledge.
B. Knowledge generation. KM aims to create insights and new knowledge. Knowledge generation refers to the formulation of new ideas through research, collaboration, and the innovation sparked through the merging of information, knowledge, and/or experiences.
C. Knowledge capture: Knowledge capture consists of the selection, cataloging, and storage of knowledge in systems and tools designed for specific purposes (e.g., a searchable database on best practices). It is also possible to capture information that facilitates access to tacit knowledge—who has it and how to reach those people—that is, connecting individuals with knowledge to those who could benefit from it (for example, a directory of staff members that can be searched by expertise).
D. Knowledge synthesis: Knowledge from various sources and from various experiences can be synthesized into generalized frameworks such as evidence-based guidance or programmatic approaches. These, in turn, can be adapted and tailored into readily adoptable formats that make this synthesized, collective knowledge actionable to specific users in specific contexts (e.g., job aids, fact sheets, summaries, policy briefs, distance learning modules, mobile phone messages).
E. Knowledge sharing: KM fosters knowledge transfer within and among groups of people with common interests and goals (i.e., CoPs) or online networks such as Facebook or LinkedIn. Although knowledge sharing can occur casually and in almost any setting, organized collaboration and networking opportunities, both face-to-face and virtual (e.g., training sessions and discussion forums), can enhance this process, enlarge its scope, or make sharing into a routine practice. Knowledge sharing mechanisms also include print and online publications, blogs, newsletters, mobile phones for health (mHealth), after-action reviews, and peer assists.
The processes in the knowledge cycle work together in myriad combinations in various KM activities. These activities can be classified into four areas:
A. Products and services include websites and Web portals, resource libraries, searchable databases, eLearning platforms, mobile applications, physical resource centers, and help desks.
B. Publications and resources refer to written documents, such as policy briefs, guidelines, journal articles, manuals, job aids, and project reports.
C. Trainings and events include workshops, seminars, meetings, webinars, forums, and conferences.
D. Approaches and techniques refer to techniques for sharing knowledge, such as after-action reviews, peer assists, twinning, study tours, knowledge cafés, and CoPs, to name some of the more popular KM approaches.

9CHAPTER 1: INTRODUCTION
The five knowledge cycle processes also have long-term effects on an organization’s KM culture and KM capacity. Nurturing a culture that values KM and the strengthening of KM capacity are essential elements for the success of KM activities. Together, they can have a profoundly positive influence on organizational performance and the long-term success of global health projects.
Nurturing a KM culture is particularly important to the success of activities, projects, and organizations. Organizational culture can either encourage or discourage KM processes. It is useful to set up systems and events to create both online and physical spaces for knowledge sharing. Also, organizational champions can help nurture and strengthen a KM culture. At all levels of an organization, they can consistently, actively, and prominently endorse, demonstrate, and model KM concepts and activities. It is said that knowledge is power; this attitude can lead to knowledge hoarding as opposed to knowledge sharing. To counter this behavior, leaders can reward or recognize those who share knowledge. Raising awareness, providing incentives for knowledge sharing, and showing the value of KM (e.g., saves time and money; builds efficiencies; yields better results) can also help to nurture a KM culture.
Strengthening KM capacity is another important institutional process for KM. KM capacity can be strengthened in all five processes in the knowledge cycle (assessment, generation, capture, synthesis, and sharing) and for all of the KM activities areas (products and services, publications and resources, training and events, approaches and techniques). Strengthening KM capacity contributes to efficient and effective programs. For more on assessing KM capacity, see Appendix 2, p. 79.
OUTPUTS
Outputs are the products that result from processes. For KM programs outputs are measured in terms of reach and engagement and usefulness.
Reach and engagement are the breadth (how far out) and saturation (how deep- proportion of intended users reached) of dissemination, distribution, or referral and exchange of knowledge. KM outputs are designed to reach key user groups, such as policymakers, program managers, or health service providers. KM programs reach these users through a variety of dissemination mechanisms, ranging from print publications to webpages to Short Message Service (SMS) to tweets. Engagement relates to users’ interactions with other users and to their connection with the knowledge presented.
Usefulness is determined by two factors: satisfaction and quality. Satisfaction reflects the user’s evaluation of relevance, not only of content, but also of presentation and the delivery mechanism. Quality refers to whether KM activities are accurate, authoritative, objective, current, and covering the intended scope (Beck 2009).
OUTCOMES
Outcomes are benefits to the users that may relate to knowledge, skills, attitudes, behaviors, or health conditions. For any specific project, outcomes are expected at several levels. In this logic model we define three levels: initial, intermediate, and long-term.
10 Guide to Monitoring and Evaluating Knowledge Management in Global Health Programs
Initial outcomes
Generally, in adopting a new idea or practice, people may move through an “innovation-decision process” from initial awareness of and access to the knowledge, to confirmed or committed practice based on that knowledge (Rogers 2003). In the context of knowledge management programs, innovations are defined as the knowledge that users can obtain via the management activities described above, and sorted into four broad categories (products and services, publications and resources, training and events, and approaches and techniques). These knowledge management activities facilitate uptake of the latest research and best practices.
The initial outcomes in this Guide draw from the stages of the innovation-decision process. Here, we adapt the innovation-decision process using two main categories—learning (which is broken down further into awareness, attitudes, and intention) and action (which is applied in three areas: decision-making, practice, and policies).
Learning: awareness, attitudes, intention
Learning encompasses the progression from awareness of an innovation to one’s attitudes toward an innovation to the intention to use it.
A. Awareness constitutes a person’s recognition, understanding, and insights about an innovation, such as what the knowledge is and why it is important (Rogers 2003).
B. Attitudes. In the next stage of the innovation-decision process, people form a favorable or an unfavorable impression of the knowledge. (Rogers [2003] refers to this step as “persuasion.”) People may come to like, accept, and thus form a positive
attitude toward the knowledge through their own direct impressions, discussions with friends and colleagues, or messages they may receive.
C. Intention. Intention to use knowledge results from a decision process that people undergo to accept or reject the knowledge. People may decide to use or “adopt” the KM activities fully as “the best course of action available.” Alternatively, they may decide not to adopt the knowledge or to reject it (Rogers 2003).
Action: decision-making, practice, policies
One of the key objectives of KM programs is to put knowledge to use. Action constitutes the adoption of knowledge for decision-making purposes or for application in practice and policy.
A. Decision-making refers to the use of knowledge to inform a decision.
B. Practice refers to the use of knowledge specifically to change global health management and clinical behavior. For example, knowledge about proper infection prevention measures, as presented in a reference booklet, may enable health care providers to adopt appropriate infection prevention techniques.
C. Policy refers to the use of knowledge to inform management and/or procedure. For example, a policy brief on the success of task shifting may support development of a new policy that allows lower-level health care providers to insert contraceptive implants.

11CHAPTER 1: INTRODUCTION
Intermediate outcomes
KM intermediate outcomes result from initial outcomes. When people first learn about an innovation and then put it into action, changes in systems and behaviors can result. This Guide does not provide indicators to measure intermediate outcomes.
Systems strengthened
KM can strengthen each of the six building blocks of the World Health Organization’s health system strengthening framework: (1) health service delivery; (2) health workforce; (3) health information system; (4) medical products, vaccines, and technologies; (5) health financing; and (6) leadership and governance (K4Health 2012). Strengthening these building blocks translates into improved access, coverage, quality, and safety (WHO 2012).
Behavior changed
While most KM activities are focused on strengthening health systems, KM activities can ultimately affect the behavior of the public as health care consumers. Improvements in the quality of services provided through a
strengthened health system can translate to changes in their clients’ health behavior.
Long-term outcomes
Health practices and health outcomes improved through effective knowledge management
Improvements in the health condition or status of communities and individuals can be related to health professionals’ exposure to health information and knowledge. KM practitioners design activities bearing in mind how they will ultimately contribute to intended long-term outcomes—improvements in the health of the population. Long-term outcomes are included in the model to indicate that KM plays a pivotal role in improving health. We do not expect, however, that KM activities would be evaluated on the basis of these health indicators, particularly since knowledge is often necessary but not sufficient for changes in health status. Indicators to measure long-term outcomes are not included in this Guide.
BOX 3
Assess Needs, Monitor, Evaluate, and Learn
Throughout the KM process, and across the logic model, needs assessment findings, program experience, research findings, and lessons learned are fed back into inputs, processes, and outputs by program implementers, thus improving the development and delivery of KM activities. Assessing needs can help tailor KM programs for maximum relevance. When KM programs routinely monitor their inputs, processes, and outputs, they can quantify and describe what the program has done, who has been reached, and who has applied knowledge. Information from monitoring also helps KM programs to identify strengths and weaknesses and to make mid-term adjustments in program design and implementation (Sullivan et al. 2010). KM programs evaluate by measuring changes in initial outcomes and assessing progress toward specific objectives. Evaluation seeks to explain why an intended or expected change did or did not occur and to identify both the contributors to progress and the challenges and obstacles to change. Taken together, these activities facilitate learning by program implementers before (needs assessment), during (monitoring), and after project implementation (evaluation).
12 Guide to Monitoring and Evaluating Knowledge Management in Global Health Programs
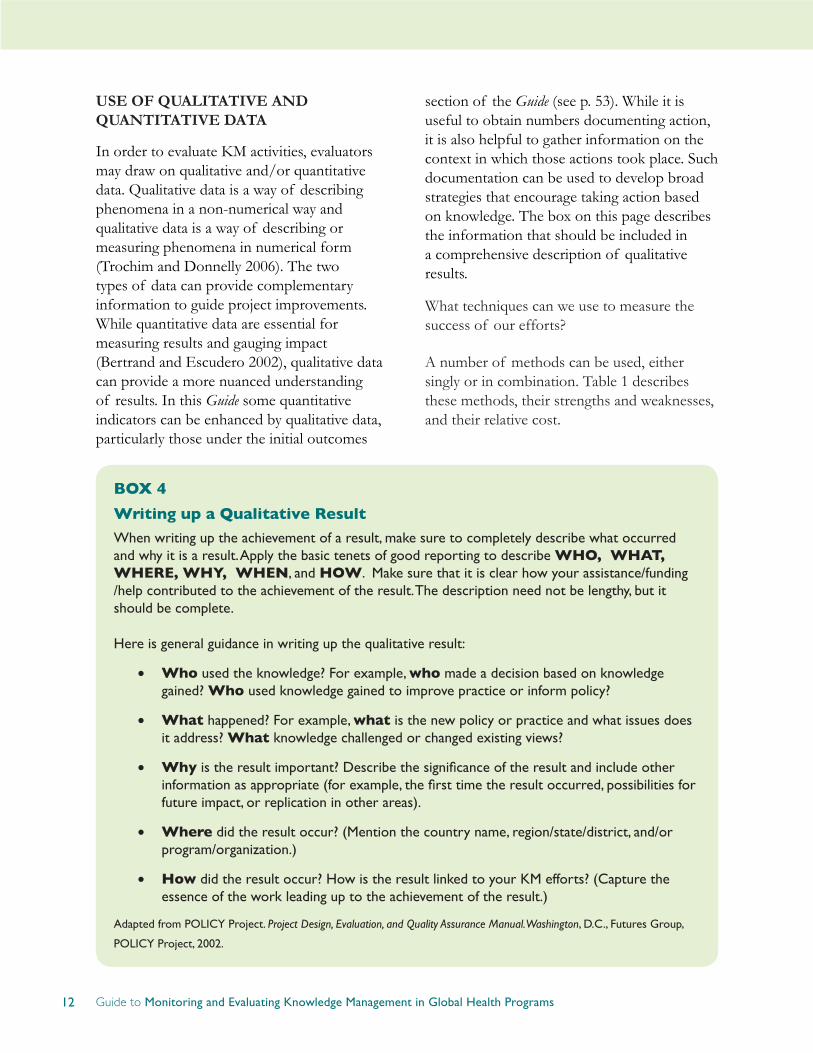
USE OF QUALITATIVE AND QUANTITATIVE DATA
In order to evaluate KM activities, evaluators may draw on qualitative and/or quantitative data. Qualitative data is a way of describing phenomena in a non-numerical way and qualitative data is a way of describing or measuring phenomena in numerical form (Trochim and Donnelly 2006). The two types of data can provide complementary information to guide project improvements. While quantitative data are essential for measuring results and gauging impact (Bertrand and Escudero 2002), qualitative data can provide a more nuanced understanding of results. In this Guide some quantitative indicators can be enhanced by qualitative data, particularly those under the initial outcomes
section of the Guide (see p. 53). While it is useful to obtain numbers documenting action, it is also helpful to gather information on the context in which those actions took place. Such documentation can be used to develop broad strategies that encourage taking action based on knowledge. The box on this page describes the information that should be included in a comprehensive description of qualitative results.
What techniques can we use to measure the success of our efforts?
A number of methods can be used, either singly or in combination. Table 1 describes these methods, their strengths and weaknesses, and their relative cost.
BOX 4
Writing up a Qualitative Result
When writing up the achievement of a result, make sure to completely describe what occurred and why it is a result. Apply the basic tenets of good reporting to describe WHO, WHAT, WHERE, WHY, WHEN, and HOW. Make sure that it is clear how your assistance/funding /help contributed to the achievement of the result. The description need not be lengthy, but it should be complete.
Here is general guidance in writing up the qualitative result:
• Who used the knowledge? For example, who made a decision based on knowledge gained? Who used knowledge gained to improve practice or inform policy?
• What happened? For example, what is the new policy or practice and what issues does it address? What knowledge challenged or changed existing views?
• Why is the result important? Describe the significance of the result and include other information as appropriate (for example, the first time the result occurred, possibilities for future impact, or replication in other areas).
• Where did the result occur? (Mention the country name, region/state/district, and/or program/organization.)
• How did the result occur? How is the result linked to your KM efforts? (Capture the essence of the work leading up to the achievement of the result.)
Adapted from POLICY Project. Project Design, Evaluation, and Quality Assurance Manual. Washington, D.C., Futures Group,
POLICY Project, 2002.
13CHAPTER 1: INTRODUCTION
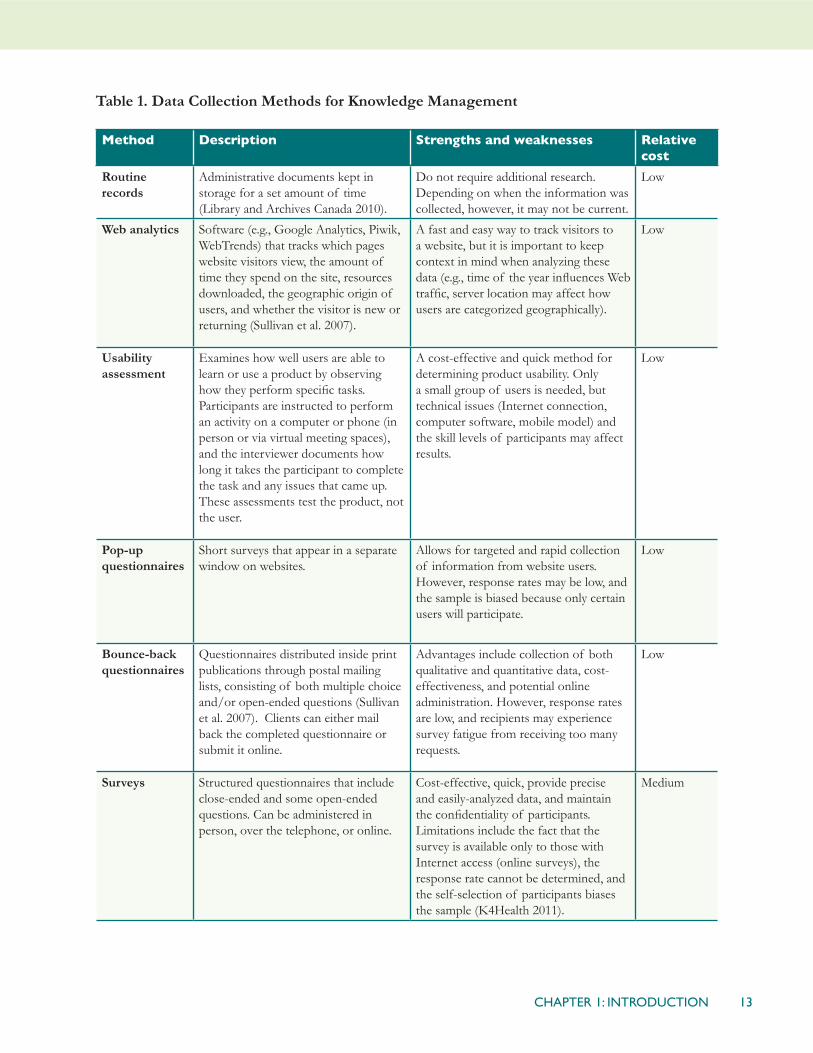
Table 1. Data Collection Methods for Knowledge Management
Method Description Strengths and weaknesses Relative cost
Routine records
Administrative documents kept in storage for a set amount of time (Library and Archives Canada 2010).
Do not require additional research. Depending on when the information was collected, however, it may not be current.
Low
Web analytics Software (e.g., Google Analytics, Piwik, WebTrends) that tracks which pages website visitors view, the amount of time they spend on the site, resources downloaded, the geographic origin of users, and whether the visitor is new or returning (Sullivan et al. 2007).
A fast and easy way to track visitors to a website, but it is important to keep context in mind when analyzing these data (e.g., time of the year influences Web traffic, server location may affect how users are categorized geographically).
Low
Usability assessment
Examines how well users are able to learn or use a product by observing how they perform specific tasks. Participants are instructed to perform an activity on a computer or phone (in person or via virtual meeting spaces), and the interviewer documents how long it takes the participant to complete the task and any issues that came up. These assessments test the product, not the user.
A cost-effective and quick method for determining product usability. Only a small group of users is needed, but technical issues (Internet connection, computer software, mobile model) and the skill levels of participants may affect results.
Low
Pop-up questionnaires
Short surveys that appear in a separate window on websites.
Allows for targeted and rapid collection of information from website users. However, response rates may be low, and the sample is biased because only certain users will participate.
Low
Bounce-back questionnaires
Questionnaires distributed inside print publications through postal mailing lists, consisting of both multiple choice and/or open-ended questions (Sullivan et al. 2007). Clients can either mail back the completed questionnaire or submit it online.
Advantages include collection of both qualitative and quantitative data, cost-effectiveness, and potential online administration. However, response rates are low, and recipients may experience survey fatigue from receiving too many requests.
Low
Surveys Structured questionnaires that include close-ended and some open-ended questions. Can be administered in person, over the telephone, or online.
Cost-effective, quick, provide precise and easily-analyzed data, and maintain the confidentiality of participants. Limitations include the fact that the survey is available only to those with Internet access (online surveys), the response rate cannot be determined, and the self-selection of participants biases the sample (K4Health 2011).
Medium

14 Guide to Monitoring and Evaluating Knowledge Management in Global Health Programs
Method Description Strengths and weaknesses Relative cost
In-depth interviews
Semi-structured interviews with open-ended questions designed to elicit in-depth responses from participants. Interviews can be conducted in person or over the telephone.
Interviews obtain detailed information and give the opportunity to ask follow-up questions. However, in-depth interviews take time to plan, coordinate, and conduct; results are subjective and not necessarily representative of the population; and, depending on sample size, analysis can be time-consuming (K4Health 2011).
Medium
Focus group discussion
Interview with group of stakeholders. Can yield nuanced responses, insight into how opinions and behaviors are informed, and information about the intended users’ attitudes and beliefs, and it allows for more rapid collection of information than individual interviews. However, focus group discussions are expensive and take time to plan and conduct; some groups may be difficult to direct; participants may give in to group dynamics and simply agree with the majority or an outspoken participant; and the opinions of the group do not necessarily represent those of the larger population (K4Health 2011).
Medium
Net mapping An interviewer works with group of stakeholders to discuss a topic or question and create a map of actors connected to the topic or question. The map specifies links among actors and the informant’s perception of the amount of influence that each actor has (K4Health 2011).
Relatively inexpensive; helps identify bottlenecks and opportunities in a network. Drawbacks include the difficulty of scheduling sessions with stakeholders and the subjective nature of information from participants.
Medium
Content analysis
Study of KM activity users’ text, recorded speech, and photographs on a specific topic. This method can reveal communication trends and patterns and the attitudes and beliefs of individuals and groups.
Useful for learning about intended users but requires much time, and the findings will not necessarily be representative of the larger population (Colorado State University 2013).
Medium
Case studies Study of an event and how and why it occurred, through interviews, participant observation, and records, to explore a specific topic or event (Colorado State University 2013).
Provides a comprehensive examination of an issue. It is costly, narrow in focus (not possible to extrapolate to the larger population), and takes time.
High
Social network analysis
Study of discussions on a specific topic on Internet social media sites to determine how people connect, their views on issues, and trends in opinions over time.
Assists with learning how users perceive your organization and can inform strategies to make your own social media sites more interactive. Often expensive and time-consuming, however.
High
15CHAPTER 1: INTRODUCTION
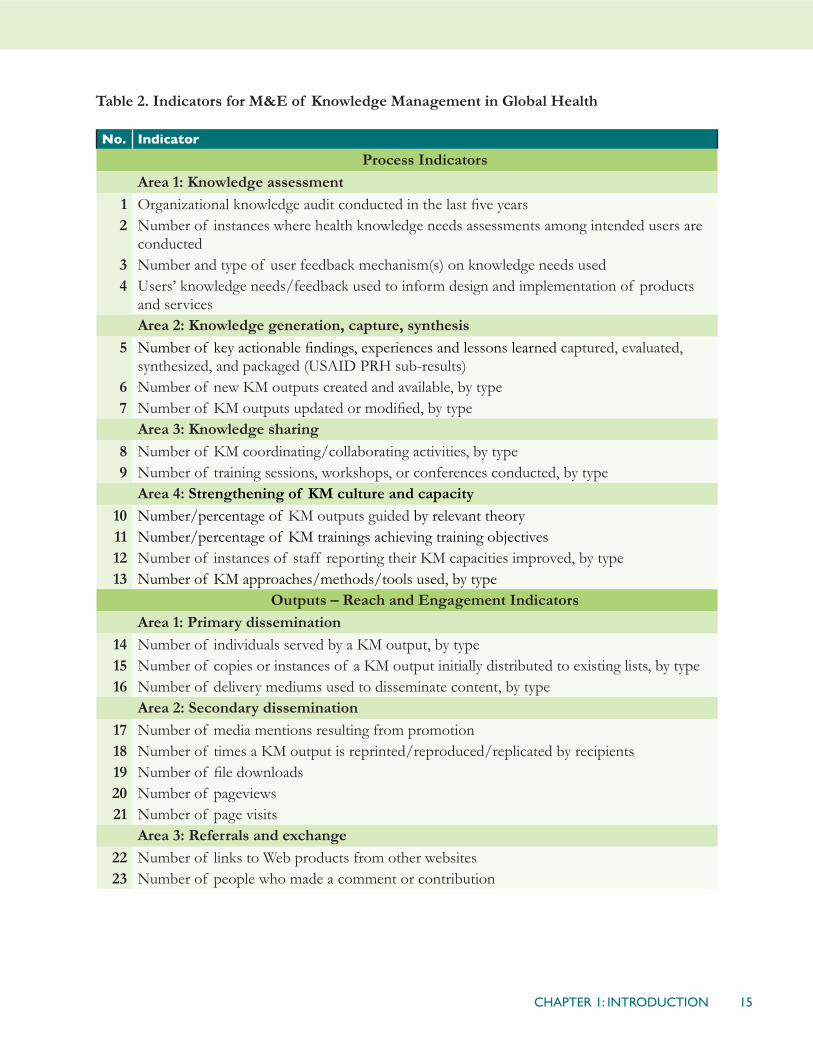
Table 2. Indicators for M&E of Knowledge Management in Global Health
No. Indicator
Process IndicatorsArea 1: Knowledge assessment
1 Organizational knowledge audit conducted in the last five years2 Number of instances where health knowledge needs assessments among intended users are
conducted3 Number and type of user feedback mechanism(s) on knowledge needs used4 Users’ knowledge needs/feedback used to inform design and implementation of products
and services Area 2: Knowledge generation, capture, synthesis
5 Number of key actionable findings, experiences and lessons learned captured, evaluated, synthesized, and packaged (USAID PRH sub-results)
6 Number of new KM outputs created and available, by type7 Number of KM outputs updated or modified, by type
Area 3: Knowledge sharing8 Number of KM coordinating/collaborating activities, by type9 Number of training sessions, workshops, or conferences conducted, by type
Area 4: Strengthening of KM culture and capacity10 Number/percentage of KM outputs guided by relevant theory11 Number/percentage of KM trainings achieving training objectives12 Number of instances of staff reporting their KM capacities improved, by type13 Number of KM approaches/methods/tools used, by type
Outputs – Reach and Engagement IndicatorsArea 1: Primary dissemination
14 Number of individuals served by a KM output, by type15 Number of copies or instances of a KM output initially distributed to existing lists, by type16 Number of delivery mediums used to disseminate content, by type
Area 2: Secondary dissemination 17 Number of media mentions resulting from promotion18 Number of times a KM output is reprinted/reproduced/replicated by recipients19 Number of file downloads20 Number of pageviews21 Number of page visits
Area 3: Referrals and exchange22 Number of links to Web products from other websites23 Number of people who made a comment or contribution

16 Guide to Monitoring and Evaluating Knowledge Management in Global Health Programs
No. Indicator
Outputs – Usefulness IndicatorsArea 1: User satisfaction
24 Number/percentage of intended users receiving a KM output that read or browsed it25 Number/percentage of intended users who are satisfied with a KM output26 User rating of usability of KM output27 User rating of content of KM output and its relevance28 Number/percentage of intended users who recommend a KM output to a colleague
Area 2: Quality 29 Average pageviews per website visit30 Average duration of website visits31 Number of citations of a journal article or other KM publication32 Number/percentage of intended users adapting a KM output33 Number/percentage of intended users translating a KM output
Initial Outcome IndicatorsArea 1: Learning (awareness, attitude, intention)
34 Number/percent of intended users who report a KM output provided new knowledge35 Number/percentage of intended users who report a KM output reinforced or validated
existing knowledge36 Number/percentage of intended users who can recall correct information about
knowledge/innovation37 Number/percentage of intended users who are confident in using knowledge/innovation38 Number/percentage of intended users who report that information/knowledge from a KM
output changed/reinforced their views, opinions, or beliefs39 Number/percentage of intended users who intend to use information and knowledge gained
from a KM outputArea 2: Action (decision-making, policy, practice)
40 Number/percentage of intended users applying knowledge/innovation to make decisions (organizational or personal)
41 Number/percentage of intended users applying knowledge/innovation to improve practice (in program, service delivery, training/education, and research)
42 Number/percentage of intended users applying knowledge/innovation to inform policy

17CHAPTER 2: INDICATOR THAT MEASURE PROCESS
Overview
“Process”—one of the three key elements of KM—refers to a series of activities that transforms KM from theory to public health practice. The indicators in this section describe activities that organizations undertake to plan and carry out successful KM programs and activities—i.e., KM activities that increase the application of knowledge to improve global health and enhance development.
These indicators also examine the capacity of public health organizations to apply KM tools and methods and indicate the extent to which user assessment findings are fed back into KM work. They can help assure KM programs that their activities are implemented systematically, using theory, user feedback, and appropriate collaborative mechanisms.
In this chapter (and throughout the Guide), we use the term “users” to refer to the groups that
CHAPTER 2INDICATORS THAT MEASURE PROCESS
Process Indicators
No.
Area 1: Knowledge assessment
1 Organizational knowledge audit conducted in the last five years2 Number of instances where health knowledge needs assessments among intended users are
conducted3 Number and type of user feedback mechanism(s) on knowledge needs used4 Users’ knowledge needs/feedback used to inform design and implementation of products
and services Area 2: Knowledge generation, capture, synthesis
5 Number of key actionable findings, experiences and lessons learned captured, evaluated, synthesized, and packaged (USAID PRH sub-results)
6 Number of new KM outputs created and available, by type7 Number of KM outputs updated or modified, by type
Area 3: Knowledge sharing
8 Number of KM coordinating/collaborating activities, by type9 Number of training sessions, workshops, or conferences conducted, by type
Area 4: Strengthening KM culture and capacity
10 Number/percentage of KM outputs guided by relevant theory11 Number/percentage of KM trainings achieving training objectives12 Number of instances of staff reporting their KM capacities improved, by type13 Number of KM approaches/methods/tools used, by type
18 Guide to Monitoring and Evaluating Knowledge Management in Global Health Programs
KM activities intend to engage and interact with—through knowledge resources, technical assistance, communities of practice (CoPs), and other activities. In the context of global health, these groups can be health care service providers, decision-makers, and program managers. Their clients (health care consumers) will benefit, in turn, from improvements in services made possible through knowledge management.
AREA 1: KNOWLEDGE ASSESSMENT
Before planning and carrying out KM activities, organizations can conduct a knowledge assessment in order to understand:
1) Knowledge needs and capacity within the project or organization (internal or organizational KM audit); and
2) Knowledge needs of the intended users (external knowledge needs assessment).
Knowledge assessments help organizations design KM programs tailored to respond more directly and specifically to knowledge needs—those of their own staff as well as those of the intended users.
INDICATOR 1:Organizational knowledge audit conducted in the last five years (y/n with evidence-based narrative)
Definition: This indicator refers to an audit conducted within an organization in order to determine organizational knowledge assets, gaps, and challenges, and to develop recommendations for addressing them through training, enhanced communication, or other
improvements (Asian Development Bank 2008).
Data requirements: Self-report of KM audit within the last five years; evidence of knowledge assessment: KM audit score; documentation of knowledge assets, gaps, challenges, and recommendations.
Data source(s): Administrative/programmatic records (e.g., knowledge assessment report).
Purposes and issues: It may be difficult to know where to begin implementing KM activities. The KM audit allows organizations to take stock of needs for tacit and explicit knowledge in order to tailor and better design KM initiatives, both internally and for the benefit of its intended users.
The defining feature of a knowledge audit is that it places people at the center of concerns: it purports to find out what people know, and what they do with the knowledge they have. It can be described as an investigation of the knowledge needs of an organization and the interconnectivity among leadership, organization, technology, and learning in meeting these. (Asian Development Bank 2008)
A knowledge audit can be performed by organization staff (i.e., a self-assessment) or by a third party. In either case, information obtained by a KM audit will provide insight and evidence about a number of topics, including:
• The organization’s definition of knowledge management
• Tacit and explicit knowledge assets of the organization and where they are located
• Where the organization places KM

19CHAPTER 2: INDICATOR THAT MEASURE PROCESS
activities in the organizational structure
• Whether (and how) staff members bring external knowledge back to the organization and use it internally
• Whether staff members think that technology is used appropriately to record, organize, and exchange knowledge
• How much support for KM—financially and in word/deed—exists among senior management
• How knowledge is created, identified, organized, and/or used
• How knowledge flows within the organization
• What barriers obstruct the flow of knowledge
• Where there might be missed opportunities for better knowledge capture, organization, sharing, and use
• What difficulties or challenges project staff face with regard to knowledge creation, access, and use, and, conversely, what support does the organization provide
• What knowledge gaps exist within the organization
• How (and how well) the organization’s knowledge (including that of staff members) is transferred to audiences
Sources: APQC 2011; Asian Development Bank 2008
An internal KM audit can help identify the key knowledge needs, sources, strengths, opportunities, and challenges within the organization. The results should enable the staff to create a “knowledge inventory”—a
directory of the locations of knowledge products and services available to the staff (including details about purpose, accessibility, and intended audiences), as well as information about which working units (or groups of people) have specific knowledge that might be useful to others. The inventory will also list knowledge gaps (Asian Development Bank 2008).
This inventory will help staff members to clearly understand their own roles and expectations (and those of the organization) and to determine what improvements should be made to the KM system (Asian Development Bank 2008). Staff members can then work as a team to strengthen KM capacity and help to shape an organizational environment that supports KM. (See Indicators 10–13. Specifically, Indicators 11 and 12 on pp. 29-31 can be used as direct follow-up indicators to Indicator 1; they can measure changes in KM capacity after initially identifying knowledge gaps.)
To keep this information current and to gauge progress, KM audits should be undertaken at regular intervals at least every five years. Information older than five years should be considered unreliable.
Self-assessment templates that organizations can complete:
• LearningtoFly(Collison and Parcell 2004)
• KM Capacity Assessment Tool (Appendix 2 on p. 79)
• WhereAreYouNow?AKnowledgeManagementProgramSelf-Assessment. (APQC 2011), http://www.k4health.org/toolkits/km/where-are-you-now-knowledge-management-program-self-assessment

20 Guide to Monitoring and Evaluating Knowledge Management in Global Health Programs
INDICATOR 2: Number of health knowledge needs assessments conducted with intended users
Definition: A needs assessment is a systematic process for identifying gaps between current and desired conditions and determining how to close them. It involves taking inventory of needs, prioritizing them, and developing solutions to address them (Altschuld and Kumar 2009; Gupta 2007).
In the context of KM for global health, there are two main levels of users: a) in-country partner organizations and b) their clients – health care consumers. Thus, conducting knowledge needs assessments among in-country partner organizations helps the in-country organization become aware of its knowledge assets/needs and helps the partner organization see where support to KM would be most beneficial for the partner and the clients they serve.
This indicator specifically measures needs assessments among users external to the implementing organization. (For internal organizational assessments, see Indicator 1.)
Data requirements: Self-report of number and type of needs assessments conducted.
Data source(s): Administrative/programmatic records.
Purposes and issues: A health knowledge needs assessment among intended users is an important first step in planning for KM activities and/or KM technical assistance. It helps organizations and projects determine knowledge resources, knowledge flow, and knowledge needs and captures the current capacity of KM systems (throughout the KM process) in a certain country, region, community, or topic area (for example,
among HIV/AIDS policy-makers). This understanding informs the design of activities to strengthen and improve the systems of the in-country partner (K4Health 2011). Once needs and problems are clearly defined, resources can then be dedicated to closing knowledge gaps and developing practical solutions.
The information generated by a knowledge needs assessment is context-specific. Therefore, a new needs assessment should be conducted in each new setting (country, region, etc.) and with each group of intended users (e.g., program managers, policy-makers). Furthermore, when conducting an assessment of KM in the health care system, it is important to examine its various administrative levels—national, regional, district, and community, for example—to understand the differing needs at each level, current information flows, and barriers to and opportunities for knowledge exchange between levels of the health system.
A number of methodologies can help technical assistance projects understand the KM needs of their in-country partners/clients. These include environmental scans, literature reviews, key informant interviews, focus group discussions, surveys, and network mapping (or Net-Map, a social mapping tool in which respondents work with interviewers to address a key question and create a network map of actors related to the question or topic of inquiry). Using these tools, project staff can collect data about knowledge gaps, health information networks, preferred methods of communication, existing tools and technology, flow of information, barriers to knowledge exchange, and current infrastructure (K4Health 2011).
Considering the quickly changing nature of technology and access to it in low- and mid-
21CHAPTER 2: INDICATOR THAT MEASURE PROCESS
income countries, knowledge needs should be continuously monitored to ensure that KM programs are taking advantage of new and improved technology as appropriate.
For detailed guidance for each of the methodologies mentioned above, please see the K4Health Guide to Conducting Health Information NeedsAssessments: http://www.k4health.org/resources/k4health-guide-conducting-needs-assessments. Further instructions on Net-Map can be found at http://netmap.wordpress.com/.
INDICATOR 3:Number and type of mechanism(s) used to obtain feedback on knowledge needs
Definition: This indicator refers to the collection of feedback from users of KM outputs. The number and types of mechanisms are recorded here. These mechanisms might include surveys, questionnaires, interviews, rating forms, opinion polls, focus group discussions, and usability assessment/testing.
In this context the feedback process involves the application of users’ comments and opinions about the usefulness and usability of KM outputs to improve outputs and/or to develop new activities.
Data requirements: Self-report of number of user feedback mechanisms used, by type.
Data source(s): Administrative records.
Purposes and issues: This indicator measures the various ways in which feedback is collected from intended users. Using multiple methods to collect this feedback ultimately leads to higher quality data. Casting a wide net can help cover different preferences that users may have to for responding to an online survey (e.g., including an option to email
from a website, print feedback form and mail, etc.). Additionally, more methods can lead to greater confidence with the results, due to the triangulation of data from different sources (e.g., conducting interviews, surveys, etc.).
Since these data are disaggregated by type, this indicator can also help an organization identify what vehicles are most useful for collecting users’ information and adjust their approaches accordingly.
See Chapter 4 on pp. 45-52 for a number of indicators that measure the usefulness of KM products and processes to clients.
INDICATOR 4: Users’ knowledge needs/feedback used to inform design and implementation of products and services (y/n)
Definition: This indicator refers to the use of data on current or intended users’ needs and of their feedback to develop and/or improve KM products and services.
Data requirements: Self-report of types of updates and changes made to KM products and services as a result of information from current or prospective users about their views of these products and services or about their knowledge needs.
Data source(s): Feedback forms or surveys among current or intended users.
Purposes and issues: This indicator can apply to both new and existing products and services. Its purpose is to assess whether evidence on users’ needs and preferences is influencing the direction of activities.
A continual feedback loop is intended to increase access to and use of knowledge outputs by making them more responsive to

22 Guide to Monitoring and Evaluating Knowledge Management in Global Health Programs
the needs of the intended users. For example, a website may contain a feedback form for users to comment on navigation, design elements, number of clicks to reach a resource, usefulness of content, or the way in which knowledge is synthesized. This information can then feed back into the design of the site and its functions. For example, users may comment that certain important resources in a website are hidden and require too many clicks to find. The website manager can consider highlighting these resources on the home page and/or create an easier navigation path.
Feedback can address an entire program broadly (for example, “What do you think of the X, Y, or Z program?”) or its parts (for example, delivery of eLearning, the ability to access online resources in remote locations, or the relevance of materials).
This indicator reflects whether the needs and wishes expressed by stakeholders are guiding a program’s KM activities. User demand should drive KM and knowledge exchange activities (World Bank 2011). However, individuals do not always know what the gaps in their knowledge are (in other words, they do not always know what they do not know). To circumvent this problem, it can be helpful to start with questions about implementation challenges. Answers to questions such as “What would you like to do that you are unable to do?” or “What would you like this product to do that it does not do?” will provide insight into knowledge gaps and challenges that users face. By then asking users what knowledge would help them solve the problems they have identified, organizations can take stock of demand and work to develop knowledge exchange solutions to address users’ specific needs.
AREA 2: GENERATION, CAPTURE, SYNTHESIS
This section includes indicators that measure the continuous and systematic process of combining knowledge from different sources to generate new ideas, capture and document existing evidence, and synthesize information from a variety of sources (Nonaka and Takeuchi 1995).
Knowledge generation refers to the formulation of new ideas by merging information, knowledge, and/or experiences. This process can consist of socialization (tacit to tacit transfer of knowledge), externalization (tacit to explicit), combination (explicit to explicit), and/or internalization (explicit to tacit) (Nonaka and Takeuchi 1995).
Knowledge capture involves various techniques that document various types of technical knowledge, experiences, perceptions, and insights in forms and formats that can be transferred to others. These outputs may take a conventional form (such as journal articles or research briefs) or may be in the form of knowledge sharing activities (such as a peer assist, in which a group of colleagues meet to learn from others’ experiences before implementing a new activity) (Ramalingam 2006).
Knowledge synthesis refers to the sifting, integration, and contextualization of research results and experiential knowledge in order to create a knowledge base on a specific topic (Grimshaw 2011). This synthesis can occur because of an immediate need—and thus is immediately applied—or it can be stored for future use. This process is integral to knowledge sharing, learning, and use of knowledge (see Chapter 5 Area 2 on pp. 58-60 for indicators about action). In the context of

23CHAPTER 2: INDICATOR THAT MEASURE PROCESS
public health, knowledge synthesis is crucial to promoting the use of the latest evidence to guide decisions regarding clinical care, policy, programming, or funding (UNDP/UNFPA/WHO/World Bank 2008). For example, authors of Cochrane reviews—systematic reviews of primary research—undertake a rigorous process in order to synthesize research results and provide evidence-based information online to a global audience. (For more about Cochrane reviews, see http://www.cochrane.org/cochrane-reviews).
INDICATOR 5: Number of key actionable findings, experiences, and lessons learned captured, evaluated, synthesized, and packaged (USAID PRH sub-result)
Definition: This indicator refers to the documentation, in response to field needs, of knowledge that can be applied to improve practice. This is usually an internal indicator, although it might occasionally apply to assessing the progress of a KM activity with a partner. This indicator is also a USAID Population and Reproductive Health sub-result.
“Actionable findings” are observations that inform decision-making and suggest appropriate action. In the context of global health, findings are made “actionable” when they are interpreted and packaged in a way that helps users understand and appreciate their implications for program activities.
“Experiences” are defined as “active participation in events or activities, leading to the accumulation of knowledge or skills” (Houghton Mifflin Company 2000).
“Lessons learned” are “generalizations based on evaluation experiences with projects, programs, or policies that abstract
from the specific circumstances to broader situations.” Lessons learned often shed light on strengths or weaknesses in the preparation, implementation, outcome, or impact of an activity or project (OECD 2010).
Data requirements: Self-report of the number of findings, experiences, and lessons learned.
Data source(s): Administrative records.
Purposes and issues: Understanding and responding to field needs is central to the practice of KM for global health. In order to do this, though, it is necessary to first document results, experiences, and lessons learned. Knowledge in the field can manifest itself in a variety of forms; see the list of KM outputs under Indicator 6.
To determine the most appropriate form for documentation, the type of knowledge (tacit/explicit) must be considered, as well as the purpose of the knowledge transfer (socialization, externalization, combination, and/or internalization) (Nonaka and Takeuchi 1995). Generally, the best forms are those that make knowledge readily accessible and applicable to intended users so that it can be disseminated and validated in new contexts (USAID 2012). (For indicators to measure reach and dissemination of materials, see Chapter 3 on pp. 33-43.) For example, “high-impact practices” in family planning (HIPs) are practices identified by technical experts as promising or best practices that, when scaled up and institutionalized, will maximize the return on investments in a comprehensive family planning strategy. This information has been packaged as a series of briefs that can be easily distributed to—and understood by—service providers, program managers, policy makers, and others who can put this knowledge into practice. This is an instance of

24 Guide to Monitoring and Evaluating Knowledge Management in Global Health Programs
evaluating and packaging findings to inform decision-making and improve global health practice. (For more on HIPs, please see http://www.fphighimpactpractices.org/.)
INDICATOR 6: Number of new KM outputs created and made available, by type
Definition: This indicator refers to new KM outputs created and made available to intended users.
In knowledge management the term “output” refers to a tool for sharing knowledge, within the organization and/or with the clients. Outputs can take many forms, including products and services, publications and other knowledge resources, training and other knowledge-sharing events, procedures, and techniques. (See pp. 8-9 for more on KM outputs.)
This Guide identifies a wide range of outputs and categorizes them into four main areas below:
• Products and services (e.g., websites, mobile applications, applied technologies, resource centers)
• Publications and resources (e.g., policy briefs, journal articles, project reports)
• Training and events (e.g., workshops, seminars, mentoring sessions)
• Approaches and techniques (e.g., reviews, reporting, communities of practice)
Illustrative examples of more specific indicators are as follows:
• Number of new mobile applications developed
• Number of new research briefs written
• Number of new eLearning courses completed
• Number of new knowledge sharing techniques developed
Data requirements: Self-report of number of new outputs, by type.
Data source(s): Administrative records.
Purposes and issues: In any field—and global health is no exception—the creation of new knowledge is imperative. The process of knowledge creation promotes communication across the field and leads to the implementation of innovative activities. In highlighting the number of new outputs, this indicator reflects the generation and synthesis of knowledge.
Making these resources available to intended users is also included in this indicator. Measuring reach against specific quantitative objectives, however, is addressed in Chapter 3.
INDICATOR 7: Number of KM outputs updated or modified, by type
Definition: The complement to indicator 6, this indicator refers to changes made to existing KM outputs.
Data requirements: Self-report of updated or modified resources (either number of updates or, for continuously updated materials, descriptive information), by type.
Data source(s): Administrative records.
Purposes and issues: In addition to measuring new outputs (see Indicator 6), it is also important to ensure that existing outputs are kept up-to-date to include the latest research findings and lessons learned from the global health field. Both written publications

25CHAPTER 2: INDICATOR THAT MEASURE PROCESS
and online resources can be updated. Some online resources, such as publication databases, are continuously updated. In the case of websites, including a date stamp can show users how current the information is. There are also organizations that evaluate health information, such as The Health on the Net (HON) Foundation, which applies the HONcode (The Health on the Net Foundation Code of Conduct) to medical and health websites (for more information, see the HON website: http://www.hon.ch/).
In addition to adding research findings and lessons learned, one might need to respond to changing content needs in the field—for example, a new disease outbreak in a region or the introduction of a new information technology (such as SMS used to return HIV test results to clinics). Knowledge generation is a continuous process, and KM resources/outputs should be designed as living tools that can be modified and supplemented as needed. These updates and modifications keep KM outputs valuable to users and help ensure that they continue to have an impact on programs.
Note that this indicator refers only to resources altered by the originating organization. To report a resource modified or adapted by another organization, see Indicator 32 on p. 51.
AREA 3: KNOWLEDGE SHARING
Although there are many definitions of KM, a common theme among them is the need to make the right information available to the right people at the right time. Accordingly, knowledge sharing is a crucial element of KM. Many KM initiatives design strategic activities to ensure that knowledge is shared (Frost 2010).
Some KM theorists have defined knowledge sharing as discretionary behavior that “in the aggregate promotes the effective functioning of the organization” (Bordia et al. 2004). To support knowledge sharing, organizations can put systems in place that encourage knowledge transfer and promote the application of knowledge within the organization and among organizations working in related areas.
The indicators in this section gauge how organizations foster knowledge transfer among groups of people with common interests and purposes. Sharing of knowledge can occur in both formal and informal settings. A number of mechanisms—either in-person or virtual—can enhance and provide structure to knowledge sharing activities. These can include training sessions, CoPs, online forums, conferences, and workshops. Additional activities can be used to support more informal knowledge sharing. For instance, an organization could install a coffee machine in a central location so that people from various units would have the chance to meet by coincidence and share information in a more casual setting. Use of online social network platforms can also promote spontaneous knowledge sharing among colleagues and CoP members.
This section focuses on the sharing of knowledge—whether within the same project, among KM colleagues in the field, or among staff from different organizations (e.g., a community of practice). It covers both tacit knowledge (knowledge based on experience) and explicit knowledge (knowledge that can be easily shared with others). (For more on sharing knowledge with intended users, rather than colleagues, see the “Reach and Engagement” indicators on pp. 33-43.)

26 Guide to Monitoring and Evaluating Knowledge Management in Global Health Programs
INDICATOR 8:Number of KM coordinating/collaborating activities, by type
Definition: This indicator refers to the activities of collaborative group structures that are used to share knowledge, both within and among organizations.
Illustrative examples of more specific indicators are as follows:
• Number of CoP events (either online or face-to-face) planned and facilitated
• Number of online forums hosted
Data requirements: Self-report of number of activities, by type.
Data source(s): Administrative records.
Purposes and issues: This indicator counts a variety of knowledge sharing activities and can cover both virtual communication (e.g., online CoPs) and face-to-face communication. The purpose of this indicator is to capture the number of activities conducted that allow colleagues (either within organizations or from different organizations working on similar topics) to connect, share experiences and lessons learned, develop common guidelines, or exchange ideas and research findings. A possible benefit of such activities is the opportunity to come to consensus on issues, chart the course of a particular effort, and provide a forum for prioritizing activities. Note that the number of activities can sometimes be difficult to define; for example, an online forum might be one activity or a series of activities. However the organization or CoP chooses to define these events, it is important to count consistently across the organization and across different activities.
Professional contacts—such as those measured by this indicator—can help transfer tacit
knowledge, which otherwise can be difficult to record and share with others. Tacit knowledge is based on direct experience; some of this can be easily abstracted into explicit knowledge, but for other experiences, this is more difficult. Sharing of tacit knowledge usually occurs person-to-person and so depends greatly on the interaction of individual human beings (Alajmi 2008). Often, when individuals attempt to generalize tacit knowledge for others, important nuances are lost. It is important, however, to share the rich, contextual knowledge of individual experience. Story-telling is often the means, and professional groups and CoPs are often the forum for story-telling and similar processes for sharing tacit knowledge within and across organizations (Schubach 2008). The social nature and shared context of some of these groups promotes common understanding and encourages active engagement (that is, people’s openness and willingness to share their own experiences and to respond to those of others) and continual learning (Athanassiou and Maznevski and Athanassiou 2007; Schubach 2008). Furthermore, these groups can help identify individuals with specialized knowledge or anecdotal evidence and encourage these people to share their knowledge with the larger group (Maznevski and Athanassiou 2007).
While these structures can be important knowledge sharing venues, experiential knowledge can often be shared only in context—that is, between an experienced person and someone who is doing a similar activity but does not have the same experience. A number of tools and techniques can be used to facilitate this transfer of experiential knowledge, including peer assists, mentoring, and master-apprentice relationships. While this indicator counts the groups themselves (for example, a CoP counts once), the tools and techniques of knowledge sharing are addressed in Indicator 13 on p.31.

27CHAPTER 2: INDICATOR THAT MEASURE PROCESS
INDICATOR 9: Number of KM training sessions, workshops, or conferences conducted, by type
Definition: This indicator refers to activities, led by the organization, among either internal or external users for the purposes of sharing knowledge and/or improving KM skills. “Training” is defined as knowledge transfer conducted in order for individuals to gain competence or improve skills—in this case, about KM (Nadler 1984).
Data requirements: Self-report of the number of training sessions, workshops, and conferences conducted, by type.
Data source(s): Administrative records.
Purposes and issues: This indicator concentrates KM training sessions, workshops, and conferences—which can be conducted either online or face-to-face and with either internal or external users, who would usually be KM practitioners or those making decisions about an organization’s KM activities. Such events seek to share information, tools, and resources that can improve the KM skills of individuals and/or organizations.
These sessions can help strengthen KM capacity within and among organizations. These events can be useful to share KM approaches widely even if only certain project staff members participate directly; the participants can then hold internal trainings or de-briefings to share the information that they obtained in their organization. Such internal training or de-briefing can help ensure that knowledge, tools, and skills are spread across project staff and not concentrated in the hands of a few. It is also important to evaluate the quality of these activities, including how much was learned and the ways in which processes or behaviors changed as a result of participation
in these events. Qualitative information should be reported wherever possible, too; Indicator 11 (see p. 29) collects information on whether these knowledge sharing events achieve their training/learning goals.
AREA 4: STRENGTHENING KM CULTURE AND CAPACITY
Organizational culture can either facilitate or discourage KM processes. Effective knowledge sharing depends on the willingness of both the sharer of knowledge and the recipient to participate in the system or method of knowledge sharing (Frost 2010). An organization that is supportive of KM makes clear the importance of knowledge sharing at both the personal and organizational levels. Such an organization provides templates, sets precedents, offers models, includes knowledge sharing in job descriptions and processes, provides incentives for KM activities, makes individuals feel secure and confident in both sharing and receiving knowledge, and fosters pride in the quality of its KM processes. These are crucial aspects of an organization’s “KM culture” (Collison and Parcell 2004; Frost 2010).
While each organization is unique, certain characteristics can be measured to assess an organization’s general support of KM. Furthermore, an organization can take actions to strengthen its KM culture and to increase its KM capacity. (If a knowledge assessment was done (see p. 18), an organization may be familiar with its knowledge needs and working to improve its KM capacity.) For example, a KM-supportive organization often has an explicit KM strategy (and/or may include KM components within the overall organizational structure, such as a KM staff member or department). Also, it has leaders who recognize

28 Guide to Monitoring and Evaluating Knowledge Management in Global Health Programs
the importance of KM in improving the organization’s overall performance and achieving specific goals. In such organizations knowledge is easily obtained, and knowledge sharing (both internally and externally) is encouraged. In other words, in such organizations KM is built into organizational strategies and overall processes (Collison and Parcell 2004). For example, an organization could hold regular knowledge sharing events, have an active organizational intranet, regularly employ after-action reviews and other KM tools, and encourage the transfer of experiential knowledge through mentorships or other techniques.
A supportive organizational KM culture is crucial. Even well-planned KM initiatives can fail if the organization lacks a supportive KM culture (Lam 2005). Factors such as lack of knowledge sharing, knowledge hoarding, and internal competitiveness can adversely affect KM initiatives (Lam 2005). Such issues are not resolved overnight. An organization must make a certain investment to improve KM culture. It is often assumed that investment in information technology is enough to implement KM. In fact, however, “in most instances, the necessary cultural shift is more difficult to accomplish and often overlooked” (Hurley and Green 2005).
An organizational investment in knowledge sharing systems enhances the learning capacities of the entire organization. This investment has long-term benefits. It reduces the need for continual training from the top, as learning is more engrained in the organizational culture. Also, a robust KM culture reduces the need for micro-management and empowers employees to share knowledge, innovate, and create new strategies (Mathew 2011).
KM culture and KM capacity go hand-in-
hand. An organization that recognizes the importance of KM and promotes knowledge sharing will often promote KM training for staff, mentorships, and other mechanisms that increase KM capacity (see Indicators 9 and 11 for more on measuring training). Such organizations will also emphasize the public health implications of KM initiatives.
Just as knowledge sharing indicators can be applied to either internal or external users (i.e., among project staff or among colleagues at other organizations), these indicators of strengthening KM culture and capacity may be relevant both within organizations and among them. That is, while organizations can strengthen their own KM capacity, they may also use CoPs or other collaborative KM techniques (such as mentorships or peer assists) to strengthen overall KM capacity among global and local health organizations with whom they work. (See Indicator 8 on p. 26 for more about such mechanisms).
INDICATOR 10: Number/percentage of KM outputs guided by relevant theory
Definition: This indicator refers to the use of theory—whether KM theory or another relevant theory—to guide the development of KM outputs. Theory is “a set of interrelated concepts, definitions, and propositions that present a systematicview of events or situations by specifying relations among variables, in order to explain and predict the events or situations” (Glanz et al. 2008).
Data requirements: Self-report of number of KM outputs guided by theories, name/type of theory used.
Data source(s): Programmatic records, including planning/design records.

29CHAPTER 2: INDICATOR THAT MEASURE PROCESS
Purposes and issues: In addition to the use of data on knowledge needs and user feedback (see Indicators 1–3 on pp. 18-21), strategic KM activities also should be based on appropriate theory.
Theories and models are essential for planning a number of public health activities, including KM. Since they provide conceptual tools that have been developed, improved, and refined, they can help guide the systematic planning and implementation of programs, strategies, and activities (Ohio University/C-Change 2011). Theories often have a specified content or topic area. Sometimes, however, they are more general and so can be broadly applied across a number of activities (Van Ryn and Heaney 1992).
A number of theories can guide KM work. Since the fields of KM and communication share some goals (and often share project staff), some theories used in KM work stem from the field of behavior change communication. For example, project staff may choose to tailor KM outputs based on the Stages of Change theory, which helps identify the user’s cognitive stage. (The five phases are pre-contemplation, contemplation, preparation, action, and maintenance [Prochaska and DiClemente 1984]). Another theory useful to KM is Diffusion of Innovation theory (Sullivan et al. 2010) (see Chapter 1, p.4). This theory proposes that people adopt a new idea (i.e., an innovation) via a five-stage process—knowledge, persuasion, decision, implementation, and confirmation (Rogers 2003). Understanding where an intended user group is along this progression can help KM practitioners design strategies for knowledge sharing, learning, and promotion of new ideas and knowledge.
Theory can provide structure on which to build a KM project or activity—particularly if you choose a theory based on the outcomes
you hope to achieve. The application of relevant theory can help organizations plan more effective activities, which ultimately help meet overall health or development goals (Salem et al. 2008). Choosing an appropriate theory to guide a KM initiative may be crucial to its success. An appropriate theory provides suppositions about the intended user, behaviors, and/or the health and development issue that are logical, consistent with current observation and past research, and/or have been used successfully to promote change for a similar issue (NCI and U.S. Department of Health and Human Services 2005).
INDICATOR 11: Number/percentage of KM trainings achieving training objectives
Definition: This is an internal indicator, measuring whether KM trainings among staff (and in some instances, CoP members or partners) achieve training objectives. Those who design or conduct the training set the training objectives in terms of improved skills, competence, and/or performance of the trainees.
Data requirements: Responses to training evaluations—specifically, answers to questions about whether or not the training met its objectives; observers’ comments; trainees’ test scores (if available).
Data source(s): Training records, training evaluation forms, notes of independent course observer, trainees’ test results.
Purposes and issues: This indicator records whether the training has provided the KM skills and knowledge outlined in the course objectives. Ideally, these objectives would be designed to address gaps identified by the KM knowledge audit (see Indicator 1). In other words, this indicator can provide one way of

30 Guide to Monitoring and Evaluating Knowledge Management in Global Health Programs
gauging the degree to which an organization has acted on its knowledge audit (see Indicator 1). For example, the KM audit may have found that many staff members do not use the organization’s information and knowledge resources. Training about internal KM tools, technologies, and strategies may help solve this. In this case this indicator would measure whether the training led the staff members to increase their use of information/knowledge resources.
Courtesy bias can often affect training participants’ responses to evaluation questions (see Box 5 below). Assuring participants that evaluation responses will be kept confidential (and even leaving names off evaluation forms) may encourage participants to respond more frankly. In addition, since evaluation forms are
not always the best way of evaluating training (due to a number of factors including courtesy bias, low response rates, and the difficulty of self-reporting on the effects of training that was only just received), other methods may be used to gauge learning and improvements in performance. For example, after training people to use an information technology, trainers could observe the trainees conducting a search on their own or use an online knowledge resource to track usage patterns. This observation could be conducted several weeks after training, if possible, as a measure of whether new knowledge was retained.
For more on training results among external users of an organization’s KM outputs, see Chapter 5.
BOX 5
Courtesy Bias and Other Response Biases
Courtesy bias is a type of response bias that occurs when a respondent is trying to be polite or courteous toward the questioner. The logic behind this bias is the respondent may not want to displease the questioner or appear offensive or disagreeable to the questioner. Instead of giving an honest answer, they respond in a way that they think is the most polite out of courtesy to the questioner (FAO 1997).
Other biases underneath the “response bias” umbrella may have different logic behind the biased answer, although the result is the same: the respondent gives an answer that they think is most favorable, either for their own benefit or based on what they think the questioner wants. Specific examples include acquiescence bias (tendency to agree with all questions or to indicate a positive connotation) and social acceptance/desirability bias (tendency to answer in a manner that will be viewed favorably by others) (Wikipedia).
Combined with the courtesy bias, the M&E results can be affected by a sampling bias when the participation is voluntary (e.g., self-administered online surveys). The people who are going to be willing to participate most likely have positive views on the subject or find it particularly interesting, which also skews the accuracy of the results (Heiman 2002).
KM research in global health can be particularly sensitive to these biases because many KM outputs are offered free of charge or at minimal cost to bring about greater social good, e.g., strengthened health systems or improved health outcomes. KM practitioners and researchers should pay close attention to such effects when collecting and reporting M&E data.

31CHAPTER 2: INDICATOR THAT MEASURE PROCESS
INDICATOR 12: Number of instances of staff reporting their KM capacities improved, by type
Definition: This indicator refers to instances in which project staff members report an improvement in their KM knowledge, skills, or abilities.
Data requirements: Number of instances of staff reporting KM capacities improved, type of improvement, and qualitative description.
Data source(s): KM audits, performance reviews, pre/post tests, training evaluations, observations by other staff (that is, asking staff members if they think their colleagues’ KM capacities have improved and asking for examples), notes from after-action reviews, interviews with staff members.
Purposes and issues: Building on the results of the KM audit, this indicator (along with Indicator 11) gauges the effects of efforts to strengthen internal KM capacity. These are direct follow-up indicators to Indicator 1 (organizational knowledge assets assessed in the last five years); the staff members themselves assess the growth of their own KM capacities.
Once a KM audit has been performed and the organization has an idea of its KM gaps and challenges, leaders can ensure that management puts financial resources and high-level support into improving KM systems overall; that management leads by example, investing their time in doing KM well, and that appropriate KM training is offered when needed. After the changes have taken place and staff members continue KM activities, they can report whether they feel their knowledge, skills, and performance have improved. Also, at the organizational level, trends in the results of KM audits can be studied.
The accuracy of this indicator depends on trust, as well as clear and open lines of communication, between management and the rest of the staff, to ensure that self-reports are honest. These conversations could even be made part of annual performance reviews between supervisors and staff. There are other ways of gauging improvements that may be less subject to bias—for example, changes in how often an internal knowledge sharing system is used or the formation of new internal CoPs that meet regularly.
INDICATOR 13: Number of KM approaches/methods/tools used, by type
Definition: This indicator refers to the use of proven approaches, methods, and tools that can facilitate and support learning, knowledge exchange, decision-making, and action within an organization.
For example, if KM practitioners use an organizational approach to implementing KM, they may focus on how an organization can be structured or designed in order to maximize knowledge creation and exchange. KM practitioners may use research methods to capture data on a specific project or purpose. Some KM tools may be related to information technology (IT) (e.g., intranet or content management systems); others may be less technology-based (e.g., collaborative tools such as a world cafés or Open Space, which provide informal, creative spaces for groups of colleagues to interact and share ideas (for more on Open Space, see http://www.openspaceworld.org/).
Data requirements: Self-report of number of KM approaches/methods/tools used, by type.
Data source(s): Survey of staff, in-depth interviews with staff members, notes from after-action reviews, administrative records.

32 Guide to Monitoring and Evaluating Knowledge Management in Global Health Programs
Purposes and issues: In KM initiatives it is important to use proven techniques to promote learning, facilitate knowledge transfer, and encourage collaboration. These processes sometimes require facilitation and/or specific tools. The choice of such tools will depend on the goals, intended users, available technology, facilitator availability/skills (if relevant), and the timeline of the KM project or activity. There are a wide range of KM techniques; some examples are: after-action reviews, world cafés, Open Space sessions, graphic facilitation, podcasts, twinning (pairing an organization in a low- to middle-income country with a similar but more mature entity in another country), role plays, simulation, storytelling, peer assists, mentoring, knowledge fairs, “fail fairs,” blogging, and online discussions (Lambe and Tan 2008; World Bank 2011; Ramalingam 2006). Some KM methods—such as after-action reviews and mentoring—can be institutionalized and made part of the organizational culture.
This indicator refers to techniques and tools that projects can use in their KM initiatives (see examples above). In contrast, Indicator 8 (see p.26) refers to the activities of collaborative groups/structures for knowledge sharing. These are related; for example, a community of practice (measured in Indicator 8) may use the world café method of exchanging information, and that method would be counted under this indicator. Nonetheless, the method/tool is distinct from the activity, and thus they are listed under two separate indicators. As methods may be used repeatedly and in different situations, the number recorded by this indicator is likely to be smaller than that recorded by Indicator 8. Information gathered for this indicator may also offer some qualitative indication of KM capacity strengthened (which may also feed into Indicator 12)
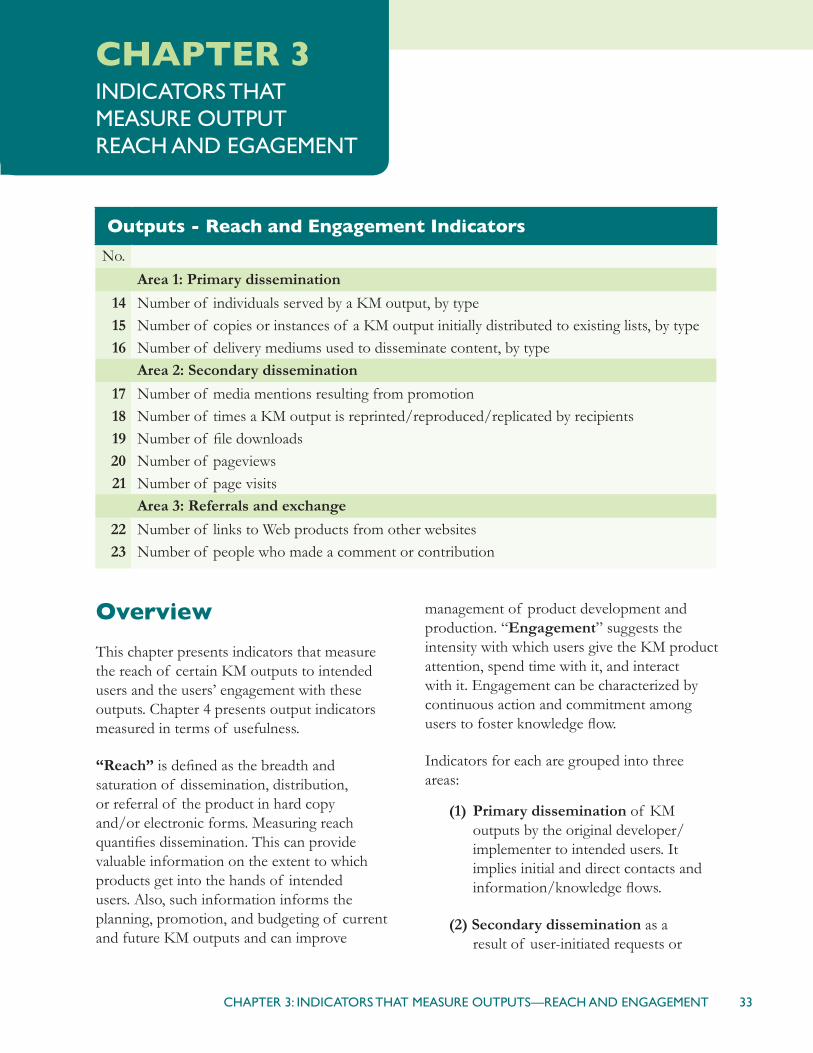
33CHAPTER 3: INDICATORS THAT MEASURE OUTPUTS—REACH AND ENGAGEMENT
Overview
This chapter presents indicators that measure the reach of certain KM outputs to intended users and the users’ engagement with these outputs. Chapter 4 presents output indicators measured in terms of usefulness.
“Reach” is defined as the breadth and saturation of dissemination, distribution, or referral of the product in hard copy and/or electronic forms. Measuring reach quantifies dissemination. This can provide valuable information on the extent to which products get into the hands of intended users. Also, such information informs the planning, promotion, and budgeting of current and future KM outputs and can improve
management of product development and production. “Engagement” suggests the intensity with which users give the KM product attention, spend time with it, and interact with it. Engagement can be characterized by continuous action and commitment among users to foster knowledge flow.
Indicators for each are grouped into three areas:
(1) Primary dissemination of KM outputs by the original developer/implementer to intended users. It implies initial and direct contacts and information/knowledge flows.
(2) Secondary dissemination as a result of user-initiated requests or
CHAPTER 3INDICATORS THAT MEASURE OUTPUT REACH AND EGAGEMENT
Outputs - Reach and Engagement Indicators
No.
Area 1: Primary dissemination
14 Number of individuals served by a KM output, by type15 Number of copies or instances of a KM output initially distributed to existing lists, by type16 Number of delivery mediums used to disseminate content, by type
Area 2: Secondary dissemination
17 Number of media mentions resulting from promotion18 Number of times a KM output is reprinted/reproduced/replicated by recipients19 Number of file downloads20 Number of pageviews21 Number of page visits
Area 3: Referrals and exchange
22 Number of links to Web products from other websites23 Number of people who made a comment or contribution

34 Guide to Monitoring and Evaluating Knowledge Management in Global Health Programs
reproductions, visits to and downloads from a Web product, as well as news media mentions.
(3) Referrals and exchange such as communication or contribution in oral or written form, as well as connections via Web links and social media. It relates to various means through which people can find their way to information resources, share them via a variety of channels, contribute their own knowledge or experiences, and/or continue to engage in a knowledge community.
“Output” is defined on p. 24 in Chapter 2 Indicator 6. Where applicable, examples of indicators are presented to illustrate how the generic indicators proposed in this guide can be adapted for a particular purpose, need and output type.
In general, the data for all of the indicators in this chapter are quantitative. These data should be collected and analyzed continually to track trends over time. The schedule for routine data collection should be determined (e.g., monthly, quarterly, semi-annually, or annually), and, when applicable, percent increase should be calculated and recorded to monitor progress. In most instances the direction of the data is “higher=better”—meaning that an increase in the number should be expected due to an ongoing effort to carry out KM outreach activities. However, there may be some cases in which a decline of the number is desirable. For example, an organization may have an activity to convert publications originally produced in print into an electronic format and post them in an online database or toolkit for intended users to download and print. In this case, the organization would aim to reduce the number of hard copy distributions while increasing
the number of file downloads. Therefore, in presenting findings, it may be helpful to explain the desired direction of the trend.
AREA 1: PRIMARY DISSEMINATION
INDICATOR 14: Number of individuals served by a KM output, by type
Definition: In a general sense this indicator captures the number of people that a KM output directly influences. The type of KM output should be specified. For instance, the number can represent people attending a meeting, seminar, or conference, as well as those joining in a virtual learning/networking activity. Also, this number could represent subscribers or recipients of a product, service, or publication.
The indicator is applicable for various kinds of KM outputs.
Illustrative examples of more specific indicators are as follows:
• Number of registered learners in an eLearning service
• Number of recipients who received a copy of a handbook via initial distribution
• Number of registered participants in a training seminar
• Number of fans and followers on social media accounts
Data requirements: Quantitative data—evidence that intended users (e.g., recipients, subscribers, participants, or learners) have received, registered, or participated in a particular KM output, whether in person
35CHAPTER 3: INDICATORS THAT MEASURE OUTPUTS—REACH AND ENGAGEMENT
or virtually. Supplementary information collected could include characteristics of these individuals, such as country/region where they work, organizational affiliation, job function or type, gender, and level of education, as well as type of dissemination, promotion, and communication channels, such as print, in-person, electronic (either online or offline), or other media.
Data sources: Mailing, contact, or subscriber lists, registration or attendance records, and other administrative records and databases.
Purpose and issues: These numbers chart the initial reach of the KM output, as well as which users were addressed. This is one of the most basic indicators for measuring reach. It is a very simple way to gauge initial communication of and access to the KM output. Various stratifications of the data can help profile the user.
◆ Example:
The Global Newborn Health (GNH) Conference, held 14-18 April 2013 in Johannesburg, South Africa and sponsored by the Maternal and Child Health Integrated Program, counted among its participants 70 senior government health officials from 50 countries.
Since January 2012, MEASURE Evaluation hosted 29 webinars that covered seven topics related to M&E of population, health, and nutrition programs. The webinars attracted 1,228 participants.
INDICATOR 15: Number of copies or instances of a KM output initially distributed to existing lists, by type
Definition: This indicator captures the numbers (e.g., document copies or email announcements) of a KM output that have been distributed. Use of existing lists indicates
that this is an initial and direct distribution or dissemination from the original developer of the output (e.g., an organization or project). Distribution of the output can be by mail, in person, online, or via any other medium. Electronic distribution of copies includes various file formats, such as PDF, TXT, PPT, or HTML.
Illustrative examples of more specific indicators are as follows:
• Number of copies of an implementation guide distributed
• Number of notifications emailed announcing a new issue of an online journal
Data requirements: Quantitative data—number of hard/paper or electronic copies distributed by language, types/formats of the product, how/where the copies were distributed, and dates distributed.
Data sources: Administrative records. A database designed specifically to track distribution/dissemination numbers is helpful.
Purposes and issues: This is a direct and simple measurement of quantity supplied. Due to the rapid advancement and growing availability of information and communication technologies (ICTs) in recent years, many organizations and projects have been shifting the scope and focus of their distribution efforts from printing and mailing paper copies to using electronic channels. Electronic copies can be distributed to intended or potential users by email as attachments or as Web links. The number of file downloads via Web links is included as a separate indicator in this section (see Indicator 19 on p. 35).

36 Guide to Monitoring and Evaluating Knowledge Management in Global Health Programs
◆ Example:
During the four-day Global Newborn Health (GNH) Conference, the Twitter hashtag #Newborn2013 had an estimated reach of 2,979,300. It generated approximately 10,423,631 impressions and was tweeted over 1686 times by more than 650 contributors.
Since 2007, 500,000 copies of the “Family Planning: A Global Handbook for Providers” have been distributed. It is available in multiple languages in nine languages including English, French, Portuguese, Russian, Spanish, Swahili, Romanian, Hindi, and Farsi. Recently the Handbook was made available online and as digital downloads for mobile devices. As a result, the number of hard copy requests started steadily decreasing due to the new and expanded dissemination channels.
INDICATOR 16: Number of delivery media for dissemination of content, by type
Definition: This indicator captures the number and type of delivery media used to disseminate or promote content and messages across a KM project or for any specific activity. It can apply to a wide range of media such as online sources, Web tools, print copies, and electronic offline devices. Examples of electronic offline delivery devices include flash drives, CD-ROM, netbook, tablet, eReader, mobile phone apps, and portable audio devices.
Data requirements: Quantitative data—number of media types used and number of copies of product distributed (see Indicator 15 on p. 35) through each medium and different formats for each medium (e.g., ePub and Kindle for eReaders, Android and iPhone for phone apps).
Data sources: Administrative records. A spreadsheet or list designed specifically to track distribution/dissemination numbers is helpful.
Purpose and issues: The strategy to select certain delivery medium over others and/or to offer information in multiple media should be based on thorough understanding of users. Findings of a KM needs assessment (see Indicator 2 on p. 20) will inform the choice of media with information about the intended users’ skill in using various electronic media or about reading level, as well as about the users’ access to information sources and, in the case of electronic and broadcast media, to the necessary hardware. Organizations and projects implementing KM activities need to assess the effectiveness of the media mix by disaggregating monitoring data by delivery media; over time they may decide to add/reduce the types of media according to these findings.
◆ Example:
MEASURE Evaluation uses Fourteen (14) communication mediums to share news, publications, presentations, events and conversations, including website, print and electronically produced publications, Monitor e-newsletter, Evaluate blog, SlideShare, YouTube, Twitter, Facebook, Flickr, LinkedIn, webinars, Knowledge Gateway, Google+, and Podcasts.
Content from the Global Newborn Health (GNH) Conference was distributed by at least nine (9) delivery mediums, including live presentation, printed materials, Twitter, Facebook, website, Webcast, email, Scribd digital document library, and blog.
AREA 2: SECONDARY DISSEMINATION
INDICATOR 17: Number of media mentions resulting from promotion
Definition: This indicator captures how many times a KM output has been mentioned in

37CHAPTER 3: INDICATORS THAT MEASURE OUTPUTS—REACH AND ENGAGEMENT
various forms of news media coverage such as print news sources, online listservs or blogs, and television or radio. A media mention usually indicates to some degree that the original output is recognized, credible, and considered authoritative.
Data requirements: Quantitative data—number of mentions (print, online, social media, TV or radio), numbers of people reached by each news media outlet (if available).
Data sources: Administrative records, media outlets, reports from clipping services, Internet monitoring tools such as Google Alerts and Yahoo Pipes, media monitoring service.
Purpose and issues: This indicator identifies media coverage of a KM output or a group of KM outputs and tracks the coverage to gauge the effect of reach, promotion, and outreach efforts. Media coverage can be about the KM output itself or about the issue or content featured in the KM output. News media coverage measures whether intermediaries thought that their audiences would be interested and consider the issue important. Since the news media often help set the political and policy agenda, an indicator of news media coverage can suggest whether policy-makers might be influenced to give an issue greater priority. News media strategy is often meant primarily as a way to reach and influence policy-makers indirectly.
An advantage of a media mention can be the potentially large population reached secondarily (e.g., via national radio). However, the total impact may not be great if the mention is fleeting and most of the people are not much interested.
As for web-based products, services, publications, and content, a Web monitoring
tool such as Google Alerts or Yahoo Pipes provides a quick and easy way to set up specific queries and monitor mentions in online media. There are also a number of media monitoring services and software that cover print, television, social media, and other types of broadcasting beyond content on the Internet. In general, these services charge a fee.
It can be difficult to capture all instances of media coverage, especially in broadcasts. When a news-making publication comes out, staff can be organized to monitor various new media outlets for coverage of the story.
◆ Example:
From July 2012 to June 2013, the K4Health project had 52 media mentions from promotion, meeting the annual project target of 50. Many of the media mentions were by various blogs managed by other global health organizations (e.g., USAID Impact Blog), and also included several Web news or announcements (e.g., News Medical) and reports (e.g., Kaiser Daily Global Health Policy Report).
INDICATOR 18:Number of times a KM output is reprinted/reproduced/replicated by recipients
Definition: This indicator collects specific cases in which an organization or an independent body, other than the one that originally authored, funded, produced, or sponsored a KM output, decides to use its own resources to copy the KM output or some part or excerpt of the KM output in any fashion. “Reprint” is a term specific to publications and other print resources, while “reproduction” can apply to products and services, and “replication” can refer to approaches and techniques. Thus, the number refers not only to print copies, but also to online copies in any online medium or even any other KM events
38 Guide to Monitoring and Evaluating Knowledge Management in Global Health Programs
or approaches.
Illustrative examples of more specific indicators are as follows:
• Number of times a checklist is reprinted/reproduced for use in training by local implementation partners
• Number of training sessions conducted by participants in a training of trainers
• Number of times that intended users replicate a KM technique
• Number of times a content management system is copied and used by intended users to create their own Web content (see the examples below)
Data requirements: Requests for approval or permission to reprint, reproduce, or replicate, stating the number of items produced and, if applicable, which parts. Copies or other evidence of reprinting, reproduction, or replication.
Data source(s): Administrative records, letters, emails, communication of request and acknowledgments, receipts; online pages that track use and downloads of web-based products such as open source content management systems.
Purpose and issues: Reprints, reproductions, and replicated approaches demonstrate demand for a particular KM output and extend the reach of the output beyond what was originally feasible. An added value of this indicator is that desire to reprint, reproduce, or replicate suggests an independent judgment that the KM output is useful and of high quality.
A limitation of this indicator is that the
original publishers or developers have to rely on what is reported to them or sent to them after reprinting and reproduction or that they happen to come across. It is not possible to know with certainty the extent of reprinting and reproduction (e.g., some re-publishers think that they would not receive permission to reprint, and so they do not tell the original publisher). Also, it may be difficult to find out the extent of dissemination, the identity of the recipients, or the use of the reprint. These limitations apply to both online and print media.
◆ Example:
OpenAid is a website platform designed and built by the USAID-funded Knowledge for Health project to help small non-governmental organizations (NGOs) and international development projects quickly create cost-effective, program-focused websites (http://drupal.org/project/openaid). OpenAid was released in July 2012. As of June 2013, 60 different sites were using the OpenAid platform.
INDICATOR 19: Number of file downloads in a time period
Definition: “File downloads” refers to an Internet user’s transfer of content from a website to his or her own electronic storage medium.
Data requirements: Web server log files, Web analytics, content management system records.
Data source(s): Web server log files, Web analytics software (e.g., WebTrends, Google Analytics, Piwik), content management system (e.g., Drupal, Joomla).
Purposes and issues: Tracking file downloads provides insight into which information products and topics website visitors most frequently save for themselves. In addition

39CHAPTER 3: INDICATORS THAT MEASURE OUTPUTS—REACH AND ENGAGEMENT
to tracking general trends, file download data can also help determine how well promotional efforts and campaigns have reached online users and prompted access.
File download data are typically recorded using either of two methods: server log files and JavaScript page tags. A server log file is essentially a raw list of website activity, including client IP address, date, time, page or file requested, and HTTP status code (e.g. 404 not found, 503 service unavailable). Log files are usually automatically produced for all transactions on a website and are available to the site’s administrator from the organization’s server (Clifton 2012).
A particular advantage to server log files is the ability to distinguish between partial and completed file downloads. Disadvantages include the need for staff to update server software as well as to store, archive, process, and analyze the data. Other disadvantages include that files cached on visitors’ computers will not be counted in totals, and that robot traffic (i.e. Web crawlers) can substantially inflate the number of file downloads recorded in server log files (Clifton 2012).
The second, more common technique for tracking file downloads uses a Web analytics program that employs JavaScript page tags and first-party cookies. Once set up, this method requires less specialized IT knowledge than using server log files to access and analyze the data. Created with non-IT specialists in mind, analytics software enables users to see anonymized data through an interactive user interface. In addition to counting file downloads, Web analytics programs allow administrators to filter the data—to see visitor attributes, for example, such as location, type of device used, and how the visitor came to and navigated the website.
Disadvantages of page-tagging include the inability to differentiate partial and completed downloads and the inability to distinguish multiple users downloading files on a single computer (e.g., at a publicly accessible computer) from a single user downloading a file onto multiple computers or devices.
Switching data collection tools should be avoided. Each tool collects data differently and often defines common terms in similar but slightly different ways. Thus, it becomes difficult to track trends across a change of tools. If switching tools is necessary, it may be feasible to use both the old tool and the new tool for a time, compare the results, and then compare historical data and data from the new program with correction for the difference between the two programs.
For more about Web analytics, see Appendix 3 on p. 83.
◆ Example:
In the first quarter after launching social media channels, document downloads on the ICT and AG community website (ictforag.org) increased by just under five-fold.
The film “In It to Save Lives: Scaling Up Voluntary Medical Male Circumcision (VMMC) for HIV Prevention for Maximum Public Health Im-pact” (http://www.aidstar-one.com/focus_areas/prevention/resources/vmmc) was produced by AIDSTAR-One (funded by USAID and managed by John Snow Inc.) received a total of 3,789 plays between June 1, 2011 – June 30, 2012. 690 down-loads were associated with the AIDSTAR-One VMMC materials. The film was downloaded from the AIDSTAR-One website 224 times, the discus-sion guide was downloaded 121 times, and the transcript was downloaded 123 times. The film was downloaded from 36 countries - the top five countries: United States, Kenya, Uganda, South Africa, and United Kingdom.
40 Guide to Monitoring and Evaluating Knowledge Management in Global Health Programs
INDICATOR 20:Number of pageviews
Definition: The count of “pageviews” is the total number of times that a page’s tracking code is executed on a website, i.e., the page is “viewed” by a visitor.
Data Requirement: Web analytics.
Data source(s): Web analytics software (e.g., Google Analytics, Piwik, WebTrends).
Purpose and issues: In the early days of Web analytics, “hits” was the typical metric used to track activity on a website. Today, pageviews serves as a broad, general measure of how often a website is viewed. While total pageviews across a website can be informative, the value of this indicator is increased by segmenting data according to areas such as visitor location, traffic source, extent of interaction with the website, and key site content viewed.
Various Web analytics software vendors use the same basic method for calculating pageviews. Because vendors use different algorithms to make calculations, however, the exact number of pageviews usually will differ slightly across products. As traffic varies greatly by project type and organization size, pageview trends (e.g., percentage increase) are more meaningful than absolute numbers of pageviews.
Note that if a website or product relies on AJAX or Flash, pageview counts will probably undercount the activity on your website. In this case, using event tracking features in your Web analytics software can yield proxy data for pageviews.
As Web technologies evolve, another general metric may replace pageviews. As the state of the art in Web analytics advances, outcomes-based Web indicators will likely have increasing influence.
For more about Web analytics, see Appendix 3 on p. 83.
◆ Example:
The GNH Conference website (http://www.newborn2013.com/) was first launched in January 2013. It generated 29,562 pageviews up until May 5, 2013.
Between June 1, 2011 – June 30, 2012, in total, the materials page of the film “In It to Save Lives: Scaling Up Voluntary Medical Male Circumcision for HIV Prevention for Maximum Public Health Impact” (http://www.aidstar-one.com/focus_ar-eas/prevention/resources/vmmc/resource_packet) generated 5,666 pageviews. The VMMC landing page (with the embedded video) generated 1,204 pageviews from 89 countries. 20 percent of all pageviews were from visits from Africa.
Since MEASURE Evaluation started using SlideShare in June 2008, the project’s 229 slides have received a total 174,162 pageviews. Most pageviews came from the United States (35,731), Bangladesh (4,975), Ethiopia (4,460), Nigeria (2,930), Kenya (2,859), and India (2,831).
INDICATOR 21: Number of site visits
Definition: A “visit” is an individual’s interaction with a website, consisting of one or more requests for content (usually a pageview). If the individual leaves the website or does not take another action (typically requesting additional pageviews) on the site within a specified time interval (customarily 30 minutes), Web analytics software considers the visit ended (adapted from the Web Analytics Association’s Web analytics definitions).
Data requirement: Web analytics.
Data source(s): Web analytics software (e.g., Google Analytics, Piwik, WebTrends).
41CHAPTER 3: INDICATORS THAT MEASURE OUTPUTS—REACH AND ENGAGEMENT
Purpose and issues: Visits represent the number of times users have gone to and then left a website. A visit can range from a few seconds to several hours, and a single visitor can log multiple visits to a page, even in the course of a single day. Thus, the tally of total visits provides insight into the total number of times that people consulted a site, but it cannot distinguish between repeat and one-time visitors.
A visit, sometimes referred to as a session, is a group of interactions that take place on a website, usually within a pre-defined time frame. Different Web analytics programs define a visit differently. In general, a visit begins with an interaction, that is, when a visitor views the first page during his or her visit, and the visit ends when a criterion set by the analytics program is met. In Google Analytics, for example, the criteria to end a visit are if the visitor is inactive on the website for 30 minutes, if the clock hits midnight (according to the time zone of Google Analytics profile, not the visitor’s), or if during a visit period, the same visitor returns to the website but via new referral parameters, such as from an AdWords or email campaign (Clifton 2012).
In addition to representing the volume of traffic to a website, site visit numbers are used to compute other common indicators, such as average visit duration and average page depth (the average number of pages viewed during a visit to a website).
Some organizations may find it useful to further qualify this indicator so that it relates to key intended users, such as users whose browsers use non-English languages or visitors from specific countries or regions.
For more about Web analytics, see Appendix 3 on p. 83.
◆ Example:
Since launching in February 2011, visits to the ICT and AG community website (ictforag.org) have grown steadily from 200 visits per month up to 1,000 visits per month, peaking at over 2,000 visits in January 2013.
During the month of April 2012, the K4Health website (www.k4health.org) received 60,371 visits, an average of 2,012 per day.
In the 2012 calendar year, 22% (40,250) of visits to K4Health toolkits came from USAID family planning priority countries.
AREA 3: REFERRALS AND EXCHANGE
INDICATOR 22: Number of links to Web products from other websites
Definition: A “link” is a URL, located on another website that directs users to the publisher’s website. The referring website creates and maintains these links.
Data requirement: Web analytics, webmaster tools, search engine optimization (SEO) tools.
Data source(s): Web analytics software (e.g., Google Analytics, Piwik, Web Trends), webmaster reports (e.g., Google Webmaster Tools, Bing Webmaster Tools, Alexa.com), SEO tools (e.g., Majestic SEO, Open Site Explorer).
Purpose and issues: The number of links and variety of referring sources directing traffic to an organization’s online information products indicate both reach and authority. If many well-reputed websites frequently link to an organization’s website and its online resources, one can reasonably argue that the destination
42 Guide to Monitoring and Evaluating Knowledge Management in Global Health Programs
resource has recognized authority on a given topic.
Some search engines can provide information on which other websites link to a specific site. For example, searching in Google for www.mysite.com returns a list of URLs that provide links to www.mysite.com. However, data from such tools are far from comprehensive; most search engines make only partial data available in order to maintain the confidentiality of their ranking algorithms and to deter spammers.
The most comprehensive tools for tracking the number and sources of links are found in webmaster tools such as those by Google and Bing. These data can be accessed only by website owners, who before accessing the data must verify their identity in some way, such as by placing a small piece of code onto their own site. These tools provide site administrators comprehensive data on which websites link to their own. Webmaster tools also can provide related data, such as the number of domains and which pages on those domains link to a site.
Like webmaster tools, search engine optimization (SEO) tools directed at online marketing professionals can provide similar link data. Currently, Majestic SEO and Open Site Explorer are two popular online tools, both of which currently offer free and paid versions.
To maintain data integrity on trends in the number of links, it is important to use the same tool or program consistently, as each has its own methods and indexes of links on the Internet.
To learn more about Web analytics, see Appendix 3 on p. 83.
◆ Example:
As of January 2013, 5,917 sources provided referral links to Web pages on www.k4health.org.
As of August 2013, 940 websites link to www.measureevaluation.org.
INDICATOR 23: Number of people who made a comment or contribution
Definition: This indicator captures active sharing of programmatic experience and knowledge among people participating in KM outputs, usually those hosted online, such as professional network groups, communities of practice, forums, webinars, or social media (e.g., blogs, Facebook, LinkedIn). The online format makes data collection easy by digitally storing comments and contributions such as postings or materials uploaded into a platform. The number of contributors indicates how many have interacted with the other users and have shared their personal experiences, knowledge resources, or opinions with others. This count helps the organizer to assess the depth of user engagement.
Data requirements: Number of participants, electronic records of postings from participants, identification of product or issue under discussion, characteristics of participants such as country/region where they work, organizational affiliation, job function or type, gender, level of education, and qualitative data, e.g., characteristics, types, themes of contributions, as captured by content analyses of comments and contributions.
Data source(s): Administrative records of comments posted via listservs, discussion groups, communities of practice, or social media tools.
43CHAPTER 3: INDICATORS THAT MEASURE OUTPUTS—REACH AND ENGAGEMENT
Purpose and issues: Counting attendance is a valid measure, but it does not indicate the degree of engagement. The total number of people in attendance as a whole includes people who contribute significantly, those who share a little, and so-called lurkers who listen without contributing. Lurkers are usually the majority, especially in virtual settings. Direct user interactions indicate interest in the subject matter, which in turn speaks to the relevance of the KM output. In addition, contributions suggest that the users feel encouraged and comfortable contributing; thus, they have developed a sense of community and belonging in a particular group, which may stimulate further knowledge sharing.
However, the indicator does not usually suggest how the user will use the information/product/output in the future or whether the information will continue to spread through the professional networks of the attendees and contributors.
◆ Example:
During the LeaderNet webinar on blended learning, 275 participants logged on from 56 countries, sharing 308 posts in English, Spanish, and French.
As of June 2013, there are 7,924 subscriptions to 11 communities of practice managed by MEASURE Evaluation. During the project’s 5th year (July 2012 – June 2013), 273 subscribers posted new insights and knowledge to the community listservs.
In August 2013, MEASURE Evaluation shared a post on LinkedIn about the availability of M&E materials for trainers by MEASURE Evaluation. The post received 15 shares, 33 comments and 16 likes in the Monitoring and Evaluation Professionals LinkedIn group. A blog post containing the same information received 21 Twitter shares and 16 Facebook shares.
For more about M&E of communities of practice, see Appendix 4 on p. 87.
For more about M&E of social media, see Appendix 5 on p. 92.

44 Guide to Monitoring and Evaluating Knowledge Management in Global Health Programs
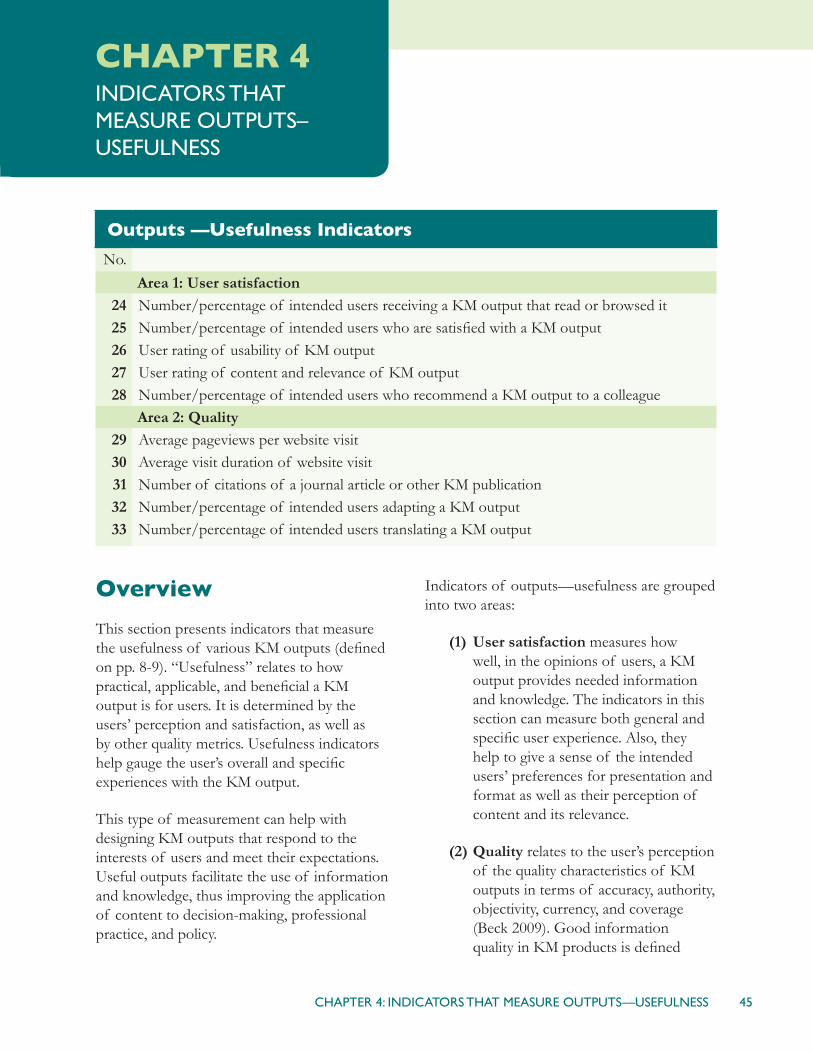
45CHAPTER 4: INDICATORS THAT MEASURE OUTPUTS—USEFULNESS
Overview
This section presents indicators that measure the usefulness of various KM outputs (defined on pp. 8-9). “Usefulness” relates to how practical, applicable, and beneficial a KM output is for users. It is determined by the users’ perception and satisfaction, as well as by other quality metrics. Usefulness indicators help gauge the user’s overall and specific experiences with the KM output.
This type of measurement can help with designing KM outputs that respond to the interests of users and meet their expectations. Useful outputs facilitate the use of information and knowledge, thus improving the application of content to decision-making, professional practice, and policy.
Indicators of outputs—usefulness are grouped into two areas:
(1) User satisfaction measures how well, in the opinions of users, a KM output provides needed information and knowledge. The indicators in this section can measure both general and specific user experience. Also, they help to give a sense of the intended users’ preferences for presentation and format as well as their perception of content and its relevance.
(2) Quality relates to the user’s perception of the quality characteristics of KM outputs in terms of accuracy, authority, objectivity, currency, and coverage (Beck 2009). Good information quality in KM products is defined
CHAPTER 4INDICATORS THAT MEASURE OUTPUTS–USEFULNESS
Outputs —Usefulness Indicators
No.
Area 1: User satisfaction24 Number/percentage of intended users receiving a KM output that read or browsed it 25 Number/percentage of intended users who are satisfied with a KM output26 User rating of usability of KM output27 User rating of content and relevance of KM output 28 Number/percentage of intended users who recommend a KM output to a colleague
Area 2: Quality 29 Average pageviews per website visit30 Average visit duration of website visit31 Number of citations of a journal article or other KM publication 32 Number/percentage of intended users adapting a KM output33 Number/percentage of intended users translating a KM output
46 Guide to Monitoring and Evaluating Knowledge Management in Global Health Programs
as “consistently meeting knowledge worker and end-user expectations” in terms of both content and format (English 1999). This section also includes external quality measurements specific to Web analytics and scientific publications.
AREA 1: USER SATISFACTION
INDICATOR 24: Number/percentage of intended user receiving a KM output that read or browsed it
Definition: This indicator measures to what extent intended users have shown their interests in knowing more about messages and contents offered through a KM output.
Data requirements: Self-reported information from intended users.
Data sources: Bounce-back feedback forms; user surveys (in print, online, or via e-mail or telephone) distributed after dissemination or promotion of a KM output.
Purposes and issues: This indicator distinguishes between the intended users who just received a KM output and did not look at it, on one hand, and, on the other, those who took the initiative to read or browse through it. Often, a survey begins with a filtering question asking whether the respondent has read or browsed a KM output. The answer to this question determines whether the respondent is qualified to answer subsequent questions about the usefulness and relevance of the KM output. It also provides a basis for gauging interest in the output or its topic among the members of the intended user.
◆ Example:
For the Global Newborn Health (GNH) Conference’s Scribd digital document library, there were 9,042 reads of conference-related material from April 1 to May 3, 2013.
INDICATOR 25: Number/percentage of the intended user who are satisfied with a KM output
Definition: This indicator measures an intended user’s overall satisfaction with a KM output. “Satisfied” indicates that the output met the intended user’s needs and expectations. It is related to the user’s perception of the relevance and value of the content as well as to the manner in which that content is delivered and presented.
Data requirements: Self-reported information from intended users. Satisfaction can be gauged on a scale (e.g., a Likert scale) that asks users to rate various attributes of the KM output.
Data sources: Feedback forms and user surveys (print, online, e-mail, or telephone). Interviews and focus groups discussions can capture further qualitative information.
Purposes and issues: Satisfaction is an overall psychological state that includes emotional, cognitive, affective (like/dislike), and behavioral responses to certain characteristics or to the output as a whole (Smith 2012, Sullivan et al. 2007). Satisfaction with a KM output is an important predictor of user behavior. If users find the KM output satisfactory, it is likely that they will use the content and possibly change behavior, adopt new behavior, or make a different decision as a result of that content.
In data collection instruments, the question about general satisfaction can be asked first, before more specific questions regarding aspects of usability and relevance.

47CHAPTER 4: INDICATORS THAT MEASURE OUTPUTS—USEFULNESS
INDICATOR 26: User rating of usability of KM output
Definition: This indicator measures user’s attitude toward and satisfaction with the usability. Usability covers a wide range of characteristics such as format, presentation, navigation, and searchability, and delivery of a KM output. The terms format and presentation refer to the way design aspects, content, and messages are laid out and organized. The term “format” refers more to technical and structural elements, while “presentation” refers more to the aesthetics. The user’s assessment of format and presentation influences an overall perception of usability. With web-based products, usability also includes navigation and the user interface.
Data requirements: Rating can be collected using a scale, such as a Likert scale, to gauge reactions to statements related to writing style and design features, organization of the information, ease of finding information, appearance, and other aspects. Greater insight requires qualitative data.
Data sources: Feedback forms or user surveys distributed with the KM output or after a KM output has been disseminated, interviews, focus group discussions, usability assessments.
Purposes and issues: This indicator provides important information about whether intended users find a KM output to be usable, practical, and logical. The indicator also encompasses whether the organization or search functions of a KM output enables users to find the information they want quickly.
To assess usability, it is helpful to conduct user surveys several months after a product or service has been disseminated, so that users have had time to put the product to use. For web-based products, accessibility and connectivity are important aspects of usability.
To serve the broadest range of technological capacity, products delivered via the Internet should be specifically designed for those who have low bandwidth (by limiting the use of large graphical elements, for example). Data collection instruments should address the loading times of Web pages and downloads.
◆ Example:
K4Health conducted an interactive usability assessment of its website with 23 participants in order to examine how K4Health users would interact with the website and improve the user interface in the new design. Each participant was given a number of tasks and observed by an interviewer/facilitator. The participants who browsed the site had a better completion rate to locate the particular resource material specified in one of the tasks compared to those who used the search box. Therefore, improving the search function and the relevancy of search results has become a priority area identified by the website team designing a new website.
For more about usability assessment, see Appendix 6 on pp. 96.
INDICATOR 27:User rating of content of a KM output and its relevance
Definition: This indicator measures the perceived quality of content in a KM output and its relevance to user’s needs. “Content” means the information or knowledge conveyed in a KM output, as distinguished from format and presentation. “Relevance” indicates that intended users find the information or knowledge applicable and important to their professional work.
Data requirements: Responses to questionnaires (regarding content quality, importance, usefulness, relevance, etc.). Rating also can be collected using scales (e.g., a Likert
48 Guide to Monitoring and Evaluating Knowledge Management in Global Health Programs
scale) that gauge reactions to statements. For further insight, qualitative data should be collected as well.
Data sources: Feedback forms or user surveys distributed with the product or after a KM output has been disseminated and promoted; interviews; focus group discussions.
Purposes and issues: It is crucial for organizations and projects to obtain feedback from intended users and gauge the overall usefulness and relevance of content in the KM output. Such information can guide further enhancement, refinement, and development of the output. Each user has a unique professional role, set of needs, or action focus, and therefore assessments of the quality and relevance of content may vary. Stratifying the data by user group will help to understand the various users and their needs.
In people’s perceptions, quality and relevance are likely to be intertwined. Users are unlikely to find content to be high-quality unless it is relevant to their needs. Thus, it is important to know users’ perceptions of relevance in order to interpret their judgment on quality.
◆ Example:
The survey results of the LeaderNet webinar on blended learning revealed that 97% found the discussions useful or very useful for their work, and 99% rated the seminar resources (the Blended Learning Guide) as useful or very useful for their work.
INDICATOR 28:Number/percentage of intended users who recommend a KM output to a colleague
Definition: A recommendation is an endorsement of the output, indicating the recommender’s judgment that the output is
a suitable resource for a particular purpose. The term “colleague” indicates a professional relationship.
Data requirements: Self-reported information on recommendations received.
Data sources: Feedback forms, user surveys (print, online, e-mail, telephone), evaluations of extended professional networks, if feasible.
Purposes and issues: The decision to recommend a KM output reflects a user’s assessment of its quality, relevance, and value (which can be captured by Indicators 26 and 27, on pp. 47–48). Recommendations also provide evidence that user-driven sharing is exposing a wider professional network to the KM output. Frequent recommendations may speak to the overall success of the KM output.
It may be useful to distinguish a recommendation from a referral. A referral may reflect a judgment of relevance, but it can be quite casual; the referrer may know little about the KM output beyond its topic. A recommendation implies a judgment of quality. Both recommendations and referrals are worth tracking, and at least it indicates secondary distribution (Chapter 3 Area 2). In data collection instruments, “recommending” needs to be clearly defined and distinguished from simple “referral” or “sharing.”
AREA 2: QUALITY
INDICATOR 29: Average pageviews per website visit
Definition: The number of times a webpage is viewed, divided by the number of site visits. (See indicators 20 and 21 on pp. 40–41 for definitions of pageviews and visits, respectively.)
49CHAPTER 4: INDICATORS THAT MEASURE OUTPUTS—USEFULNESS
Data requirements: Web analytics.
Data source(s): Web analytics software (e.g., Google Analytics, Piwik, WebTrends).
Purposes and issues: Average pageviews per visit gauges the visitor’s engagement with a website; a high pageview average suggests that visitors interact more deeply with the site. There is no specific “good” or “poor” average; rather, context determines what is a satisfactory average. For example, if a site features a popular blog, consider that blog readers typically view fewer pages. Trends over time and the averages for key areas of the site should receive at least as much attention as the overall average. As a general rule, a low bounce rate (i.e., representing the percentage of visitors who enter the site and leave the site rather than continue viewing other pages within the same site) alongside a high average pageview metric is most desirable.
Informed decisions about modifications to a website require data for specific types of users (e.g., new versus returning visitors, users’ country) and content areas viewed (e.g., blog content versus research databases).
◆ Example:
From January 1, 2013 to July 31, 2013, 2,606 page visits to the ICT and AG website (ictforag.org) came from Africa, with an average of 3.15 pageviews per visit.
During the month of December 2012, returning visitors to the Photoshare website (www.photoshare.org) viewed an average of 6.18 pageviews, while new visitors averaged 2.04 pageviews.
Visitors to the DHS toolkit on www.k4health.org between November 1, 2012 and January 31, 2013 viewed an average of 2.72 pageviews per visit.
INDICATOR 30: Average duration of website visit
Definition: The mean length of time for visits to a website, calculated as the difference between the times of a visitor’s first and last activity during the visit and averaged for all visitors.
Data requirements: Web analytics.
Data source(s): Web analytics software (e.g., Google Analytics, Piwik, WebTrends).
Purposes and issues: The average amount of time that visitors spend on the site is an overall indicator of quality.
Longer visits generally suggest that visitors interact more extensively with the website, which may mean they find it a rich source of relevant information and knowledge. However, the nature of website content is important to consider when interpreting average visit duration. As with most Web analytics indicators, average visit duration is a relative measure, making it difficult to prescribe a “good” or “poor” average duration. However, the context of a product or service can help with interpreting the data. For example, if the most important content or tasks on the site typically take three minutes to consume or complete, and the average time on site is less than one minute, one can conclude that the average visitor is not staying long enough, In such cases, website managers should seek insights to determine where and why users leave the website, using available tools and methods, such as visitor flow and user testing.
The reasons for the above scenario should be investigated. Data on audience segments and user types available in Web analytics tools (e.g., new versus return visitors or visitor’s country) can imply whether it is a crucial
50 Guide to Monitoring and Evaluating Knowledge Management in Global Health Programs
user segment that is not staying long enough. Similarly, consider the distribution of visit durations. A small percentage of visitors’ behavior at a far end of the distribution can skew an overall average. Fortunately, different Web analytics programs use various techniques for calculating average visit duration. For example, to compensate for users who might leave a browser or tab open after finishing on a site, one analytics program might ignore the final pageview when calculating visit length, while another might use JavaScript to record a visitor’s final activity on the site (i.e., when a visitor navigates away from the page). Such differences argue for using the same analytics program consistently.
◆ Example:
From January 01, 2012 to December 31, 2012, average visit duration on www.popline.org was 2 minutes, 50 seconds. Visitors in Nigeria, however, spent an average of 6 minutes, 11 seconds on the site. The POPLINE-wide pages per visit figure for this time period was 13.68 compared to 23.72 pages per visit for Nigerian users. It may indicate that Nigerian users are engaging more than average POPLINE users or it takes longer to navigate the website due to the Internet connectivity in Nigeria.
From October 01, 2012 to December 31, 2012, the average visit duration on www.k4health.org for visitors from North America was 2 minutes, 49 seconds; from Africa, 4 minutes, 39 seconds; and from Asia, 2 minutes, 16 seconds. It is true that slower Internet connections can affect visit durations. In this example, a lower bounce rate (55% vs. 67%) and higher average pages per visit (2.94 vs. 2.52) for Africa indicate that African users are indeed more engaged than the average K4Health site visitor. Google analytics also provides a number of site speed indicators, including average page load time. In this example, Asian visitors experienced the slowest average page load times, further supporting the assertion that African users are more highly engaged.
INDICATOR 31: Number of citations of a journal article or other KM publication
Definition: This indicator counts the number of times a journal article or other KM publication (such as a book or white paper) is referenced in others’ information products. The number of citations represents the instances when the article or KM publication was used as evidence, as back-up information, or supplementary knowledge in the development of another publication.
Data requirements: Data from citation studies, Journal Citation Reports—Science Edition or Journal Citation Reports—Social Sciences Edition (Thompson Reuters http://thomsonreuters.com/journal-citation-reports/).
Data sources: Citation studies; Web search engines; citation indexes. Internet search engines such as Google Scholar can provide partial information on the number of times a publication is cited online. Citation reports are costly, but easy to obtain from specialized services.
Purposes and issues: This indicator is a collective measure of the perceived authority, quality, and importance of a scientific publication in the research community. The number of citations reflects the popularity of the topic and importance of findings. A limitation of indicators based on citation counts is that they do not apply to all types of KM outputs but only to published scientific literature, where influence in the scientific community is a goal and a sign of success. For many other KM outputs (e.g., a database, a curriculum), influence in the scientific community is not a primary goal.
In some instances, KM practitioners and authors in low and middle income countries may find this indicator not useful for them.
51CHAPTER 4: INDICATORS THAT MEASURE OUTPUTS—USEFULNESS
Even when influence in the scientific community is a goal, authors in developing countries often face the well-known biases and other limitations that make it difficult for them to make their work known to others in the scientific community. A related limitation is that many relevant journals published in developing countries are not included in some widely used databases such as MEDLINE.
INDICATOR 32: Number/percentage of intended user adapting a KM output
Definition: “Adaptation” means the original KM output has been altered to suit the context of a specific set of users. Adaptation might entail translation (see indicator 33), simply changing terminology to locally used phrasing, or modifying artwork to depict a specific people or culture, or it could involve changing the KM output to take into account local policy, resource availability, and cultural norms. Adaptations also can include new (expanded or updated) editions, abridgments, modules for training, modification to address additional topics, and transfer to another medium, when these actions are taken by organizations or people other than the original producer of the KM output.
Data requirements: Self-report from users regarding adaptation, including identification of the KM output adapted; the purpose, extent, and nature of the adaptation; and the end results or outputs from adaptation (if known).
Data sources: User surveys (print, online, e-mail, telephone), requests for permission to adapt the output, requests for technical assistance with adaptation, requests for funding to make changes and disseminate the revised product.
Purposes and issues: This indicator gauges the extended life and increased relevance that an information resource may gain when adapted to meet local needs. In fact, research shows that guidelines, for example, are more effective when they are adapted to account for local circumstances (NHS Centre for Reviews and Dissemination 1999). When adaptations are undertaken independently of the original producer, they constitute evidence of the adaptors’ judgment that the output will be useful enough in their setting to merit the effort and cost involved in adaptation and production.
Documenting adaptations is useful, but it is not possible to know whether one has the complete tally of adaptations. A user may adapt a publication without notifying the original authors, publisher, or developers.
INDICATOR 33: Number/percentage of intended user translating a KM output
Definition: “Translation” is a type of adaptation that refers to rendering written texts from one language into another. The demand for translations reflects the requesters’ assessment that the KM output would be useful and relevant to their local setting.
Data requirements: Self-report from users regarding translation, including identification of KM output translated, purpose and extent of translation, end results or outputs from translation (if known).
Data sources: Self-reported user surveys (print, online, email, telephone), requests to translate the product, requests for technical assistance with translation or funding to translate.

52 Guide to Monitoring and Evaluating Knowledge Management in Global Health Programs
Purposes and issues: Translation can expand the reach and usability of a KM output by making it accessible to those who do not read/speak the language in which the output was originally created. It may be most common to translate into widely used languages; still, other language versions can be important, particularly if needs for certain information/knowledge are particularly great among specific populations or in specific regions.

53CHAPTER 5: INDICATORS THAT MEASURE INITIAL OUTCOMES
Overview
This section presents indicators that measure the initial outcomes of various KM outputs. “Initial outcomes” refer to various stages of cognition and behavior identified by behavior change theories such as the Diffusion of Innovations theory and the social cognitive theory.
The “innovation-decision process” from Diffusion of Innovations theory (Rogers 2003) has informed the identification of two main categories of initial outcomes, as follows:
Area 1: Learning (awareness, attitude, intention)
• Awareness: This first stage of outcomes occurs when a person recognizes the existence and utility of the knowledge/innovation and is aware of the necessary skills and tools that help effective adoption of the knowledge/innovation.
• Attitude: This stage occurs when a person forms an opinion about the knowledge/innovation. The basis for that opinion may lie in Rogers’
CHAPTER 5INDICATORS THAT MEASURE INITIAL OUTCOMES
Initial Outcomes Indicators
No.Area 1: Learning (awareness, attitude, intention)
34 Number/percentage of intended users who report that a KM output provided new knowledge
35 Number/percentage of intended users who report that a KM output reinforced or validated existing knowledge
36 Number/percentage of intended users who can recall correct information about knowledge 37 Number/percentage of intended users who are confident in using knowledge38 Number/percentage of intended users who report that information/knowledge from a KM
output changed/reinforced their views, opinions, or beliefs39 Number/percentage of intended users who intend to use information and knowledge
gained from a KM outputArea 2: Action (decision-making, practice, policy)
40 Number/percentage of intended users applying knowledge gained from a KM output to make decisions (organizational or personal)
41 Number/percentage of intended users applying knowledge gained from a KM output to improve practice (in program, service delivery, training/education, or research)
42 Number/percentage of intended users applying knowledge gained from a KM output to inform policy

54 Guide to Monitoring and Evaluating Knowledge Management in Global Health Programs
characteristics of an innovation—relative advantage, compatibility, complexity, observability, and trialability.
• Intention: This stage encompasses a person’s intention to seek additional information about the knowledge/innovation and her or his intention to use it. Also, it covers a person’s adoption of the new knowledge as his or her own.
In addition, several indicators in Area 1 address self-efficacy, defined in social cognitive theory as one’s belief in one’s ability to succeed in a specific situation (Bandura b 2006). Self-efficacy is an important predictor of behavior change.
Area 2: Action (decision-making, practice, policy)
This stage occurs when a person puts new knowledge to use with a specific aim to change or enhance policies, programmatic or practice guidance or procedures, training, or research methods (Sullivan et al. 2007). It may lead to continual, long-term use, which indicates commitment to and adoption of the knowledge/innovation (Rogers 2003).
Use of information and knowledge can be categorized as instrumental, conceptual, or symbolic. “Instrumental use” relates to use of information for a particular purpose; “conceptual use” describes use of information for general enlightenment; and “symbolic use” refers to information used to justify a position or action that was taken previously for a different reason or in a different area (Lavis et al. 2003). As part of a specific evaluation effort, an evaluation team may decide to examine specific types of use—instrumental, conceptual, or symbolic—to understand the
nature of information use. While we attempt to encompass all three types of knowledge use in this Guide, this chapter mainly talks about instrumental knowledge that leads to learning and action of practical knowledge in global health programs. Fully capturing initial outcomes—both “learning” and “action”—can be challenging. While it is relatively easy to track the reach of KM outputs and even to assess how useful they are judged to be, it can be more difficult to monitor the knowledge adoption process and to attribute short- or long-term changes in decision-making, practice, or policies to a KM product or effort. Even if intended users indicate that they have learned something, the timing and frequency with which they apply that knowledge can be difficult to observe (Machlup 1993; NCDDR 2006). It is partially due to the nature of knowledge, which differs from data and information in two ways: knowledge is based on experience, and it involves the application of theory or heuristics (Milton 2005)
To investigate use of knowledge and outcomes stemming from use of knowledge, KM researchers can ask users or observe their actions. Asking those who have been exposed to knowledge if they have applied it, how they have applied it, and what affect that it had is relatively straightforward. Courtesy bias and recall bias may be problems, but in some cases the reported use or its result can be verified objectively. Observing use of information and outcomes related to its use in real time is much more challenging. Determining what information/knowledge were factors in generating a change in behavior or an improvement in clinical practice continues to be difficult. One way to address this challenge is to start with the action or project outcome, and work backward to ascertain its influences and contributed factors to find out what specific knowledge inputs were made into the decision-making process by users.
55CHAPTER 5: INDICATORS THAT MEASURE INITIAL OUTCOMES
Quasi-experimental evaluation design can be used to isolate a causal pathway leading from specific KM activity areas to anticipated project outcomes.
AREA 1: LEARNING (AWARENESS, ATTITUDE, INTENTION)
INDICATOR 34: Number/percent of intended users who report that a KM output provided new knowledge
Definition: This indicator measures the extent to which intended users report that they have become aware of and learned from information and guidance presented in a KM output, and as a result they have created or obtained new knowledge.
Data requirements: Self-report in survey; anecdotal reports from users of KM output.
Data source(s): Feedback forms or audience surveys distributed with the KM output or after its dissemination or promotion; in-depth interviews (telephone or in-person).
Purpose and issues: This stage occurs when a person first becomes aware of the existence of information and guidance and gains understanding of how it functions (Rogers 2003). It may take place consciously or unconsciously when a person encounters new information, but it results in the ability to make decisions and take action (Milton 2005).
Survey and interview questions can be designed to gauge whether members of intended audiences have learned something new that provides new knowledge relevant to their work. Yes/no questions usually do not yield sufficient information, but they can be
followed up with an open-ended request for the most important point learned and assessed.
◆ Example:
Approximately 80% of FP service providers who filled out a bounce-back survey enclosed in Family Planning: A Global Handbook for Providers (n=82) indicated that the book provided them with new information on who can and cannot use specific FP methods safely.
The survey about the LeaderNet webinar on blended learning revealed that 96% of the 98 participants who responded to the final seminar evaluation (36% response rate) indicated that they acquired skills or knowledge from the seminar that they could apply to their work.
INDICATOR 35: Number/percentage of intended users who report that a KM output reinforced or validated existing knowledge
Definition: This indicator measures the extent to which uses feel that the information and experiential knowledge presented in KM outputs has supported their previously acquired knowledge and helped them to continue to apply such knowledge in their work.
Data requirements: Self-report in survey; anecdotal reports from users.
Data source(s): Feedback forms or user surveys distributed with the KM output or after its dissemination or promotion; in-depth interviews (telephone or in-person).
Purpose and issues: Reinforcement and validation can help to further transform health information and guidance into knowledge that is relevant and actionable for the user. It can also confirm the importance of the knowledge, reduce uncertainty, and increase the person’s
56 Guide to Monitoring and Evaluating Knowledge Management in Global Health Programs
confidence in continuing to use the knowledge. Validation is an important step in adopting and applying knowledge/innovation (Rekers 2012). As with measurement of new knowledge acquisition (Indicator 34), in a cohort approach questions can be designed to gauge whether intended users have encountered any infor-mation or guidance that confirmed what they already knew. To obtain sufficient information, yes/no questions should be followed up with an open-ended request for respondents to provide specifics.
INDICATOR 36: Number/percentage of intended users who can recall correct information about knowledge
Definition: This indicator measures the extent to which members of intended audiences remember health information, lessons, and guidance offered by a KM output and can recall the information or concepts accurately. Correctly recalling information suggests that a person paid enough attention to it to be able to remember it accurately later and/or it was presented in an appropriate way for learning and retention.
Data requirements: Pre- and post-assessment data on knowledge about a particular subject matter; self-report surveys (most useful when conducted after the knowledge/information has been available for some time); anecdotal reports from intended users.
Data source(s): Pre- and post-assessment instruments on selected subject matter, e.g., multiple-choice or true/false knowledge quizzes or tests; feedback forms or audience surveys distributed with the KM output or after its dissemination or promotion; in-depth interviews (telephone or in-person).
Purpose and issues: Correct recall of infor-mation can be associated with effective knowl-edge development. It indicates an understand-ing of the knowledge or innovation, which may lead to better or more innovative application (Carneiro 2000). Self-efficacy (Indicator 37) and adoption of knowledge into one’s belief system (Indicator 38) can facilitate learning, retention, and recollection and, more impor-tantly, necessary precursors to action (Bandura b 2006; Bell et al. 2008). Correct recall of information suggests that the person continues to have that information in mind for applica-tion in the future. As with Indicator 35, to obtain sufficient information, yes/no questions should be followed up with an open-ended request for respondents to provide specifics.
INDICATOR 37: Number/percentage of intended users who are confident in using knowledge
Definition: This indicator measures the extent to which members of the intended users think they have the necessary skills, authority, and opportunity to act and feel capable of applying knowledge.
Data requirements: Self-report in survey; anecdotal reports from intended users.
Data source(s): Feedback forms or user surveys distributed with the KM output or after its dissemination or promotion; in-depth interviews (telephone or in-person).
Purposes and issues: Self-efficacy, which is the confidence in one’s ability to organize and execute actions to achieve desired goals (Bandura b 2006), is one of the key components of behavior change. Self-efficacy affects a person’s intention to use knowledge (Indicator 39) and his or her actual application of knowledge (Indicators 40, 41, and 42). The availability of information, research findings,
57CHAPTER 5: INDICATORS THAT MEASURE INITIAL OUTCOMES
and lessons from others’ experience can build a person’s confidence to act. Conversely, dissatisfaction with available information (Indicator 25) can undermine the confidence to act. In addition to a simple statement about one’s confidence that can be answered by yes or no, KM researchers can develop and use specific confidence/self-efficacy scales tailored to the particular domain of functioning that is the object of interest (Bandura a 2006).
INDICATOR 38:Number/percentage of intended audience who report that information/knowledge from a KM output changed/reinforced their views, opinions, or beliefs
Definition: This indicator gauges the extent to which audiences’ views, attitudes, opinions, or beliefs changed or else were strengthened as a result of information in the KM output. Views and opinions are a favorable or unfavorable state of mind or feeling toward something. Beliefs are contentions that people accept as true or real.
Data requirements: Self-report in survey; anecdotal reports from users.
Data source(s): User surveys distributed with the KM output or after its dissemination; in-depth interviews (telephone or in-person).
Purpose and issues: The persuasion stage in behavior change occurs when a person forms favorable (or unfavorable) attitudes towards the knowledge/information or KM output, based on assessment of attributes such as relative advantage, compatibility, complexity, observability, and trialability (Rogers 2003; Sullivan 2010). Questions about whether audiences changed their views or opinions due to a KM output can help reveal whether the content was internalized. People often (although not always) act in ways that are
compatible with their views. Consequently, those who feel favorably toward a new concept or innovation are more likely to act on it and adopt new behaviors in the future.
Like questions about knowledge gained, questions about views need to determine both what views or opinions changed or were reinforced and in what direction.
INDICATOR 39: Number/percentage of intended audience who intend to use information and knowledge gained from a KM output
Definition: This indicator measures the extent to which intended audiences plan to put to use the knowledge/information, such as guidance or concepts, gained from KM outputs.
Data requirements: Self-reported information from users on intention to change behavior or practice based on information from a KM output, including identification of the output and the purpose, scope, and nature of the intended application.
Data source(s): User surveys distributed with the KM output or after its dissemination (online, mail), informal (unsolicited) feedback, in-depth interviews (telephone or in-person).
Purpose and issues: This indicator reflects a person’s acceptance of new knowledge and expectation to act on it. This “intention” stage also includes a person’s intention to seek additional information about new knowledge or an innovation (Rogers 2003).
Intention to use precedes use. Perception of usefulness, which relate to usability (Indicator 26) and content (Indicator 27), influences both intention and use. Measuring intention to use is important because it gives an indication of the future. Once users are exposed to new
58 Guide to Monitoring and Evaluating Knowledge Management in Global Health Programs
knowledge, they may expect to use it in the future even if they have not done so yet.
In addition to capturing intention at the initial data collection phase, it is a good practice in ongoing monitoring to check back with respondents later, if possible, to find out if their plans have been carried out.
“Intent to use” is an appropriate measure for KM in addition to the more commonly used “quantity of use” indicator, which fails to predict the success of a KM intervention, along with quality of and type of use that are described in Area 2 below (Jennex 2008). Success in KM can be defined as capturing the right knowledge and getting that knowledge to the right audience to improve organizational or professional performance. Intention to use a KM output suggests that it will be used when needed.
AREA 2: ACTION (DECISION-MAKING, PRACTICE, POLICY)
INDICATOR 40: Number/percentage of intended users applying knowledge gained from KM output to make decisions (organizational or personal)
Definition: This indicator measures the use of information/knowledge from KM outputs in decision-making and the outcomes of that use. It can apply to work-related decisions at both organizational and personal levels.
Data requirements: Description of the information in the KM output that was used; approximate time frame of use; organization(s) involved; title, position, or role of person(s) involved; how users benefited or expect their clientele to benefit from applying the
knowledge/innovation; description of the context of use; scope of application; and any further outcomes associated with use.
Data source(s): User surveys distributed with the KM output or after its dissemination; in-depth interviews (telephone or in-person).
Purpose and issues: This indicator examines how KM outputs, through their effect on users’ knowledge, affected their decision-making. However, audiences may have difficulty recalling just which information influenced their decision-making—let alone recalling which KM outputs provided that information.
Evaluators can ask those exposed to a KM output whether and how the information and knowledge presented by a KM output have affected their decision-making. The data can be quantitative (e.g., percentage of readers who made a decision based on the information) and qualitative, based on anecdotal information (e.g., what decisions did respondents make based on the information).
INDICATOR 41: Number/percentage of intended users applying knowledge gained from a KM output to improve practice (in program, service delivery, training/education, or research)
Definition: This broad indicator measures the use, and the outcomes of the use, of knowledge gained from KM outputs to improve practice guidelines, program design and management, or curricula, and the like, resulting in better service delivery, more efficient programs, better training and education of health care personnel, or stronger research designs.
Data requirements: Description of knowledge from KM outputs that was used,
59CHAPTER 5: INDICATORS THAT MEASURE INITIAL OUTCOMES
approximate timeframe of use, organization(s) involved, how programs or practice benefited from applying the information, and any further outcomes associated with use.
Data source(s): User surveys (online, mail, telephone), usually distributed after the product has been disseminated; informal (unsolicited) feedback; in-depth interviews (telephone or in-person); guidelines or protocols referencing or incorporating information/knowledge from KM outputs.
Purpose and issues: The purpose of this indicator is to trace how knowledge has been specifically used to enhance practice, programs, training, education, or research. A difficulty with measuring effect on practice is that audiences may not recall which particular knowledge gained from what specific KM output was used and how it contributed to a defined outcome, particularly in a case-control approach, which begins with a change in practice and looks for factors that contributed to the change.
Research has found that the information in guidelines is more likely to be adopted when it is disseminated through educational or training interventions than when guidelines are simply distributed in their original written form (NHS Centre for Reviews and Dissemination 1999). A resulting difficulty in measuring the effect of KM outputs such as guidelines is separating the effect of the training from that of the KM output, per se. In fact, however, this is not necessary or even appropriate. When training and information resources are necessary components of the trainee’s education or where training is necessary to use an information resource, the training and the information resource constitute a package that should be evaluated holistically.
Anecdotal reports on use are valuable, particularly given the inherent difficulty in capturing and quantifying the use of information and the outcomes of its use. It is helpful to collect in-depth stories from users of products or services, including reports on improvements or achievements based on using a product or service and on any problems with using it.
To obtain a quantitative indicator, evaluators can count the instances of use of knowledge gained from a KM product or group of products. Alternatively, evaluators can calculate the percentage of respondents to a survey who said that they used knowledge gained from the KM product. For more insight, it is important to follow up with an open-ended request for specific examples and details. Evaluators can then create a case-study summary of the collected anecdotal evidence. This applies to all three action indicators included in the Guide (Indicators 40, 41, and 42).
◆ Example:
In the 2011 K4Health website users’ online survey, majorities of respondents (n=224) used the information obtained from the K4Health website to improve their knowledge (72%), to design or improve projects or programs (55%), and to promote best practices (52%).
In the survey about the LeaderNet webinar on blended learning, when asked for examples of how they applied or plan to apply their new knowledge to their work, participants stated they will apply the ADDIE model (consisting of 5 phases—analysis, design, development, implementation, and evaluation), set SMART objectives (consisting of 5 criteria—specific, measurable, attainable, relevant, and time-bound), thoroughly analyze the target audience, measure learning interventions beyond Kirkpatrick’s Level 1 and 2 (reaction and learning), apply blended learning strategies to their current learning challenges, and engage in Global Health eLearning courses.

60 Guide to Monitoring and Evaluating Knowledge Management in Global Health Programs
INDICATOR 42: Number/percentage of intended audience using knowledge gained from a KM output to inform policy
Definition: This indicator measures the use of knowledge gained from KM outputs in policy formulation and the outcomes of that use. It covers efforts either to change or enhance existing policies or to develop new policies—at any level of the health system. Policies both reflect and affect the public interest and are considered keystones or necessary tools in making public health improvements.
Data requirements: Self-reported information from audiences using the knowledge to inform policy. Description of knowledge from a KM output used, approximate time frame of use, organization(s) involved, how policy formulation benefited from applying the knowledge, and any further outcomes associated with applying the knowledge.
Data sources: Audience surveys (online, mail, telephone), usually distributed after the product has been disseminated; informal (unsolicited) feedback; in-depth interviews (telephone or in-person); copies of policies referencing, incorporating, or shaped by information/knowledge from KM outputs.
Purpose and issues: This indicator tracks specifically how knowledge from a KM output has informed policy. Making health policies evidence-based is a cornerstone of health system governance (WHO/Europe 2013).
Like the previous indicator on practice (Indicator 41), the number of instances of use of knowledge gained from a KM product or group of products to inform policy can provide a quantitative assessment. Alternatively, evaluators can calculate the percentage of respondents to a survey who said that they used the knowledge gained from the KM product to shape policy. For more insight, it is important to follow up with an open-ended request for specifics. Evaluators can then create a case-study summary of the collected anecdotal evidence.
Methodological challenges involved in measuring the role of knowledge in policy formulation include the sometimes-competing, sometimes-reinforcing influences of other external forces or conditions; attribution; an often long time frame needed for changes to occur, shifting strategies and milestones, and policy-makers’ capacity and engagement (Reisman et al. 2007). It may not be easy for respondents to recall which particular knowledge gained from which specific KM output was used and how it contributed to the policy.

61REFERENCES
ReferencesAlajmi, B. (2008). Understanding knowledge-sharing behavior: A theoretical framework. In Knowledge
Management in Organizations (pp. 6-14). NJ: Rutgers University.
Altschuld, J. W., & Kumar, D. D. (Eds.). (2009). Needsassessment:Anoverview (Vol. 1). Thousand Oaks, CA: Sage Publications.
American Productivity and Quality Center (APQC). (2011). Whereareyounow?Aknowledgemanagementprogram self-assessment. Houston, TX: APQC.
Arrow, K. J. (1962). The economic implications of learning by doing. The Review of Economic Studies, 29(3), 155-173.
Asian Development Bank. (2008). Auditingthelessonsarchitecture. Mandaluyong City, Philippines: Asian Development Bank. Retrieved from http://www.adb.org/publications/auditing-lessons-architecture
Bandura, A. (2006)
a. Chapter 14: Guide for constructing self-efficacy scales. Self-efficacy beliefs for adolescents (pp.307-337). Charlotte, NC: Information Age Publishing.
b. Going global with social cognitive theory: From prospect to paydirt. In S. I. Donaldson, D. E. Berger, & K. Pezdek (Eds.). Applied psychology: New frontiers and rewarding careers (pp. 53-79). Mahwah, NJ: Lawrence Erlbaum.
Beck, S. (2009). Thegood,thebad&theUgly:or,whyit’sagoodideatoevaluateWebSources.Retrieved from http://lib.nmsu.edu/instruction/eval.html
Bell, D. S., Harless, C. E., Higa, J. K., & Mangione, C. M. (2008). Knowledge retention after an online tutorial: A randomized educational experiment among resident physicians. Journal of General Internal Medicine, 23(8), 1164-1171.
Bertrand, J. T., & Escudero, G. (2002). Compendium of indicators for evaluating reproductive health programs. MEASURE Evaluat ion, Carolina Population Center, University of North Carolina at Chapel Hill.
Bordia, P., Irmer, B.E., Garden, M., Phair, K., & Abusah, D. (2004). Knowledge sharing in response to a supportive work environment: evidence from an Australian engineering firm. In: B. Trezzeni, P. Lambe & S. Hawamdeh (Eds.), People,knowledgeandtechnology:whathavewelearntsofarproceedingof thefirstiKMSInternationalconferenceonknowledgemanagement (pp. 129–139). Singapore: World Scientific.
Carneiro, A. (2000). How does knowledge management influence innovation and competitiveness? Journal of knowledge management, 4(2), 87-98.
Clifton, B. (2012). AdvancedwebmetricswithGoogleanalytics. Indianapolis: John Wiley.
Collison, C. and Parcell, G. (2004). Learningtofly:Practicalknowledgemanagementfromleadingandlearningorganizations. Chichester, West Sussex: Capstone.
62 Guide to Monitoring and Evaluating Knowledge Management in Global Health Programs
Colorado State University (2013). WritingatCSUguide:Contentanalysis. Retrieved from http://writing.colostate.edu/guides/guide.cfm?guideid=61
Food and Agriculture Organization of the United Nations. (1997). Chapter 5: Personal Interviews. In Marketingresearchandinformationsystems. Rome, Italy: FAO. Retrieved from http://www.fao.org/docrep/W3241E/W3241E00.htm
Frost, A. (2010). KMT:AneducationalKMSite. Retrieved from http://www.knowledge-management-tools.net/.
Glanz, K., Rimer, B., & Viswanath, K. (Eds.). (2008). Healthbehaviorandhealtheducation:Theory,research, and practice. San Francisco, CA: Jossey-Bass.
Grimshaw, J. (2011). A knowledge synthesis chapter. In Aguidetoknowledgesynthesis. Canadian Institutes of Health Research.
Gupta, K. (2007). Apracticalguidetoneedsassessment. C. Skeezer & D. Russ-Eft (Eds.). San Francisco, CA: Pfeiffer.
Health on the Net Foundation. (n.d.). HONcode.Retrieved from http://www.hon.ch/HONcode/
Heiman, G.A. (2002). Researchmethodsinpsychology. (3rd ed.). Boston and New Work: Houghton Mifflin Company.
Hurley, T.A. & Green, C.W. (2005). Creatingaknowledgemanagementculture:Theroleoftask,structure,technologyandpeopleinencouragingknowledgecreationandtransfer. Proceedings from the 2005 Midwest Academy of Management Conference.
Jafar, T. H., Jessani, S., Jafary, F. H., Ishaq, M., Orkazai, R., Orkazai, S., Levey, A.S., & Chaturvedi, N. (2005). General practitioners’ approach to hypertension in urban Pakistan: Disturbing trends in practice. Circulation, 111(10), 1278-1283.
Jennex, M.E. (2008). Exploring system use as a measure of knowledge management success. Journal of Organizational and End User Computing (JOEUC), 20(1), 50-63.
Knowledge for Health. (2011). K4Health guide to conducting health information needs assessments. Baltimore: Johns Hopkins Bloomberg School of Public Health, Center for Communication Programs. Retrieved from http://www.k4health.org/resources/k4health-guide-conducting-needs-assessments
Knowledge for Health. (2012). Theintersectionof knowledgemanagementandhealthsystemsstrengthening:implications from the Malawi Knowledge for Health demonstration project. Baltimore: Johns Hopkins Bloomberg School of Public Health, Center for Communication Programs. Retrieved from http://www.k4health.org/resources/intersection-knowledge-management-and-health-systems-strengthening-implications-malawi
Kols, A. (2004). Managing knowledge to improve reproductive health programs. MAQPaperNo.5. Baltimore: Johns Hopkins Bloomberg School of Public Health, Center for Communication Programs. Retrieved from http://www.k4health.org/resources/managing-knowledge-improve-reproductive-health-programs
Lam, W. (2005). Successful knowledge management requires a knowledge culture: a case study. Knowledge Management Research & Practice, 3(4), 206-217.
63REFERENCES
Lambe, P. (2011). The unacknowledged parentage of knowledge management. Journal of Knowledge Management, 15(2), 175-197.
Lambe, P. and Tan, E. (2008). KMMethods,ApproachesandTools:AGuidebook. Singapore: Straits Knowledge.
Lavis, J. N., Robertson, D., Woodside, J. M., McLeod, C. B., & Abelson, J. (2003). How can research organizations more effectively transfer research knowledge to decision makers? Milbank Quarterly, 81(2), 221-248.
Library and Archives Canada. (2010). Frequentlyaskedquestions. Retrieved from http://www.collectionscanada.gc.ca/007/002/007002-2010-e.html
Machlup, F. (1993). Uses, value, and benefits of knowledge. Science Communication, 14(4), 448-466.
Machlup, F. (1972). The production and distribution of knowledge in the United States (Vol. 278). Princeton, NJ: Princeton University Press.
Mansfield, W. & Grunewald, P. (2013). The use of indicators for the monitoring and evaluation of knowledge management and knowledge brokering in international development. Brighton, UK: Institute of Development Studies Knowledge Services and Loughborough University.
Mathew, V. (2011) KM strategies (Part 1): Key to change and development in business. Journal of Knowledge Management Practice, 12(1).
Maznevski, M. & Athanassiou, N. (2007). Bringing the outside in. In Ichijo, K., & Nonaka, I. (Eds.), Knowledgecreationandmanagement:Newchallengesformanagers. (pp. 69-82). Oxford, New York: Oxford University Press.
MedicalJournalImpactFactors. (n.d.). Retrieved from http://impactfactor.weebly.com/medicine.html
Milton, N (2005). Knowledge management for teams and projects. Oxford, UK: Neal-Schuman Publishers.
Nadler, L. (1984). The handbook of human resource development. New York: John Wiley & Sons.
National Center for the Dissemination of Disability Research (NCDDR) (2006). Overview of international literature on knowledge translation. FOCUSTechnicalBrief No.14.Austin, TX: Southwest Educational Development Laboratory. Retrieved from http://www.ktdrr.org/ktlibrary/articles_pubs/ncddrwork/focus/focus14/Focus14.pdf
NHS Centre for Reviews and Dissemination. (1999). Getting evidence into practice. Effective Health Care,5(1).
Nolan T., Angos, P., Cunha, A., Muhe, L., Qazi, S., Simoes, E., Tamburlini, G., Weber,
M., & Pierce, N. F. et al. (2001). Quality of hospital care for seriously ill children in less developed countries. TheLancet,357(9250),106-110.
Nonaka, I. & Takeuchi, H. (1995). Theknowledgecreatingcompany. New York: Oxford University Press.
Ohio University/C-Change. (2011). Social and behavior change communication (SBCC): Resources on theory and its application.C-Capacity#11, Issue 11.
64 Guide to Monitoring and Evaluating Knowledge Management in Global Health Programs
OpenSpaceWorld. (n.d.). Retrieved from http://www.openspaceworld.org/
Organisation for Economic Co-operation and Development (OECD). (2010). Glossaryof keytermsinevaluation and results based management. Paris: OECD Publications.
Pakenham-Walsh, N. (2012). Towards a Collective Understanding of the Information Needs of Health Care Providers in Low-Income Countries, and How to Meet Them. Journal of health communication, 17(sup2), 9-17.
Piotrow, P.T., Kinkaid, D.L., Rimon, J.G., Rinehart, W. (1997). Healthcommunication:Lessonsfromfamilyplanning and reproductive health. Westport, CT: Praeger Publishers.
Polanyi, Michael. (1962).Personalknowledge:Towardsapost-criticalphilosophy(2nd ed.). London: Routledge & Kegan Paul.
Prochaska, J.O. and DiClemente, C.C. (1984). Thetranstheoreticalapproach:Towardsasystematiceclecticframework. Homewood, IL: Dow Jones Irwin.
Ramalingam, B. (2006). RAPIDToolkit-ToolsforKnowledgeandLearning:Aguidefordevelopmentandhumanitarian organizations. London: Overseas Development Institute.
Reisman, J., Gienapp, A., & Stachowiak, S. (2007). A guide to measuring advocacy and policy. In The Evaluation Exchange XIII. Cambridge, MA: Harvard Family Research Project.
Rekers, J. (2012). Evaluatingandvalidatinginnovativesolutions:Theroleof intermediariesintwoknowledge-intensive sectors [PowerPoint slides]. Retrieved from https://underpinn.portals.mbs.ac.uk/Portals/70/docs/Rekers%20-%20demand_innovation_presentation.pdf
Rogers, E. M. (2003) Diffusion of innovations (5th ed.). New York, NY: Free Press.
Salem, R. M., Bernstein, J., Sullivan, T. M., & Lande, R. (2008). Communication for better health. Population Reports, Series J, No. 56. Baltimore, MD: INFO Project, Johns Hopkins Bloomberg School of Public Health
Schubach, C. (2008). Leveraging organizational structure and communities of practice for the transmission of tacit knowledge. In Knowledge Management in Organizations (pp. 217-223). NJ: Rutgers University.
Sullivan, T.M., Harlan, S., Pakenham-Walsh, N., Ouma, S. (2012). Working together to meet the information needs of health care providers, program managers, and policy makers in low- and middle-income countries. Journalof HealthCommunication,17(Sup. 2), 5-8.
Sullivan, T. M., Ohkubo, S., Rinehart, W., & Storey, J. D. (2010). From research to policy and practice: a logic model to measure the impact of knowledge management for health programs. KnowledgeManagementforDevelopmentJournal, 6(1), 53-69.
Sullivan, T.M., Strachan, M. & Timmons, B.K. (2007). Guide to Monitoring and Evaluating Health Information Products and Services. Baltimore, MD: Center for Communication Programs, Johns Hopkins Bloomberg School of Public Health; Washington, DC: Constella Futures; Cambridge, MA: Management Sciences for Health.

65REFERENCES
Smith, S. (2012). Howtomeasurecustomersatisfaction:Doyouoverlookthese4keycustomersatisfactionmeasurements? Retrieved from http://www.qualtrics.com/blog/customer-satisfaction-measurement/.
Sveiby, K. E. (1997). Theneworganizationalwealth:Managingandmeasuringknowledgebasedassets. San Francisco, CA: Berrett-Koehler Publishers.
Trochim, W. and Donnelly, J.P. (2006). The research methods knowledge base (3rd Ed.). Mason, Ohio. Atomic Dog.
UNDP/UNFPA/WHO/World Bank Special Programme of Research, Development and ResearchTraining in Human Reproduction (HRP). (2008). Knowledge synthesis and transfer: a case-study. Geneva: WHO. Retrieved from http://whqlibdoc.who.int/hq/2008/WHO_RHR_HRP_08.09_eng.pdf
United States Agency for International Development (USAID). (2012). USAIDresourceguideforfamilyplanning:Aguidetotoolsandresourcestosupportfamilyplanningprogrammingandadvocacy. Washington, DC: USAID.
Van Ryn, M., & Heaney, C. A. (1992). What’s the use of theory? HealthEducation&Behavior, 19(3), 315-330.
Wadhwani N., Pitman, M., Mody, A. (2005). Healtheducationtovillages:Anintegratedapproachtoreducechildhoodmortalityandmorbidityduetodiarrhoeaanddehydration;Maharashtra,India2005–1010. Retrieved from http://hetv.org/india/mh/plan/hetvplan.pdf
Wardlaw T., Salama, P., Johansson, E.W., & Mason, E. (2006). Pneumonia: the leading killer of children. TheLancet,368, 1048-50.
Wikipedia
Acquiescence bias http://en.wikipedia.org/wiki/Acquiescence_bias
Quasi-experiment http://en.wikipedia.org/wiki/Quasi-experiment
Social desirability bias http://en.wikipedia.org/wiki/Social_desirability_bias
World Bank (1999). Worlddevelopmentreport1998/1999:Knowledgemanagement. New York: Oxford University Press, Inc.
World Bank. (2011). Theartof knowledgeexchange:Aresults-focusedplanningguidefordevelopmentpractitioners. Geneva, Switzerland: World Bank.
World Health Organization (2012). Everybody’sbusiness:strengtheninghealthsystemstoimprovehealthoutcomes,WHO’sframeworkforaction. Geneva: WHO. Retrieved from http://www.who.int/healthsystems/strategy/everybodys_business.pdf
World Health Organization Regional Office for Europe (2013). Healthsystemsgovernance. Retrieved from http://www.euro.who.int/en/what-we-do/health-topics/Health-systems/health-systems-governance.
66 Guide to Monitoring and Evaluating Knowledge Management in Global Health Programs
GlossaryAction: The adoption of knowledge for decision-making purposes or for application in practice and policy.
• Decision-making: The use of knowledge to inform a decision.
• Practice: The use of knowledge specifically to change global health management and clinical behavior.
• Policy: The use of knowledge to inform management and/or procedure.
Courtesy bias: A type of response bias that occurs when a respondent is trying to be polite or courteous toward the questioner.
Community of practice (CoP): A community of practice (CoP) is a group of people with a common interest who interact regularly to learn from each other by sharing experiences and exchanging information.
Data, information, and knowledge: Data are the raw or unorganized building blocks of information, often presented as numbers, words, or symbols. People convert data into information by interpreting and presenting them in a meaningful, structured way for a specific purpose. Knowledge is ultimately derived from data and information (Milton 2005).
Engagement: Engagement relates to users’ interactions with other users and to their connection with the knowledge presented. Also see “Reach.”
Explicit knowledge: Knowledge that can be effectively communicated via symbols—words and numbers, typically. It is relatively easy to capture, codify, organize, and share across distances (Nonaka and Takeuchi 1995).
File downloads: An internet user’s transfer of content from a website to his or her own electronic storage medium.
Information: See “Data, information, and knowledge.”
Inputs: The resources put into a program.
Intended users: See “Users.”
Knowledge: See “Data, information, and knowledge.”
Knowledge management (KM): A complex, non-linear process that relies on good processes, appropriate technology, and, most importantly, people who have the capacity and motivation to share knowledge (Milton 2005).

67GLOSSARY
KM activities: KM activities in global health seek to collect knowledge, to connect people to the knowledge they need, and to facilitate learning before, during, and after program implementation (Milton 2005). KM activities in global health can be classified into four categories: (1) products and services; (2) publications and resources; (3) training and events; and (4) approaches and techniques.
KM outputs: Tools for sharing knowledge, within the organization and/or with the clients. In this Guide a wide range of outputs are identified and categorized into the four areas below.
• Products and services (e.g., websites, mobile applications, applied technologies, resource centers)
• Publications and resources (e.g., policy briefs, journal articles, project reports)
• Training and events (e.g., workshops, seminars, mentoring sessions)
• Approaches and techniques (e.g., reviews, reporting, communities of practice)
Learning: The progression from awareness of an innovation to one’s attitudes toward an innovation to the intention to use it.
• Awareness: A person’s recognition, understanding, and insights about an innovation, such as what the knowledge is and why it is important (Rogers, 2003).
• Attitude: A favorable or an unfavorable impression of the knowledge. (Rogers (2003) refers to this step as “persuasion.”)
• Intention: Intention to use knowledge results from a decision process that people undergo to accept or reject the knowledge. People may decide to use or “adopt” the KM activities fully as “the best course of action available” or to reject it (Rogers 2003).
Likert scale: A way to measure attitudes and behaviors in a survey by offering answer choices ranging from one extreme to the other (for example, strongly disagree to strongly agree). Unlike a “yes/no” question, this allows the researcher to examine degrees of opinion.
Link: A URL, located on another website that directs users to the publisher’s website.
Outcomes: The changes anticipated in the target population as a result of the program.
Outputs: The products and services created by the processes undertaken.
Pageviews: The total number of times that a page’s tracking code is executed on a website, i.e., the page is “viewed” by a visitor.

68 Guide to Monitoring and Evaluating Knowledge Management in Global Health Programs
Primary distribution: This refers to distribution of KM outputs by the original developer/implementer to intended users. It implies initial and direct contacts and information/knowledge flows.
Processes: The activities undertaken as part of a program.
Qualitative data: A way of describing phenomena in a non-numerical way. Some of the major categories of qualitative data are: in-depth interviews, direct observations, and written reports (Trochim and Donnelly 2006). While quantitative data are essential for measuring results and gauging impact (Bertrand and Escudero 2002), qualitative data can provide a more nuanced understanding of results.
Quality: In KM, it relates to the user’s perception of the quality characteristics of KM outputs in terms of accuracy, authority, objectivity, currency, and coverage (Beck 2009).
Quantitative data: A way of describing or measuring phenomena in numerical form (Trochim and Donnelly 2006). See “Qualitative data.”
Quasi-experimental design: The design of a quasi-experiment relates to the setting up of a particular type of experiment or other study in which one has little or no control over the allocation of the treatments or other factors being studied (Wikipedia).
Reach: Reach and engagement are the breadth (how far out) and saturation (how deep) of dissemination, distribution, or referral and exchange of knowledge.
Response bias: The respondent gives an answer that they think is most favorable, either for their own benefit or based on what they think the questioner wants.
Satisfaction: Satisfaction is an overall psychological state that includes emotional, cognitive, affective (like/dislike), and behavioral responses to certain characteristics or to the output as a whole topic (Smith 2012).
Secondary distribution: This refers to dissemination as a result of user-initiated requests or reproductions, visits to and downloads from a Web product, as well as news media mentions.
Self-efficacy: One’s belief in one’s ability to succeed in a specific situation, and is an important predictor of behavior change.
69GLOSSARY
Tacit knowledge: Knowledge that is “in people’s heads” or even in “muscle memory.” It comes largely from experience and so encompasses skills, “know-how,” perceptions, and mental models. Tacit knowledge is much harder to codify or record, and thus it is more difficult to communicate across distance and time. It is best communicated face-to-face and by demonstration (Nonaka and Takeuchi 1995; Milton 2005).
Usefulness: Relates to how practical, applicable, and beneficial a KM output is for a particular user. It is determined by the user’s perceptions and satisfaction, as well as by other quality metrics.
Users: The groups that KM activities intend to engage and interact with—through knowledge resources, technical assistance, communities of practice (CoPs), and other activities. In the context of global health, these groups can be health care service providers, decision-makers, and program managers.
Visit: An individual’s interaction with a website, consisting of one or more requests for content (usually a pageview).
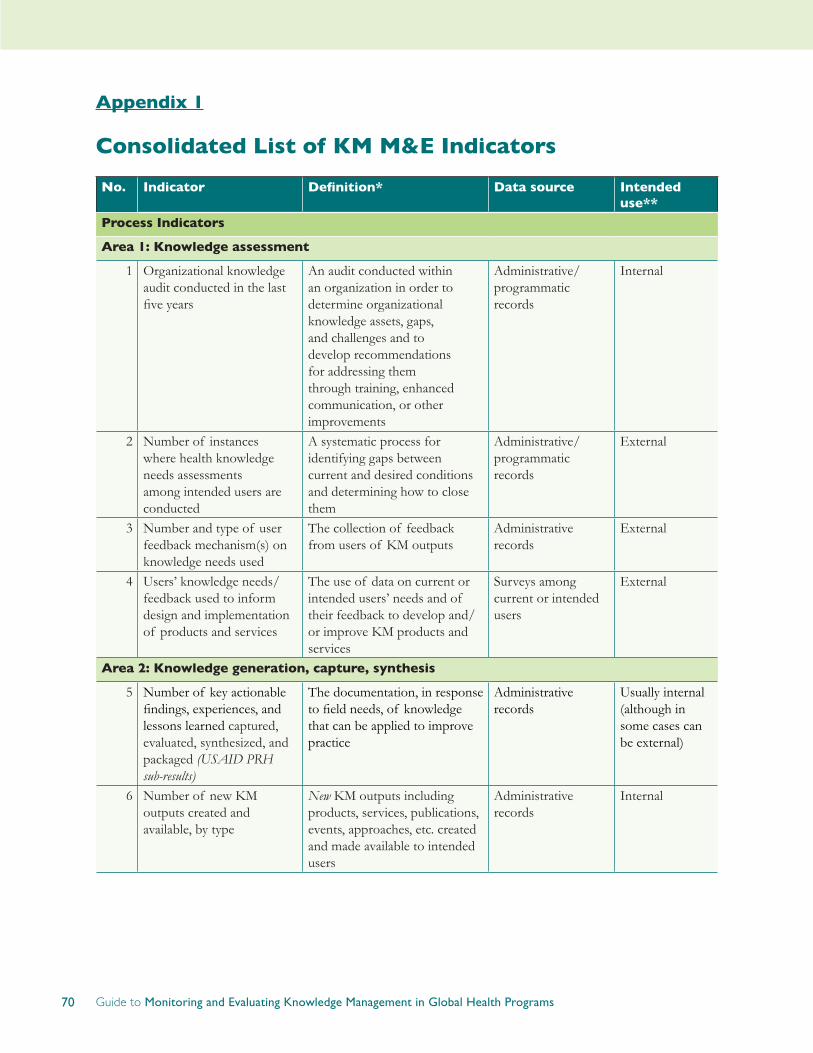
70 Guide to Monitoring and Evaluating Knowledge Management in Global Health Programs
Appendix 1
Consolidated List of KM M&E Indicators
No. Indicator Definition* Data source Intended use**
Process Indicators
Area 1: Knowledge assessment
1 Organizational knowledge audit conducted in the last five years
An audit conducted within an organization in order to determine organizational knowledge assets, gaps, and challenges and to develop recommendations for addressing them through training, enhanced communication, or other improvements
Administrative/programmatic records
Internal
2 Number of instances where health knowledge needs assessments among intended users are conducted
A systematic process for identifying gaps between current and desired conditions and determining how to close them
Administrative/programmatic records
External
3 Number and type of user feedback mechanism(s) on knowledge needs used
The collection of feedback from users of KM outputs
Administrative records
External
4 Users’ knowledge needs/feedback used to inform design and implementation of products and services
The use of data on current or intended users’ needs and of their feedback to develop and/or improve KM products and services
Surveys among current or intended users
External
Area 2: Knowledge generation, capture, synthesis
5 Number of key actionable findings, experiences, and lessons learned captured, evaluated, synthesized, and packaged (USAIDPRHsub-results)
The documentation, in response to field needs, of knowledge that can be applied to improve practice
Administrative records
Usually internal (although in some cases can be external)
6 Number of new KM outputs created and available, by type
New KM outputs including products, services, publications, events, approaches, etc. created and made available to intended users
Administrative records
Internal
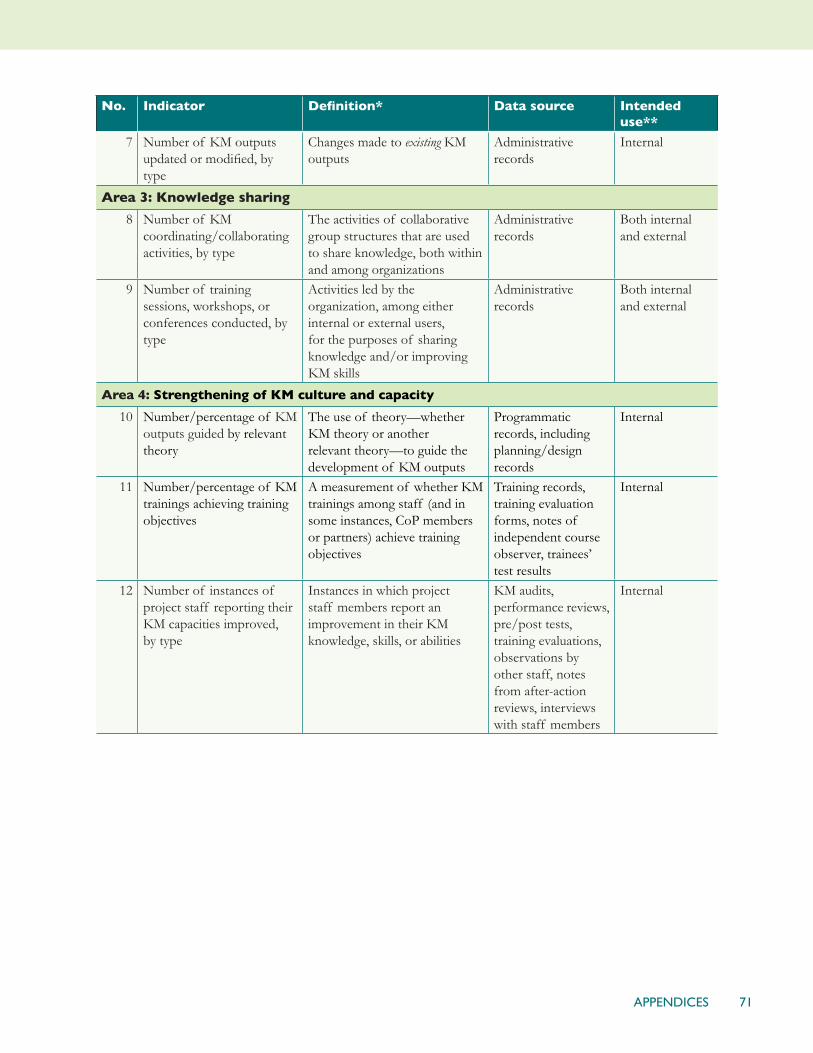
71APPENDICES
No. Indicator Definition* Data source Intended use**
7 Number of KM outputs updated or modified, by type
Changes made to existing KM outputs
Administrative records
Internal
Area 3: Knowledge sharing
8 Number of KM coordinating/collaborating activities, by type
The activities of collaborative group structures that are used to share knowledge, both within and among organizations
Administrative records
Both internal and external
9 Number of training sessions, workshops, or conferences conducted, by type
Activities led by the organization, among either internal or external users, for the purposes of sharing knowledge and/or improving KM skills
Administrative records
Both internal and external
Area 4: Strengthening of KM culture and capacity
10 Number/percentage of KM outputs guided by relevant theory
The use of theory—whether KM theory or another relevant theory—to guide the development of KM outputs
Programmatic records, including planning/design records
Internal
11 Number/percentage of KM trainings achieving training objectives
A measurement of whether KM trainings among staff (and in some instances, CoP members or partners) achieve training objectives
Training records, training evaluation forms, notes of independent course observer, trainees’ test results
Internal
12 Number of instances of project staff reporting their KM capacities improved, by type
Instances in which project staff members report an improvement in their KM knowledge, skills, or abilities
KM audits, performance reviews, pre/post tests, training evaluations, observations by other staff, notes from after-action reviews, interviews with staff members
Internal
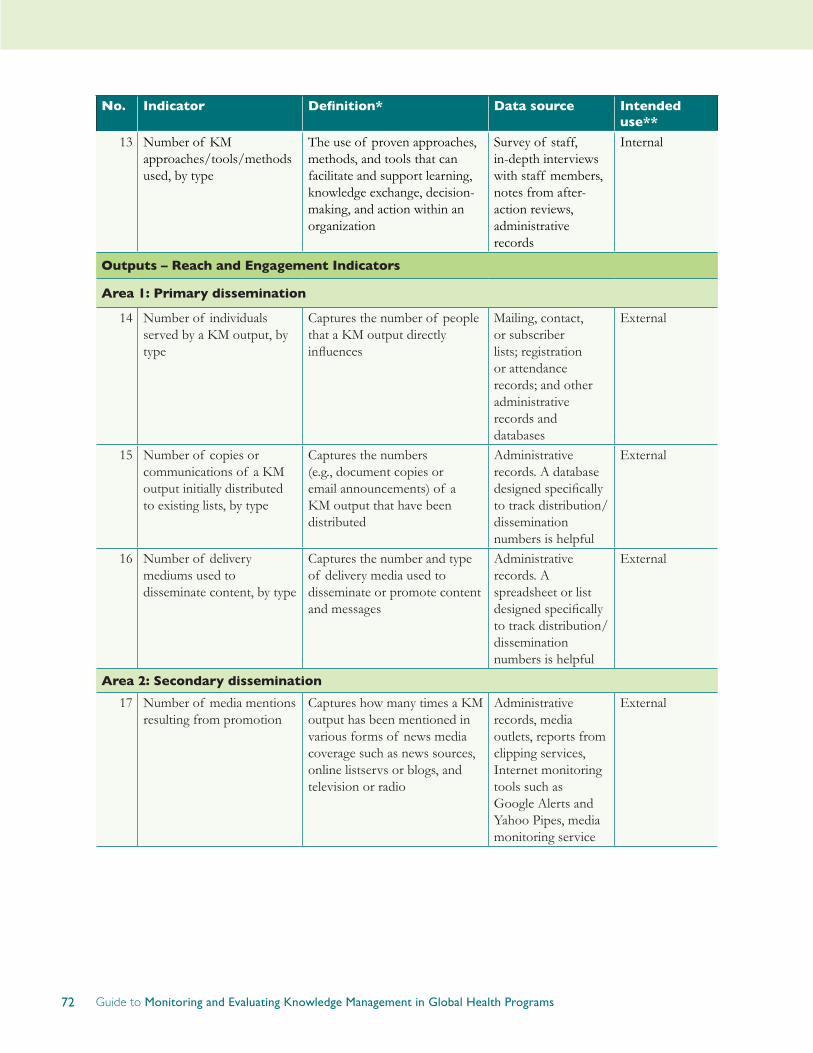
72 Guide to Monitoring and Evaluating Knowledge Management in Global Health Programs
No. Indicator Definition* Data source Intended use**
13 Number of KM approaches/tools/methods used, by type
The use of proven approaches, methods, and tools that can facilitate and support learning, knowledge exchange, decision-making, and action within an organization
Survey of staff, in-depth interviews with staff members, notes from after-action reviews, administrative records
Internal
Outputs – Reach and Engagement Indicators
Area 1: Primary dissemination
14 Number of individuals served by a KM output, by type
Captures the number of people that a KM output directly influences
Mailing, contact, or subscriber lists; registration or attendance records; and other administrative records and databases
External
15 Number of copies or communications of a KM output initially distributed to existing lists, by type
Captures the numbers (e.g., document copies or email announcements) of a KM output that have been distributed
Administrative records. A database designed specifically to track distribution/dissemination numbers is helpful
External
16 Number of delivery mediums used to disseminate content, by type
Captures the number and type of delivery media used to disseminate or promote content and messages
Administrative records. A spreadsheet or list designed specifically to track distribution/dissemination numbers is helpful
External
Area 2: Secondary dissemination
17 Number of media mentions resulting from promotion
Captures how many times a KM output has been mentioned in various forms of news media coverage such as news sources, online listservs or blogs, and television or radio
Administrative records, media outlets, reports from clipping services, Internet monitoring tools such as Google Alerts and Yahoo Pipes, media monitoring service
External
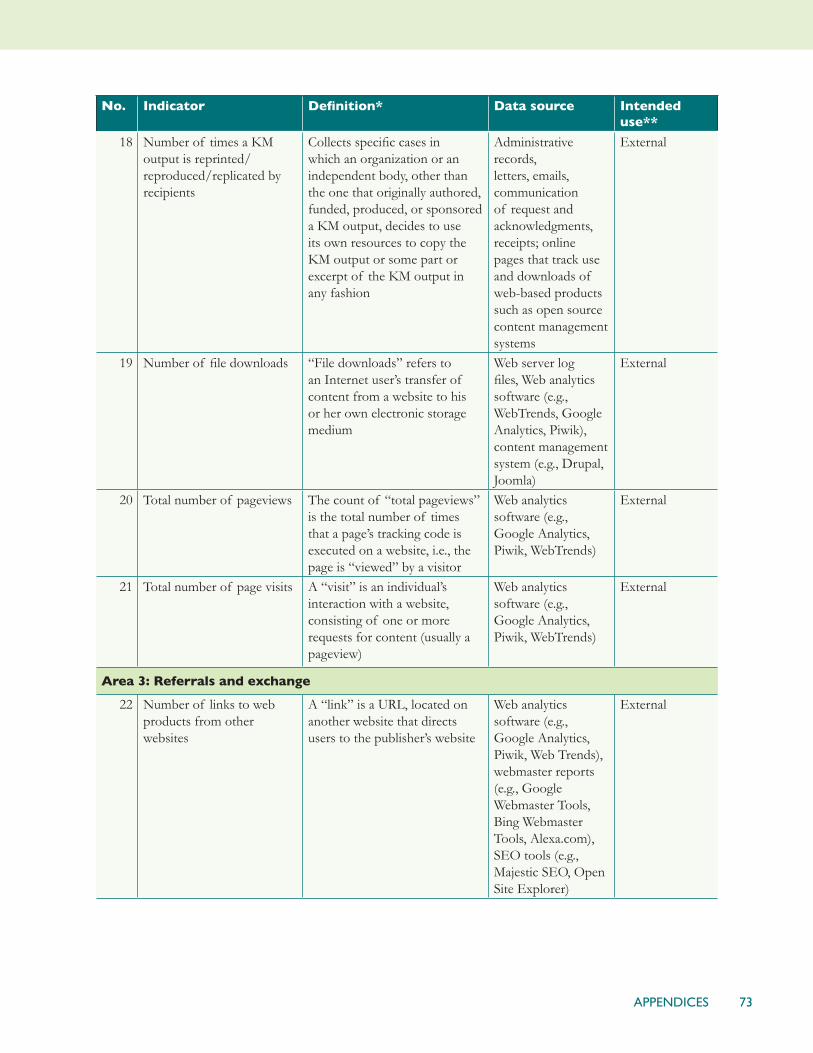
73APPENDICES
No. Indicator Definition* Data source Intended use**
18 Number of times a KM output is reprinted/reproduced/replicated by recipients
Collects specific cases in which an organization or an independent body, other than the one that originally authored, funded, produced, or sponsored a KM output, decides to use its own resources to copy the KM output or some part or excerpt of the KM output in any fashion
Administrative records, letters, emails, communication of request and acknowledgments, receipts; online pages that track use and downloads of web-based products such as open source content management systems
External
19 Number of file downloads “File downloads” refers to an Internet user’s transfer of content from a website to his or her own electronic storage medium
Web server log files, Web analytics software (e.g., WebTrends, Google Analytics, Piwik), content management system (e.g., Drupal, Joomla)
External
20 Total number of pageviews The count of “total pageviews” is the total number of times that a page’s tracking code is executed on a website, i.e., the page is “viewed” by a visitor
Web analytics software (e.g., Google Analytics, Piwik, WebTrends)
External
21 Total number of page visits A “visit” is an individual’s interaction with a website, consisting of one or more requests for content (usually a pageview)
Web analytics software (e.g., Google Analytics, Piwik, WebTrends)
External
Area 3: Referrals and exchange
22 Number of links to web products from other websites
A “link” is a URL, located on another website that directs users to the publisher’s website
Web analytics software (e.g., Google Analytics, Piwik, Web Trends), webmaster reports (e.g., Google Webmaster Tools, Bing Webmaster Tools, Alexa.com), SEO tools (e.g., Majestic SEO, Open Site Explorer)
External

74 Guide to Monitoring and Evaluating Knowledge Management in Global Health Programs
No. Indicator Definition* Data source Intended use**
23 Number of people who made a comment or contribution
Captures active sharing of programmatic experience and knowledge among people participating in KM outputs, usually those hosted online, such as professional network groups, communities of practice, forums, webinars, or social media (e.g., blogs, Facebook, LinkedIn)
Administrative records of comments posted via listservs, discussion groups, communities of practice, or social media tools
External
Outputs – Usefulness Indicators
Area 1: User satisfaction
24 Number/percentage of intended users receiving a KM output that read or browsed it
Measures to what extent intended users have shown their interests in knowing more about messages and contents offered through a KM output
Bounce-back feedback forms; user surveys (in print, online, or via email or telephone) distributed after dissemination or promotion of a KM output
External
25 Number/percentage of intended users who are satisfied with a KM output
Measures an intended user’s overall satisfaction with a KM output. “Satisfied” indicates that the output met the intended user’s needs and expectations
Feedback forms and user surveys (print, online, e-mail, or telephone). Interviews and focus groups discussions can capture further qualitative information
External
26 User rating of usability of KM output
Measures user’s attitude toward and satisfaction with the format, presentation, navigation, searchability, and delivery of a KM output
Feedback forms or user surveys distributed with the KM output or after a KM output has been disseminated, interviews, focus group discussions, usability assessments
External

75APPENDICES
No. Indicator Definition* Data source Intended use**
27 User rating of content of KM output and its relevance
Measures the perceived quality of content in a KM output and its relevance to user’s needs. “Content” means the information or knowledge conveyed in a KM output; “Relevance” indicates that intended users find the information or knowledge applicable and important to their professional work
Feedback forms or user surveys distributed with the product or after a KM output has been disseminated and promoted, interviews, focus group discussions
External
28 Number/percentage of intended users who recommend a KM output to a colleague
A recommendation is an endorsement of the output, indicating the recommender’s judgment that the output is a suitable resource for a particular purpose. The term “colleague” indicates a professional relationship
Feedback forms, user surveys (print, online, email, telephone), evaluations of extended professional networks, if feasible
External
Area 2: Quality
29 Average pageviews per website visit
The number of times a web page is viewed, divided by the number of site visits
Web analytics software (e.g., Google Analytics, Piwik, WebTrends)
External
30 Average duration of website visit
The mean length of time for visits to a website, calculated as the difference between the times of a visitor’s first and last activity during the visit and averaged for all visitors
Web analytics software (e.g., Google Analytics, Piwik, WebTrends)
External
31 Number of citations of a journal article or other KM publication
The number of times a journal article or other KM publication (such as a book or white paper) is referenced in other information products
Citation studies, web search engines, citation indexes. Internet search engines such as Google Scholar can provide partial information on the number of times a publication is cited online. Citation reports are costly but easy to obtain from specialized services
External
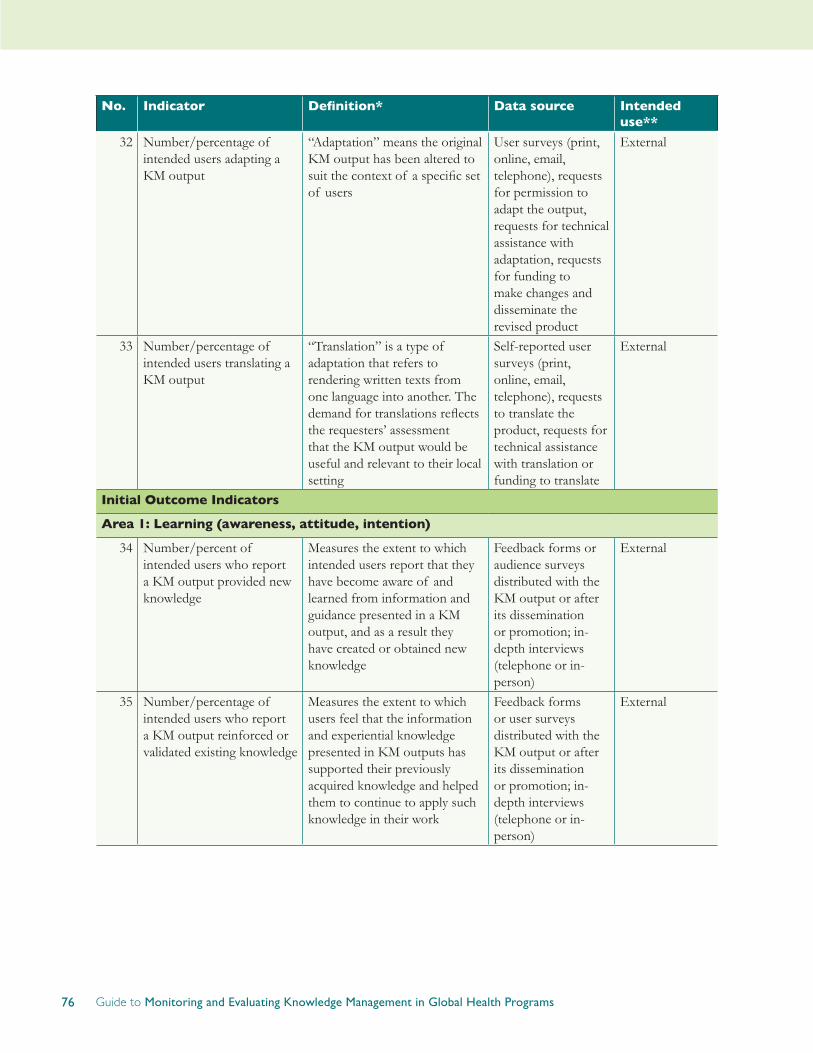
76 Guide to Monitoring and Evaluating Knowledge Management in Global Health Programs
No. Indicator Definition* Data source Intended use**
32 Number/percentage of intended users adapting a KM output
“Adaptation” means the original KM output has been altered to suit the context of a specific set of users
User surveys (print, online, email, telephone), requests for permission to adapt the output, requests for technical assistance with adaptation, requests for funding to make changes and disseminate the revised product
External
33 Number/percentage of intended users translating a KM output
“Translation” is a type of adaptation that refers to rendering written texts from one language into another. The demand for translations reflects the requesters’ assessment that the KM output would be useful and relevant to their local setting
Self-reported user surveys (print, online, email, telephone), requests to translate the product, requests for technical assistance with translation or funding to translate
External
Initial Outcome Indicators
Area 1: Learning (awareness, attitude, intention)
34 Number/percent of intended users who report a KM output provided new knowledge
Measures the extent to which intended users report that they have become aware of and learned from information and guidance presented in a KM output, and as a result they have created or obtained new knowledge
Feedback forms or audience surveys distributed with the KM output or after its dissemination or promotion; in-depth interviews (telephone or in-person)
External
35 Number/percentage of intended users who report a KM output reinforced or validated existing knowledge
Measures the extent to which users feel that the information and experiential knowledge presented in KM outputs has supported their previously acquired knowledge and helped them to continue to apply such knowledge in their work
Feedback forms or user surveys distributed with the KM output or after its dissemination or promotion; in-depth interviews (telephone or in-person)
External
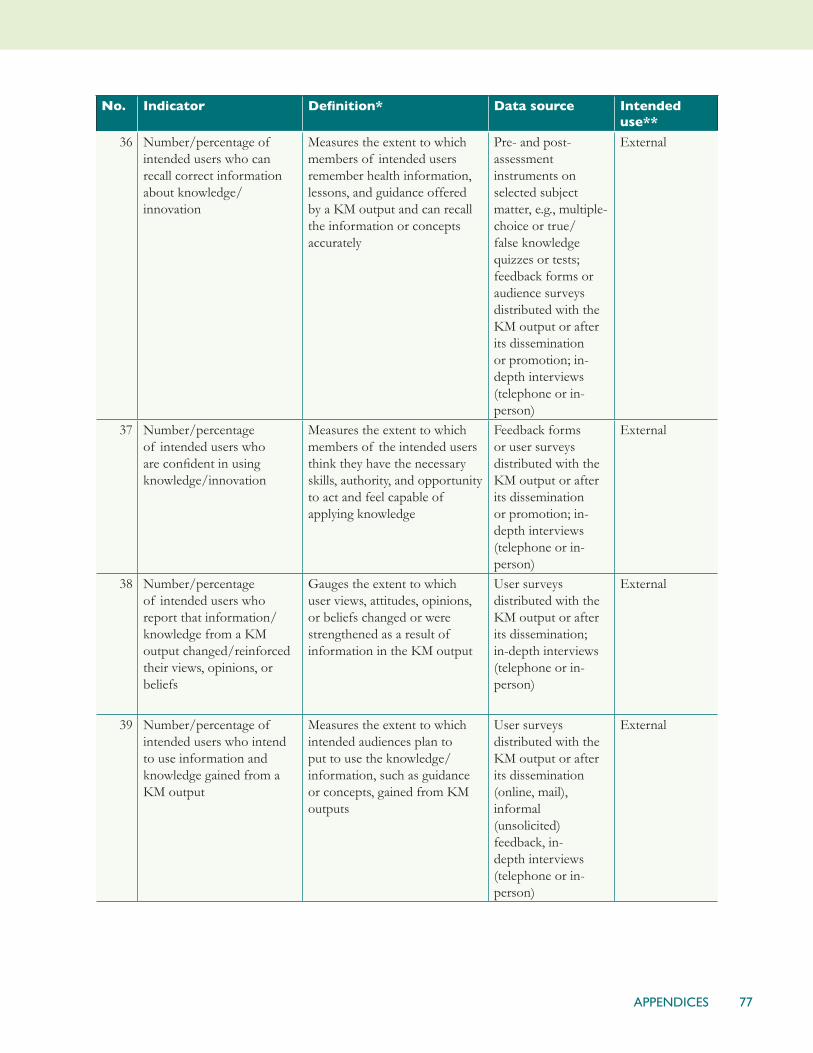
77APPENDICES
No. Indicator Definition* Data source Intended use**
36 Number/percentage of intended users who can recall correct information about knowledge/innovation
Measures the extent to which members of intended users remember health information, lessons, and guidance offered by a KM output and can recall the information or concepts accurately
Pre- and post-assessment instruments on selected subject matter, e.g., multiple-choice or true/false knowledge quizzes or tests; feedback forms or audience surveys distributed with the KM output or after its dissemination or promotion; in-depth interviews (telephone or in-person)
External
37 Number/percentage of intended users who are confident in using knowledge/innovation
Measures the extent to which members of the intended users think they have the necessary skills, authority, and opportunity to act and feel capable of applying knowledge
Feedback forms or user surveys distributed with the KM output or after its dissemination or promotion; in-depth interviews (telephone or in-person)
External
38 Number/percentage of intended users who report that information/knowledge from a KM output changed/reinforced their views, opinions, or beliefs
Gauges the extent to which user views, attitudes, opinions, or beliefs changed or were strengthened as a result of information in the KM output
User surveys distributed with the KM output or after its dissemination; in-depth interviews (telephone or in-person)
External
39 Number/percentage of intended users who intend to use information and knowledge gained from a KM output
Measures the extent to which intended audiences plan to put to use the knowledge/information, such as guidance or concepts, gained from KM outputs
User surveys distributed with the KM output or after its dissemination (online, mail), informal (unsolicited) feedback, in-depth interviews (telephone or in-person)
External

78 Guide to Monitoring and Evaluating Knowledge Management in Global Health Programs
No. Indicator Definition* Data source Intended use**
Area 2: Action (decision-making, policy, practice)
40 Number/percentage of intended users applying knowledge/innovation to make decisions (organizational or personal)
Measures the use of information/knowledge from KM outputs in decision-making and the outcomes of that use. It can apply to work-related decisions at both organizational and personal levels
User surveys distributed with the KM output or after its dissemination; in-depth interviews (telephone or in-person)
External
41 Number/percentage of intended users applying knowledge/innovation to improve practice (in programs, service delivery, training/education, and research)
Measures the use and outcomes of the use of knowledge gained from KM outputs to improve practice guidelines, program design and management, or curricula, and the like, resulting in better service delivery, more efficient programs, better training and education of health care personnel, or stronger research designs
User surveys (online, mail, telephone), usually distributed after the product has been disseminated; informal (unsolicited) feedback; in-depth interviews (telephone or in-person); guidelines or protocols referencing or incorporating information/knowledge from KM outputs
External
42 Number/percentage of intended users applying knowledge/innovation to inform policy
Measures the use in policy formulation and the outcomes of that use of knowledge gained from KM outputs—either to change or enhance existing policies or to develop new policies—at any level of the health system
Audience surveys (online, mail, telephone), usually distributed after the product has been disseminated; informal (unsolicited) feedback; in-depth interviews (telephone or in-person); copies of policies referencing, incorporating, or shaped by information/knowledge from KM outputs
External

79APPENDICES
Appendix 2
Knowledge Management Capacity Assessment Tool*
Indicator Names
Questions
Description of Stages
Stage 1 Stage 2 Stage 3 Stage 4
4.1
Knowledge exchange
Does your organization use a system for knowledge exchange to generate, learn, share, and use relevant knowledge for the benefit of individuals, units and the organization?
There are no mechanisms for knowledge exchange. Staff does not have time set aside to learn from what they are doing, share, or act creatively and innovatively.
Staff informally share and learn from what they are doing on an ad-hoc basis.
Some structured, formal mechanisms exist for internal knowledge exchange (After Action Reviews, training, workshops, presentations, meetings, mentoring etc).Knowledge exchange mechanisms are not utilized regularly OR they are not utilized by all staff.
The organization uses structured, formal mechanisms for internal AND external knowledge exchange (After Action Reviews, training, workshops, seminars, presentations, meetings, mentoring, website, online learning, etc). Knowledge exchange mechanisms are utilized by staff, and time is set aside roughly once every quarter to share and learn.
4.2
Knowledge management
Does your organization have a repository and system to capture, document, and disseminate knowledge for program improvement, organizational learning, and sharing with external stakeholders?
The organization does not have a knowledge management system.
The organization has an informal knowledge management system, but it is not well organized.
The organization has a formal knowledge management repository and system, which is used to capture and document knowledge gained from program implementation and learning. However, the KM system is not widely known about or well utilized.
The organization has a formal knowledge management repository and system, which is used to capture, document, and disseminate knowledge gained from program implementation and learning. The KM system is widely known about and often used to inform program design and for organizational learning. Knowledge gained benefits the organization.
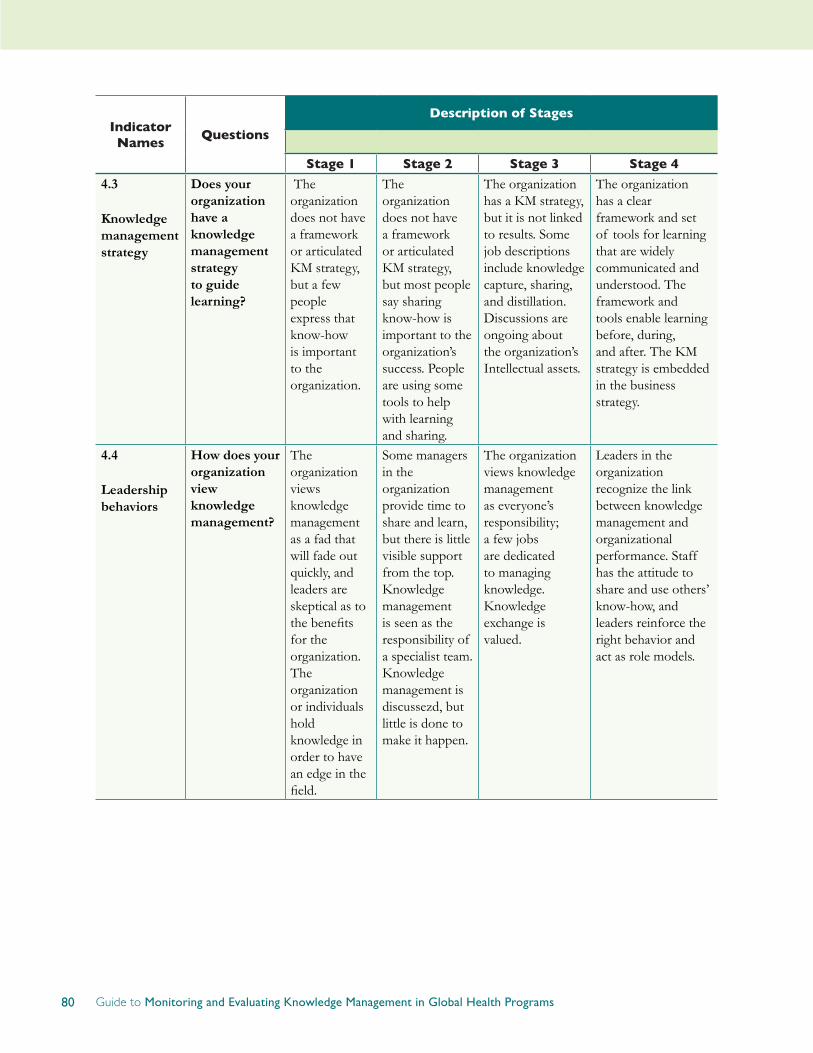
80 Guide to Monitoring and Evaluating Knowledge Management in Global Health Programs
Indicator Names
Questions
Description of Stages
Stage 1 Stage 2 Stage 3 Stage 4
4.3
Knowledge management strategy
Does your organization have a knowledge management strategy to guide learning?
The organization does not have a framework or articulated KM strategy, but a few people express that know-how is important to the organization.
The organization does not have a framework or articulated KM strategy, but most people say sharing know-how is important to the organization’s success. People are using some tools to help with learning and sharing.
The organization has a KM strategy, but it is not linked to results. Some job descriptions include knowledge capture, sharing, and distillation. Discussions are ongoing about the organization’s Intellectual assets.
The organization has a clear framework and set of tools for learning that are widely communicated and understood. The framework and tools enable learning before, during, and after. The KM strategy is embedded in the business strategy.
4.4
Leadership behaviors
How does your organization view knowledge management?
The organization views knowledge management as a fad that will fade out quickly, and leaders are skeptical as to the benefits for the organization. The organization or individuals hold knowledge in order to have an edge in the field.
Some managers in the organization provide time to share and learn, but there is little visible support from the top. Knowledge management is seen as the responsibility of a specialist team. Knowledge management is discussezd, but little is done to make it happen.
The organization views knowledge management as everyone’s responsibility; a few jobs are dedicated to managing knowledge. Knowledge exchange is valued.
Leaders in the organization recognize the link between knowledge management and organizational performance. Staff has the attitude to share and use others’ know-how, and leaders reinforce the right behavior and act as role models.
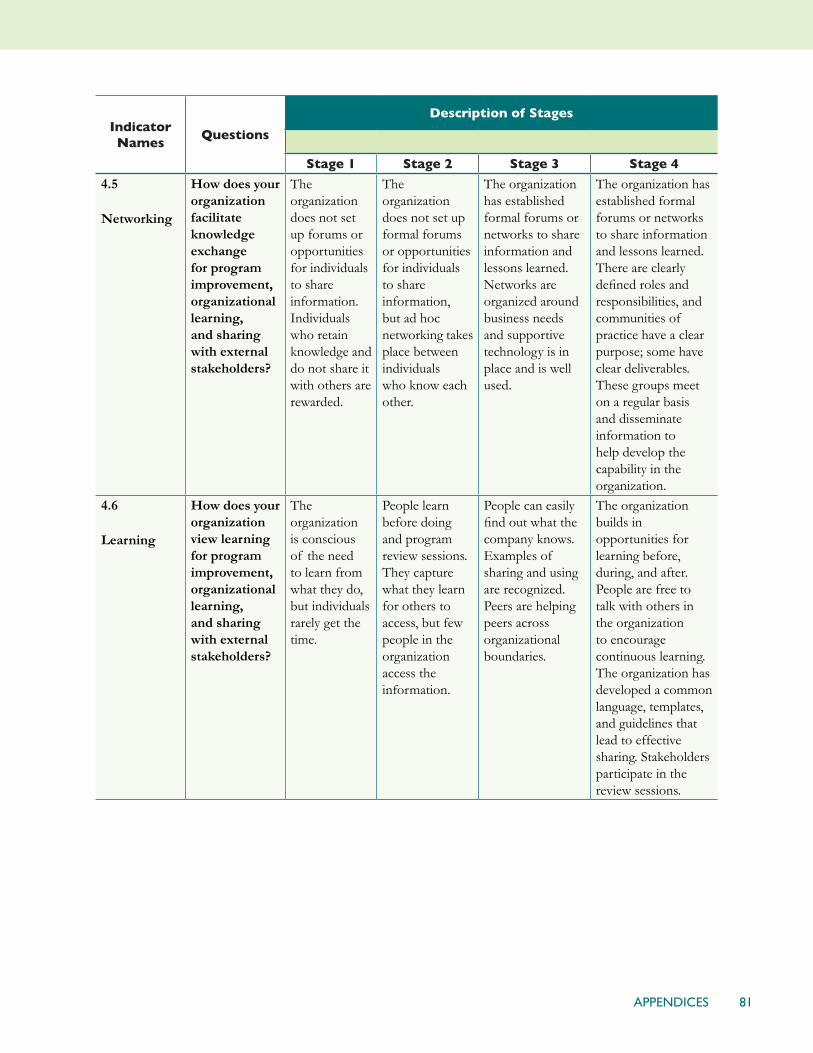
81APPENDICES
Indicator Names
Questions
Description of Stages
Stage 1 Stage 2 Stage 3 Stage 4
4.5
Networking
How does your organization facilitate knowledge exchange for program improvement, organizational learning, and sharing with external stakeholders?
The organization does not set up forums or opportunities for individuals to share information. Individuals who retain knowledge and do not share it with others are rewarded.
The organization does not set up formal forums or opportunities for individuals to share information, but ad hoc networking takes place between individuals who know each other.
The organization has established formal forums or networks to share information and lessons learned. Networks are organized around business needs and supportive technology is in place and is well used.
The organization has established formal forums or networks to share information and lessons learned. There are clearly defined roles and responsibilities, and communities of practice have a clear purpose; some have clear deliverables. These groups meet on a regular basis and disseminate information to help develop the capability in the organization.
4.6
Learning
How does your organization view learning for program improvement, organizational learning, and sharing with external stakeholders?
The organization is conscious of the need to learn from what they do, but individuals rarely get the time.
People learn before doing and program review sessions. They capture what they learn for others to access, but few people in the organization access the information.
People can easily find out what the company knows. Examples of sharing and using are recognized. Peers are helping peers across organizational boundaries.
The organization builds in opportunities for learning before, during, and after. People are free to talk with others in the organization to encourage continuous learning. The organization has developed a common language, templates, and guidelines that lead to effective sharing. Stakeholders participate in the review sessions.
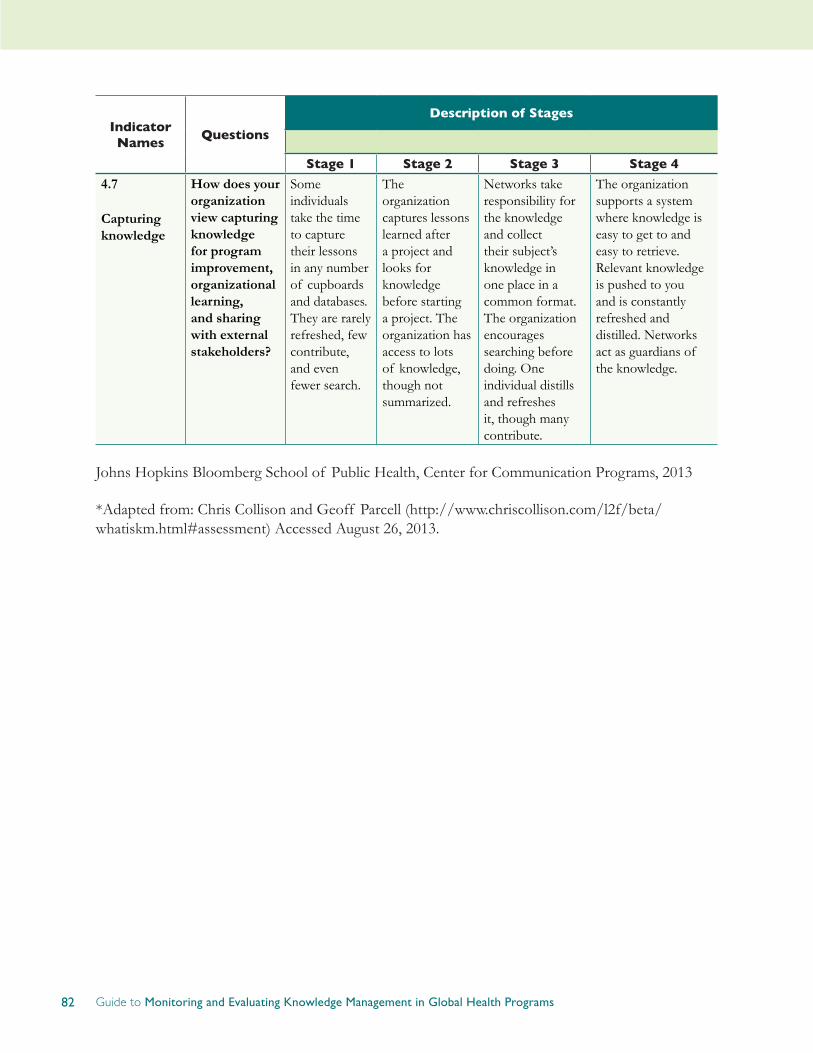
82 Guide to Monitoring and Evaluating Knowledge Management in Global Health Programs
Indicator Names
Questions
Description of Stages
Stage 1 Stage 2 Stage 3 Stage 4
4.7
Capturing knowledge
How does your organization view capturing knowledge for program improvement, organizational learning, and sharing with external stakeholders?
Some individuals take the time to capture their lessons in any number of cupboards and databases. They are rarely refreshed, few contribute, and even fewer search.
The organization captures lessons learned after a project and looks for knowledge before starting a project. The organization has access to lots of knowledge, though not summarized.
Networks take responsibility for the knowledge and collect their subject’s knowledge in one place in a common format. The organization encourages searching before doing. One individual distills and refreshes it, though many contribute.
The organization supports a system where knowledge is easy to get to and easy to retrieve. Relevant knowledge is pushed to you and is constantly refreshed and distilled. Networks act as guardians of the knowledge.
Johns Hopkins Bloomberg School of Public Health, Center for Communication Programs, 2013
*Adapted from: Chris Collison and Geoff Parcell (http://www.chriscollison.com/l2f/beta/whatiskm.html#assessment) Accessed August 26, 2013.

83APPENDICES
Appendix 3
Web Analytics: Recommendations and a Success Story
ScottDalessandro
This section presents recommended and best practices in the use of Web analytics. It covers issues to consider when using Web analytics and an example of how Web analytics can be used to show the effectiveness of a KM output.
In recent years Web usage statistics have become increasingly accurate, nuanced, and easy to collect. Free and subscription-based tools such as Google Analytics, Piwik, and WebTrends make data accessible to anyone who manages a website. At the same time, the ability to cheaply and easily collect and manipulate data on countless indicators can quickly overwhelm even the most sophisticated M&E professional.
Organizations’ ability to collect and analyze Web usage statistics varies widely for reasons that include resource availability, experience, and technical knowledge. Despite this variation, the typical starting point is to use Web analytics tools to collect data on outputs and general trends. Such reports typically contain metrics on visitor demographics (e.g., visitors’ country of origin, technology used), traffic volume (e.g., unique visits, pageviews), and engagement (e.g., time on site, percent returning versus new visitors).
More experienced organizations, in addition to collecting level and trend data for reporting, apply this information to enhance online products and services and to design new ones. Before making changes to a Web site, for example, an organization can compare the performance of a new design against the site’s existing one, a process known as A/B testing. Organizations can thus determine whether the new version will increase page views or time on-site. Similarly, an organization can consider analytics data to decide which upgrades and revisions to prioritize, i.e., gauging which enhancements are most likely to improve visitors’ experiences.
Each organization will have its own unique set of Web analytics indicators to suit its goals, priorities, and resources. For some, tracking a few basic outputs will serve its purposes. For others, precise and detailed data on audience segments will be used by decision-makers to support advocacy, and by program staff to target campaigns and focus marketing efforts.
The following points provide useful guidance for all those using Web analytics, regardless of the complexity of an organization’s Web analytics efforts.
1. Articulate a core objective for your Web product or service
Building a cohesive and valuable Web-based product or service requires first articulating its core objective. Also, for monitoring and evaluating, that objective helps to ensure strategic use of Web analytics tools and to avoid being overwhelmed by their ever-increasing features. For example, a
84 Guide to Monitoring and Evaluating Knowledge Management in Global Health Programs
product’s core objective might be to enable health professionals to exchange best practices or to provide developing-country health professionals with access to research-based evidence. Articulating a core objective will help organizations to stay focused on indicators that truly matter, such as downloads of key publications or percentage of traffic coming from developing countries.
2. Identify key performance indicators
With a core objective in mind, organizations should choose three to five key performance indicators (KPIs) that concisely convey whether or not the Web product or service is meeting the core objective. KPIs will vary by project and organization and be specific to the objective or activity; examples include number of downloads of publications, an amount of time spent on-site sufficient for learning to take place, or number of registered users accessing the site within a specified period of time. In all cases, KPIs should easily and clearly communicate to all stakeholders whether or not the product or service is achieving its core objective.
3. Both quality and quantity matter
No single indicator can tell a comprehensive story. Instead, a set of indicators should reflect both quantity (i.e., reach) and quality (i.e., usefulness). Indicators such as the number of unique visitors and pageviews provide traffic quantity, while visit length, the ratio of new to returning visitors, and bounce rate (i.e., the percentage of visitors who go only one page before exiting a site) suggest traffic quality. While it may be impressive to report large or increasing numbers of pageviews (i.e., large reach), such a trend is less praiseworthy if few visitors return or spend more than a few seconds on your site, which suggests low usefulness.
4. Dig deeper for actionable insights
Going beyond a small set of key performance indicators, collecting and analyzing additional data can provide deeper insights into the efficacy of online efforts. For further guidance on which additional data to explore, Brian Clifton’s AdvancedWebMetricswithGoogleAnalytics (http://www.wiley.com/WileyCDA/WileyTitle/productCd-1118168445.html) and Avinash Kaushik’s WebAnalytics2.0:TheArtof OnlineAccountability&Scienceof CustomerCentricity (http://www.wiley.com/WileyCDA/WileyTitle/productCd-0470529393.html) are useful.
The following list provides examples of high-value analyses and suggested actions:
• How do audiences find your website—organically via search engines, through links from other sites, and/or by email and social media campaigns? Apply these findings to inform promotion and outreach efforts.
• Which content is most popular? Are visitors consuming what you expect and want them to? Be proactive: Create more of what they consume, and better promote and manage what you prefer that they access most.
• Which websites send you high-quality traffic? Form or strengthen relationships where appropriate and feasible.
• Which keywords bring audiences to your site? Do you offer significant and unique content for popular searches?
• When using your website, which search terms do visitors most commonly use? Provide

85APPENDICES
site content and use headings and metadata that mirror popular terms from your search logs. In effect, visitors typing terms into your search box tell you what they expect or would like to find on your site, in their own words.
• Where do audiences leave your site? Besides reviewing top bounce and exit pages, use the features of your Web analytics tool to create and analyze funnels for key goals or targets that you set. (“Funnels” describe traffic towards a goal, seeing if and how it is ultimately reached, as well as where audiences leave.)
• Is your project or organization active on social media platforms? Use your Web analytics tool to examine how visitors referred from social media accounts behave when they come to your site.
5. Avoid thinking about “average users”
While products and services are typically created with certain personas in mind, there is truly no “average user” on the Web. With grounding in a core objective and KPIs, selecting and comparing meaningful visitor attributes and behaviors help to better assess a product’s performance. Relevant segments to analyze can include new versus returning visitors, visitors from developing countries versus others, direct (i.e., users typing the URL into the address bar or using the bookmark) versus referral (i.e., users coming from another website via the link) traffic, and mobile versus desktop traffic. Findings can help enhance current Web products or to develop new ones, as well as to better understand how well the most loyal visitors fit the profile of the intended users.
6. Use other data collection methods to triangulate analytics data
For monitoring and evaluating Web products and services, analytics are extremely adept at describing what a site’s traffic is but quite poor at explaining why. To bridge this gap, there are tools and research methods that complement analytics data. For example, observing live audiences visiting a site may provide quick insights that click stream data, which is a record of a user’s activity on the Internet, cannot provide. Free and low-cost tools, such as iPerceptions (http://www.iperceptions.com) or FluidSurveys (http://www.fluidsurveys.com), can collect rich qualitative data from audiences at the time they access the site. Such point-of-use survey tools are particularly valuable because, unlike interviews or focus groups, they nearly eliminate recall bias.
7. Favor trends over absolute numbers
Given the complex and dynamic nature of the Web, data from analytics tools are, unavoidably, imperfect. Trends are more significant than absolute numbers. Additionally, contextual knowledge is vital for understanding and explaining data. For example, time of year can help to explain drops in traffic, such as during holiday periods, and spikes during global or local campaigns and events related to a site.
While collecting and reporting nuanced Web usage statistics is increasingly easy, making sense of and taking action based on available data remains challenging and requires significant time, skill, and effort.
Whether an organization is new or experienced in collecting Web statistics, the key to successfully using Web analytics lies in identifying and focusing on key performance indicators that clearly reflect the core objectives of your products and services, and which can indicate both reach and usefulness among intended audiences.

86 Guide to Monitoring and Evaluating Knowledge Management in Global Health Programs
Success Story
Photoshare, a product of the Knowledge for Health (K4Health) project, is a unique editorial photography collection that helps international nonprofit organizations communicate about health and development issues. Its database contains more than 20,000 captioned images related to global health. It depends entirely on the generosity of people who freely share their photos with public health professionals and organizations.
After more than seven years of success and increasing interest, the Photoshare website needed updating to keep pace with audience demand and ever-changing Web technology. To better serve Photoshare’s growing community of users more efficiently, K4Health sought to improve key elements of the audience experience and to streamline manual processes that occupied substantial staff time.
With the support of USAID, the K4Health team began upgrading the Photoshare website in March 2011 after an online survey to measure audience satisfaction, card-sorting sessions to gather feedback on possible redesign (card-sorting is a user-centered design method that helps determine how concepts and content should be organized), and meeting with key stakeholders to solicit feedback on proposed changes.
Informed by the audience input and Web traffic data, K4Health prioritized changes and completed its first phase of upgrades in September 2011. These site enhancements built on Photoshare’s existing ability to report or document which images have been requested, site updates that improved the order checkout process, search functionality, filtering, layout and design, and file upload features.
By tracking key performance indicators using Web analytics, K4Health has been able to document clear, measurable results following the first phase of upgrades to the Photoshare website. Compared with a similar period in the previous year, in a 3-month interval Photoshare audiences spent an average of 35% more time on the website and contributed 45% more images. As a result of longer visits and a larger collection of photographs, K4Health fulfilled 60% more orders following the site changes.
Between 2008 and 2012, Photoshare has provided audiences with more than 40,000 images and has expanded the database by over 13,000 images. By using Web analytics to monitor and evaluate site traffic and use of the service, K4Health can continue to demonstrate the collection’s value and the impact of photography in global efforts to improve health and save lives.
Additional resources
Clifton, B. (2012). AdvancedwebmetricswithGoogleanalytics. Indianapolis: John Wiley.
Kaushik, A. Occam’sRazorbyAvinashKaushik. Retrieved from http://www.kaushik.net/avinash/, 2013.
Kaushik, A. (2010). Webanalytics2.0:Theartof onlineaccountability&scienceof customercentricity. Indianapolis, Indiana: Wiley.
87APPENDICES
Appendix 4
Communities of Practice: Monitoring and Evaluation
KavithaNallathambiandAngelaNash-Mercado
This section describes tools and resources for monitoring and evaluating communities of practice (CoPs). Examples of indicators and case studies illustrate how some organizations track data related to CoPs.
The rising popularity of CoPs in global health raises the need to develop new and innovative methods to monitor and evaluate their outputs and outcomes. The evaluation approach should: objectively document a community’s development; understand and identify over- and under-performing parts of the community; assess a community’s effectiveness as a knowledge sharing tool; compare it with and learn from other communities; identify lessons learned to improve CoP performance; and learn how to meet the needs of different types of participants and sustain the existence of a CoP (Meessen and Bertone 2012; U.S. Department of Education 2011; Wenger et al. 2002).
Challenges with evaluating CoPs include capturing quantitative and qualitative outcomes and determining impact. There is no universally accepted set of standards for evaluating the activities and results of CoPs. Another challenge is choosing indicators or metrics appropriate for the CoP being evaluated. Defining success and expectations is an important aspect of the evaluation process. CoP organizers need to decide on indicators at the outset. Indicators should reflect both the specific purpose of the CoP as well as the community’s style of engagement (U.S. Department of Education 2011).
While challenges persist, there are a number of tools that global health CoP managers can consider when measuring the success of their communities (Meessen and Bertone 2012; Robertson 2003; Web2fordev 2007):
• Website statistics• Content analysis and document reviews (using coding, Strengths, Weaknesses, Opportunities
and Threats [SWOT] analysis, and summaries)• Surveys (questionnaires)• Interviews (structured and semi-structured)• Peer group or focus group discussions• Participant observation• Kudos file, or compliments file• Audience rankings• Expert evaluation• Social network analysis• Success stories and case studies• Usability testing

88 Guide to Monitoring and Evaluating Knowledge Management in Global Health Programs
Indicators that CoP managers and evaluators can employ are provided in the table below.
Website indicators Outputs Outcomes
• Number of registered participants
• Number of unique visitors
• Number of contributions (e.g., number of topical threads, postings, video uploads)
• Average number of replies per new topic
• Percentage of the entire community are active contributors
• Activity per member (e.g., member contributions, sharing of documents)
• Countries represented
• Pageviews
• Bounce rates
• No-response rate
• Average number of friends/colleagues in member profiles
• Initial distribution
• Secondary distribution
• Referrals
• Audience satisfaction
• Audience perception of quality
• Number of collaborations facilitated
• Evidence-based information contributes to policy and increases resources for health
• Evidence-based best practices adopted
• Participant access facilitated
• Availability of and access to information improved
• Sharing of knowledge and experience increased
• “Reinventing the wheel” reduced
• Innovation enhanced (e.g., number of new strategic initiatives)
Sources: Avila et al. 2011; Hoss and Schlussel 2009; McDermott 2001; U.S. Department of Education 2011

89APPENDICES
Case study
A number of organizations and authors are embarking on new and innovative approaches to develop conceptual frameworks and metrics to monitor and evaluate CoPs.
UNICEF Communities
UNICEF Communities started in 2008 to connect and collaborate with groups at the global, regional, and country levels. Members make use of Web 2.0 technologies and social networking, including blogs, discussion forums, document and photo libraries, and online wiki spaces to share knowledge. The project consists of more than 25 groups, involving over 2400 people from UN agencies, multilateral organizations, and research institutions. Communities include those focused on HIV/AIDS, education, policy advocacy, knowledge management, social and economic policy, and gender equality.
UNICEF conducted a KM assessment to identify a simple and sustainable way to scale up the communities model to fit the global needs of staff and partners; define specific measurements of return on investment in communities; create an effective model for collaboration using appropriate technology; and collect stories to illustrate what works and identify key actions to improve.
To evaluate the community, community managers defined specific leadership roles to maximize and measure communities’ impact; developed Community Booths to visualize the progress of 10 different groups; created Community Case Clinics to identify areas of success and needs for improvement through collective feedback by the groups, including sharing relevant stories; pilot-tested multiple online spaces to enable staff and partners to lead their groups effectively; developed a simple model for an online survey to help gauge how well communities meet the needs of their members; and pilot-tested the survey.
Important lessons learned and actions planned included making the platform available to staff and partners in real time and simplifying its use by improving skills in writing for the Web and social networking, producing a Web-enabled guide for engaging communities and networks, and refining and simplifying the current platform to make it more user-friendly. UNICEF also held a Global Leadership Workshop with Etienne Wenger and Beverly Trayner, experts in the CoP field. The workshop demonstrated to the importance of training leaders to identify sources of knowledge and expertise, attract external members, actively engage them to collaborate, build and sustain membership, and measure impact. In May 2011, Wenger led the team in a follow-up workshop looking at measuring the value of and making the business case for communities of practice, focusing on the real-time effectiveness of the community model and return on investment. (http://kmonadollaraday.wordpress.com/2011/05/05/demonstrating-value-in-communities-of-practice/)
For the complete story and other cases, visit http://kdid.org/kmic/unicef-communities.
Future directions
Evaluation of CoPs in global health and development has evolved significantly in the past few years. However, more work remains to be done. First, the global health community needs to agree on a universal set of standards to evaluate CoPs. Second, online surveys and other tools currently
90 Guide to Monitoring and Evaluating Knowledge Management in Global Health Programs
assess only a subset of participants. New methods for understanding the opinions and behavior of non-respondents need to be developed. Third, while a number of authors have discussed return on investment, a clear methodology relevant to global health for calculating this measure needs still to be formulated. Fourth, many CoPs are increasingly blending online activities with face-to-face activities, which presents new opportunities for measurement while also necessitating measurement of blended activities.
Also, the global health community needs to invest more time and resources in narrative development and capturing compelling CoP success stories (UNICEF 2011). For example, practitioners in developing countries should be empowered and encouraged to publish programmatic stories online (UNICEF 2011). Finally, organizations and networks should consider investing more M&E resources into measuring the outcome of CoPs.
Additional resources
Assessingperformanceof communitiesof practiceinhealthpolicy:aconceptualframework(Meessen & Bertone 2012). http://www.abdn.ac.uk/femhealth/documents/CoP_assessment_framework2012.pdf
This assessment proposes a novel conceptual framework for assessing CoPs in health policy, based on a literature scoping review.
Communities for public health. Resource kit. Centers for Disease Control and Prevention.http://www.cdc.gov/phcommunities/resourcekit/evaluate/start_evaluation.html
The CDC’s evaluation framework is a concise yet thorough approach that can be easily understood and applied. The framework emphasizes six logical steps that can be used as a starting point for CoP evaluation: engage stakeholders, describe the community, focus the evaluation design, gather credible evidence, justify conclusions, ensure use, and share lessons learned. The resource kit includes a template for SMART objectives and evaluation interviews.
KMImpactChallenge.http://kdid.org/kmic
The KM Impact Challenge was designed to initiate a dialogue and a process of shared learning about KM approaches and tools. It has served as a springboard for increased peer-networking and collaborative action. Its website showcases short case studies from practitioners around the world on experiences, successes, and challenges in assessing KM activities, including CoPs.
Promotingandassessingvaluecreationincommunitiesandnetworks:aconceptualframework(Wenger et al. 2011). http://www.open.ou.nl/rslmlt/Wenger_Trayner_DeLaat_Value_creation.pdf
This guide includes a conceptual framework as well as practical methods and tools. The paper outlines cycles in which communities create value. The framework includes indicators for which data could be collected, and a process for integrating personal and collective experience into a meaningful account through value-creation stories.
91APPENDICES
References
Avila, M., Nallathambi, K., Richey, C., & Mwaikambo, L. (2011). Six years of lesson learned in monitoring and evaluating online discussion forums. KnowledgeManagement&E-Learning:AnInternational Journal, 3(4).
McDermott, R. (2001). Measuring the impact of communities: how to draw meaning from measures of communities of practice. KnowledgeManagementReview,5(2), 26-29.
Meessen, B. & Bertone, (2012) M.P.Assessingperformanceof communitiesof practiceinhealthpolicy:aconceptual framework. Department of Public Health, Institute of Tropical Medicine (Antwerp).
Hoss, R. and Schlussel, A. Howdoyoumeasuretheknowledgemanagement(KM)maturityof yourorganization?Metricsthatassessanorganization’sKMstate. Draft. United States Army. April 20, 2009. http://www.digitalgovernment.com/media/Downloads/asset_upload_file66_2654.pdf
Robertson, J. Metrics for knowledge management and content management. KM Column. Broadway, Australia: Step Two Designs. http://www.steptwo.com.au/papers/kmc_metrics/index.html.
UNICEF. UNICEF Communities. KM Impact Challenge. January 22, 2013. http://kdid.org/kmic/unicef-communities
U.S. Department of Education. (2013). Connectandinspire:onlinecommunitiesof practiceineducation. U.S. Department of Education, Office of Educational Technology.
Web2fordev. Monitoring and Impact Evaluation Working Group. 2007. http://wiki.km4dev.org/wiki/index.php/Monitoring_and_Impact_Evaluation_Working_Group-_Web2fordev.
Wenger, E., Trayner, B., and de Laat, M. (2011). Promoting and assessing value creation in communities and networks:aconceptualframework. Open Universitelt.
92 Guide to Monitoring and Evaluating Knowledge Management in Global Health Programs
Appendix 5
Social Media: Monitoring and Evaluation
Saori Ohkubo
This section describes the purpose of social media in the global health and development context, and suggests approaches for monitoring and evaluating the effect of social media activities.
The term “social media” refers to online communities and networks where people use a conversation style to create and share information, knowledge, ideas, and opinions (Stern 2010). Social media are multidimensional, allowing organizations to communicate with their intended clients, clients to communicate with organizations, and individuals to communicate with one another (Thackeray 2012).
Social media technologies take many different forms; they can be broadly categorized as follows (CDC 2010; Kaplan and Haenlein 2010; Mangold 2009):
• Social networking sites (e.g., Facebook, LinkedIn)
• Blogs and microblogs (e.g., Twitter)
• Image sharing (e.g., Flickr)
• Video sharing (e.g., YouTube)
• Collaborative projects (e.g., Wikipedia)
• Social bookmarking sites (e.g., Pinterest)
• Virtual social worlds (e.g., Second Life)
• Online/virtual forums or message boards (e.g., phpBB)
In the global health and development field, social media has become a key channel to reach and engage global audiences, including individuals in low-income countries. Many health and development organizations are now using social media tools for multiple purposes and in innovative ways to assist people with few or limited resources.
Examples of how organizations are using social media tools are (CDC 2010; O’Neille 2012):
• To ensure the timely dissemination of health messages
• To enhance engagement and communication among related communities
• To give individuals opportunities to contribute experiential knowledge and personal insights to discussions
• To increase access to credible, science-based health information
93APPENDICES
• To exhibit intellectual leadership and reputation through postings and commentary
Using social media is not a standalone tactic. It should be part of a larger communication strategy, and therefore, overarching communication goals should be considered when developing social media activities and selecting metrics (CDC 2010). Furthermore, organizations should select indicators that can be linked to their ultimate program goals. The overall and thorough integration of social media into the large program/organization elevate social media from just a tool to an integral part of the particular intervention (Shore 2013).
A number of approaches and tools can be used to monitor, evaluate, and improve social media efforts.
Measuring reach, content mobility, and engagement
Social media platforms may offer tools or features (e.g. Facebook’s Page Insights) that enable managers to monitor and evaluate social media use, including reach, content mobility, and engagement. Reach, often a good starting point, can be reported as a count of participants. To supplement reach data, content mobility measures how frequently content is shared to improve brand awareness (Smith 2013). In addition to content sharing, it is useful to capture instances when people interact further with social media messages or content by adding or sharing their own personal reflections and opinions (Gordon 2003).
Broad indicators and specific examples include:
• Social media reach
o Facebook page likes
o Twitter followers
o YouTube channel subscribers
• Content mobility
o Facebook post likes and shares
o Tweets directly from content
o Retweets and mentions
o YouTube video likes, shares, and embeds
o Pinterest repins
o LinkedIn post likes and shares
• User engagement
o Facebook shares that include personal messages/comments from users
o Twitter retweets that include personal messages/comments from users
o Comments or contributions in Facebook, blogs, YouTube, etc.

94 Guide to Monitoring and Evaluating Knowledge Management in Global Health Programs
Tracking website traffic driven by social media
One benefit of social media is that it can drive traffic to a website and to Web-based KM products, converting casual visitors into engaged users. Web analytics tools (e.g., Google Analytics, WebTrends) can measure social media campaigns and promotion efforts, providing insights such as geographic locations where highly engaged participants are found (Jackson 2013; Smith 2013), if they complete tasks that you want them to undertake on your website (e.g., downloading key publications), or how users referred from social media channels compare with other important segments of your site’s traffic.
To monitor and manage social media, additional tools (e.g., Hootsuite, Sprout Social) offer various features to organize and present social media data. These tools include features such as custom branding, data exporting, data visualization, and statistical analysis.
Indicators to track the amount and pattern of Web traffic from social media include:
• Social web traffic: Total number of click-throughs or visits to the organization’s website from each social media source. These can be stratified by type and location.
• Social conversions: Set up and monitor Web analytics data to determine if social media visitors have converted into returning Web users.
Analyzing conversations and sentiment
Using automated content analysis programs can be difficult or even impossible, given that social media content often includes a great deal of slang and abbreviations. Social media content analysis typically requires human coding.
Although content analysis of social media is time-consuming, there are various reasons that it is worthwhile, including the opportunity to identify trends using content voluntarily generated by users (Paariberg 2012; Stephens 2012). Monitoring comments and discussions on social media is a valuable way to better understand current interests, knowledge levels, and potential misunderstandings or myths about health topics as well as the actions that people take in response to health messages or information shared among audience members (CDC 2010).
It is helpful to track the sentiment of conversations and mentions over time, perhaps monthly, to determine if there is a change in the numbers of positive and negative mentions, to identify sources of positive, negative and neutral sentiment, and to identify popular topics (Smith 2013; Altimeter Group 2011).
Monitoring of social media can offer insights into the performance of campaigns and promotion efforts. Further, findings can help with tailoring communication to specific groups to help spread key health messages or information and to influence health behavior and decision-making (Altimeter Group 2011; CDC 2010).
95APPENDICES
References
Altimeter Group. (2011). Aframeworkforsocialsnalytics. Retrieved from http://www.altimetergroup.com/research/reports/a-framework-for-social-analytics
Centers for Disease Control and Prevention. (2010). Thehealthcommunicator’ssocialmediatoolkit. Retrieved from http://www.cdc.gov/socialmedia/tools/guidelines/pdf/socialmediatoolkit_bm.pdf
Gordon, J. (2011). See,say,feeldo-socialmediametricsthatmatter. Retrieved from http://www.fenton.com/new/wp-content/uploads/2013/04/social-media-metrics-guide.pdf
Kaplan, A. M., & Haenlein, M. (2010). Users of the world, unite! The challenges and opportunities of Social Media. Businesshorizons, 53(1), 59-68.
Mangold, W. G., & Faulds, D. J. (2009). Social media: The new hybrid element of the promotion mix. Businesshorizons, 52(4), 357-365.
Neilsen, J. (2000, March 19). Whyyouonlyneedtotestwith5users. Retrieved from http://www.nngroup.com/articles/why-you-only-need-to-test-with-5-users/
O’Neille, M. (2013, February 22). Advancingdevelopmentthroughsocialmedia. Retrieved from http://blog.usaid.gov/2013/02/advancing-development-through-social-media/
Paariberg, B. (2012, July 19). Whyissocialmediacontentanalysissodifficult?Linguisticdetectivesprovideaclue. Retrieved from http://kdpaine.blogs.com/themeasurementstandard/2012/07/why-is-social-media-content-analysis-so-difficult-linguistic-detectives-provide-a-clue.html
Shore, R. (2013, August 30). Beyondoutputs:evaluatingsocialmediaforoutcomes. Retrieved from http://www.k4health.org/blog/post/beyond-outputs-evaluating-social-media-outcomes
Smith, B. (2013, April 27). SocialmediaanalyticsandROItracking. Retrieved from http://beingyourbrand.com/2013/04/27/social-media-analytics-roi-tracking/
Sterne, J. (2010). Socialmediametrics:howtomeasureandoptimizeyourmarketinginvestment. Hoboken, NJ: Wiley
Stephens, T. (2012, May 5). Researchandsocialmedia:why&howtodoacontentanalysis. Retrieved from http://intrepidstrategic.com/blog/research-and-social-media-why-how-to-do-a-content-analysis/
Thackeray, R., Neiger, B. L., Smith, A. K., & Van Wagenen, S. B. (2012). Adoption and use of social media among public health departments. BMCpublichealth, 12(1), 242.
96 Guide to Monitoring and Evaluating Knowledge Management in Global Health Programs
Appendix 6
Usability Assessment: Attributes and Methods
Ruwaida Salem
This section describes dimensions of usability assessment in general and methods for evaluating the usability of a website or mobile application. The methods detailed include heuristic evaluation, card sorting, and usability testing.
“Usability” refers to how well users can learn and use a product or system to achieve their goals, as well as to how satisfied they are with that process (Nielsen 1993). The product or system can be a website, software application, mobile technology, or, indeed, any other user-operated device.
Usability is multidimensional, usually described by the following five attributes (Nielsen 1993):
• Learnability. The system should be easy to learn, so that users can rapidly start getting some work done with the system.
• Efficiency. The system should be efficient to use, so that once users have learned the system, a high level of productivity is possible.
• Memorability. The system should be easy to remember, so that the casual user can return to the system, after a period of not using it, without having to learn it all over again.
• Errors. The system should have a low error rate, so that users make few errors while using it. If they do make errors, they should be able to recover easily from them.
• Satisfaction. The system should be pleasant to use, so that users are subjectively satisfied when using it.
Designing an optimal user interface starts with understanding the intended users, including their jobs, tasks, goals, and information needs. It is also important to understand their knowledge and experience with using computers and performing similar tasks and their attitudes toward learning new software and interfaces. This information will help with designing and developing an interface tailored to meeting the intended users’ needs with ease.
A number of usability assessment methods can be employed throughout the process of designing, evaluating, and refining a user interface. Commonly used methods include heuristic evaluation, card sorting, and usability testing.
Evaluate interface compliance and consistency—heuristic evaluation
In a heuristic evaluation a small group of evaluators—usually experts in this type of evaluation, not representative users—assesses how well an interface complies with recognized usability heuristics,

97APPENDICES
or principles. The most commonly used heuristics in the field of interface design are “Nielsen’s 10 Usability Heuristics,” which include such principles as using language and concepts that are familiar to audiences and being consistent across the interface (Nielsen 1985). Although heuristic evaluation provides quick and relatively inexpensive feedback about an interface, it requires a certain level of knowledge and experience with the principles and how to apply them correctly. It is often useful to conduct a heuristic evaluation at the early stages of design to identify major usability issues and then to follow up with usability testing with representative users to identify any remaining issues.
Identify and organize interface labels—card sort
In a card sort exercise, representative users organize information, such as website content, into logical categories that they then label. The results can be used to build and label the structure of the user interface, such as the navigation menu of a website.
Card sorting can be conducted in a face-to-face meeting with physical pieces of paper or remotely with an online card-sorting tool. Two popular online card-sorting tools that are free to use with up to 10 participants are WebSort and OptimalSort. They also offer options to pay for a single study or on a subscription basis.
Card sorts can be open or closed. In an open card sort, participants are asked to organize cards into groups that make sense to them and then to name each group. In a closed card sort, participants are asked to sort items into predefined categories.
Assess audience experience of a website or mobile application—usability testing
Usability testing involves asking representative users to complete typical tasks or find information on an interface, such as a website or mobile application, while observers watch, listen, and take notes. The goal is to observe how well the intended audience can use the interface. The assessment focuses on users’ behavior more than on their attitudes. Inexpensive software, such as Loop (www.loop11.com), makes it possible to conduct remote usability testing; the software presents tasks to participants and tracks their interaction with the site, including navigation path, page scrolling, and click location. Remote usability testing also can be accomplished by using web conferencing/online meeting tools, such as GoToMeeting (http://www.gotomeeting.com/) and Adobe Connect (http://www.adobe.com/products/adobeconnect.html).
Common indicators measured in usability testing include:
• Effectiveness: Task completion success rates (percentage of participants who complete a task successfully)
• Efficiency: Time and number of clicks required to complete the task
• Error frequency and severity: How often do testers make errors? How serious are the errors? How do they recover from the errors?
• Satisfaction: Subjective evaluations by the testers
98 Guide to Monitoring and Evaluating Knowledge Management in Global Health Programs
Some key points for test facilitators to keep in mind are to put the test participants at ease, assuring them that it is the site that is being tested, not them. Participants should know that there are no wrong moves during the test session; if they cannot complete a task, then it is considered a problem with the interface and not with the participant. Also, test facilitators should encourage participants to “think aloud” during the testing session—that is, to verbalize their thoughts as they interact with the interface. This helps the test facilitator to understand what the participant is thinking while watching the participant’s interactions with the interface. It often helps the facilitator understand why audiences succeed with certain tasks and find others difficult.
The purpose of usability testing is to uncover areas on the site or application that make audiences struggle and to suggest improvements. A key principle in usability testing is to test early and test often. In fact, it is recommended to test prototypes or draft versions of the interface (even paper drawings) before the expensive coding begins.
Experts recommend testing with no more than five rounds of testing; this is usually enough to uncover 85% of usability problems, including the most significant (Nielsen 2000). The first set of testers will provide interface developers with many insights. The second group usually uncovers issues similar to those seen by the first audience but might also discover some new issues. With more and more rounds, the usability testing yields fewer and fewer new observations.
Once you have identified the major problems, and designers and developers have fixed them, another small-scale usability test can evaluate whether the revisions have solved the problems. Such iterative testing and revision is helpful also because it allow the usability testing team to probe deeper into potential problems in subsequent tests.
99APPENDICES
Additional resources
A List Apart / Audience Sciencehttp://www.alistapart.com/topics/audiencescience/
Nielsen Norman Group (NN/g)http://www.nngroup.com/
Usability.govhttp://www.usability.gov/
Usability Nethttp://www.usabilitynet.org/home.htm
UX Mattershttp://www.uxmatters.com/
Albert, B., Tullis, T., & Tedesco, D. (2010). Beyondtheusabilitylab:Conductinglarge-scaleonlineaudienceexperience studies. Burlington, MA: Morgan Kaufmann.
Schumacher, R.M. (ed). (2010). Handbook of global audience research. Burlington, MA: Morgan Kaufmann.
References
Nielsen, J. (2000). Whyyouonlyneedtotestwith5audiences. Available from: http://www.nngroup.com/articles/why-you-only-need-to-test-with-5-users/
Nielsen, J. (1993). Usabilityengineering. San Diego, CA: Morgan Kaufmann.
Nielsen, J. (1985). 10 Usability heuristics for audience interface design. JakobNielsen’sAlertbox. Available from: http://www.nngroup.com/articles/ten-usability-heuristics/
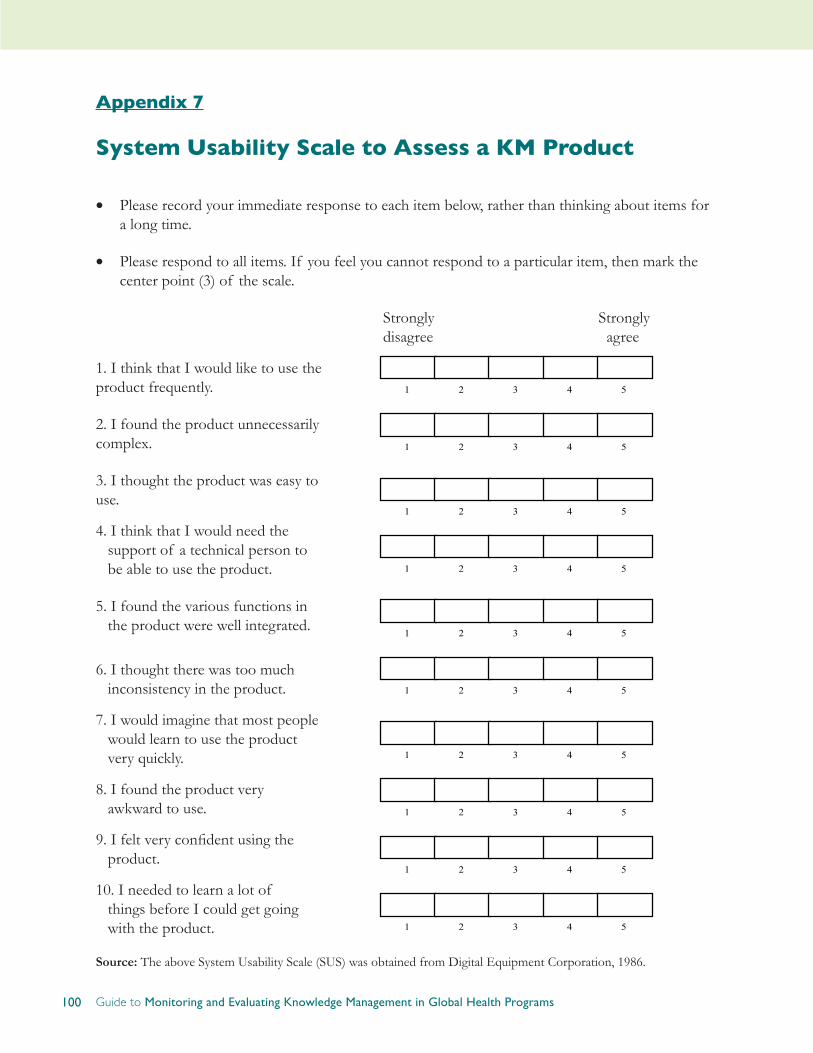
100 Guide to Monitoring and Evaluating Knowledge Management in Global Health Programs
Appendix 7
System Usability Scale to Assess a KM Product
• Please record your immediate response to each item below, rather than thinking about items for a long time.
• Please respond to all items. If you feel you cannot respond to a particular item, then mark the center point (3) of the scale.
Strongly Strongly disagree agree
1. I think that I would like to use the product frequently.
2. I found the product unnecessarily complex.
3. I thought the product was easy to use.
4. I think that I would need the support of a technical person to be able to use the product.
5. I found the various functions in the product were well integrated.
6. I thought there was too much inconsistency in the product.
7. I would imagine that most people would learn to use the product very quickly.
8. I found the product very awkward to use.
9. I felt very confident using the product.
10. I needed to learn a lot of things before I could get going with the product.
1 2 3 4 5
1 2 3 4 5
1 2 3 4 5
1 2 3 4 5
1 2 3 4 5
1 2 3 4 5
1 2 3 4 5
1 2 3 4 5
1 2 3 4 5
1 2 3 4 5
Source: The above System Usability Scale (SUS) was obtained from Digital Equipment Corporation, 1986.

101APPENDICES
Appendix 8
Usability Test Task Example
TASK 1: BACK TO MAIN MENU
Please show me how you would go back to the main menu of the mobile app.*
Pathway(s)
(Circle chosen pathway or write alternate in Notes column)
Time to Completion
Success
(Circle your assessment)
Notes/Observations
(Note why was the user successful or not successful, e.g., wrong pathways, confusing page layout, navigation issues, terminology)
● Tap the phone’s menu button > Click on Home
● Tap the green home bar at the top of the screen
Time Started:
0
Not completed
1
Completed with difficulty or help
2
Easily completed
Time Completed:
Total Time to Completion:
(Time Completed – Time Started)
Thanks. This was really helpful.
*The question can be adapted for web-based or other electronic products.
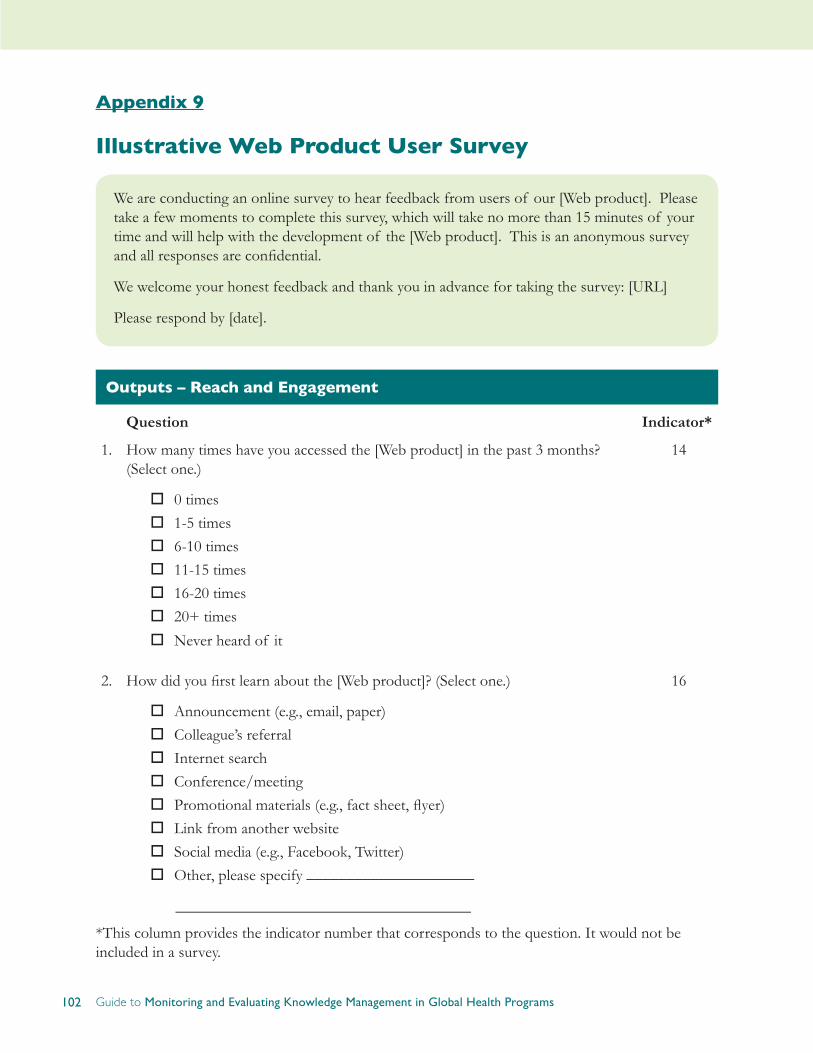
102 Guide to Monitoring and Evaluating Knowledge Management in Global Health Programs
Appendix 9
Illustrative Web Product User Survey
We are conducting an online survey to hear feedback from users of our [Web product]. Please take a few moments to complete this survey, which will take no more than 15 minutes of your time and will help with the development of the [Web product]. This is an anonymous survey and all responses are confidential.
We welcome your honest feedback and thank you in advance for taking the survey: [URL]
Please respond by [date].
Outputs – Reach and Engagement
Question Indicator*
1. How many times have you accessed the [Web product] in the past 3 months? (Select one.)
o0 timeso1-5 timeso6-10 timeso11-15 timeso16-20 timeso20+ times
oNever heard of it
14
2. How did you first learn about the [Web product]? (Select one.)
oAnnouncement (e.g., email, paper)oColleague’s referraloInternet searchoConference/meetingoPromotional materials (e.g., fact sheet, flyer) oLink from another websiteoSocial media (e.g., Facebook, Twitter)oOther, please specify _____________________
16
_____________________________________
*This column provides the indicator number that corresponds to the question. It would not be included in a survey.

103APPENDICES
Outputs – Usefulness
Question Indicator
Think of the last time you visited the [Web product]. What types of information resources were you looking for? (Select all that apply.)
o Research/journal articles
o Reviews/syntheses
o Fact sheets/policy briefs
o Implementation guides/handbooks
o Job aids (e.g., wall charts, flipcharts, checklists, memory cue cards)
o Communication materials
o Visual media (e.g., illustrations, photos, graphics, charts)
o Training curricula
o Other, please specify _____________
24

104 Guide to Monitoring and Evaluating Knowledge Management in Global Health Programs
Question Indicator
4. Please rate the following statements about the [Web product] layout and design:
(1-Strongly disagree, 2- Disagree, 3-Not sure, 4-Agree, 5-Strongly agree)
1 2 3 4 5The home page makes me want to explore it further. ¡ ¡ ¡ ¡ ¡The layout and design is clear and visually appealing. ¡ ¡ ¡ ¡ ¡It is easy to navigate through the different sections. ¡ ¡ ¡ ¡ ¡I am able to find the information I am looking for. ¡ ¡ ¡ ¡ ¡Screens/pages have too much information. ¡ ¡ ¡ ¡ ¡Screens/pages have too little information. ¡ ¡ ¡ ¡ ¡
It is as easy or easier to find the information I am looking for, compared to finding the same information in other online resources (e.g., database, website, etc.).
¡ ¡ ¡ ¡ ¡
It is as easy or easier to find the information I am looking for, compared to finding the same information in print resources (e.g., books, journals, etc.).
¡ ¡ ¡ ¡ ¡
26
5. Please rate the following statements about the [Web product] content:
(1-Strongly disagree, 2- Disagree, 3-Not sure, 4-Agree, 5-Strongly agree)
1 2 3 4 5The content is complete, offering comprehensive coverage of [global health topic]. ¡ ¡ ¡ ¡ ¡
The content is credible and trustworthy. ¡ ¡ ¡ ¡ ¡
The topics covered are relevant to my work. ¡ ¡ ¡ ¡ ¡
The information is of equal or higher quality than information on this topic I can find in other online resources (e.g., database, website, etc.)
¡ ¡ ¡ ¡ ¡
The information is of equal or higher quality than information on this topic I can find in print resources (e.g., books, journals, etc.).
¡ ¡ ¡ ¡ ¡
27

105APPENDICES
Question Indicator
6. To approximately how many colleagues or co-workers have you recommended the [Web product] or its resources? (Fill in the blank.)
_________colleagues
28
7. Please give a specific example of how and what you have shared with your colleagues. (Open-ended.)
28
8. Please indicate if you have adapted information from the [Web product] as follows. (Check all that apply.)
o I have translated information from English into a local language.
o I have adapted information to better fit the context I work in.
o I have adapted complex information to make it simpler to use.
o I have used content that I have adapted, or that has been adapted by others.
32, 33
9. Please give an example of how you have translated or adapted specific information from the [Web product] and used it in your work. (Open-ended.)
32, 33
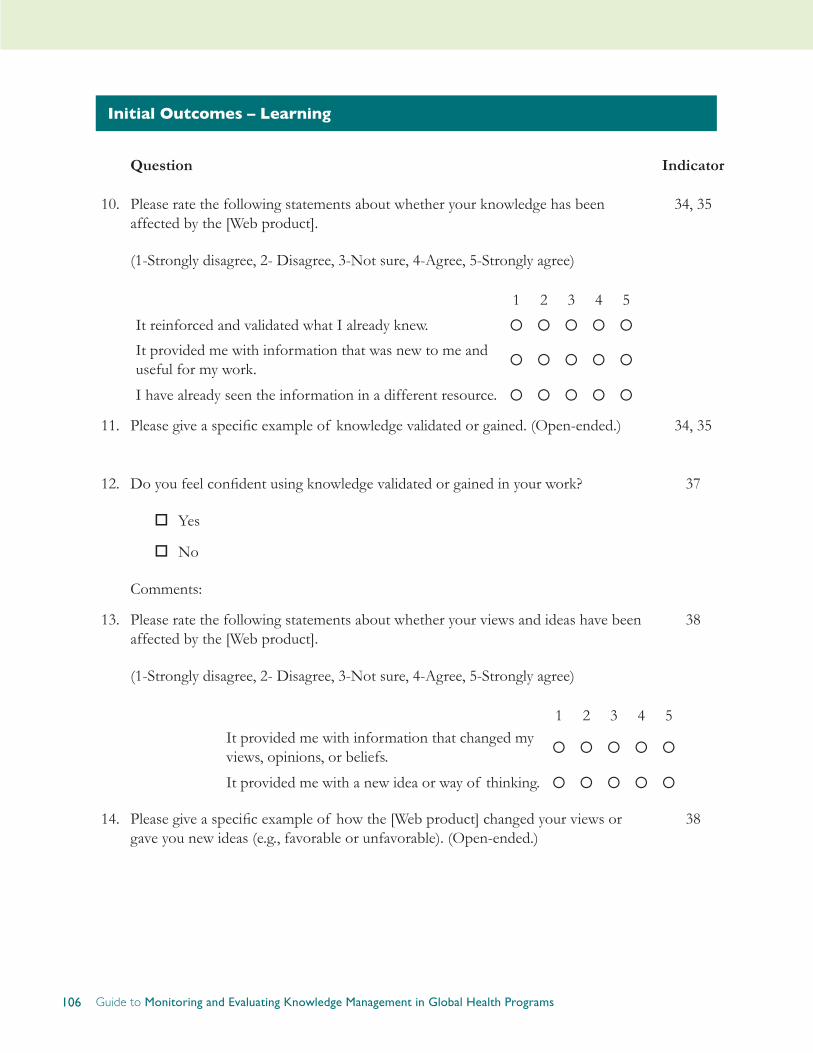
106 Guide to Monitoring and Evaluating Knowledge Management in Global Health Programs
Initial Outcomes – Learning
Question Indicator
10. Please rate the following statements about whether your knowledge has been affected by the [Web product].
(1-Strongly disagree, 2- Disagree, 3-Not sure, 4-Agree, 5-Strongly agree)
1 2 3 4 5
It reinforced and validated what I already knew. ¡ ¡ ¡ ¡ ¡
It provided me with information that was new to me and useful for my work. ¡ ¡ ¡ ¡ ¡
I have already seen the information in a different resource. ¡ ¡ ¡ ¡ ¡
34, 35
11. Please give a specific example of knowledge validated or gained. (Open-ended.) 34, 35
12. Do you feel confident using knowledge validated or gained in your work?
oYes
oNo
Comments:
37
13. Please rate the following statements about whether your views and ideas have been affected by the [Web product].
(1-Strongly disagree, 2- Disagree, 3-Not sure, 4-Agree, 5-Strongly agree)
1 2 3 4 5It provided me with information that changed my views, opinions, or beliefs. ¡ ¡ ¡ ¡ ¡
It provided me with a new idea or way of thinking. ¡ ¡ ¡ ¡ ¡
38
14. Please give a specific example of how the [Web product] changed your views or gave you new ideas (e.g., favorable or unfavorable). (Open-ended.)
38
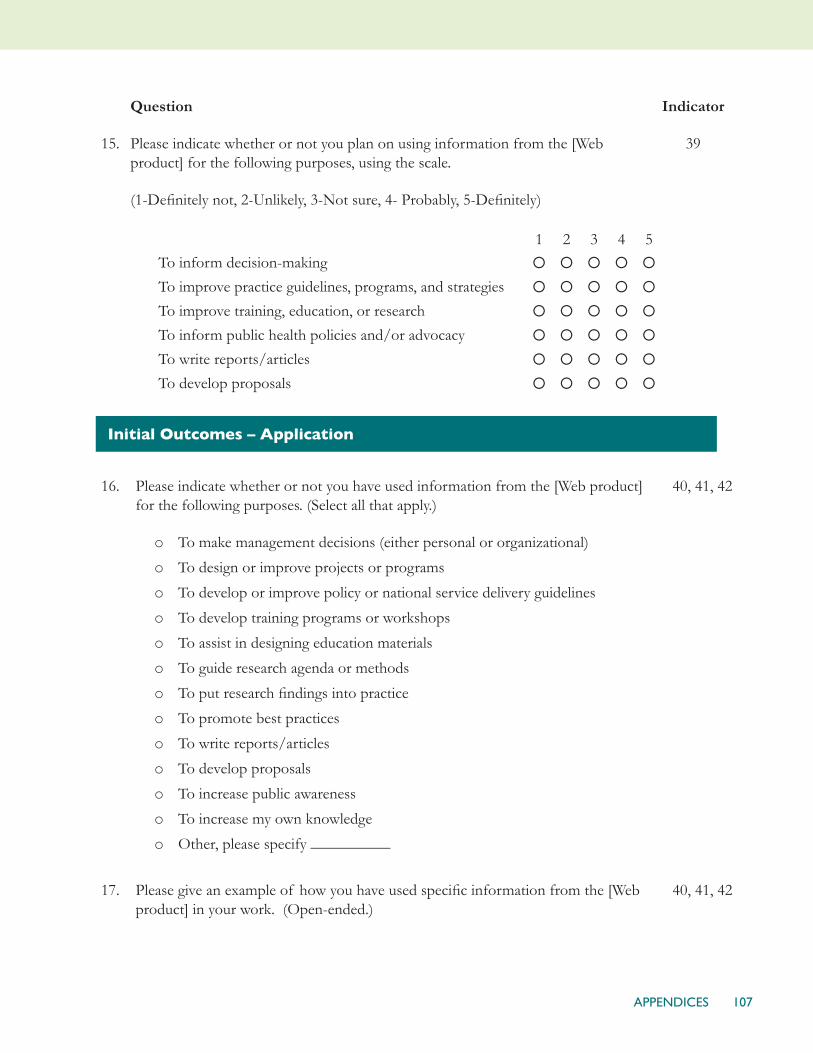
107APPENDICES
15.
Question
Please indicate whether or not you plan on using information from the [Web product] for the following purposes, using the scale.
(1-Definitely not, 2-Unlikely, 3-Not sure, 4- Probably, 5-Definitely)
1 2 3 4 5To inform decision-making ¡ ¡ ¡ ¡ ¡
To improve practice guidelines, programs, and strategies ¡ ¡ ¡ ¡ ¡
To improve training, education, or research ¡ ¡ ¡ ¡ ¡
To inform public health policies and/or advocacy ¡ ¡ ¡ ¡ ¡
To write reports/articles ¡ ¡ ¡ ¡ ¡
To develop proposals ¡ ¡ ¡ ¡ ¡
Indicator
39
Initial Outcomes – Application
16. Please indicate whether or not you have used information from the [Web product] for the following purposes. (Select all that apply.)
o To make management decisions (either personal or organizational)
o To design or improve projects or programs
o To develop or improve policy or national service delivery guidelines
o To develop training programs or workshops
o To assist in designing education materials
o To guide research agenda or methods
o To put research findings into practice
o To promote best practices
o To write reports/articles
o To develop proposals
o To increase public awareness
o To increase my own knowledge
o Other, please specify __________
40, 41, 42
17. Please give an example of how you have used specific information from the [Web product] in your work. (Open-ended.)
40, 41, 42

108 Guide to Monitoring and Evaluating Knowledge Management in Global Health Programs
Question Indicator
18. Please rate the following statements about performance areas affected as a result of using the [Web product]:
(1-Strongly disagree, 2- Disagree, 3-Not sure, 4-Agree, 5-Strongly agree)
1 2 3 4 5
Based on something I have learned in it, I have changed the way I perform my job. ¡ ¡ ¡ ¡ ¡
I have used information from it to improve my skills. ¡ ¡ ¡ ¡ ¡
It has helped me to be more competent and effective at my job. ¡ ¡ ¡ ¡ ¡
It has helped me to perform my job more efficiently. ¡ ¡ ¡ ¡ ¡
It has helped to improve the performance of my organization. ¡ ¡ ¡ ¡ ¡
40, 41, 42
19. Please give a specific example of how the [Web product] has improved your own performance or your organization’s performance. (Open-ended.)
40, 41, 42
Background Information
20. In what country do you work? (Drop-down list.)
21. Please select the category that best describes your function. (Select one.)
o Policy maker
o Program manager
o Technical advisor
o Service provider/clinician
o Researcher/evaluator
o Teacher/trainer
o Information and communication officer/knowledge management specialist
o Other, please specify: __________________________

109APPENDICES
22. Please select the category that best describes your organization/institution. (Select one.)
o Academic/research institution
o NGO/PVO (local or international/non-profit or for-profit)
o Government/ministry
o Donor agency (bilateral or multilateral)
o Private commercial sector medical/health organization
o Religious/faith-based organization
o News media
o Other, please specify ________________________
23. Are you:
o Male
o Female
Closing
24. If you could make one significant change to the [Web product], what would it be?
25. Do you have any additional comments?
Thank you very much for your time and valuable feedback. Your feedback will be used to guide the development, management, and improvement of the [Web product] in the future. Please feel free to contact [contact name / email address] anytime if you have any concerns or questions.
Source: This illustrative survey draws heavily from two online surveys developed and conducted by K4Health in 2013: K4Health Toolkit User Survey and K4Health Website and Web Products Survey.
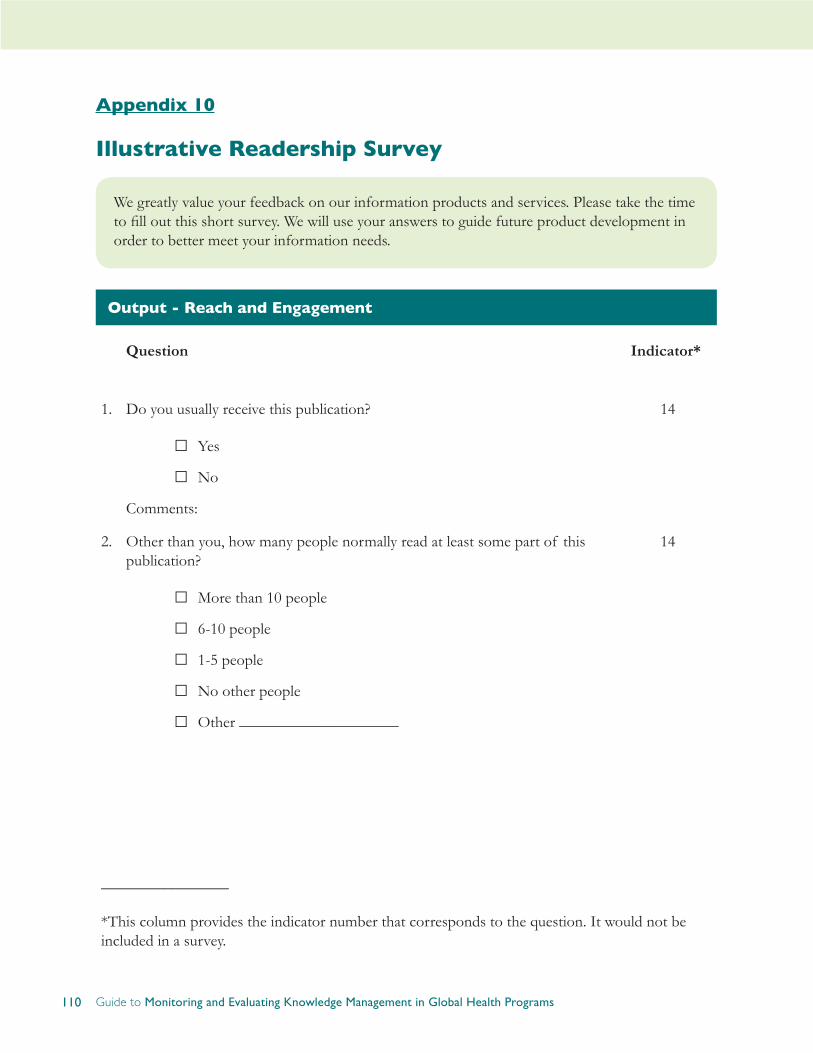
110 Guide to Monitoring and Evaluating Knowledge Management in Global Health Programs
Appendix 10
Illustrative Readership Survey
We greatly value your feedback on our information products and services. Please take the time to fill out this short survey. We will use your answers to guide future product development in order to better meet your information needs.
Output - Reach and Engagement
Question Indicator*
1. Do you usually receive this publication?
□Yes
□No
Comments:
14
2. Other than you, how many people normally read at least some part of this publication?
□More than 10 people
□ 6-10 people
□ 1-5 people
□No other people
□Other ____________________
14
________________
*This column provides the indicator number that corresponds to the question. It would not be included in a survey.
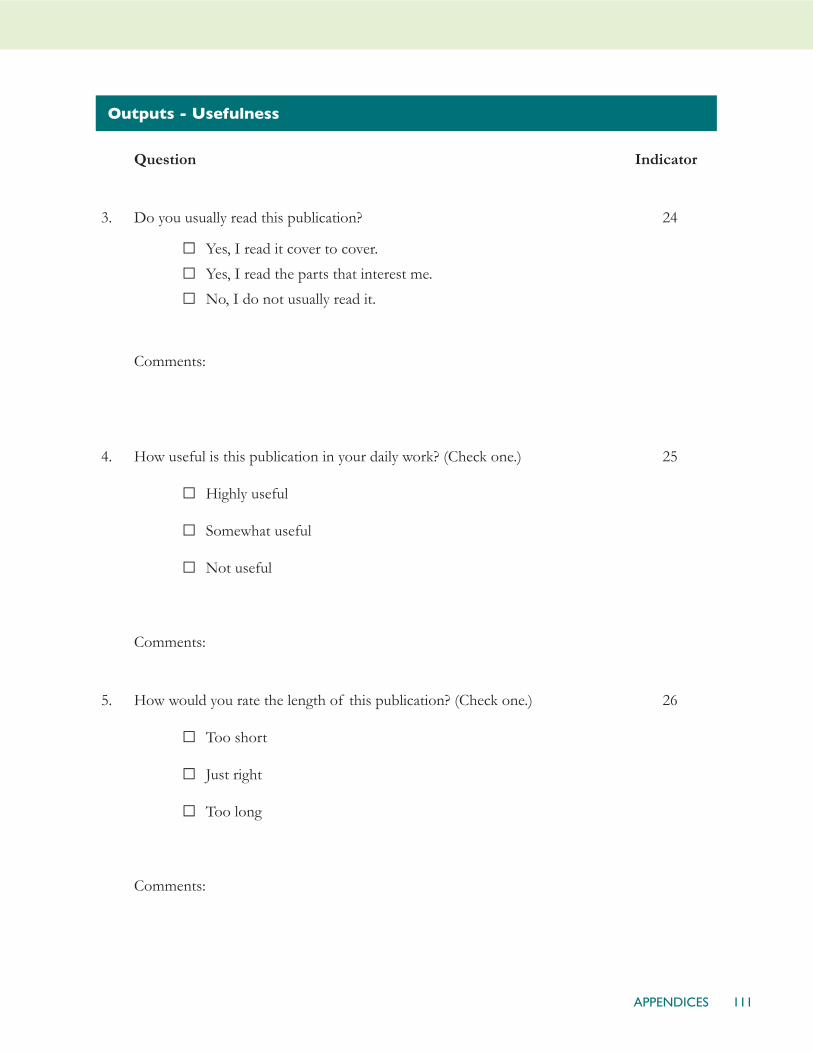
111APPENDICES
Outputs - Usefulness
Question Indicator
3. Do you usually read this publication?
□Yes, I read it cover to cover.
□Yes, I read the parts that interest me.
□No, I do not usually read it.
Comments:
24
4. How useful is this publication in your daily work? (Check one.)
□Highly useful
□ Somewhat useful
□Not useful
Comments:
25
5. How would you rate the length of this publication? (Check one.)
□Too short
□ Just right
□Too long
Comments:
26
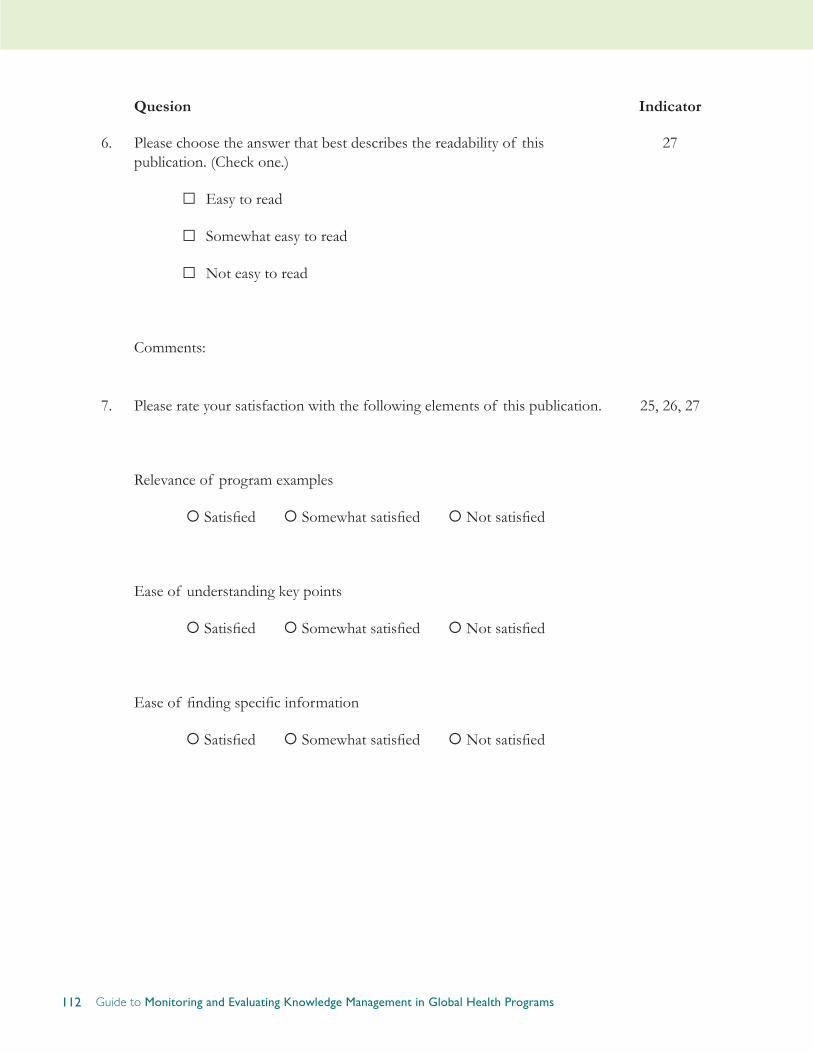
112 Guide to Monitoring and Evaluating Knowledge Management in Global Health Programs
Quesion Indicator
6. Please choose the answer that best describes the readability of this publication. (Check one.)
□Easy to read
□ Somewhat easy to read
□Not easy to read
Comments:
27
7. Please rate your satisfaction with the following elements of this publication.
Relevance of program examples
¡ Satisfied ¡ Somewhat satisfied ¡ Not satisfied
Ease of understanding key points
¡ Satisfied ¡ Somewhat satisfied ¡ Not satisfied
Ease of finding specific information
¡ Satisfied ¡ Somewhat satisfied ¡ Not satisfied
25, 26, 27

113APPENDICES
Quesion Indicator
8. How would you rate the coverage of topics in this publication? (Check one.)
□Too little
□ Just right
□Too much
Comments:
27
9. What suggestions do you have for making the content of this publication more useful and relevant to your work?
25, 26, 27
10. What other topics would you like to see covered in this publication? 27
11. Have you or do you intend to adapt this publication for a specific use?
□Yes, I have adapted this publication.
□Yes, I intend to adapt this publication.
□No
Please explain.
32
114 Guide to Monitoring and Evaluating Knowledge Management in Global Health Programs
Initial Outcomes - Learning
Question Indicator
12. Did you learn anything new from this publication?
□Yes
□No
Please explain.
34
13. Did the information contained in this publication change your mind about a specific issue?
□Yes
□No
Please explain.
38

115APPENDICES
Initial Outcomes - Application
Question Indicator
14. How often have you used this publication for the following purposes? (Check in all rows that apply.)
15. Has the information in this publication led to changes in policies or procedures or influenced the provision of health services?
□Yes
□No
Please explain.
16. Please give specific examples of how you (or your colleagues) have used this publication in your work and explain the results of that use (if known).
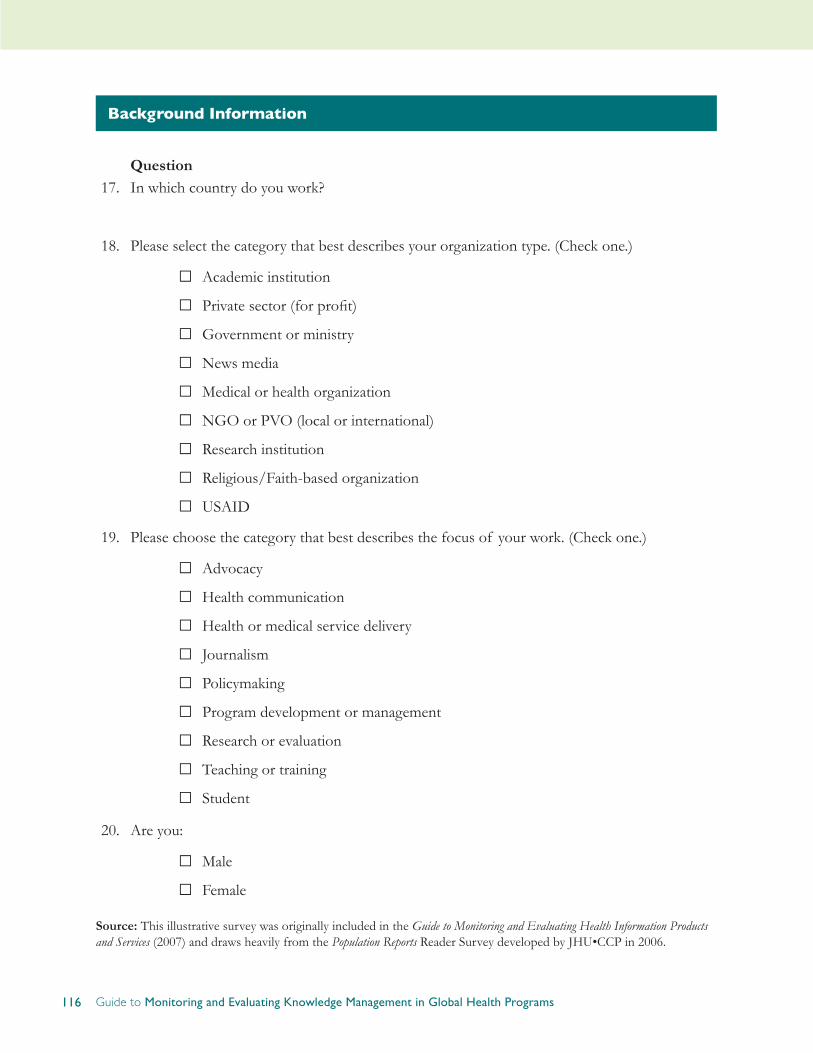
116 Guide to Monitoring and Evaluating Knowledge Management in Global Health Programs
Background Information
Question17. In which country do you work?
18. Please select the category that best describes your organization type. (Check one.)
□Academic institution
□ Private sector (for profit)
□Government or ministry
□News media
□Medical or health organization
□NGO or PVO (local or international)
□Research institution
□Religious/Faith-based organization
□USAID
19. Please choose the category that best describes the focus of your work. (Check one.)
□Advocacy
□Health communication
□Health or medical service delivery
□ Journalism
□ Policymaking
□ Program development or management
□Research or evaluation
□Teaching or training
□ Student
20. Are you:
□Male
□ Female
Source: This illustrative survey was originally included in the Guide to Monitoring and Evaluating Health Information Products and Services (2007) and draws heavily from the Population Reports Reader Survey developed by JHU•CCP in 2006.

117APPENDICES
Appendix 11
For Writers: Questions to Ask of an Outline
Developing a cogent publication requires keeping your purpose in mind. These nine questions can help you check that your publication is on track right from the concept and outline stages and throughout research, writing, and editing. When developing the concept, ask:
1. Who is it for?
2. What do we expect these readers to do as a result of their reading?
When developing the outline, researching, and writing, ask:
3. Are we addressing the issues that most concern the intended audience(s)?
4. What practices, behavior, or policies do we want to encourage and enable through the presentation and analysis of evidence and experience?
5. Are we emphasizing the facts that support or call for this new behavior?
6. Are the actions/practices/policies that the facts suggest sufficiently highlighted and easy to find? Will a browsing reader spot them?
7. Are facts linked with actions that the intended audience can take?
8. Are we presenting material—and presenting it in a way—that makes use of the five characteristics of readily adopted behavior described in Diffusion of Innovation theory?
• Relative advantage
• Compatibility
• Simplification
• Observability
• Trialability
9. Have we sacrificed for focus? Have we presented the crucial content efficiently? For example, have we used tables and graphics where they are more efficient or more cogent than text? Have we weeded out or held to a minimum content that is supplemental or already well known?
Source: Developed by Ward Rinehart for the INFO Project, Center for Communication Programs, Johns Hopkins Bloomberg School of Public Health, 2006. It is available on the web: http://www.jura-eds.com/managingknowledge/questionsforanoutline.html
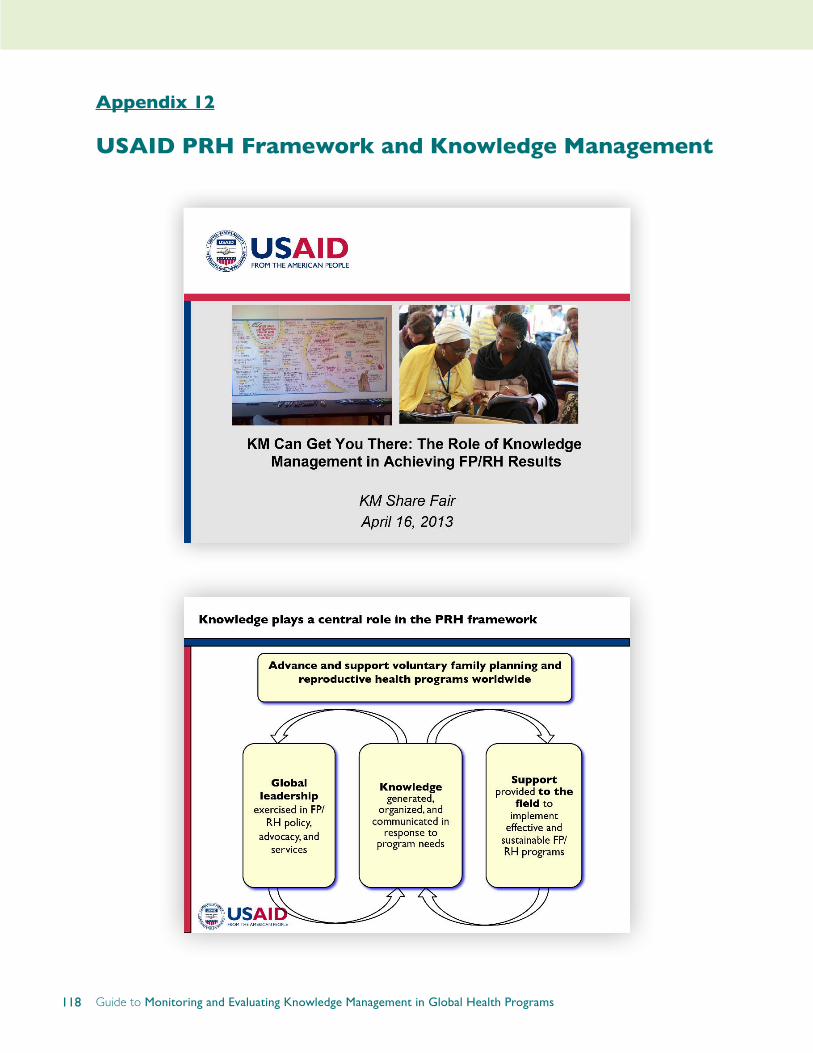
118 Guide to Monitoring and Evaluating Knowledge Management in Global Health Programs
Appendix 12
USAID PRH Framework and Knowledge Management
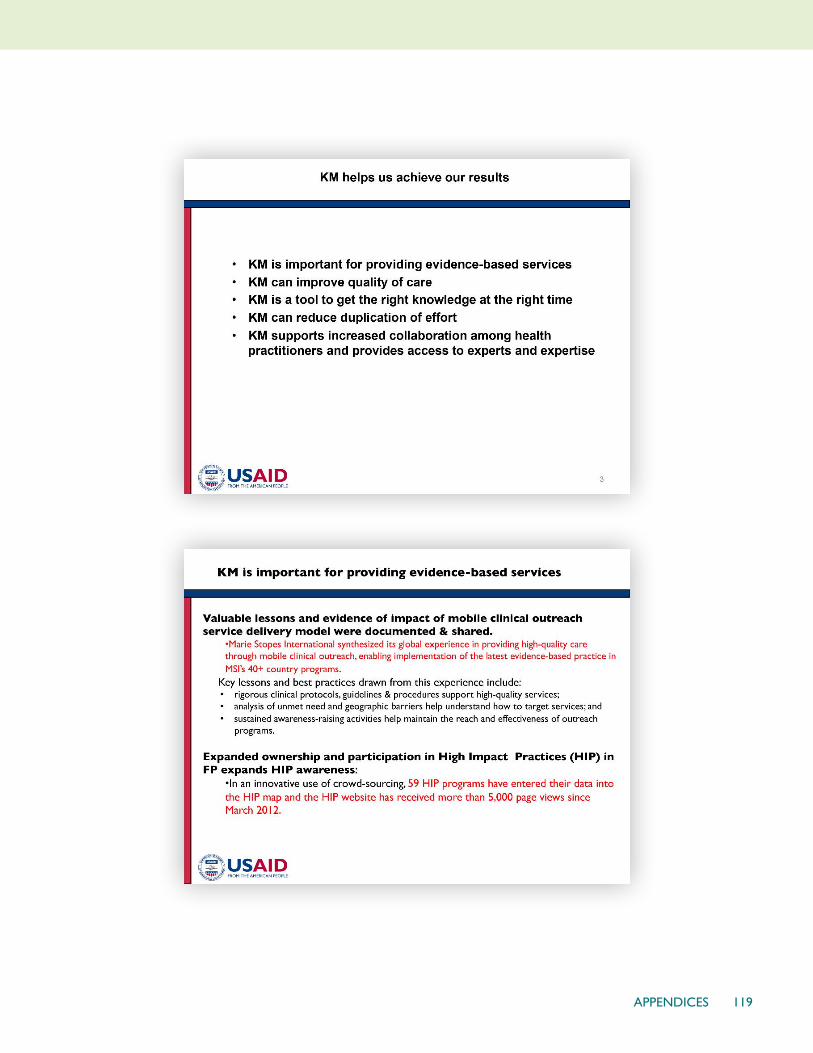
119APPENDICES

120 Guide to Monitoring and Evaluating Knowledge Management in Global Health Programs
121APPENDICES
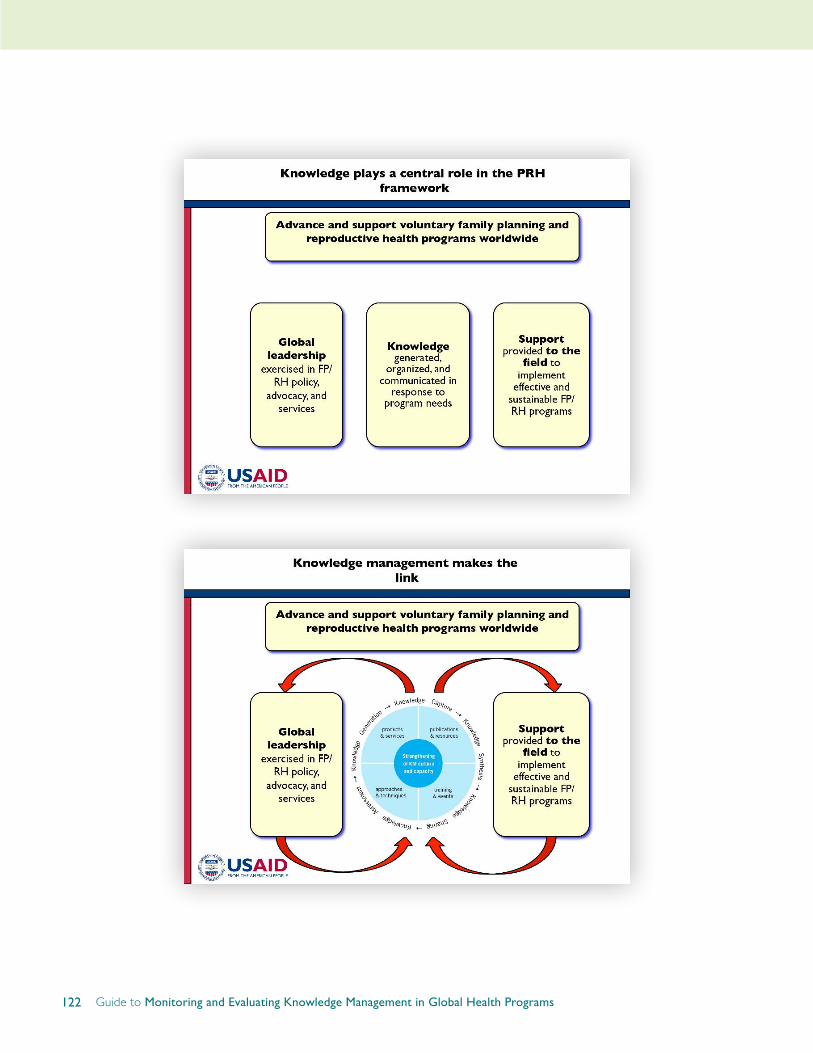
122 Guide to Monitoring and Evaluating Knowledge Management in Global Health Programs

123APPENDICES

124 Guide to Monitoring and Evaluating Knowledge Management in Global Health Programs