e occurrence of heat waves in europe and their circulation
TRANSCRIPT

�e occurrence of heat waves in Europe and their circulation conditions
arkadiusz m. tomczyk, ewa bednorz, marek półrolniczak
geografie 124/1 (2019)
Adam Mickiewicz University, Institute of Physical Geography and Environmental Planning, Department of Climatology, B. Krygowskiego 10, 61-680 Poznań, Poland; e-mail: [email protected]
abstract 0e objective of the paper was to characterize the occurrence of heat waves in Europe between 1976 and 2015 and to determine circulation conditions causing their occurrence. 0e heat waves were recognized as a sequence of at least 5 consecutive hot days. 0e hot day was defined as a day on which daily maximum air temperature was higher than 95ᵗh percentile of all the values in the analyzed period. 0e conducted research showed an increase in the number of heat waves and their duration in the analyzed period. 0e longest heat wave occurred in 2010, in Moscow, which lasted 45 days. 0e most intense changes were observed in the eastern and south-eastern regions. 0e occurrence of heat waves was mainly connected with positive anomalies of atmospheric pressure at sea level, geopotential height of 500 hPa, and temperature on isobaric surface 850 hPa.
key words heat waves – atmospheric circulation – climate change – Europe
tomczyk, a.m., bednorz, e., półrolniczak, m. (2019): 0e occurrence of heat waves in Europe and their circulation conditions. Geografie, 124, 1, 1–17.Received March 2018, accepted February 2019.
© Česká geografická společnost, z. s., 2019
2 geografie 124/1 (2019) / a. m. tomczyk, e. bednorz, m. półrolniczak
1. Introduction
Contemporary climate warming is manifested, among others, by more and more frequent occurrences of extreme weather events, such as heat waves (IPCC 2013). Regional research has clearly indicated that the heat waves in the 21sᵗ century are not only going to be more frequent, but also longer and more intense (Meehl, Tebaldi 2004; Beniston et al. 2007; Kyselý 2010; Pongracz, Bartholy, Bartha 2013; Zacharias, Koppe, Mücke 2015).
Despite the fact that heat waves are not a new weather phenomenon, a sharp increase in interest in their occurrence has been observed since 2003. 0is is due to the occurrence of a very hot summer in Western and Southern Europe, which caused a significant increase in the number of deaths. In France alone, more than 14,000 deaths are estimated due to biometeorological conditions affecting human bodies (Johnson et al. 2005; Poumadere et al. 2005). In Paris, the record number of deaths, which exceeded the average daily number by 600%, was found on 13ᵗh August 2003 (Vandentorren et al. 2004). In the last few decades, several very intense heat waves have occurred in Europe. Heat waves of 1994 and 2015 affected mainly Central Europe (Shevchenko et al. 2014; Lhotka, Kyselý 2015; Hoy et al. 2017; Sulikowska, Wypych, Woszczek 2016), of 2003 and 2006, both Western and Southern Europe (Johnson et al. 2005, Poumadere et al. 2005, Barriopedro et al. 2011), while of 2010, Eastern Europe (Dole et al. 2011, Grumm 2011; Otto et al. 2012). 0e consequence of the aforementioned heat waves was a significant increase in the number of deaths in relation to the expected value (Kuchcik 2001; Bobvos, Fazekas, Páldy 2015; Revich et al. 2015). In addition to fatalities, extreme air temperatures also caused enormous economic losses, mainly in power industry and agriculture (de Beno et al. 2004; García-Herrera et al. 2010).
As Kyselý and Domonkos (2006) have shown, more and more frequent occur-rence of extreme air temperature in Europe is related to an increase in stability of anticyclonic types of atmospheric circulation. Particularly important for the occurrence of extreme air temperature values, including heat and frost waves, are strong high-pressure systems and blocking situations, interrupting zonal circula-tion (Porębska, Zdunek 2013, Bielec-Bąkowska 2014). Due to the great importance of atmospheric circulation for shaping the weather and climate, further and de-tailed research is required in connection to the changes in circulation conditions on a global and local scale, both from the holistic perspective and in the context of changes to individual elements of the circulation system (Bielec-Bąkowska 2014).
With this in mind, the aim of the study was to determine the general conditions of atmospheric circulation conducive to the occurrence of heat waves in Europe. 0e implementation of this objective was preceded by the determination of the temporal and spatial variability of the occurrence of heat waves in particular regions of the continent.

the occurrence of heat waves in europe and their circulation conditions 3
2. Data and research methods
0e article used data on the maximum (Tmax) daily air temperature from 1976–2015 for 60 stations located in Europe (Fig. 1). For Polish stations, data was obtained from the Institute of Meteorology and Water Management – National Research Institute, for German stations from the German Meteorological Service (Deutscher Wetterdienst), and for Norwegian stations from the Norwegian Meteo-rological Institute. For other stations, data was obtained from generally available National Oceanic and Atmospheric Administration (NOAA) databases. Data from NOAA collections, according to the metadata record (http://www7.ncdc.noaa.gov/CDO/GSOD_DESC.txt), are subject to the quality assessment procedure (QC). Only stations that had a complete set of data for the period under study were used in the article. 0is resulted in limiting the number of stations included in the study.
In the climatological literature one can find a number of definitions of heat waves that refer to different criteria (Perkins, Alexander 2013). Various wave intensity criteria have been adopted, i.e. air temperature thresholds or biomete-orological indices, but also different criteria of the phenomenon’s stability, i.e. different lengths of sequences of days that meet the adopted assumptions. Two groups of definitions dominate in the literature. 0e first of these are definitions
Fig. 1 – Location of synoptic stations with division into regions (R1 – northern, R2 – western, R3 – east, R4 – south-western and R5 – south-eastern region)

4 geografie 124/1 (2019) / a. m. tomczyk, e. bednorz, m. półrolniczak
based on arbitrary thresholds, that is, specific values of the maximum air tempera-ture, e.g. 25 °C or 30 °C (Kudzewicz, Huang 2010; Kyselý 2010; Tomczyk 2018). 0e second group are the definitions referring to the relative thresholds. Most of the definitions in this group is based on the criterion of extreme weather events as proposed by the IPCC (2007): a weather event which is so rare within a particular area and in a particular season that it lies within the range of 10ᵗh or 90ᵗh percentile of an observed probability density function or rarer. For these definitions, the air temperature percentile value can be calculated from both the whole year and the summer season. 0e most commonly assumed percentile value is 90. (Lhotka, Kyselý 2015), 95. (Rey et al. 2009; Tomczyk, Bednorz 2014) or 99. (Hoy et al. 2017). 0e adoption of an arbitrary threshold is suitable for studies with a small spatial extent. 0e definitions based on relative thresholds are more universal, and their application makes comparison of results from different climatic regions possible, which works well in the implementation of this study. However, their adoption re-sults in identifying a similar number of heat waves, even in regions with extremely different climatic conditions. 0e minimum three-day or five-day duration of a wave is the most open used in the climatological research studies (Kyselý 2010; Shevchenko et al. 2014; Tomczyk, Bednorz 2014). It is reported that a human body starts its negative reaction to the stress of heat aper three days (Hajat et al. 2002; Nairn, Fawcett 2015).
Based on the source material, the Tmax 95ᵗh annual percentile values were cal-culated from the entire multi-year period (for every single station). Subsequently, on the basis of these values, the area under study was divided into regions by adopting threshold values of 25 °C and 30 °C. On this basis, 3 regions were distin-guished, however, in 2 of them further subdivision was made due to the extent of the area, based on simultaneous occurrence of heat waves in the sub-regions. As a result, 5 regions were obtained, such as: R1 – northern (Tmax below 25 °C), R2 – western (Tmax between 25 °C and 30 °C), R3 – eastern (Tmax between 25 °C and 30 °C), R4 – south-western (Tmax above 30 °C) and R5 – south-eastern (Tmax above 30 °C) regions. In the next step, hot days were distinguished, and then heat waves in particular regions were determined from the selected days. A sequence of at least 5 consecutive hot days was considered a heat wave. A hot day was defined as a day on which daily maximum air temperature was higher than 95ᵗh percentile of all the values in the analysed period. 0e next step consisted in calculating the potential period of the occurrence of heat waves, that is the period between the earliest commencement and the latest termination of the heat waves.
In order to define circulation conditions conducive to the occurrence of heat waves, daily values of atmospheric pressure at sea level, height of isobaric surface 500 hPa (z500 hPa) and temperature on isobaric surface 850 hPa (T850) were used. 0e data was obtained from the National Center for Environmental Pre-diction / National Center for Atmospheric Research (NCEP / NCAR) Reanalysis

the occurrence of heat waves in europe and their circulation conditions 5
(Kalnay et al. 1996), which are available in the archives of the NOAA ESRL PSD (Earth System Research Laboratory Physical Science Division). On the basis of the aforementioned data, there were composite maps for heat-wave-days drawn up for atmospheric pressure at sea level, together with maps of z500 hPa and T850 as well as maps of anomalies. Only the days when heat waves occurred in at least 20% of stations were taken into consideration. 0e composite maps depict mean atmospheric pressure at sea level and z500 hPa in the days with heat waves in a given region and the mapped anomalies were calculated as the difference between average values of particular parameters for selected waves and average values for the summer season from the analysed period.
3. Results
3.1. Occurrence of heat waves in Europe between 1976 and 2015
3.1.1. Northern region
In the northern region (R1) in the analysed 1976–2015 period, the total number of heat waves varied from 10 in Świnoujście to 56 in Oslo, which lasted 98 days and 429 days, respectively. In 47% of stations, the fewest heat waves were recorded in 1986–1995 (Fig. 2). During this period, the number of heat waves ranged from 4 in Świnoujście (36 days) to 14 in Oslo (108 days). In addition, in two stations the smallest number of waves was found in two decades, i.e. 1986–1995 and 2006–2015 in Alta and 1976–1985 and 1986–1995 in Kvikkjokk. In turn, the highest number of heat waves was recorded mainly in 2006–2015, but also between 1996 and 2005. In the last 10 years of the analysed period, the number of waves ranged from 4 in Świnoujście (34 days) to 19 in Tallinn (161 days).
Fig. 2 – Ee number of heat waves (A) and the duration of heat waves (B) in 1976–2015 at selected stations.
6 geografie 124/1 (2019) / a. m. tomczyk, e. bednorz, m. półrolniczak
In the analysed period, in the northern region, heat waves occurred from May to September. Apart from one station (Schleswig), the highest number of heat waves was recorded in July. In the case of 60% of stations, July heat waves constituted at least 50% of all heat waves. 0e earliest, and also the latest heat waves were recorded in Bergen, from 4ᵗh to 9ᵗh May 2006, and from 8ᵗh to 12ᵗh September 2002, respectively. 0e above-mentioned data shows that the longest potential period of occurrence of heat waves was recorded in Bergen and lasted 132 days, while the shortest one was in Świnoujście – only 59 days.
In 60% of stations, the most numerous were 5-day heat waves, while in 7% of stations, waves of 5 and 6 days occurred with the same frequency. In the other stations, 6-day waves were most frequently recorded. In 60% of stations, 5- and 6-day waves constituted over 50% of all recorded waves. 0e longest heat wave was recorded in Jyvaskyla, which lasted as many as 26 days, from 17ᵗh July to 11ᵗh August 2014. 0e heat wave from 2014 lasted over 20 days also in Kvikkjokk, Schleswig and Tallinn.
3.1.2. Western region
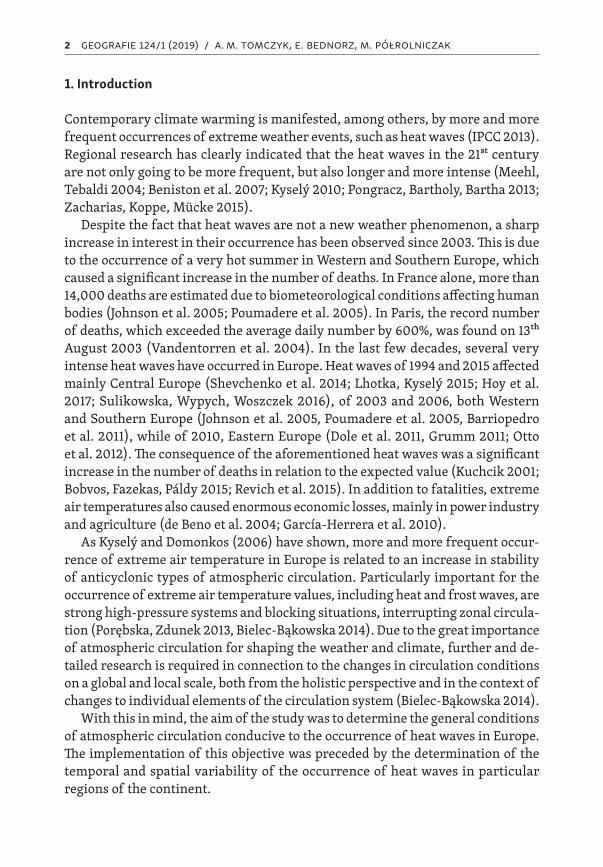
In the western region (R2), in the analysed period, the total number of heat waves varied from 27 in Cologne to 40 in Dijon and Prague. In Cologne, the total dura-tion of heat waves was 203 days, and in Dijon it was 306 days. In 75% of stations, the lowest number of heat waves was recorded in the years 1976–1985, and this number changed from 2 in Paris (22 days) to 9 in Magdeburg (64 days; Fig. 3). In turn, in 63% of stations the highest number of heat waves was recorded in the years 1996–2005, while in two stations a similar number of waves was also recorded in the years 1986–1995. 0eir number changed from 6 in Prague (47 days) to 14 in Dijon (101 days). In other stations, heat waves most open occurred in the years 2006–2015.
Fig. 3 – Ee number of heat waves (A) and the duration of heat waves (B) in 1976–2015 at selected stations.

the occurrence of heat waves in europe and their circulation conditions 7
In the western region, heat waves occurred from May to September. In 50% of the stations, the highest number of heat waves was recorded in July, while in the case of two stations, the same number of waves was observed in July and August. In the remaining 38% of stations, waves were most open recorded in August. 0e earliest heat wave was recorded in Amsterdam from 2ⁿᵈ to 6ᵗh May 1990, and the latest in Nantes from 27ᵗh September to 2ⁿᵈ October 2011. 0e aforementioned data show that the potential period of occurrence of heat waves within the analysed area was 154 days, from 2ⁿᵈ May to 2ⁿᵈ October. In individual stations, the length of this period ranged from 75 days in Paris (from 14ᵗh June to 27ᵗh August) to 117 days in Amsterdam (from 2ⁿᵈ May to 26ᵗh August).
In all stations, the number of heat waves lasting 5 days was the highest. Only in Nantes, 5- and 6-day waves constituted less than 50% of all recorded waves. 0e longest heat wave lasting 18 days was recorded in Augsburg (22ⁿᵈ June – 9ᵗh July 1976) and Dijon (21sᵗ June – 7ᵗh July 1976 and 10ᵗh–27ᵗh July 2006). In each station, the longest heat waves lasted at least 16 days.
3.1.3. Eastern region
In the eastern region (R3) in the analysed 40 years, the total number of heat waves ranged from 32 in Olsztyn to 67 in Kharkiv. 0e total duration of heat waves ranged from 231 days in Lviv to 519 in Kharkiv. In 81% of stations, the lowest number of heat waves was recorded in the years 1976–1985, and their number ranged from 1 in Botosani (7 days) and Lviv (7 days) to 10 in Penza (72 days; Fig. 4). In one station (Sochi), the same number of heat waves was recorded in 1976–1985 and 1986–1995.
In turn, in all stations the highest number of heat waves was recorded in 2006–2015. In the above-mentioned multi-year period their number changed from 12 in Olsztyn (95 days) to 34 in Kharkiv (296 days).
Fig. 4 – Ee number of heat waves (A) and the duration of heat waves (B) in 1976–2015 at selected stations.
8 geografie 124/1 (2019) / a. m. tomczyk, e. bednorz, m. półrolniczak
In the analysed period in the eastern region, heat waves occurred from the turn of May to September, although in all stations they occurred most frequently in July. In five stations, July heat waves constituted over 50% of all waves recorded in these stations. 0e earliest heat wave was recorded in Lviv from 28ᵗh April to 2ⁿᵈ May 2012, and the latest in Penza from 22ⁿᵈ to 26ᵗh September 2015. According to the above-mentioned data, the potential period of occurrence of heat waves in the analysed area was 152 days, from 28ᵗh April to 26ᵗh September. In individual stations, the length of this period ranged from 89 days in Poznań (from 31sᵗ May to 27ᵗh August) to 138 days in Penza (12ᵗh May to 26ᵗh September).
In 56% of stations, heat waves lasting 5 days were most frequently recorded. With the same frequency, there were 5- and 6-day waves occurring in 3 stations, while 5- and 7-day waves in one station. Only in Botosani, the most numerous were 7-day waves. In 50% of stations, 5- and 6-days waves constituted over 50% of all waves recorded, and in Kraków this share exceeded 70%. 0e longest heat wave was recorded in Moscow in 2010 and it lasted as many as 45 days, from 5ᵗh July to 18ᵗh August. 0e longest heat wave that covered the western part of the analysed area was the wave from the turn of August 1994. In all stations, the longest heat waves lasted at least 15 days.
3.1.4. South-western region
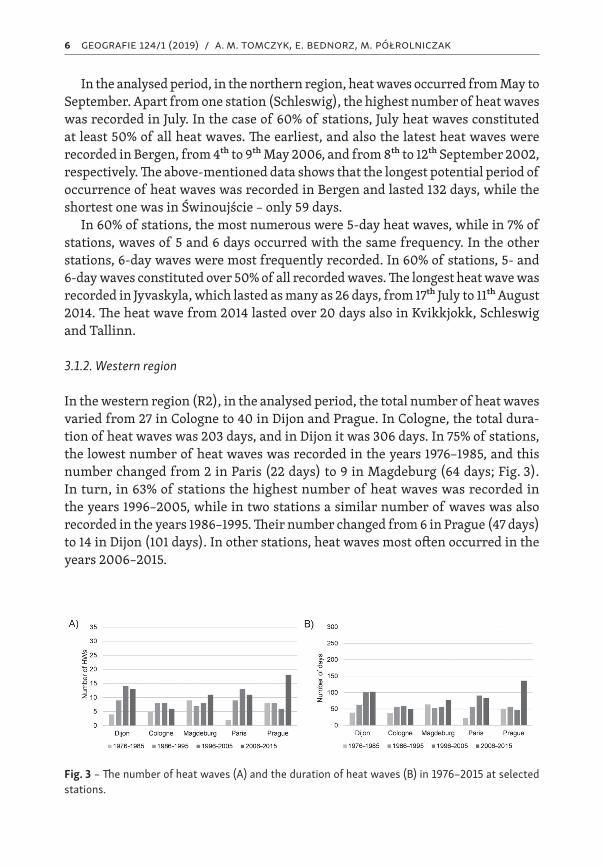
In the south-western region (R4), the total number of heat waves varied from 14 in Bilbao to 55 in Venice, which in total lasted 98 and 476 days, respectively. In 73% of the stations, the lowest number of heat waves was recorded between 1976 and 1985 (Fig. 5). During this period, their number ranged from 2 in Bari (10 days) and Valencia (13 days) to 11 in Sevilla (65 days). In the remaining stations the smallest number was recorded for the next 10 year-periods. In turn, in 45% of stations, the highest number of heat waves was recorded in 2006–2015, and the number changed from 3 in Bilbao (19 days) to 23 in Venice (212 days). Equally numerous
Fig. 5 – Ee number of heat waves (A) and the duration of heat waves (B) in 1976–2015 at selected stations.

the occurrence of heat waves in europe and their circulation conditions 9
heat waves occurred in the years 1986–1995, in which 36% of stations recorded the highest number of them.
In the analysed period in the south-western region, heat waves occurred from June to October. In 64% of stations, the highest number of heat waves was recorded in July, while in 27% in August. Only in Bilbao the highest number of heat waves occurred in September. 0e earliest eat wave was recorded in Bilbao, Florence and Venice, which occurred respectively on 7ᵗh–11ᵗh June 2006, 7ᵗh–17ᵗh June 2003 and 7ᵗh–15ᵗh June 2003, and the latest was found in Bilbao, on 1sᵗ–6ᵗh October 1983. 0e above-mentioned data shows that the longest potential period of occurrence of heat waves was recorded in Bilbao and it lasted 122 days, while the shortest one was in Valencia – only 52 days.
In 91% of stations, the number of heat waves lasting 5 days was the highest. Apart from three stations (Florence, Valencia and Venice), 5- and 6-day waves constituted at least 50% of all recorded waves. 0eir largest percentage was re-corded in Seville and Baria (69% and 67%, respectively). In 55% of stations, the longest heat wave occurred in August 2003, and its maximum length was 24 days in Florence (2ⁿᵈ–25ᵗh August 2003). In individual stations, the longest heat waves lasted at least 12 days.
3.1.5. South-eastern region
In the south-eastern (R5) region, in the analysed period, the total number of heat waves varied from 33 in Burgas and Larissa to 60 in Split. On the other hand, a total duration of heat waves oscillated between 226 days in Larissa and 525 in Split. In 90% of the stations, the fewest or no heat waves was recorded between 1976 and 1985, while in one station (Larissa) a similar number of heat waves oc-curred also between 1986 and 1995 (Fig. 6). During this period, no heat waves were recorded only in one station, i.e. Bucharest, while the highest number was found in Bratislava (8 waves), which lasted a total of 53 days. In turn, in 80% of
Fig. 6 – Ee number of heat waves (A) and the duration of heat waves (B) in 1976–2015 at selected stations.

10 geografie 124/1 (2019) / a. m. tomczyk, e. bednorz, m. półrolniczak
stations, the highest number of heat waves was recorded in 2006–2015, and the number changed from 15 in Bratislava (127 days) and Larissa (110 days) to 28 in Split (242 days).
In the analysed period in the south-eastern region, heat waves occurred from June to September. In 60% of stations, the highest number of heat waves was recorded in August, while in other stations in July. 0e earliest heat wave was recorded in Bratislava, from 1sᵗ to 7ᵗh June 1979, and Pecs, from 1sᵗ to 5ᵗh June 1979, and the latest in Skopje, from 11ᵗh to 15ᵗh September 2011, respectively. 0e above-mentioned data shows that the potential period of the occurrence of heat waves within the particular area was 107 days, from 1sᵗ June to 15ᵗh September. In individual stations, the length of this period ranged from 64 days in Burgas (from 22ⁿᵈ June to 24ᵗh August) to 96 days in Skopje (from 12ᵗh June to 15ᵗh September).
In 80% of the stations, the most numerous were the shortest, 5 days long, heat waves, while in 20% these were 6-day heat waves. Apart from two stations (Brati-slava, Split), 5- and 6-day waves constituted at least 50% of all recorded waves. In the vast majority of stations, the longest duration of heat waves was more than 15 days. In turn, the longest wave in the surveyed area was recorded in Simferopol in 2014, from 21sᵗ July to 17ᵗh August.
3.2. Synoptic conditions of the heat waves occurrence
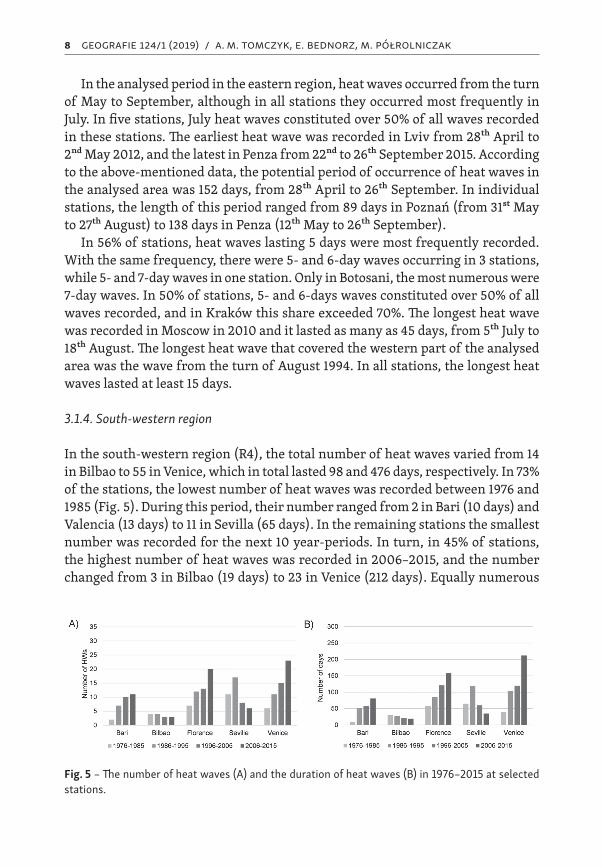
0e occurrence of heat waves in Europe is generally associated with anticyclonic pressure conditions over the continent, which is demonstrated by higher-than-normal atmospheric pressure at sea level and z500 hPa values during heat events. Synoptic conditions of the heat waves that were analysed individually for each distinguished region characterised by a ridge of high pressure and an anticyclonic centre were associated with positive air temperature anomalies. In each case, a local high centre was connected by a ridge of high pressure with the strong sum-mer Azores High. However, the location, extent and intensity of the anticyclonic systems causing hot weather differed substantially depending on the region of the heat waves’ occurrence. For each region, the anticyclonic centres with the strong-est atmospheric pressure at sea level and z500 hPa anomalies appeared in the eastern part of the region of heat waves’ occurrence, or northwards of the region.
0e strongest positive atmospheric pressure at sea level anomalies accompanied the heat waves striking the northern region. 0e high-pressure area extended over northern Europe, with a centre (atmospheric pressure at sea level > 1,018 hPa) located over southern Finland and north-western Russia (Fig. 7). Contour lines of z500 hPa over the majority of the continent bent northward, creating an omega-shaped blocking pattern with a clear elevation of geopotential level over Northern Europe. 0e atmospheric pressure at sea level anomalies amounted to > 7 hPa,
the occurrence of heat waves in europe and their circulation conditions 11
and the z500 hPa was settled higher than on average in the summer (positive anomalies in the centre exceeded 125 gpm). 0e occurrence of positive anomalies of geopotential heights together with the positive anomalies of air temperature complies with the hydrostatic balance in the troposphere. 0e described pressure pattern caused an inflow of warm and dry continental air masses from the north-east in the lower troposphere, and therefore, the positive anomalies of T850 over Scandinavia and the Norwegian Sea exceeded 5 °C.
Heat waves in the western region were caused by a local high-pressure area formed north-east of the region with its centre over the Baltic Sea, northern Po-land and Germany (atmospheric pressure at sea level in the centre > 1,018 hPa; Fig. 7). Over the majority of Europe, atmospheric pressure at sea level was higher
Fig. 7 – Mean atmospheric pressure at sea level and z500 hPa (leR column), atmospheric pressure at sea level and z500 hPa anomalies (middle column), and anomalies of T850 (right column) for the heat waves days in the distinguished regions of the continent (R1 – northern, R2 – western, R3 – east, R4 – south-western and R5 – south-eastern region).

12 geografie 124/1 (2019) / a. m. tomczyk, e. bednorz, m. półrolniczak
than on average in summer, and in the centre of the high pressure area atmos-pheric pressure at sea level anomalies exceeded 5 hPa. 0e centre was located over southern Scandinavia and it was shiped south- and westwards in comparison to the pressure pattern favourable to heat waves in the northern region. Contour lines of z500 hPa over Southern and Central Europe bent north-eastwards creating its elevation, and anomalies of z500 hPa over the analysed area range from 50 to > 100 gpm. 0e described pressure pattern caused the advection of warm air masses to western Europe, which resulted in positive T850 anomalies, ranging from 4 °C to more than 5 °C.
During heat waves in the eastern region the local anticyclonic centre was shiped eastwards in comparison to the western region, i.e. it was located at the borderline between Belarus, Lithuania and Russia (atmospheric pressure at sea level > 1,016 hPa, atmospheric pressure at sea level anomalies > 4 hPa; Fig. 7). Con-tour lines of the 500 hPa isobaric surface over the eastern part of the continent bent northward creating an elevation over the analysed area, and that indicates the presence of warm air masses. 0e z500 hPa positive anomalies amounted to 100 gpm in the centre of the high pressure system. 0e described pressure condi-tions caused an inflow of warm and dry continental air masses from the eastern sector in the lower troposphere. By contrast, warm air masses advection from the southern sector occurred in higher troposphere layers. 0e presence of warm air masses was confirmed by positive T850 anomalies, exceeding 4 °C over Belarus, Lithuania and eastern Poland.
Much weaker atmospheric pressure at sea level anomalies were associated with heat waves occurring in Southern Europe. In the south-western region, the occurrence of heat waves was related to a ridge of high pressure with its centre over the Azores Islands, extending to central Europe (Fig. 7). Atmospheric pressure at sea level was higher than average over the majority of the continent, but the anomalies were weak and ranged from −0.5 to 2 hPa. 0e centre of the atmospheric pressure at sea level anomalies was located north to the south-eastern region, i.e. over Denmark, northern Germany and the North Sea (anomalies of atmospheric pressure at sea level > 2 hPa in the centre). 0e research area remained within z500 hPa positive anomalies, which ranged from 25 to > 80 gpm and the pattern of z500 hPa contour lines shows south-western air flow in the middle troposphere layer. Over most of Northern, Southern and Eastern Europe, the temperature at the 850 hPa isobaric surface was close to average conditions in the summer, while over the analysed area it was significantly higher. 0e centre of the positive T850 anomalies was recorded over southern France (> 4 °C). 0e described pressure conditions provided an intense inflow of solar radiation which was caused by the cloudlessness or small cloud cover specific to high-pressure weather. Heat waves in the south-eastern region were associated with the weakest anomalies of atmos-pheric pressure at sea level (up to > 1 hPa in the east). Atmospheric pressure at sea

the occurrence of heat waves in europe and their circulation conditions 13
level ranged from approximately 1,008 to > 1,016 hPa (Fig. 7) over the analysed area. 0e described pattern caused an inflow of air masses from the northeast and east. Contour lines of the 500 hPa geopotential level over Southern Europe bent north-eastwards, creating its elevation, and therefore, warm air masses set-tled over this part of the continent. 0e pattern of z500 hPa contour lines shows south-western air flow in the middle troposphere layer. 0e described conditions were accompanied by positive T850 anomalies that ranged from 2 to > 4 °C over the south-eastern region.
4. Discussion and summary
0e conducted research showed an increase in the number of heat waves and their total duration in the analysed period. 0e most intense changes were observed in the eastern and south-eastern regions. In these regions, the highest number of heat waves occurred in 2006–2015, while in the other regions the highest number of waves was recorded usually in 2006–2015 or 1996–2005. 0is situation was related to the occurrence of hot summer seasons, mainly in 2003, 2006, 2010, and also in 2015 (Twardosz, Kossowska-Cezak 2015; Hoy et al. 2017). In turn, the rarest were the heat waves occurring mainly in 1976–1985, except for the northern region, where the lowest number of waves was recorded in 1986–1995. Similar temporal evolution of changes in the number of hot days, as well as heat waves is also indicated by other authors who conduct research in much smaller areas (Shevchenko et al. 2014; Lhotka, Kyselý 2015; Unkašević, Tošić 2015; Sulikowska, Wypych, Woszczek 2016; Tomczyk, Sulikowska 2017). Increasing trends have been demonstrated by analysing the occurrence of characteristic days and heat waves in stations with over 100-year sequences of data (Kundzewicz, Huang 2010; Tomczyk 2018). It was estimated that between 1880 and 2005, the frequency of hot days in western Europe increased nearly threefold, and the length of heat waves doubled (Della-Marta et al. 2007). Increasing frequency of heat waves is congruent with increasing Tmax temperature in Europe (increase by 0.52–1.5 °C per 10 years, depending on the region; Founda, Giannakopoulos 2009; Corobov et al. 2010; Unkaševic, Tošic 2009; Martínez et al. 2010; Tomczyk, Bednorz 2016).
0e conducted research showed that heat waves in Europe occurred from the end of April to the beginning of October. 0e shortest potential period of occur-rence of heat waves was found in the south-eastern region (107 days), while the longest in the western region (154 days). Usually, the most frequent heat waves were recorded in July, with the exception of the south-eastern region, where August heat waves prevailed. 0e longest heat wave occurred in 2010 in Moscow, which lasted as many as 45 days. In individual stations, the longest heat waves occurred mainly in the last two decades, i.e. in 1994, 2003, 2006, 2010, 2014 and

14 geografie 124/1 (2019) / a. m. tomczyk, e. bednorz, m. półrolniczak
2015. As has already been shown in previous studies, their occurrence was as-sociated with much larger anomalies of atmospheric pressure field and air tem-perature than on average during heat waves (Tomczyk 2016; Tomczyk, Bednorz 2016; Tomczyk, Piotrowski, Bednorz 2016; Tomczyk, Półrolniczak, Bednorz 2017; Tomczyk 2017).
In numerous studies the driving mechanisms of increase in occurrence of heat waves in Europe were analysed. Besides the anthropogenic reasons for the air temperature increase, natural processes, including mainly air circulation, are considered (Kyselý 2007). Based on this study, it was claimed that the occurrence of heat waves was associated with the presence of high pressure systems blocking zonal circulation. In each analysed region of Europe, the mean pressure field dur-ing the occurrence of heat waves had common features, i.e. higher-than-normal pressure over the continent, but the location of the anticyclonal systems varied depending on the analysed area of research. 0e blocking high in case of each distinguished region located north or northeast from the area of heat waves occurrence. Such pattern caused eastern or south eastern air inflow, dominat-ing in a particular region during the hottest periods. In addition, anticyclonic conditions provide cloud-free weather and a strong solar energy flux. Increased solar irradiation enhances the surface energy balance and uprates the surface temperature. Besides, in the stable anticyclonic conditions, the downward move-ment of the air and adiabatic subsidence contribute to increased surface air tem-perature. 0e positioning and intensity of the high-pressure areas are indicated by positive anomalies of sea level pressure and height of 500 hPa isobaric surface. For the occurrence of heat waves the strongest positive anomalies of atmospheric pressure at sea level and z500 hPa were observed in the northernmost region of Europe, while the weakest in the southern regions. Distinct increasing the level of 500 hPa and positive air temperature anomalies at the level of 850 hPa, indicate the presence of warm air masses over the research area, according to the hydrostatic balance in the troposphere. Similar pressure patterns have been shown by previous studies of the circulation conditions causing the occurrence of heat waves in many regions of Europe (Black et al. 2004; Rebetez, Dupont, Giroud 2006; Founda, Giannakopoulos 2009; Porębska, Zdunek 2013; Unkašević, Tošić 2015). However, detailed analyses have also shown the possibility of oc-currence of heat waves in Central Europe with cyclonic circulation (Tomczyk, Bednorz 2016).
the occurrence of heat waves in europe and their circulation conditions 15
References
BARRIOPEDRO, D., FISCHER, E.M., LUTERBACHER, J., TRIGO, R.M., GARCÍA-HERRERA, R. (2011): 0e hot summer of 2010: redrawing the temperature record map of Europe. Science, 332, 220–224.
BENISTON, M., STEPHENSON, D.B., CHRISTENSEN, O.B., FERRO, C.A.T., FREI, C., GOYETTE, S., HALSNAES, K., HOLT, T., JYLHA, K., KOFFI, B., PALUTIKOF, J., SCHOLL, R., SEMMLER, T., WOTH, K. (2007): Future extreme events in European Climate: An ex-ploration of regional climate model projections. Climatic Change, 81, 81–95.
BIELEC-BĄKOWSKA, Z. (2014): Silne wyże na Europą (1951–2010). Wydawnictwo Uniwer-sytetu Śląskiego, Katowice, 219.
BLACK, E., BLACKBURN, M., HARRISON, G., HOSKINS, B., METHVEN, J. (2004): Factors contributing to the summer 2003 European heatwave. Weather, 59, 217–223.
BOBVOS, J., FAZEKAS, B., PÁLDY, A. (2015): Assessment of heat-related mortality in Budapest from 2000 to 2010 by different indicators. Időjárás, 119, 2, 143–158.
COROBOV, R., SHERIDAN, S., OVERCENCO, A., TERINTE, N. (2010): Air temperature trends and extremes in Chisinau (Moldova) as evidence of climate change. Climate Research, 42, 247–256.
DE BONO, A., PEDUZZI, P., GIULIANI, G., KLUSER, S. (2004): Impacts of summer 2003 heat wave in Europe. United Nations Environment Programm, UNEP.
DELLA-MARTA, P.M., HAYLOCK, M.R., LUTERBACHER, J., WANNER, H. (2007): Doubled length of western European summer heat waves since 1880. Journal of Geophysical Research, 112, D15103.
DOLE, R., HOERLING, M., PERLWITZ, J., EISCHEID, J., PEGION, P., ZHANG, T., QUAN, TAIYI, XU, MURRAY, D. (2011): Was there a basis for anticipating the 2010 Russian heat wave. Geophysical Research Letters, 38.
FOUNDA, D., GIANNAKOPOULOS, C. (2009): 0e exceptionally hot summer of 2007 in Athens, Greece–a typical summer in the future climate? Global and Planetary Change, 67, 3–4, 227–236.
GARCÍA-HERRERA, R., DÍAZ, J., TRIGO, R.M., LUTERBACHER, J., FISCHER, E.M. (2010): A review of the European summer heat wave of 2003. Critical Reviews in Environmental Science and Technology, 40, 4, 267–306.
GRUMM, R.H. (2011): 0e Central European and Russian Heat Event of July-August 2010. http://cms.met.psu.edu/sref/severe/2010/21Aug2010.pdf (10. 1. 2018).
HAJAT, S., KOVATS, R.S., ATKINSON, R.W., HAINES, A. (2002): Impact of hot temperatures on death in London: a time series approach. Journal of Epidemiology and Community Health, 56, 5, 367–372.
HOY, A., HÄNSEL, S., SKALAK, P., USTRNUL, Z., BOCHNÍČEK, O. (2017): 0e extreme European summer of 2015 in a long-term perspective. International Journal of Climatology, 37, 2, 943–962.
IPCC (2007): Climate change: 0e physical science basis. Contribution of Working Group I to the Fourth Assessment Report of the Intergovernmental Panel in Climate Change. Cambridge University Press, Cambridge.
IPCC (2013): Climate change: 0e physical science basis. Contribution of Working Group I to the Fiph Assessment Report of the Intergovernmental Panel in Climate Change. Cambridge University Press, Cambridge.

16 geografie 124/1 (2019) / a. m. tomczyk, e. bednorz, m. półrolniczak
JOHNSON, H., KOVATS, R.S., MCGREGOR, G., STEDMAN, J., GIBBS, M., WALTON, H. (2005): 0e impact of the 2003 heat wave on daily mortality in England and Wales and the use of rapid weekly mortality estimates. Eurosurveillance, 10, 7–9, 168–171.
KALNAY, E., KANAMISTU, M., KISTLER, R., COLLINS, W., DEAVEN, D., GANDIN, L., IRE-DELL, M., SAHA, S., WHITE, G., WOOLLEN, J., ZHU, Y., LEETMAA, A., REYNOLDS, R., CHELLIAH, M., EBISUZAKI, W., HIGGINS, W., JANOWIAK, J., MO, K.C., ROPELEWSKI, C., WANG, J., JENNE, R., JOSEPH, D. (1996): 0e NMC/NCAR 40-Year Reanalysis Project. Bulletin of the American Meteorogical Society, 77, 437–471.
KUCHCIK, M. (2001): Mortality in Warsaw: is there Any connection with Feather and air pol-lution? Geographia Polonica, 74, 1, 29–45.
KUNDZEWICZ, Z.W., HUANG, S. (2010): Seasonal temperature extremes in Potsdam. Acta Geophysica, 58, 6, 1115–1133.
KYSELÝ, J. (2010): Recent severe heat waves in central Europe: how to view them in a long–term prospect? International Journal of Climatology, 30, 89–109.
KYSELÝ, J., DOMONKOS, P. (2006): Recent increase in persistence of atmospheric circula-tion over Europe: comparison with long–term variations since 1881. International Journal of Climatology, 26, 461–483.
LHOTKA, O., KYSELÝ, J. (2015): Characterizing joint effects of spatial extent, temperature magnitude and duration of heat waves and cold spells over Central Europe. International Journal of Climatology, 35, 7, 1232–1244.
MARTÍNEZ, M.D., SERRA, C., BURGUEÑO, A., LANA, X. (2010): Time trends of daily maximum and minimum temperatures in Catalonia (ne Spain) for the period 1975–2004. International Journal of Climatology, 30, 267–290.
MEEHL, G., TEBALDI, C. (2004): More intense, more frequent, and longer lasting heat waves in the 21sᵗ century. Science, 305, 994–997.
NAIRN, J.R., FAWCETT, R.J. (2015): 0e excess heat factor: a metric for heatwave intensity and its use in classifying heatwave severity. International Journal of Environmental Research and Public Health, 12, 1, 227–253.
OTTO, F.E.L., MASSEY, N., VAN OLDENBORGH, G.J., JONES, R.G., ALLAN, M.R. (2012): Reconciling two approaches to attribution of the 2010 Russian heat wave. Geophysical Re-search Letters, 39, L04702.
PERKINS, S.E., ALEXANDER, L.V. (2013): On the measurement of heat waves. Journal of Climate, 26, 13, 4500–4517.
PONGRACZ, R., BARTHOLY, J., BARTHA, E.B. (2013): Analysis of projected changes in the occurrence of heat waves in Hungary. Advances in Geosciences, 35, 115–122.
PORĘBSKA, M., ZDUNE, M. (2013): Analysis of extreme temperature events in Central Europe related to high pressure blocking situations in 2001–2011. Meteorologische Zeitschrip, 22, 5, 533–540.
POUMADERE, M., MAYS, C., LE MER, S., BLONG, R. (2005): 0e 2003 Heat Waves in France. Dongerous Climate Change Here and Now, 25, 6, 1483–1494.
REBETEZ, M., DUPONT, O., GIROUD, M. (2006): An analysis of the July 2006 heatwave extent in Europe compared to the record year of 2003. 0eoretical and Applied Climatology, 95, 1–2, 1–7.
REVICH, B.A., SHAPOSHNIKOV, D.A., PODOL’NAYA, M.A., KHOR’KOVA, T.L., KVASHA, E.A. (2015): Heat Waves in Southern Cities of European Russia as a Risk Factor for Premature Mortality. Studies on Russian Economic Development, 26, 2, 142–150.

the occurrence of heat waves in europe and their circulation conditions 17
REY, G., FOUILLET, A., BESSEMOULIN, P., FRAYSSINET, P., DUFOUR, A., JOUGLA, E., HEMON, D. (2009): Heat exposure and socio-economic vulnerability as synergistic factors in heat-wave-related mortality. European Journal of Epidemiology, 24, 9, 495–502.
SHEVCHENKO, O., LEE, H., SNIZHKO, S., MAYER, H. (2014): Long-term analysis of heat waves in Ukraine. International Journal of Climatology, 34, 1642–1650.
SULIKOWSKA, A., WYPYCH, A., WOSZCZEK, I. (2016): Fale upałów latem 2015 roku i ich uwarunkowania cyrkulacyjne. Badania Fizjograficzne, Seria A. Geografia Fizyczna, 67, 205–223.
TOMCZYK, A.M. (2016): Impact of atmospheric circulation on the occurrence of heat waves in southeastern Europe. Időjárás, 120, 4, 395–414.
TOMCZYK, A.M. (2017): Atmospheric circulation during heat waves in Eastern Europe. Geo-grafie, 122, 2, 121–146.
TOMCZYK, A.M. (2018): Hot weather in Potsdam in the years 1896–2015. Meteorology and Atmospheric Physics, 130, 1, 1–10.
TOMCZYK, A.M., BEDNORZ, E. (2014): Heat and cold waves on the southern coast of the Baltic Sea. Baltica, 27, 1, 44–53.
TOMCZYK, A.M., BEDNORZ, E. (2016): Heat waves in Central Europe and their circulation conditions. International Journal of Climatology, 36, 2, 770–782.
TOMCZYK, A.M., SULIKOWSKA, A. (2017): Heat waves in lowland Germany and their circulation-related conditions. Meteorology and Atmospheric Physics, doi: 10.1007/s00703-017-0549-2.
TOMCZYK, A.M., PIOTROWSKI, P., BEDNORZ, E. (2016): Warm spells in Northern Europe in relation to atmospheric circulation. 0eoretical and Applied Climatology, 128, 3–4, 623–634.
TOMCZYK, A.M., PÓŁROLNICZAK, M., BEDNORZ, E. (2017): Circulation Conditions’ Effect on the Occurrence of Heat Waves in Western and Southwestern Europe. Atmosphere, 8, 31.
TWARDOSZ, R., KOSSOWSKA-CEZAK, U. (2015): Exceptionally hot and cold summers in Europe (1951–2010). Acta Geophysica, 63, 1, 275–300.
UNKAŠEVICA, M., TOŠIC, I. (2009): An analysis of heat waves in Serbia. Global and Planetary Change, 65, 17–26.
UNKAŠEVIĆ, M., TOŠIĆ, I. (2015): Seasonal analysis of cold and heat waves in Serbia during the period 1949–2012. 0eoretical and Applied Climatology, 120, 29–40.
VANDENTORREN, S., SUZAN, R., MEDINA, S., PASCAL, M., MAULPOIX, A., COHEN, J.C., LEDRANS, M. (2004): Mortality in 13 French Cities During the August 2003 Heat Wave. American Journal of Public Health, 94, 9, 1518–1520.
ZACHARIAS, S., KOPPE, CH., MÜCKE, H.–G. (2015): Climate change effects on heat waves and future heat wave–associated IHD mortality in Germany. Climate, 3, 1, 100–117.
acknowledgements
0is work was supported by the Polish National Science Centre under grant number: UMO-2014/15/N/ST10/00717.