e marketer digital_subscriptions-essential_revenue_streams_across_a_wide_range_of_content
TRANSCRIPT

DIGITAL SUBSCRIPTIONSEssential Revenue Streams Across a Wide Range of Content
JULY 2013
Paul Verna
Contributors: Rebecca Chadwick
Read this on eMarketer for iPad
DIGITAL SUBSCRIPTIONS: ESSENTIAL REVENUE STREAMS ACROSS A WIDE RANGE OF CONTENT ©2013 EMARKETER INC. ALL RIGHTS RESERVED 2
CONTENTS2 Executive Summary
3 Movies and Television
6 Music
8 News
9 Sports
10 The Mobile Effect
12 Related eMarketer Reports
12 Related Links
12 Editorial and Production Contributors
EXECUTIVE SUMMARY
In their ongoing quest to build profitable and
sustainable businesses around digital media, content
owners are increasingly turning to subscription
models. Although a sizeable portion of the target
audience remains unwilling to pay for online or
mobile content, many consumers are beginning to
accept the idea that quality comes at a price.
Consumers’ expectations of multiscreen access are helping fuel growth in subscription models. From the end user’s perspective, the implied bargain is something along these lines: “If I’m going to pay a monthly fee to read the news or watch my favorite TV show, I expect to be able to access it on my laptop, tablet, smartphone, connected TV or any other device I choose.”
Universal access isn’t always simple or possible, and content owners are still in a steep learning curve when it comes to monetizing their digital assets. However, the success of subscription models across a range of industries in recent months has caused many to rethink the conventional wisdom that people expect all digital content to be free.
KEY QUESTIONS ■ What are the key metrics behind digital subscription
models in the movie and TV industries?
■ What percentage of the US streaming music
user base is on subscription plans vs. free,
ad-supported services?
■ How are subscription models performing for
newspaper and magazine publishers?
■ How important is mobile access to content owners
pursuing subscription models?
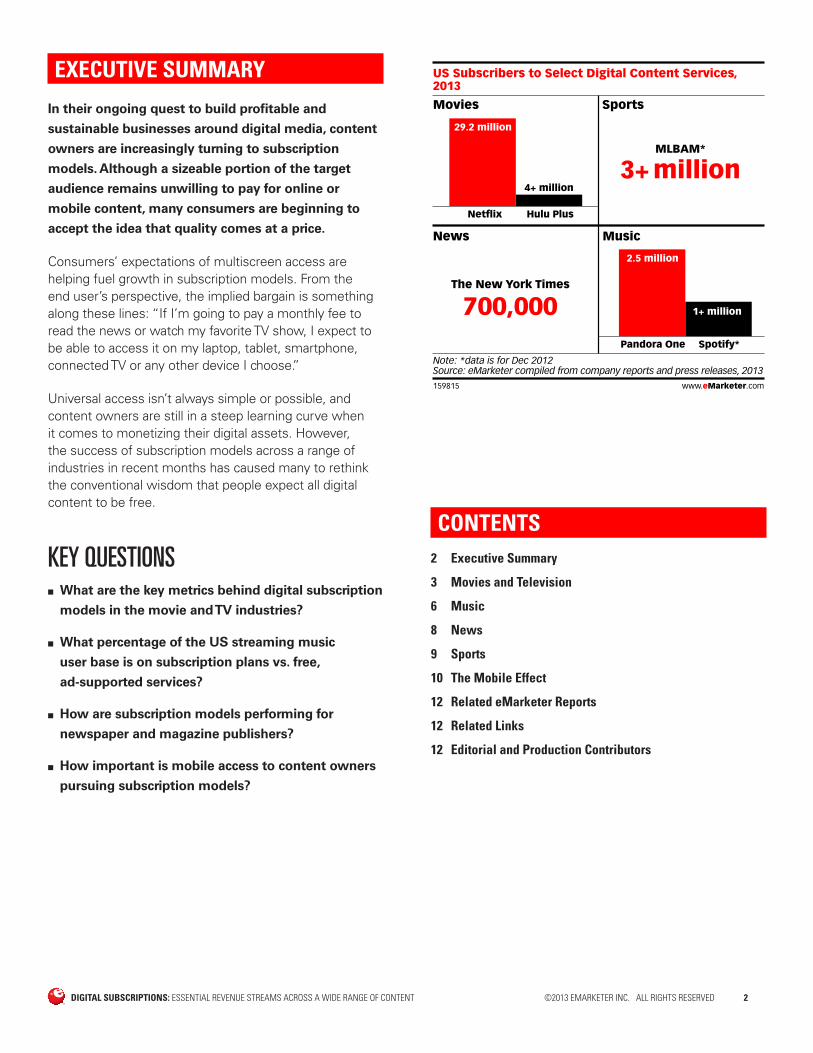
US Subscribers to Select Digital Content Services,2013
Netflix
29.2 million
Hulu Plus
4+ million
Pandora One
The New York Times
700,000
3+ millionMLBAM*
Movies Sports
News Music
2.5 million
Spotify*
1+ million
Note: *data is for Dec 2012Source: eMarketer compiled from company reports and press releases, 2013
159815 www.eMarketer.com
DIGITAL SUBSCRIPTIONS: ESSENTIAL REVENUE STREAMS ACROSS A WIDE RANGE OF CONTENT ©2013 EMARKETER INC. ALL RIGHTS RESERVED 3
MOVIES AND TELEVISION
Recent events have put subscription-based movie and
TV streaming in the forefront. These include:
■ Reports of growing subscriber totals and
subscription revenues from Netflix and Hulu Plus
■ A wave of original content debuts led by Netflix’s
original drama series “House of Cards” and its
revival of the cult sitcom “Arrested Development”
■ News that YouTube plans to roll out its own
subscription-based video service after years of
leadership in the ad-supported streaming field
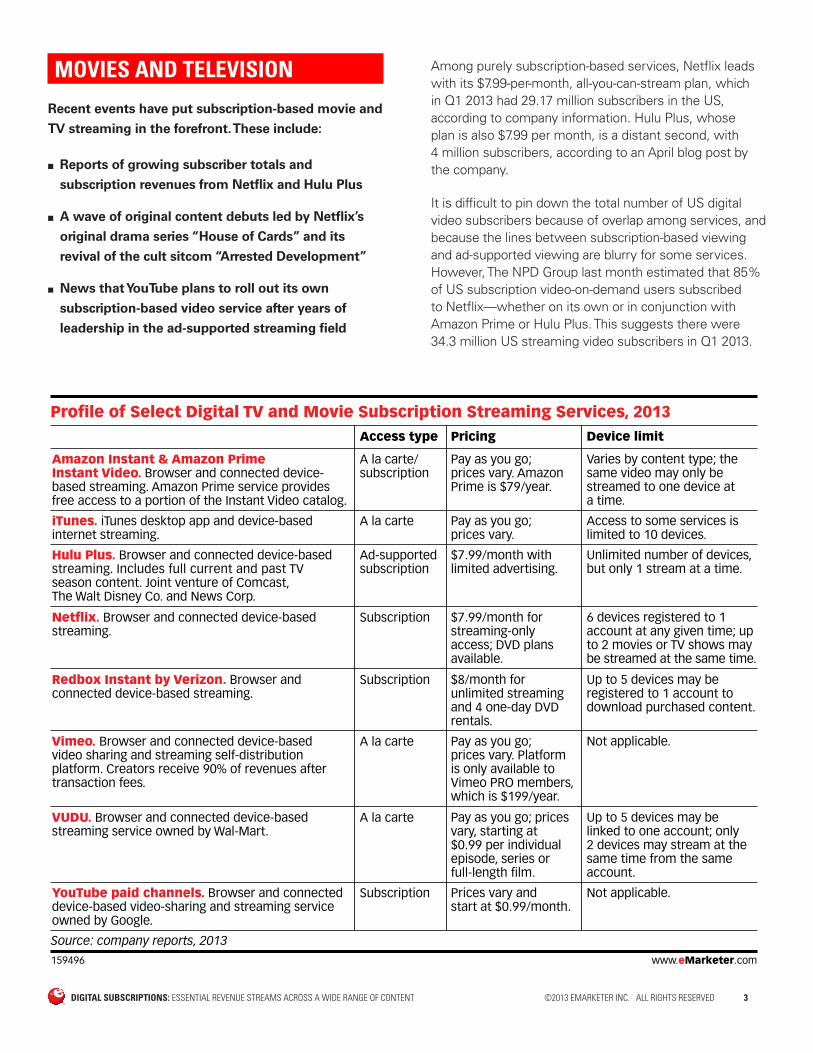
Profile of Select Digital TV and Movie Subscription Streaming Services, 2013
A la carte
Access type
A la carte/subscription
A la carte
Ad-supported subscription
Subscription
Subscription
A la carte
Subscription
Amazon Instant & Amazon Prime Instant Video. Browser and connected device-based streaming. Amazon Prime service provides free access to a portion of the Instant Video catalog.
iTunes. iTunes desktop app and device-based internet streaming.
Hulu Plus. Browser and connected device-basedstreaming. Includes full current and past TV season content. Joint venture of Comcast, The Walt Disney Co. and News Corp.
Netflix. Browser and connected device-based streaming.
Redbox Instant by Verizon. Browser and connected device-based streaming.
Vimeo. Browser and connected device-based video sharing and streaming self-distribution platform. Creators receive 90% of revenues after transaction fees.
VUDU. Browser and connected device-based streaming service owned by Wal-Mart.
YouTube paid channels. Browser and connecteddevice-based video-sharing and streaming serviceowned by Google.
Pricing
Pay as you go; prices vary. AmazonPrime is $79/year.
Pay as you go; prices vary.
$7.99/month with limited advertising.
$7.99/month forstreaming-only access; DVD plansavailable.
$8/month for unlimited streaming and 4 one-day DVD rentals.
Pay as you go; prices vary. Platformis only available toVimeo PRO members, which is $199/year.
Pay as you go; pricesvary, starting at $0.99 per individual episode, series or full-length film.
Prices vary and start at $0.99/month.
Device limit
Varies by content type; the same video may only be streamed to one device at a time.
Access to some services islimited to 10 devices.
Unlimited number of devices, but only 1 stream at a time.
6 devices registered to 1account at any given time; up to 2 movies or TV shows may be streamed at the same time.
Up to 5 devices may be registered to 1 account to download purchased content.
Not applicable.
Up to 5 devices may belinked to one account; only2 devices may stream at thesame time from the sameaccount.
Not applicable.
Source: company reports, 2013
159496 www.eMarketer.com
Among purely subscription-based services, Netflix leads with its $7.99-per-month, all-you-can-stream plan, which in Q1 2013 had 29.17 million subscribers in the US, according to company information. Hulu Plus, whose plan is also $7.99 per month, is a distant second, with 4 million subscribers, according to an April blog post by the company.
It is difficult to pin down the total number of US digital video subscribers because of overlap among services, and because the lines between subscription-based viewing and ad-supported viewing are blurry for some services. However, The NPD Group last month estimated that 85% of US subscription video-on-demand users subscribed to Netflix—whether on its own or in conjunction with Amazon Prime or Hulu Plus. This suggests there were 34.3 million US streaming video subscribers in Q1 2013.
DIGITAL SUBSCRIPTIONS: ESSENTIAL REVENUE STREAMS ACROSS A WIDE RANGE OF CONTENT ©2013 EMARKETER INC. ALL RIGHTS RESERVED 4
Apple and Amazon are the other major competitors in the paid-video field, but neither offers a straight subscription service like Netflix and Hulu Plus. Apple’s iTunes has been an a la carte video download service since 2005, when it branched out into TV and later movie programming from its roots as a music destination. iTunes also offers digital rentals.
Amazon operates the Instant Amazon a la carte download service, which is a direct competitor to iTunes. However, Amazon also offers free streaming to subscribers to its Prime rewards program, which costs $79 a year and includes such perks as free shipping. The latter service is marketed as Amazon Instant Prime Video.
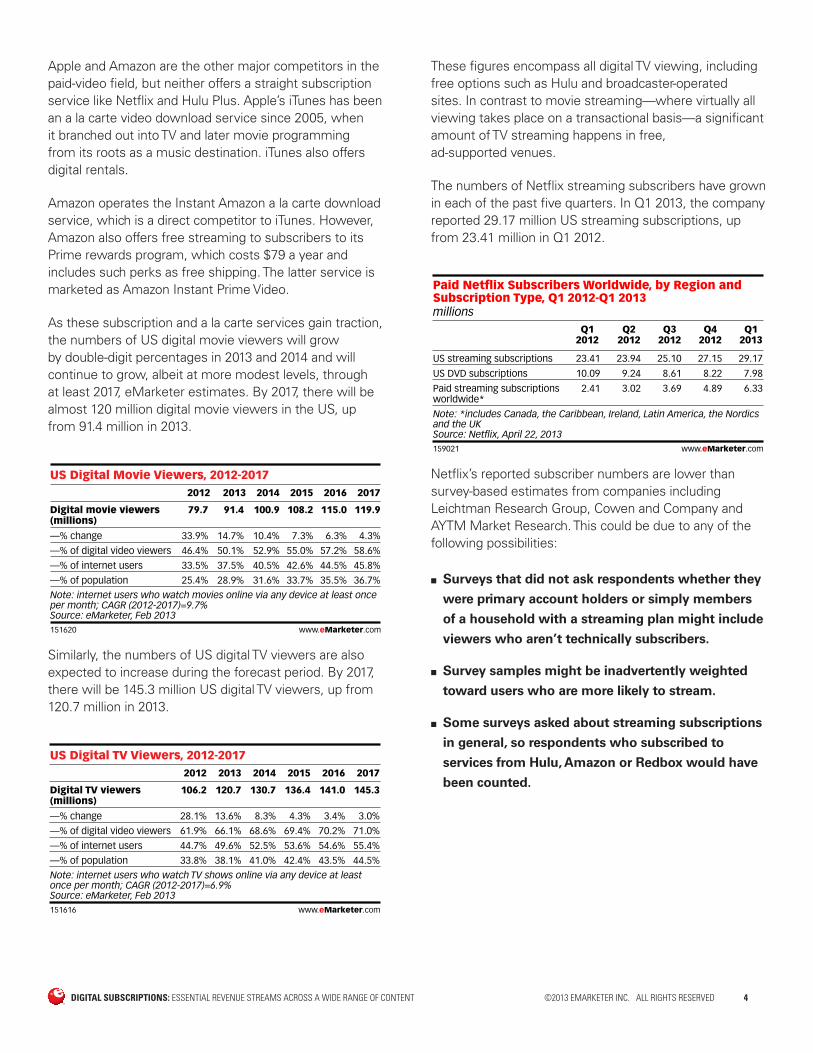
As these subscription and a la carte services gain traction, the numbers of US digital movie viewers will grow by double-digit percentages in 2013 and 2014 and will continue to grow, albeit at more modest levels, through at least 2017, eMarketer estimates. By 2017, there will be almost 120 million digital movie viewers in the US, up from 91.4 million in 2013.
US Digital Movie Viewers, 2012-2017
Digital movie viewers (millions)
—% change
—% of digital video viewers
—% of internet users
—% of population
2012
79.7
33.9%
46.4%
33.5%
25.4%
2013
91.4
14.7%
50.1%
37.5%
28.9%
2014
100.9
10.4%
52.9%
40.5%
31.6%
2015
108.2
7.3%
55.0%
42.6%
33.7%
2016
115.0
6.3%
57.2%
44.5%
35.5%
2017
119.9
4.3%
58.6%
45.8%
36.7%
Note: internet users who watch movies online via any device at least onceper month; CAGR (2012-2017)=9.7%Source: eMarketer, Feb 2013151620 www.eMarketer.com
Similarly, the numbers of US digital TV viewers are also expected to increase during the forecast period. By 2017, there will be 145.3 million US digital TV viewers, up from 120.7 million in 2013.
US Digital TV Viewers, 2012-2017
Digital TV viewers (millions)
—% change
—% of digital video viewers
—% of internet users
—% of population
2012
106.2
28.1%
61.9%
44.7%
33.8%
2013
120.7
13.6%
66.1%
49.6%
38.1%
2014
130.7
8.3%
68.6%
52.5%
41.0%
2015
136.4
4.3%
69.4%
53.6%
42.4%
2016
141.0
3.4%
70.2%
54.6%
43.5%
2017
145.3
3.0%
71.0%
55.4%
44.5%
Note: internet users who watch TV shows online via any device at leastonce per month; CAGR (2012-2017)=6.9%Source: eMarketer, Feb 2013151616 www.eMarketer.com
These figures encompass all digital TV viewing, including free options such as Hulu and broadcaster-operated sites. In contrast to movie streaming—where virtually all viewing takes place on a transactional basis—a significant amount of TV streaming happens in free, ad-supported venues.
The numbers of Netflix streaming subscribers have grown in each of the past five quarters. In Q1 2013, the company reported 29.17 million US streaming subscriptions, up from 23.41 million in Q1 2012.
millions
Paid Netflix Subscribers Worldwide, by Region andSubscription Type, Q1 2012-Q1 2013
US streaming subscriptions
US DVD subscriptions
Paid streaming subscriptionsworldwide*
Q12012
23.41
10.09
2.41
Q22012
23.94
9.24
3.02
Q32012
25.10
8.61
3.69
Q42012
27.15
8.22
4.89
Q12013
29.17
7.98
6.33
Note: *includes Canada, the Caribbean, Ireland, Latin America, the Nordicsand the UKSource: Netflix, April 22, 2013159021 www.eMarketer.com
Netflix’s reported subscriber numbers are lower than survey-based estimates from companies including Leichtman Research Group, Cowen and Company and AYTM Market Research. This could be due to any of the following possibilities:
■ Surveys that did not ask respondents whether they
were primary account holders or simply members
of a household with a streaming plan might include
viewers who aren’t technically subscribers.
■ Survey samples might be inadvertently weighted
toward users who are more likely to stream.
■ Some surveys asked about streaming subscriptions
in general, so respondents who subscribed to
services from Hulu, Amazon or Redbox would have
been counted.
DIGITAL SUBSCRIPTIONS: ESSENTIAL REVENUE STREAMS ACROSS A WIDE RANGE OF CONTENT ©2013 EMARKETER INC. ALL RIGHTS RESERVED 5
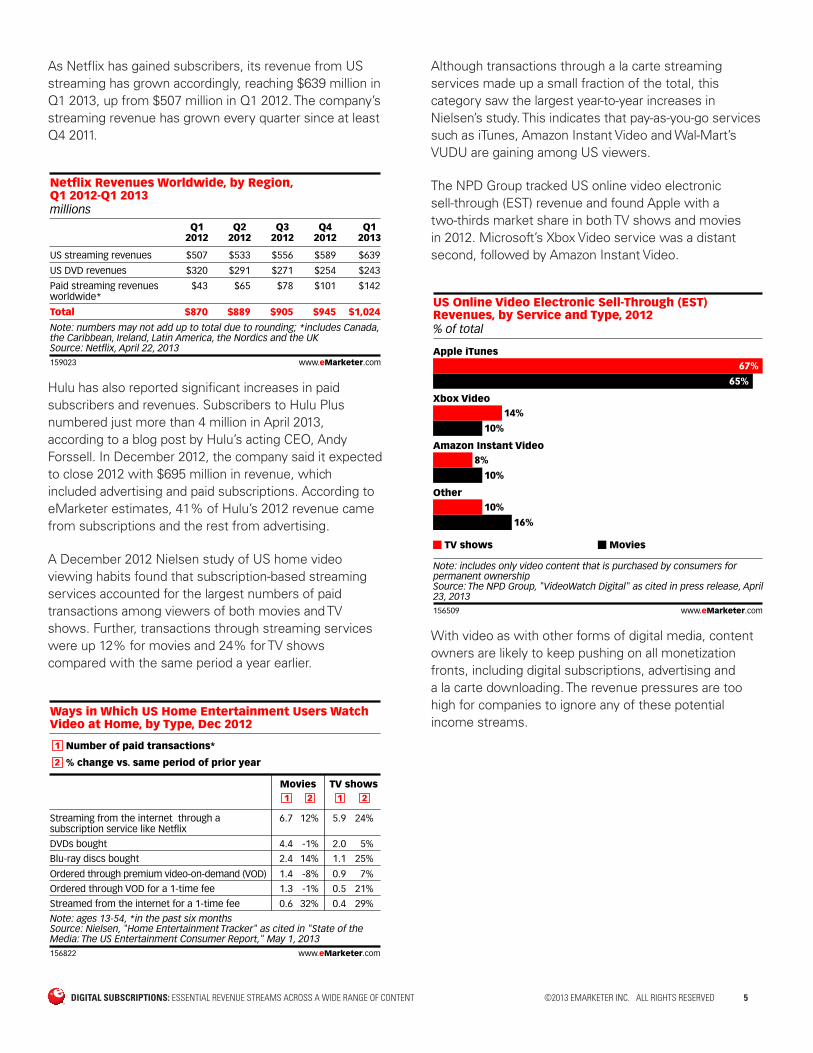
As Netflix has gained subscribers, its revenue from US streaming has grown accordingly, reaching $639 million in Q1 2013, up from $507 million in Q1 2012. The company’s streaming revenue has grown every quarter since at least Q4 2011.
millions
Netflix Revenues Worldwide, by Region, Q1 2012-Q1 2013
US streaming revenues
US DVD revenues
Paid streaming revenuesworldwide*
Total
Q12012
$507
$320
$43
$870
Q22012
$533
$291
$65
$889
Q32012
$556
$271
$78
$905
Q42012
$589
$254
$101
$945
Q12013
$639
$243
$142
$1,024
Note: numbers may not add up to total due to rounding; *includes Canada,the Caribbean, Ireland, Latin America, the Nordics and the UKSource: Netflix, April 22, 2013159023 www.eMarketer.com
Hulu has also reported significant increases in paid subscribers and revenues. Subscribers to Hulu Plus numbered just more than 4 million in April 2013, according to a blog post by Hulu’s acting CEO, Andy Forssell. In December 2012, the company said it expected to close 2012 with $695 million in revenue, which included advertising and paid subscriptions. According to eMarketer estimates, 41% of Hulu’s 2012 revenue came from subscriptions and the rest from advertising.
A December 2012 Nielsen study of US home video viewing habits found that subscription-based streaming services accounted for the largest numbers of paid transactions among viewers of both movies and TV shows. Further, transactions through streaming services were up 12% for movies and 24% for TV shows compared with the same period a year earlier.
Ways in Which US Home Entertainment Users WatchVideo at Home, by Type, Dec 2012
Movies TV shows
Streaming from the internet through asubscription service like Netflix
DVDs bought
Blu-ray discs bought
Ordered through premium video-on-demand (VOD)
Ordered through VOD for a 1-time fee
Streamed from the internet for a 1-time fee
Note: ages 13-54, *in the past six monthsSource: Nielsen, "Home Entertainment Tracker" as cited in "State of theMedia: The US Entertainment Consumer Report," May 1, 2013156822 www.eMarketer.com
Number of paid transactions*
% change vs. same period of prior year
6.7
4.4
2.4
1.4
1.3
0.6
12%
-1%
14%
-8%
-1%
32%
5.9
2.0
1.1
0.9
0.5
0.4
24%
5%
25%
7%
21%
29%
Although transactions through a la carte streaming services made up a small fraction of the total, this category saw the largest year-to-year increases in Nielsen’s study. This indicates that pay-as-you-go services such as iTunes, Amazon Instant Video and Wal-Mart’s VUDU are gaining among US viewers.
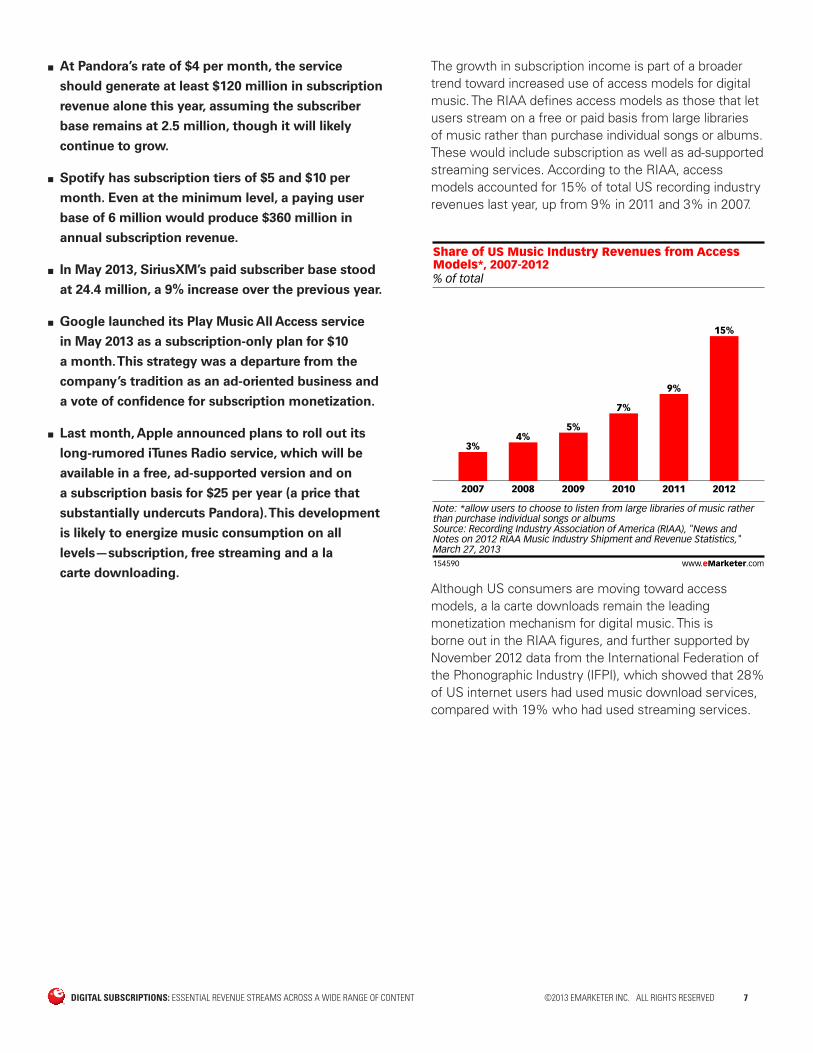
The NPD Group tracked US online video electronic sell-through (EST) revenue and found Apple with a two-thirds market share in both TV shows and movies in 2012. Microsoft’s Xbox Video service was a distant second, followed by Amazon Instant Video.
% of total
US Online Video Electronic Sell-Through (EST)Revenues, by Service and Type, 2012
Apple iTunes67%
65%
Xbox Video14%
10%
Amazon Instant Video8%
10%
Other10%
16%
TV shows Movies
Note: includes only video content that is purchased by consumers forpermanent ownershipSource: The NPD Group, "VideoWatch Digital" as cited in press release, April23, 2013156509 www.eMarketer.com
With video as with other forms of digital media, content owners are likely to keep pushing on all monetization fronts, including digital subscriptions, advertising and a la carte downloading. The revenue pressures are too high for companies to ignore any of these potential income streams.

DIGITAL SUBSCRIPTIONS: ESSENTIAL REVENUE STREAMS ACROSS A WIDE RANGE OF CONTENT ©2013 EMARKETER INC. ALL RIGHTS RESERVED 6
MUSIC
Subscription-based music services are showing
modest growth in the US but lag behind other
digital access modes when it comes to user totals
and revenue.
A May 2013 survey of US subscriber totals to leading paid music streaming services showed Pandora One with 2.5 million and Spotify and Rhapsody with just more than 1 million each. The numbers are subject to overlap since many music fans subscribe to multiple services.
US Paying Subscribers for Select Music Subscription Services
Subscribers(millions)
Pandora One* 2.5+
Rhapsody 1+
Spotify 1+
As of
Q1 2013
March 5, 2013
Dec 6, 2012
Note: *Australia, New Zealand, USSource: company reports, 2012 & 2013159748 www.eMarketer.com
As a point of comparison, these numbers represented a fraction of the subscribers to SiriusXM’s satellite radio service, which had nearly 25 million as of May 2013.
The Recording Industry Association of America (RIAA) noted that US digital music subscription revenues totaled $570.8 million in 2012, a 58.9% increase over 2011. As a percentage of total digital music revenue, the subscription category accounted for 14.1% in 2012, up from 10.1% the previous year.
millions and % change
US Digital Music Shipments and Revenues, by Format,2011 & 2012
Units shipped Revenues
Permanent downloadDownload single
Download album
Music video
Kiosk
Mobile
Subscription & streaming
Subscription
SoundExchangedistributions
TotalSynchronizationroyalties
2011
1,332.3
103.9
16.3
1.3
115.4
1.8
-
--
2012
1,392.2
116.7
10.5
2.0
69.3
3.4
-
--
%change
4.5%
12.3%
-35.6%
55.9%
-40.0%
86.3%
-
--
2011
$1,522.4
$1,070.8
$32.4
$2.7
$276.2
$359.2
$292.0
$3,555.6$196.5
2012
$1,623.6
$1,204.8
$20.8
$3.7
$166.9
$570.8
$462.0
$4,052.7$190.6
%change
6.7%
12.5%
-35.6%
36.6%
-35.6%
58.9%
58.3%
14.0%-3.0%
Note: numbers may not add up to total due to roundingSource: Recording Industry Association of America (RIAA), "News andNotes on 2012 RIAA Music Industry Shipment and Revenue Statistics,"March 27, 2013154919 www.eMarketer.com
The RIAA figures come with caveats. The “subscription” category included ad-supported revenue from on-demand streaming services such as Spotify. Conversely, the “SoundExchange distributions” category included subscription revenue from internet radio broadcasters such as Pandora, which operate under a license agreement with SoundExchange, the recording industry’s royalty collection organization for satellite and internet radio broadcasts.
Notwithstanding this overlap, sizeable jumps in both the subscription and SoundExchange distribution categories indicate increased streaming activity on all fronts, including subscriptions. Other proof points of the growth of subscription-based revenue in the digital music industry include:
■ In Q1 2013, Pandora grew its paid subscriber base to
2.5 million from 1.8 million the previous quarter. On
a year-over-year basis, paid subscribers increased by
114%. The vast majority of these subscribers were
in the US, but Pandora is also available in Australia
and New Zealand.
■ In the three months leading up to March 2013,
Spotify increased its global subscriber base by 20%
to 6 million.
DIGITAL SUBSCRIPTIONS: ESSENTIAL REVENUE STREAMS ACROSS A WIDE RANGE OF CONTENT ©2013 EMARKETER INC. ALL RIGHTS RESERVED 7
■ At Pandora’s rate of $4 per month, the service
should generate at least $120 million in subscription
revenue alone this year, assuming the subscriber
base remains at 2.5 million, though it will likely
continue to grow.
■ Spotify has subscription tiers of $5 and $10 per
month. Even at the minimum level, a paying user
base of 6 million would produce $360 million in
annual subscription revenue.
■ In May 2013, SiriusXM’s paid subscriber base stood
at 24.4 million, a 9% increase over the previous year.
■ Google launched its Play Music All Access service
in May 2013 as a subscription-only plan for $10
a month. This strategy was a departure from the
company’s tradition as an ad-oriented business and
a vote of confidence for subscription monetization.
■ Last month, Apple announced plans to roll out its
long-rumored iTunes Radio service, which will be
available in a free, ad-supported version and on
a subscription basis for $25 per year (a price that
substantially undercuts Pandora). This development
is likely to energize music consumption on all
levels—subscription, free streaming and a la
carte downloading.
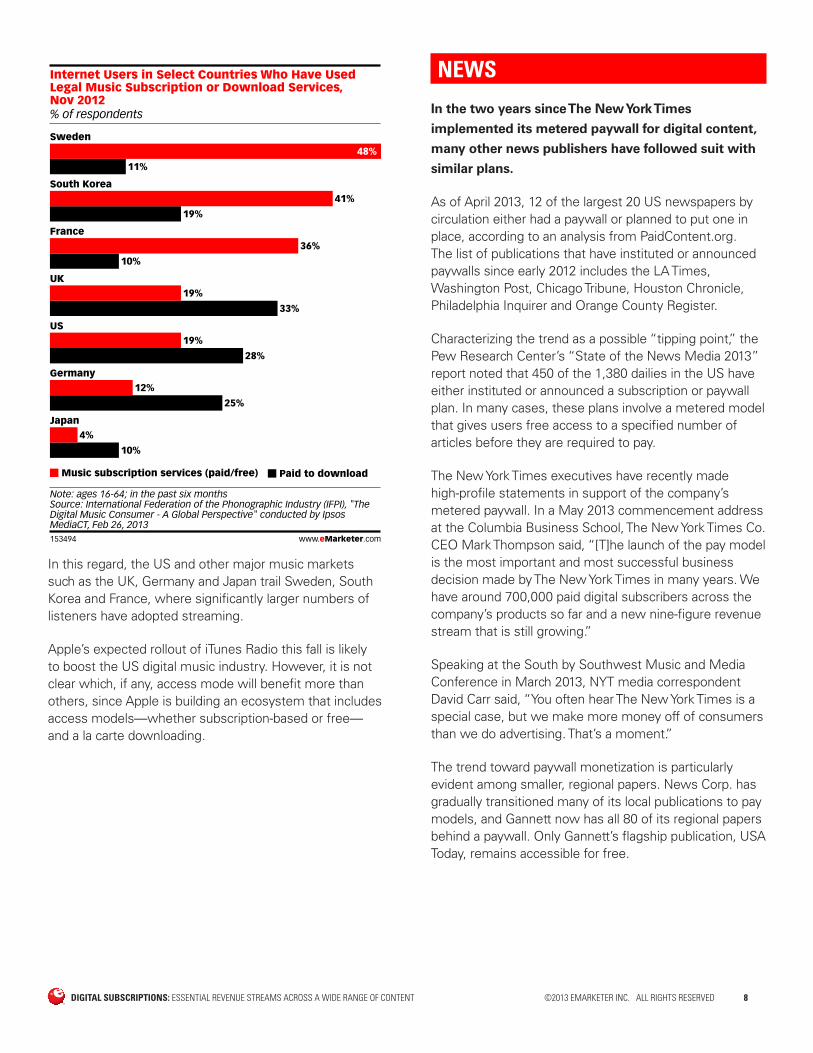
The growth in subscription income is part of a broader trend toward increased use of access models for digital music. The RIAA defines access models as those that let users stream on a free or paid basis from large libraries of music rather than purchase individual songs or albums. These would include subscription as well as ad-supported streaming services. According to the RIAA, access models accounted for 15% of total US recording industry revenues last year, up from 9% in 2011 and 3% in 2007.
% of total
Share of US Music Industry Revenues from AccessModels*, 2007-2012
2007
3%
2008
4%
2009
5%
2010
7%
2011
9%
2012
15%
Note: *allow users to choose to listen from large libraries of music ratherthan purchase individual songs or albumsSource: Recording Industry Association of America (RIAA), "News andNotes on 2012 RIAA Music Industry Shipment and Revenue Statistics,"March 27, 2013154590 www.eMarketer.com
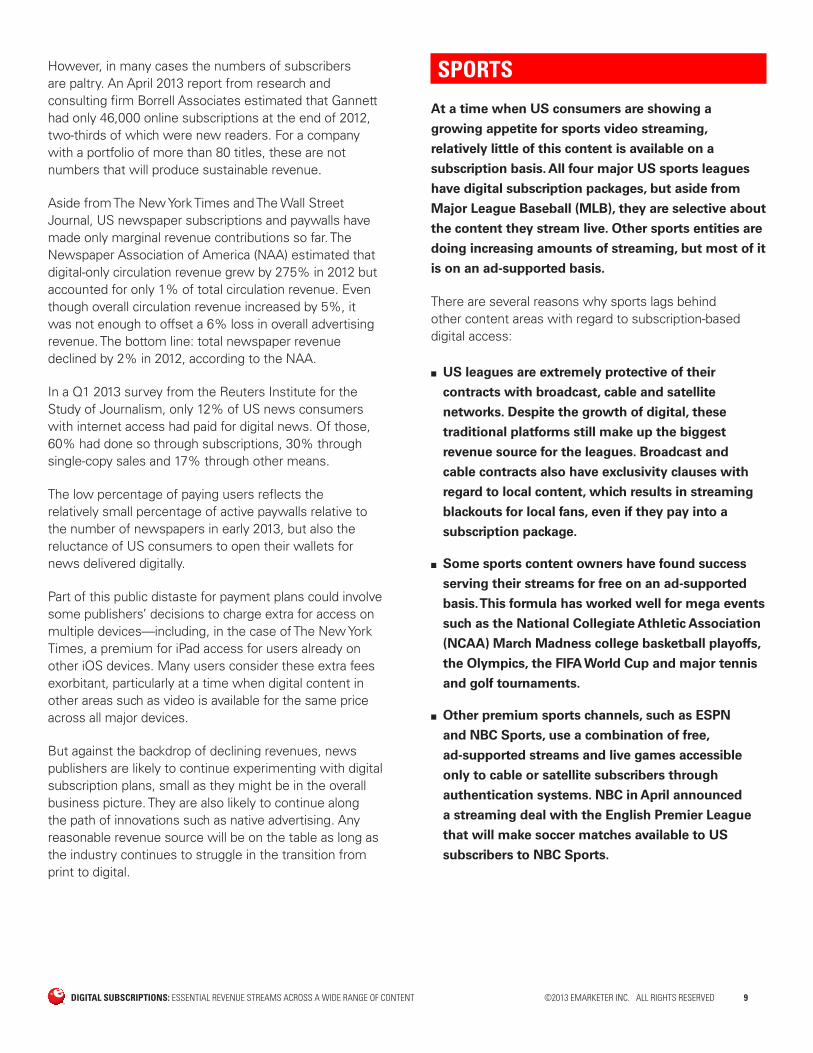
Although US consumers are moving toward access models, a la carte downloads remain the leading monetization mechanism for digital music. This is borne out in the RIAA figures, and further supported by November 2012 data from the International Federation of the Phonographic Industry (IFPI), which showed that 28% of US internet users had used music download services, compared with 19% who had used streaming services.
DIGITAL SUBSCRIPTIONS: ESSENTIAL REVENUE STREAMS ACROSS A WIDE RANGE OF CONTENT ©2013 EMARKETER INC. ALL RIGHTS RESERVED 8
% of respondents
Internet Users in Select Countries Who Have UsedLegal Music Subscription or Download Services, Nov 2012
Sweden48%
11%
South Korea41%
19%
France36%
10%
UK19%
33%
US19%
28%
Germany12%
25%
Japan4%
10%
Music subscription services (paid/free) Paid to download
Note: ages 16-64; in the past six monthsSource: International Federation of the Phonographic Industry (IFPI), "TheDigital Music Consumer - A Global Perspective" conducted by IpsosMediaCT, Feb 26, 2013153494 www.eMarketer.com
In this regard, the US and other major music markets such as the UK, Germany and Japan trail Sweden, South Korea and France, where significantly larger numbers of listeners have adopted streaming.
Apple’s expected rollout of iTunes Radio this fall is likely to boost the US digital music industry. However, it is not clear which, if any, access mode will benefit more than others, since Apple is building an ecosystem that includes access models—whether subscription-based or free—and a la carte downloading.
NEWS
In the two years since The New York Times
implemented its metered paywall for digital content,
many other news publishers have followed suit with
similar plans.
As of April 2013, 12 of the largest 20 US newspapers by circulation either had a paywall or planned to put one in place, according to an analysis from PaidContent.org. The list of publications that have instituted or announced paywalls since early 2012 includes the LA Times, Washington Post, Chicago Tribune, Houston Chronicle, Philadelphia Inquirer and Orange County Register.
Characterizing the trend as a possible “tipping point,” the Pew Research Center’s “State of the News Media 2013” report noted that 450 of the 1,380 dailies in the US have either instituted or announced a subscription or paywall plan. In many cases, these plans involve a metered model that gives users free access to a specified number of articles before they are required to pay.
The New York Times executives have recently made high-profile statements in support of the company’s metered paywall. In a May 2013 commencement address at the Columbia Business School, The New York Times Co. CEO Mark Thompson said, “[T]he launch of the pay model is the most important and most successful business decision made by The New York Times in many years. We have around 700,000 paid digital subscribers across the company’s products so far and a new nine-figure revenue stream that is still growing.”
Speaking at the South by Southwest Music and Media Conference in March 2013, NYT media correspondent David Carr said, “You often hear The New York Times is a special case, but we make more money off of consumers than we do advertising. That’s a moment.”
The trend toward paywall monetization is particularly evident among smaller, regional papers. News Corp. has gradually transitioned many of its local publications to pay models, and Gannett now has all 80 of its regional papers behind a paywall. Only Gannett’s flagship publication, USA Today, remains accessible for free.
DIGITAL SUBSCRIPTIONS: ESSENTIAL REVENUE STREAMS ACROSS A WIDE RANGE OF CONTENT ©2013 EMARKETER INC. ALL RIGHTS RESERVED 9
However, in many cases the numbers of subscribers are paltry. An April 2013 report from research and consulting firm Borrell Associates estimated that Gannett had only 46,000 online subscriptions at the end of 2012, two-thirds of which were new readers. For a company with a portfolio of more than 80 titles, these are not numbers that will produce sustainable revenue.
Aside from The New York Times and The Wall Street Journal, US newspaper subscriptions and paywalls have made only marginal revenue contributions so far. The Newspaper Association of America (NAA) estimated that digital-only circulation revenue grew by 275% in 2012 but accounted for only 1% of total circulation revenue. Even though overall circulation revenue increased by 5%, it was not enough to offset a 6% loss in overall advertising revenue. The bottom line: total newspaper revenue declined by 2% in 2012, according to the NAA.
In a Q1 2013 survey from the Reuters Institute for the Study of Journalism, only 12% of US news consumers with internet access had paid for digital news. Of those, 60% had done so through subscriptions, 30% through single-copy sales and 17% through other means.
The low percentage of paying users reflects the relatively small percentage of active paywalls relative to the number of newspapers in early 2013, but also the reluctance of US consumers to open their wallets for news delivered digitally.
Part of this public distaste for payment plans could involve some publishers’ decisions to charge extra for access on multiple devices—including, in the case of The New York Times, a premium for iPad access for users already on other iOS devices. Many users consider these extra fees exorbitant, particularly at a time when digital content in other areas such as video is available for the same price across all major devices.
But against the backdrop of declining revenues, news publishers are likely to continue experimenting with digital subscription plans, small as they might be in the overall business picture. They are also likely to continue along the path of innovations such as native advertising. Any reasonable revenue source will be on the table as long as the industry continues to struggle in the transition from print to digital.
SPORTS
At a time when US consumers are showing a
growing appetite for sports video streaming,
relatively little of this content is available on a
subscription basis. All four major US sports leagues
have digital subscription packages, but aside from
Major League Baseball (MLB), they are selective about
the content they stream live. Other sports entities are
doing increasing amounts of streaming, but most of it
is on an ad-supported basis.
There are several reasons why sports lags behind other content areas with regard to subscription-based digital access:
■ US leagues are extremely protective of their
contracts with broadcast, cable and satellite
networks. Despite the growth of digital, these
traditional platforms still make up the biggest
revenue source for the leagues. Broadcast and
cable contracts also have exclusivity clauses with
regard to local content, which results in streaming
blackouts for local fans, even if they pay into a
subscription package.
■ Some sports content owners have found success
serving their streams for free on an ad-supported
basis. This formula has worked well for mega events
such as the National Collegiate Athletic Association
(NCAA) March Madness college basketball playoffs,
the Olympics, the FIFA World Cup and major tennis
and golf tournaments.
■ Other premium sports channels, such as ESPN
and NBC Sports, use a combination of free,
ad-supported streams and live games accessible
only to cable or satellite subscribers through
authentication systems. NBC in April announced
a streaming deal with the English Premier League
that will make soccer matches available to US
subscribers to NBC Sports.

DIGITAL SUBSCRIPTIONS: ESSENTIAL REVENUE STREAMS ACROSS A WIDE RANGE OF CONTENT ©2013 EMARKETER INC. ALL RIGHTS RESERVED 10
■ Notwithstanding the agreement between the
Premier League and NBC, most broadcast and
streaming rights to potentially lucrative European
soccer leagues and tournaments are fragmented
and subject to territorial restrictions. This lack
of uniformity has inhibited the sport’s global
and European governing bodies—FIFA and the
Union of European Football Associations (UEFA),
respectively—from monetizing digital content
through subscriptions.
■ The live nature of sports lends itself to
appointment viewing, which is still a forte of
traditional platforms.
A May 2013 report from Kantar Media, TV Sports Markets and Sporting News Media estimated that only 9% of US sports fans had paid to watch sports online in the past 12 months. Most had done so through a subscription to a website or app, as opposed to a one-time fee. In 2013, 11% of US sports fans said they were willing to pay for sports online, down from 15% in 2012.
The exception among US sports leagues is the MLB, which in 2000 pioneered subscription-based streaming and has continued to lead the way in that area. Robert Bowman, CEO of MLB Advanced Media (MLBAM), the league’s digital division, said the entity earned approximately $650 million in revenue in 2012, of which $250 million came from content subscriptions.
Furthermore, Forbes estimated that in 2012, MLBAM had more than 3 million subscribers to its digital products, which included MLB.tv and the MLB.com At Bat mobile app. Forbes also said the app was downloaded 6.7 million times that year, which was more than twice the combined totals from 2010 and 2011. This made At Bat the top-grossing sports app of all time.
THE MOBILE EFFECT
As consumers become accustomed to accessing
content on all screens, mobile is helping drive growth
in digital media subscription revenues.
eMarketer forecasts that subscription-based mobile video revenues will top $2 billion by 2017, up from $1.25 billion in 2013. This content includes mobile-only subscription revenues as well as a portion of revenues from cross-platform subscription bundles.
millionsUS Mobile Video Revenues, by Type, 2011-2017
Subscription-based*
Ad-supported
Pay-per-view download
Total
2011
$650
$46
$39
$735
2012
$1,051
$158
$107
$1,316
2013
$1,251
$331
$148
$1,730
2014
$1,508
$583
$208
$2,298
2015
$1,665
$903
$270
$2,838
2016
$1,874
$1,274
$316
$3,463
2017
$2,054
$1,611
$349
$4,015
Note: numbers may not add up to total due to rounding; includes tablets;*includes mobile-only subscription revenues and a portion of revenuesfrom cross-device subscription bundles, based on the share of contentconsumed on mobile devicesSource: eMarketer, April 2013154411 www.eMarketer.com
Within the mobile video space, subscription-based viewing is the largest revenue category but not the fastest growing. Revenues from both ad-supported and pay-per-view download viewing are expected to grow faster than subscriptions.
On the music side, subscriptions fall between ad-supported and download revenues in terms of dollar volume and projected growth. eMarketer expects US subscription-based mobile music to generate $230 million in 2017, up from $103 this year. During the same period, ad-supported music will grow to $2.8 billion from $824 million, and downloads to $107 million from $88 million.
millionsUS Mobile Music Revenues, by Type, 2011-2017
Ad-supported
Subscription-based*
Download
Total
2011
$241
$35
$33
$309
2012
$512
$71
$79
$662
2013
$824
$103
$88
$1,015
2014
$1,314
$153
$96
$1,564
2015
$1,894
$205
$103
$2,201
$216
$106
2016
$2,372
$2,693
2017
$2,806
$230
$107
$3,143Note: numbers may not add up to total due to rounding; includes tablets;*includes mobile-only subscription revenues and a portion of revenuesfrom cross-device subscription bundles, based on the share of contentconsumed on mobile devicesSource: eMarketer, April 2013154414 www.eMarketer.com
DIGITAL SUBSCRIPTIONS: ESSENTIAL REVENUE STREAMS ACROSS A WIDE RANGE OF CONTENT ©2013 EMARKETER INC. ALL RIGHTS RESERVED 11
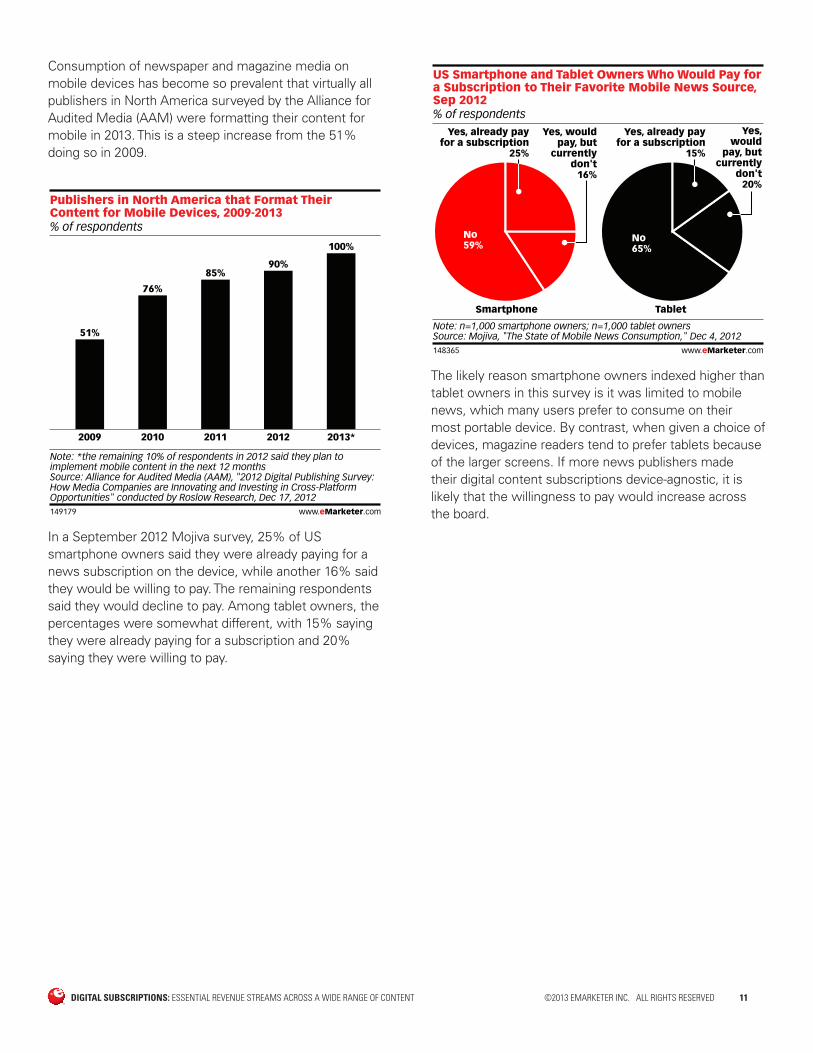
Consumption of newspaper and magazine media on mobile devices has become so prevalent that virtually all publishers in North America surveyed by the Alliance for Audited Media (AAM) were formatting their content for mobile in 2013. This is a steep increase from the 51% doing so in 2009.
% of respondents
Publishers in North America that Format TheirContent for Mobile Devices, 2009-2013
2009
51%
2010
76%
2011
85%
2012
90%
2013*
100%
Note: *the remaining 10% of respondents in 2012 said they plan toimplement mobile content in the next 12 monthsSource: Alliance for Audited Media (AAM), "2012 Digital Publishing Survey:How Media Companies are Innovating and Investing in Cross-PlatformOpportunities" conducted by Roslow Research, Dec 17, 2012149179 www.eMarketer.com
In a September 2012 Mojiva survey, 25% of US smartphone owners said they were already paying for a news subscription on the device, while another 16% said they would be willing to pay. The remaining respondents said they would decline to pay. Among tablet owners, the percentages were somewhat different, with 15% saying they were already paying for a subscription and 20% saying they were willing to pay.
Smartphone Tablet
% of respondents
US Smartphone and Tablet Owners Who Would Pay fora Subscription to Their Favorite Mobile News Source, Sep 2012
Yes, wouldpay, but
currentlydon't
16%
No59%
No65%
Yes, already payfor a subscription
25%
Yes,would
pay, butcurrently
don't20%
Yes, already payfor a subscription
15%
Note: n=1,000 smartphone owners; n=1,000 tablet ownersSource: Mojiva, "The State of Mobile News Consumption," Dec 4, 2012148365 www.eMarketer.com
The likely reason smartphone owners indexed higher than tablet owners in this survey is it was limited to mobile news, which many users prefer to consume on their most portable device. By contrast, when given a choice of devices, magazine readers tend to prefer tablets because of the larger screens. If more news publishers made their digital content subscriptions device-agnostic, it is likely that the willingness to pay would increase across the board.
DIGITAL SUBSCRIPTIONS: ESSENTIAL REVENUE STREAMS ACROSS A WIDE RANGE OF CONTENT ©2013 EMARKETER INC. ALL RIGHTS RESERVED 12
RELATED EMARKETER REPORTS
Digital TV and Movie Streaming: A Rising Tide of Devices Content and Viewing
Internet Radio: Marketers Move In
Magazine and Newspaper Epublishing: Opportunities and Challenges of the Digital Transition
Digital Video and TV Advertising: 16 Forces that Will Help or Hinder Integration
RELATED LINKS
Alliance for Audited Media (AAM)
Hulu
International Federation of the Phonographic Industry (IFPI)
MLBAM
Mojiva
Netflix
New York Times
Nielsen
NPD Group
Pandora
Recording Industry Association of America (RIAA)
SiriusXM
Spotify
EDITORIAL AND PRODUCTION CONTRIBUTORS
Cliff Annicelli Senior EditorKaitlin Carlin Copy EditorJoanne DiCamillo Senior Production ArtistStephanie Gehrsitz Senior Production ArtistDana Hill Director of ProductionHeather Price Copy EditorNicole Perrin Associate Editorial DirectorAllie Smith Director of Charts