e-issn 2392-3458 problems of agricultural...
TRANSCRIPT

Problems of Agricultural Economics
AGNIESZKA SOMPOLSKA-RZECHUŁA 10.5604/00441600.1225666MICHAŁ ŚWITŁYKWest Pomeranian University of TechnologySzczecin
FACTORS AFFECTING PROBABILITY OF INCOME INCREASE IN AGRICULTURAL HOLDINGS SPECIALISED
IN MILK PRODUCTION
SummaryThe paper uses logistic regression model to determine factors affect-
ing probability of income increase in agricultural holdings specialised in milk production. Analysis had a dynamic character and covered the period between 2009 and 2011. Independent variables included both quality and quantity features associated with farm activities. The analysis showed that, in each year, the most important variables in the logit model concerned the utilised agricultural area and the number of dairy cows, which had a positive impact on probability of income increase. All estimated models are charac-terised by high quality and thus can be used to correctly classify agricultural holdings.
Keywords: income, agricultural holdings, milk production, logit model.
The significance of milk production in Poland is evidenced by the data of the national agricultural census – cattle rearing in 454 thousand of farms secured livelihood for ca. 2 million rural residents (Ziętara, 2013).
The share of animal production in the structure of global output of agriculture in 2009-2011 dropped from 47.7% (2009) to 43.7% (2011). The production of milk, live cattle and calves in the researched years was at ca. 20% of the global
Problems of Agricultural Economics
4(349) 2016, 107-120
p-ISSN 0044-1600e-ISSN 2392-3458
www.zer.waw.pl
Translation from Polish
-
-
-
-
-
Agnieszka Sompolska-Rzechuła, Michał Świtłyk108
4(349) 2016
output. The share of animal production in the structure of commercial produc-tion of agriculture was characterised by similar trends: from 56.5% in 2009 it dropped to 53.4% in 2011. But then, the share of cattle, calves and milk in the analysed period was stable (23-24%, including milk at 17-18%).
This research is to identify the factors of improvement of the revenues of farms specialising in milk production. It was based on information from the Polish Farm Accountancy Data Network (Polish FADN). The surveyed group amounted to 670 farms and the research period covered the years between 2009 and 2011. The data concerned farms of type 45, i.e. holdings specialising in dairy cattle rearing. Given the fact that the level of specialisation of the surveyed farms was different, their percentage share was calculated in the value of sales of milk and milk products in total output value. The calculated coefficient was used to correct costs, assuming their proportional allocation to respective sec-tions and branches.
The variables concerning farming activity included both qualitative and quan-titative variables, and logit model was used to achieve the aim which helped to estimate the probability of better revenues of farms. Logistic regression gains increasingly more recognition in many disciplines of science, such as: medicine, psychology, technical sciences, banking, insurances, demography and econom-ics. Examples of works applying the logit model include: (Jackowska and Wy-cinka, 2011; Kmieć, 2015; Kowerski, Bielak and Długosz, 2006; Kasprzyk and Fura, 2011).
Research method Logistic regression model (similarly to the multiple linear regression) al-
lows for researching the impact of many independent variables X1 ..., Xk on the dependent variable Y. The dependant variable has only two values and is dichotomous. The two values are coded as 1 and 0, where: value 1 stands for the presence of one property, and 0 for absence of the given property (Hosmer and Lemenshow, 2000). Logistic function is used in the logit regression to describe the below correlation (Stanisz, 2007):
(1)
This function takes values from the range (0;1) and its graph resembles an elongated letter S. It is possible to separate three stages of changes in the func-tion value: initially to a certain threshold value they practically do not change the probability, upon reaching the threshold value probability abruptly grows to one and stays at the level. Such a function has many applications to the descrip-tion of phenomena in medicine, epidemiology, psychology and economics, e.g. disease risk, chance of recovery, ability to find a job, etc.
-
-
-
-
-

Factors affecting probability of income increase in agricultural holdings 109
Problems of Agricultural Economics
Logistic model is a very good tool to consider probability of presence of a given event. It enables to present how the probability of presence of the re-searched event depends on some variables which can be both quantitative and qualitative. The logistic model makes it possible to devise a mathematical for-mula – which is its advantage – and that formula will be used to determine the strength and direction of impact of respective variables on the modelled event. Additionally the logistic regression model does not require certain assumptions necessary for linear regression. The vector of independent variables and the rest do not have to have a normal distribution. An additional advantage of logistic regression is the fact that analysis and interpretation of results are similar as in classical regression models.
Logistic regression model for dichotomous variable Y is determined by the following correlation (Maddala, 2008; Stanisz, 2007):
(2)
where: α0,α1,...,αk, – are coefficients of logistic regression, and X1,…,Xk – are independ-ent variables, which can have both qualitative and quantitative character.
Transforming the logistic model (2) by calculating its logarithm, gives odds ratio, which should be understood as the relation of probability of presence of a given event to the probability of its absence. The natural logarithm of odds is known as logit (Stanisz, 2007; Cramer, 2003; Kleinbaum and Klein, 2002):
(3)
This equality is a logit form of a logistic model. In the logit model, the log- -odds of a presence of an event is a linear function of independent variables.
Upon estimation of the parameters of logistic regression model it is possible to establish the theoretical value of the Y variable according to the standard rule of forecasting:
(4)
where: – theoretical probabilities obtained on the basis of logistic regression model
estimated on a random sample.
1, if 0.5 < ≤ 10, if 0 < ≤ 0.5
-
-
-
-
-
Agnieszka Sompolska-Rzechuła, Michał Świtłyk110
4(349) 2016
When the sample is unbalanced, i.e. the number of ones is considerably dif-ferent then the number of zeros, modification of the standard rule may be used to forecast theoretical values and forecasts may be computed by the rule of op-timum limit value α:
(5)
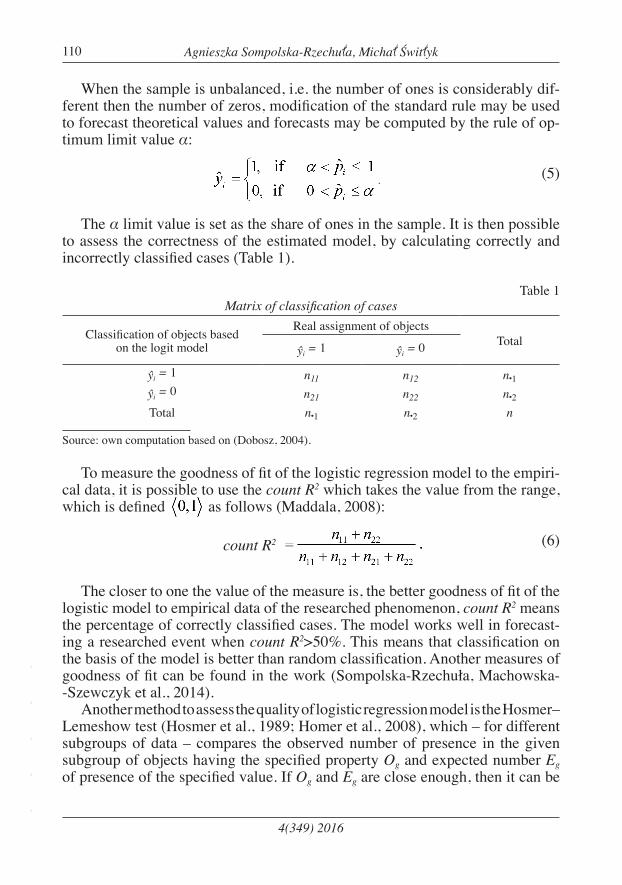
The α limit value is set as the share of ones in the sample. It is then possible to assess the correctness of the estimated model, by calculating correctly and incorrectly classified cases (Table 1).
Table 1Matrix of classification of cases
Classification of objects based on the logit model
Real assignment of objectsTotal
ŷi = 1 ŷi = 0
ŷi = 1 n11 n12 n•1
ŷi = 0 n21 n22 n•2
Total n•1 n•2 n
Source: own computation based on (Dobosz, 2004).
To measure the goodness of fit of the logistic regression model to the empiri-cal data, it is possible to use the count R2 which takes the value from the range, which is defined as follows (Maddala, 2008):
(6)
The closer to one the value of the measure is, the better goodness of fit of the logistic model to empirical data of the researched phenomenon, count R2 means the percentage of correctly classified cases. The model works well in forecast-ing a researched event when count R2>50%. This means that classification on the basis of the model is better than random classification. Another measures of goodness of fit can be found in the work (Sompolska-Rzechuła, Machowska- -Szewczyk et al., 2014).
Another method to assess the quality of logistic regression model is the Hosmer– Lemeshow test (Hosmer et al., 1989; Homer et al., 2008), which – for different subgroups of data – compares the observed number of presence in the given subgroup of objects having the specified property Og and expected number Eg of presence of the specified value. If Og and Eg are close enough, then it can be
count R2
-
-
-
-
-

Factors affecting probability of income increase in agricultural holdings 111
Problems of Agricultural Economics
assumed that a well-fitted model has been constructed. Usually, observations are divided for calculations into G subgroups with the use of, e.g., deciles. The hypotheses in the test have the following form:
H0 : Og = Eg for all categories,H1 : Og ≠ Eg for at least one category.
The value of test statistics is devised as follows:
where:Ng – number of observations in a group g, g ϵ {1,...G}.
This statistics has asymptotic distribution χ2 with G-2 degrees of freedom.
The assessment of the quality of logit model uses, apart from various meas-ures, also the Receiver Operating Characteristic (ROC) curve which is con-structed on the basis of dependent variable value and expected probability of dependent variable, making it possible to assess the abilities of the constructed logistic regression model to classify the cases in two groups: having a specific property and not having a specific property. The ROC curve is created by com-bining points with the following coordinates (1-specificity, sensitivity). Sensi-tivity means the ability to detect units that have the specified property:
sensitivity (7)
Whereas specificity describes the ability to find units not having the specified property:
specificity (8)
Thus the created curve and especially the area underneath it, illustrate the classification quality of a model. When the ROC curve overlaps with the diago-nal y = x, then the decision on assignment of a given case to a selected class (1) or (0) made on the basis of the model is as good as the random distribution of the researched cases into these groups. The classification quality of the model is good when the curve is much above the diagonal y = x, i.e. when the area underneath the ROC curve is much larger than 0.5.
-
-
-
-
-

Agnieszka Sompolska-Rzechuła, Michał Świtłyk112
4(349) 2016
Characteristic of farmsThe following variables were adopted to assess the revenues achieved by
farms:Y – revenues on sales of: milk, live cattle and subsidies (PLN thousand),X1 – utilised agricultural area (ha),X2 – number of dairy cows (LU)1,X3 – yield-forming inputs, which comprise: seeds, fertilisers and plant protec-
tion products (PLN),X4 – fodder from purchase (PLN),X5 – other direct costs of animal production (PLN),X6 – upkeep costs of machines and buildings (PLN),X7 – costs of energy (PLN),X8 – other overheads (PLN),X9 – depreciation costs (PLN),X10 – presence of a successor (-1 – no successor, 0 – not applicable, 1 – suc-
cessor),X11 – age (years),X12 – sex (1 – woman, 2 – man),X13 – education (1 – primary, 2 – vocational, 3 – vocational agricultural, 4 – sec-
ondary, 5 – secondary agricultural, 6 – higher, 7 – higher agricultural).
In the research period, 2009-2011, the values of variables: Y, X1, X2, X3, X4, X5, X6, X7, X8, X9 clearly increased. Revenues on sales increased yearly by 16.9%. Utilised agricultural area also increased on average by 1.69% and the number of cows by 1.61%. The yield-forming inputs also increased on average by 3.75%. The costs linked to purchase of fodder grew yearly by an average of 9.36%. Among other costs, the highest increase was noted for the costs of energy (by an average of 16.62%) and upkeep costs of machines and buildings (by 6.37%). Depreciation costs increased the least (by an average of 3.54%). In the analysed years the average age of a farm manager also changed – from 44 years in 2009 to 45.6 years in 2011.
In 2009, 18% of researched farms did not have a successor and in 2011 – al-ready 21%. In 2009, 17% of farms had a successor and in 2011 – 20%. The share of farms managed by women increased by one percentage point (from 13% to 14%). However, the structure of farms in the researched period did not change as regards education of the farm manager. The largest share of farms (29%) was run by managers having vocational agricultural education, 25% by managers
1 LU – Livestock Unit.
-
-
-
-
-
Factors affecting probability of income increase in agricultural holdings 113
Problems of Agricultural Economics
having secondary agricultural education, and 10% by managers having primary education. Only for 5% of farms managers had higher or higher agricultural education.
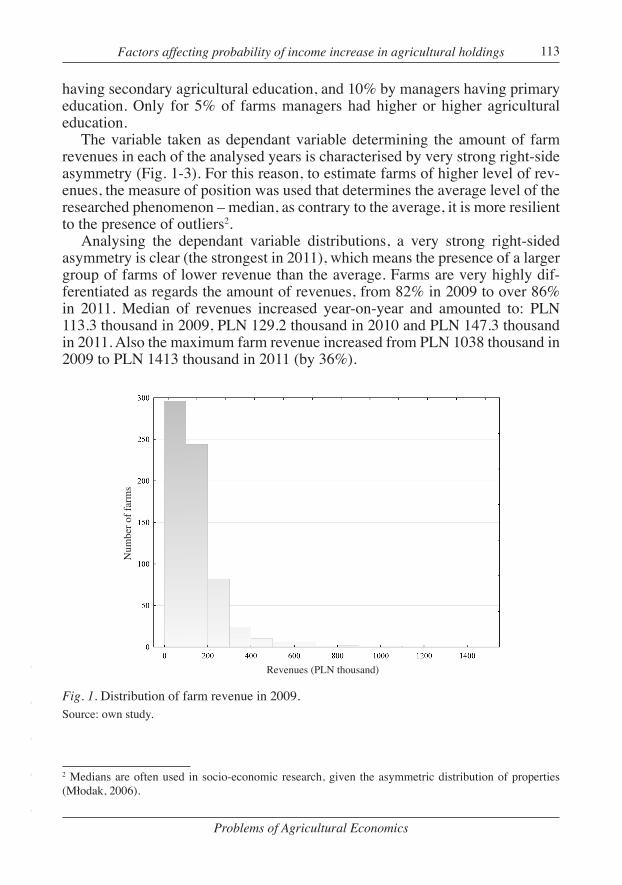
The variable taken as dependant variable determining the amount of farm revenues in each of the analysed years is characterised by very strong right-side asymmetry (Fig. 1-3). For this reason, to estimate farms of higher level of rev-enues, the measure of position was used that determines the average level of the researched phenomenon – median, as contrary to the average, it is more resilient to the presence of outliers2.
Analysing the dependant variable distributions, a very strong right-sided asymmetry is clear (the strongest in 2011), which means the presence of a larger group of farms of lower revenue than the average. Farms are very highly dif-ferentiated as regards the amount of revenues, from 82% in 2009 to over 86% in 2011. Median of revenues increased year-on-year and amounted to: PLN 113.3 thousand in 2009, PLN 129.2 thousand in 2010 and PLN 147.3 thousand in 2011. Also the maximum farm revenue increased from PLN 1038 thousand in 2009 to PLN 1413 thousand in 2011 (by 36%).
Fig. 1. Distribution of farm revenue in 2009.Source: own study.
2 Medians are often used in socio-economic research, given the asymmetric distribution of properties (Młodak, 2006).
Num
ber o
f far
ms
Revenues (PLN thousand)
-
-
-
-
-

Agnieszka Sompolska-Rzechuła, Michał Świtłyk114
4(349) 2016
Fig. 2. Distribution of farm revenue in 2010.Source: own study.
Fig. 3. Distribution of farm revenue in 2011.Source: own study.
Num
ber o
f far
ms
Revenues (PLN thousand)
Num
ber o
f far
ms
Revenues (PLN thousand)
-
-
-
-
-
Factors affecting probability of income increase in agricultural holdings 115
Problems of Agricultural Economics
Modelling results using logit regressionBecause independent variables include both qualitative and quantitative vari-
ables, logit regression model was used to realise the objective. Dependant variable was determined in a binary manner as a level of revenue equalling at least the median value (value 1) and adopting the value below the median (value 0).
In order to find the best combination of variables having a significant impact on probability of increasing revenue, formal selection of properties was done with the use of stepwise regression which gave the following set of variables.• for 2009 and 2010: X1, X2, X3, X4, X5, X9, • for 2011: X1, X2, X3, X4, X5,
The generated sets form new lists of variables, which are poorly correlated between each other and, at the same time, strongly correlated with other vari-ables.
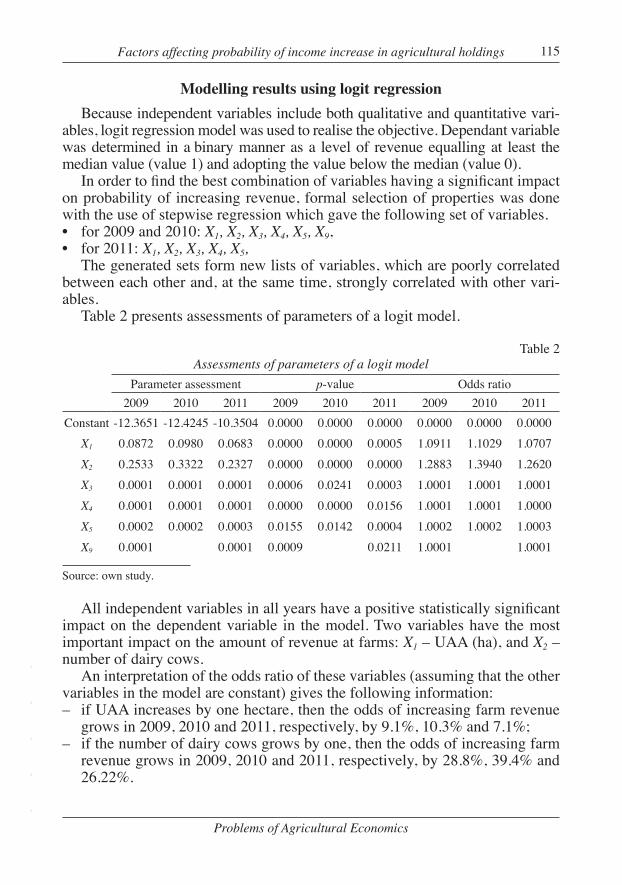
Table 2 presents assessments of parameters of a logit model.
Table 2Assessments of parameters of a logit model
Parameter assessment p-value Odds ratio2009 2010 2011 2009 2010 2011 2009 2010 2011
Constant -12.3651 -12.4245 -10.3504 0.0000 0.0000 0.0000 0.0000 0.0000 0.0000X1 0.0872 0.0980 0.0683 0.0000 0.0000 0.0005 1.0911 1.1029 1.0707X2 0.2533 0.3322 0.2327 0.0000 0.0000 0.0000 1.2883 1.3940 1.2620X3 0.0001 0.0001 0.0001 0.0006 0.0241 0.0003 1.0001 1.0001 1.0001X4 0.0001 0.0001 0.0001 0.0000 0.0000 0.0156 1.0001 1.0001 1.0000X5 0.0002 0.0002 0.0003 0.0155 0.0142 0.0004 1.0002 1.0002 1.0003X9 0.0001 0.0001 0.0009 0.0211 1.0001 1.0001
Source: own study.
All independent variables in all years have a positive statistically significant impact on the dependent variable in the model. Two variables have the most important impact on the amount of revenue at farms: X1 – UAA (ha), and X2 – number of dairy cows.
An interpretation of the odds ratio of these variables (assuming that the other variables in the model are constant) gives the following information:– if UAA increases by one hectare, then the odds of increasing farm revenue
grows in 2009, 2010 and 2011, respectively, by 9.1%, 10.3% and 7.1%;– if the number of dairy cows grows by one, then the odds of increasing farm
revenue grows in 2009, 2010 and 2011, respectively, by 28.8%, 39.4% and 26.22%.
-
-
-
-
-
Agnieszka Sompolska-Rzechuła, Michał Świtłyk116
4(349) 2016
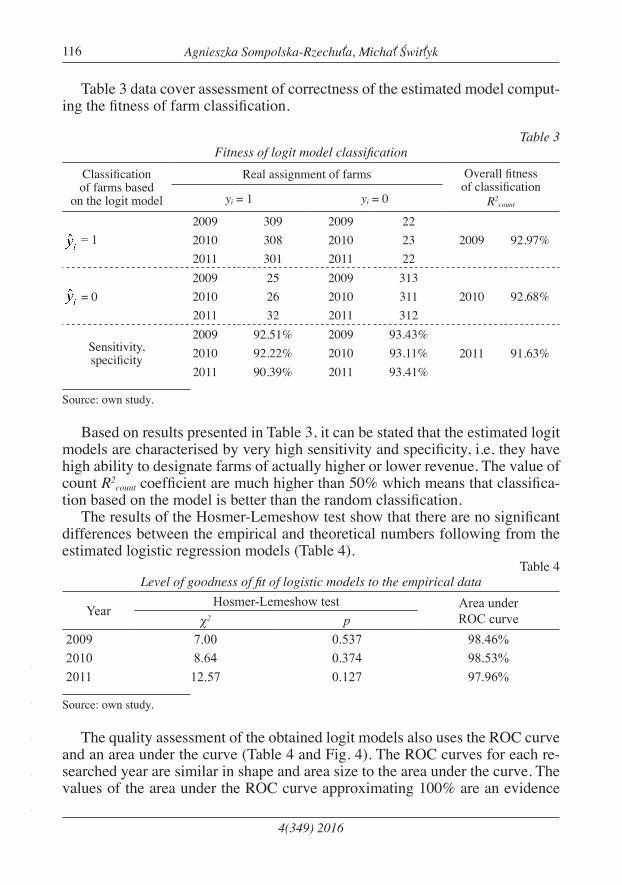
Table 3 data cover assessment of correctness of the estimated model comput-ing the fitness of farm classification.
Table 3Fitness of logit model classification
Classification of farms based
on the logit model
Real assignment of farms Overall fitness of classification
R2countyi = 1 yi = 0
= 12009 309 2009 22
2009 92.97%2010 308 2010 232011 301 2011 22
= 02009 25 2009 313
2010 92.68%2010 26 2010 3112011 32 2011 312
Sensitivity, specificity
2009 92.51% 2009 93.43%2011 91.63%2010 92.22% 2010 93.11%
2011 90.39% 2011 93.41%
Source: own study.
Based on results presented in Table 3, it can be stated that the estimated logit models are characterised by very high sensitivity and specificity, i.e. they have high ability to designate farms of actually higher or lower revenue. The value of count R2
count coefficient are much higher than 50% which means that classifica-tion based on the model is better than the random classification.
The results of the Hosmer-Lemeshow test show that there are no significant differences between the empirical and theoretical numbers following from the estimated logistic regression models (Table 4).
Table 4Level of goodness of fit of logistic models to the empirical data
YearHosmer-Lemeshow test Area under
ROC curveχ2 p2009 7.00 0.537 98.46%2010 8.64 0.374 98.53%2011 12.57 0.127 97.96%
Source: own study.
The quality assessment of the obtained logit models also uses the ROC curve and an area under the curve (Table 4 and Fig. 4). The ROC curves for each re-searched year are similar in shape and area size to the area under the curve. The values of the area under the ROC curve approximating 100% are an evidence
-
-
-
-
-
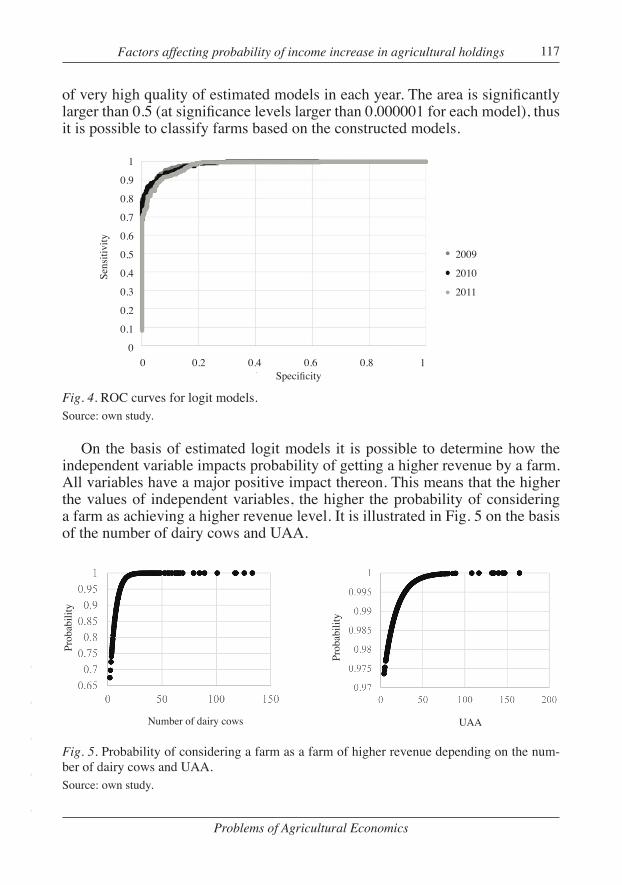
Factors affecting probability of income increase in agricultural holdings 117
Problems of Agricultural Economics
of very high quality of estimated models in each year. The area is significantly larger than 0.5 (at significance levels larger than 0.000001 for each model), thus it is possible to classify farms based on the constructed models.
Fig. 4. ROC curves for logit models.Source: own study.
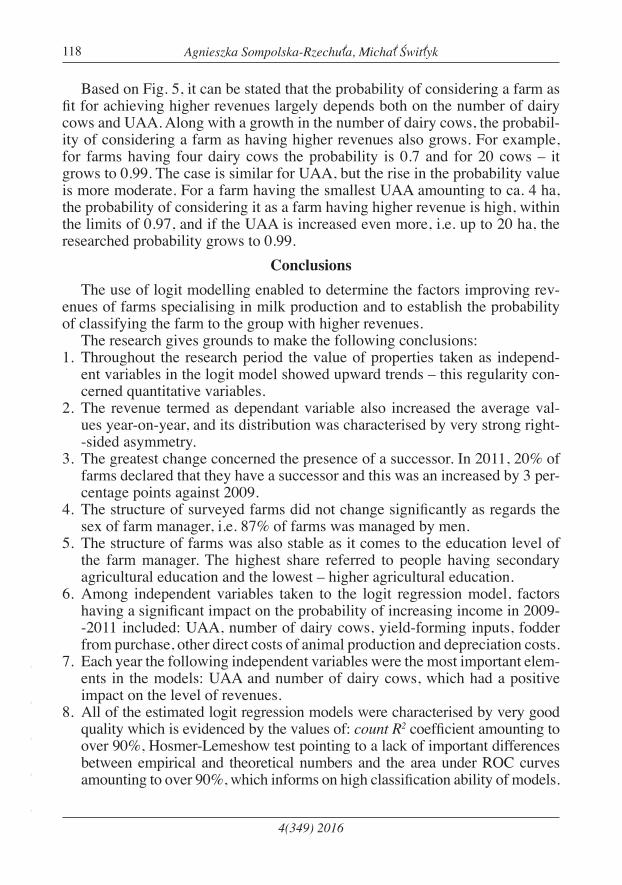
On the basis of estimated logit models it is possible to determine how the independent variable impacts probability of getting a higher revenue by a farm. All variables have a major positive impact thereon. This means that the higher the values of independent variables, the higher the probability of considering a farm as achieving a higher revenue level. It is illustrated in Fig. 5 on the basis of the number of dairy cows and UAA.
Fig. 5. Probability of considering a farm as a farm of higher revenue depending on the num-ber of dairy cows and UAA.Source: own study.
0 0.2 0.4 0.6 0.8 1
Sens
itivi
ty
Specificity
1
0.9
0.8
0.7
0.6
0.5
0.4
0.3
0.2
0.1
0
2009
2010
2011
Prob
abili
ty
Number of dairy cows
Prob
abili
ty
UAA
-
-
-
-
-
Agnieszka Sompolska-Rzechuła, Michał Świtłyk118
4(349) 2016
Based on Fig. 5, it can be stated that the probability of considering a farm as fit for achieving higher revenues largely depends both on the number of dairy cows and UAA. Along with a growth in the number of dairy cows, the probabil-ity of considering a farm as having higher revenues also grows. For example, for farms having four dairy cows the probability is 0.7 and for 20 cows – it grows to 0.99. The case is similar for UAA, but the rise in the probability value is more moderate. For a farm having the smallest UAA amounting to ca. 4 ha, the probability of considering it as a farm having higher revenue is high, within the limits of 0.97, and if the UAA is increased even more, i.e. up to 20 ha, the researched probability grows to 0.99.
ConclusionsThe use of logit modelling enabled to determine the factors improving rev-
enues of farms specialising in milk production and to establish the probability of classifying the farm to the group with higher revenues.
The research gives grounds to make the following conclusions:1. Throughout the research period the value of properties taken as independ-
ent variables in the logit model showed upward trends – this regularity con-cerned quantitative variables.
2. The revenue termed as dependant variable also increased the average val-ues year-on-year, and its distribution was characterised by very strong right- -sided asymmetry.
3. The greatest change concerned the presence of a successor. In 2011, 20% of farms declared that they have a successor and this was an increased by 3 per-centage points against 2009.
4. The structure of surveyed farms did not change significantly as regards the sex of farm manager, i.e. 87% of farms was managed by men.
5. The structure of farms was also stable as it comes to the education level of the farm manager. The highest share referred to people having secondary agricultural education and the lowest – higher agricultural education.
6. Among independent variables taken to the logit regression model, factors having a significant impact on the probability of increasing income in 2009- -2011 included: UAA, number of dairy cows, yield-forming inputs, fodder from purchase, other direct costs of animal production and depreciation costs.
7. Each year the following independent variables were the most important elem- ents in the models: UAA and number of dairy cows, which had a positive impact on the level of revenues.
8. All of the estimated logit regression models were characterised by very good quality which is evidenced by the values of: count R2 coefficient amounting to over 90%, Hosmer-Lemeshow test pointing to a lack of important differences between empirical and theoretical numbers and the area under ROC curves amounting to over 90%, which informs on high classification ability of models.
-
-
-
-
-
Factors affecting probability of income increase in agricultural holdings 119
Problems of Agricultural Economics
Literature:Cramer, J.S. (2003). Logit Models from Economics and Other Fields. Cambridge: Cambridge
University Press.Dobosz, M. (2004). Wspomagana komputerowo statystyczna analiza wyników badań.
Warszawa: Akademicka Oficyna Wydawnicza EXIT.Gołaś, Z., Kurzawa, I. (2014). Zastosowanie uporządkowanego modelu logitowego w ana-
lizie rentowności branż przemysłu spożywczego. Zagadnienia Ekonomiki Rolnej, no. 1, pp. 78-96.
Hosmer, D.W., Lemeshow, S. (2000). Applied logistic regression (issue 2). New York: Wiley & Sons.
Jackowska, B., Wycinka, E. (2011). Wykorzystanie regresji logistycznej w analizie czynni-ków wpływających na aktywne poszukiwanie pracy przez osoby długotrwałe bezrobot-ne. Modelowanie i prognozowanie gospodarki narodowej, Prace i Materiały Wydziału Zarządzania Uniwersytetu Gdańskiego, Gdańsk, pp. 393-403.
Kasprzyk, B., Fura, B., (2011). Wykorzystanie modeli logitowych do identyfikacji gospo-darstw domowych zagrożonych ubóstwem. Wiadomości Statystyczne, no. 6, pp. 1-16.
Kleinbaum, D.G., Klein, M. (2002). Logistic Regression. New York: Springer.Kmieć, D. (2015). Zastosowanie modelu logitowego do analizy czynników wpływających na
bezrobocie wśród ludności wiejskiej. Zeszyty Naukowe Szkoły Głównej Gospodarstwa Wiejskiego Ekonomika i Organizacja Gospodarki Żywnościowej, no. 110, pp. 33-42.
Kowerski, M., Bielak, J., Długosz, D. (2006), Zastosowanie logitowych modeli mikro- -makro do prognozowania kondycji ekonomiczno-finansowej przedsiębiorstw. Barometr Regionalny, Analizy i Prognozy, pp. 56-66.
Maddala, G.S. (2001). Introduction to Econometrics. Third Edition, John Wiley & Sons.Młodak, A. (2006). Analiza taksonomiczna w statystyce regionalnej. Difin. Sompolska-Rzechuła, A., Machowska-Szewczyk, M., Chudecka-Głaz, A., Cymbaluk-
-Płoska, A., Menkiszak, J. (2014). The Use of Logistic Regression in the Ovarian Cancer Diagnostics. Ekonometria, no. 3(45), pp. 151-164.
Stanisz, A. (2007). Przystępny kurs z zastosowaniem Statistica PL na przykładach z medycy-ny. Statsoft Kraków, vol. 3.
Ziętara, W. (ed.) (2013). Polskie gospodarstwa z chowem bydła na tle wybranych krajów. Warszawa: IERiGŻ-PIB.
-
-
-
-
-

Agnieszka Sompolska-Rzechuła, Michał Świtłyk120
4(349) 2016
AGNIESZKA SOMPOLSKA-RZECHUŁAMICHAŁ ŚWITŁYKZachodniopomorski Uniwersytet TechnologicznySzczecin
CZYNNIKI WPŁYWAJĄCE NA PRAWDOPODOBIEŃSTWO POPRAWY PRZYCHODÓW GOSPODARSTW ROLNYCH SPECJALIZUJĄCYCH SIĘ
W PRODUKCJI MLEKA
AbstraktW pracy wykorzystano model regresji logistycznej do określenia czyn-
ników wpływających na prawdopodobieństwo poprawy przychodów gospo-darstw rolnych specjalizujących się w produkcji mleka. Badanie miało cha-rakter dynamiczny i obejmowało lata 2009-2011. Wśród zmiennych niezależ-nych uwzględniono zmienne ilościowe i jakościowe związane z działalnością gospodarstw rolnych. Najbardziej istotne w modelu logitowym, w każdym roku, okazały się zmienne dotyczące: powierzchni użytków rolnych i licz-by krów mlecznych, mające dodatni wpływ na prawdopodobieństwo popra-wy przychodu. Wszystkie oszacowane modele odznaczają się bardzo wyso-ką jakością, a tym samym zdolnością do poprawnej klasyfikacji gospodarstw.
Słowa kluczowe: przychody, gospodarstwa rolne, produkcja mleka, model logitowy.
Unless stated otherwise all the materials on the website are available under the Creative Commons Attribution 3.0 Poland license. Some rights reserved to the Institute of Agricultural and Food Economics – National Research Institute.
Accepted for print: 07.12.2016.
-
-
-
-
-