e delle iniziative artistiche e culturali quaderni ask · liriche, giuffrè editore: milan, p. 43....
TRANSCRIPT

ASK (Art, Science and Knowledge) Laboratorio di economia e gestione delle istituzioni e delle iniziative artistiche e culturali
Quaderni ASK
Uni
vers
ità C
omm
erci
ale
Luig
i Boc
coni
6/2011
The ‘Teatri di Tradizione’ in Italy. Representation of a Multiform Sector
Alix Doran, Ilaria Morganti, Alex Turrini
Mau
rizio
Nan
nucc
i, Ex
plor
e, n
eon,
200
5 (G
alle
ria F
umag
alli,
Ber
gam
o)
Quaderni ASK - 6/2011
1
1. Objectives and scope of the study Opera is one of the most important expressions of art in the Italian cultural tradition. It is part of the country’s heritage and the preservation and the promotion of this art form is a fundamental goal of national cultural policies. In Italy, there is a large number of institutions pursuing this goal. These institutions might be divided in three categories: the ‘Fondazioni Lirico Sinfoniche’ (FLS), which are private foundations (from a legal point of view) but heavily funded by the State, which are located in big Italian cities and which are considered the pillars of the opera tradition in the country; the ‘Teatri di Tradizione’ (TDT), which are usually located in medium-sized cities, which operate in the local territory and, for this reason, whose main stakeholder is the local government (i.e.: the municipality), and the ‘lirica ordinaria’, which are music institutions of different types and which either have a short season or they include opera performances in their seasonal programs1. Italian institutions staging opera are currently facing a very difficult situation mostly due to two main issues. As mentioned, from a public policy point of view, opera is considered as an art form which needs to be preserved as it represents an important part of Italian cultural identity and heritage. The recognition of the importance of Italian opera tradition above all by the State has enabled institutions to maintain high levels of artistic quality in this genre. However, it has also represented a risk as this rich tradition has led some opera theatre to become ‘museums’ or ‘temples’ too tied to the past, without a deep focus on audience development (especially young audience) or artistic innovation. Connected to this point, from an organizational point of view, there is a problem of economic sustainability and related management capacity. As a matter of fact, one of the characteristics of Italian opera theatres is the high fixed costs they have to sustain to produce and stage performances and, consequently, over the years, they have been highly dependent on public funding. Indeed, the overall consequence of this situation is that public intervention is taken for granted and very few cultural institutions have invested in the development of strong managerial competencies (for example in fundraising) or in the restructuring of their organization to gain efficiency in their operations2. In order to address above all the latter issue, this paper reports the main findings of a study about Italian Teatri di Tradizione (TDT) and their organisational and managerial performances3. In particular, we aim at:
• Providing an overall picture of the Italian TDT sector, putting scattered data from different sources into a unitary framework;
1 Cori, E. (2004), Aspetti Istituzionali e Dinamiche Organizzative nel Teatro d’Opera in Italia, Franco Angeli: Milan, pp. 10-11. 2 For more insight on the topic see: Matinoni, M. and Sacco P.L. (2004), ‘Il Fundraising per la Cultura, ovvero l’Arte di Coinvolgere: Nuove Sfide e Prospettive di Sviluppo per le Organizzazioni Culturali’, in Severino, F. and Trimarchi, M. (edited by), Sette Idee per la Cultura, Roma: Labitalia; Turrini A. (2010) “Lo spettacolo? Un dramma”, www.lavoce.info, December, Turrini A. (2009) “Finanziatori privati in scena”, www.lavoce.info, September; Turrini A. (2009) “L’opera da tre soldi. Pubblici?”, www.lavoce.info, March; Finessi, E. (2010), L’Economia delle Fondazioni Liriche, Giuffrè Editore: Milan, p. 43. 3 The study has been developed as part of a research project commissioned by Fondazione Teatro di Pisa, willing to improve its strategy through benchmarking with other institutions. We thank, in particular, the former and new President of Fondazione Teatro di Pisa, dott. Toscano and dott. Cortopassi. A particular thanks goes to Cassa di Risparmio di Pisa and to the Association of Teatri di Tradizione in Italy (in particular, its President, dott.ssa Cauzzi). We also thank all the theatres that were available for the data collection and benchmarking.
Quaderni ASK - 6/2011
2
• Analysing the TDTs’ economic and managerial performances pointing out the main issues and problems TDTs are facing in Italy.
The paper is organised in three main parts: a quick explanation of methods we used to collect and analyse data; the presentation of the main evidences focusing, first, on the results concerning the sector of the TDT and its general characteristics and, second, on those results emerging from the qualitative analysis. Recommendations and final conclusions are developed in the last section. 2. Data and methods The study was based on an analysis of the sector of the TDTs in Italy and, second, on an evaluation of the managerial performances of a sample of 10 of these theatres. The analysis of the sector consisted in collecting and analysing data published by the MiBAC in its Annual Report on Performing Arts (Relazione sull’utilizzo del Fondo Unico per lo Spettacolo 2009) and in EDT Annual Report (Annuario dell’opera lirica in Italia. Anno 2009)4. The second part of the study elaborated on data collected from a sample of ten theatres for the year 2009. The theatre sample was selected following two fundamental criteria: the amount of ministerial contributions received and the geographic position so as to replicate the distribution of all the TDT on the Italian territory. The ten theatres that participated to the research are: Fondazione Teatro Comunale e Auditorium Provinciale (Bolzano), Fondazione Donizetti Onlus (Bergamo), Società Teatro Grande (Brescia), Teatro Sociale (Como), Fondazione Teatro Ponchielli (Cremona), Teatro Coccia Onlus (Novara), Fondazione I Teatri di Reggio Emilia (Reggio Emilia), Fondazione Teatro di Pisa (Pisa), Fondazione Pergolesi Spontini (Jesi) and Fondazione Teatro Massimo Bellini (Catania)5. Considering that there are twenty-eight theatres in total, in the field, the study cannot be considered perfectly representative of the sector: we consider it a basis for further research, which could hopefully involve more theatres in the future. In order to collect data from the sample, a questionnaire, divided into eight sections and fifty-eight questions, was distributed among the theatres. They were asked to provide information about: the artistic programme, the production capacity, the organisational structure and the governance. The aim of the data collection was to build an evaluation on each theatre strategic positioning, their ‘internal’/’operative’ performances, their ‘external’ performances. Each of these three dimensions was investigated using a set of indicators. These indicators aimed at revealing specific information about each of the ten theatres and were designed to be comparable and readable. Below, the list of variables and indicators we wanted to measure:
• Theatre accessibility/inaccessibility o number of seats per thousand inhabitant o number of performances per year o number of subscribers per seat in the theatre
4 Data published in the Annuario are provided by the theatres. One issue related to the collection of secondary data in the Annuario dell’opera lirica in Italia. Anno 2009 was the impossibility of checking the way in which the numbers were aggregated by the different theatres and therefore how homogeneous the data were. Moreover, some theatres did not declare all the information presented in the book and some categories therefore remained incomplete. 5 This sample is composed of seven theatres located in the North of the country, two theatres in the centre and one theatre for the South and islands. This implies that the North represents close to 60% of the sample, the centre 25%, and the South 14%. These percentages actually reflect the distribution of the twenty-eight TDTs in Italy.

Quaderni ASK - 6/2011
3
• Focus on the audience o average price per seat (subscriptions not included) o overall occupancy rate and occupancy rate per genre (i.e.: opera, dance, drama)
calculated as the number of spectators for each genre per number of seats in the theatre
• Programming concentration/diversification o number of performances per typology (i.e.: opera, dance, drama, concerts,
entertainment, events for schools, other) • Theatre visibility
o presence in the local, national and international media • Self-financing and fundraising capacity
o percentage of revenues from the activities6 (over total revenues) o amount of public and private contributions received
• Efficiency o cost per single performance o cost per spectator o number of employees per performance
• Productivity o % of shows produced internally (over total number of shows)
• Quality of the organization and human capital o personnel average age o number of employees per manager o number of working years in the theatre o cost for the personnel per performance o degree of organizational flexibility: % of tenured contracts (over total workforce) o % of graduate employees (over total workforce) o % cost for personnel training (over total costs) o number of computers and number of email addresses per employee o average % of performance related salary
• Openness to the external environment o number of members in the Board of Directors o % of complimentary tickets (over total number of tickets sold) o number of partners involved for co-productions
• Fundraising ability o % of earned income (on total revenues) o % of funds received from the city per inhabitant (on total revenues) o % sponsorships (on total revenues) o % of funds received by the city, province, region, and state (on total revenues)
In order to compare theatres’ overall performances (internal and external) indicators (assuming different values) have been normalised and then aggregated.
6 The revenues from the activities are defined as the sum of the revenues from the ticket sales and from the educational activities, renting the theatre spaces and other sources.

Quaderni ASK - 6/2011
Normalisation was done by subtracting the sector’s average value for indicator X (Mx) to the value for indicator X corresponding to theatre Y (Vx,y) and dividing afterwards by the standard deviation (DEV_STDx). The new normalised value for indicator X and theatre Y (Nx,y) was therefore calculated following the formula: Nx,y= Value of single theatre (Vx,y) – Average of the sector (Mx) Standard Deviation (DEV_STDx) The average normalised value of different indicators obtained by one theatre enabled to position the latter in relation to the others. It was then possible to evaluate how distant from the sector’s average each single theatre was. The logic of the benchmarking activity was not to give a positive or negative absolute evaluation of performances reached by each theatre but to evaluate how a theatre was performing in comparison with the sector. 3. Results 3.1 The TDT sector Italian TDTs are, historically and along with concert and orchestral institutions, responsible for ‘promoting, facilitating and coordinating musical activities which take place on the territories of the respective provinces’ (Art. 28, law 14 August 1967, n. 800). Today, this category includes 28 theatres all over Italy. What distinguishes them for other theatres is the fact that their activities focus on the production of opera performances, these being a requirement to obtain State subsidies. The programme of these theatres, however, also includes other forms of performances: drama, concert, ballet, entertainment and other activities aimed at the promotion of the local cultural identity (see infra p.10). As is clearly stated in the law concerning this specific sector, these theatres must maintain a strong connection with their territory. The theatres contribute to the cultural heritage of Italian cities through their productions as well as through their simple presence on the territory. The Geographic Distribution of the TDT in Italy The first noticeable thing about the sector is that 61% of the TDT are located in the North of Italy. Lombardy and Emilia-Romagna in particular are the two regions with the highest number of TDTs. 25% of the TDT are in the Centre of the country, while only 14% of them are located in the Southern regions. Although these results alone cannot illustrate the interest of the Northern regions for opera, they attest that there is more supply on this part of the Italian territory, and, as it will be explained, potentially more competition for funds and audience. In some regions, the level of competition is further increased by the presence of several FLS.
4

Quaderni ASK - 6/2011
5
Map 1 - Map of the TDT
Source: Italian Ministry of Culture - Ministero per i Beni e le Attività Culturali (MiBAC), 2009 Public Funding One important public funding source for Italian TDTs is the State, and in particular a specific Annual National Fund, Fondo Unico per lo Spettacolo (FUS)7. Based on data published by the MiBAC for the year 2009, the sector of the TDT received 15.834.000 Euro, which corresponds to 3,77% of the total Annual National Fund. The distribution of resources among the theatres is relatively homogeneous: most theatres receive between 3% and 5% of the total amount of FUS distributed to the TDT ranging from 475.020 to 791.700 Euros (Map 2). The most important portion of FUS allocated to a single theatre amounts to 1.510.000 Euro (the theatre of Catania in Sicily). This theatre receives 9.54% of the total FUS in 2009. 7 In Italy, TDTs and FLS receive public funds from the Italian Ministry of Culture (MiBAC). The Ministry distributes to performing arts institutions in different field (i.e. cinema, music and opera, dance, drama, festivals and circus) an annual fund, FUS (Fondo Unico per lo Spettacolo). The quantity of resources that annually sustain different performing arts subfields is decided by law according to fixed proportions that have not changed much from year to year. In 2009, opera theatres received approximately 47,5% of the total FUS, while symphonies almost 13,8% and drama almost 16,3% of the total fund.

Quaderni ASK - 6/2011
6
Map 2 - Distribution of the FUS Map 3 – Relevance of the FUS in comparison
to the whole structure of contribution
Source: Elaborations Centro ASK of data from MiBAC Source: Elaborations Centro ASK of data from MiBAC 20098 20099 The incidence of the State funding on the theatres’ total public and private contributions does differ somehow (Map 3). For over 70% of the theatres, the State funding counts less than 50%. For as much as 1/3 of the theatres, the relative weight of the FUS is inferior to 30%. Only in the case of Trapani the role of State funding is really determinant and represents over 70% of the total contributions the theatre benefits from. It is therefore possible to say that the FUS represents in certain cases an important source of resources but it is not necessarily the main one and its impact on overall budgets may even be limited at times. It is consequently interesting to look at what the other sources of contributions are. Indeed, the fact that these theatres are traditionally very much linked to their territories might be reflected in the way local institutions and local companies support their activities. Even though in some cases one source of funding clearly represents the main source for a theatre, all the theatres have a variety of actors providing them with financial support and therefore they have multiple sources of funding: other than the State, the sources of funding for TDTs are the local governments such as the city, the county and the region, and private sponsors in particular bank foundations.
8 Each colour corresponds to a range of percentage and the size of the dot is proportional to the amount of FUS allocated to the theatre. The smaller the dot is, the smaller the percentage of FUS allocated is and, vice versa, the larger the dot is, the higher the percentage of FUS allocated is. 9 Each colour corresponds to a range of percentage and the size of the dots is proportional to the weight of the FUS for the theatre. The smaller the dot is, the less important role the FUS plays in the theatre’s total of contributions received, and the larger the dot is, the bigger portion of the total contributions it represents.

Quaderni ASK - 6/2011
7
Looking at the composition of the funding received by each theatre, excluding the FUS, it emerges that contributions are rather diversified since it is rare for a theatre to receive more than 50% of its contributions from only one entity; moreover, the form of funding which is most recurrent and important is the local government funding. The City funds represent for all theatres an important form of contribution, in many cases even more relevant than the State. The role of the Province (as another local government) is mostly minor and almost half of the TDT do not receive any funds from their province. Finally, the private support is also important but it is distributed in a less homogeneous way. For instance, the data reveal that the theatre of Treviso receives almost 80% of its contributions from private partners while most of the other theatres receive a much more limited amount of private funds: on average, 24% of the total contributions received by a theatre come from the private sector. These data are confirmed by calculating the amount of contribution received per capita (considering all the residents in the corresponding province10), as the table below demonstrates: on average, Provinces allocate 0,42 Euro per capita, Regions allocate 1,09 Euro per capita, Cities allocate 1,35 Euro and other local public entities 1,15 Euro. The overall regional and local public spending for TDT amounts to 4,01 Euro per resident in the province while the State spends only an equivalent of 1,31 Euro per capita. In sum: every year each resident in the province where a TDT operates indirectly receives, from different levels of government, 5,32 Euro (as an average) to enjoy performances at the TDT or to enjoy the indirect benefit the existence of a TDT produces in the local territory. Table 1 – Contribution per inhabitant of the province
Contribution per inhabitant *
State Region Province City Other local Institutions
Minimum 0,31 0,03 0,01 0,02 0,01
Maximum 3,14 12,26 1,7 8,00 6,89
Average 1,31 1,09 0,42 1,35 1,15 Source: ISTAT and Annuario dell’opera lirica in Italia. Anno 2009 Juridical Forms In terms of juridical form, the TDT sector is quite heterogeneous. Indeed, there are only twenty-eight theatres but eight different legal forms have been adopted. More than half of the TDTs are private foundations. The remaining are:
• Associations • Public entities • Institutions
10 The data on the inhabitants of the province were taken from the Italian National Institute of Statistics (ISTAT). The inhabitants of the province were considered as the TDT play a role at the level of the province, not only at the level of the city.
Quaderni ASK - 6/2011
8
• ‘Special companies’11 • Cooperatives • Joint ownership • Operating companies
There are many implications related to these differences. In the case of the Institutions and the Public Entity, the role of the public authorities and institutions will probably be stronger than in the case of a Foundation which receives financial support from the local institutions but, being involved in a wider network of private stakeholders, might have to satisfy a wider range of interests. Even though the foundation appears to be the preferred legal structure it is unclear whether this model is efficient and suited to the needs of these theatres. Moreover, it is unsure whether it really enables and encourages relationships with the local third parties. Theatre Capacity and Catchment Potential In order to evaluate these two elements, the ratio between the number of seats in the theatres’ main rooms and the number of inhabitants in the province were taken into account. The results highlight the diversity which exists among the theatres in this sector, both in terms of the structure and of the catchment area they operate in. On average, a TDT offers about 1.000 seats for its potential audience and 2,2 seats per thousand residents. Of course, a variety of factors influence the capacity of each theatre to get good results in terms of occupancy, given their capacity. First of all, the competition between theatres might become fierce in the case of theatres located in a region where other theatres of the same category are based, or close to other areas fully populated by other cultural institutions. For example, the six TDTs located in the region of Lombardy and the six ones located in the region of Emilia-Romagna are geographically close to each other, which implies that the theatres located next to each other might compete. Second, these theatres surely compete not only among themselves but also with all the other cultural institutions that are geographically close, whether they operate in the musical sector, like the FLS do (such as the Teatro alla Scala, the Fondazione Teatro Comunale of Bologna, the Arena in Verona, and the Teatro Regio di Torino) or whether they offer other forms of performances and entertainment. Average Prices It terms of pricing policies, the sector of the TDT appears once again rather heterogeneous as average prices12 vary greatly from one theatre to another. The average price of opera tickets is 44,67 Euro, with a minimum price of 10 euro and a maximum price of 101 euro. An interesting data is that the in the case of the minimum prices offered for opera performances, the theatres are rather aligned as there is a general oscillation between 5 and 21 euro (average of 11 euro), while the range of the maximum prices is much wider and goes from 25 to 100 euro (average 78 euro). This can be related to the way each theatre positions itself in relation to its audience. Indeed, in the case of relatively low maximum prices, the theatres remain accessible for a larger part of the population whereas theatres that greatly increase the price of certain performances or of certain kinds of performance (opera shows for instance), consider the public as formed of different 11 In Italian, an Azienda speciale or ‘special company’ is a particular form of public company. 12 The average price for each theatre was calculated using the data available in the Annuario dell’Opera. Anno 2009.
Quaderni ASK - 6/2011
9
categories and therefore targets different kinds of audience with the different performances and their associated prices. 3.2. TDT economic and managerial performances In this section, the data related to a sample of 10 TDTs will be presented following three dimensions of analysis: their strategic positioning, the internal/operative performances and the external performances. The indicators used to evaluate these three dimensions reveal specific information about each of the ten sample theatres and they are comparable and understandable in relation to the sector’s average.13 Strategic Positioning We interpret strategic positioning as how an organisation defines its identity with respect to other institutions in the same field. The positioning of a TDT in the sector is defined referring to a variety of factors that are related to their core business such as artistic production. In our study, the strategic positioning was built on the basis of the programme offered by each single theatre to its public and in particular on the basis of:
• The composition of the programme in terms of prevalence of a genre (i.e.: opera, drama, dance, entertainment, etc.) over another (Graph 1);
• The prevalence of ‘institutional’ performances (i.e. opera, drama, dance, classic music) in relation to performances of different natures (i.e. entertainment, school galas and performances, etc.) (Graph 2);
• The willingness of each theatre to produce internally, to co-produce or to buy from other producers new shows and events (Graph 3).
Also in this respect the sector of the TDT appears to be highly heterogeneous: most theatres schedule different types of performances, they achieve different targets, different missions and different strategies. As a summary we can say that TDTs are more similar for their local vocation and appeal rather than for the characteristics of their programming.
13 In order to respect the theatres’ sensitive data, references to the theatres are made using letters and not the names of the theatres. There is no correspondence between the letters used to describe the graphs. In relation to one graph a theatre may be ‘Theatre A’ while it becomes ‘Theatre C’ in reference to another graph.
Quaderni ASK - 6/2011
10
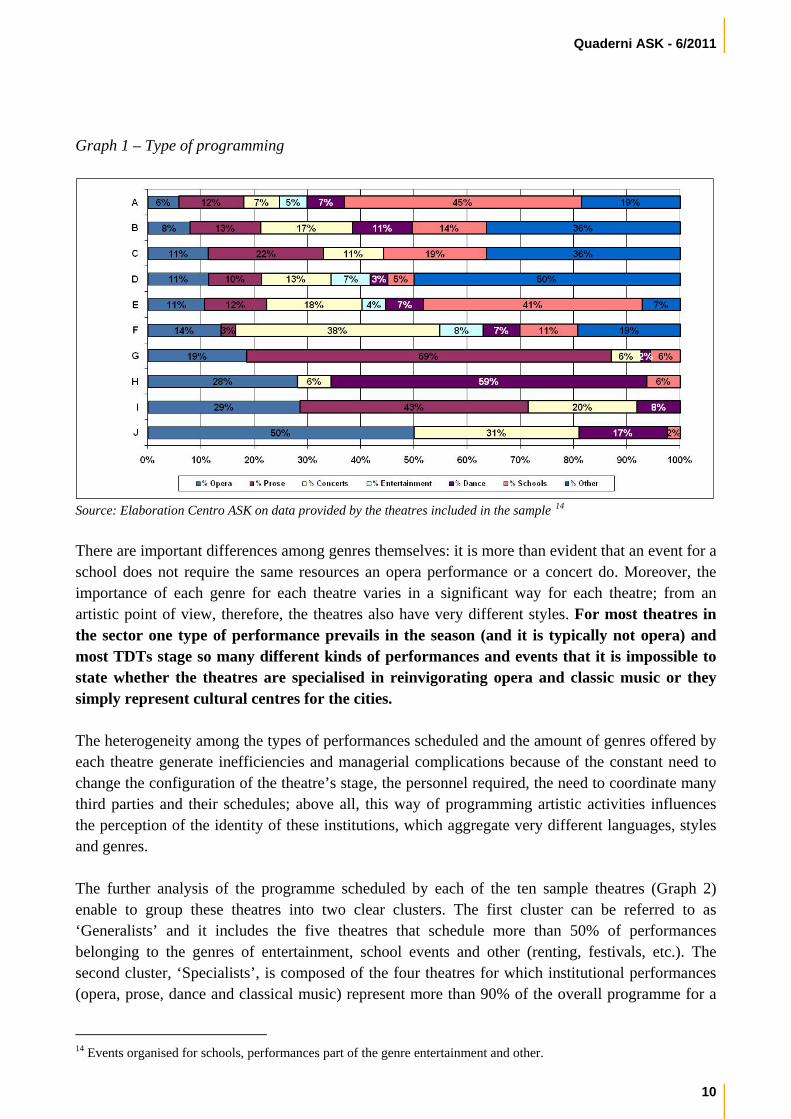
Graph 1 – Type of programming
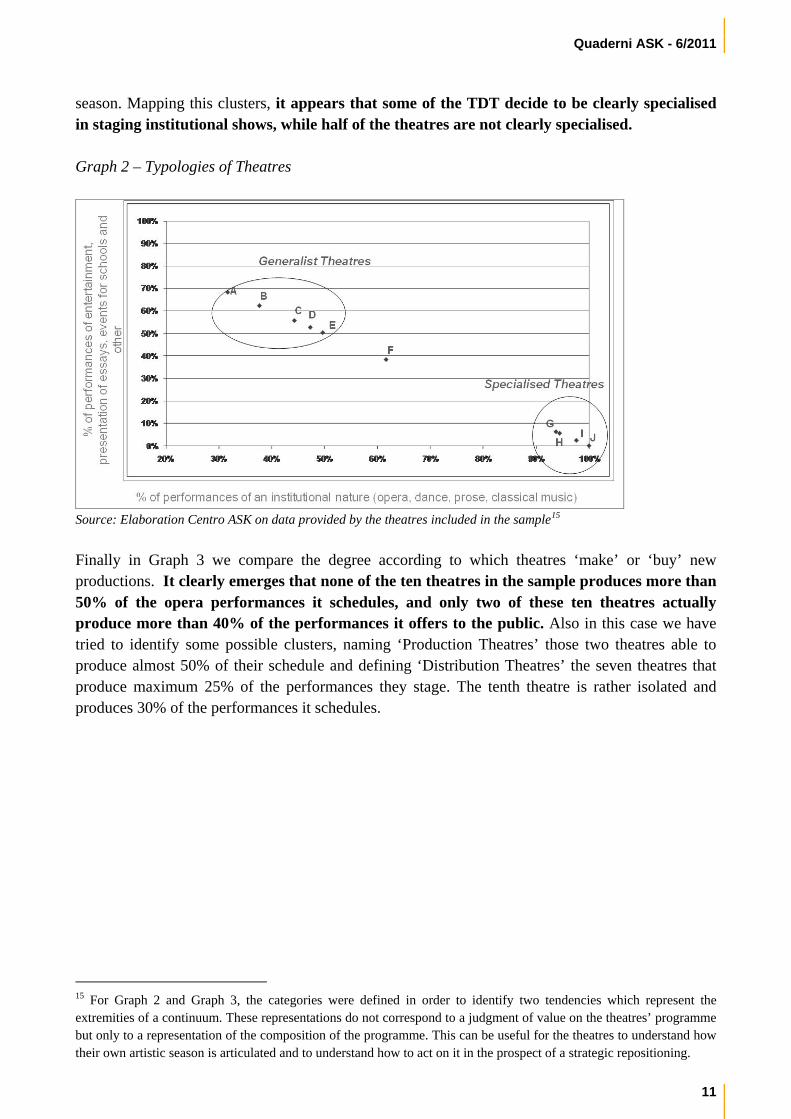
Source: Elaboration Centro ASK on data provided by the theatres included in the sample 14 There are important differences among genres themselves: it is more than evident that an event for a school does not require the same resources an opera performance or a concert do. Moreover, the importance of each genre for each theatre varies in a significant way for each theatre; from an artistic point of view, therefore, the theatres also have very different styles. For most theatres in the sector one type of performance prevails in the season (and it is typically not opera) and most TDTs stage so many different kinds of performances and events that it is impossible to state whether the theatres are specialised in reinvigorating opera and classic music or they simply represent cultural centres for the cities. The heterogeneity among the types of performances scheduled and the amount of genres offered by each theatre generate inefficiencies and managerial complications because of the constant need to change the configuration of the theatre’s stage, the personnel required, the need to coordinate many third parties and their schedules; above all, this way of programming artistic activities influences the perception of the identity of these institutions, which aggregate very different languages, styles and genres. The further analysis of the programme scheduled by each of the ten sample theatres (Graph 2) enable to group these theatres into two clear clusters. The first cluster can be referred to as ‘Generalists’ and it includes the five theatres that schedule more than 50% of performances belonging to the genres of entertainment, school events and other (renting, festivals, etc.). The second cluster, ‘Specialists’, is composed of the four theatres for which institutional performances (opera, prose, dance and classical music) represent more than 90% of the overall programme for a
14 Events organised for schools, performances part of the genre entertainment and other.
Quaderni ASK - 6/2011
11
season. Mapping this clusters, it appears that some of the TDT decide to be clearly specialised in staging institutional shows, while half of the theatres are not clearly specialised. Graph 2 – Typologies of Theatres
Source: Elaboration Centro ASK on data provided by the theatres included in the sample15 Finally in Graph 3 we compare the degree according to which theatres ‘make’ or ‘buy’ new productions. It clearly emerges that none of the ten theatres in the sample produces more than 50% of the opera performances it schedules, and only two of these ten theatres actually produce more than 40% of the performances it offers to the public. Also in this case we have tried to identify some possible clusters, naming ‘Production Theatres’ those two theatres able to produce almost 50% of their schedule and defining ‘Distribution Theatres’ the seven theatres that produce maximum 25% of the performances they stage. The tenth theatre is rather isolated and produces 30% of the performances it schedules. 15 For Graph 2 and Graph 3, the categories were defined in order to identify two tendencies which represent the extremities of a continuum. These representations do not correspond to a judgment of value on the theatres’ programme but only to a representation of the composition of the programme. This can be useful for the theatres to understand how their own artistic season is articulated and to understand how to act on it in the prospect of a strategic repositioning.

Quaderni ASK - 6/2011
12
Graph 3 – Production or Acquisition of Performances
Source: Elaboration Centro ASK on data provided by the theatres included in the sample Triangulating the information that emerged before it therefore becomes apparent that TDTs are increasingly adopting the profile of cultural city centres, heavily relying on acquisitions of performances produced by others and diversifying the programming mix by including a variety of genres, which could eventually challenge their traditional identity. Considering the high costs associated with the production of opera, this result is not surprising. However, increasing the frequency of collaborations among TDT would help amortising the costs of production. In order to be able to do so, the theatres need to develop their networks, which we have seen are not systematically created or wide enough. The issue of the co-production represents one of the critical points for the development of the TDT and the reinforcement of their identity. On this issue, qualitative insights emerge from our analysis:
• TDTs tend to co-produce always with the same partners and in particular with the theatres that are geographically closer;
• There are, in Italy, two very important networks of co-production that are both strong at the regional level: the Lombardy circuit and the Emilia-Romagna one;
• Some theatres do not maintain any co-production relationships with other Italian theatres, and therefore isolate themselves from the sector.
As a matter of fact, according to the data collected in the Annuario dell’opera lirica in Italia. Anno 2009, four of the twenty-eight theatres (Catania, Chieti, Cosenza and Lecce) did not co-produce at all in 2009, which indicates that they are not part of any network and have no relationship with other theatres belonging to the sector. Five main co-production networks can be identified but two in particular are important because more theatres are included and because they represent a higher frequency of co-productions: the first one is composed of the theatres of Brescia, Bergamo, Como, Pavia, Cremona and Pisa16; the second is composed of Ravenna, Ferrara, Piacenza, Modena, Reggio
16 These theatres are part of the network Circuito Lombardo, which for years has been sharing a policy of planning co-productions and networks.
Quaderni ASK - 6/2011
13
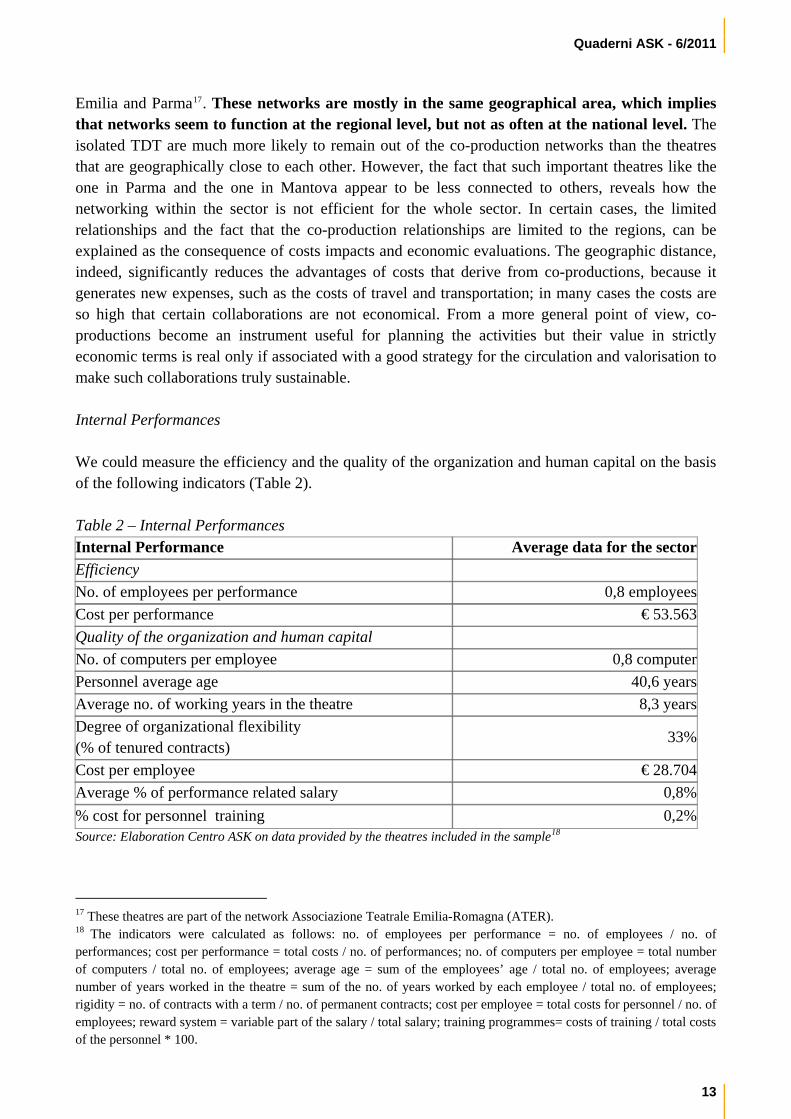
Emilia and Parma17. These networks are mostly in the same geographical area, which implies that networks seem to function at the regional level, but not as often at the national level. The isolated TDT are much more likely to remain out of the co-production networks than the theatres that are geographically close to each other. However, the fact that such important theatres like the one in Parma and the one in Mantova appear to be less connected to others, reveals how the networking within the sector is not efficient for the whole sector. In certain cases, the limited relationships and the fact that the co-production relationships are limited to the regions, can be explained as the consequence of costs impacts and economic evaluations. The geographic distance, indeed, significantly reduces the advantages of costs that derive from co-productions, because it generates new expenses, such as the costs of travel and transportation; in many cases the costs are so high that certain collaborations are not economical. From a more general point of view, co-productions become an instrument useful for planning the activities but their value in strictly economic terms is real only if associated with a good strategy for the circulation and valorisation to make such collaborations truly sustainable. Internal Performances We could measure the efficiency and the quality of the organization and human capital on the basis of the following indicators (Table 2). Table 2 – Internal Performances Internal Performance Average data for the sector Efficiency No. of employees per performance 0,8 employeesCost per performance € 53.563Quality of the organization and human capital No. of computers per employee 0,8 computer Personnel average age 40,6 years Average no. of working years in the theatre 8,3 yearsDegree of organizational flexibility (% of tenured contracts)
33%
Cost per employee € 28.704Average % of performance related salary 0,8%% cost for personnel training 0,2%Source: Elaboration Centro ASK on data provided by the theatres included in the sample18
17 These theatres are part of the network Associazione Teatrale Emilia-Romagna (ATER). 18 The indicators were calculated as follows: no. of employees per performance = no. of employees / no. of performances; cost per performance = total costs / no. of performances; no. of computers per employee = total number of computers / total no. of employees; average age = sum of the employees’ age / total no. of employees; average number of years worked in the theatre = sum of the no. of years worked by each employee / total no. of employees; rigidity = no. of contracts with a term / no. of permanent contracts; cost per employee = total costs for personnel / no. of employees; reward system = variable part of the salary / total salary; training programmes= costs of training / total costs of the personnel * 100.
Quaderni ASK - 6/2011
These indicators represent the averages emerging from our sample. They, therefore, might represent standards each TDT could take as reference to evaluate its activities and to establish objectives for the future or to plan new strategies. The number of employees for each performance, for instance, indicates what the relationship is between the number of people hired in a theatre and the production capacity of the same theatre, indicated as the number of performances staged each year. The cost per performance was calculated as the ratio between the total costs and the number of performances staged. Knowing these results it can therefore be useful to integrate a qualitative evaluation of the activities with a quantitative one and to find, in the estimated results, explanations for certain phenomena or trends, typical of each theatre. Among other issues we notice that the average age is low while the average number of years worked in the theatre reveals that the organisational structure of the theatres is quite stable because many employees remain for a long time in the same theatre. A joint reading of the data about average staff age (40,6 years) and the average tenure in the institution (8,3 years) reveal that people who work in theatres join it when they are still very young and build their own professional path within the same theatre. This result could be interpreted positively as a consequence of a stable labour market in this sector. It also has, however, negative implications when confronted to the investments made for the training of the personnel. Indeed, the low levels of expenses in training for staff members (0,2% of total costs) and the inexistence of monetary incentive systems linked to performance (variable performance pay counts less than 1% of the salary) might suggest a general impoverishment of the competence and quality of the staff for the future. It could, in other terms, imply that employees are not particularly motivated to increase their productivity and with the passing of time, their competences could become inadequate to tackle the changes, sustain new strategies and manage innovation introduced by the new technologies. Normalizing and aggregating data about internal performances of the sample, it was possible to build Graph 4. The graph represents the distance that exists between the sector’s average and the standardised values of all the internal performances of each theatre. The average of the sector is equal to zero and it is located in the centre of the graph, while the position of each theatre is represented by the numerical value.
14

Quaderni ASK - 6/2011
Graph 4 – Representation of the distances from the average for the internal performances
Source: Elaboration Centro ASK on data provided by the theatres included in the sample The radar chart confirms once again that the theatres that form the sector of the TDT display important differences. The overall heterogeneity of the sector is quite clear because the theatres are distant from each other – the results are all contained between 0 and 1.50 points, with results in fact varying between 0,49 to one of 1,23. To better clarify the meaning of the graph, the results of the theatres F and H (the outliers) were analysed. The theatre F is the TDT which is closest to the average for the sector, and is therefore the most in line with the state of the sector. The only variables that differentiate it from the average are lower personnel tenure and a higher quality of technological structure compared to the other theatres taken into consideration in the sample. The theatre H, on the other hand, is the most distant from the sector’s average because many of its results are very different from the average of each variable. In particular, the average number of years its employees have worked in the theatre is much higher than the average (17 years while the average is 8 years), it demonstrates a high level of rigidity, which means that more of its employees have a permanent contract (0,84 against an average of 0,33 for the sector), and a level of spending per employee superior to the sector’s average. External Performances Evaluating external performances meant calculating three indicators, presented in the table below. For each of them, the elements that were considered to assess the indicators and the average results for the sector are specified below.
15

Quaderni ASK - 6/2011
16
Table 3 – External performances External Performances Average data for the sectorTheatre occupancy for opera 51% of full theatre capacity Theatre occupancy for drama 63% of full theatre capacityTheatre occupancy for dance 56% of full theatre capacity% of earned income 31% of total revenues% of sponsorships 13% of total revenues Source: Elaboration Centro ASK on data provided by the theatres included in the sample19 On average, the levels of occupancy are rather low. In particular, it is important to notice that even though an important part of the contributions TDT receive is aimed at supporting opera performances, opera is the last preferred genre by the audience (on average it covers 51% of full theatre capacity), which suggests that a reflection needs to be made on the value these opera actually represent for the local populations and on how to attract and cultivate a wider audience if the TDT are to keep on producing opera. As seen previously (see infra p. 7) generate income from the activities, an average of 31% of the total revenues suggests that the theatres heavily rely on contributions. The consequence, from a managerial point of view, is that since the level of financial support received might vary from one year to the next it is very difficult for the theatres to plan long-term strategies and activities. As in the previous case, it was possible to visually represent the positioning of each theatre, established using its external performances in relation to the sector’s average (Graph 5). Graph 5 – Representation of the distances from the average for the external distances
Source: Own elaboration on data provided by the theatres included in the sample The results for the external performances reveal an even higher level of heterogeneity among the TDT. Especially when it comes to their ability to attract public and sponsors as well as to 19 The indicators were calculated as follows: average level of occupancy for opera = no. of tickets sold for opera performances / no. of seats in the theatre; average level of occupancy for prose = no. of tickets sold for prose performances / no. of seats in the theatre; average level of occupancy for dance = no. of tickets sold for dance performances / no. of seats in the theatre; ability to auto-finance = revenues from activities / total revenues.
Quaderni ASK - 6/2011
17
generate sufficient revenues for their activities, the TDT perform very differently. The most important differences among the theatres regard the levels of occupancy for the performances they stage, in particular for opera and dance, and the capacity to self-finance20 their activities. For instance, theatre C is distant from the sector’s average because it has a particularly weak fundraising ability (3% of the total revenues) and low occupancy rates (32% for opera and 22% for dance) while theatre D is distant from the average because it is efficient in self-financing its activities (56% for a sector’s average of 31%) and attracting private sponsors (19% of the total revenues while the average for the sector is 13%). Theatre F exhibits a high score because it benefits from rather high levels of occupancy (78% for opera and 69% for prose) and attracts more private sponsors than most of the other theatres do (21%). However, the distance between each theatre and the sector’s average is not necessarily a negative result because it can be explained by many factors and some theatres actually perform better than the rest of the sector and are therefore far from the sector’s average. 4. Conclusions and recommendations This study represents a first overview of the TDT sector situation. From the main results highlighted above we can draw the following conclusions.
• It emerged clearly that the TDT sector is heterogeneous in terms of type of artistic programming, juridical forms, audience and catchment potential, pricing strategies, total amount of public contributions, etc. The great diversity characterizing the sector, from the cultural point of view as well as from the managerial one, might weaken the individual sense of belonging to this category. It seems necessary to think about new communalities among TDTs. These common points of interest might be no longer tied to the production and distribution of opera and music – which has been the basic reason for the State funding – but might be tied to a new TDT identity as multi-genre performing arts centres in medium-sized cities – which is the rationale for local government funding. On the basis of this new identity it would be possible to build a shared strategy, common actions, common lobbying activities and stronger collaborations.
• Theatre occupancy levels are highly variable but, on average, the most positive results are achieved for drama, while opera and dance remain two genres for which it is difficult to reach high occupancy rates. This result raises an issue on how to cultivate audience taste for opera, how to reach new audience segments and, generally speaking, to what degree the programming and producing of opera might contribute to the artistic and cultural mission of these institutions.
• The study portraits a situation of relative managerial ‘immaturity’ of the TDTs. As noted before, for example, staff working in the sector tend to remain in the same institution for a relatively high number of years, no ‘pay for performance’ mentality in rewarding staff exists and investment in training and competence development is very low. These facts suggest that the development of staff’s skills and the introduction of new managerial competencies is a priority for a sector (more important than others).
• Linked to the latter point, it seems that, on average, TDTs experience deep difficulties in addressing external stakeholders. Beside the average low levels of theatre occupancy, TDTs
20 The capacity to self-finance is intended as the sum of the revenues generated by the sales of tickets, by renting of the theatre spaces for events, by the educational activities and from other sources.
Quaderni ASK - 6/2011
experience difficulties in self-financing their activities both through the sale of tickets and through private funds (sponsorships and partnerships). In the same vein, the co-production networks, which could enable theatres to achieve economies of scale in production, they are seldom valued as important mechanisms of collaboration. Above all, networks in the TDT sector emerge and are created because of geographical proximity or the support of the Region and not on the basis of the mutual recognition of the complementary competencies each theatres might have and which the network might benefit from.
18

Quaderni ASK - 6/2011
19
Selected References
• Cori, E. (2004), Aspetti Istituzionali e Dinamiche Organizzative nel Teatro d'Opera in Italia, Franco Angeli: Milan
• Finessi, E. (2010), L'Economia delle Fondazioni Liriche, Giuffrè Editore: Milano • Martinoni, M., and Sacco, P.L. (2004), 'Il Fundraising per la Cultura, ovvero l'Arte di
Coinvolgere: Nuove Sfide e Prospettive di Sviluppo per le Organizzazioni Culturali', in Severino, F., and Trimarchi, M. (Edited by), Sette Idee per la Cultura, Roma: Labitalia
• Art. 28, law 14 August 1967, n. 800. • Law 30 April 1985, n. 163; DL 22 gennaio 2004, n.24; art. 15-100-108 del TUIR
01/01/2008.