e. bojorquez - energy-based damage index for steel structures
TRANSCRIPT
ENERGY-BASED DAMAGE INDEX FOR STEEL STRUCTURES
E. Bojórquez1,*, A. Reyes-Salazar1, A. Terán-Gilmore2
and S. E. Ruiz3
1Fac. de Ing., Universidad Autónoma de Sinaloa, Culiacán, Sinaloa, México
2Departamento de Materiales, Universidad Autónoma Metropolitana, México City, México 3Instituto de Ingeniería, Universidad Nacional Autónoma de México, México City, México
* Corresponding author: E-mail: [email protected] Tel.: 0052 6677134043; fax: 0052 6677134043
ABSTRACT
Ample research effort has been oriented into developing damage indices with the aim of
estimating in a reasonable manner the consequences, in terms of structural damage and
deterioration, of severe plastic cycling. Although several studies have been devoted to
calibrate damage indices for steel and reinforced concrete members; currently, there is a
challenge to study and calibrate the use of such indices for the practical evaluation of
complex structures. The aim of this paper is to introduce an energy-based damage index
for multi-degree-of-freedom (MDOF) steel building that accounts explicitly for the
effects of cumulative plastic deformation demands. The model has been developed by
complementing the results obtained from experimental testing of steel members with
those derived from analytical studies regarding the distribution of plastic demands on
several steel frames designed according to the Mexico City Building Code. It can be
concluded that the approach discussed herein is a promising tool for practical structural
evaluation of framed structures subjected to large energy demands.
Keywords: energy-based damage index; plastic hysteretic energy; cumulative plastic
deformation demands; steel frames.
INTRODUCTION
Currently, the maximum inter-story drift and ductility demands are targeted as
performance parameters to achieve adequate damage control in earthquake-resistant
structures. However, there is ample evidence that in some cases, the structural
performance of structures subjected to long duration ground motions cannot be
adequately characterized through their maximum deformation demands (Fajfar 1992,
Cosenza and Manfredi 1996, Terán-Gilmore 1996, Fajfar and Krawinkler 1997,
Rodríguez and Ariztizabal 1999, Bojórquez and Ruiz 2004, Arroyo and Ordaz 2007,
Hancook and Boomer 2006, Terán-Gilmore and Jirsa 2007), in such manner that the
effect of cumulative plastic deformation demands should be accounted explicitly during
seismic design. Particularly, it is necessary to establish appropriate parameters for an
adequate numerical evaluation during the performance based-design of structures.
The effect of cumulative plastic deformation demands can be considered through the
use of energy concepts; particularly through the plastic dissipated hysteretic energy
demand. The use of energy for this purpose was initially discussed by Housner (1956),
and has been used by several researchers to propose energy-based methodologies that
aim to provide earthquake-resistant structures with an energy dissipating capacity larger
or equal than its corresponding demand (Akiyama 1985, Akbas et al. 2001, Choi and
Kim 2006, Bojórquez et al. 2008a). Due to the limitations of the maximum deformation
as the principal indicator of structural damage, several damage indices that account for
the plastic dissipated hysteretic energy have been formulated to better represent the
consequences, in terms of structural damage and deterioration, of severe plastic cycling.
Most research has been devoted to calibrate damage indices for steel and reinforced
concrete members (Krawinkler and Zohrei 1983, Park and Ang 1985, Bozorgnia and
Bertero 2001, Teran and Jirsa 2005, Rodriguez and Padilla 2008). However, there is a
challenge to study and calibrate the use of such indices for the practical structural
evaluation of complex structures. For this reason, this paper proposes an energy-based
damage index which explicitly accounts for the effects of cumulative plastic
deformation demands on MDOF steel frames.
ENERGY-BASED DAMAGE INDEX
Energy-based methodologies are focused at providing structures with energy dissipating
capacities that are larger or equal than their expected energy demands (Akiyama 1985,
Uang and Bertero 1990). The design requirement of an earthquake-resistant structure in
these terms is formulated as:
Energy Capacity ≥ Energy Demand (1)
Among all the energies absorbed and dissipated by a structure, the plastic dissipated
hysteretic energy HE is clearly related to the structural damage. HE can be physically
interpreted by considering that it is equal to the total area under all the hysteresis loops
that a structure undergoes during a ground motion. Therefore, it is convenient to express
Eq. (1) in terms of plastic dissipated hysteretic energy:
HCE ≥ HDE (2)
where HCE is the plastic hysteretic energy capacity and HDE is the energy demand. Eq.
(2) can be reformulated as an energy-based damage index through.
1≤=HC
HDDE E
EI (3)
In Eq. (3), the performance level or condition where HDE equals HCE will be
considered as the failure of the system. Hence, while 1=DEI corresponds to failure of
the structural system; a value of zero implies no structural damage (elastic behavior
implies no structural damage). From a physical point of view, this equation represents a
balance between the structural capacity and demand in terms of energy. In this sense,
this formulation follows the direction initially established by Housner in 1956 for an
energy-based design.
According to Eq. (3), structural damage depends on the balance between the plastic
hysteretic energy capacity and demand on the structure. While the plastic hysteretic
energy demand can be obtained through dynamic analysis, a challenge exists to define
the plastic hysteretic energy capacity of a structure. Nevertheless, flexural plastic
behavior is usually concentrated at the ends of the structural members that make up a
frame; and in the particular case of W steel shapes, in the flanges. The plastic hysteretic
energy capacity of a steel member that forms part of a structural frame can be estimated
as follows (Akbas et al. 2001):
(4)
where fZ is the section modulus of the flanges of the steel member; yf , the yield stress;
and paθ , its cumulative plastic rotation capacity. Note that the above equation considers
that plastic energy is dissipated exclusively through plastic behavior at both ends of a
steel member.
Eq. (4) can be used together with Eq. (3) to evaluate the level of structural damage in
steel members. However, it is convenient to normalize the hysteretic energy EH as
follows for damage evaluation purposes (Krawinkler and Nassar 1992, Terán-Gilmore
and Simon 2006):
payfHCm fZE θ2=
yy
HN F
EEδ
= (5)
where yF and yδ are the strength and displacement at first yield, respectively. Eq. (3)
can be expressed in terms of NE as follows:
1≤=NC
NDDEN E
EI (6)
where the parameters involved in Eq. (6) have the same meaning as those used in Eq.
(3). The advantage of formulating the problem in terms of NE is that this is a more
stable parameter, and in quantitative terms it can easily be used for practical purposes.
In other words, the energy-based damage index proposed herein corresponds to the ratio
between the normalized hysteretic energy demand and normalized hysteretic energy
capacity, and the condition of failure is assumed to be IDEN equal to one.
In the case of MDOF steel structures, the principal challenge for the practical use of Eq.
(6) is the definition of the energy capacity of the structure in terms of that of its
structural members. Through the consideration that in regular steel frames the energy is
dissipated exclusively by the beams (which is an appropriate hypothesis for strong
column-weak beam structural systems), the energy capacity of these systems can be
estimated as (Bojórquez et al. 2008a):
(7)
where NS and NB are the number of stories and bays in the building, respectively; EHiF
an energy participation factor that accounts for the different contribution of each story
to the energy dissipation capacity of a frame; W is the total weight of the structure; and
WDC
FFZNE
yy
EHi
N
ipayfB
NC
S
)2(1∑==
θ
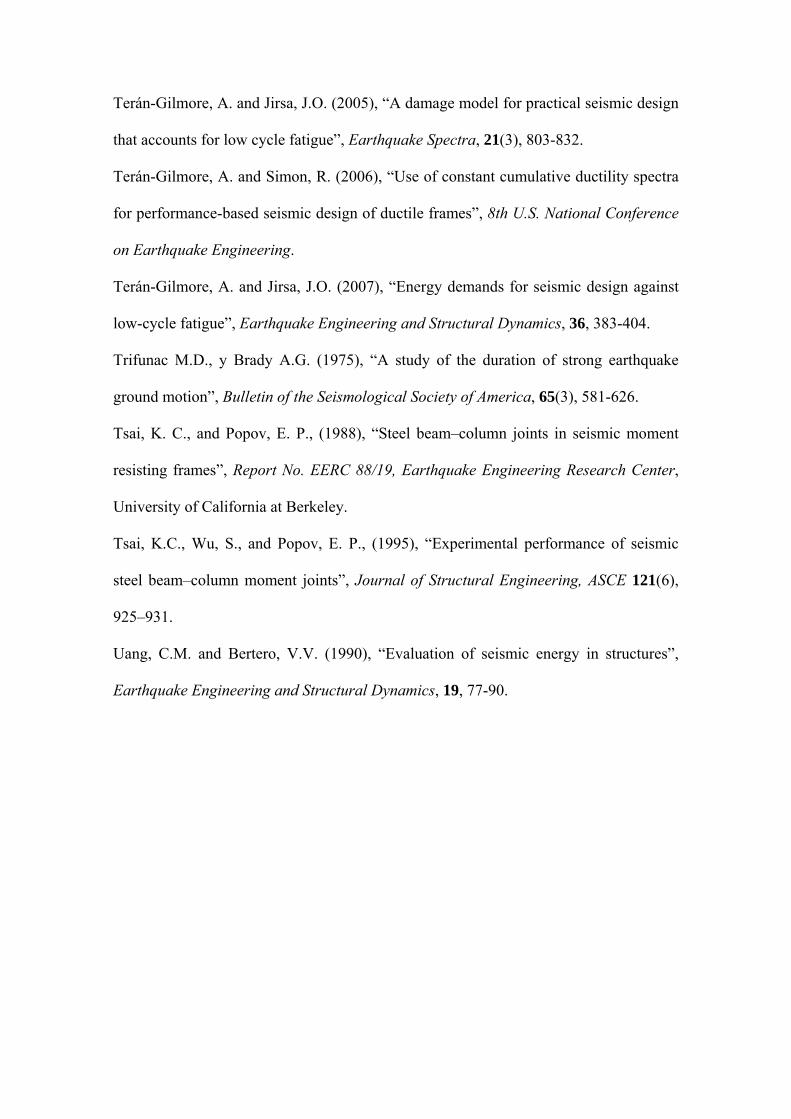
finally, Cy and Dy, the seismic coefficient and displacement at first yield, which can be
obtained, as shown in Fig. 1, from the capacity curve of the frames.
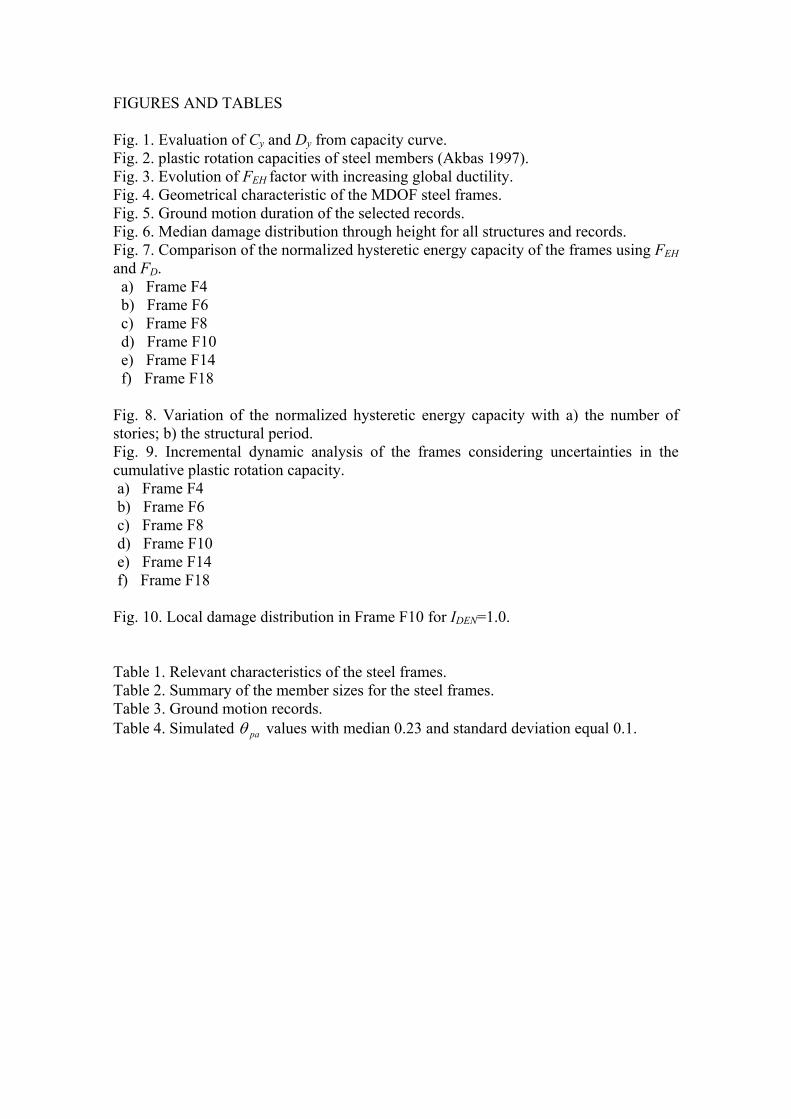
Eq. (7) shows the role of the cumulative plastic rotation capacity of the structural
members in the total energy dissipation capacity of a frame. Fig. 2 shows a wide range
of paθ values collected by Akbas (1997) from experimental tests of steel members
subjected to cyclic loading. Based on the results collected by Akbas, Bojórquez et al.
(2008b) found that the cumulative plastic rotation capacity of steel members is well
represented by a lognormal probability density function with a median value equal to
0.23.
ENERGY AND DAMAGE DISTRIBUTION IN REGULAR STEEL FRAMES
To estimate the contribution of the different structural members to the total plastic
hysteretic energy capacity of MDOF frames, it is usually necessary to assume a
distribution of plastic energy dissipation through height. For instance, while Akbas et al.
(2001) proposed a linear distribution, recent studies suggest that if energy dissipation is
concentrated in the beams of a frame, a lognormal distribution represents a better
approximation (Bojórquez et al. 2008a). A plastic hysteretic energy participation factor
( EHF ) need to be established to estimate the contribution of each story to the energy
dissipating capacity of a building according to Eq. (7). In particular, EHF can be
formulated so that it evaluates the percentage of the ultimate energy capacity that a story
dissipates during the ground motion (the critical stories contributing their full energy
dissipating capacity, fact that is expressed through a unitary value for EHF ). Normally,
an expression to describe the variation of EHF through height is derived from plastic
energy demand distributions estimated analytically in prototype frames and buildings.
From extensive statistical studies of eight steel moment resisting frames subjects to
several long duration ground motions, EHiF was estimated by Bojórquez et al. (2008a)
with the following expression:
(8)
where:
Fig. 3 shows the evolution of the value of EHF through height for buildings with
increasing ductility. Note the increase in the values of EHF , particularly in the upper
stories of the frames, for increasing ductility. This evolution indicates that the beams
located at the upper stories tend to contribute more to the energy dissipating capacity of
the frames as the global ductility in the frames increases.
Although this manner of establishing EHF provides a reasonable approximation on how
the structural members contribute to the total plastic hysteretic energy capacity of
framed structures; it has the limitation of not considering the actual energy dissipating
capacity of individual members, which may vary from story to story, and from bay to
bay. This implies, as will be discussed in the next section, the need to address the
damage distribution through height in lieu of the dissipated hysteretic energy
configuration.
Numerical characterization of damage distribution through height
The evaluation of a factor to characterize a damage distribution through height (FD) is
based herein on the energy damage models discussed in the previous sections. Six
regular steel frames designed according to the Mexico City Building Code were
( )( )
⎪⎭
⎪⎬⎫
⎪⎩
⎪⎨⎧
⎥⎦
⎤⎢⎣
⎡+
+−−
+−=
2
39.006.0)3461.0031.0ln()/ln(
21exp
/82.20675.01*
μμ
μHh
HhFEH
)1*,( EHEH FmínF =
subjected to 23 soft-soil long duration ground motions recorded in the Lake Zone of
Mexico City and exhibiting a dominant period (Ts) of two seconds. Particularly, all
motions were recorded during seismic events with magnitudes of seven or larger, and
having epicenters located at distances of 300 km or more from Mexico City. The
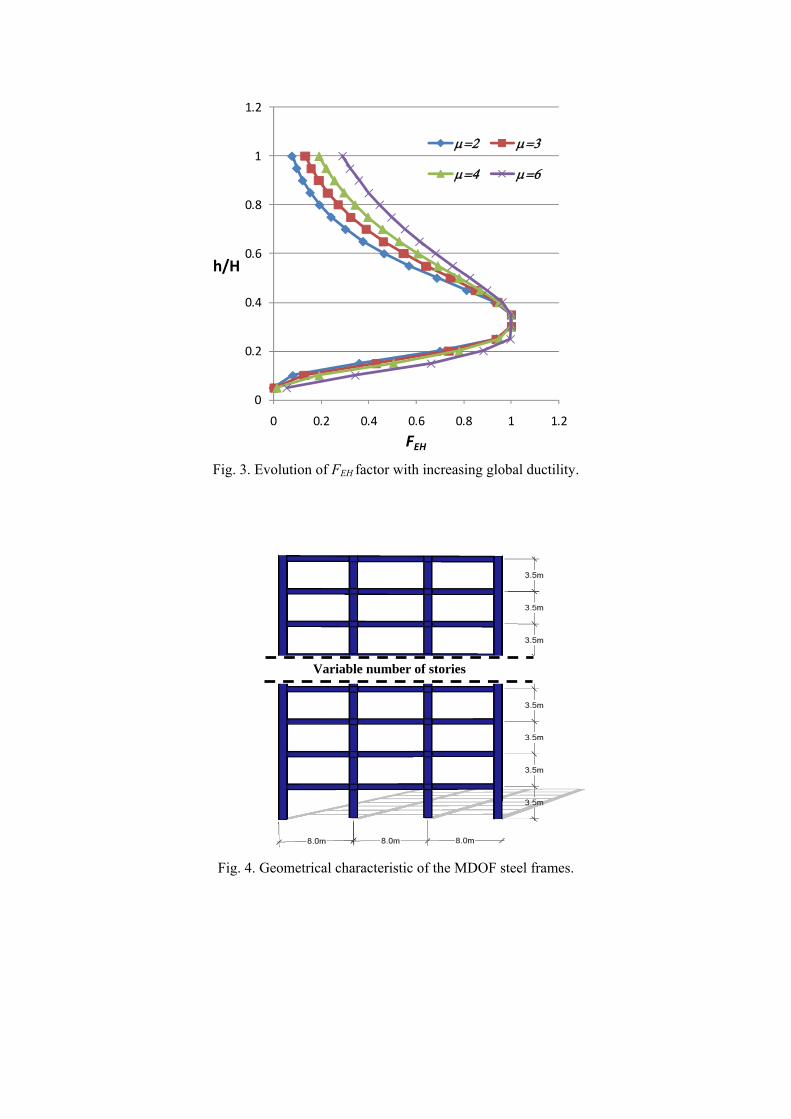
frames, which were assumed to be used for office occupancy, have three bays and a
number of levels that range from four to eighteen. The bay and inter-story dimensions
are those indicated in Fig. 4. The frames were designed for ductile detailing. A36 steel
and W sections were used for the beams and columns of the frames. An elasto-plastic
model with 3% strain-hardening was considered to model the cyclic behaviour of the
steel members (Bojórquez and Rivera, 2008). The critical damping ratio was assumed
equal to 3%. Relevant characteristics for each frame, such as the fundamental period of
vibration (T1), and the seismic coefficient and displacement at first yield (Cy and Dy) are
shown in Table 1 (the latter two values were established from pushover analyses). Note
that the frames exhibit a wide range of period values. Furthermore, Table 2 summarizes
the member sizes for all frames under consideration, while Table 3 summarizes the
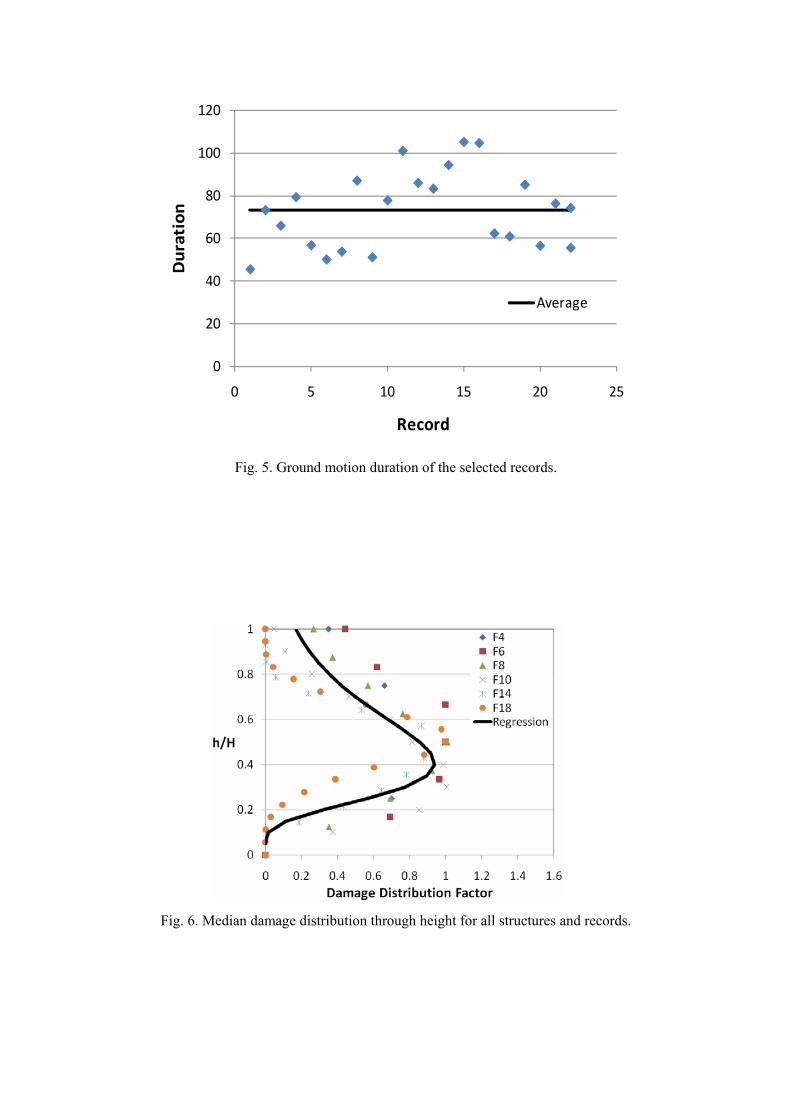
principal characteristics of the seismic records under consideration, and Fig. 5 shows
their ground motion duration established according to Trifunac and Brady (1975). This
duration is defined as the time interval delimited by the instants of time at which the 5%
and 95% of the Arias Intensity (Arias 1970) occurs. Note that the average duration of
the records equals 73.1 sec. The very long duration of the motions helps to illustrate the
importance of cumulative demand parameters during seismic design.
For the purpose of obtaining the damage distribution through height for a given frame,
the frame was subjected to all the records scaled up according to a target spectral
acceleration evaluated at its fundamental period of vibration Sa(T1). Several target
spectral accelerations were used in this manner until the median value of the damage
index in the critical story of the frame reached the value of one. The value of one
represents the threshold associated to structural failure of the MDOF steel frame. It
should be mentioned that all beams within a story exhibited similar level of damage, in
such manner that it is possible to assign a unique value of damage to that story.
Bojórquez et al. (2006) have discussed the pertinence of this approach to represent
structural failure. It was considered that the median value for the cumulative plastic
rotation capacity of the beams of the frames is equal to 0.23.
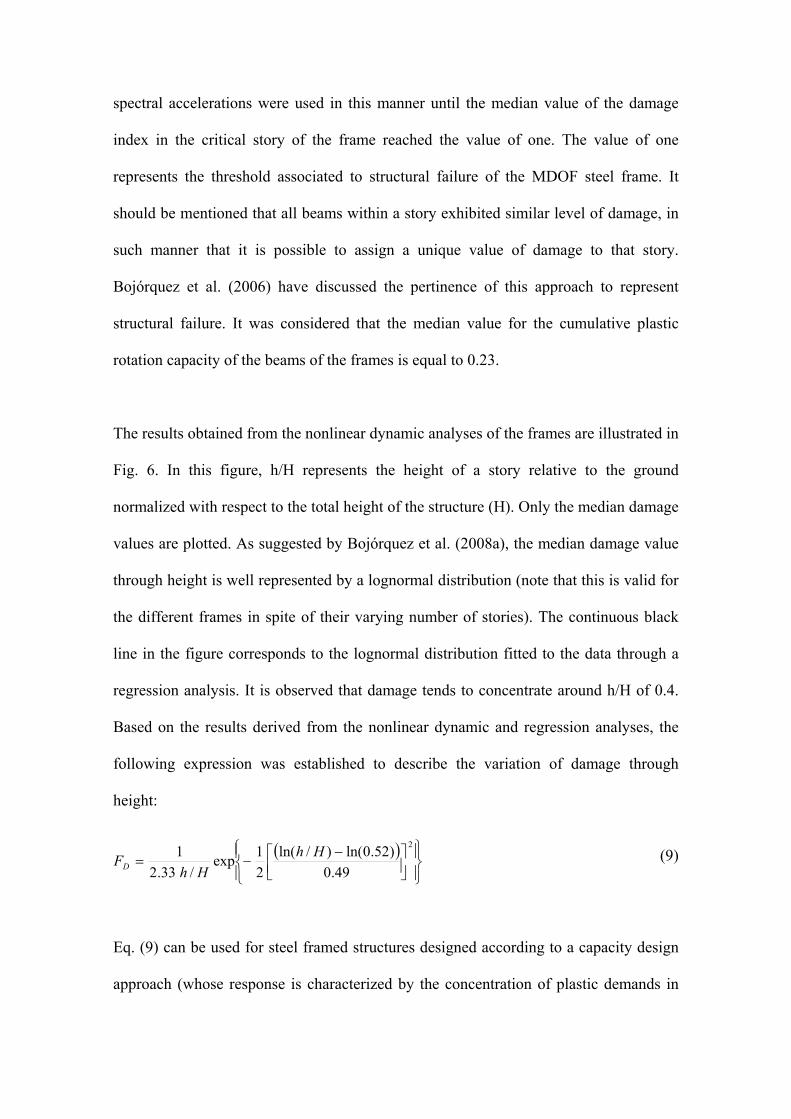
The results obtained from the nonlinear dynamic analyses of the frames are illustrated in
Fig. 6. In this figure, h/H represents the height of a story relative to the ground
normalized with respect to the total height of the structure (H). Only the median damage
values are plotted. As suggested by Bojórquez et al. (2008a), the median damage value
through height is well represented by a lognormal distribution (note that this is valid for
the different frames in spite of their varying number of stories). The continuous black
line in the figure corresponds to the lognormal distribution fitted to the data through a
regression analysis. It is observed that damage tends to concentrate around h/H of 0.4.
Based on the results derived from the nonlinear dynamic and regression analyses, the
following expression was established to describe the variation of damage through
height:
(9)
Eq. (9) can be used for steel framed structures designed according to a capacity design
approach (whose response is characterized by the concentration of plastic demands in
( )⎪⎭
⎪⎬⎫
⎪⎩
⎪⎨⎧
⎥⎦⎤
⎢⎣⎡ −
−=2
49.0)52.0ln()/ln(
21exp
/33.21 Hh
HhFD
the beams) and subjected to long duration ground motions. The value of FD derived
from Eq. (9) can be used in Eq. (7) in lieu of the energy participation factor (FEH) that
accounts for the different contribution of each story to the energy dissipating capacity of
the frame. Once the value of ENC is established, it can be used in Eq. (6) to evaluate the
structural performance of a frame.
Evaluation of normalized hysteretic energy capacity: FEH versus FD
The advantages of using the damage distribution through height factor (Eq. (9)) in lieu
of the hysteretic energy distribution through height factor (Eq.(8)) is discussed next. It
should be mentioned that the hysteretic energy distribution through height factor has
been used successfully in previous papers to assess damage in steel frames (e.g.,
Bojórquez et al. 2008a, 2008b).
While the value of FD only depends on the height with respect to the ground of the story
where the factor is estimated, the evaluation of FEH requires also the knowledge of the
maximum ductility demand associated to the failure of the frame. Although this
maximum ductility demand or target demand could be estimated for systems subjected
to severe cumulative plastic deformation demands (Bojórquez et al. 2009), this results
in added complication to the evaluation process in such manner that the use of FD
should be studied in terms of its technical pertinence during damage evaluation.
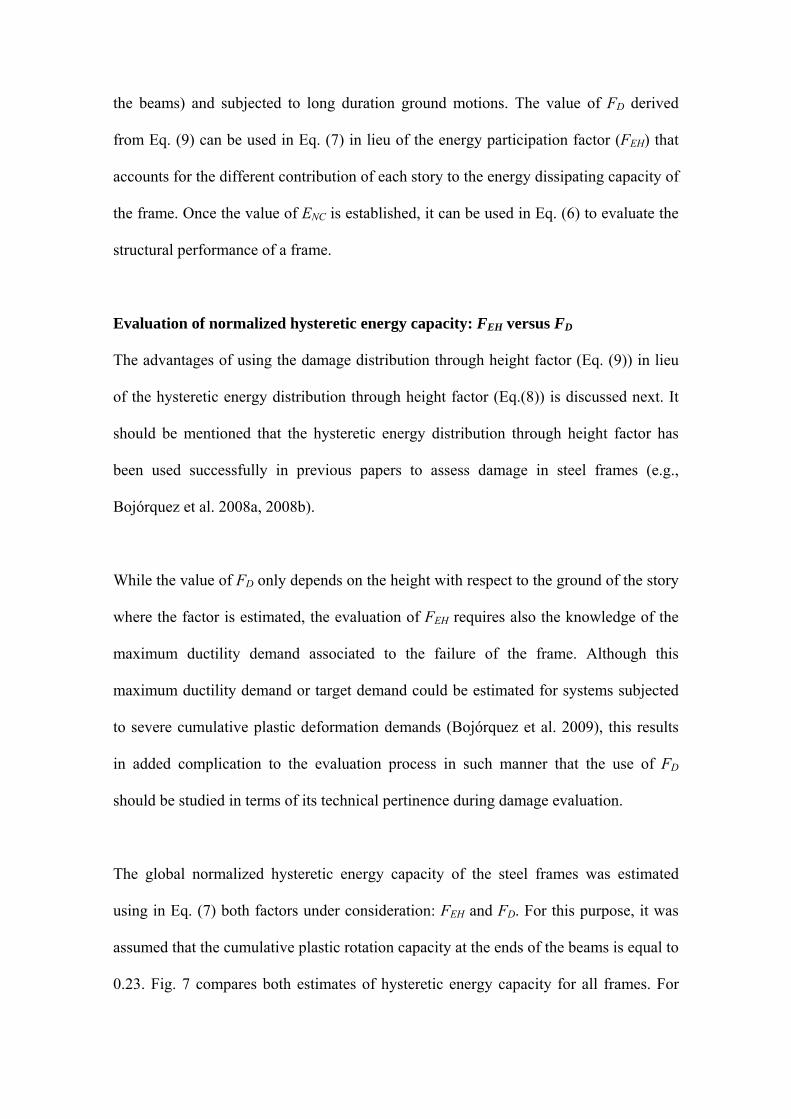
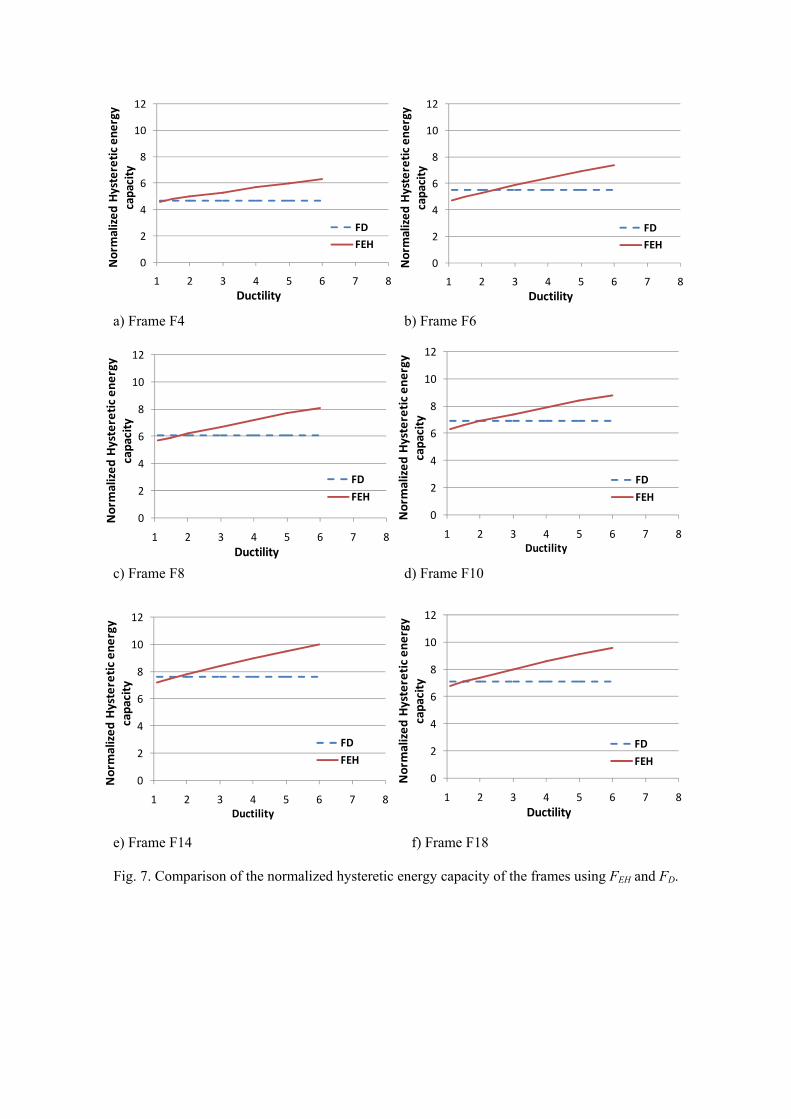
The global normalized hysteretic energy capacity of the steel frames was estimated
using in Eq. (7) both factors under consideration: FEH and FD. For this purpose, it was
assumed that the cumulative plastic rotation capacity at the ends of the beams is equal to
0.23. Fig. 7 compares both estimates of hysteretic energy capacity for all frames. For
any specific frame, the energy capacity derived from FD is constant throughout the
range of maximum ductilities under consideration. In contrast, the capacity derived
from FEH increases with increasing ductility. Note that for small and moderate ductility
demands (ranging from one to three), the energy capacities derived from both factors
are practically the same, in such way that an evaluation procedure that uses either one of
them will yield similar estimates of damage. Within this context, it is important to
mention that studies carried out by Bojórquez et al. (2009) suggest that ductile
structures can’t undergo ductility demands larger than three during severe ground
motions exhibiting high energy contents.
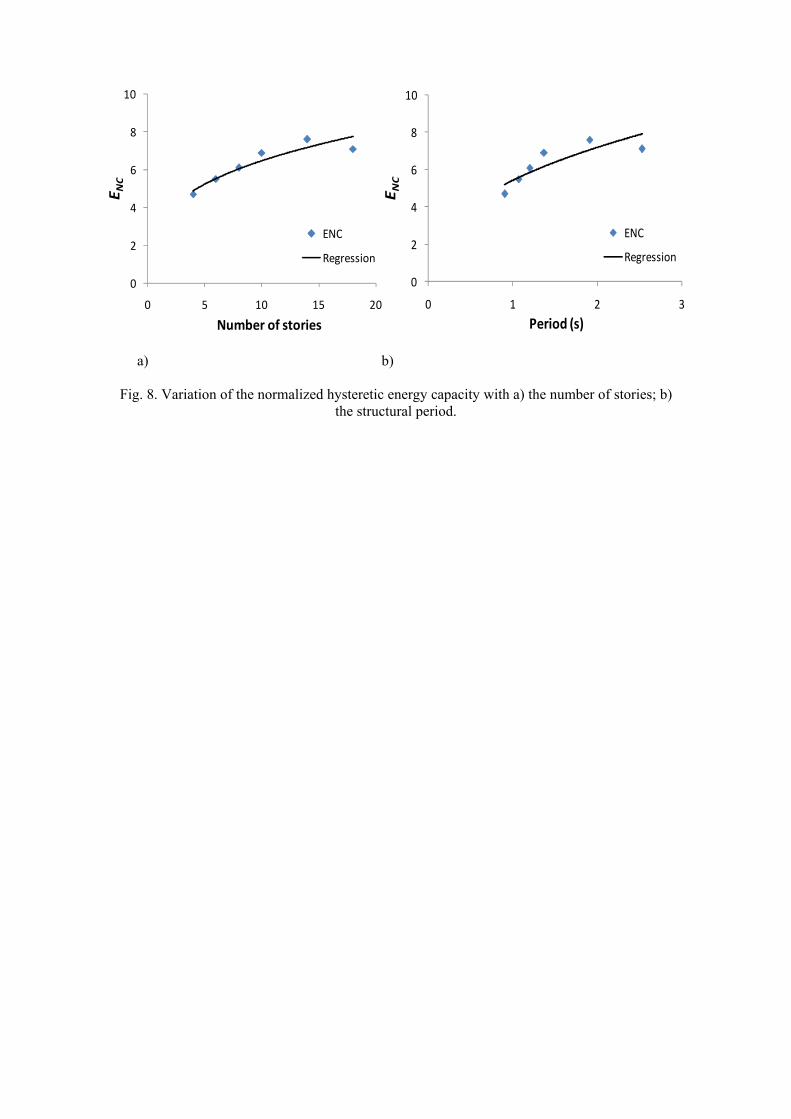
Fig. 8 shows the dependence of the energy capacity of the frames estimated from FD,
with respect to their number of stories and fundamental period of vibration period. As
shown, the normalized hysteretic energy capacity increases with the number of stories
and the structural period of the frames. It should be emphasized that the energy
capacities shown in Fig. 8 are those that the frames exhibit at failure.
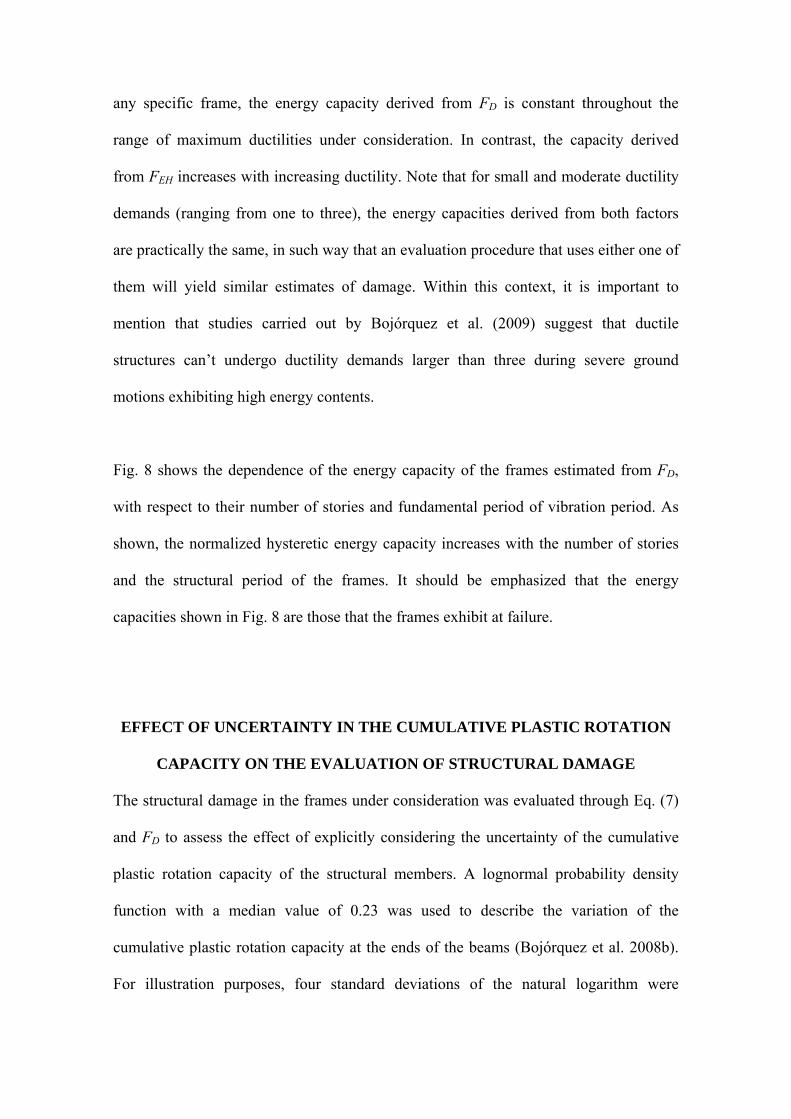
EFFECT OF UNCERTAINTY IN THE CUMULATIVE PLASTIC ROTATION
CAPACITY ON THE EVALUATION OF STRUCTURAL DAMAGE
The structural damage in the frames under consideration was evaluated through Eq. (7)
and FD to assess the effect of explicitly considering the uncertainty of the cumulative
plastic rotation capacity of the structural members. A lognormal probability density
function with a median value of 0.23 was used to describe the variation of the
cumulative plastic rotation capacity at the ends of the beams (Bojórquez et al. 2008b).
For illustration purposes, four standard deviations of the natural logarithm were
considered: 0, 0.1, 0.3 and 0.5. A standard deviation of zero corresponds to the mean
values. While it was assumed that the value of paθ varied in height according to the
lognormal density function, the value of paθ for all beams within a story was considered
equal. The paθ values obtained for all frames and a standard deviation of 0.1 are
summarized in Table 4.
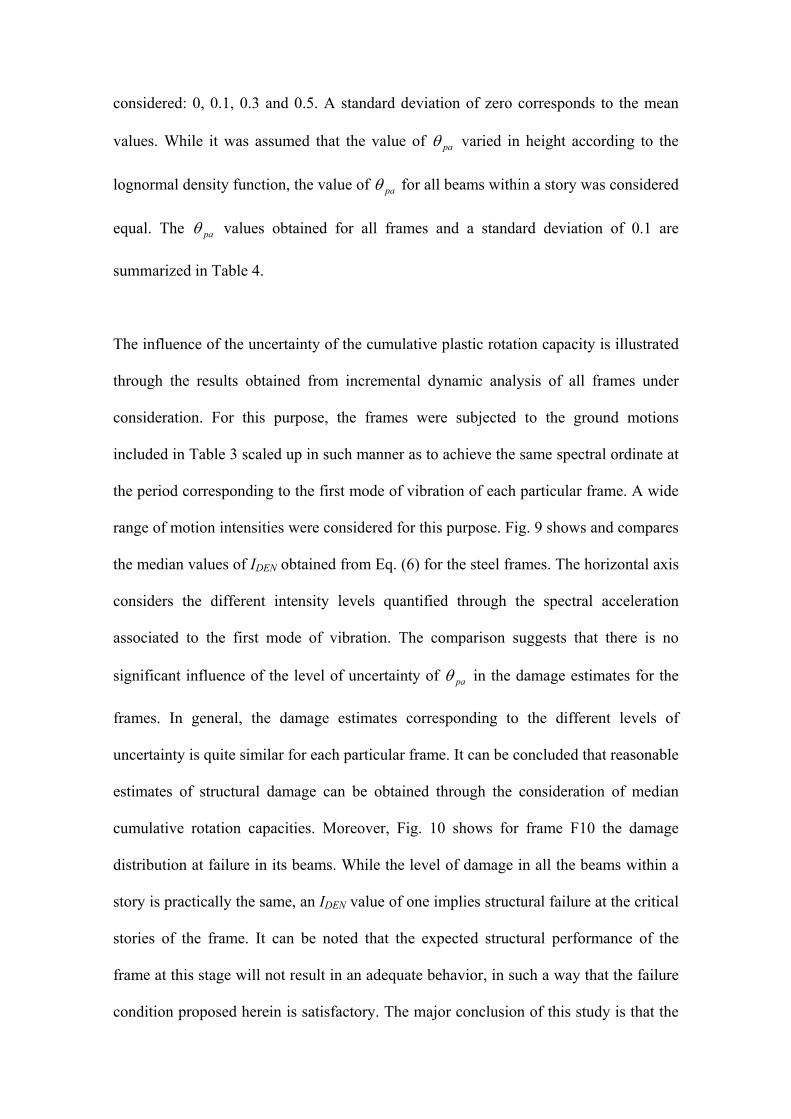
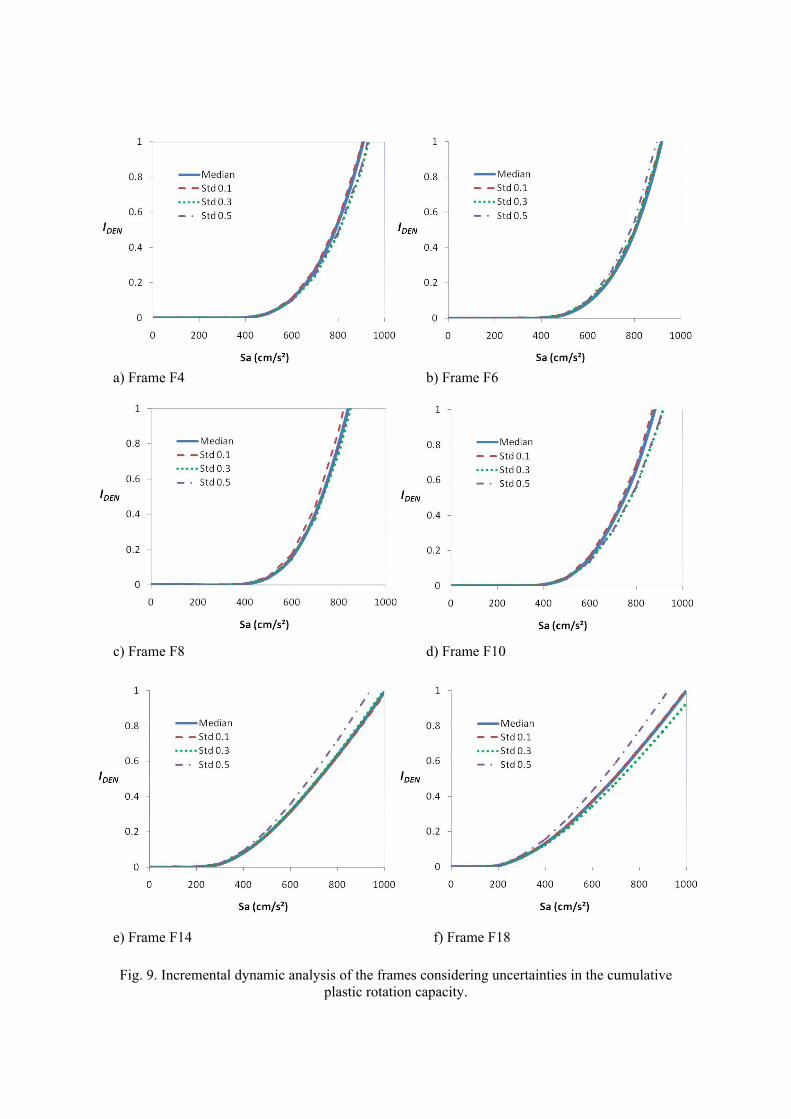
The influence of the uncertainty of the cumulative plastic rotation capacity is illustrated
through the results obtained from incremental dynamic analysis of all frames under
consideration. For this purpose, the frames were subjected to the ground motions
included in Table 3 scaled up in such manner as to achieve the same spectral ordinate at
the period corresponding to the first mode of vibration of each particular frame. A wide
range of motion intensities were considered for this purpose. Fig. 9 shows and compares
the median values of IDEN obtained from Eq. (6) for the steel frames. The horizontal axis
considers the different intensity levels quantified through the spectral acceleration
associated to the first mode of vibration. The comparison suggests that there is no
significant influence of the level of uncertainty of paθ in the damage estimates for the
frames. In general, the damage estimates corresponding to the different levels of
uncertainty is quite similar for each particular frame. It can be concluded that reasonable
estimates of structural damage can be obtained through the consideration of median
cumulative rotation capacities. Moreover, Fig. 10 shows for frame F10 the damage
distribution at failure in its beams. While the level of damage in all the beams within a
story is practically the same, an IDEN value of one implies structural failure at the critical
stories of the frame. It can be noted that the expected structural performance of the
frame at this stage will not result in an adequate behavior, in such a way that the failure
condition proposed herein is satisfactory. The major conclusion of this study is that the
approach discussed herein is a promising tool for practical structural damage evaluation
of structures subjected to large energy demands.
CONCLUSIONS
An energy-based damage model for multi-degree-of-freedom steel structures has been
proposed. The model is based on the demand-supply balance of normalized plastic
dissipated hysteretic energy. Particularly, the damage index is formulated as the ratio of
the normalized plastic hysteretic energy demand to its corresponding capacity. While a
value of zero for the damage model implies no structural damage, a unitary value
implies failure.
The principal challenge for the correct use of the model is the estimation of the
normalized plastic hysteretic energy capacity. To achieve a reasonable estimation of this
capacity, a damage distribution factor through height was proposed and calibrated. The
factor was compared with the hysteretic energy distribution factor. It was observed that
the normalized hysteretic energy capacity of a steel frame can be evaluated in a
reasonable manner with both factors. The results suggest that in general, structural
damage in regular steel frames tends to concentrate from one third to the half of its total
height (h/H around 0.4-0.5). Furthermore, no influence of the uncertainty in the
cumulative plastic rotation capacity was observed during the structural evaluation of the
steel frames.
The energy-based damage model introduced is a promising tool for the evaluation of the
seismic performance of structures subjected to long duration ground motion. In these
terms, the tool can be used for the formulation of design requirements of steel frames
that may be subjected to severe cumulative plastic deformation demands.
ACKNOWLEDGMENTS
The financial support given by El Consejo Nacional de Ciencia y Tecnología
(CONACYT) and by La Universidad Autónoma de Sinaloa under the grant PROFAPI
2009/026 is appreciated. Financial support also was received from Universidad
Autónoma Metropolitana and by DGAPA- UNAM under the grant 108708.
REFERENCES
Akbas, B. (1997). “Energy-based earthquake resistant design of steel moment resisting
frames”, PhD thesis, Department of Civil and Architectural Engineering, Illinois
Institute of Technology.
Akbas, B., Shen, J. and Hao, H. (2001). Energy approach in performance-based design
of steel moment resisting frames for basic safety objective. The Structural Design of
Tall Buildings, 10, 193-217.
Akiyama, H. 1985. Earthquake-Resistant Limit-State Design for Buildings, Tokyo:
University of Tokyo Press.
Arias, A. (1970), “A measure of earthquake intensity”, Seismic Design for Nuclear
Power Plants, edited by R. J. Hansen, MIT Press, Cambridge, MA, pp. 438-483.
Arroyo, D. and Ordaz, M. (2007), “Hysteretic energy demands for SDOF systems
subjected to narrow band earthquake ground motions. Applications to the lake bed zone
of Mexico City”, Journal of Earthquake Engineering, 11, 147-165.
Bojórquez, E. and Ruiz, S. E. (2004), “Strength reduction factors for the valley of
Mexico taking into account low cycle fatigue effects”, 13º World Conference on
Earthquake Engineering, Vancouver, Canada.
Bojórquez, E, Diaz, M.A., Ruiz, S.E. and Terán-Gilmore, A. (2006), “Correlation
between local and global cyclic structural capacity of SMR frames”, First European
Conference on Earthquake Engineering and Seismology, Geneva Switzerland.
Bojórquez, E., Ruiz, S.E. and Terán-Gilmore, A. (2008a), “Reliability-based evaluation
of steel structures using energy concepts, Engineering Structures, 30(6), 1745-1759.
Bojórquez, E., Terán-Gilmore, A. Ruiz, S.E. and Reyes-Salazar, A. (2008b),
“Evaluation of structural reliability of steel frames considering cumulative damage”,
The 14th World Conference on Earthquake Engineering, Beijing, China 2008.
Bojórquez, E. and Rivera, J. L. 2008. “Effects of degrading models for ductility and
dissipated hysteretic energy in uniform annual failure rate spectra”, The 14th World
Conference on Earthquake Engineering, Beijing, China 2008.
Bojórquez, E., Terán-Gilmore A., Bojórquez J., and Ruiz, S.E., (2009), “Explicit
consideration of cumulative damage for seismic design of structures through ductility
reduction factors”, Revista de Ingeniería Sísmica (Sociedad Mexicana de Ingeniería
Sísmica), 80, 31-62. (In Spanish)
Bozorgnia, Y. and Bertero, V. V. (2001), “Improved shaking and damage parameters
for post-earthquake applications”, Proceedings of the SMIP01 Seminar on Utilization of
Strong-Motion Data, Los Angeles, California.
Cosenza, E. and Manfredi, G. (1996), “Seismic design based on low cycle fatigue
criteria”. 11 World Conference on Earthquake Engineering, Acapulco, México.
Choi, H. and Kim, J. (2006), “Energy-based seismic design of buckling-restrained
braced frames using hysteretic energy spectrum”, Engineering Structures, 28, 304-311.
Engelhardt, M. D., Husain, A, S. (1992), “Cyclic tests on large scale steel moment
connections”, Report No. PMFSEL 92-2, Phil M. Ferguson Structural Engineering
Laboratory, University of Texas at Austin.
Fajfar, P. (1992), “Equivalent ductility factors taking into account low-cycle fatigue”,
Earthquake Engineering and Structural Dynamics, 21, 837-848.
Fajfar, P. and Krawinkler, H. (1997), “Conclusions and recommendations”, Seismic
Design Methodologies for the Next Generation of Codes, A. A. Balkema.
Hancock, J. and Bommer, J.J. (2006), “A state-of-knowledge review of the influence of
strong-motion duration on structural damage”, Earthquake Spectra, 22(3): 827-845.
Housner, G. W. (1956), “Limit design of structures to resist earthquakes”, First World
Conference on Earthquake Engineering, Berkeley, California.
Krawinkler, H. and Zohrei, M. (1983), “Cumulative damage in steel structure subjected
to earthquake ground motions”, Computer and Structures, 16, 531-541.
Krawinkler, H. and Nassar, A. (1992), “Seismic design based on ductility and
cumulative damage demands and capacities”, In Krawinkler H, Fajfar P. (ed.) Nonlinear
Seismic Analysis and Design of Reinforced Concrete Buildings, UK: Elsevier Applied
Science, 95-104.
Park, Y.J. and Ang, A.H. (1985), “Mechanistic seismic damage model for reinforced
concrete”, ASCE Journal of Structural Engineering, 111(ST4), 740-757.
Popov, E, P., and Stephen, R. M., (1972), “Cyclic loading of full-size steel
connections”, American Iron and Steel Institute, Bulletin No. 21.
Rodríguez, M.E. and Ariztizabal, J.C. (1999), “Evaluation of a seismic damage
parameter”. Earthquake Engineering and Structural Dynamics, 28, 463-477.
Rodríguez, M.E. and Padilla, C. (2008), “A damage index for the seismic analysis of
reinforced concrete members”, Journal of Earthquake Engineering, 13(3), 364-383.
Terán-Gilmore, A. (1996), “Performance-based earthquake-resistant design of framed
building using energy concepts”, PhD Thesis, University of California Berkley.
Terán-Gilmore, A. and Jirsa, J.O. (2005), “A damage model for practical seismic design
that accounts for low cycle fatigue”, Earthquake Spectra, 21(3), 803-832.
Terán-Gilmore, A. and Simon, R. (2006), “Use of constant cumulative ductility spectra
for performance-based seismic design of ductile frames”, 8th U.S. National Conference
on Earthquake Engineering.
Terán-Gilmore, A. and Jirsa, J.O. (2007), “Energy demands for seismic design against
low-cycle fatigue”, Earthquake Engineering and Structural Dynamics, 36, 383-404.
Trifunac M.D., y Brady A.G. (1975), “A study of the duration of strong earthquake
ground motion”, Bulletin of the Seismological Society of America, 65(3), 581-626.
Tsai, K. C., and Popov, E. P., (1988), “Steel beam–column joints in seismic moment
resisting frames”, Report No. EERC 88/19, Earthquake Engineering Research Center,
University of California at Berkeley.
Tsai, K.C., Wu, S., and Popov, E. P., (1995), “Experimental performance of seismic
steel beam–column moment joints”, Journal of Structural Engineering, ASCE 121(6),
925–931.
Uang, C.M. and Bertero, V.V. (1990), “Evaluation of seismic energy in structures”,
Earthquake Engineering and Structural Dynamics, 19, 77-90.
FIGURES AND TABLES Fig. 1. Evaluation of Cy and Dy from capacity curve. Fig. 2. plastic rotation capacities of steel members (Akbas 1997). Fig. 3. Evolution of FEH factor with increasing global ductility. Fig. 4. Geometrical characteristic of the MDOF steel frames. Fig. 5. Ground motion duration of the selected records. Fig. 6. Median damage distribution through height for all structures and records. Fig. 7. Comparison of the normalized hysteretic energy capacity of the frames using FEH and FD. a) Frame F4 b) Frame F6 c) Frame F8 d) Frame F10 e) Frame F14 f) Frame F18
Fig. 8. Variation of the normalized hysteretic energy capacity with a) the number of stories; b) the structural period. Fig. 9. Incremental dynamic analysis of the frames considering uncertainties in the cumulative plastic rotation capacity. a) Frame F4 b) Frame F6 c) Frame F8 d) Frame F10 e) Frame F14 f) Frame F18
Fig. 10. Local damage distribution in Frame F10 for IDEN=1.0. Table 1. Relevant characteristics of the steel frames. Table 2. Summary of the member sizes for the steel frames. Table 3. Ground motion records. Table 4. Simulated paθ values with median 0.23 and standard deviation equal 0.1.
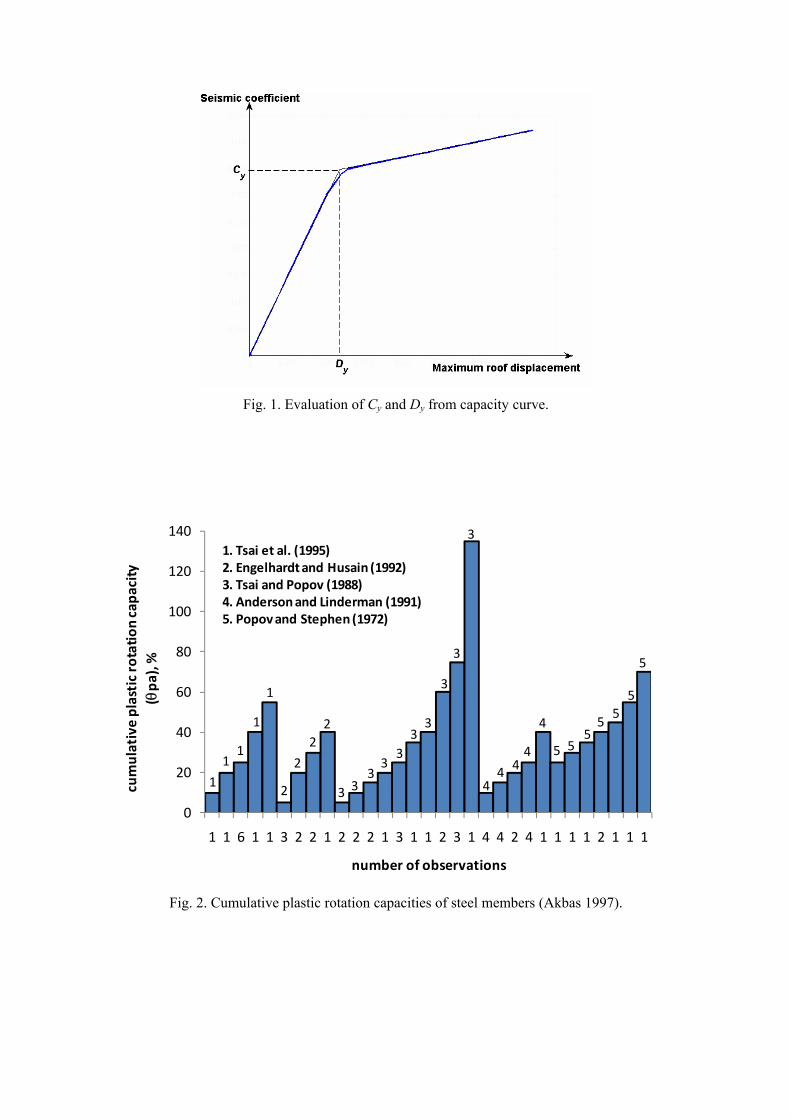
Fig. 1. Evaluation of Cy and Dy from capacity curve.
0
20
40
60
80
100
120
140
1 1 6 1 1 3 2 2 1 2 2 2 1 3 1 1 2 3 1 4 4 2 4 1 1 1 1 2 1 1 1
cumulative plastic rotatio
n capa
city
(θpa
), %
number of observations
1
11
1
1
2
2
22
3 333
333
3
3
3
44 4
4
4
5 555
55
5
1. Tsai et al. (1995)2. Engelhardt and Husain (1992)3. Tsai and Popov (1988)4. Anderson and Linderman (1991)5. Popov and Stephen (1972)
Fig. 2. Cumulative plastic rotation capacities of steel members (Akbas 1997).
0
0.2
0.4
0.6
0.8
1
1.2
0 0.2 0.4 0.6 0.8 1 1.2
h/H
FEH
μ=2 μ=3
μ=4 μ=6
Fig. 3. Evolution of FEH factor with increasing global ductility.
Fig. 4. Geometrical characteristic of the MDOF steel frames.
Variable number of stories
0
20
40
60
80
100
120
0 5 10 15 20 25
Duration
Record
Average
Fig. 5. Ground motion duration of the selected records.
Fig. 6. Median damage distribution through height for all structures and records.
0
2
4
6
8
10
12
1 2 3 4 5 6 7 8
Normalized
Hysteretic
ene
rgy
capacity
Ductility
FD
FEH
0
2
4
6
8
10
12
1 2 3 4 5 6 7 8
Normalized
Hysteretic
ene
rgy
capacity
Ductility
FD
FEH
0
2
4
6
8
10
12
1 2 3 4 5 6 7 8
Normalized
Hysteretic en
ergy
capacity
Ductility
FD
FEH
0
2
4
6
8
10
12
1 2 3 4 5 6 7 8
Normalized
Hysteretic en
ergy
capacity
Ductility
FD
FEH
0
2
4
6
8
10
12
1 2 3 4 5 6 7 8
Normalized
Hysteretic en
ergy
capacity
Ductility
FD
FEH
0
2
4
6
8
10
12
1 2 3 4 5 6 7 8
Normalized
Hysteretic en
ergy
capacity
Ductility
FD
FEH
a) Frame F4 b) Frame F6
c) Frame F8 d) Frame F10
e) Frame F14 f) Frame F18
Fig. 7. Comparison of the normalized hysteretic energy capacity of the frames using FEH and FD.
0
2
4
6
8
10
0 1 2 3
E NC
Period (s)
ENC
Regression
0
2
4
6
8
10
0 5 10 15 20
E NC
Number of stories
ENC
Regression
a) b)
Fig. 8. Variation of the normalized hysteretic energy capacity with a) the number of stories; b) the structural period.
a) Frame F4 b) Frame F6
c) Frame F8 d) Frame F10
e) Frame F14 f) Frame F18
Fig. 9. Incremental dynamic analysis of the frames considering uncertainties in the cumulative plastic rotation capacity.
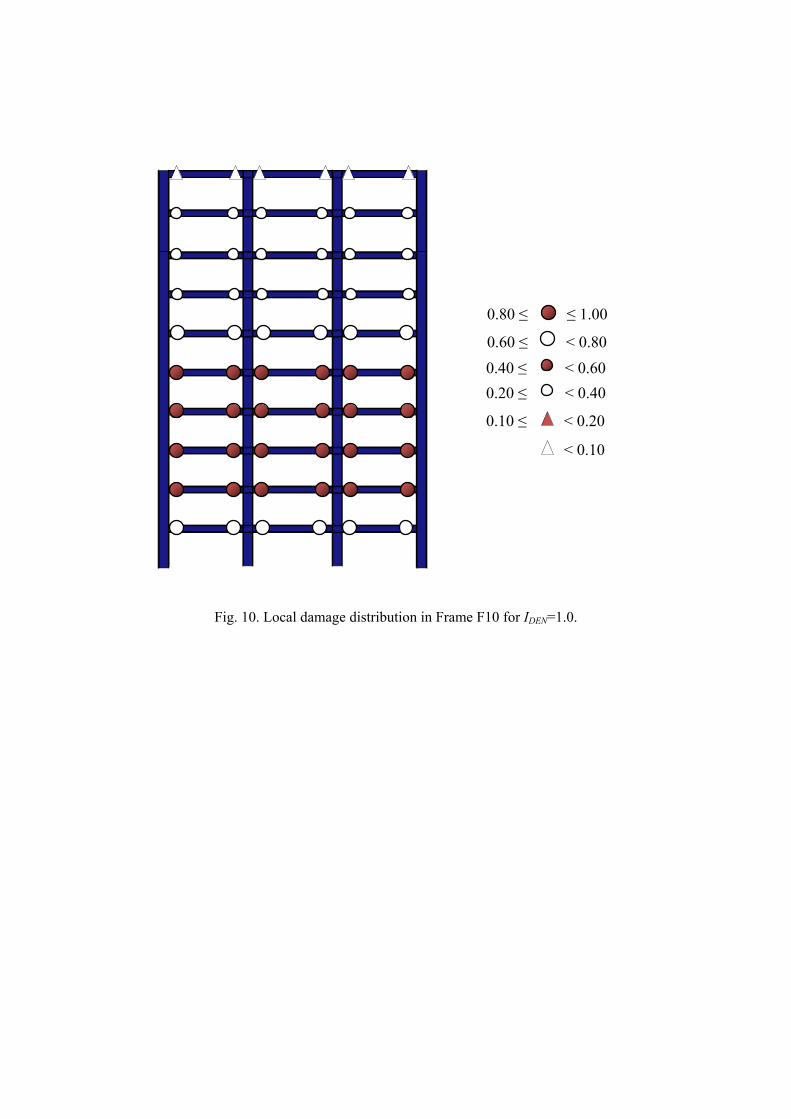
Fig. 10. Local damage distribution in Frame F10 for IDEN=1.0.
≤ 1.00 0.80 ≤
< 0.80 0.60 ≤ < 0.60 0.40 ≤ < 0.40 0.20 ≤
< 0.20 0.10 ≤
< 0.10
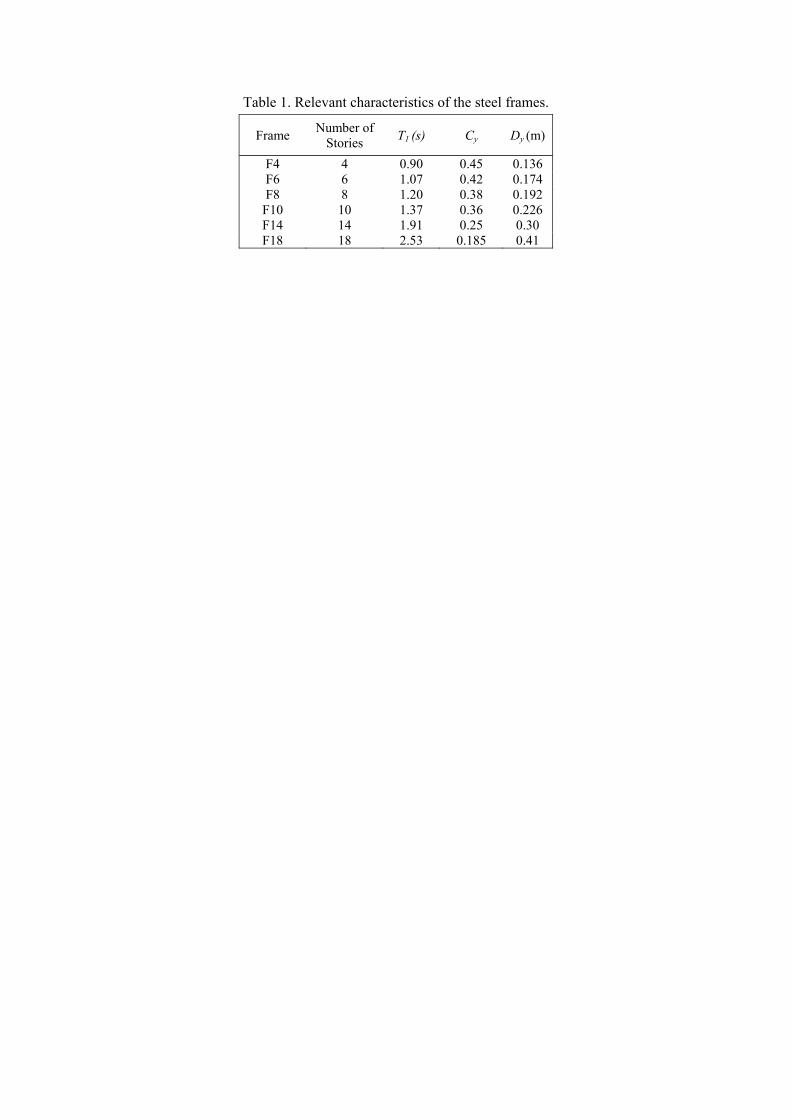
Table 1. Relevant characteristics of the steel frames.
Frame Number of Stories T1 (s) Cy Dy (m)
F4 4 0.90 0.45 0.136 F6 6 1.07 0.42 0.174 F8 8 1.20 0.38 0.192
F10 10 1.37 0.36 0.226 F14 14 1.91 0.25 0.30 F18 18 2.53 0.185 0.41
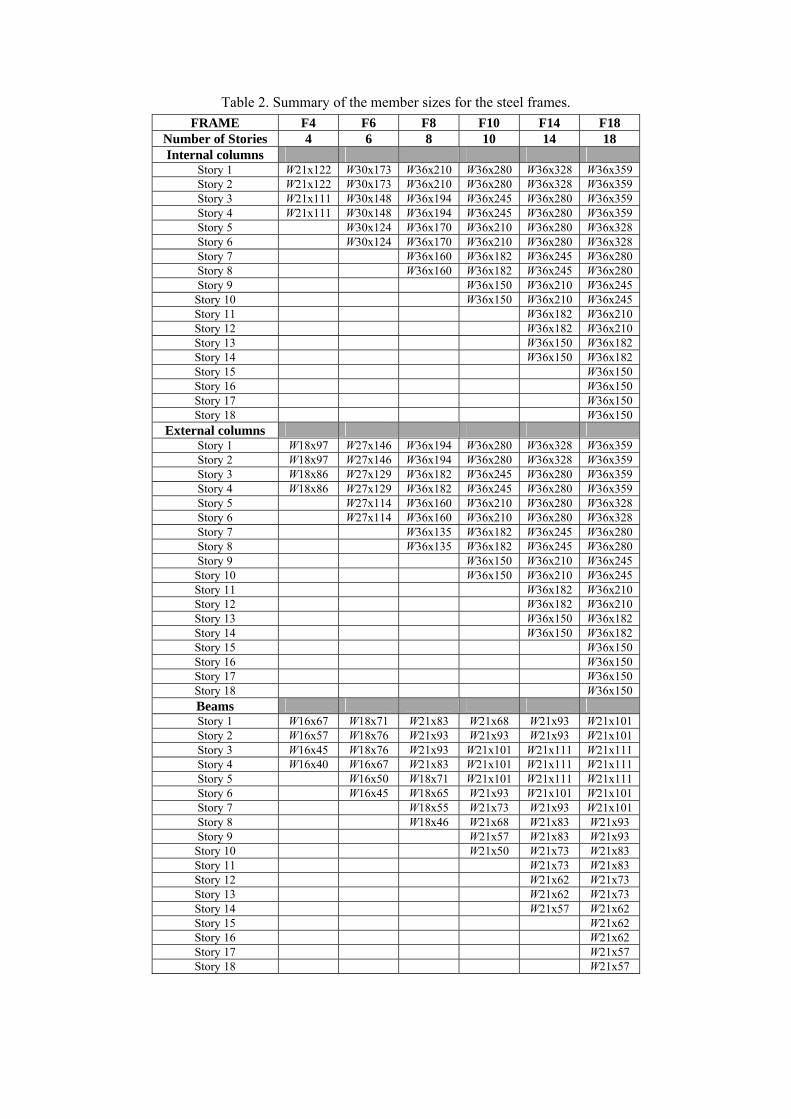
Table 2. Summary of the member sizes for the steel frames. FRAME F4 F6 F8 F10 F14 F18
Number of Stories 4 6 8 10 14 18 Internal columns
Story 1 W21x122 W30x173 W36x210 W36x280 W36x328 W36x359 Story 2 W21x122 W30x173 W36x210 W36x280 W36x328 W36x359 Story 3 W21x111 W30x148 W36x194 W36x245 W36x280 W36x359 Story 4 W21x111 W30x148 W36x194 W36x245 W36x280 W36x359 Story 5 W30x124 W36x170 W36x210 W36x280 W36x328 Story 6 W30x124 W36x170 W36x210 W36x280 W36x328 Story 7 W36x160 W36x182 W36x245 W36x280 Story 8 W36x160 W36x182 W36x245 W36x280 Story 9 W36x150 W36x210 W36x245 Story 10 W36x150 W36x210 W36x245 Story 11 W36x182 W36x210 Story 12 W36x182 W36x210 Story 13 W36x150 W36x182 Story 14 W36x150 W36x182 Story 15 W36x150 Story 16 W36x150 Story 17 W36x150 Story 18 W36x150
External columns Story 1 W18x97 W27x146 W36x194 W36x280 W36x328 W36x359 Story 2 W18x97 W27x146 W36x194 W36x280 W36x328 W36x359 Story 3 W18x86 W27x129 W36x182 W36x245 W36x280 W36x359 Story 4 W18x86 W27x129 W36x182 W36x245 W36x280 W36x359 Story 5 W27x114 W36x160 W36x210 W36x280 W36x328 Story 6 W27x114 W36x160 W36x210 W36x280 W36x328 Story 7 W36x135 W36x182 W36x245 W36x280 Story 8 W36x135 W36x182 W36x245 W36x280 Story 9 W36x150 W36x210 W36x245 Story 10 W36x150 W36x210 W36x245 Story 11 W36x182 W36x210 Story 12 W36x182 W36x210 Story 13 W36x150 W36x182 Story 14 W36x150 W36x182 Story 15 W36x150 Story 16 W36x150 Story 17 W36x150 Story 18 W36x150 Beams Story 1 W16x67 W18x71 W21x83 W21x68 W21x93 W21x101 Story 2 W16x57 W18x76 W21x93 W21x93 W21x93 W21x101 Story 3 W16x45 W18x76 W21x93 W21x101 W21x111 W21x111 Story 4 W16x40 W16x67 W21x83 W21x101 W21x111 W21x111 Story 5 W16x50 W18x71 W21x101 W21x111 W21x111 Story 6 W16x45 W18x65 W21x93 W21x101 W21x101 Story 7 W18x55 W21x73 W21x93 W21x101 Story 8 W18x46 W21x68 W21x83 W21x93 Story 9 W21x57 W21x83 W21x93 Story 10 W21x50 W21x73 W21x83 Story 11 W21x73 W21x83 Story 12 W21x62 W21x73 Story 13 W21x62 W21x73 Story 14 W21x57 W21x62 Story 15 W21x62 Story 16 W21x62 Story 17 W21x57 Story 18 W21x57
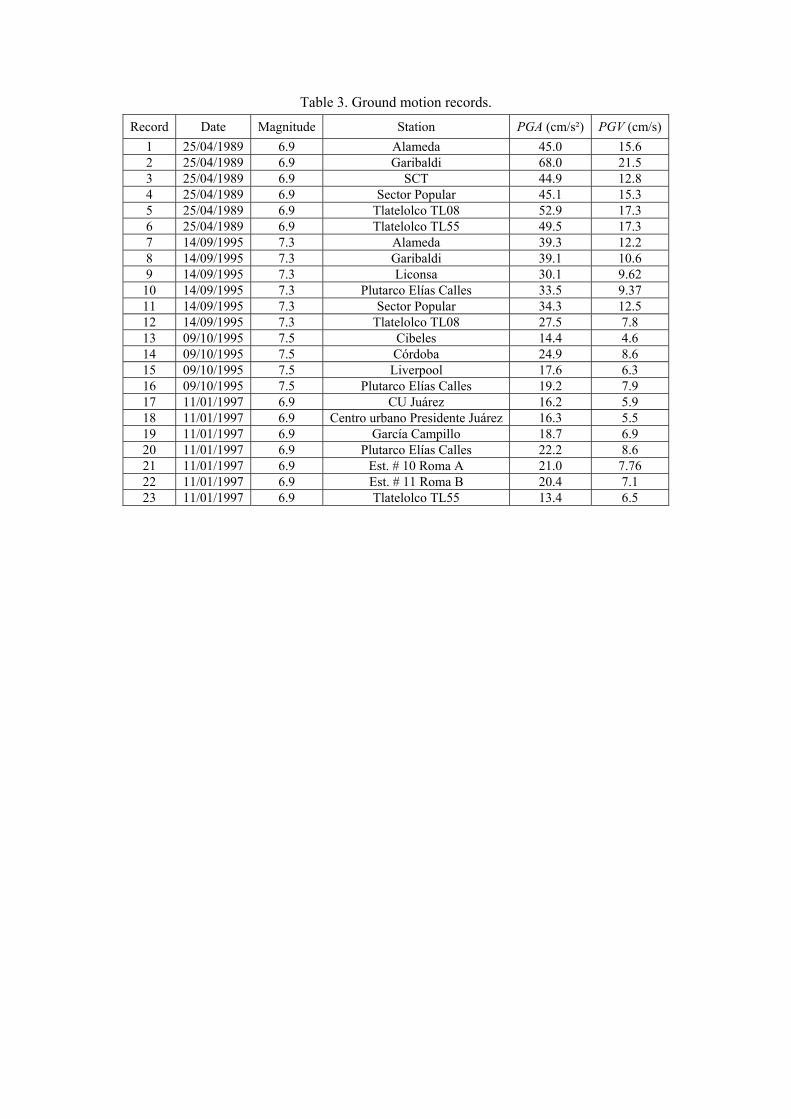
Table 3. Ground motion records.
Record Date Magnitude Station PGA (cm/s²) PGV (cm/s) 1 25/04/1989 6.9 Alameda 45.0 15.6 2 25/04/1989 6.9 Garibaldi 68.0 21.5 3 25/04/1989 6.9 SCT 44.9 12.8 4 25/04/1989 6.9 Sector Popular 45.1 15.3 5 25/04/1989 6.9 Tlatelolco TL08 52.9 17.3 6 25/04/1989 6.9 Tlatelolco TL55 49.5 17.3 7 14/09/1995 7.3 Alameda 39.3 12.2 8 14/09/1995 7.3 Garibaldi 39.1 10.6 9 14/09/1995 7.3 Liconsa 30.1 9.62
10 14/09/1995 7.3 Plutarco Elías Calles 33.5 9.37 11 14/09/1995 7.3 Sector Popular 34.3 12.5 12 14/09/1995 7.3 Tlatelolco TL08 27.5 7.8 13 09/10/1995 7.5 Cibeles 14.4 4.6 14 09/10/1995 7.5 Córdoba 24.9 8.6 15 09/10/1995 7.5 Liverpool 17.6 6.3 16 09/10/1995 7.5 Plutarco Elías Calles 19.2 7.9 17 11/01/1997 6.9 CU Juárez 16.2 5.9 18 11/01/1997 6.9 Centro urbano Presidente Juárez 16.3 5.5 19 11/01/1997 6.9 García Campillo 18.7 6.9 20 11/01/1997 6.9 Plutarco Elías Calles 22.2 8.6 21 11/01/1997 6.9 Est. # 10 Roma A 21.0 7.76 22 11/01/1997 6.9 Est. # 11 Roma B 20.4 7.1 23 11/01/1997 6.9 Tlatelolco TL55 13.4 6.5
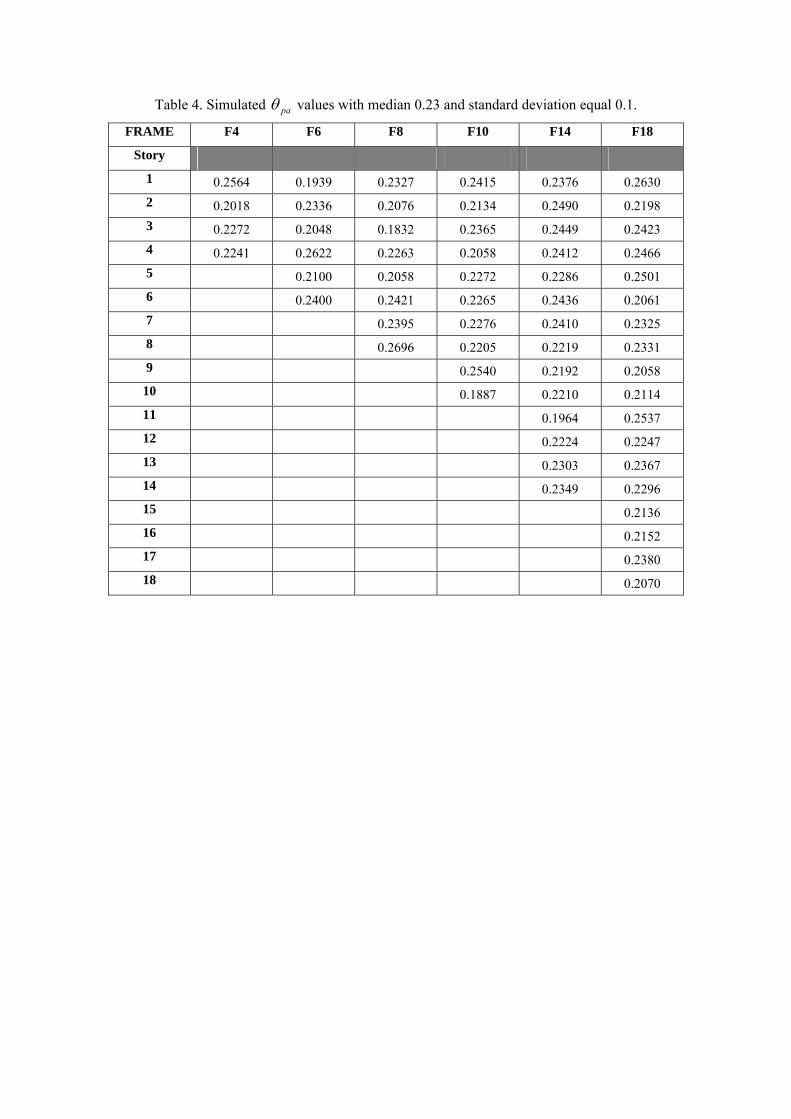
Table 4. Simulated paθ values with median 0.23 and standard deviation equal 0.1.
FRAME F4 F6 F8 F10 F14 F18
Story
1 0.2564 0.1939 0.2327 0.2415 0.2376 0.2630 2 0.2018 0.2336 0.2076 0.2134 0.2490 0.2198 3 0.2272 0.2048 0.1832 0.2365 0.2449 0.2423 4 0.2241 0.2622 0.2263 0.2058 0.2412 0.2466 5 0.2100 0.2058 0.2272 0.2286 0.2501 6 0.2400 0.2421 0.2265 0.2436 0.2061 7 0.2395 0.2276 0.2410 0.2325 8 0.2696 0.2205 0.2219 0.2331 9 0.2540 0.2192 0.2058
10 0.1887 0.2210 0.2114 11 0.1964 0.2537 12 0.2224 0.2247 13 0.2303 0.2367 14 0.2349 0.2296 15 0.2136 16 0.2152 17 0.2380 18 0.2070