dynamics japan's challenging debt · japan’s challenging debt dynamics this working paper...
TRANSCRIPT

Please cite this paper as:
Guillemette, Y. and J. Strasky (2013), “Japan's ChallengingDebt Dynamics”, OECD Economics Department WorkingPapers, No. 1085, OECD Publishing.http://dx.doi.org/10.1787/5k41w045v6mp-en
OECD Economics Department WorkingPapers No. 1085
Japan's Challenging DebtDynamics
Yvan Guillemette, Jan Strasky
JEL Classification: E63, H68

Unclassified ECO/WKP(2013)77 Organisation de Coopération et de Développement Économiques Organisation for Economic Co-operation and Development 14-Aug-2013 ___________________________________________________________________________________________
English - Or. English ECONOMICS DEPARTMENT
JAPAN’S CHALLENGING DEBT DYNAMICS ECONOMICS DEPARTMENT WORKING PAPER No. 1085
By Yvan Guillemette and Jan Strasky
All Economics Department Working Papers are available through OECD's Internet website at http://www.oecd.org/eco/Workingpapers
JT03343607
Complete document available on OLIS in its original format This document and any map included herein are without prejudice to the status of or sovereignty over any territory, to the delimitation of international frontiers and boundaries and to the name of any territory, city or area.
ECO
/WK
P(2013)77 U
nclassified
English - O
r. English

ECO/WKP(2013)77
2
Abstract/Résumé
Japan’s challenging debt dynamics
This working paper presents the background and the details of the simulations behind Box 1.4 of the May 2013 OECD Economic Outlook. A small simulation model is used to evaluate the contribution that the three pillars of the government’s strategy – fiscal consolidation, growth-boosting structural reforms and higher inflation – could make to reversing the rise in Japan’s public debt ratio, currently about 230% of GDP. The findings indicate that fiscal consolidation amounting to around 10 percentage points of GDP is necessary by 2020 to eliminate the primary deficit, as targeted in the current medium-term fiscal strategy. With moderately higher growth coming from increased female labour force participation and higher productivity growth, as well as inflation gradually rising to 2% thanks to unconventional monetary policy measures, the debt ratio would likely be put on a resolute downward trajectory by the end of this decade, although it is likely to remain around 200% of GDP in 2035.
JEL classification codes: E63; H68. Key words: Japan; debt; deficit; fiscal; budget; projection; simulation; arrow; consolidation; growth; inflation; reform.
********************
L’inquiétante évolution de la dette publique au Japon
Ce document de travail présente la toile de fond et les détails des simulations derrière l’encadré 1.4 du numéro de Mai 2013 des Perspectives économiques de l’OCDE. Un modèle de simulation de petite taille est utilisé pour évaluer dans quelle mesure les trois piliers de la stratégie gouvernementale – consolidation budgétaire, réformes structurelles pour doper la croissance et inflation plus élevée – pourraient contribuer à renverser l’évolution du ratio d’endettement publique au Japon, actuellement autour de 230% du PIB. Les résultats indiquent qu’environ 10 points de PIB de consolidation budgétaire sont nécessaires d’ici 2020 pour éliminer le déficit primaire, tel que prévue par la stratégie fiscale à moyen terme. Avec une croissance accrue due à une augmentation de la participation des femmes au marché du travail, et à une inflation plus élevée due aux mesures de politique monétaire non conventionnelles, le ratio d’endettement serait vraisemblablement sur une pente résolument descendante d’ici la fin de la décennie, bien qu’il demeurerait quand même autour de 200% en 2035.
Classification JEL : E63 ; H68. Mots clefs : japon ; dette ; déficit ; fiscal ; budget ; projection ; simulation ; flèche ; consolidation ; croissance ; inflation ; réforme.
© OECD (2013) You can copy, download or print OECD content for your own use, and you can include excerpts from OECD publications, databases and multimedia products in your own documents, presentations, blogs, websites and teaching materials, provided that suitable acknowledgment of OECD as source and copyright owner is given. All requests for commercial use and translation rights should be submitted to [email protected].

ECO/WKP(2013)77
3
TABLE OF CONTENTS
JAPAN’S CHALLENGING DEBT DYNAMICS ......................................................................................... 5
1. Introduction ...................................................................................................................................... 5 2. The scale of the challenge ................................................................................................................ 5 3. How much can the government’s three-pillar strategy lower the debt burden? ................................... 6
3.1 The first pillar: flexible fiscal policy ........................................................................................... 6 3.2 The second pillar: new growth strategy to lift potential growth ................................................. 8 3.3 The third pillar: bold monetary policy to achieve the 2% inflation target .................................. 9
4. What if the fiscal multiplier is higher? ............................................................................................... 11 5. The time dimension ........................................................................................................................ 12
REFERENCES ............................................................................................................................................. 13
Boxes
Box 1. Main features of the simulation model ............................................................................................ 7 Tables
1. Scenario 1: Fiscal stimulus followed by consolidation ........................................................................... 8 2. Scenario 2: Scenario 1 + higher potential growth ................................................................................... 9 3 Scenario 3: Scenario 2 + 2% inflation target .......................................................................................... 10 4 Scenario 4: Scenario 3 with no pass-through of inflation into higher interest rates ............................... 10 5 Scenario 5: Scenario 3 with a fiscal multiplier of 1. .............................................................................. 12
Figures
Figure 1. Impact of increasing the fiscal multiplier from 0.5 to 1.0 in scenario 3 .................................... 11 Figure 2. Evolution of the public debt burden in Japan over the medium term under the government’s three-pillar strategy.................................................................................................................................... 12

ECO/WKP(2013)77
4

ECO/WKP(2013)77
5
JAPAN’S CHALLENGING DEBT DYNAMICS
by Yvan Guillemette and Jan Strasky1
1. Introduction
1. With very high public debt, a large primary deficit, low growth and a history of persistent deflation, Japan is vulnerable to a loss of market confidence in the sustainability of its public finances. A sovereign debt crisis in Japan would be an important source of instability for the world economy given the size of the Japanese economy and its deep international linkages, including those of financial institutions, which hold the bulk of government liabilities. The challenge for Japan is thus to reduce the structural budget deficit and boost nominal GDP growth to prevent the risk of such a scenario. After setting out the scope of the fiscal challenge, this paper uses a small simulation model to evaluate the contribution that the three-pillar strategy announced by the new government in January – fiscal consolidation, structural reforms to boost trend growth and a higher inflation target – could make to lowering the debt ratio over the medium term. It provides details behind the discussion and simulations in Box 1.4 of the May 2013 OECD Economic Outlook. The main finding is that the government’s strategy, if fully implemented, would put the gross debt ratio on a mild downward track, but it could remain close to 200% of GDP in 2035, implying that more radical strategies may be necessary if the debt burden is to be reduced more quickly.
2. The scale of the challenge
2. The sustainability issues facing Japan can be illustrated in a very simple framework. The evolution of debt as a share of GDP (d) depends on the primary balance as a share of GDP (pb), on the difference between the real interest rate (r) and the growth rate of real GDP (g), and approximately follows: =− + ( − )
3. Gross public debt has risen from 70% of GDP in 1992 to more than 200% today, and the latest OECD Economic Outlook short-term projections put it at just over 230% of GDP in 2014. Despite financial assets amounting to some 80% of GDP, net public debt would remain about 150% of GDP, the second highest in the OECD after Greece. The increase in the debt burden over the past two decades is due to a combination of high primary deficits, relatively high real interest rates and low real GDP growth.
1 . Respectively Senior Economist and Economist in the Macroeconomic Policy Division of the OECD
Economics Department. The views expressed in this paper are those of the authors and not necessarily those of the OECD or its member countries. The authors wish to thank Sveinbjorn Blondal, Randall Jones, Vincent Koen, Jorgen Elmeskov, Jean-Luc Schneider, Sebastian Barnes, Piritta Sorsa, Tomasz Kozluk, Balázs Égert and Richard Herd for comments on earlier drafts, Ane Kathrine Christensen for statistical assistance, and Isabelle Fakih and Maartje Michelson for assistance in preparing the document.

ECO/WKP(2013)77
6
4. Japan has run a primary deficit for 20 years and it is projected to be over 9% of GDP in 2013. One fundamental factor behind this structural deficit has been demographics, as population ageing tends to increase social spending and reduce tax revenue. These demographic headwinds on public finances are projected to continue: the old-age dependency ratio is expected to keep rising and peak only in the 2050s. Accordingly, public spending on health and long-term care is expected to increase by between 2.1% and 2.8% of GDP by 2030, of which 0.8 percentage points is due purely to demographics (de la Maisonneuve and Oliveira Martins, 2013). Upward pressure on public pension expenditure can also be expected.
5. Trend real economic growth has averaged less than 1% since 1995, also weighed down by population ageing, and is expected to average less than 1½ per cent through 2060 in the long-term baseline scenario produced by the OECD (see Chapter 4 in OECD, 2013). Over the past 15 years, the economy has also generally been operating below capacity, entrenching deflation, which in turn worsens debt dynamics by increasing the real interest rate. Indeed, despite low nominal interest rates – the policy rate has been stuck against the zero bound for a decade and a half – deflation has kept real interest rates hovering between 2½ and 3%, noticeably higher than average real GDP growth, and not stimulative enough to jump-start the economy. According to accumulating empirical evidence, this significant wedge between real interest rates and real growth rates may be partly due to the high public debt burden itself (Turner and Spinelli, 2012; Kumar and Woo, 2010; Caner et al., 2010; Elmeskov and Sutherland, 2012; Égert, 2012).
6. Despite deflation, real interest rates have so far remained lower than if they included the normal fiscal risk premium observed in other highly indebted countries. One reason why the risk premium may be low in Japan is the high proportion of government debt which is financed from domestic sources, about 91%.2 This has been possible thanks to significant home bias, a high private saving rate, and a current account that has been in surplus since the early 1980s, so that for the past three decades Japan has not had to rely on external sources to finance its government deficits. The current account could move into deficit for structural reasons sometime over the next decade if population ageing led to a decline in the private saving rate, though this is by no means certain and also depends on the evolution of government saving. Japanese investors could also decide to diversify their portfolios by investing more overseas. If either, or both, scenario occurs and the government needs to seek foreign sources of financing, foreign investors could ask for a more “normal” fiscal risk premium.
3. How much can the government’s three-pillar strategy lower the debt burden?
3.1 The first pillar: flexible fiscal policy
7. Using the latest OECD Economic Outlook short-term projections to 2014 as a starting point, a first scenario is constructed using a simulation model that is anchored on long-term trend output projections for the 2015-to-2060 simulation period (Box 1). The scenario includes the first pillar of the government’s three-pillar strategy, that is, the fiscal stimulus package announced in January 2013. Thereafter, it adheres to the government’s commitment to keep to the medium-term fiscal objective first announced in the 2010 Fiscal Management Strategy of eliminating the primary budget deficit by 2020. Having a substantial amount of fiscal consolidation is necessary, otherwise the debt ratio would be on an exploding path. To isolate the impact of the three pillars one by one, this first scenario does not take the recent re-orientation of monetary policy into account, nor does it include the new growth strategy that was introduced in June 2013. A fiscal multiplier of 0.5 is used. On this basis, gross debt reaches close to 250% of GDP in 2020, and thereafter fiscal policy is assumed to tighten only slightly so as to eventually stabilise debt at 230% of GDP, close to its current level (Table 1).
2. At the end of the third quarter of 2012, about 40% of government bonds were held by Japanese commercial
banks, about 10% by the Bank of Japan, about 30% by Japanese insurance and pension funds (including the national pension fund) and about 3% by Japanese households.
ECO/WKP(2013)77
7
Box 1. Main features of the simulation model
The simulation model is based on Rawdanowicz (2012) and Johansson et al. (2013). Its main features are:
• Initial potential output projections come from the long-term conditional convergence model described in Chapter 4 of OECD (2013) and in Johansson et al. (2013). They are consistent with the supply side underlying the latest OECD Economic Outlook short-term projections. However, because there is no investment in the simulation model, potential output is not affected via the impact of interest rates on capital accumulation as in Johansson et al. (2013). On the other hand, potential output is endogenised via a hysteresis effect, so that a 1% output gap for one year permanently affects the level of potential output by 0.1%, for both positive and negative gaps, an effect consistent with estimates in DeLong and Summers (2012) and Guichard and Rusticelli (2010). Through the effect of real interest rates on the demand side (see below), the supply side is thus indirectly, if only slightly, affected.
• The cyclical component of real GDP growth is driven by closure of the output gap with an elasticity of -0.3, so that an output gap roughly halves in 2 years. In addition, real output growth is affected by fiscal policy via a short-term fiscal multiplier, assumed to be 0.5 in most scenarios. Short-term real output growth is also affected by changes in real long-term interest rates: a 1-percentage point increase in the real interest rate reduces growth by 0.3 percentage points.
• Fiscal policy is implemented through assumptions on the evolution of the underlying primary balance. This measure is cyclically-adjusted via an assumption that a 1% output gap lowers the actual primary balance by 0.3% of GDP, an estimate taken from Girouard and André (2005). Projected increases in social security expenditure due to population ageing are not included in the model, so such costs represent additional fiscal consolidation efforts.
• Inflation, defined in term of the GDP deflator, is modelled using an expectations-augmented Phillips curve, with expectations set as a weighted average of past inflation (weight of 0.4), future inflation (assuming perfect foresight, weight of 0.2) and the inflation target, set at 1% in scenario 1 (weight of 0.4). A 1% negative output gap for one year is assumed to lower inflation by 0.4 percentage points.
• The monetary policy stance is driven by interest-rate smoothing toward a standard Taylor rate but cannot fall below an assumed bound of 0.1%. The Taylor rate is set in response to the output gap and to deviations of actual inflation from the target. The natural nominal short-term interest rate is assumed to be equal to a 10-year average of real trend output growth, plus the inflation target, plus a constant of 0.4 percentage points. The monetary authorities are assumed to keep the short-term interest rate at the zero bound despite the effect on inflation of the 2014/15 indirect tax increases.
• The long-term (10-year) interest rate is modelled as a 10-year average of future short-term policy rates (under perfect foresight), a term premium (fixed at 0.7%) and a fiscal-risk premium which depends on the gross debt ratio. This fiscal risk premium is equal to ½ basis point for each percentage point of gross debt in excess of 75% of GDP, and an additional ½ basis point for each percentage point of gross debt in excess of 125% of GDP. This premium is low, only one quarter of that typically used when OECD fiscal simulations are done for other countries.
• The cost of debt servicing depends on the maturity structure of debt, as well as past and projected interest rates. The initial maturity structure of debt at the start of the simulations is calibrated on the maturity distribution of Japanese government bonds (JGBs) outstanding in January 2013. The maturity structure of new debt issues to cover projected gross financing needs is calibrated on the JGB issuance plan for fiscal year 2012 as reported in January 2013. Debt is assumed to be issued at 1, 2, 5, 10, 20 and 30-year maturities. The 20-year (30-year) bond interest rate is assumed to have a term premium of 60 (120) basis points over the 10-year bond rate, corresponding approximately to observed term premiums in January 2013. One-year debt is assumed to be financed at the policy rate, and the interest rates on 2-year and 5-year debt are assumed to be weighted averages of the short and long-term rates.

ECO/WKP(2013)77
8
Table 1. Scenario 1: Fiscal stimulus followed by consolidation
Source: OECD Economic Outlook 93 databases and model simulations.
8. This requires fiscal consolidation – measured using the underlying primary balance – amounting to almost ten percentage points of GDP from 2013 to 2020, and an additional one percentage point of GDP in consolidation between 2020 and 2035. The effort is largely front-loaded, with some four percentage points of GDP in consolidation over 2014 and 2015 combined, due in large part to planned indirect tax increases. This large fiscal retrenchment weakens activity, as reflected in the output gap going from 0.6% to -1.8% between 2014 and 2018, and keeps the monetary policy rate up against the zero bound until the early 2020s. Notwithstanding the effects of the planned indirect tax increases in 2014 and 2015, deflation also persists until the early 2020s in this scenario.
3.2 The second pillar: new growth strategy to lift potential growth
9. The second pillar of the government’s strategy is to boost growth, so a second scenario adds a higher trend growth projection to the first scenario. In line with the government’s initial announcement of the strategy in June 2013, as well as expectations of further reform announcements later in the year, Japan is assumed to implement product market reforms that raise total factor productivity growth and labour market reforms that increase the aggregate labour force participation rate. The aggregate labour force participation rate is assumed to increase gradually by 2½ percentage points above its level in the first scenario. Total factor productivity growth is assumed to increase gradually by 0.2 percentage points above its growth rate in the first scenario, a modest but realistic increase given that Japan is already close to the world technology frontier. On account of increased participation and productivity combined, real potential growth gradually rises by up to 0.5 percentage points above the first scenario over the 2015-to-2035 period (Table 2).3 The level of potential output is about 7% higher than in the first scenario by 2035. Actual growth responds to higher potential growth via the assumed elasticity of real GDP growth to the output gap (see Box 1). For greater realism, in this scenario the budget balance is made endogenous to the change in labour force participation compared to the first scenario, as higher participation would be expected to raise fiscal revenue and lower social spending in line with the size of automatic stabilisers. Higher productivity growth, on the other hand, is assumed not to affect the primary budget balance, even though commensurate increases in both revenue and spending would tend to worsen the fiscal position given the large initial deficit.
10. Faster GDP growth has several positive mutually reinforcing effects on Japan’s debt dynamics. It directly increases the denominator of the debt-to-GDP ratio. Higher participation simultaneously reduces the budget deficit and thus the rate of increase of the numerator. By reducing the fiscal risk premium, declining debt as a fraction of GDP also leads to lower market interest rates, thus lowering refinancing
3. Potential growth reaches 1.7% in 2035 in this scenario, a conservative assumption relative to the
government’s stated objective of booting potential growth to 2% per year.
2013 2014 2015 2016 2017 2018 2019 2020 2025 2030 2035Potential real GDP growth (%) 0.8 0.8 0.9 0.8 0.8 0.8 0.8 0.8 1.0 1.2 1.3Actual real GDP growth (%) 1.6 1.4 -0.1 0.1 0.4 0.5 0.9 1.1 1.1 1.2 1.2Output gap (%) 0.0 0.6 -0.4 -1.1 -1.6 -1.8 -1.7 -1.5 -0.5 -0.2 -0.1Output price inflation (%) -0.8 0.9 0.5 0.0 -0.8 -0.7 -0.6 -0.5 0.4 0.8 0.9Short-term interest rate (%) 0.2 0.1 0.1 0.1 0.1 0.1 0.1 0.1 0.9 1.8 2.3Long-term interest rate (%) 0.7 1.2 1.5 1.8 2.1 2.3 2.5 2.8 3.7 4.3 4.6Net lending (% of GDP) -10.3 -8.0 -6.3 -4.3 -2.9 -1.6 -0.9 -0.5 -0.9 -2.1 -2.8Underlying primary balance (% of potential GDP) -8.5 -6.2 -4.7 -3.2 -1.7 -0.2 0.6 1.1 1.9 2.2 2.4Cumulative fiscal consolidation since 2013 (% of potential GDP) 0.0 2.4 3.9 5.4 6.9 8.3 9.2 9.7 10.4 10.7 11.0Gross interest payments (% of GDP) 2.0 2.3 2.6 2.5 2.7 3.0 3.3 3.6 5.4 7.1 8.2Net interest payments (% of GDP) 1.0 1.3 1.0 0.5 0.5 0.7 0.9 1.1 2.6 4.2 5.1Gross debt (% of GDP) 228.4 233.1 238.9 243.0 246.5 248.5 249.0 248.5 241.0 235.0 232.1Net debt (% of GDP) 145.2 149.9 155.7 159.8 163.3 165.3 165.8 165.3 157.8 151.8 148.9

ECO/WKP(2013)77
9
costs, deficits and debt in a virtuous circle. The effects build up over time: the gross debt-to-GDP ratio is only three percentage points lower than in the previous scenario by 2020, but more than 20 percentage points lower by 2035, mainly through the positive effect of higher participation on the primary balance.
Table 2. Scenario 2: Scenario 1 + higher potential growth
Source: OECD Economic Outlook 93 databases and model simulations.
3.3 The third pillar: bold monetary policy to achieve the 2% inflation target
11. The third pillar of the government’s strategy is to end the period of sustained deflation and target 2% inflation using bold monetary policy measures. Its impact is illustrated in a third scenario which adds to the second the increase in the inflation target from 1% to 2% and implicitly assumes determined monetary policy action to reach the new target. The underlying primary balance is assumed to evolve exactly as in scenario 2. While in reality higher inflation would increase tax receipts, it would also increase nominal government spending, and the extent of de facto indexation may well be higher on the spending side. Even if it is not, the primary balance will tend to deteriorate given that spending is higher than revenue, so the assumption of an unchanged primary balance may overestimate the impact of higher inflation on debt reduction somewhat.
12. In this scenario, inflation is higher than in the first two scenarios because inflation expectations gradually adjust upward and Japan does not return to deflation after the indirect tax increases of 2014/15 (Table 3). Meanwhile, higher inflation rapidly works its way into short and long-term nominal interest rates, which also rise relative to previous scenarios. Although higher market interest rates lead to higher financing costs for the government, the implicit average interest rate paid on all outstanding debt rises more slowly than market rates, and more slowly than inflation, reflecting the existing maturity structure of debt. This effect allows the implicit average real interest rate paid on government liabilities to go down, slowly eroding the debt ratio, which is some 15 percentage points of GDP lower in 2035 than in the second scenario. That the effect is modest and front-loaded is due to the relatively short maturity structure of Japanese government debt: close to 30% of currently outstanding market debt matures within one year and almost 40% is to be refinanced within two years. By way of comparison, if Japan’s debt maturity structure and new issuance plan were the same as the United Kingdom’s, where less than 15% of debt matures within the next two years, the debt ratio would decline by an additional 20 percentage points by 2035. Also, by allowing higher inflation to fully pass through into higher government financing costs, the scenario does not account for two channels through which aggressive monetary policy actions could directly lower such costs. First, quantitative easing via the JGB market may imply that interest rates rise less than inflation expectations due to portfolio rebalancing effects. Second, quantitative easing substitutes base money and low earning reserves for higher-earning JGBs in the private sector’s portfolio, which is likely to reduce overall interest costs for the government sector (after taking into account remittances from
2013 2014 2015 2016 2017 2018 2019 2020 2025 2030 2035Potential real GDP growth (%) 0.8 0.8 1.0 1.0 1.0 1.1 1.1 1.1 1.4 1.6 1.7Actual real GDP growth (%) 1.6 1.4 -0.1 0.3 0.6 0.8 1.2 1.4 1.5 1.7 1.7Output gap (%) 0.0 0.6 -0.4 -1.1 -1.6 -1.8 -1.8 -1.5 -0.6 -0.2 -0.1Output price inflation (%) -0.8 0.9 0.4 0.0 -0.8 -0.7 -0.7 -0.5 0.4 0.8 0.9Short-term interest rate (%) 0.2 0.1 0.1 0.1 0.1 0.1 0.1 0.1 1.1 2.2 2.7Long-term interest rate (%) 0.7 1.2 1.6 1.9 2.1 2.4 2.7 2.9 4.0 4.6 4.8Net lending (% of GDP) -10.3 -8.0 -6.2 -4.3 -2.7 -1.4 -0.6 -0.2 -0.4 -1.0 -0.9Underlying primary balance (% of potential GDP) -8.5 -6.2 -4.6 -3.1 -1.5 0.0 0.9 1.5 2.5 3.2 3.7Cumulative fiscal consolidation since 2013 (% of potential GDP) 0.0 2.4 3.9 5.5 7.0 8.5 9.4 10.0 11.1 11.7 12.3Gross interest payments (% of GDP) 2.0 2.3 2.6 2.5 2.8 3.1 3.3 3.7 5.5 7.0 7.7Net interest payments (% of GDP) 1.0 1.3 1.0 0.5 0.5 0.7 0.9 1.1 2.7 4.1 4.6Gross debt (% of GDP) 228.4 233.1 238.8 242.5 245.6 247.0 246.8 245.6 233.6 221.4 209.6Net debt (% of GDP) 145.2 149.9 155.6 159.3 162.4 163.8 163.6 162.4 150.4 138.2 126.4
ECO/WKP(2013)77
10
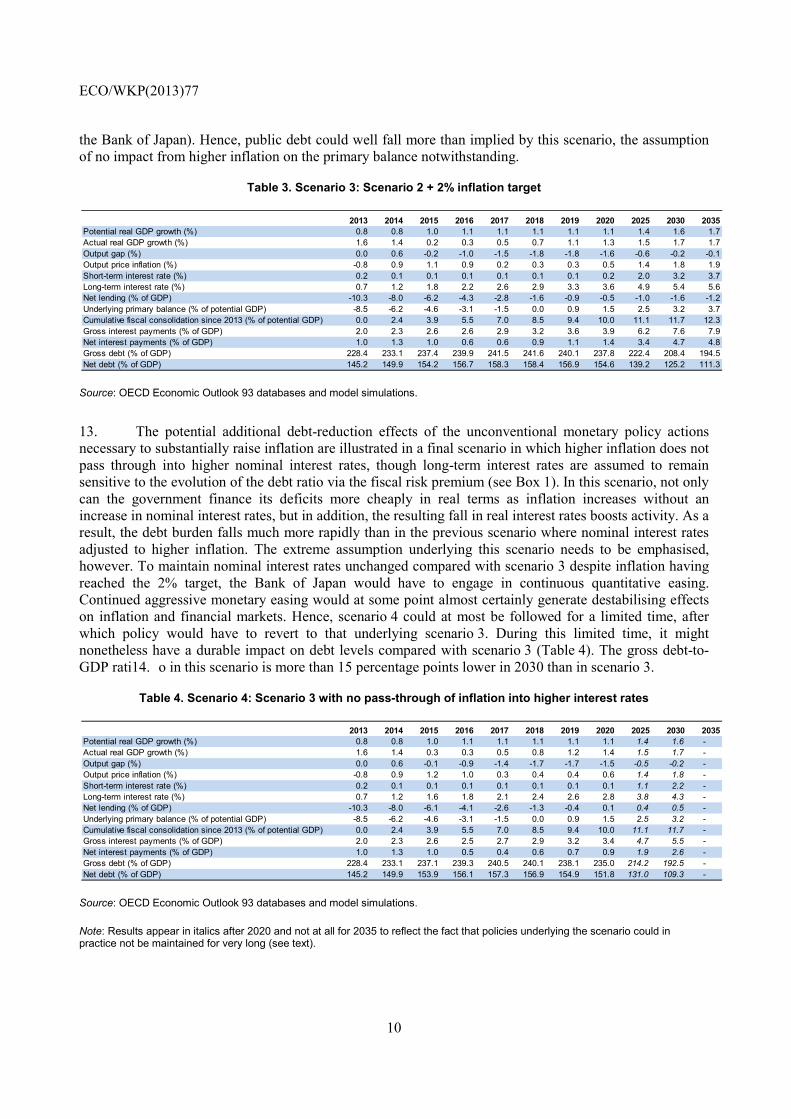
the Bank of Japan). Hence, public debt could well fall more than implied by this scenario, the assumption of no impact from higher inflation on the primary balance notwithstanding.
Table 3. Scenario 3: Scenario 2 + 2% inflation target
Source: OECD Economic Outlook 93 databases and model simulations.
13. The potential additional debt-reduction effects of the unconventional monetary policy actions necessary to substantially raise inflation are illustrated in a final scenario in which higher inflation does not pass through into higher nominal interest rates, though long-term interest rates are assumed to remain sensitive to the evolution of the debt ratio via the fiscal risk premium (see Box 1). In this scenario, not only can the government finance its deficits more cheaply in real terms as inflation increases without an increase in nominal interest rates, but in addition, the resulting fall in real interest rates boosts activity. As a result, the debt burden falls much more rapidly than in the previous scenario where nominal interest rates adjusted to higher inflation. The extreme assumption underlying this scenario needs to be emphasised, however. To maintain nominal interest rates unchanged compared with scenario 3 despite inflation having reached the 2% target, the Bank of Japan would have to engage in continuous quantitative easing. Continued aggressive monetary easing would at some point almost certainly generate destabilising effects on inflation and financial markets. Hence, scenario 4 could at most be followed for a limited time, after which policy would have to revert to that underlying scenario 3. During this limited time, it might nonetheless have a durable impact on debt levels compared with scenario 3 (Table 4). The gross debt-to-GDP rati14. o in this scenario is more than 15 percentage points lower in 2030 than in scenario 3.
Table 4. Scenario 4: Scenario 3 with no pass-through of inflation into higher interest rates
Source: OECD Economic Outlook 93 databases and model simulations.
Note: Results appear in italics after 2020 and not at all for 2035 to reflect the fact that policies underlying the scenario could in practice not be maintained for very long (see text).
2013 2014 2015 2016 2017 2018 2019 2020 2025 2030 2035Potential real GDP growth (%) 0.8 0.8 1.0 1.1 1.1 1.1 1.1 1.1 1.4 1.6 1.7Actual real GDP growth (%) 1.6 1.4 0.2 0.3 0.5 0.7 1.1 1.3 1.5 1.7 1.7Output gap (%) 0.0 0.6 -0.2 -1.0 -1.5 -1.8 -1.8 -1.6 -0.6 -0.2 -0.1Output price inflation (%) -0.8 0.9 1.1 0.9 0.2 0.3 0.3 0.5 1.4 1.8 1.9Short-term interest rate (%) 0.2 0.1 0.1 0.1 0.1 0.1 0.1 0.2 2.0 3.2 3.7Long-term interest rate (%) 0.7 1.2 1.8 2.2 2.6 2.9 3.3 3.6 4.9 5.4 5.6Net lending (% of GDP) -10.3 -8.0 -6.2 -4.3 -2.8 -1.6 -0.9 -0.5 -1.0 -1.6 -1.2Underlying primary balance (% of potential GDP) -8.5 -6.2 -4.6 -3.1 -1.5 0.0 0.9 1.5 2.5 3.2 3.7Cumulative fiscal consolidation since 2013 (% of potential GDP) 0.0 2.4 3.9 5.5 7.0 8.5 9.4 10.0 11.1 11.7 12.3Gross interest payments (% of GDP) 2.0 2.3 2.6 2.6 2.9 3.2 3.6 3.9 6.2 7.6 7.9Net interest payments (% of GDP) 1.0 1.3 1.0 0.6 0.6 0.9 1.1 1.4 3.4 4.7 4.8Gross debt (% of GDP) 228.4 233.1 237.4 239.9 241.5 241.6 240.1 237.8 222.4 208.4 194.5Net debt (% of GDP) 145.2 149.9 154.2 156.7 158.3 158.4 156.9 154.6 139.2 125.2 111.3
2013 2014 2015 2016 2017 2018 2019 2020 2025 2030 2035Potential real GDP growth (%) 0.8 0.8 1.0 1.1 1.1 1.1 1.1 1.1 1.4 1.6 -Actual real GDP growth (%) 1.6 1.4 0.3 0.3 0.5 0.8 1.2 1.4 1.5 1.7 -Output gap (%) 0.0 0.6 -0.1 -0.9 -1.4 -1.7 -1.7 -1.5 -0.5 -0.2 -Output price inflation (%) -0.8 0.9 1.2 1.0 0.3 0.4 0.4 0.6 1.4 1.8 -Short-term interest rate (%) 0.2 0.1 0.1 0.1 0.1 0.1 0.1 0.1 1.1 2.2 -Long-term interest rate (%) 0.7 1.2 1.6 1.8 2.1 2.4 2.6 2.8 3.8 4.3 -Net lending (% of GDP) -10.3 -8.0 -6.1 -4.1 -2.6 -1.3 -0.4 0.1 0.4 0.5 -Underlying primary balance (% of potential GDP) -8.5 -6.2 -4.6 -3.1 -1.5 0.0 0.9 1.5 2.5 3.2 -Cumulative fiscal consolidation since 2013 (% of potential GDP) 0.0 2.4 3.9 5.5 7.0 8.5 9.4 10.0 11.1 11.7 -Gross interest payments (% of GDP) 2.0 2.3 2.6 2.5 2.7 2.9 3.2 3.4 4.7 5.5 -Net interest payments (% of GDP) 1.0 1.3 1.0 0.5 0.4 0.6 0.7 0.9 1.9 2.6 -Gross debt (% of GDP) 228.4 233.1 237.1 239.3 240.5 240.1 238.1 235.0 214.2 192.5 -Net debt (% of GDP) 145.2 149.9 153.9 156.1 157.3 156.9 154.9 151.8 131.0 109.3 -

ECO/WKP(2013)77
11
4. What if the fiscal multiplier is higher?
15. All of the above scenarios have used a fiscal multiplier of 0.5, meaning that budget consolidation equal to 1% of GDP in a given year reduces real GDP growth in that year by 0.5 percentage point and, through the assumed hysteresis effect, reduces potential real GDP growth in that year by 0.05 percentage point (see Box 1). This should be considered a conservative fiscal multiplier, especially for a depressed economy (Auerbach and Gorodnichenko, 2012 and 2013; Owyang, Ramey and Zubairy, 2013; Fazzari, Morley and Panovska, 2012; Mittnik and Semmler, 2012). Recent estimates of Japan-specific multipliers for fiscal contractions when the output gap is negative place the multiplier at two for spending cuts and at about 0.6 for revenue increases (Baum, Poplawski-Ribeiro and Weber, 2012). A multiplier of 0.5 might accordingly be an appropriate assumption for revenue-based fiscal consolidation, but much too low for spending-based consolidation. Given large consolidation needs, a workable strategy is likely to rely on both types of measures, but should rely mostly on increasing revenue given the large revenue space that Japan enjoys when compared to other OECD countries, with total tax revenue as a share of GDP some six percentage points lower than the OECD average (OECD, 2012). Thus, a reasonable multiplier estimate for a consolidation programme that relies mostly, but not exclusively, on revenue measures might be one.
16. With a fiscal multiplier of one, the negative effects of fiscal consolidation on economic activity and prices that occur in the scenarios presented above become more significant. For instance, in scenario 3, going from a 0.5 to a 1.0 fiscal multiplier lowers nominal GDP growth by an average of 1.6 percentage points between 2015 and 2020 when fiscal consolidation is most rapid, through both real activity and price effects. At its widest in 2018, the negative output gap would be twice as large as in scenario 3, pointing also to the potential political difficulties of rapid fiscal consolidation in a high-multiplier context (Figure 1). Moreover, through the assumed hysteresis effect, the larger negative output gap lowers trend real GDP growth slightly, marking down the level of both actual and potential output permanently. The size of the effect is modest: the level of real potential output is 1.4% lower in 2035 with a fiscal multiplier of 1.0 than with the 0.5 multiplier. If hysteresis mechanisms were to be stronger than assumed, however, the negative impact of fiscal consolidation on the long-term productive capacity of the economy would be more material. Finally, with a fiscal multiplier of 1.0, the fiscal consolidation path in scenario 3 does not succeed in reducing the gross debt ratio below 200% of GDP by 2035: the ratio then is some 20 percentage points higher than with a fiscal multiplier of 0.5 (Table 5).
Figure 1. Impact of increasing the fiscal multiplier from 0.5 to 1.0 in scenario 3
Source: OECD Economic Outlook 93 databases and model simulations.
-4
-3
-2
-1
0
1
-4
-3
-2
-1
0
1
2010 2015 2020 2025 2030 2035
Fiscal multiplier = 0.5Fiscal multiplier = 1.0
Output gap, %
0.4
0.6
0.8
1.0
1.2
1.4
1.6
1.8
0.4
0.6
0.8
1.0
1.2
1.4
1.6
1.8
2010 2015 2020 2025 2030 2035
Fiscal multiplier = 0.5Fiscal multiplier = 1.0
Trend real GDP growth, %

ECO/WKP(2013)77
12
Table 5. Scenario 5: Scenario 3 with a fiscal multiplier of 1.
Source: OECD Economic Outlook 93 databases and model simulations.
5. The time dimension
17. The analysis has shown that, together, the three pillars of the government’s strategy could be successful in arresting the rise of the debt ratio around 2020 and putting it on a downward track (Figure 2). On the other hand, the debt burden would likely still be around 200% of GDP in 2035, particularly if the fiscal multiplier is one or more. High refinancing and debt turnover needs would keep the fiscal situation tense and vulnerable to a crisis of confidence. Maintaining market trust is thus paramount in the months and years to come, and this means fleshing out the monetary, fiscal and structural policy measures to be taken, their timing, and avoiding any slippage in their implementation to maintain credibility. Nevertheless, it may be desirable to consider options beyond the three-pillar strategy that could reduce the debt burden more decisively.
Figure 2. Evolution of the public debt burden in Japan over the medium term under the government’s three-pillar strategy
Gross government debt, % of GDP
Source: OECD Economic Outlook 93 databases and model simulations.
2013 2014 2015 2016 2017 2018 2019 2020 2025 2030 2035Potential real GDP growth (%) 0.8 0.8 1.0 1.0 0.9 0.9 0.9 1.0 1.4 1.6 1.7Actual real GDP growth (%) 1.6 1.4 -0.8 -0.2 0.1 0.4 1.1 1.4 1.5 1.7 1.7Output gap (%) 0.0 0.6 -1.2 -2.4 -3.1 -3.6 -3.4 -3.0 -1.0 -0.4 -0.3Output price inflation (%) -0.8 0.9 0.5 -0.2 -1.2 -1.3 -1.2 -0.8 0.9 1.6 1.8Short-term interest rate (%) 0.2 0.1 0.1 0.1 0.1 0.1 0.1 0.1 1.0 2.6 3.4Long-term interest rate (%) 0.7 1.2 1.5 1.8 2.1 2.4 2.7 3.0 4.4 5.3 5.7Net lending (% of GDP) -10.3 -8.0 -6.5 -4.6 -3.2 -2.0 -1.2 -0.8 -0.8 -1.8 -2.0Underlying primary balance (% of potential GDP) -8.5 -6.2 -4.6 -3.1 -1.5 0.0 0.9 1.5 2.5 3.2 3.7Cumulative fiscal consolidation since 2013 (% of potential GDP) 0.0 2.4 3.9 5.5 7.0 8.5 9.4 10.0 11.1 11.7 12.3Gross interest payments (% of GDP) 2.0 2.3 2.6 2.5 2.8 3.1 3.4 3.8 5.8 7.8 8.8Net interest payments (% of GDP) 1.0 1.3 1.0 0.5 0.6 0.8 1.0 1.3 3.0 4.8 5.7Gross debt (% of GDP) 228.4 233.1 240.1 245.5 250.5 254.0 255.3 255.1 242.0 226.8 213.8Net debt (% of GDP) 145.2 149.9 156.9 162.3 167.2 170.8 172.1 171.9 158.8 143.6 130.6
160
170
180
190
200
210
220
230
240
250
160
170
180
190
200
210
220
230
240
250
2010 2015 2020 2025 2030 2035
Fiscal consolidation (1)(1) + higher potential growth (2)(2) + 2% inflation target and pass-through of higher inflation to interest rates (3)(2) + 2% inflation target and no pass-through of higher inflation to interest rates (4)
ECO/WKP(2013)77
13
REFERENCES
Auerbach, A.J. and Y. Gorodnichenko (2012), “Measuring the Output Responses to Fiscal Policy”, American Economic Journal: Economic Policy, Vol. 4, No. 2, pp. 1-27.
Auerbach, A.J. and Y. Gorodnichenko (2013), “Fiscal Multipliers in Recession and Expansion” in Fiscal Policy after the Financial Crisis, edited by Alberto Alesina and Francesco Giavazzi, University of Chicago Press.
Baum, A., M. Poplawski-Ribeiro and A. Weber (2012), “Fiscal Multipliers and the State of the Economy”, IMF Working Paper, No. 12/286.
Caner, M., T. Grennes and F. Koehler-Geib (2010), “Finding the Tipping Point – When Sovereign Debt Turns Bad”, World Bank Policy Research Working Paper, No. 5391.
de la Maisonneuve, C. and J. Oliveira Martins (2013), “Public Spending on Health and Long-Term Care: A New Set of Projections”, OECD Economic Policy Papers, No. 6.
DeLong, J.B. and L.H. Summers (2012), “Fiscal Policy in a Depressed Economy”, Brookings Papers on Economic Activity, Spring, pp. 233-274.
Égert, B. (2012), “Public Debt, Economic Growth and Nonlinear Effects: Myth or Reality?”, OECD Economics Department Working Papers, No. 993.
Elmeskov, J. and D. Sutherland (2012), “Post-Crisis Debt Overhang: Growth and Implications across Countries”, OECD Economics Department mimeo, http://www.oecd.org/dataoecd/7/2/49541000.pdf
Fazzari, S.M., J. Morley and I. Panovska (2012), “State-Dependent Effects of Fiscal Policy”, UNSW Australian School of Business Research Paper, No. 2012-27.
Girouard, N. and C. André (2005), “Measuring Cyclically-adjusted Budget Balances for OECD Countries”, OECD Economics Department Working Papers, No. 434.
Guichard, S. and E. Rusticelli (2010), “Assessing the Impact of the Financial Crisis on Structural Unemployment in OECD Countries”, OECD Economics Department Working Papers, No. 767.
Johansson, Å., Y. Guillemette, F. Murtin, D. Turner, G. Nicoletti, C. de la Maisonneuve, P. Bagnoli, G. Bousquet and F. Spinelli (2013), “Long-term Growth Scenarios”, OECD Economics Department Working Papers, No. 1000.
Kumar, M.S. and J. Woo (2010), “Public Debt and Growth”, IMF Working Paper, No. 10/174.
Mauro, P., R. Romeu and A. Binder (2013), “A Modern History of Fiscal Prudence and Profiglacy”, IMF Working Paper, No. 13/5.
Mittnik, S. and W. Semmler (2012), “Regime Dependence of the Fiscal Multiplier”, Center for Quantitative Risk Analysis Working Paper, No. 5.
OECD (2012), Revenue Statistics of OECD Countries, OECD Publishing.

ECO/WKP(2013)77
14
OECD (2013), OECD Economic Outlook, Vol. 2013/1, OECD Publishing.
Owyang, M.T., V.A. Ramey and S. Zubairy (2013), “Are Government Spending Multipliers Greater During Periods of Slack? Evidence from Twentieth-Century Historical Data”, American Economic Review, Vol. 103, No. 3, pp. 129-134.
Rawdanowicz, L. (2012), “Choosing the Pace of Fiscal Consolidation”, OECD Economics Department Working Papers, No. 992.
Turner, D. and F. Spinelli (2012), “Interest-rate-growth differentials and government debt dynamics”, OECD Journal: Economic Studies, Vol. 2012/1.

ECO/WKP(2013)77
15
WORKING PAPERS
The full series of Economics Department Working Papers can be consulted at www.oecd.org/eco/workingpapers/
1084. Transitions in and out of unemployment among young people in the Irish recession (August 2013) by Elish Kelly, Seamus McGuinness, Philip O’Connell, David Haugh and
Alberto González Pandiella 1083. Is there convergence of Russia’s regions? Exploring the empirical evidence: 1995-2010 (August 2013) by Hartmut Lehmann and Maria Giulia Silvagni 1082. The benefits and costs of highly expansionary monetary policy (August 2013) by Łukasz Rawdanowicz, Romain Bouis and Shingo Watanabe 1081. The effectiveness of monetary policy since the onset of the financial crisis
(August 2013) by Romain Bouis, Łukasz Rawdanowicz, Jean-Paul Renne, Shingo Watanabe and Ane Kathrine Christensen
1080. Responding to key well-being challenges in Austria (August 2013) by Rauf Gönenç, Oliver Röhn, Christian Beer and Andreas Wörgötter 1079. Austria’s well-being goes beyond GDP (August 2013) by Oliver Röhn, Rauf Gönenç, Christian Beer and Romina Boarini 1078. Improving fiscal federal relations for a stronger Mexico (August 2013) by Aida Caldera Sánchez 1077. Deleveraging: challenges, progress and policies (August 2013) by Romain Bouis, Ane Kathrine Christensen and Boris Cournède 1076. Policies to support sustainable long-term growth in New Zealand (July 2013) by Calista Cheung 1075. Do structural policies affect macroeconomic stability? (July 2013) by Volker Ziemann 1074. A simple fiscal stress testing model - case studies of Austrian, Czech and German economies (July 2013) by Ondra Kamenik, Zdenek Tuma, David Vavra and Zuzana Smidova 1073. Road connectivity and the border effect: evidence from Europe (July 2013) by Henrik Braconier and Mauro Pisu 1072. Fiscal consolidation across government levels. Part 3: Intergovernmental grants, pro- or
counter-cyclical? (July 2013) by Hansjörg Blöchliger and Balázs Égert 1071. Fiscal consolidation across government levels. Part 2: Fiscal rules for sub-central governments,
update of the institutional indicator (July 2013) by Kaja Fredriksen

ECO/WKP(2013)77
16
1070. Fiscal consolidation across government levels. Part 1: How much, what policies? (July 2013) by Hansjörg Blöchliger 1069. Restructuring the electricity sector and promoting green growth in Japan (June 2013) by Randall S. Jones and Myungkyoo Kim 1068. Labour market policies to promote growth and social cohesion in Korea (June 2013) by Randall S. Jones and Satoshi Urasawa 1067. Education reform in Korea (June 2013) by Randall S. Jones 1066. Belgium: enhancing the cost efficiency and flexibility of the health sector to adjust to population
ageing (June 2013) by Stéphane Sorbe 1065. Italy and the euro area crisis: securing fiscal sustainability and financial stability (June 2013) by Oliver Denk 1064. Policy implementation in Italy: legislation, public administration and the rule of law (June 2013) by Paul O’Brien 1063. Greening growth in Luxembourg (June 2013) by Nicola Brandt Vers une croissance plus verte en Luxembourg (juin 2013) par Nicola Brandt 1062. The post-crisis narrowing of international imbalances – cyclical or durable? (June 2013) by Patrice Ollivaud and Cyrille Schwellnus 1061. Restructuring welfare spending in Slovenia (June 2013) by Rafał Kierzenkowski 1060. The economics of civil justice: new cross-country data and empirics by G. Palumbo; G. Giupponi; L. Nunziata and J. Mora-Sanguinetti (forthcoming) 1059. Banks’ restructuring and smooth deleveraging of the private sector in Slovenia (June 2013) by Olena Havrylchyk 1058. Assessing the efficiency of welfare spending in Slovenia with data envelopment analysis (June 2013) by Matevz Hribernik and Rafał Kierzenkowski 1057. Policy determinants of school outcomes under model uncertainty: evidence from South Africa (June 2013) by Thomas Laurent, Fabrice Murtin, Geoff Barnard, Dean Janse van Rensburg,
Vijay Reddy, George Frempong and Lolita Winnaar 1056. Improving education quality in South Africa (June 2013) by Fabrice Murtin 1055. The 90% public debt threshold: the rise and fall of a stylised fact (June 2013) by Balázs Égert