dynamic foot morphology - qucosa: startseite · methods: the three hypotheses (h 1, h 2, h 3) are...
TRANSCRIPT

Bettina Barisch-Fritz
Dynamic Foot Morphology
Measurements of 3D static and dynamic foot morphology
and recommendations for footwear
Doctoral Thesis
Submitted to the Faculty of Behavioral and Social Sciences of the
Chemnitz University of Technology,
to ful�l the requirements
for the degree of
doctor rerum naturalium (Dr. rer. nat.)
February 2014


Datum der Disputation: 24. Juli 2014
Vorsitzender des Promotionskolloqiums: JP Dr. Christian Maiwald
Erstgutachter: Prof. Dr. Thomas L. Milani
Zweitgutachter: Prof. Dr. Stefan Grau


For Marc


Abstract
Background: The foot has to ful�l important and complex functions which are, in
most regions of the world, supported by shoes. The interface of feet and footwear has
often been considered with respect to comfort and function but also to negative e�ects
of shoes. One main contribution to the improvement of footwear �t is provided by
matching the shape of the shoe to the shape of the foot. However, current approaches
for implementation only include static information. There is still a lack of dynamic
information about foot morphology and deformation. Recent advancements in scanner
technology allow capturing the foot during natural walking. These advancements and the
development of a dynamic foot scanner system (DynaScan4D) are preconditions for this
thesis. The research question is: How does foot morphology di�er between static and
dynamic situations? This question is further speci�ed toward three hypotheses by �ndings
and de�cits of the current state of research. The examination of the three hypotheses
and their contribution to the research question are topic of this thesis. Furthermore,
the �ndings are combined with comprehensive knowledge of the literature to formulate
recommendations for last and footwear construction.
Methods: The three hypotheses (H1, H2, H3) are evaluated within three research arti-
cles. The �rst research article aims to identify the di�erences in dynamic foot morphology
according to age, gender, and body mass (H1). The plantar dynamic foot morphology
of 129 adults is recorded and analysed by two statistical methods: (1) comparison of
matched groups and (2) multiple linear regression analysis. The second and third re-
search article is dealing with di�erences between static and dynamic foot morphology
in developing feet (H2) and their inter-individual di�erences (H3). For this reason, a
large sample of 2554 children, aged between 6 and 16 years, is analysed. Foot measures,
corresponding to last measures, are used to identify the di�erences between static and
dynamic foot morphology (H2) by Student's t-test for paired samples. The in�uences
of gender, age, and body mass (H3) are analysed within the whole sample by multiple
vii

linear regression analysis and within matched groups by Student's t-test for independent
samples.
Results: There are di�erences in dynamic foot morphology according to age, gender,
and body mass in adults which con�rm H1. In general, the di�erences are rather small.
Furthermore, the di�erences must be considered in a more di�erentiated way, as they are
not consistent regarding all plantar foot measures. H2 is con�rmed as there are statis-
tically signi�cant di�erences between static and dynamic foot morphology in developing
feet. Theses di�erences are found for all foot measures. However, the magnitude of these
di�erences varies depending on each foot measure. Relevant di�erences, in particular the
forefoot width and midfoot girth measures as well as the angles of the forefoot, must
be considered for footwear construction. In�uences of gender, age, and body mass are
found for the dynamic foot morphology and the di�erences between static and dynamic
foot morphology of developing feet. Thus, H3 is veri�ed. However, these �ndings are
small, especially considering the high variance within each foot measure. The variables
gender, age, and body mass cannot appropriately explain the variance of the di�erences
between static and dynamic foot morphology. Thus, the customization of footwear to
dynamic foot morphology can be conducted without individual adjustments to gender,
age, or body mass.
Conclusion: This thesis presents di�erent aspects to answer the question of di�erences
between static and dynamic foot morphology. The �ndings of this thesis are critically
discussed and recommendations for improvements of dynamic �t of footwear are formu-
lated, taking into account the current state of research as well as practical aspects. The
�ndings of the thesis contribute to the �eld of fundamental research, i.e. to broaden the
knowledge about three-dimensional characteristics of dynamic foot morphology. Further-
more, this thesis can help to improve the �t of footwear and thus contributes to applied
research in the �eld of footwear science.
viii

Zusammenfassung
Hintergrund: Der Fuÿ erfüllt wichtige und komplexe Funktionen, die in den meisten
Regionen der Welt, durch Schuhe unterstützt werden. Die Berührungspunkte zwischen
Schuhen und Füÿen wurden im Hinblick auf komfortable und funktionelle Schuhe, aber
auch hinsichtlich negativer E�ekte von Schuhen, häu�g betrachtet. Ein wesentlicher
Beitrag zur Verbesserung der Passform von Schuhen liefert die Annäherung der Schuhform
an die Fuÿform. Jedoch beschränken sich bisherige Umsetzungsansätze auf statische
Informationen. Bislang fehlen umfangreiche dynamische Informationen zur Fuÿgestalt
und Verformung. Erst aktuelle Fortschritte der Scanner-Technologie ermöglichen es, den
Fuÿ während des natürlichen Gehens zu erfassen. Diese Fortschritte und die Entwicklung
eines dynamischen Fuÿ-Scanner-Systems (DynaScan4D), stellen die Grundlage für diese
Dissertation dar. Die Forschungsfrage ist: Wie unterscheidet sich die statische Fuÿgestalt
von der dynamischen? Mit der Aufarbeitung von Ergebnissen und De�ziten aktueller
Forschungsarbeiten wird diese Frage durch die Formulierung von drei Hypothesen weiter
spezi�ziert. Diese drei Hypothesen, sowie deren Beitrag zur Forschungsfrage, sind Thema
dieser Dissertation. Darüber hinaus wird umfassendes Wissen aus der Literatur verwendet
um Empfehlungen für die Konstruktion von Schuhen zu geben.
Methoden: Die drei Hypothesen (H1, H2, H3) werden in drei wissenschaftlichen Veröf-
fentlichungen untersucht. Die erste Verö�entlichung zielt darauf ab, die Unterschiede
zwischen der dynamischen Fuÿgestalt in Abhängigkeit von Alter, Geschlecht und Kör-
permasse zu ermitteln (H1). Die plantare dynamische Fuÿgestalt von 129 Erwachsenen
wird hierzu erfasst und durch zwei statistische Verfahren analysiert: (1) Vergleich von
gepaarten Probandengruppen und (2) multiple lineare Regressionsanalyse. Die zweite und
dritte Hypothese befassen sich mit den Unterschieden der statischen und dynamischen
Fuÿgestalt bei heranreifenden Füÿen (H2) und deren inter-individuellen Unterschieden
(H3). Aus diesem Grund wird eine groÿe Stichprobe mit 2554 Kindern im Alter zwis-
chen 6 und 16 Jahren untersucht. Fuÿmaÿe, die den Maÿen im Leistenbau entsprechen,
ix

werden verwendet um die Unterschiede zwischen der statischen und der dynamischen
Fuÿgestalt (H2) durch einen gepaarten Student's t-Test zu identi�zieren. Der Ein�uss des
Geschlechtes, des Alters und der Körpermasse (H3) werden in der gesamten Stichprobe
durch eine multiple lineare Regressionsanalyse und innerhalb gepaarter Probandengrup-
pen durch Student's t-Test für unabhängige Stichproben untersucht.
Ergebnisse: Es gibt Unterschiede in der dynamischen Fuÿgestalt von Erwachsenen,
beein�usst durch Alter, Geschlecht und Körpermasse, welche die Veri�zierung von H1
erlauben. Im Allgemeinen sind diese Unterschiede jedoch gering. Die ermittelten Un-
terschiede müssen di�erenziert betrachtet werden, da sie nicht konsistent in Bezug auf
die gesamte plantare Fuÿgestalt auftreten. H2 kann veri�ziert werden, da es zwischen
der statischen und der dynamischen Fuÿgestalt von heranreifenden Kindern statistisch
signi�kante Unterschiede gibt. Diese Unterschiede wurden bei allen Fuÿmaÿen gefunden,
wobei das Auÿmaÿ dieser Unterschiede in Abhängigkeit vom jeweiligen Fuÿmaÿ variiert.
Relevante Unterschiede, insbesondere Breitenmaÿe und Winkelmaÿe des Vorfuÿes sowie
Umfangsmaÿe des Mittelfuÿes, müssen bei der Konstruktion von Schuhen berücksichtigt
werden. Es zeigen sich Ein�üsse von Geschlecht, Alter und Körpermasse auf die dynamis-
che Fuÿgestalt sowie auf die Di�erenzen zwischen der statischen und der dynamischen
Fuÿgestalt. Somit ist H3 veri�ziert. Jedoch sind diese Ein�üsse gering, besonders wenn
die Varianz innerhalb der Fuÿmaÿe betrachtet wird. Die Variablen Alter, Geschlecht
und Körpermasse können die Varianz der Di�erenzen zwischen der statischen und der
dynamischen Fuÿgestalt nicht angemessen erklären. Damit kann die Anpassung an die
dynamische Fuÿgestalt ohne eine Individualisierung hinsichtlich Alter, Geschlecht oder
Körpermasse vollzogen werden.
Schlussfolgerungen: Die vorliegende Dissertation stellt unterschiedliche Aspekte zur
Beantwortung der Frage, welche Unterschiede zwischen der statischen und der dynamis-
chen Fuÿgestalt bestehen, vor. Die Ergebnisse der Arbeit werden kritisch diskutiert und
es werden, unter Berücksichtigung des aktuellen Forschungsstandes sowie praktischer As-
pekte, Empfehlungen zur Optimierung der dynamischen Passform von Schuhen gegeben.
Die Ergebnisse der Dissertation liefern einen Beitrag zur Grundlagenforschung, insbeson-
dere durch die Erweiterung des Wissensstands der dreidimensionalen Eigenschaften der
dynamischen Fuÿgestalt. Darüber hinaus kann diese Arbeit helfen die dynamische Pass-
form von Schuhen zu verbessern und trägt damit zur angewandten Schuhforschung bei.
x

Contents
Abstract vii
List of Figures xiii
List of Tables xv
List of Abbreviations xvii
1 Introduction 1
1.1 Structure of the thesis . . . . . . . . . . . . . . . . . . . . . . . . . . . 2
2 Anatomical and functional basics of the foot 5
2.1 General functions of the foot . . . . . . . . . . . . . . . . . . . . . . . 5
2.2 Structures and functionality of the foot . . . . . . . . . . . . . . . . . . 6
2.3 Development of the foot . . . . . . . . . . . . . . . . . . . . . . . . . . 14
2.4 In�uences on foot morphology . . . . . . . . . . . . . . . . . . . . . . 17
3 Fundamentals of footwear 29
3.1 Footwear construction . . . . . . . . . . . . . . . . . . . . . . . . . . . 29
3.2 Foot and shoe interface . . . . . . . . . . . . . . . . . . . . . . . . . . 34
3.3 Measuring foot morphology . . . . . . . . . . . . . . . . . . . . . . . . 37
4 Formulation of research question and hypotheses 43
4.1 Findings and de�cits of the current state of research . . . . . . . . . . 43
4.2 Research question and hypotheses . . . . . . . . . . . . . . . . . . . . 45
5 Methods 47
5.1 Samples . . . . . . . . . . . . . . . . . . . . . . . . . . . . . . . . . . 47
5.2 Measurement system and analysis procedure . . . . . . . . . . . . . . . 48
xi

Contents
5.3 Statistical analysis . . . . . . . . . . . . . . . . . . . . . . . . . . . . . 49
6 Anthropometric in�uences on dynamic foot shape: Measurements of plan-
tar three-dimensional foot deformation 53
6.1 Introduction . . . . . . . . . . . . . . . . . . . . . . . . . . . . . . . . 54
6.2 Methods . . . . . . . . . . . . . . . . . . . . . . . . . . . . . . . . . . 56
6.3 Results . . . . . . . . . . . . . . . . . . . . . . . . . . . . . . . . . . . 61
6.4 Discussion . . . . . . . . . . . . . . . . . . . . . . . . . . . . . . . . . 69
7 Foot deformation during walking: Di�erences between static and dynamic
3D foot morphology in developing feet 79
7.1 Introduction . . . . . . . . . . . . . . . . . . . . . . . . . . . . . . . . 80
7.2 Methods . . . . . . . . . . . . . . . . . . . . . . . . . . . . . . . . . . 82
7.3 Results . . . . . . . . . . . . . . . . . . . . . . . . . . . . . . . . . . . 90
7.4 Discussion . . . . . . . . . . . . . . . . . . . . . . . . . . . . . . . . . 96
8 The e�ects of gender, age, and body mass on dynamic foot shape and
foot deformation in children and adolescents 109
8.1 Introduction . . . . . . . . . . . . . . . . . . . . . . . . . . . . . . . . 110
8.2 Methods . . . . . . . . . . . . . . . . . . . . . . . . . . . . . . . . . . 112
8.3 Results . . . . . . . . . . . . . . . . . . . . . . . . . . . . . . . . . . . 120
8.4 Discussion . . . . . . . . . . . . . . . . . . . . . . . . . . . . . . . . . 130
9 Discussion 141
9.1 Research question and hypotheses . . . . . . . . . . . . . . . . . . . . 141
9.2 Limitations . . . . . . . . . . . . . . . . . . . . . . . . . . . . . . . . . 146
9.3 Recommendations for footwear . . . . . . . . . . . . . . . . . . . . . . 150
10 Conclusion and perspectives 155
Reference list 159
A Appendix 177
A.1 Information about the aim and content of the study for children and their
parents . . . . . . . . . . . . . . . . . . . . . . . . . . . . . . . . . . . 177
A.2 Case report form . . . . . . . . . . . . . . . . . . . . . . . . . . . . . . 183
xii

Contents
A.3 Comparison of measurements of a bowling ball with varying spatial reso-
lution and several static and dynamic situations . . . . . . . . . . . . . 187
A.4 Comparison of last and foot measures . . . . . . . . . . . . . . . . . . 189
A.5 Calculation of the toe allowance based on the three components . . . . 193
A�dativ 197
Contributions to research articles 199
Curriculum vitae 201
Danksagung 203
xiii


List of Figures
1.1 General structure of the thesis . . . . . . . . . . . . . . . . . . . . . . 3
2.1 Qualitative Illustration of vertical and horizontal anteroposterior compo-
nents of the ground reaction force in standing and walking (adapted from
Brinckmann et al., 2012, p. 387; Zatsiorsky, 2002, p. 57) . . . . . . . . 6
2.2 Dorsal view of the bony skeleton of the foot . . . . . . . . . . . . . . . 7
2.3 Example of force-deformation relations for a selection of excised human
tissues reported by Kenedi et al. (Kenedi et al., 1975) . . . . . . . . . . 11
2.4 Overview of foot growth (data from Anderson et al., 1956, Cheng et al.,
1997, and Mauch, 2007) . . . . . . . . . . . . . . . . . . . . . . . . . 15
2.5 Reasons for foot variability . . . . . . . . . . . . . . . . . . . . . . . . 18
3.1 Important last measures (adjusted to Mitchell et al., 1995) . . . . . . . 30
3.2 Illustration of several sizing systems (in accordance with Luximon and
Luximon, 2013, p.206; Rossi, 2011, p. 88) . . . . . . . . . . . . . . . . 31
6.1 Dynamic plantar foot scan during walking - �ve frames of stance phase. 57
7.1 Illustration of analysed foot measures (see Table 7.3 for the descriptions
of the foot measures) . . . . . . . . . . . . . . . . . . . . . . . . . . . 86
7.2 Sequence of 30 frames of a standard dynamic foot scan . . . . . . . . . 89
8.1 Analysed foot measure . . . . . . . . . . . . . . . . . . . . . . . . . . . 116
xv


List of Tables
2.1 Range of motion of transvers tarsal and tarsometatarsal joints of the foot
(according to Nester et al., 2007) . . . . . . . . . . . . . . . . . . . . . 8
2.2 The four muscle layers of the plantar foot . . . . . . . . . . . . . . . . 10
2.3 Main results for plantar soft tissue deformation . . . . . . . . . . . . . . 13
2.4 State-of-the-art of science concerned with inter-individual in�uences on feet 20
5.1 Characteristics of the two samples. Mean values with standard deviation
in brackets. . . . . . . . . . . . . . . . . . . . . . . . . . . . . . . . . . 48
6.1 All foot measures collected in static and dynamic situation . . . . . . . 59
6.2 Characteristics of matched groups . . . . . . . . . . . . . . . . . . . . 62
6.3 Di�erences in dynamic foot measure between matched groups � Gender 64
6.4 Di�erences in dynamic foot measure between matched groups � BMI . . 65
6.5 Di�erences in dynamic foot measure between matched groups � Age . . 66
6.6 Results of multiple regression analysis within whole sample . . . . . . . 68
7.1 Characteristics of the participants. Mean and standard deviation of an-
thropometric variables for the whole sample as well as di�erent age groups.s 83
7.2 Walking speed adjusted to body height . . . . . . . . . . . . . . . . . . 84
7.3 Analysed foot measures . . . . . . . . . . . . . . . . . . . . . . . . . . 87
7.4 Absolute and relative foot measures. The results of one-way ANOVA with
comparison of HWB, FWB, and MaxDyn by paired Student´s t-test . . 91
7.5 Di�erences of relative foot measures between the three situations HWB,
FWB, and MaxDyn analysed by one-way ANOVA . . . . . . . . . . . . 93
xvii

List of Tables
7.6 Intra-tester reliability of the calculation of the foot measures (including
measures based on the visually detected anatomical landmarks MTH1 and
MTH5). Supplemented by the absolute di�erences between MaxDyn and
static HWB and the half increments based on shoe grading (French Scale). 95
8.1 Characteristics of the whole sample and the matched groups . . . . . . 114
8.2 Analysed foot measures . . . . . . . . . . . . . . . . . . . . . . . . . . 118
8.3 Results of multiple regression analysis within all male subjects . . . . . . 122
8.4 Results of multiple regression analysis within all female subjects . . . . . 123
8.5 Di�erences in relative dynamic foot measure and foot deformation be-
tween overweight and normal weight subjects . . . . . . . . . . . . . . 125
8.6 Di�erences in relative dynamic foot measure and foot deformation be-
tween children and adolescents . . . . . . . . . . . . . . . . . . . . . . 127
8.7 Di�erences in relative dynamic foot measure and foot deformation be-
tween female and male subjects . . . . . . . . . . . . . . . . . . . . . . 129
9.1 Overview of the research question and the three hypotheses . . . . . . . 141
A.1 Measurement results of a bowling ball measured in static and dynamic
situation with di�erent spatial resolution . . . . . . . . . . . . . . . . . 188
A.2 Mean and standard deviation of the foot measures calculated from scanned
lasts and children's feet of shoe size EU 33 . . . . . . . . . . . . . . . . 190
A.3 Mean and standard deviation of the foot measures calculated from scanned
lasts and children's feet of shoe size EU 37 . . . . . . . . . . . . . . . . 191
A.4 Toe allowance calculated on the base of mean values . . . . . . . . . . 194
A.5 Allowance calculated on the base of the 90th percentile . . . . . . . . . 195
xviii

List of Abbreviations
∆Dyn dynamic delta
AA arch angle
AB-G anatomical ball girth
AB-W anatomical ball width
AH arch height
AKA64 description of the standardization for children shoe lasts, since 1974 also
known as WMS
ANOVA analysis of variance
AW arch width
B-H ball height
BA, B-A ball angle
BMI body mass index [kg/m2]
BMI-percentile normalized BMI to gender- and age-speci�c German reference data
(Kromeyer-Hauschild et al., 2001)
BW ball width
CCD charge-coupled device
CI con�dence interval
CSI Chippaux-Smirak-Index
xix
List of Abbreviations
DF degrees of freedom
DGOT German association for orthopaedy and traumatology (Deutsche Gesell-
schaft fur Orthopadie und Traumatologie)
DLP digital light processor
DOG German association for orthopaedy (Deutsche Orthopädische Gesell-
schaft)
FL, F-L foot length
fps frames per second
FWB full weight-bearing
HW heel width
HWB half weight-bearing
Hz Hertz
I-H instep height
ICC intraclass correlation coe�cient
ISO International Organization for Standardization
LB-G last ball girth
LBL, LB-L lateral ball length
LI-G last instep girth
LW-G last waist girth
MaxDyn maximum value during dynamic situation
MBL, MB-L medial ball length
MTH metatarsal head
MW midfoot width
xx

List of Abbreviations
N number of participants
NWB non weight-bearing
OB-W orthogonal ball width
OH-W orthogonal heel width
RMSE root mean square error
SD standard deviation
SI Staheli-Index
T1-A toe 1 angle
T5-A toe 5 angle
WMS system for shoes with more width dimensions in Germany (�weit� =
wide; �mittel� = medium; �schmal� = narrow)
xxi


1 Introduction
Footwear is as old as humanity and has always been important for human beings. Beside
the protection of our feet, footwear ful�ls further tasks. Taking for example the pointed
shoes of the 14th century: The longer the shoe tip, the better the position of the wearer.
Even more today, footwear is an expression of fashion and lifestyle.
Often enough, our feet are stressed by ill-�tting shoes and probably everybody can
contribute own experiences. Therefore, it can be stated that the importance of our feet
is often ignored. They carry us the whole life and enable the freedom of movement and
mobility. Several studies have reported the e�ects of footwear on feet. Therefore, it is
known that di�erent problems are related to ill-�tting footwear (Menz and Morris, 2005;
Klein et al., 2009). This is especially true for developing feet as they are in particular
prone to external in�uences.
The often �gurative sense of the English proverb �If the shoe �ts, wear it� re�ects the
generally considered signi�cance of well-�tting shoes. Similarly, several research studies
are concerned with the topic ��t and comfort of footwear� at various levels (Goonetilleke
et al., 2000; Piller, 2002; Kouchi et al., 2005). One conclusion is that footwear �t can
be improved by matching the shape of the shoe to the shape of the foot (Luximon et
al., 2001; Witana et al., 2004). In other words the model of a shoe should be the foot
without a shoe (Staheli, 1991). Especially, the approach of Mauch et al. and Krauss et
al. is promising regarding the coverage of the natural variability of feet (Mauch et al.,
2009; Krauss et al., 2010). One lack of this approach, which is based on comprehensive
foot measurements and subsequent categorisation of foot types, is that only static foot
morphology is considered. However, the motion of feet and thus dynamic �t of footwear
is also or even more important. With respect to children's feet it is postulated that best
development and maturation of the foot takes place barefoot (Staheli, 1991; Rao and
Joseph, 1992).
In view of these considerations, the question arises: How does foot morphology di�er
between static and dynamic situations? This is the research question of this thesis. The
1

1 Introduction
problem is re�ected in the quote: �Boots that may be correct to stand in, may not be
correct to walk in.� (Golding, 1902, p. 37). Although, this question arises much earlier,
there is still a lack of information about dynamic foot morphology.
New and further developments of scanner systems allow capturing the foot three-
dimensionally during walking. Even if there are dynamic foot scanner systems now avail-
able, signi�cant results useful for the improvement of the dynamic �t of footwear are still
missing. The aim of this thesis is to generate �ndings that are generally valid to provide
practically applicable answers to the question of di�erences between static and dynamic
foot morphology. In order to achieve this aim, this thesis comprehensively elaborates
knowledge and research �ndings of the foot but also practically relevant fundamentals
of footwear. For the claim to establish general recommendations for the dynamic �t of
footwear, large samples must be incorporated. The �ndings obtained from the thesis
can be situated in the range of fundamental research. The combination of the �ndings
and the acquired basic knowledge contribute to applied research in the �eld of footwear
science.
1.1 Structure of the thesis
This thesis aims to identify di�erence between static and dynamic foot morphology. The
resultant objective is to give recommendations for the dynamic �t of footwear.
The theoretical Chapter 2 presents a review of the literature focussing on the topic
foot. Within this chapter, anatomical structures of the foot, important for motion or po-
tentially deformable, are re�ected. In this context, the development of feet is considered
with respect to the adaptation triggered by changing loading situations. Subsequently,
the diversity of foot morphology is discussed by intra-individual and inter-individual dif-
ferences.
Chapter 3 includes theoretical aspects of the interaction between foot and footwear.
Some basics of last construction and shoe manufacturing are brie�y described. This is
followed by a review of the literature regarding the e�ects of footwear on feet and the
knowledge about footwear �t. The generally accepted approach to improve footwear �t
is to match shoe and foot shape. Thus, the foot must be measured. Several methods to
measure the foot in static and dynamic situations are summarized.
In Chapter 4, the research question is formulated on the base of �ndings and de�cits
of the current state of research. Additionally, three hypotheses are derived. An overview
2

1.1 Structure of the thesis
of the used methods to examine the three hypotheses is presented in Chapter 5. This
chapter summarizes characteristics of the two samples, principles of measurement and
data processing as well as statistical analysis. Furthermore, it refers to sections where
more details are found. The three hypotheses are consecutively veri�ed by the three
research papers that are presented in Chapter 6, Chapter 7, and Chapter 8.
The subsequent discussion of Chapter 9 includes the consideration of the hypotheses
with respect to the research question. Furthermore, the �ndings are critically discussed
and recommendations for last construction and shoe manufacture are compiled. The
thesis ends with a conclusion and highlights a possible future line of research and further
development for practical applications.
Figure 1.1: General structure of the thesis
3


2 Anatomical and functional basics of
the foot
This chapter describes anatomical and functional basics of the foot. Section 2.1 responds
to the general functions of standing and walking followed by the structural composition
with their individual functionality (Section 2.2). Section 2.3 illustrates the structural
development and maturation of the foot focusing on functional changes due to upright
standing and walking. The last section (Section 2.4) addresses the variety of foot shapes
demonstrated by the inter-individual in�uences closing with already known intra-individual
di�erences between di�erent static and dynamic situations.
2.1 General functions of the foot
The foot has to ful�l essential functions that are characteristic for the human being:
First, it has to carry body weight. Second, it has to move body weight and is therefore
important for locomotion (Brinckmann et al., 2012, p. 367; Götz, 2001; Rodgers, 1995).
These tasks can be expanded in consideration of the general properties of the �eld of
mechanics. Mechanics is the �branch of physical science that deals with energy and forces
and their relation to the equilibrium, deformation, or motion� (Webster's Third Interna-
tional Dictionary, p. 1401). Carrying body weight is synonymous to static situations, as
this branch of mechanics is �dealing with relations of forces that produce equilibrium�
(Webster's Third International Dictionary, p. 2229). Moving body weight is synonymous
to dynamic situations, as the �branch of mechanics that deals with forces and their rela-
tion primarily to the motion but sometimes also to the equilibrium of bodies of matters�
(Webster's Third International Dictionary, p. 711).
The foot has to be rigid for standing tasks. Whereas for walking, a balance between
static and dynamic elements is required. Thus, the foot has to act as a spring to
compensate in�uencing forces and as a lever to provide the locomotion of the body.
5

2 Anatomical and functional basics of the foot
Figure 2.1: Qualitative Illustration of vertical and horizontal anteroposterior componentsof the ground reaction force in standing and walking (adapted from Brinck-mann et al., 2012, p. 387; Zatsiorsky, 2002, p. 57)
Simultaneously, the foot has to be �exible to adjust to the environment and transfer
generated and acting forces (Götz, 2001; Rodgers, 1995). Vertical and horizontal forces
constrain di�erent structures of the foot to change their dimension or location. The forces
di�er in static compared to dynamic situations (Brinckmann et al., 2012, p. 51; Elftman,
1939). For instance, vertical static forces during standing comprise the magnitude of
body weight, whereas they exceed body weight during walking (see Figure 2.1).
2.2 Structures and functionality of the foot
The foot consists of seven tarsal bones, �ve metatarsal bones, fourteen bones of the
phalanges, and usually two sesamoid bones. These bones interact with each other in 33
articulated unions. To ful�l the static and dynamic tasks, 20 muscles and 107 ligaments
and tensions, as well as thousands of blood vessels and nerve tracts are involved (Zim-
mermann, 2010, p. 10; Greisberg, 2007, p.1; Netter, 2001, p. 312; DeAsla and Deland,
2004, p. 1). For the functionality of the foot, skeletal structures and soft tissues are
coequally important. Soft tissue is �a generic term for muscle, fat, �brous tissue, blood
vessels, or other supporting tissue matrix� (McGraw-Hill Dictionary).
6
2.2 Structures and functionality of the foot
2.2.1 Bones and joints
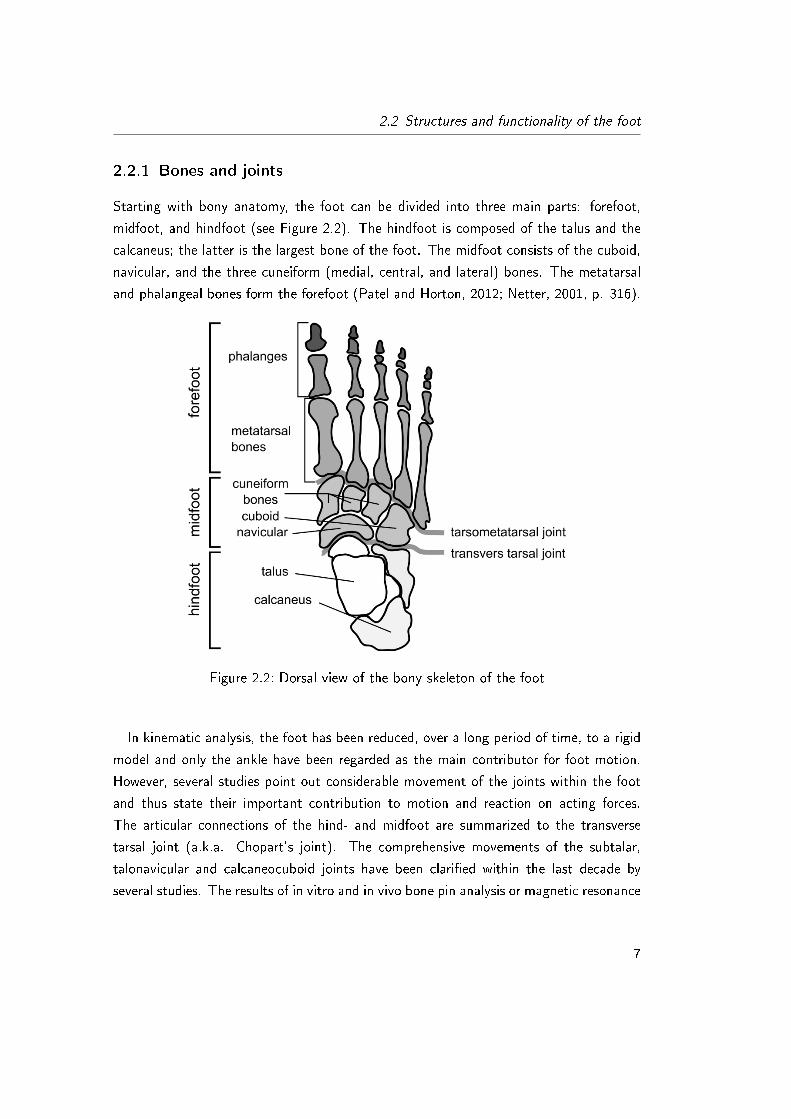
Starting with bony anatomy, the foot can be divided into three main parts: forefoot,
midfoot, and hindfoot (see Figure 2.2). The hindfoot is composed of the talus and the
calcaneus; the latter is the largest bone of the foot. The midfoot consists of the cuboid,
navicular, and the three cuneiform (medial, central, and lateral) bones. The metatarsal
and phalangeal bones form the forefoot (Patel and Horton, 2012; Netter, 2001, p. 316).
Figure 2.2: Dorsal view of the bony skeleton of the foot
In kinematic analysis, the foot has been reduced, over a long period of time, to a rigid
model and only the ankle have been regarded as the main contributor for foot motion.
However, several studies point out considerable movement of the joints within the foot
and thus state their important contribution to motion and reaction on acting forces.
The articular connections of the hind- and midfoot are summarized to the transverse
tarsal joint (a.k.a. Chopart's joint). The comprehensive movements of the subtalar,
talonavicular and calcaneocuboid joints have been clari�ed within the last decade by
several studies. The results of in vitro and in vivo bone pin analysis or magnetic resonance
7

2 Anatomical and functional basics of the foot
imaging show that these joints are more mobile than formerly assumed (Nester et al.,
2007; Arndt et al., 2004; Mattingly et al., 2006). Nester et al. have found, in 13
cadaveric feet, a broad range of motion in sagittal, frontal, and transverse plane (see
Table 2.1). The authors have compared the in vitro bone pin data with in vivo data of
three subjects and found similar kinematic patterns (Nester et al., 2007; Arndt et al.,
2004). Thus, the assumption that the calcaneocuboid joint is less important for motion
must be refused (Greisberg, 2007, p. 5). For inversion and eversion during walking, the
subtalar and the talonavicular joints are important (Greisberg, 2007, p. 5; Mattingly et
al., 2006).
The symbiosis of joints, connecting midfoot and forefoot, are summarized as the tar-
sometatarsal joint (a.k.a. Lisfranc's joint). These joints also feature sagittal, frontal, and
transversal motion, even more pronounced within the lateral ray (Nester et al. 2007).
Motion is also found between the three cuneiform and the �ve metatarsal bones (Nester
et al., 2007).
Table 2.1: Range of motion of transvers tarsal and tarsometatarsal joints of the foot(according to Nester et al., 2007)
Joints of the hind-, mid- and fore-foot
SagittalPlane [°]
FrontalPlane [°]
TransversePlane [°]
Calcaneus - Talus 7.8 ± 3.8 9.7 ± 5.2 8.1 ± 4.7Talus - Navicular 12.2 ± 7.1 12.4 ± 5.0 16.8 ± 9.2Calcaneus - Cuboid 9.8 ± 4.0 7.6 ± 3.7 8.0 ± 3.2Navicular - Medial Cuneiform 11.4 ± 5.1 8.3 ± 2.3 4.5 ± 2.2Navicular - Central Cuneiform 9.8 ± 3.6 8.1 ± 2.2 5.4 ± 2.7Navicular - Lateral Cuneiform 14.3 ± 4.7 7.4 ± 1.6 11.2 ± 4.0Navicular - Cuboid 9.4 ± 4.5 8.3 ± 3.3 7.9 ± 2.8Metatarsal 1 - Medial Cuneiform 5.6 ± 2.4 6.9 ± 2.4 5.1 ± 2.1Metatarsal 2 - Central Cuneiform 5.3 ± 1.6 5.1 ± 2.1 4.6 ± 2.0Metatarsal 3 - Lateral Cuneiform 7.3 ± 3.1 7.7 ± 2.2 4.9 ± 1.6Metatarsal 4 - Cuboid 10.4 ± 3.0 10.4 ± 2.8 5.3 ± 1.8Metatarsal 5 - Cuboid 12.5 ± 3.2 12.9 ± 4.4 5.1 ± 1.7
The metatarsophalangeal joints, with their wide range of motion, are essential for
the functionality of the foot during locomotion (Greisberg, 2007, p. 1). Whereas, the
interphalangeal joints are more important for grasping which signs to the preliminary
tasks of the foot (Greisberg, 2007, p. 6).
8

2.2 Structures and functionality of the foot
The operating forces during standing are distributed through the talus to the fore- and
hindfoot. This distribution is realised by the constitution of the arches of the foot. The
arches of the foot are contradictorily described, especially regarding their function and
signi�cance (Logan, 1995, p. 9). Consensus exists on the occurrence of a longitudinal
and a transverse arch. The longitudinal arch can be divided into a medial and a lateral
part. The medial longitudinal arch is formed by the calcaneus, the talus, the navicular,
the three cuneiforms, and the three medial metatarsals. The lateral longitudinal arch is
composed by the calcaneus, the cuboid and the lateral the two metatarsal bones (Logan,
1995, p. 9). The curved array of the MTHs is responsible for the formation of the
transverse arch (Logan, 1995, p. 9). Both arches are passively tensed up by ligaments
and actively by muscles. The dynamic behaviour depends on the individual constitution
especially of the individual muscular and ligamentous tension (Appell, 2008, p. 79).
2.2.2 Soft tissues of the foot
The soft tissue is actively and passively important for foot function. The muscles, as
active portions of soft tissue, are important for both static and dynamic functions and
also for the transfer of forces on bones and soft tissues due to their activation (Lloyd et
al., 2008). The muscles of the foot can be divided into intrinsic and extrinsic muscles.
The muscle bulges of the intrisic muscles are within the foot. Whereas, the muscle bulges
of the extrinsic muscles are in the lower leg and only their tendons insert and function
within the foot (DeAsla and Deland, 2004, p. 9; Soysa et al., 2012).
Most of the intrinsic muscles can be found on the plantar side of the foot. On the
dorsum of the foot, the extensor hallucis longus and extensor digitorum brevis is located.
The plantar intrinsic muscles are divided into four layers (Table 2.4). It is generally
accepted that intirisic muscles ful�l several important tasks during walking, which can
be summarized by supporting the arch. Nevertheless, not much is known about their
activation patterns as well as their concentric or eccentric functions and their overall
strength, due to challenges in examining these muscles (Soysa et al., 2012).
The extrinsic muscles can be divided into anterior, lateral, and posterior compartments.
The anterior compartment consists of tibialis anterior, extensor hallucis longus, extensor
digitorum longus, and peroneus tertius. Their tendons pass through the superior exten-
sor retinaculum and are mainly responsible for dorsi�exion and inversion of the ankle,
dorsi�exion of the hallux, and dorsi�exion of the other four toes (DeAsla and Deland,
9

2 Anatomical and functional basics of the foot
Table 2.2: The four muscle layers of the plantar foot
Muscle Layers Intrinsic Muscles Extrinsic Muscles
�rst (super�cial) layer adductor hallucis,�exor digitorum brevis,adductor digiti
second layer quadrates plantae,four lubricals
tendons of �exor hallucislongus and �exor digitorumlongus
third layer �exor hallucis brevis,�exor digiti minimi brevis,adductor hallucis
forth (deep) layer seven interosseous tendons of tibialis posterior,tibialis anterior and peroneuslongus
2004, p. 10). Peroneus longus and brevis form the lateral compartment. Their tendons,
going through the superior peroneal retinaculum, evert the foot and plantar �ex the an-
kle as well as the �rst metatarsal (DeAsla and Deland, 2004, p. 10). Furthermore, the
tension of the peronaeus longus is important for the function of the longitudinal arch.
The deep posterior compartment comprises the �exor digitorum longus, tibialis posterior,
and �exor hallucis longus that pass through the �exor retinaculum. They are involved
in inversion of the foot and plantar �exion of foot and ankle. The super�cial posterior
compartment consists of the gastrocnemicus and soleus that con�uence into the Achilles
tendon (DeAsla and Deland, 2004, p. 10).
Manifold ligaments are involved to stabilize the foot and to support force transmission
during locomotion. Short links run plantar and dorsal between the bones next to each
other (Putz and Müller-Gerbl, 1991). On the dorsum of the foot, these ligaments form
a heterogeneous �bre slap that is entangled to the articular capsules. In this respect, the
ligament birfurcatum is most important for the limitation of pronation in the transvers
tarsal joint. Around the tarsometatarsal joint, the same kind of �bre slap is found,
although only the medial part can be seen as an amphiarthrosis (Putz and Müller-Gerbl,
1991).
10
2.2 Structures and functionality of the foot
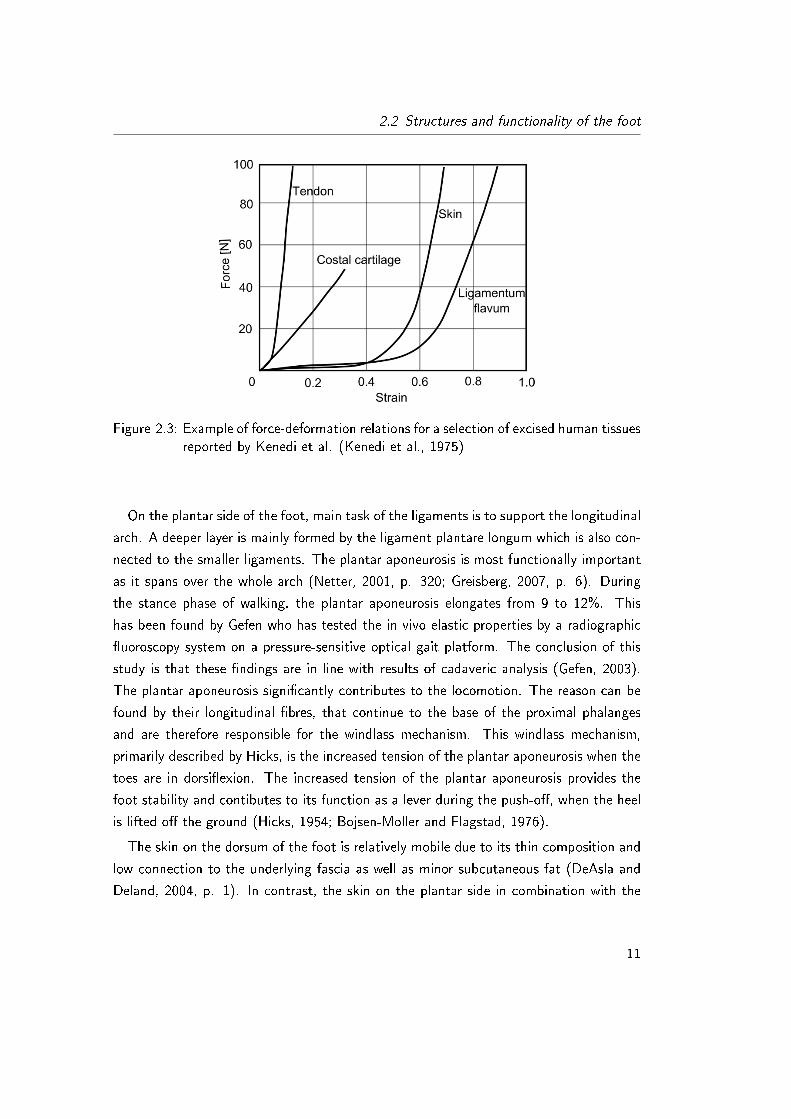
Figure 2.3: Example of force-deformation relations for a selection of excised human tissuesreported by Kenedi et al. (Kenedi et al., 1975)
On the plantar side of the foot, main task of the ligaments is to support the longitudinal
arch. A deeper layer is mainly formed by the ligament plantare longum which is also con-
nected to the smaller ligaments. The plantar aponeurosis is most functionally important
as it spans over the whole arch (Netter, 2001, p. 320; Greisberg, 2007, p. 6). During
the stance phase of walking, the plantar aponeurosis elongates from 9 to 12%. This
has been found by Gefen who has tested the in vivo elastic properties by a radiographic
�uoroscopy system on a pressure-sensitive optical gait platform. The conclusion of this
study is that these �ndings are in line with results of cadaveric analysis (Gefen, 2003).
The plantar aponeurosis signi�cantly contributes to the locomotion. The reason can be
found by their longitudinal �bres, that continue to the base of the proximal phalanges
and are therefore responsible for the windlass mechanism. This windlass mechanism,
primarily described by Hicks, is the increased tension of the plantar aponeurosis when the
toes are in dorsi�exion. The increased tension of the plantar aponeurosis provides the
foot stability and contibutes to its function as a lever during the push-o�, when the heel
is lifted o� the ground (Hicks, 1954; Bojsen-Moller and Flagstad, 1976).
The skin on the dorsum of the foot is relatively mobile due to its thin composition and
low connection to the underlying fascia as well as minor subcutaneous fat (DeAsla and
Deland, 2004, p. 1). In contrast, the skin on the plantar side in combination with the
11

2 Anatomical and functional basics of the foot
plantar fat pads have to absorb high forces and shocks. Therefore, they have a special
composition. The skin is tightly bonded by the strong vertical �brous elements located
on the heel, medial and lateral borders, and the ball of the feet (DeAsla and Deland,
2004, p. 1). The �brous lamellae of the plantar subcutaneous layers are adipose-�lled
chambers, which provide the absorption of the peak forces and the damping of vibrations
(Bojsen-Moller and Flagstad, 1976; Wang et al., 1999).
Between 1947 and 1965, several historic developments have been done that are im-
portant for the interpretation of soft tissue deformation. These studies analysed the
mechanical properties of biological tissues and found that most of them feature non-
linear viscoelastic behaviour (see Figure 2.3). The mixture-composition, considering the
cellular level, as well as high proportions of elastin and water explain the viscoelasticity of
the biological tissues and non-linear deformation (Larrabee, 1986; Kenedi et al., 1975).
The structures under the heel and MTHs have been most frequently studied (Prichasuk
et al., 1994; De Clercq et al., 1994; Aerts et al., 1995; Cavanagh et al., 1999; Wearing et
al., 2009; Wang et al., 1999) and their non-linear properties have been veri�ed (Pioletti
and Rakotomanana, 2000; Gefen et al., 2001; Wearing and Smeathers, 2011; Aerts et al.,
1995). The highest thickness of the tissue is under the heel, followed by the MTHs. The
thickness progressively decreases from MTH1 to MTH5 (Hsu et al., 1979; Wang et al.,
1999). Ledoux and Belvins have found di�erent compressive properties beneath the heel.
They have found an increased relaxation time and energy loss compared to other plantar
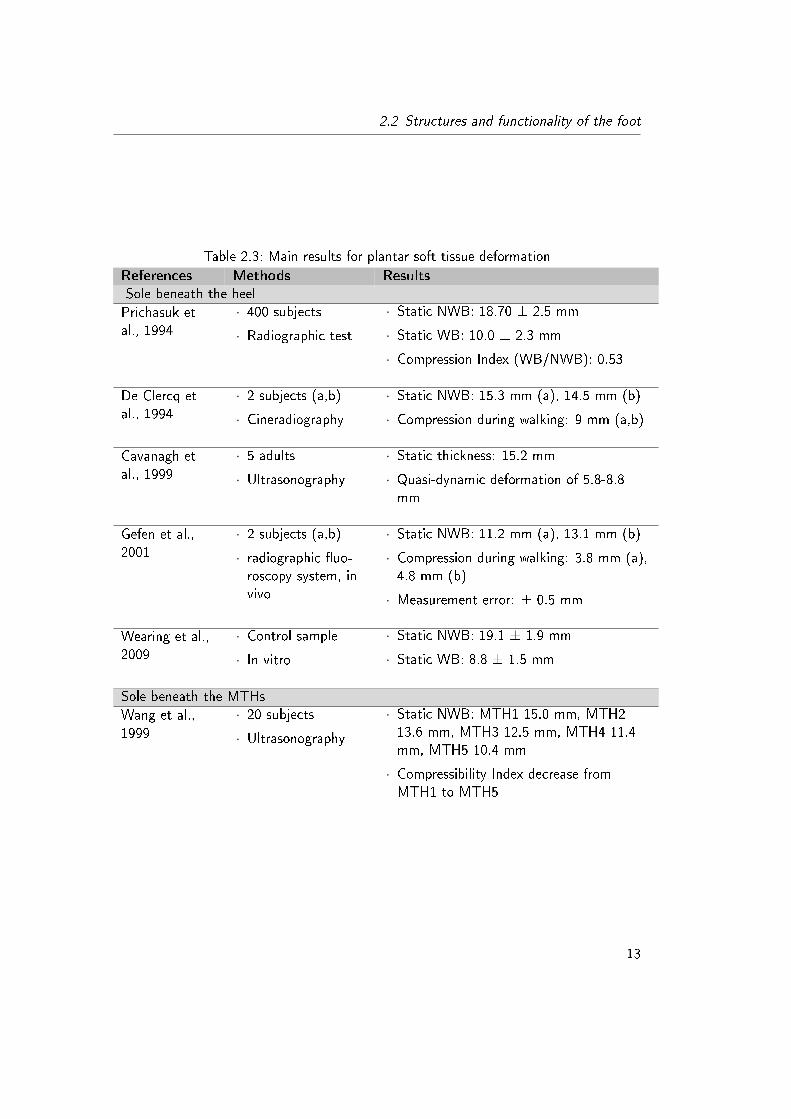
soft tissue areas (Ledoux and Belvins, 2007). Table 2.3 presents the main �ndings of soft
tissue compression between static non-weight-bearing (NWB) and weight-bearing (WB).
12
2.2 Structures and functionality of the foot
Table 2.3: Main results for plantar soft tissue deformationReferences Methods ResultsSole beneath the heelPrichasuk etal., 1994
· 400 subjects
· Radiographic test
· Static NWB: 18.70 ± 2.5 mm
· Static WB: 10.0 ± 2.3 mm
· Compression Index (WB/NWB): 0.53
De Clercq etal., 1994
· 2 subjects (a,b)
· Cineradiography
· Static NWB: 15.3 mm (a), 14.5 mm (b)
· Compression during walking: 9 mm (a,b)
Cavanagh etal., 1999
· 5 adults
· Ultrasonography
· Static thickness: 15.2 mm
· Quasi-dynamic deformation of 5.8-8.8mm
Gefen et al.,2001
· 2 subjects (a,b)
· radiographic �uo-roscopy system, invivo
· Static NWB: 11.2 mm (a), 13.1 mm (b)
· Compression during walking: 3.8 mm (a),4.8 mm (b)
· Measurement error: ± 0.5 mm
Wearing et al.,2009
· Control sample
· In vitro
· Static NWB: 19.1 ± 1.9 mm
· Static WB: 8.8 ± 1.5 mm
Sole beneath the MTHsWang et al.,1999
· 20 subjects
· Ultrasonography
· Static NWB: MTH1 15.0 mm, MTH213.6 mm, MTH3 12.5 mm, MTH4 11.4mm, MTH5 10.4 mm
· Compressibility Index decrease fromMTH1 to MTH5
13
2 Anatomical and functional basics of the foot
2.3 Development of the foot
At the time of birth, the child's foot already resembles an adult's foot in appearance.
However, the foot has to pass through di�erent developing processes until it reaches the
functional characteristics of an adult's foot. These processes can be regarded from an
external point of view as foot growth (Section 2.3.1) but also from an internal point of
view as functional development (Section 2.3.2).
2.3.1 Foot growth
The changes of foot anthropometry have been analysed in di�erent studies (Anderson
et al., 1956; Cheng et al., 1997; Mauch, 2007; Volpon, 1994). Newborn's foot length
comprises one third of its �nal length and already three years later about two thirds are
reached (Maier and Killmann, 2003; Volpon, 1994). From birth to the age of three years,
feet grow on average 24 mm a year, to the age of �ve years approximately 12 mm a year,
and to the age of twelve years 8-10 mm (Anderson et al., 1956; Cheng et al., 1997;
Mauch, 2007;Volpon, 1994). Girls reach the �nal foot length at the age of twelve to 13
years and boys approximately two years later (see Figure 2.4). Between the ages of �ve to
twelve years, boy's feet are on average 2 mm longer than girl's feet. The gender-speci�c
di�erences of foot length are extended as the feet of boys grow further to the age of
about 15 years (Anderson et al., 1956; Cheng et al., 1997; Gould et al., 1990; Maier and
Killmann, 2003; Walther et al., 2005).
The pronounced growth of the �rst toe, accompanied by diminishing growing tenden-
cies from the second to the �fth toe, changes the shape of the forefoot by the age. The
pointier forefoot of an adult and therefore more acute-angled ball angle obviously di�ers
from the round-shaped forefoot of a child (Maier and Killmann, 2003; Stracker, 1966).
Other dimensions like foot width and foot girth change due to the growing process,
too. Relative ball width and girth as well as relative heel width decrease up to the age of
eleven years followed by a small increase (Kouchi, 1998; Mauch, 2007). Several studies,
that studied the feet of children and adolescents, have summarized that smaller feet are
usually more voluminous than larger feet (Debrunner, 1965; Gould et al., 1990; Kristen,
1968; Mauch, 2007).
14

2.3 Development of the foot
Figure 2.4: Overview of foot growth (data from Anderson et al., 1956, Cheng et al.,1997, and Mauch, 2007)
15

2 Anatomical and functional basics of the foot
2.3.2 Functional development
The visible growth of the �exible children's feet, is accompanied by other developing
processes. The numerous developing processes even continue after the foot has reached
its �nal length and proportion. Main processes, important to achieve full function of the
foot, comprise ossi�cation of bones and reduction of the �exibility of tendons, ligaments,
and joint capsules due to increased inclusion of proteoglycans and crosslinks of collagens
(Anderson et al., 1965; Cheng et al., 1997; Gould et al., 1990; Maier and Killmann, 2003;
Mauch, 2007; Stavlas, 2005). Complete sti�ness and resistance of all soft tissues and full
ossi�cation are not achieved until late adolescence (Drenckhahn, 2003; Drennan, 1992;
Maier and Killmann, 2003; Walther et al., 2005).
Most essential developing processes take place by the time of upright standing and
walking (Maier et al., 1980). Related to this developmental stage, di�erent functional
adaptations occur. Wilhelm Roux described �ttingly that morphogenesis is the adaptation
to functional performance (Sander, 1991). The changed and enlarged forces cause an
increase of the strength of muscles and ligaments and the tightening of connecting tissues
within the foot (Maier and Killmann, 2003). Furthermore, skeletal changes take place,
with their onset in the hip joint. Asymmetric growth, which is caused by compressive load
on the lateral side of the leg, and the sequential internal rotation of the hip are responsible
for the convertion of the primary genuvarum to an intermediate state of genu valgum.
Further compressive load accounts for the increased growth of the lateral epiphyseal
cartilage and yields in a straight position of the leg ( Hefti, 2000; Hefti and Brunner,
1999; Jani, 1986; Maier and Killmann, 2003). Additional contribution to the neutral leg
centreline is supplied by the outward rotation of malleoli of ankle. The neutral position
of the ankle is reached at the age of about three years (Nakai et al., 2000). Whereas, a
neutral leg centreline is usually achieved at the age of six years (Maier, 1999).
The changes, regarding foot function, are associated with the described changes of
the leg centreline. Within the foot, most important changes concern the hindfoot and
the longitudinal arch. The hindfoot starts to reorganize with the beginning of upright
standing and walking. The calcaneus rotates in a longitudinal and pronated pattern and
gradually undercut the talus which is more pronated and medially positioned, in the foot
of an infant (Jani, 1986; Koebke, 1993). Asymmetric growth is again responsible for
the erection of the hindfoot (Maier and Killmann, 2003; Walther et al., 2005). A genu
valgum of the hindfoot of 15-20° is still visible at the age of four years (Jani, 1986).
16

2.4 In�uences on foot morphology
The erection of the hindfoot is decisive for the maturation of the medial longitudinal
arch. The bones of the midfoot move from a formerly supinated into a pronated location
(Koebke, 1993; Nigg and Segesser, 1992; Rabl and Nyga, 1994). On the contrary,
some authors stated that the bony constitution of the medial longitudinal arch exists
already prenatally (Bähler, 1986; Jani, 1986; Von Lanz, 1972, p. 383-386). Indeed, the
maturation of the medial longitudinal arch may depend more on the dimension of the
subjacent fat pad and on weaker ligaments and muscles (Dowling et al., 2001; Ker et
al., 1987). The fat pad has to protect the growing enchondral cartilage by distributing
the acting forces (Dowling et al., 2001; Ker et al., 1987). Until the age of approximately
�ve years, this fat pad is responsible for an enlarged contact area, which is similar to
pathological �at feet, when only footprints are examined (Anetzberger and von Liebe,
2000; Hefti and Brunner, 1999; Schilling, 1985). The decline of this fat pad is evidence
of a developmental process. The time of this decline di�ers between the genders and is
earlier attained in girls (Hefti and Brunner, 1999; Hennig and Rosenbaum, 1991; Hennig
et al., 1994; Mickle et al., 2008; Pfei�er et al., 2006).
The incidence of �at feet is considered as a developmental stage which is manifested in
footprints of 97% of infants aged between twelve to 18 months (Forriol and Pascual, 1990;
Morely, 1957; Staheli, 1999). Responsible factors for development of a normal-arched
foot are the combined factors of skeletal changes within the hindfoot, strengthening of
ligaments and muscles and reduction of the fat pad.
2.4 In�uences on foot morphology
The variability of the feet has been reported in many studies (Cheskin, 1987; Krauss et
al., 2008; Mauch, 2007). The reason for the high variability of foot morphology can
be explained by the statement: form follows function (Sullivan, 1947). Roux has also
stated that morphogenesis is the outcome of functional adaptation that occurs through
performing the functions (Sander, 1991). Thus, the combination of individual behaviour
and aging as well as body mass in combination with the genetic program causes the
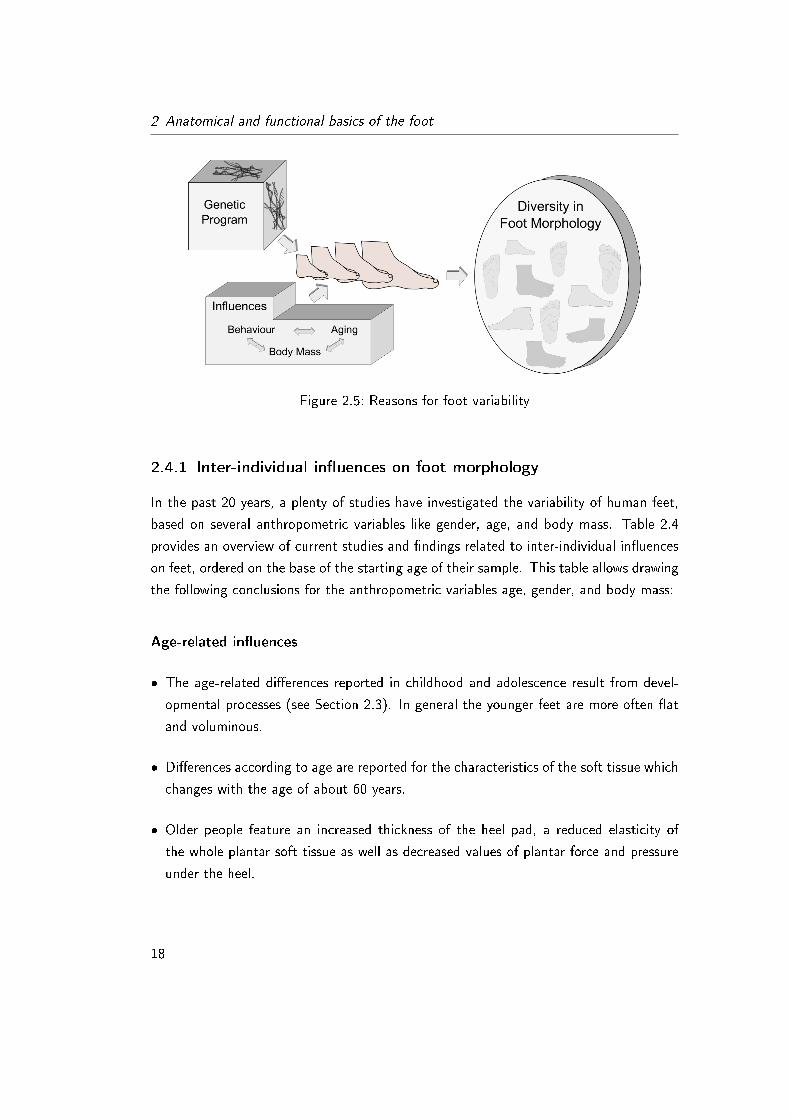
inter-individual in�uences of foot morphology (see Figure 2.5).
17
2 Anatomical and functional basics of the foot
Figure 2.5: Reasons for foot variability
2.4.1 Inter-individual in�uences on foot morphology
In the past 20 years, a plenty of studies have investigated the variability of human feet,
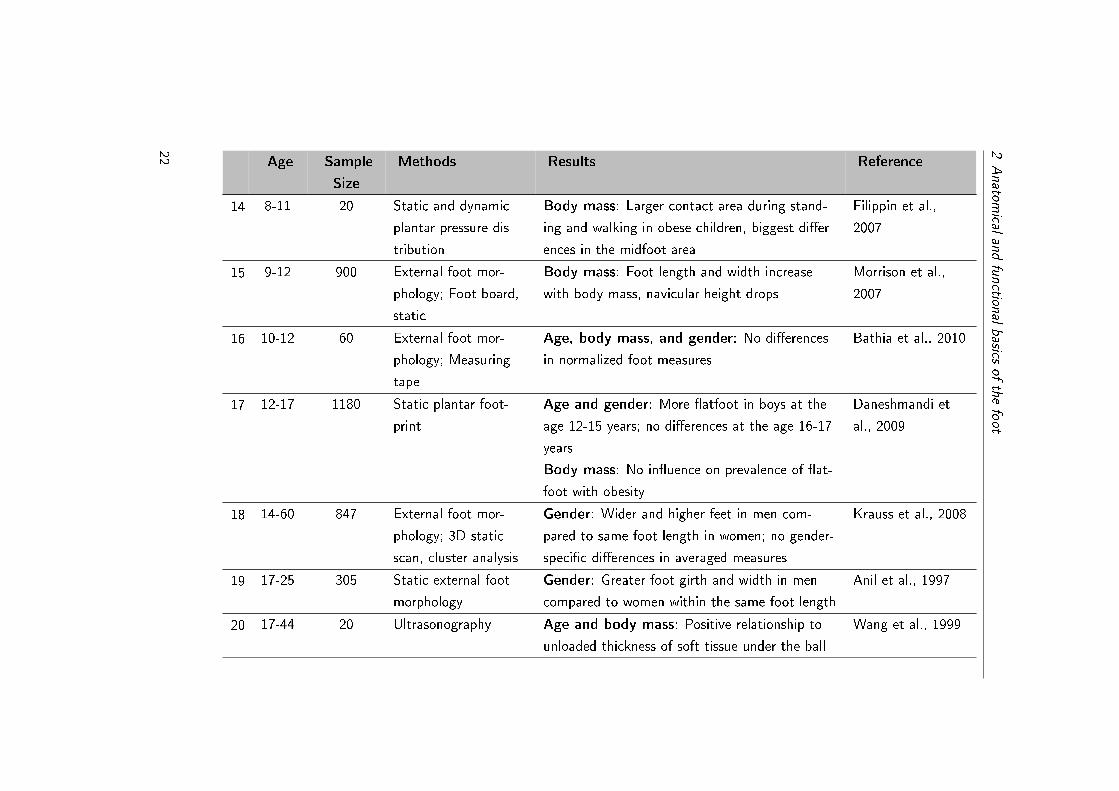
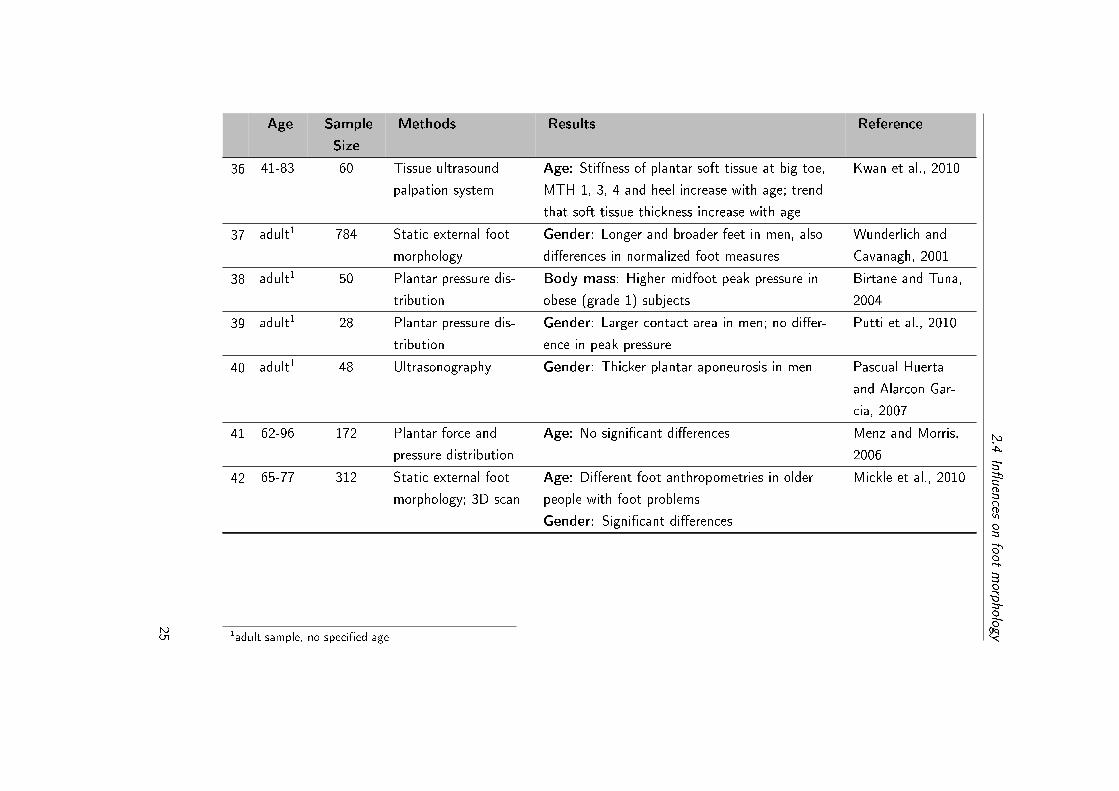
based on several anthropometric variables like gender, age, and body mass. Table 2.4
provides an overview of current studies and �ndings related to inter-individual in�uences
on feet, ordered on the base of the starting age of their sample. This table allows drawing
the following conclusions for the anthropometric variables age, gender, and body mass:
Age-related in�uences
� The age-related di�erences reported in childhood and adolescence result from devel-
opmental processes (see Section 2.3). In general the younger feet are more often �at
and voluminous.
� Di�erences according to age are reported for the characteristics of the soft tissue which
changes with the age of about 60 years.
� Older people feature an increased thickness of the heel pad, a reduced elasticity of
the whole plantar soft tissue as well as decreased values of plantar force and pressure
under the heel.
18

2.4 In�uences on foot morphology
Gender-related in�uences
� At the age of three to �ve years, there are gender-related di�erences relating the arch.
These di�erences refer to the retarded foot development of boys.
� The prevalence of �at feet is still increased in boys at the age of twelve to 15 years.
No di�erence is found at the age of 16 to 17 years.
� Di�erences according to gender are reported in full-gown feet. The feet of males partic-
ipants are usually longer, higher, and broader. However, the �ndings are controversial
when the foot measures are normalized to foot length.
� Higher plantar pressure under the midfoot and less sti�ness of the arch of the feet of
female particpants point to di�erences of the characteristics of soft tissue.
In�uences related to overweight or obesity
� Di�erences according to overweight are already reported in childhood. Feet of over-
weight children are more often �at and voluminous.
� The prevalence of �at feet is increased in younger overweight children.
� In general, the magintude of measured force is higher under the feet of overweight
participants. However, similar plantar pressures of normal and overweight participants,
due to increased contact area, are found.
� The thickness of the soft tissue under the heel and the ball is higher in overweight
adults.
These inter-individual di�erences are especially important for the construction of footwear.
However, not much is known about the intra-individual in�uences of foot morphology.
19

2Anatom
icalandfunction
albasics
ofthefoot
Table 2.4: State-of-the-art of science concerned with inter-individual in�uences on feet
Age Sample
Size
Methods Results Reference
1 1-80 441 External foot mor-
phology
Age: Flat feet usual in infants, common in chil-
dren and normal range in adults feet
Staheli et al., 1987
2 2-14 2887 External foot mor-
phology; 3D static
scan; Cluster analysis
Age: More slender and long foot types, less �at,
robust and short foot types with increasing age
Body mass: More �at and robust foot types in
overweight, more slender and long foot types in
underweight children
Mauch et al., 2008
3 3-5 88 External foot mor-
phology and ultra-
sonography
Gender: Flatter feet and thicker midfoot fat
pad in boys
Mickle et al., 2008
4 3-5 38 Plantar foot print and
ultrasonography
Body mass: Lower plantar arch height in over-
weight children; No di�erences in thickness of
midfoot fat pad due to body weight
Mickle et al.,
2006a
5 3-5 34 Dynamic plantar pres-
sure distribution
Body mass: Larger force, larger contact area,
higher peak pressure under the midfoot of over-
weight children
Mickle et al.,
2006b
6 3-6 835 Clinical diagnose of
�at feet, 3D static
scan
Age, body mass, and gender has in�uences
on the prevalence of �at foot
Pfei�er et al.,
2006
20

2.4In�uences
onfoot
morp
hology
Age Sample
Size
Methods Results Reference
9 4-13 1181 Plantar foot print Body weight: Increased prevalence of �at feet
in 4-5 year-old, overweight children
Garcia-Rodriguez
et al., 1999
10 6-12 1032 External foot mor-
phology; 3D digitizer,
static
Age: No di�erences
Body mass: Di�erences in width, ball height,
and arch height; di�erences in whole foot mea-
sures in overweight and obese children; most
di�erences disappeared with normalization to
foot length
Jiménez-Ormeno
et al., 2013
11 6-10;
adult1125;
111
Dynamic plantar pres-
sure distribution
Age: Lower peak pressure and larger relative
contact area in children; medial load shift with
age to forefoot
Body mass: Higher plantar pressure distribu-
tion in overweight subjects
Gender: No di�erences
Hennig et al.,
1994
12 7-9 26 Static foot print and
plantar pressure dis-
tribution
Body mass: Lower footprint angle, higher
mean peak dynamic forefoot pressures in obese
children
Dowling et al.,
2001
13 7-10 140 Identi�cation of �at
feet; Foot Posture
Index, Static
Body mass: Less �at feet in overweight chil-
dren
Evans, 2011
21
2Anatom
icalandfunction
albasics
ofthefoot
Age Sample
Size
Methods Results Reference
14 8-11 20 Static and dynamic
plantar pressure dis-
tribution
Body mass: Larger contact area during stand-
ing and walking in obese children, biggest di�er-
ences in the midfoot area
Filippin et al.,
2007
15 9-12 900 External foot mor-
phology; Foot board,
static
Body mass: Foot length and width increase
with body mass, navicular height drops
Morrison et al.,
2007
16 10-12 60 External foot mor-
phology; Measuring
tape
Age, body mass, and gender: No di�erences
in normalized foot measures
Bathia et al., 2010
17 12-17 1180 Static plantar foot-
Age and gender: More �atfoot in boys at the
age 12-15 years; no di�erences at the age 16-17
years
Body mass: No in�uence on prevalence of �at-
foot with obesity
Daneshmandi et
al., 2009
18 14-60 847 External foot mor-
phology; 3D static
scan, cluster analysis
Gender: Wider and higher feet in men com-
pared to same foot length in women; no gender-
speci�c di�erences in averaged measures
Krauss et al., 2008
19 17-25 305 Static external foot
morphology
Gender: Greater foot girth and width in men
compared to women within the same foot length
Anil et al., 1997
20 17-44 20 Ultrasonography Age and body mass: Positive relationship to
unloaded thickness of soft tissue under the ball
Wang et al., 1999
22

2.4In�uences
onfoot
morp
hology
Age Sample
Size
Methods Results Reference
21 18-26 19 Static internal foot
morphology; radiogra-
phy
Gender: Greater medial and lateral arch angles
in female in weight bearing condition
Fukano and
Fukubayashi, 2012
22 18-65 145 External foot mor-
phology; arch height
and sti�ness
Age: No di�erences in arch height index and
sti�ness
Gender: No di�erences in arch height index;
less sti�ness of arch in women
Zifchock et al.,
2006
23 18-78 33 Ultrasonography Age: Loss of elasticity of the heel pad in older
people
Hsu et al., 1998
24 18-24;
74-86
100 Plantar force and
pressure distribution
Age: Decreased magnitude of force and pres-
sure under the heel in older people
Scott et al., 2007
26 18-24;
71-90
70 Plantar pressure dis-
tribution
Age: Greater contact area and less contact time
in the forefoot; no di�erences in force or peak
pressures in older people
Kernozek and
LaMott, 1995
27 19-29 72 Static plantar imprint
and ground reaction
force
Body mass: Larger plantar contact area and
pressure in overweight subjects
Gender: No di�erences
Gravanate et al.,
2003
28 19-35;
42-72
19 In vivo tissue tester Age: E�ects of aging on plantar soft tissue
properties under metatarsal heads in older peo-
ple
Hsu et al., 2005
23

2Anatom
icalandfunction
albasics
ofthefoot
Age Sample
Size
Methods Results Reference
29 20-25 300 Foot volume (water
displacement)
Gender: In all foot dimensions Manna et al., 2001
30 20-59 90 Static external foot
morphology
Gender: Longer feet in men, relatively narrower
but higher feet in women
Luo et al., 2009
31 20-60 400 Radiography of heel
pad
Age and body mass: Increase of heel pad
thickness with age and body weight
Gender: Thicker unloaded heel pad in men
Prichasuk et al.,
1994
32 20-30;
60-70
20 In vivo tissue tester Age: Higher tissue sti�ness under MTH2 and
heel in older people
Theo et al., 2012
33 21-37 45 Static and dynamic
external foot mor-
phology; cross sec-
tions
Gender: No di�erences Kouchi et al., 2009
34 30-53 70 Static and dynamic
plantar pressure dis-
tribution
Body mass: Higher plantar pressure, broader
ball width in overweight subjects
Gender: Higher plantar pressure under the mid-
foot in women
Hills et al., 2001.
35 37-74 50 Ultrasonography Body mass: Positive correlations with unloaded
heel pad thickness
Gender: Compressibility index is related to gen-
der
Nass et al., 1999
24
2.4In�uences
onfoot
morp
hology
Age Sample
Size
Methods Results Reference
36 41-83 60 Tissue ultrasound
palpation system
Age: Sti�ness of plantar soft tissue at big toe,
MTH 1, 3, 4 and heel increase with age; trend
that soft tissue thickness increase with age
Kwan et al., 2010
37 adult1 784 Static external foot
morphology
Gender: Longer and broader feet in men, also
di�erences in normalized foot measures
Wunderlich and
Cavanagh, 2001
38 adult1 50 Plantar pressure dis-
tribution
Body mass: Higher midfoot peak pressure in
obese (grade 1) subjects
Birtane and Tuna,
2004
39 adult1 28 Plantar pressure dis-
tribution
Gender: Larger contact area in men; no di�er-
ence in peak pressure
Putti et al., 2010
40 adult1 48 Ultrasonography Gender: Thicker plantar aponeurosis in men Pascual Huerta
and Alarcon Gar-
cia, 2007
41 62-96 172 Plantar force and
pressure distribution
Age: No signi�cant di�erences Menz and Morris,
2006
42 65-77 312 Static external foot
morphology; 3D scan
Age: Di�erent foot anthropometries in older
people with foot problems
Gender: Signi�cant di�erences
Mickle et al., 2010
1adult sample, no speci�ed age
25

2 Anatomical and functional basics of the foot
2.4.2 Intra-individual di�erences
Intra-individual di�erences imply all changes within a subject's foot. These in�uences
are important for each individual but also for footwear design. This subchapter focuses
on di�erences caused by static or dynamic situations; other in�uences based on thermal,
hormonal or daytime factors are not considered.
Several studies have compared di�erent loading situations with regard to changes of
foot dimension. In 1968, Carlsöö and Wetzstein compared in vitro skeletal changes in
NWB, half weight-bearing (HWB), and full weight-bearing (FWB). They examined the
feet of 19 students by x-ray examination. Their conlusion was that not the skeletal
changes but soft tissue deformation are responsible for changes of foot dimension. How-
ever, they found no signi�cant di�erences of foot length, width, or height (Carlsöö and
Wetzstein, 1968).
Current �ndings conclude that there are di�erences of foot dimensions due to di�erent
loading situations. Plantar foot deformation of 126 Nigerian subjects has been analysed
for NWB, HWB and FWB situations. The foot lenght of men increases by 2.5% in HWB
and 3.0% in FWB compared to NWB situation. For women, the corresponding values are
smaller with 1.6% and 2.3%, respectively. Foot width of men increases by 3.7% in HWB
and 5.4% in FWB situation, foot width of women by 5.0% and 6.4%. The measurements
have been taken using a sliding caliper. No information about reproducibility is provided
(Oladipo et al., 2009). Tsung et al. have measured the 3D plantar foot shape of 16
normal feet in NWB, HWB, and FWB situation by an optical digitizing system. The
contact area, foot length, width and rearfoot width increase while average height, arch
height, and arch angle decrease. From NWB to HWB and FWB foot length increase
about 2.7 ± 1.2% and 3.4 ± 1.3%, foot width about 2.9 ± 2.4% and 6.0 ± 2.1%, and
rearfoot width 5.9 ± 4.8% and 8.7 ± 4.9%. The presented Root Mean Square Error
is > 1 mm for foot length and width measures (Tsung et al., 2003). For the feet of
40 men, captured by an optical digitizer, Houston et al. have found an increase in foot
length from NWB to HWB of about 1.7% and from NWB to FWB of about 2.2%. Ball
width increases by 3.8% in HWB and 4.3% in FWB (Houston et al., 2006). Xiong et al.
have analysed nine foot dimensions of the whole foot of 30 Chinese adults using a laser
scanner. They have also compared NWB, HWB, and FWB of the 3D foot and concluded
similar to the plantar comparisons that the foot becomes signi�cantly longer, wider, and
is reduced in height with weight-bearing. Main changes have been found for the midfoot
26

2.4 In�uences on foot morphology
area (Xiong et al., 2009). Another study has compared the foot length and width in
NWB and FWB situation of 2829 Chinese children, aged between 3 and 18. The values
for the reproducibility of the foot measures obtained by an electronic caliper are about
± 0.1 cm for foot length and ± 0.2 cm for foot width. The increases are independent
of age and gender and comprise 3.1% for foot lenght and 4.8% for foot width (Cheng et
al., 1997).
The dynamic foot morphology is in particular important with respect to the �t of
footwear. To adequately capture the dynamic foot morphology, analysis systems like
kinematic set-ups, goniometers, or pressure platform do not provide su�cient informa-
tion about the deformation of the foot. Advances in scanner technology allow capturing
the foot during walking. Di�erent scanner technologies are described in detail in Sec-
tion 3.3.2. The focus on this section is on the �ndings regarding dynamic foot morphology
compared to static foot morphology.
Several research groups are engaged in the development of dynamic foot scanner sys-
tems. Regarding the literature of the last years, some di�erent feasibility studies of
dynamic foot scanner systems can be found (Jezersek and Mozina 2009; Kimura et al.,
2005; Wang et al., 2006). Jezersek and Mozina have calculated the foot girth at 55% of
foot length and found a change of 16 mm (about 5.6%). However, these changes are not
captured during natural walking but during plantar�exion of a static situation (Jezersek
and Mozina, 2009). During the stance phase of walking, i.e. the phase from the position
when the MTHs hit the ground to the position when the whole foot is on the ground
before the heel lift up, Coudert et al. have analysed one foot by example. They have
found an increase in foot width of about 5 mm for this subject, the width of the fore-
foot deforms about 5%. However, the authors have not precisely de�ned the used foot
measures and have reported some technical problems regarding the synchronisation and
measurement frequency (Coudert et al., 2006). Kouchi et al. have examined di�erent
foot girth measures of the feet of 45 Japanese. They have directly drawn four lines on
the foot of each subject and compared these cross-sections at two di�erent times of the
stance phase. They have compared the two dynamic sitautions, determided by vertical
ground reaction forces (�rst peak and midstance valley), with a static situation. Espe-
cially, the width of the heel and instep cross-section is wider at the �rst peak compared
to standing. The width of the forefoot cross-section is wider, whereas the width of the
heel cross-section narrower at the midstance valley compared to the standing situation
27

2 Anatomical and functional basics of the foot
(Kouchi et al., 2009). Kimura et al. have provided one example of the measured 40
subjects. For this example the maximum of ball girht during walking is about 4 mm
larger compared to the standing situation. However, they have stated that the analysis
of the foot shape deformation will be future work (Kimura et al., 2011). Another study
has showed that the foot length of 27 subjects increases on average of 9 mm during
dynamic situation compared to static situation (Thabet et al., 2011). The repeatability
of the static and dynamic foot length on the plantar system comprises 2.44 mm and 2.81
mm, respectively. Schmeltzpfenning et al. have achieved on a plantar scanner system a
Root Mean Square Error (RMSE) for foot length and width measures, ranging from 0.43
mm to 1.72 mm (Schmeltzpfenning et al., 2009a). In 144 subjects, an increase of heel
width, medial ball length, and width as well as ball angle in several phases during the
stance phase compared to static situations has been reported (Schmeltzpfenning et al.,
2010).
The di�erent studies, focusing on dynamic foot morphology are promising. However,
there is still a lack of information about the entire foot deformation compared to the
respective static values. Furthermore, no study aimed to give concrete recommendations
for the improvement of the dynamic �t of footwear. These recommendations can be ben-
e�cial for foot development and health, the subsequent Chapter 3 presents fundamentals
of footwear construction as well as the interface of foot and footwear to derive these
recommendations.
28

3 Fundamentals of footwear
This chapter presents fundamentals of footwear. Section 3.1 describes principles of last
and shoe construction with respect to sizing and grading. The interfaces of feet and
shoes are presented by the current state of reserach, in Section 3.2. Main focus is on
e�ects of footwear on feet and thus, the �t of footwear. The last subchapter (Section 3.3)
explains basic methods to record static foot morphology followed by current approaches
to capture the foot during walking.
3.1 Footwear construction
Footwear construction is a complex process with several working steps. The primal
footwear has been manufactured solely by handcraft. Until now, knowledge and ex-
periences of footwear construction have been kept and passed on from generation to
generation. Today, most of the work�ow is automated, however, the �rst steps of de-
signing shoes is still handcrafted. Likewise, main steps of the construction as well as the
general architecture of shoes are the same as a hundred years ago.
3.1.1 How a shoe arises
Basically, the shoe is formed by the upper and the sole. The sole can be divided into
di�erent parts (outsole, midsole, insole). All parts ful�l, at a variable extent, the main
function of shock absorption and thus contribute to the comfort of shoes. The design
of the upper part is determined by the type of the shoe and decisive for its �t (Cheskin,
1987; Miller, 1989; Rossi and Tennant, 2011; Satra, 1993). The �rst working step to
receive a shoe, and even the most important, is designing a shoe last (Mitchell et al.,
1995).
A shoe last is the model or internal support to create a shoe. The very �rst lasts have
been made of stone, followed by wooden lasts that have been used for centuries. In the
29

3 Fundamentals of footwear
Figure 3.1: Important last measures (adjusted to Mitchell et al., 1995)
course of industrialisation, metal lasts were introduced in 1818. In 1961, commercial
plastic lasts came into the market. However, wooden handmade lasts are still the initial
models for shoes (Cavanagh, 1980; Luximon and Luximon, 2013, p. 194; Mitchell et al.,
1995; Rossi, 1980).
Nowadays, shoe manufacturing usually starts by a copy of a proven hind part of a
shoe last. The fore part of this shoe last is mainly modi�ed following the current fashion
trends or key measurements or sometimes also an example of another shoe. To achieve
a promising shoe, the �heart of a shoe�, as Rossi entitled the last, has to be thoroughly
�nished, following years of experience (Rossi, 1980, p. 1). According the six measures,
presented in Figure 3.1, last designers inspect their lasts of the respective size. Usually,
last designers work on one master piece in the size EU 38 or US 6 for women and EU 42
or US 9 for men (Cavanagh, 1980; Cheskin, 1987; Luximon and Luximon, 2013; Mitchell
et al., 1995; Rossi, 1980).
30

3.1 Footwear construction
3.1.2 Sizing and grading
The required variety of shoe sizes is attained by grading the master piece last. Grading
means that the master piece is enlarged or reduced. Usually, a combination of length and
girth measures is used and one of three types of grading. The �rst type, most frequently
used, is called arithmetic grading. This type implies that the increments of the measures
are constant. The second type is called geometric grading where the increments are
speci�ed as percentages of the dimensions. The third type, called proportional grading,
uses constant increments for all dimensions within all sizes (Miller, 1989).
Figure 3.2: Illustration of several sizing systems (in accordance with Luximon and Luxi-mon, 2013, p.206; Rossi, 2011, p. 88)
Even if sizing of shoes dates back several thousand years, it has become more important
within mass production of shoes. A di�erentiated and advanced system for sizing and
31

3 Fundamentals of footwear
grading was introduced by Edwin B. Simpson, in 1880. This system followed the English
system, based on one third inch for a whole shoe size with additional half sizes and
also di�erent widths for each size. This system includes a proportional grading and was
adopted by the US footwear industry, in 1888 (Rossi and Tennant 2011, p. 81).
Nowadays, there are several coexistent sizing systems all over the world, for instance
the English (UK), the American (US), the French (EU, a.k.a. Continental system or
Paris Point), the Chinese, and the Mondopoint system. The sizing, based on foot or
shoe length, of commonly used systems is presented in Figure 3.2. Their increments vary
depending on the system and comprise for the UK and US systems, from one shoe size
to the other, 8.46 mm (1/3 inch), for the EU system 6.67 mm and for the Mondopoint
5 mm.
The di�erent shoe widths are based on girth measure on lasts or feet, respectively. The
US system uses up to twelve di�erent widths for each shoe size (AAAAA to EEEEE).
The increments for the US and the UK system comprise ¼ inch (6.35 mm) from one
width to the other. Within the EU system, seven widths, with an increment of 5 mm,
are common (F, G, H, J, K, L, M). The same increments, from one width to the other
within a shoe size, are used for grading the width from one shoe size to the other.
Economically reasons are responsible that not all shoe manufacturers o�er this range of
shoe widths. This might be the reason why another classi�cation of shoe widths can be
found. A simplier and reduced shoe width system is often characterized by the letters
N (narrow), M (medium), and W (wide). However, there are no standards behind these
terms (Luximon and Luximon, 2013, p. 206-207; Rossi and Tennant, 2011, p. 82-83).
The Mondopoint system (see Section 3.1.3) also describes di�erent shoe widths for each
size that refer to the measured foot width (ISO 9407).
Another approach to account for the diversity of feet is based on the consideration of
the entire foot, rather than only one width or girth measure. A cluster analysis has been
used to de�ne several types of feet based on foot length, width and height measures.
Three main types of feet could be categorized by data of static foot scans (Krauss et al.,
2010; Mauch, 2007; Mauch et al., 2009). According to these analysed foot types, three
types of lasts as well as shoes have been produced for each shoe size. Up to now, this
promising procedure is only insularly adopted in German footwear industry.
32

3.1 Footwear construction
3.1.3 Standards for footwear construction
In most cases, the various sizing systems depend on guidelines of individual shoe man-
ufacturers and only a few national guidelines are available. However, there have been
several e�orts to standardize shoe and sizing systems. The international ISO technical
committee of footwear sizing system (ISO 9407) has aimed to introduce one sizing sys-
tem with standardized unit and increments. Furthermore, their objective has been to
standardize systems for calibrating lasts or equivalent equipment, as well as terminology.
In 1991, they presented the Mondopoint system, which is a standardized sizing system
where the distinction of the sizes is based on foot length and width measures. This
system is used for military shoes as well as, in parts, security shoes and skiing boots.
However, it has still not been expanded to other �elds (Blattner, 2007).
The handcraft of last construction mostly follows exclusively collected guidelines of last
designers or shoe manufacturers. Only few guidelines, depending on national or collabo-
rative activities of manufacturers, do exist. Two guidelines for shoe last construction are
accessible to the public: First, the German AKA64-WMS and second, the Chinese Sys-
tem (Luximon and Luximon, 2009). The AKA64-WMS is a result of research activities in
Germany. They have started to identify de�cits of shoes regarding the physiological sup-
port of children's feet. Thus, the consortium of shoe manufacturers, last designers and
researchers, called �Arbeitskreis Kinderschuh� has been formed. In 1964, they primarily
presented guidelines that included threshold values for the construction of children's and
adolescents' shoes which were drawn on two-dimensional lasting boards. The main ben-
e�t of this reform is a better standardization of existing widths systems. This is realized
by a reduction of the prior recommended eleven shoe widths to four or �ve widths. These
recommendations has better be accepted by shoe manufacturers. Furthermore, the rec-
ommendations include instructions for the design of the toe box and the characteristics
of the sole (Maier and Killmann, 2003). The expansion of the system, adopted in 1974,
is still known as WMS system. Subsequently, it has been conformed to adults' and has
also been introduced in other countries, for example America (Adrian, 1991).
In China, standards for footwear construction were also de�ned and published, in 1984.
These standards refer to extensive foot studies. According to Luximon and Luximon, how-
ever, these standards have not been implemented in common software for last construc-
tion. Therefore, Luximon and Luximon have presented a new bottom design template
on the base of the American (adopted WMS) and Chinese standards, applicable for last
33

3 Fundamentals of footwear
construction (Luximon and Luximon, 2009).
Regarding the international available standards, it can be concluded that it is the
responsibility of each shoe manufacturer to rely on one of these rarely available standard-
izations. However, in reality, form, fashion, and economy are more often the decision
making criteria for footwear.
3.2 Foot and shoe interface
Archaeological �ndings have shown that footwear is as old as humanity. Footwear has
always been important to protect against abrasion and injury due to di�erent ground
surfaces. Furthermore, the developed footwear has always re�ected the climate in which
it has been used. Thus, its characteristics depend on the protection either against heat
or cold (Blattner, 2007, p. 1; Cheskin, 1987, p. 3). These positive reasons to wear shoes
are accompanied by several side e�ects resulting from the interactions of shoe and foot.
3.2.1 E�ects of footwear
The positive e�ect of shoes is the protection of the foot against environmental in�uences.
This is important for daily demands and even more in particular settings, for example
working or sports environments. Eventually, footwear is an expression of fashion and
lifestyle. In several cases, physiological requirements of feet are ignored, at best for a
certain time. In most countries worldwide, any kind of footwear is worn all day long.
Consequently, foot development takes place �within� shoes. On the one hand the protec-
tion is important for the foot, however on the other hand di�erent kinds of problems due
to wearing footwear are reported. This problems can be summarized in dermatological
problems, deformities, and functional impairments.
Dermatological problems are primarily caused by dynamic friction between shoes and
skin. This friction generates high temperatures on which the natural response is callused
skin. Callused skin reduces the conductibility of temperature with its Beilby-layer2 and
thus reduces the impairment of deeper layers. Another protective mechanism is perspi-
ration which enables a ten times higher heat absorption due to evaporation. Natural
adaptation is that more prespiratory glands can be found in areas where high dynamic
2Beilby-layer: hard layer with a greater density and reduced thermal conductivity; caused by bondingof horn cells of the skin due to friction heat (Grünewald, 2002, p. 175)
34

3.2 Foot and shoe interface
friction appears (Beilby, 1921; Günewald, 2002, p. 174-176). If the friction exceeds
a certain threshold regarding time or magnitude it may result in painful dermatological
problems. These problems are often reported and range from calluses, corns, plantar
warts, blisters etc. (Rossi and Tennant, 2011).
Deformities of the foot, which are continuously developed over time, occur frequently.
The relationship between foot deformities and ill-�tting footwear was already reported in
the middle of the 19th century. Hermann von Meyer reasoned that lateral and frontal
pressure pushes the toes aside and in some cases one upon the other (von Meyer, 1888).
Until then, shoes have been straight-shaped without obvious di�erences between right
and left shoe. The results of several studies of von Meyer can be seen as the origin of
curved lasts and shoes. However, current studies still indicate that shoe shape but also
incorrectly �tted footwear is responsible for foot deformities. Frey et al. described the
connection between shoe trends and foot deformities and pain in women. The majority of
the 356 women wore smaller shoes than their feet would need and reported foot pain (Frey
et al., 2000). Menz and Morris similarly concluded that forefoot diseases and foot pain
relate to incorrectly �tted footwear, on the base of their study of 176 older adults (Menz
and Morris, 2005). In 858 pre-school children, Klein et al. have found a relationship
between shoe length and the amount of the hallux valgus angle. Thus, ill-�tted footwear
is particularly harmful for the feet of children, that are prone to external in�uences (Klein
et al., 2009). Rao and Joseph, who have analysed 2300 static footprints, found that the
prevalence of �at feet is higher in children who have worn shoes, especially closed-toe
shoes, at an early age (Rao and Joseph, 1992). Already in 1939, Emslie reported that
80% of children, aged between two and four years, who have worn shoes had deformities
(Emslie, 1939). Jerosch and Mamsch have found mild to signi�cant deformities in ten
to thirteen years old children. They have found 19.1% with �at feet and 17.1% with
a hallux valgus (Jerosch and Mamsch, 1998). Di�erences in foot morphology between
shoed and un-shoed populations have been found in barefoot and shoed walkers. General
�ndings are that the feet of barefoot walkers are wider especially in the forefoot (D'Aout
et al., 2009).
Di�erent walking patterns that may lead to functional impairments have been demon-
strated in several studies using kinetic, kinematic, and temporal-spatial analysis methods.
The centre of pressure during walking has been investigated by Grundy et al. in 1975.
Sixteen subjects, have shown di�erent patterns when walking with shoes compared to
35

3 Fundamentals of footwear
barefoot walking. The conclusion is that the function of the forefoot is progressively re-
duced by increasing rigidity of the shoe sole (Grundy et al., 1975). In a kinematic analysis
of Wolf et al., most obvious di�erences have been found for the motion of the tibio-talar
joint, the medial arch, and the foot torsion (along the long foot axis) for 18 children
(mean age 8 years). The authors have showen that walking patterns with more �exible
footwear is approximated to the barefoot walking pattern (Wolf et al., 2008). González
et al. have found, for toddlers who have worn shoes, increased relative step length and
gait velocity as well as decreased relative step width and duration. The authors have
concluded that with appropriate footwear the gait patterns are more mature (González et
al., 2005). It is not clear whether this is a desirable goal. Future research and especially
longitudinal study designs can provide clarity on this issue.
3.2.2 Fit of footwear
The �t of footwear can be de�ned as �. . . the preference for a shoe to accommodate an
individual's foot.� (Goonetilleke et al., 2000, p. 1). Footwear �t is hard to de�ne but
generally accepted as important for foot health. It is one of the main criterions for buying
a shoe (Chong and Chan, 1992; Piller, 2002). However, every person with its individual
preconditions perceives �t in a di�erent way.
The perceived �t results in the individual assessment if the shoe is comfortable or
uncomfortable. The relationship between perception and measured pressure has been
evaluated for 15 subjects who tested three pairs of commercially available shoes. The
negative relationship has been found for measured plantar and dorsal pressure distribution
and perceived comfort, rated by a questionnaire (Jordan et al., 1997). Several studies
have assessed the relationship between pressure and comfort of running shoes. The
conclusion is that increased pressure, no matter whether it comes from di�erent insoles
or the whole shoe, results in reduced comfort (Chen et al., 1994; Miller et al., 2000;
Mündermann et al., 2002; 2003). The same relationship between perceived comfort and
variables resulting from kinematic or EMG analysis has been demonstrated for insoles
(Mündermann et al. 2003).
A shoe is perceived as uncomfortable if high pressures or forces occur. Interestingly,
the same perception is provoked by shoes that are too loose. The reason can be found
in slipping forward within the shoe. Thus, several researchers have stated that the
quality of footwear �t is in accordance with the match between foot and footwear or last,
36

3.3 Measuring foot morphology
respectively (Bataller et al., 2001; Cheskin, 1987, p. 126; Gould et al., 1991; Hawes et
al., 1994; Janisse, 1992; Kouchi, 1995; Rossi, 1980).
An indicator for the quality of �t has been presented by Goonetilleke et al. in 2000.
They have compared the 2D outline of the foot with the outline of the shoe and calculated
the dimensional di�erences (Goonetilleke et al., 2000). This procedure has been expanded
to a 3D comparison of lasts and feet by Luximon et al. (Luximon et al., 2001). Witana et
al. have found a high correlation between the perceived �t of a shoe and the match of a
last and the foot shape (Witana et al., 2004). Kouchi et al. have evaluated the favoured
�t of running shoes, compared to the exact match of last an foot by 3D scans. Their
results show that athletes with broad feet tend to wear narrow shoes whereas athletes
with slender feet prefer wide shoes (Kouchi et al., 2005).
The best �t of a shoe also implies to �nd the correct shoe. Following Rossi that
the �t of footwear is the �ability of the shoe to conform to the size, width, shape and
proportions of the foot� (Rossi, 2000, p. 63), it might be hard �tting the correct shoe
solely on the base of length and width measures. Several studies aimed to use additional
foot measures, beside foot length and foot width, to improve the 3D �t of footwear. This
is already common in individual shoe customization. However, the procedure of Mauch
et al. and Krauss et al. have showen a way to improve the �t as well as the �tting of
footwear for a larger population (Krauss et al., 2010; Mauch, 2007; Mauch et al., 2009).
The remaining lack is the information about dynamic changes of foot morphology.
3.3 Measuring foot morphology
The generally accepted assumption that footwear should follow foot shape makes it nec-
essary to measure the foot. For �tting the correct shoe it is recommended to measure foot
length and width in standing (half weight-bearing) situation (ISO 7250, Rossi and Ten-
nant, 2011, Telfer and Woodburn, 2010). Several methods to capture foot morphology
are available ranging from basic tools up to scanning technologies.
3.3.1 Static measurements
The basic tools and techniques to capture static foot morphology are calliper rulers or
tapes (Golding, 1902, p. 53-57). These basic tools allow capturing foot height, width,
length, and girth measures. Several foot measuring devices like the Brannock Foot-
37

3 Fundamentals of footwear
Measuring Device®, Ritz stick, and Scholl focus on foot length and maximum forefoot
width (Goonetilleke et al., 2000; Krauss and Mauch, 2013).
Further common methods are imprints produced by foam impressions and castings. A
positive shape of the imprint is reproduces and used to manufacture a foot orthotic on
the base of the model. Today, scanner systems are commonly used for this procedure
and several software packages allow time e�ectively processing and designing of orthotics
(Telfer and Woodburn, 2010).
Several scanner systems allow capturing and digitizing foot morphology from a plantar
view but also in its entirety. Basic information is obtained by 2D scanner systems with
the same mode of operation like �atbed scanners (Telfer and Woodburn, 2010). The
information is reduced to the outline of the plantar foot shape. 3D information of the
static foot morphology is mainly obtained by laser scanners (e.g. Yeti, scanGogh II) or
projected white light (e.g. FootScan3D, Artec M-Series, FootScaner FTS-4) (Saunders
and Chang, 2012). Both methods are based on the principle of active triangulation which
requires a projecting and a recording unit. Laser light (usually in lines) or structured white
light is projected onto the foot. Light sensors or cameras simultaneously record the scene
at a known angle (D'Apuzzo, 2007; Saunders and Chang, 2013). All methods allow recal-
culating the 3D models of the foot and the calculation of di�erent foot measures. Several
methods for the calculation of the foot measures are available. First, foot measures based
on anatomical landmarks are calculated with information about markers. These markers
are attached on several anatomical landmarks prior to the scanning process. Second, the
foot measures based on anatomical landmarks are calculated after the 3D model. Thus,
the anatomical landmarks have to be de�ned on the 3D image by editing digital points.
Third, the foot measures do not rely on anatomical landmarks but on de�ned percentages
of foot length (Krauss and Mauch, 2013, p. 21; Mauch et al., 2009).
In general, most of the scanner systems and especially those that are based on laser
technology need several seconds to record a static scene. Necessarily, participants have
to stand still for several seconds which is di�cult to realize especially with children
(D'Apuzzo, 2007; Saunders and Chang, 2013).
3.3.2 Dynamic foot scanning
Several authors, concerned with footwear �t, have claimed information about foot mor-
phology during natural walking (D'Aout et al., 2009; Kimura et al., 2009; Krauss et al.,
38

3.3 Measuring foot morphology
2010; Morio et al., 2009; Tsung et al., 2003). Current enhancements in scanner technol-
ogy provide approaches for the challenge of scanning 3D objects during motion. In the
entertainment industry some systems, like Microsoft Kinect, are already well-known and
furthermore a�ordable for everybody. However, a dynamic foot scanner presents major
challenges. Regarding the grading and sizing system but also the sensitivity of perceived
comfort, it can be stated that only few millimetres make a big di�erence. Thus, the
accuracy has to be very high.
There are only a few studies available that have presented dynamic foot scanner sys-
tems. The contemplated systems can be divided by their used methods: First, stereo
matching method and second, structured light method. The stereo matching method is
an optical method based on the principle of passive triangulation. Dynamic foot scan-
ners, on the base of stereo matching, have been introduced in several publications. The
advantage of this method is that the measurements can be conducted with high res-
olution (Coudert et al., 2006; Kouchi et al., 2009; Wang et al., 2006). However, the
main disadvantage is that correspondence problems exacerbate the 3D reconstruction of
the foot. Main reason for these correspondence problems is the uniform texture of the
surface of the foot. These problems have been di�erently solved in the studies and are
therefore regarded for each system.
Wang et al. have presented a set-up of eight CCD cameras based on the principle of
passive triangulation. They have captured the dorsum of the foot and the reconstruction
of the foot is based on the principal component analysis. Thus, the dynamic 3D model
has been approximated on the base of 397 feet. The solution for the correspondence
problems is that participants wear socks. The measurement frequency comprises 7.5
frames per second (fps) with a resolution of 640 x 480 pixels. The accuracy is speci�ed
ranging from 2 to 4 mm (Wang et al., 2005; 2006).
Coudert et al. have reconstructed the surface of the whole foot. They have used six
cameras (three pairs) to generate a 3D model of the foot. The authors have o�ered
two options to solve the correspondence problem. First, the foot can be covered with
a sock and second the foot can be sprayed with paint. The measurement frequency
comprises 25 fps with a resolution of 1280 x 960 pixels. Another limitation of this system
is that the synchronisation of the camera pairs is time shifted which may bias the results.
Furthermore, no information about the accuracy of the system is available (Coudert et
al., 2006).
39

3 Fundamentals of footwear
Kouchi et al. have used twelve cameras to capture the foot. They solve the correspon-
dence problems by drawing lines on the foot. Thus, only these lines can be evaluated.
The measurement frequency comprises 14 fps at a full resolution of 1026 x 768 pixels.
The accuracy is given at 0.5 mm (Kouchi et al., 2009).
During running, Blenkinsopp et al. have measured the dynamic dorsal foot surface
(Blenkinsopp et al., 2012). They have used six cameras (three pairs) and calculated
the foot morphology by digital image correlation. Contrasting random patterns on the
surface of the foot have been used to increase corresponding problems. These patterns
have been generated by water based face paints. A single subject has been studied with
the speed of about 4 ms-1. The measurement frequency is not reduced due to the post-
processing and is provided by the cameras (250 fps). The resolution comprises 1024
x 1024 pixels. The accuracy of the system and reliability of the foot measures is not
presented (Blenkinsopp et al., 2012).
Basically, two methods to solve the corresponding problems are presented in the studies:
First, using socks, and second, drawing lines or painting the whole foot. The �rst one
possibly in�uences the natural deformation of soft tissue. The second might a�ect the
reproducibility of the foot measures. Thus, both methods are not appropriate to capture
a higher number of persons. Other research groups chose approaches to capture the
dynamic foot morphology based on the principle of active triangulation. The advantage
is that the correspondence problems do not appear.
One system has been presented by the company Lionssytems. This system, called
Dynamic FootMorphology, is based on the principle of time of �ight. There are no
scienti�c notes available about details of this system. The measurement frequency is
stated as 42 fps (Dynamic FootMorphology, Lionsystems).
Jezersek and Mozina have presented a foot scanner system based on laser multiple-line
triangulation technique with four scanner units. The measurement frequency is 25 fps.
The accuracy of the system is given with 0.3 mm. The maximum error for the foot
length, width, height, and girth varies from 0.24 to 0.82 mm. However, the foot has
not been scanned during natural walking but only when rising on its toes. (Jezersek and
Mozina, 2009).
Thabet et al. have presented a plantar scanner system consisting of a single scanner
unit. Structured light is projected by a 3-LCD projector. The measurement frequency
is not presented. The resolution comprises 1080i HD resolution. The accuracy of the
40
3.3 Measuring foot morphology
system comprises 0.34 mm with a maximum of 0.5 mm. The reproducibility of empirical
feet is presented with an average of 2.44 mm in static situation and 2.81 mm in dynamic
situation (Thabet et al., 2011).
Schmeltzpfenning et al. have presented a plantar system using three scanner units.
Structured light is projected onto the foot and coded by pulse-width-modulation. The
timely synchronized high speed cameras capture the light patterns and the elevation
pro�le of the object is recalculated by equations of Frankowski et al. (Frankowski et
al., 2000). The measurement system comprises 41 fps with a resolution of 320 x 240
pixels. For detailed calculation of the repeatability of each foot measure it is refered to
Schmeltzpfenning et al., (2009) and Schmeltzpfenning (2011).
It can be summarzed that capturing the dynamic foot morphology is possible. The
challenge is much more the analysis of the data and the interpretation in terms of practical
relevance and applicability of the results.
41


4 Formulation of research question
and hypotheses
The research question and hypotheses of this thesis are derived from �ndings and de�cits
of the current state of research. In Section 4.1 the de�cits of the theoretical background
(Chapter 2 and Chapter 3) are summarized. These de�cits raise three main hypotheses
that are presented in Section 4.2.
4.1 Findings and de�cits of the current state of research
The main �ndings and de�cits of anatomical and functional basics of the foot can be
summarized as follows:
1. The foot has a very complex composition and is more mobile than formerly as-
sumed.
2. Movement of the foot is more or less known for single structures like bones and
joints as well as soft tissues like muscles or fat pad. Not much is known about the
entirety of foot deformation regarding the external foot morphology.
3. The development of the foot is important for the whole body and not �nished
until late adulthood. A major part of the development takes place within shoes
considering the shoed populations.
4. In�uences of gender, age, and body mass are veri�ed for static foot morphology
and functionality regarding pressure and force distribution as well as soft tissue
characteristics. However, these in�uences have not been considered for dynamic
deformation of the foot.
43

4 Formulation of research question and hypotheses
5. Intra-individual di�erences of foot morphology have not been considered as di�er-
ences between static and dynamic foot morphology. These di�erences are most
important for developing feet.
6. Up to now, anthropometric in�uences on the di�erences between static and dy-
namic foot morphology have not been analysed.
With respect to fundamentals of footwear as well as foot and shoe interface following
de�cits can be summarized:
1. The last, which has to represent the shape of the shoe, is mainly designed on the
base of experiences. The design of the last is still a handcraft and follows the
traditions as a hundred years ago.
2. Customization to dynamic changes of the foot is less considered in last construction.
Mainly foot length is regarded and usually implemented by adding a speci�ed toe
allowance which is the space in front of the toes.
3. Sizing and grading procedures are discrete even if the feet are continuous. Using
the words of Cheskin �Girth and size intervals � regular on lasts, irregular on the
feet� (Cheskin, 1987, p. 127).
4. Friction is one of the reasons for foot problems. Thus, footwear should account for
dynamic friction.
5. Footwear can change the walking patterns which might be a reason for further
problems. Thus, footwear should allow natural walking.
6. It is generally accepted that information about static foot morphology improves
the �t of footwear. Dynamic foot morphology, which has not been considered, can
further improve footwear �t.
7. Several systems allow generating static foot measures. Only, advancements in scan-
ner technology allow capturing dynamic foot morphology and calculating dynamic
foot measures.
8. Previous studies focus on the feasibility of the dynamic scanner systems. Thus,
there is a lack of comprehensive samples to formulate recommendations for the
dynamic �t of footwear.
44
4.2 Research question and hypotheses
9. There is no study that has considered dynamic foot morphology of developing feet.
The summarized �ndings and de�cits are twice as important: First, they are reason for
the raise of the research question and hypotheses. Second, they highlight the importance
of the responses and bene�t for footwear. The latter will be discussed in Section 9.2.
4.2 Research question and hypotheses
This thesis aims to evaluate dynamic foot morphology. Furthermore, the aim is to
generate results that help improve footwear �t and formulate recommendations for the
construction of footwear.
Research question 1:
How does foot morphology di�er between static and dynamic situations?
(RQ1)
This research question in addition with the state of the research is conducted to formulate
the three hypotheses.
Hypothesis 1 is established on previous �ndings that dynamic foot morphology in adults
di�ers from static foot morphology. The disparity in static and dynamic foot morphology
regarding anthropometric in�uences has not been evaluated. The detected in�uences
of gender, age, and body mass on static foot morphology raise the question if these
in�uences can also be detected in dynamic situation.
Hypothesis 1:
There are di�erences in dynamic foot morphology of adults according to age, gender,
and body mass.
(H1)
Hypothesis 2 also relies on the research question. However, this question has not been
answered for developing feet. The physiological development of the feet is very important
for the whole body. Static foot morphology has already been used to improve footwear �t
of children's shoes. However, the di�erences between static and dynamic foot morphology
is very important in terms of the fact that footwear is worn in most countries worldwide
and footwear can negatively a�ect the foot morphology.
Hypothesis 2:
Dynamic foot morphology of developing feet di�ers from static foot morphology.
(H2)
45
4 Formulation of research question and hypotheses
Hypothesis 3 further examines these di�erences by detecting the in�uence of gender,
age, and body mass. The inter-individual di�erences regarding static foot morphology
has also been detected in developing feet. Thus, it can be assumed that these variables
also a�ect the di�erences between static and dynamic foot morphology.
Hypothesis 3:
Gender, age, and body mass a�ect the dynamic foot morphology and the di�erences
between static and dynamic foot morphology of developing feet.
(H3)
The three hypotheses are examined within three research articles, which are presented in
Chapter 6, Chapter 7, and Chapter 8. A brief overview of the used methods to examine
the three hypotheses is presented in the following Chapter 5.
46

5 Methods
The aim of this chapter is to provide an overview of the used methods within this thesis.
The methods to examine the hypotheses are elaborated within each research article. This
chapter does not introduce the methods in detail, but references to chapters that provide
these details. Section 5.1 presents information about characteristics of the two analysed
samples and collections of foot data. The measurement system and analysis procedure
is brie�y described in Section 5.2, followed by the statistical analysis in Section 5.3.
5.1 Samples
The �rst sample comprises adult participants that were recruited from the area around
Tübingen. Criteria for exclusion were injuries or diseases of lower extremities a�ecting
normal gait, other limitations of free walking, vertigo, age less than 18 years, and body
weight of more than 125 kg. Precondition for the participation was that the participants
had read and understood the information about aims and contents of the study and
had signed the informed consent. 129 adults were included in the study. One randomly
de�ned foot of each adult was recorded during walking, with predifend walking speed of
4.5 km/h ±5%. More details on this sample can be found in Section 6.2.2.
The second sample includes 2554 children and adolescents from the southern part of
Germany. They were recruited within 15 schools. Measurements took place in these
schools. Children with written consent of one parent were included. Exclusion criteria
comprised injuries or diseases of the lower extremities that in�uence normal gait. One
randomly de�ned foot of each child was recorded during standing and walking (see Sec-
tion 7.2.1). Walking speed was prede�ned and adjusted to body height and is presented
in Table 7.2.
Both studies were approved by the ethics committee of the medical clinic of Tübingen.
The characteristics of the �rst and second sample are summarized in Table 5.1.
47
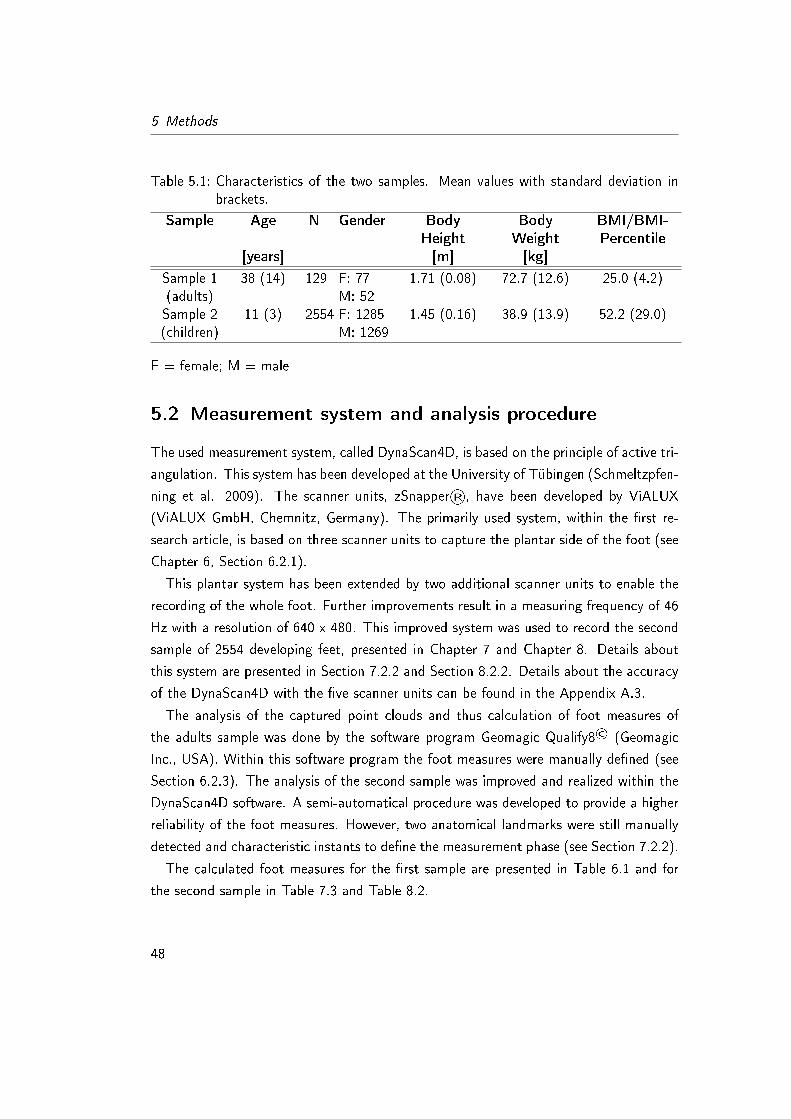
5 Methods
Table 5.1: Characteristics of the two samples. Mean values with standard deviation inbrackets.
Sample Age N Gender BodyHeight
BodyWeight
BMI/BMI-Percentile
[years] [m] [kg]
Sample 1(adults)
38 (14) 129 F: 77M: 52
1.71 (0.08) 72.7 (12.6) 25.0 (4.2)
Sample 2(children)
11 (3) 2554 F: 1285M: 1269
1.45 (0.16) 38.9 (13.9) 52.2 (29.0)
F = female; M = male
5.2 Measurement system and analysis procedure
The used measurement system, called DynaScan4D, is based on the principle of active tri-
angulation. This system has been developed at the University of Tübingen (Schmeltzpfen-
ning et al. 2009). The scanner units, zSnapper®, have been developed by ViALUX
(ViALUX GmbH, Chemnitz, Germany). The primarily used system, within the �rst re-
search article, is based on three scanner units to capture the plantar side of the foot (see
Chapter 6, Section 6.2.1).
This plantar system has been extended by two additional scanner units to enable the
recording of the whole foot. Further improvements result in a measuring frequency of 46
Hz with a resolution of 640 x 480. This improved system was used to record the second
sample of 2554 developing feet, presented in Chapter 7 and Chapter 8. Details about
this system are presented in Section 7.2.2 and Section 8.2.2. Details about the accuracy
of the DynaScan4D with the �ve scanner units can be found in the Appendix A.3.
The analysis of the captured point clouds and thus calculation of foot measures of
the adults sample was done by the software program Geomagic Qualify8© (Geomagic
Inc., USA). Within this software program the foot measures were manually de�ned (see
Section 6.2.3). The analysis of the second sample was improved and realized within the
DynaScan4D software. A semi-automatical procedure was developed to provide a higher
reliability of the foot measures. However, two anatomical landmarks were still manually
detected and characteristic instants to de�ne the measurement phase (see Section 7.2.2).
The calculated foot measures for the �rst sample are presented in Table 6.1 and for
the second sample in Table 7.3 and Table 8.2.
48

5.3 Statistical analysis
5.3 Statistical analysis
Hypothesis 1 and hypothesis 3 assume that dynamic foot morphology of adults (see
Chapter 6) and children ( see Chapter 8) is a�ected by the variables gender, age, and
body mass. Thus, the used statistical procedures to examine these in�uences are similar.
Section 6.2.4 and Section 8.2.5 describe two methods in detail:
� First, an analysis of matched pairs with the identi�cation of di�erences by Student's
t-test for independent samples.
� Second, a multiple regression analysis was conducted.
Hypothesis 2 states that there are di�erences between static and dynamic foot mor-
phology in developing feet. The di�erences between HWB, FWB and MaxDyn are tested
by one-way ANOVA with paired Student's t-test (see Section 7.2.3). Furthermore, within
this research article the repeatability of calculated foot measures was calculated by intr-
aclass correlation coe�cient (ICC) as well as root mean squared error (RMSE) (Perini et
al. 2005; Shrout and Fleiss 1979).
The statistical analysis was performed using the software JMP 9.0.2 (version 9.0.2,
SAS, Cary, USA) and SPSS (version 20, SPSS Inc. Chicago, IL, USA).
49


Research Paper I
In�uences on plantar dynamic
foot morphology in adults
Summary: The foot changes its shape in dynamic situations. This has been discussed
and proven with several studies (Coudert et al., 2006; Leardini et al., 2007; Kouchi et al.,
2009). Furthermore, it has been veri�ed that anthropometric variables like gender, age,
and BMI a�ect static foot morphology (Krauss et al., 2010; Xiong et al., 2009; Zifchock
et al., 2006). The aim of the present study is to identify the in�uence of gender, age,
and BMI on dynamic foot morphology and therefore prove hypothesis 1.
Published in: Footwear Science, 2013, Vol. 5, No. 2, 121�129
DOI: 10.1080/19424280.2013.789559
51


6 Anthropometric in�uences on
dynamic foot shape: Measurements
of plantar three-dimensional foot
deformation
Bettina Fritz, Timo Schmeltzpfenning, Clemens Plank, Tobias Hein and Stefan Grau
University of Tuebingen, Department of Sports Medicine, Hoppe-Seyler-Str. 6, Tuebin-
gen, 72076 Germany;
(Received November 6, 2012; accepted March 21, 2013)
Abstract
Purpose: Advances in scanner technology enable the capture of feet during walking.
Knowledge of dynamic deformation is essential for fundamental research and application-
oriented improvements in terms of comfortable and functional footwear. The core hy-
pothesis of our study is that there is a relationship between dynamic foot measures and
the anthropometric dimensions age, gender and body mass index.
Methods: We measured the dynamic foot shape of 129 subjects (77 female, 52 male)
with a plantar dynamic scanner system. During stance phase we captured maximum
values (MaxDyn) and changes (∆Dyn) of length, width, and height measures as well
as angles and indices of feet. We identi�ed relationships between foot measures and
anthropometric dimensions by two statistical methods: analysis of variance (ANOVA)
between matched groups and multiple regression analysis within whole sample size.
Results: MaxDyn values of foot width measures are higher in overweight subjects.
Most important predictors of MaxDyn are static measures and gender, regarding values
53

6 Anthropometric in�uences on dynamic foot shape
that characterise the longitudinal arch as well as lateral ball length. More dynamic
deformation was found in ball and arch angle as well as medial ball length and ball width
of overweight subjects and in width measures of women. Multiple regression analysis
detects body weight as an important predictor for changes in foot width measures as well
as arch height and angle.
Conclusion: The ability to collect foot measures during natural walking is the basis for
the following �ndings. First, our study con�rms that static foot measures can be used as
basic design criteria for footwear. Second, our study points out the in�uence of factors
like gender and body weight on dynamic foot morphology. Consideration of these ad-
ditional factors can essentially improve design methods and particularly the �t of footwear.
Keywords: dynamic scanning; dynamic foot deformation; footwear design; anthropome-
try; comfort; customisation
6.1 Introduction
Capture of the foot shape during walking is an essential and therefore frequently desired
procedure (Tsung et al., 2003; D'Aout et al., 2009; Kimura et al., 2009; Morio et al.,
2009; Krauss et al., 2010). The knowledge of dynamic deformation of the foot is a
bene�t for fundamental research as well as application-oriented improvements in terms
of comfortable and functional footwear. The �t of a shoe is a mostly long-kept secret of
last designers and based on long-standing manual craft experience. Advances in scanner
technology render it possible to capture feet in dynamic situations (Coudert et al., 2006;
Kouchi et al., 2009; Kimura et al., 2011). Moreover, this new input can help to objectify
the universal topic of well-�tting shoes.
Foot morphology is highly variable and therefore measures such as length, width, girth
and height, as well as �exibility of feet, are individually pronounced. Di�erent factors
in�uence characteristics of static foot shape, for example ethnicity, age, sex and body
mass index (BMI) (Hawes and Sovak, 1994; Kouchi, 1998; Wunderlich and Cavanagh,
2001; Mauch et al., 2008; Krauss et al., 2010). Several studies identi�ed the in�uence of
BMI on static foot width. Especially children's foot shape and functionality of longitudinal
arch are in�uenced by BMI (Hills et al., 2002; Mauch et al., 2008; Xiong et al., 2009). The
anthropometric dimension age causes controversial debates. In fact, biological structures
54
6.1 Introduction
change with increasing age, for example �exibility of soft tissues (Hsu et al., 1998).
However, some authors found no signi�cant changes in foot shape between di�erent ages
(Menz and Morris, 2006; Zifchock et al., 2006). The in�uences of gender have been
intensively studied during recent years. The main �ndings are that within the same shoe
size female feet are more slender and foot girth is smaller than in male feet (Krauss et
al., 2010). Recommendations to last designers are obvious: females need di�erent lasts
to males and it is not su�cient to graduate a men's last to a smaller size (Wunderlich
and Cavanagh, 2001; Krauss et al., 2010).
All identi�ed in�uences are important to improve comfort and �t of footwear and
therefore approximate the last's shape to the anatomical foot shape. Certainly, more
attention needs to be paid to anatomical conditions, because there is still a lack of
well-�tting shoe lasts (Kouchi, 1998; Witana et al., 2004; Richter and Schaefer, 2009).
Possibly, insu�cient considerations of dynamic situations can explain this lack. Comfort
and functionality of footwear is certainly more than assisting someone's buying decision
(Michel et al., 2009). Literature shows associations between insu�cient �t of shoes
and the development of foot deformities like hallux valgus, hammer or claw toes (Rossi
and Tennant, 1984; Janisse, 1992; Frey, 2000). Recent �ndings postulate that footwear
has long-term negative e�ects on foot morphology, function, and biomechanical qualities
(Wunderlich and Cavanagh, 2001; Zipfel and Berger, 2007; D'Aout et al., 2009).
Without controversy, feet change their shape in dynamic situations (Coudert et al.,
2006; Leardini et al., 2007; Kouchi et al., 2009). Based on assumptions and experiences,
designers of lasts and insoles try to include dynamic changes. However, there are only a
few studies that provide data for them. To the best of our knowledge, there is no inves-
tigation that systematically examines in�uencing factors of dynamic changes. Until now
technology has not allowed the capture of three-dimensional foot shape during natural
walking. Methods based on markers or goniometers and also e�orts to interpret dynamic
plantar pressure analysis provide dissatisfying results. Furthermore, the results may also
be error-prone due to relative moments of markers or coarse resolutions of pressure plat-
forms (Leardini et al., 2005; Wolf et al., 2008). In recent years, several research groups
have presented di�erent measurement systems for dynamic three-dimensional foot scan-
ning (Coudert et al., 2006; Wang et al., 2006; Kimura et al., 2009; Kouchi et al., 2009;
Schmeltzpfenning et al., 2009; Schmeltzpfenning et al., 2010). Most publications ad-
dress feasibility and show potentials and limitations of their systems (Wang et al., 2006;
55

6 Anthropometric in�uences on dynamic foot shape
Kimura et al., 2009; Kimura et al., 2011). Beside technical de�ciencies (e.g. low sample
rate), the core limitation of these studies is the small sample size (Coudert et al., 2006;
Kouchi et al., 2009). However, their scienti�c �ndings are auspicious and also seminal for
objecti�cation of dynamic customisation in footwear. Coudert et al. identi�ed increasing
ball width (5%) and heel width (about 5 mm) during walking. However, they did not
capture plantar foot morphology (Coudert et al., 2006). Kouchi et al. compared static
and dynamic situations and found statistically signi�cant di�erences in heel width, instep
height, width of forefoot, and medial ball length. Their sample rate was only 14 Hz and
they only analysed cross sections of the foot instead of the whole three-dimensional shape
(Kouchi et al., 2009).
Previous studies of foot deformation due to di�erent loading situations specify changes
especially in foot length, width of rear and forefoot and decreasing height of arch and
instep (Rossi and Tennant, 1984; Frey, 2000; Tsung et al., 2004; Xiong et al., 2009).
These changes or maybe more pronounced changes can also be expected during natural
walking. However, if you take into account the attitudes of several elastic and active
soft tissues it is impossible to predict the magnitude of deformation. A radiographical
examination of length, height and width of feet showed no changes in skeletal dimensions
(Carlsoo and Wetzenstein, 1968). In contrast, another group of researchers recently
analysed the kinematics of foot bones during walking and slow running by bone pins.
They concluded that in all studied joints movement was found and these movements
in some joints were higher than expected (Nester et al., 2007; Lundgren et al., 2008).
Therefore, deformation of soft tissues can be supposed. Elaborating on these thoughts,
anthropometric factors like age, gender, and BMI can be important and expanding in
analysing dynamic foot characteristics. The core hypothesis of this study is: there is a
relationship between dynamic foot deformation and the anthropometric dimensions age,
gender, and BMI.
6.2 Methods
6.2.1 Measurement system
To measure foot morphology during natural walking a special system based on active
triangulation was designed (Schmeltzpfenning et al., 2010). This dynamic scanner (Dy-
naScan4D) operates with three scanner systems (z-Snapper, Vialux, Chemnitz, Ger-
56

6.2 Methods
Figure 6.1: Dynamic plantar foot scan during walking - �ve frames of stance phase.
many), in which each system consists of a high-speed camera and a projector. The used
cameras (Pike F-032 B/W, Allied Vision, Stadtroda, Germany) record 205 frames per
second with a resolution of 640x480. The Digital Light Processing projectors project
di�erent structured light patterns by laminar technique on the foot. The light patterns
are coded by pulse-width-modulation and the shifting time of applied digital micro mirror
device technology (DMDTM by Texas Instruments, USA) generates luminous intensity
(Schmeltzpfenning et al., 2010). Timely synchronised cameras capture these light pat-
terns. With information about phase positions an elevation pro�le of the object can be
calculated by the equations of Frankowski et al. (Frankowski et al., 2000).
The scanner systems are installed on a 4.6 m long and 0.8 m high walkway. One
scanner system captures plantar foot morphology from beneath the walkway through a
glass platform. The other two scanner systems are installed above on the left and right
side of the walkway. Subjects walk over the walkway on which strain gauges additionally
trigger the detection of the roll-over process. In addition, we use light barriers to control
subjects' walking speed. We captured feet with a measurement frequency of 41 Hz and
a shutter time of less than 2 ms. The resolution was reduced to a 2x2 binning mode to
guarantee the high record rate (Figure 6.1).
6.2.2 Study design and study population
We recruited subjects from the medical clinic of the university to identify in�uences of
BMI, gender, and age. The study was approved by the local Ethics Committee of the
university. Altogether 187 subjects replied to announcements by email and �yers. We
informed all subjects about the aims and contents of the study as well as exclusion criteria.
Exclusion criteria comprised injuries or diseases of lower extremities a�ecting normal gait,
other limitations of free walking, vertigo, age younger than 18 years, and body weight of
more than 125 kg. Before starting measurements, exclusion criteria where observed and
subjects had to give written consent to participate.
57
6 Anthropometric in�uences on dynamic foot shape
We collected potential in�uencing variables like age, gender, body weight, and body
height. Body mass index (BMI) was calculated according to body weight (kg) divided by
squared body height (m). Additionally, we asked for the usually worn shoe size of each
subject. We de�ned the captured foot randomly and subsequently conducted dynamic
measurements. All subjects achieved a period of adaptation to assess that they walk
naturally with a speci�ed walking speed of 4.5 km/h ±5%. We captured three valid
naturally conducted trials per subject. Additionally, we captured all foot measures in a
static situation. Subjects were instructed to position their feet parallel and distribute
weight equally on both feet. Therefore, in the static situation, half body weight was
on the measured foot. The whole measurement procedure took about 25 minutes per
participant.
The �nal and representative sample is composed of 77 women and 52 men with a
mean age of 38 ±14 years. Body weight (72.7 ±12.6 kg), body height (1.71 ±0.08 m)
and BMI (25 ±4.2 kg/m2) are normally distributed. Shoe size for each gender is also
normally distributed with a peak around shoe size 39 (Paris Point) for women and around
42 for men. We found a skewed distribution for the variable age that can be explained
because of increased voluntary participation of students.
6.2.3 Foot measures
Captured point clouds of the foot were processed with the software program Geomagic
Qualify8© (Geomagic Inc., USA). The orientation of the foot was standardised on an axis
through the most medial point of the heel and �rst metatarsal head (MTH1). We identify
the plane of the glass platform within foot �at and transferred it to the other frames
of the roll-over process. Because of the marker-less technology, anatomical landmarks
MTH1 and MTH5 and also further foot measures were manually detected on the point
clouds. All foot measures are speci�ed in Table 6.1.
58

6.2Meth
ods
Table 6.1: All foot measures collected in static and dynamic situationFoot Length Measures Foot Width Measures Foot Angles and Height M. Arch I.
Foot Length (FL) Heel Width (HW) Ball Angle (BA) Chipaux-Smirak-Index(CSI) Ratioof AW andBW.
Distance betweenmost posterior pointof the heel andmost anterior pointof the longest toe.This measure is onlyde�ned in static sit-uations.
Distance betweenmost lateral andmedial point of theheel at right anglesto the medial axis.
Angle of theconnecting line(MTH1 andMTH5) and thex-axis.
Medial Ball Length (MBL) Midfoot Width (MW) Arch Angle (AA) Staheli-Index (SI)Ratio of AWand HW.
Distance betweenmost posterior pointof the heel andmost medial pointof MTH1.
Distance betweenmost lateral andmedial point of themidfoot at rightangle to the medialaxis.
Angle of theconnecting line(MTH1 and theangular point ofthe arch) and they-axis.
Lateral Ball Length (LBL) Arch Width (AW) Arch Height (AH)Distance betweenmost posterior pointof the heel andmost lateral pointof MTH5.
Narrowest distanceof the exit �eld.
Distance betweenthe ground (xy-plane) and thehighest point ofthe arch.
Ball Width (BW)Distance betweenmost medial pointof MTH1 and mostlateral point ofMTH5.
59

6 Anthropometric in�uences on dynamic foot shape
Four phases of the roll-over process where de�ned according to Blanc et al. (1999).
The �rst phase (P1) starts with the initial heel contact when the heel hits the glass
platform and ends with the �rst metatarsal contact. We standardised the beginning of
this phase with the second frame of heel contact. The second phase (P2) begins with the
�rst metatarsal contact and ends when the toes hit the ground. We de�ned the beginning
of the phase as the frame on which �rst and �fth metatarsals have complete contact with
the ground. Mean stance phase (P3) is the phase when the toes have contact with the
ground until the heel takes o�. We standardised the end of this phase by choosing the
second frame when the heel moves upwards and is no longer completely loaded but also
not o� the ground. The terminal stance phase (P4) is speci�ed from heel take o� to the
frame before MTH1 leaves the ground. Within these phases we calculated the di�erent
foot measures.
To analyse in�uences of anthropometric variables, we determined two response values
for each dynamic foot measure: (1) maximum value (MaxDyn) measured during dy-
namic loading; (2) magnitude of changes during dynamic loading calculated as di�erence
between minimum and maximum (∆Dyn). In which phases these data were captured
depends on the load situation during stance phase and di�ers for each foot measure.
Therefore, the three foot length measures foot length (FL), medial ball length (MBL),
and lateral ball length (LBL) were analysed within P2, and P3. During the same phases
ball angle (BA), arch angle (AA), arch height (AH), arch width (AW), and midfoot width
(MW) as well as the arch indices Chipaux-Smirak-Index (CSI), and Staheli-Index (SI)
were calculated. We additionally observed heel width (HW) within P1 and ball width
(BW) within P4.
6.2.4 Statistical analysis
We chose two di�erent methods to identify in�uences of age, gender, and BMI on dynamic
foot morphology. First, we normalised foot width, length, and height measures to static
foot length to eliminate or minimise in�uences of foot length on the dimension of dynamic
changes. In the �rst statistical approach we generated matched groups of subjects by
individually assigning subjects. Therefore, two groups for each variable were formed with
the aim to minimise the e�ect of confounding variables (see Table 6.2). Furthermore,
mean values between groups were compared by one-way analysis of variance (ANOVA)
and tested by independent t-test. With the second statistical method we calculated
60

6.3 Results
multiple regression analysis within the whole sample to identify in�uencing variables. This
method provides additional advantages in terms of estimating the magnitude of e�ects
as well as relationships between di�erent variables (Aiken et al., 1991). We calculated
a multiple linear regressions model on the basis of adding the variables stepwise forward
into the model. Critical p-value for inclusion of variables was ascertained at p ≤ 0.25.
The model was calculated according to Equation (1). Y is the target variable, which
represents the dynamic foot measures. Xi(i = 1, n) are the in�uencing variables that
describe dynamic foot measures.
E
(Y
X
)= β0 + β1X1 + β2X2 + · · · + βnXn + ε
All analyses were performed by using JMP Version 9.0.2 (SAS, Cary, USA). The level
of signi�cance was set to p < 0.05. If we state `di�erence', this refers to a statistically
signi�cant di�erence at this alpha level, throughout the paper.
6.3 Results
6.3.1 Di�erences between matched groups
Table 6.2 describes the matched groups formed according to the in�uencing variables
gender, BMI, and age. Main criteria of individual assignment were that groups were as
similar as possible within remaining anthropometric variables.
61

6Anthrop
ometric
in�uences
ondynam
icfoot
shape
Table 6.2: Characteristics of matched groupsIn�uencingVariables
Level N Age BodyHeight
BodyWeigth
BMI Shoe Size Gender
[years] [m] [kg] [kg/m2] [ParisPoint]
GenderMale 21 35.0 ± 13.0 1.74 ± 0.1 77.6 ± 11.7 25.3 ± 3.9 43 ± 1.0 ♂21Female 21 35.0 ± 14.0 1.68 ± 0.1 71.8 ± 8.7 25.3 ± 3.8 40 ± 1.4 ♀21
BMIOverweight 37 40.7 ± 14.8 1.69 ± 5.6 84.1 ± 10.7 29.4 ± 5.6 41 ± 2.1 ♀ 19; ♂ 18NormalWeight
37 39.6 ± 14.3 1.70 ± 7.1 68.0 ± 8.0 22.5 ± 1.9 41 ± 2.1 ♀ 19; ♂ 18
AgeOlder 26 57.6 ± 5.6 1.70 ± 5.6 74.3 ± 11.6 25.9 ± 3.8 41 ± 1.8 ♀ 13; ♂ 13Younger 26 24.6 ± 2.3 1.72 ± 7.1 74.5 ± 8.7 25.1 ± 3.1 41 ± 2.2 ♀ 13; ♂ 13
62

6.3 Results
Table 6.3, 6.4 and 6.4 show the results of comparing each pair by ANOVA. We tested
the di�erences between the matched groups for MaxDyn and ∆Dyn of all foot measures.
No gender-speci�c di�erences exist for MaxDyn of all foot measures. However, there
are di�erences between women and men for ∆Dyn of AW and BW. With both measures
women have higher values for ∆Dyn.
Between the matched groups overweight and normal weight we found di�erences for
∆Dyn of MBL, BW, BA, and AA. Furthermore, all maximum values of foot width mea-
sures di�er between overweight and normal weight subjects. All values are higher in the
group with overweight subjects.
The di�erences in ∆Dyn between the two age groups were statistically signi�cant
only in BA. Older subjects have higher di�erences in BA during dynamic loading. The
maximum value of HW is also higher in older subjects.
63

6Anthrop
ometric
in�uences
ondynam
icfoot
shape
Table 6.3: Di�erences in dynamic foot measure between matched groups � Gender
SubgroupsLengthMeasures
Width Measures Angles and Heights Indices
MBL[%FL]
LBL[%FL]
HW[%FL]
MW[%FL]
AW[%FL]
BW[%FL]
AH[%FL]
BA[°]
AA[°]
CSI SI
Gender
∆Dyn
♂ 0.92±0.47
1.95±0.92
2.13±0.32
0.92±0.53
3.04±2.09
1.67±0.60
2.05±1.45
2.56±1.20
7.59±5.16
0.08±0.05
0.13±0.09
♀ 0.75±0.39
2.12±0.74
2.18±0.37
0.84±0.49
4.25±2.47
2.20±0.63
2.46±1.45
2.15±1.14
7.22±7.59
0.10±0.06
0.18±0.11
p-value 0.220 0.536 0.639 0.603 0.044 0.012 0.362 0.270 0.865 0.254 0.133
MaxDyn
♂ 72.47±1.05
60.24±1.92
25.26±1.49
32.2±2.14
11.85±3.09
39.08±2.04
13.12±1.80
20.75±2.56
45.95±5.18
0.28±0.07
0.43±0.11
♀ 72.97±1.14
60.72±1.48
24.93±1.78
31.4±1.82
11.09±3.50
39.55±2.03
13.17±3.05
20.53±2.35
45.59±4.07
0.28±0.06
0.45±0.15
p-value 0.152 0.372 0.514 0.190 0.816 0.461 0.941 0.772 0.807 0.883 0.602
64
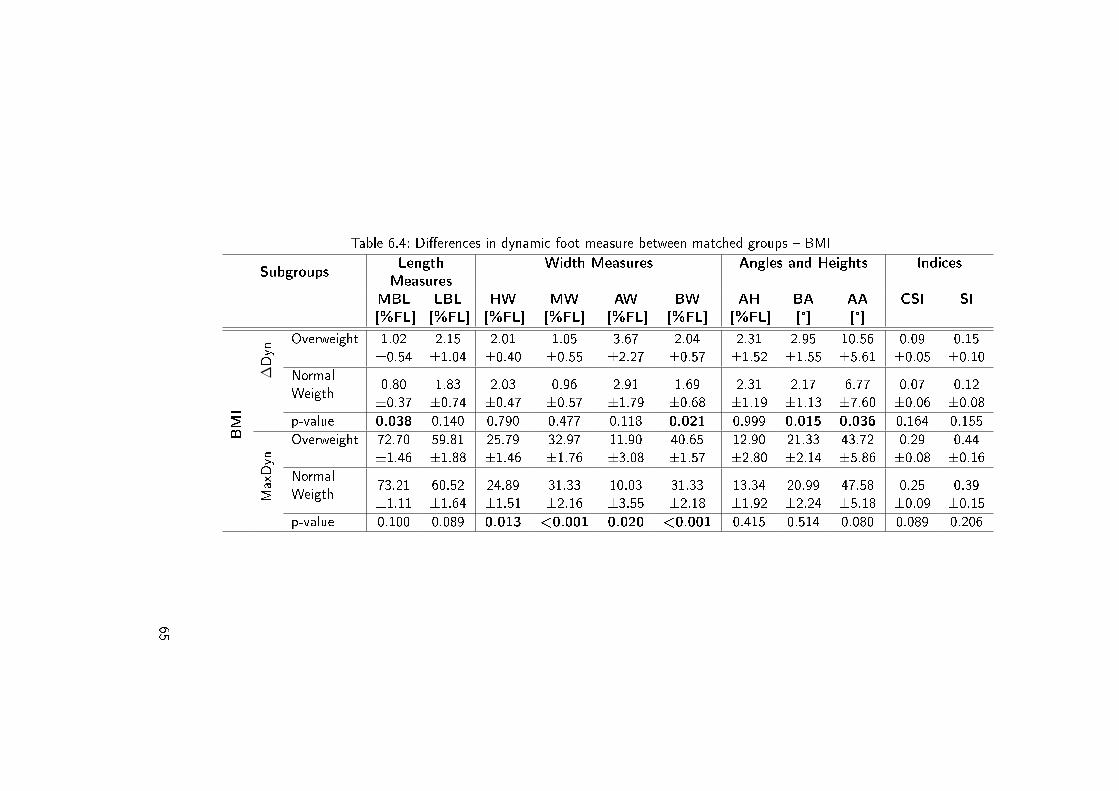
Table 6.4: Di�erences in dynamic foot measure between matched groups � BMI
SubgroupsLengthMeasures
Width Measures Angles and Heights Indices
MBL[%FL]
LBL[%FL]
HW[%FL]
MW[%FL]
AW[%FL]
BW[%FL]
AH[%FL]
BA[°]
AA[°]
CSI SI
BMI
∆Dyn
Overweight 1.02±0.54
2.15±1.04
2.01±0.40
1.05±0.55
3.67±2.27
2.04±0.57
2.31±1.52
2.95±1.55
10.56±5.61
0.09±0.05
0.15±0.10
NormalWeigth
0.80±0.37
1.83±0.74
2.03±0.47
0.96±0.57
2.91±1.79
1.69±0.68
2.31±1.19
2.17±1.13
6.77±7.60
0.07±0.06
0.12±0.08
p-value 0.038 0.140 0.790 0.477 0.118 0.021 0.999 0.015 0.036 0.164 0.155
MaxDyn
Overweight 72.70±1.46
59.81±1.88
25.79±1.46
32.97±1.76
11.90±3.08
40.65±1.57
12.90±2.80
21.33±2.14
43.72±5.86
0.29±0.08
0.44±0.16
NormalWeigth
73.21±1.11
60.52±1.64
24.89±1.51
31.33±2.16
10.03±3.55
31.33±2.18
13.34±1.92
20.99±2.24
47.58±5.18
0.25±0.09
0.39±0.15
p-value 0.100 0.089 0.013 <0.001 0.020 <0.001 0.415 0.514 0.080 0.089 0.206
65

6Anthrop
ometric
in�uences
ondynam
icfoot
shape
Table 6.5: Di�erences in dynamic foot measure between matched groups � Age
SubgroupsLengthMeasures
Width Measures Angles and Heights Indices
MBL[%FL]
LBL[%FL]
HW[%FL]
MW[%FL]
AW[%FL]
BW[%FL]
AH[%FL]
BA[°]
AA[°]
CSI SI
Age
∆Dyn
Older 0.93±0.48
2.15±0.78
1.93±0.41
1.10±0.56
3.08±1.98
1.89±0.73
2.13±1.03
2.79±1.28
6.30±3.98
0.07±0.06
0.12±0.09
Younger 0.78±0.50
1.82±0.66
1.99±0.36
1.06±0.52
3.32±1.83
1.92±0.67
2.07±1.20
2.03±1.11
7.01±5.39
0.08±0.05
0.14±0.07
p-value 0.282 0.108 0.596 0.810 0.671 0.878 0.872 0.030 0.601 0.790 0.533
MaxDyn
Older 72.88±1.08
60.24±1.49
26.09±1.32
32.64±1.61
11.40±2.55
40.35±1.89
13.37±2.02
20.91±2.15
48.57±4.47
0.28±0.08
0.41±0.15
Younger 72.86±1.21
60.65±1.97
24.89±1.18
31.91±1.93
10.51±3.29
39.52±1.83
13.06±1.97
20.16±2.11
47.85±3.18
0.27±0.08
0.43±0.13
p-value 0.964 0.412 0.002 0.161 0.296 0.124 0.608 0.274 0.623 0.691 0.610
66

6.3 Results
6.3.2 Predictors of dynamic foot shape and deformation
With creating regression models we could identify predicting variables of the responses
∆Dyn and MaxDyn for all foot measures. The explained variances in all regression models
calculated for ∆Dyn are very low. The highest value of variance R2 comprises 0.50 for AA.
This model includes the variables body weight and static values and shows statistically
signi�cant in�uences. For the other foot measures minor explainable variances from R2
of 0.15 to 0.05 are found. Body weight and static values have predicting in�uence in
multiple regression analysis for ∆Dyn of most foot measures and explain changes in HW.
Body weight explains changes in MW. Furthermore, body weight in combination with
body height explains changes in AH. The static values are also statistically signi�cant
predictors for ∆Dyn of MBL and, in combination with gender, of BW. In LBL body
height statistically signi�cantly predicts dynamic changes. ∆Dyn of AW and BA cannot
be predicted by chosen variables.
Explained variance in models calculated for the response MaxDyn are much higher
and range from R2 of 0.48 to 0.96. In all foot measures static values are statistically
signi�cant predictors of MaxDyn. Furthermore, in MBL, HW, BW, BA, and AA the
static values are the only predictor. Gender does additionally predict MaxDyn of AH and
LBL. In addition, the combination of static values, gender and body height can explain
the variance of MaxDyn of MW (R2 = 0.85) and AW (R2 = 0.90).
67
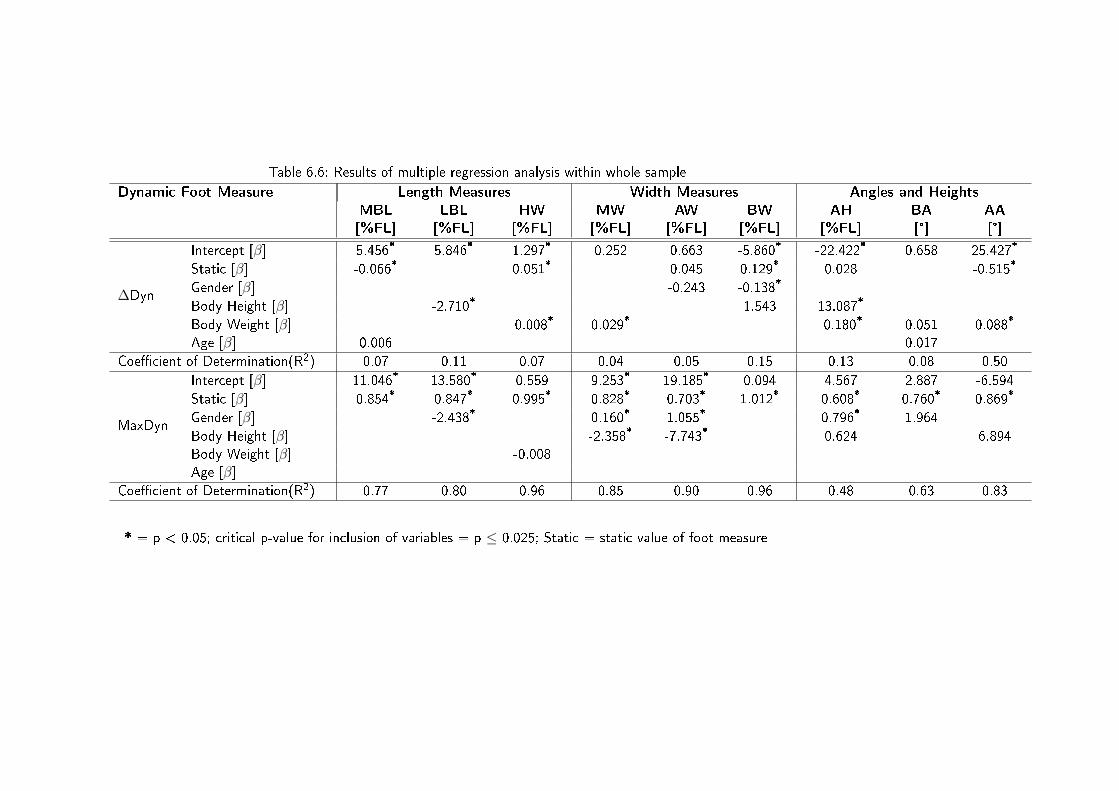
Table 6.6: Results of multiple regression analysis within whole sampleDynamic Foot Measure Length Measures Width Measures Angles and Heights
MBL[%FL]
LBL[%FL]
HW[%FL]
MW[%FL]
AW[%FL]
BW[%FL]
AH[%FL]
BA[°]
AA[°]
∆Dyn
Intercept [β] 5.456* 5.846* 1.297* 0.252 0.663 -5.860* -22.422* 0.658 25.427*
Static [β] -0.066* 0.051* 0.045 0.129* 0.028 -0.515*
Gender [β] -0.243 -0.138*
Body Height [β] -2.710* 1.543 13.087*
Body Weight [β] -0.008* 0.029* -0.180* 0.051 0.088*
Age [β] 0.006 0.017Coe�cient of Determination(R2) 0.07 0.11 0.07 0.04 0.05 0.15 0.13 0.08 0.50
MaxDyn
Intercept [β] 11.046* 13.580* 0.559 9.253* 19.185* 0.094 4.567 2.887 -6.594Static [β] 0.854* 0.847* 0.995* 0.828* 0.703* 1.012* 0.608* 0.760* 0.869*
Gender [β] -2.438* 0.160* 1.055* 0.796* 1.964Body Height [β] -2.358* -7.743* 0.624 6.894Body Weight [β] -0.008Age [β]
Coe�cient of Determination(R2) 0.77 0.80 0.96 0.85 0.90 0.96 0.48 0.63 0.83
* = p < 0.05; critical p-value for inclusion of variables = p ≤ 0.025; Static = static value of foot measure
6.4 Discussion
6.4 Discussion
6.4.1 In�uence of gender on dynamic foot shape
In the present study we identi�ed almost no gender-speci�c in�uences on dynamic foot
shape. For MaxDyn of all foot measures gender-speci�c in�uences are rather marginal.
This is con�rmed by the method of matched pairs and by multiple regression models in
the whole sample size. Foot measures were normalised to foot length, this can be one
reason for small di�erences. Regarding matched groups, women have a mean shoe size
of 40 and men 43. We can say that dynamic foot measures normalised to foot length
show no di�erences in dynamic foot measures between men and women. This is in line
with reports for static foot shape. In contrast, there are di�erences comparing feet of the
same foot length with regard to gender-speci�c in�uences. Women's and men's feet of
the same size have di�erent proportions of static foot shape (Krauss et al., 2008; Krauss
et al., 2010). If this holds for dynamic foot shape, additionally comparisons of the same
sizes as well as the same proportions are required. The results of multiple regression
models con�rm in�uences of gender. In the whole sample, gender can predict MaxDyn
of the foot measures LBL, MW, AW, and AH. We can state that measures characterising
longitudinal arch are a�ected by gender in dynamic situations.
There are gender-speci�c di�erences between ∆Dyn of AW and BW, compared in
matched groups. Therefore, women show higher dynamic deformation in width measures.
Also multiple regression models approve the in�uence of gender on ∆Dyn of BW. Overall,
the in�uences due to gender are marginal. We expected more pronounced gender-speci�c
di�erences in ∆Dyn, because literature shows higher laxity of ligaments and lower sti�ness
of longitudinal arch for women (Hennig and Milani, 1993; Krauss, 2006; Zifchock et al.,
2006). In summary, the variable gender has low in�uences on dynamic foot shape.
Predominantly, gender a�ects the dynamic characteristics of longitudinal arch which is
in agreement with previous assumptions.
6.4.2 In�uence of BMI on dynamic foot shape
A few studies pursued the identi�cation of in�uences on dynamic characteristics of gait for
overweight subjects. Until now only studies on ground reaction force, plantar pressure or
kinematic measures have been available (Hills et al., 2002; Wearing et al., 2006). Related
work points out relationships between obesity and the prevalence of �at foot deformities
69

6 Anthropometric in�uences on dynamic foot shape
(Van Boerum and Sangeorzan, 2003; Birtane and Tuna, 2004; Dowling et al., 2004).
There are di�erences in MaxDyn between normal weight and overweight subjects.
These �ndings show that maximum values of all foot width measures are exceeded in
overweight compared to normal weight subjects. Broader dynamic foot measures for
overweight subjects have not been reported before. For children static foot shape has been
examined before with regard to changes with increasing BMI, but more often body weight
was used as the predictor (Dowling et al., 2004; Mickle et al., 2004; Mickle et al., 2006a;
Mauch et al., 2008; Riddiford-Harland et al., 2011). We calculated regression models of
each foot measure for the whole sample size and found no statistically signi�cant input
of body weight for the explanation of variance. In contrast, body height is a statistically
signi�cant predictor of MaxDyn in MW and AW. Whereas, each static foot measure is a
statistically signi�cant predictor for MaxDyn of all foot measures.
The magnitude of dynamic deformation is also increased for overweight subjects. Dif-
ferences are found in ∆Dyn of MBL, BW, BA, and AA comparing groups of overweight
and normal weight subjects. The longitudinal arch of overweight subjects �attens more
and their BW broadens more during stance phase.
The relationship between ground reaction force and body weight is obvious, but plantar
pressure and body weight is linked marginally (Cavanagh et al., 1987; Hennig and Milani,
1993). The reason is the increased loading area for overweight subjects. Our results
con�rm the results of reported studies (Gravante et al., 2003; Hennig and Milani, 1993).
Examination of the whole sample by multiple regression analysis determined body
weight as a predictor for ∆Dyn of HW, MW, AH, and AA. Within the longitudinal arch,
dynamic changes are more pronounced whereas values of AH and HW decrease with
increasing weight. The smaller di�erences during stance phase can be explained by non-
linear deformation of the fat pad. More compression does not mean that the fat pad
deforms at a same level (Nass et al., 1999).
We can say that body weight and also BMI in�uence dynamic foot measures. It is not
visible if di�erences in ∆Dyn of foot measures between overweight and normal weight
subjects relate to reported di�erences in static foot morphology. These static di�erences
are obvious for children: feet of overweight children are more voluminous, more �at and
robust (Mickle et al., 2006b; Mauch et al., 2008). We also found more pronounced
changes of MBL and BW during stance phase in subjects with higher BMI levels. With
increasing body weight the changes in MW do also increase. One reason for this is the
70

6.4 Discussion
thicker fat pads in overweight subjects as Nass et al. detected (Nass et al., 1999).
6.4.3 In�uence of age on dynamic foot shape
Di�erences of dynamic foot morphology in older subjects have not been analysed before.
We found that MaxDyn of HW is higher in older subjects. In literature, �ndings regarding
age-related in�uences are controversial (Menz and Morris, 2006; Mickle et al., 2010).
Menz and Morris �nd only marginal in�uences of age. Their conclusion was that body
weight is a more important in�uencing factor (Menz and Morris, 2006). We con�rm
their results. Our analysis of the whole sample size shows that age has no predicting
contribution on the variance for MaxDyn of any foot measure.
Other studies assume that feet in elderly persons show less changes in dynamic sit-
uations because of their more pronounced sti�ness (Hsu et al., 1998; Wearing et al.,
2006). Our results do not con�rm this conclusion. We found no in�uence of age on
the magnitude of changes within the whole sample size. The only di�erence could be
found for ∆Dyn of BA, where older subjects showed higher values. The reason for these
marginal di�erences between the two age groups may be the comparatively low mean
age of 57.6 ±5.6 years in the group of older subjects. Age-related di�erences of foot
morphology are already reported at the age of 30 years and it is assumed that it is a
progressive development (Staheli et al., 1987). Therefore, the di�erences in dynamic foot
morphology should be more obvious with increasing age. However, this must be assessed
in future studies with subjects at older ages.
6.4.4 Conclusions
We found statistically signi�cant in�uences in dynamic situations within di�erent foot
measures. These di�erences are most obvious for the variable BMI as well as body
weight and in parts for the variable gender. The chosen statistics help to identify these
in�uences. Furthermore, these �ndings can help last designers and shoe manufacturers.
The maximum values during loaded situations of the roll-over process can be best pre-
dicted by static values. Therefore, customisation of footwear is still important and for
this reason static values can be consulted. In addition, adjustments to dynamic situations
must be carried out. The improvements for better-�tting shoes in dynamic situations can
be achieved by consideration of changes during stance phase (∆Dyn). These changes
depend on each foot measure and the main predictors for these changes are body weight
71

6 Anthropometric in�uences on dynamic foot shape
and body height as well as gender for BW. How these improvements can be realised is the
subject of future work, which has to consider the di�erences between static and dynamic
foot morphology.
References
Aiken, L.S., West, S.G., and Reno, R.R., 1991. Multiple regression: Testing and inter-
preting interactions. Newbury Park, CA: Sage.
Birtane, M. and Tuna, H., 2004. The evaluation of plantar pressure distribution in obese
and non-obese adults. Clinical Biomechanics, 19, 1055�1059.
Blanc, Y., et al., 1999. Temporal parameters and patterns of the foot roll over during
walking: normative data for healthy adults. Gait and Posture, 10, 97�108.
Carlsoo, S. and Wetzenstein, H., 1968. Change of form of the foot and the foot skeleton
upon momentary weight-bearing. Acta Orthopaedica Scandinavica, 39, 413�423.
Cavanagh, P.R., Rodgers, M.M., and Iiboshi, A., 1987. Pressure distribution under
symptom-free feet during barefoot standing. Foot and Ankle, 7, 262�276.
Coudert, T., et al., 2006. A method to obtain 3D foot shape deformation during the gait
cycle. Ninth International Symposium on the 3D Analysis of Human Movement,
28�30 June, Valencienne, France.
D'Aout, K., et al., 2009. The e�ect of habitual footwear use: foot shape and function
in native barefoot walkers. Footwear Science, 1, 81�94.
Dowling, A.M., Steele, J.R., and Baur, L.A., 2004. What are the e�ects of obesity in
children on plantar pressure distributions? International Journal of Obesity, 28,
1514�1519.
Frankowski, G., Chen, M., and Huth, T., 2000. Real-time 3D Shape Measurement with
Digital Stripe Projection by Texas Instruments Micromirror Devices DMD. San Jose
USA. Frey, C., 2000. Foot health and shoewear for women. Clinical Orthopaedics
and Related Research, 372, 32�44.
Gravante, G., et al., 2003. Comparison of ground reaction forces between obese and
control young adults during quiet standing on a baropodometric platform. Clinical
Biomechanics, 18, 780�782.
Hawes, M.R. and Sovak, D., 1994. Quantitative morphology of the human foot in a
North American population. Ergonomics, 37, 1213�1226.
72

6.4 Discussion
Hennig, E.M. and Milani, T.L., 1993. The tripod support of the foot. An analysis of pres-
sure distribution under static and dynamic loading. Zeitschrift feur Orthopeadie
und Ihre Grenzgebiete, 131, 279�284.
Hills, A.P., et al., 2002. The biomechanics of adiposity�structural and functional limita-
tions of obesity and implications for movement. Obesity Reviews, 3, 35�43.
Hsu, T.C., et al., 1998. Comparison of the mechanical properties of the heel pad between
young and elderly adults. Archives of Physical Medicine and Rehabilitation, 79,
1101�1104.
Janisse, D.J., 1992. The art and science of �tting shoes. Foot Ankle, 13, 257�262.
Kimura, M., Mochimaru, M., and Kanade, T., 2009. Measurement of 3D foot shape
deformation in motion. International Conference on Computer Graphics and Inter-
active Techniques. Proceedings of the 5th ACM/IEEE International Workshop on
Projector camera systems, New York, USA.
Kimura, M., Mochimaru, M., and Kanade, T., 2011. 3D measurement of feature cross-
sections of foot while walking. Machine Vision and Applications, 22, 377�388.
Kouchi, M., 1998. Foot dimensions and foot shape: di�erences due to growth, generation
and ethnic origin. Anthropol. Sci., 106, 161�188.
Kouchi, M., Kimura, M., and Mochimaru, M., 2009. Deformation of foot cross-section
shapes during walking. Gait and Posture, 20, 482�486.
Krauss, I., 2006. Frauenspezi�sche Laufschuhkonzeption. Eine Betrachtung aus klinis-
cher, biomechanischer und anthropometrischer Sicht [Conception of female-speci�c
running shoes. A consideration from a clinical, biomechanical, and anthropomet-
rical view]. Thesis (PhD) Eberhard-Karls-Universität at Tübingen.
Krauss, I., et al., 2008. Sex-related di�erences in foot shape. Ergonomics, 51, 1693�
1709.
Krauss, I., et al., 2010. Comparison of female foot morphology and last design in athletic
footwear -are men's lasts appropriate for women? Research in Sports Medicine,
18, 140�156.
Leardini, A., et al., 2005. Human movement analysis using stereophotogrammetry. Part
3. Soft tissue artifact assessment and compensation. Gait and Posture, 21, 212�
225.
Leardini, A., et al., 2007. A new anatomically based protocol for gait analysis in children.
Gait and Posture, 26, 560�571.
73

6 Anthropometric in�uences on dynamic foot shape
Lundgren, P., et al., 2008. Invasive in vivo measurement of rear-, mid-and forefoot
motion during walking. Gait and Posture, 28, 93�100.
Mauch, M., et al., 2008. Foot morphology of normal, underweight and overweight
children. International Journal of Obesity (London), 32, 1068�1075.
Menz, H.B. and Morris, M.E., 2006. Clinical determinants of plantar forces and pressures
during walking in older people. Gait and Posture, 24, 229�236.
Michel, F., et al., 2009. The functional sport shoe parameter �Torsion� within running
shoe research - a literature review. Sportverletz Sportschaden, 23, 197�205.
Mickle, K.J., et al., 2010. Foot shape of older people: implications for shoe design.
Footwear Science, 2, 131�139. Mickle, J., Steele, J., and Munro, B., 2004. Do
overweight and obesity a�ect dynamic plantar pressure distributions in preschool
children. Proceedings of the XX Congresso of ISB 29th Annual Meeting, 31 June�5
August, Cleveland, USA.
Mickle, K.J., Steele, J.R., and Munro, B.J., 2006a. Does excess mass a�ect plantar
pressure in young children? International Journal of Pediatric Obesity, 1, 183�188.
Mickle, K.J., Steele, J.R., and Munro, B.J., 2006b. The feet of overweight and obese
young children: are they �at or fat? Obesity (Silver Spring), 14, 1949�1953.
Morio, C., et al., 2009. The in�uence of footwear on foot motion during walking and
running. Journal of Biomechanics, 42, 2081�2088.
Nass, D., Hennig, EM., and van Treek, R., 1999. The thickness of the heel pad loaded by
body weight in obese and normal weight adults. In: Hennig, EM., Stephanyshin,
DJ. (eds). Proceedings of the 4th Symposium on Footwear Biomechanics, 1999.
Calgary, Canada.
Nester, C., et al., 2007. Foot kinematics during walking measured using bone and surface
mounted markers. Journal of Biomechanics, 40, 3412�3423.
Richter, M. and Schaefer, K., 2009. Der deutsche Fuÿreport. Teil II - Der Schuhbezug,
1�28. Report.
Riddiford-Harland, D.L., Steele, J.R., and Baur, L.A., 2011. Medial midfoot fat pad
thickness and plantar pressures: are these related in children? International Journal
of Pediatric Obesity, 6, 261�266.
Rossi, W. and Tennant, R., 1984. Professional shoe �tting. New York: Pedorthic
Footwear Association, National Shoe Retailers Association, 90�100.
Schmeltzpfenning, T., et al., 2009. Dynamic foot scanning: A new approach for mea-
74

6.4 Discussion
surement of the human foot shape while walking. Footwear Science, 1, 28�30.
Schmeltzpfenning, T., et al., 2010. Dynamic foot scanning. Prospects and limitations
of using synchronized 3D scanners to capture complete human foot shape while
walking. In: W. Karwowski and G. Salvendy, eds. 3rd International Conference on
Applied Human Factors and Ergonomics, 2010, Louisville, USA.
Staheli, L.T., Chew, D.E., and Corbett, M., 1987. The longitudinal arch. A survey of
eight hundred and eighty-two feet in normal children and adults. Journal of Bone
and Joint Surgery, American Volume, 69, 426�428.
Tsung, B.Y., et al., 2004. E�ectiveness of insoles on plantar pressure redistribution.
Journal of Rehabilitation Research and Development, 41, 767�774.
Tsung, B.Y.S., et al., 2003. Quantitative comparison of plantar foot shapes under dif-
ferent weight-bearing conditions. Journal of Rehabilitation Research and Develop-
ment, 40, 517� 526.
Van Boerum, D.H. and Sangeorzan, B.J., 2003. Biomechanics and pathophysiology of
�at foot. Foot and Ankle Clinics, 8, 419�430.
Wang, J., et al., 2006. Human foot reconstruction from multiple camera images with
foot shape database. IEICE Transactions on Information and Systems, E89-D,
1732�1742.
Wearing, S.C., et al., 2006. Musculoskeletal disorders associated with obesity: a biome-
chanical perspective. Obesity Reviews, 7, 239�250.
Witana, C.P., Feng, J., and Goonetilleke, R.S., 2004. Dimensional di�erences for evalu-
ating the quality of footwear �t. Ergonomics, 47, 1301�1317.
Wolf, S., et al., 2008. Foot motion in children shoes - A comparison of barefoot walking
with shod walking in conventional and �exible shoes. Gait and Posture, 27, 51�59.
Wunderlich, R.E. and Cavanagh, P.R., 2001. Gender di�erences in adult foot shape:
implications for shoe design. Medicine and Science in Sports and Exercise, 33,
605�611.
Xiong, S., et al., 2009. Foot deformations under di�erent load-bearing conditions and
their relationships to stature and body weight. Anthropol. Sci., 117, 77�88.
Zifchock, R.A., et al., 2006. The e�ect of gender, age, and lateral dominance on arch
height and arch sti�ness. Foot and Ankle International, 27, 367�372.
Zipfel, B. and Berger, L.R., 2007. Shod versus unshod: The emergence of forefoot
pathology in modern humans? The Foot, 17, 205�213.
75


Research Paper II
Di�erences between static and
dynamic foot morphology in
developing feet
Summary: The di�erences between static and dynamic foot morphology in developing
feet have not been evaluated before. The literature overview points out that relevant
di�erence can be expected. Furthermore, these di�erences are important to improve
the dynamic �t of footwear, which contributes to a physiological development of feet.
The following original article examines hypothesis 2, and beyond that, it focusses on the
relevance of these di�erences for footwear construction.
Published in: Ergonomics (in press)
77

7 Foot deformation during walking:
Di�erences between static and
dynamic 3D foot morphology in
developing feet
Bettina Barisch-Fritz1, Timo Schmeltzpfenning1, Clemens Plank1 and Stefan Grau2
1University of Tuebingen, Department of Sports Medicine, Hoppe-Seyler-Str. 6, Tuebin-
gen, 72076 Germany;2Department of Food and Nutrition, and Sports Science, University of Gothenburg,
Lroverksgatan 7, Box 300, SE 405 30, Gothenburg, Sweden
(Received April 6, 2013; accepted February 15, 2014)
Abstract
The complex functions of feet require a speci�c composition which is progressively
achieved by developmental processes. This development should take place without being
a�ected by footwear. The aim of this study is to evaluate di�erences between static and
dynamic foot morphology in developing feet. Feet of 2554 participants (6-16 years) were
recorded using a new scanner system (DynaScan4D). Each foot was recorded in static
half and full weight-bearing and during walking. Several foot measures corresponding
to those used in last construction were calculated. The di�erences were identi�ed by
one-way ANOVA and paired Student´s t-test. Static and dynamic values of each foot
measure must be considered to improve the �t of footwear. In particular footwear must
account for the increase of forefoot width and the decrease of midfoot girth. Further-
more, the toe box should have a more rounded shape. The �ndings are important for
the construction of footwear for developing feet.
79

7 Di�erences between static and dynamic 3D foot morphology in developing feet
Practitioner Summary
Until now, foot deformation has not been analysed in developing feet. The presented
di�erences between standing and walking of 2554 children were obtained using a new
dynamic 3D scanner system. The results show that especially di�erences between foot
width and girth measures and angles must be considered in footwear construction.
Keywords: children, anthropometry, health care ergonomics, industrial ergonomics, biome-
chanics
7.1 Introduction
The foot is a complex organ that has to ful�l three essential functions: First, it has to
carry body weight with appropriate stability. Thus it must be rigid. Second, the foot
must interact with all ground conditions. Therefore, it must be �exible. Third, the foot
has to support the balance between static and dynamic tasks during movement. This
means that it has to act as a spring to compensate in�uencing forces and as a lever to
support the movement of the body (Rodgers 1995). These complex functions require a
speci�c composition of the foot, which is progressively achieved by di�erent developmen-
tal processes. These processes start prenatally and continue until late adolescence (Maier
and Killmann 2003; Walther et al. 2005). Therefore, it is wrong to treat children's and
adults' feet equally. There are numerous di�erences comprising foot shape, proportion,
and size, as well as structural and functional characteristics (Maier and Killmann 2003).
The development of a foot includes ossi�cation of bones as well as a reduction of the
�exibility of tendons, ligaments, and joint capsules by increased inclusion of proteogly-
cans and crosslinks of collagens (Maier and Killmann 2003; Walther et al. 2005). Foot
development continues after the foot has reached its �nal length at the age of 12-13
years in girls and 13-15 years in boys (Cheng et al. 1997; Mauch 2007; Stavlas et al.
2005).
The well-regulated and coordinated developmental processes of the foot are open pro-
grams that are prone to be a�ected by negative external in�uences (DiMeglio 2001; Maier
and Killmann 2003). Shoes are one external in�uence which should not be negative. Var-
ious e�ects of shoes have been reported, ranging from di�erences during the roll-over
process between barefoot walking and walking with shoes and reduced �exibility of the
80

7.1 Introduction
foot up to serious deformities like hallux valgus, hammer toes, or �at feet (González et
al. 2005; Klein et al. 2009; Rao and Joseph 1992; Staheli 1991; Wolf et al. 2008b).
Staheli (1991) has concluded that the best guideline for children's shoes is the foot
without a shoe. Following this recommendation, several studies used anatomical foot
measures to improve last design (Krauss et al. 2008; Mauch et al. 2009). For example,
Mauch et al. (2009) developed a method to categorize children's feet to embrace their
natural variability. A comprehensive study by Cheng et al. (1997) compared the static
foot morphology of 2829 Chinese children in loaded and unloaded static situation. The
di�erences between unloaded and loaded foot length and width were 2.5-3.4 mm and
2.1-4.4 mm, respectively. However, there is still a lack of information about dynamic
changes during walking. These changes are essential for the construction of well-�tting
shoes and thus the physiological development of the foot.
Guidelines for footwear construction should also consider dynamic information about
the foot (Kouchi, Kimura and Mochimaru 2009; Mauch et al. 2009). In parts, this infor-
mation has been obtained by methods based on markers, goniometers, plantar pressure
analysis or interpretation of imprints (Alvarez et al. 2008; Bosch, Gress and Rosenbaum
2007; Hennig and Rosenbaum 1991; Maier and Killmann 2003). These methods bear
limitations in terms of the partial view on the foot morphology and therefore have limited
applicability.
Children´s three-dimensional (3D) foot deformation during natural walking has not
been evaluated before due to previous de�cits in scanner technology. Advancements
in 3D scanner systems allow recording the foot during walking (Coudert et al. 2006;
Kimura, Mochimaru and Kanade 2009; Schmeltzpfenning et al. 2009; Wang et al.
2006). Existing work only focusses on the feasibility of these systems as well as their
potentials and limitations. In order to evaluate the systems, small sample sizes have been
used (Kimura, Mochimaru and Kanade 2009; Wang et al. 2006). This is su�cient to
evaluate the system but not to obtain signi�cant results on foot changes. Furthermore,
no study has examined dynamic 3D foot deformation in children and adolescents.
The aim of the present study is to identify di�erences between loaded static and dy-
namic 3D foot morphology for the developing feet of children aged between 6 and 16
years. To achieve this aim, the feet of more than 2000 children and adolescents were
recorded and the results were evaluated with respect to their relevance for last construc-
tion. The relevance of the results was assessed by putting the increments of shoe grading
81

7 Di�erences between static and dynamic 3D foot morphology in developing feet
in contrast to the obtained foot measures. The error of the system was determined by
calculating the Root Mean Square Error (RMSE). These �ndings are important for last
construction and can help improve footwear �t for developing feet. Well-�tting shoes for
children and adolescents are important to ensure normal and physiological development
of feet, which is signi�cant for the whole body.
7.2 Methods
7.2.1 Participants
This study was approved by the ethics committee of the medical clinic of Tübingen. Data
acquisition took place in the southern part of Germany, between April 2010 and December
2011, with collaboration of 15 di�erent schools. Parents and children received written
information about the aim and content of the study prior to data acquisition. All children
and adolescents in this experiment voluntarily participated and had written consent of
one parent. Exclusion criteria comprised injuries or diseases of the lower extremities that
in�uence normal gait. The foot measures of 1285 female and 1269 male children and
adolescents (51% female; 49% male), aged between 6 and 16 years with an average
age of 10.6 ± 2.5 years, were analysed. The data from both genders were merged as
there is no in�uence of gender on the foot deformation of developing feet (Barisch-Fritz
et al., 2013). This is in contrast to the in�uence of gender on the plantar pressure
distribution (Chung and Wang, 2012) and the static foot shape (Hong et al., 2013). The
secondary measurements, body weight and body height, were carried out without shoes
in lightweight clothing. Body mass index was calculated (weight [kg]/height [m2]) and
normalized to German reference data (Kromeyer-Hauschild et al. 2001) to attain gender
and age-speci�c BMI percentiles. The mean percentile of the entire sample was 52.2 ±
29.0 (see Table 7.1).
One foot per participant was captured and analysed using DynaScan4D. In previous
studies, no statistically signi�cant or practically relevant di�erences between the data
of right and left feet have been found. Thus, the foot to be measured was randomly
determined as recommended by Menz (2004). Foot morphology was captured in static
and dynamic situations. Each participant conducted one static trial with full weight-
bearing (FBW) and one with half weight-bearing (HWB). For FWB, participants had
to stand on the de�ned foot and had to look straight ahead. To ensure static stance,
82

7.2 Methods
Table 7.1: Characteristics of the participants. Mean and standard deviation of anthropo-metric variables for the whole sample as well as di�erent age groups.s
Age N Gender BodyHeight
BodyWeight
BMI-Percentile
ShoeSize
FootLength
[years] [m] [kg] [FrenchScale]
[mm]
6 � 7 343 F: 156M: 187
1.23±0.06
24.4±4.7
52.0±27.3
32 ± 2 197.7±11.9
8 � 10 920 F: 468M: 452
1.36±0.08
31.9±7.1
52.5±28.6
35 ± 2 217.1±17.1
11 - 13 943 F: 480M: 463
1.53±0.09
44.2±11.3
51.8±30.1
39 ± 2 240.9±17.5
14 - 16 348 F: 181M: 167
1.66±0.09
57.3±12.5
53.0±28.7
41 ± 3 254.9±16.9
6 -16 2554 F: 1285M: 1269
1.45±0.16
38.9±13.9
52.2±29.0
37 ± 4 228.3±24.6
F = female; M = male
subjects were allowed to grip the handrails of the scanner walkway without shoring up
while lifting the other foot backwards. The HWB condition was achieved by asking
the participants to stand on both feet. The children and adolescents had to �ex and
subsequently extend their knees to ensure equally distributed weight on both feet.
Dynamic foot morphology was recorded during natural barefoot walking. The partici-
pants were asked to walk over a 4.6 m long walkway with the mounted scanner system.
They had time to get used to the scanner setup and to the walking task by completing
several training walks. During the training walks, the starting point was varied until the
children were able to tread centrally on the measuring �eld. Walking speed was prede�ned
and monitored. The reason for prede�ning walking speed is to consider the e�ects of
factors such as body height and age as well as contact time and functionality (Sutherland
1997; Wheelwright et al. 1993). Furthermore, it could minimize the step-to-step vari-
ability. In reference to the indicated comfortable walking speed of adults normalised to
body height (Bohannon 1997), we developed a scale for children. The foundation of the
presented ranges of the walking speed (see Table 7.2) was the index of 0.78 (comfortable
walking speed normalised to body height) according to Bohannon (1997). Three valid
trials were recorded per participant.
83

7 Di�erences between static and dynamic 3D foot morphology in developing feet
Table 7.2: Walking speed adjusted to body heightBody Height Walking Speed
[cm] [m/s]
< 110.0 0.78 � 0.86110.0 � 119.9 0.83 � 0.94120.0 � 129.9 0.92 � 1.03130.0 � 139.9 1.00 � 1.11140.0 � 140.9 1.06 � 1.17150.0 � 159.9 1.14 � 1.25160.0 � 169.9 1.22 � 1.33170.0 � 179.9 1.28 � 1.42
≥ 180.0 1.36 � 1.50
The �nal sample sizes ranged from 2017 to 2047 participants, depending on each foot
measure. Reasons for excluding participants were insu�cient quality of scan data due to
challenges in the alignment of the shutter time as well as technical problems during saving
processes and trigger functions. Other problems were caused by the high sensitivity of
the scanner system to ambient light or de�cits in adjusting to darker or unsteady coloured
skin types. The HWB and FWB scans of each participant were matched to the mean of
the three dynamic trials. Missing trials were the reason for further dropouts.
7.2.2 Measurement system and data processing
The scanner system, DynaScan4D, was used within this study to capture images of the
foot during standing and natural walking. This scanner system has been developed at
the University of Tübingen (Schmeltzpfenning et al. 2009). It is based on the principle of
full-�eld triangulation by structured light projection with �ve scanner units (zSnapper®,
ViALUX GmbH, Germany). The DynaScan4D has a measurement frequency of 46 Hz
and a resolution of 640 x 480. Reducing resolution to a 4x4 binning mode allows the
high frequency. The measurement volume is about 55 cm length, 35 cm width, and 25
cm height. The �ve scanner units are calibrated to each other to guarantee that the
captured images of each unit can be merged in a single coordinate system. The accuracy
of the system comprises 0.23 mm in static full resolution and 0.89 mm in dynamic 4x4
binning mode with a velocity of 0.8 m/s. This has been evaluated by recording a bowling
84

7.2 Methods
ball (circumference 32.25 mm) in static and dynamic situations. For more details on the
hardware of the scanner system, it is referred to Schmeltzpfenning et al. (2009; 2010).
A strain gauge was used to trigger the recording of the roll-over process and light
detectors to measure the walking speed of the participants. The room with the scan-
ner system was darkened and synthetic light was used to produce constant illumination
conditions.
The DynaScan4D is operated using a self-developed software program which automates
the scanning process and the post-processing of the recorded data. The latter includes
the alignment of the foot scans to the x-axis, which is the connecting line between the
most medial point of the heel and of the �rst metatarsal head (MTH 1). In collaboration
with last designers, typical measures that are used in last construction were identi�ed
(Mitchell et al. 1995). The identi�ed girth measures in this study comply with those
taken on lasts. The location of each girth measure depends on the shoe size and was
de�ned according to a last marking device (Behrens, Alfeld, Germany). This device
provides the distance relative to the heel where the girth has to be measured for each
shoe size. With these measures, the transfer from research to implementation could be
simpli�ed. The foot measures are de�ned in Figure 7.1 and Table 7.3. All foot measures
were calculated for each static scan as well as for each frame of dynamic scans.
85

7 Di�erences between static and dynamic 3D foot morphology in developing feet
Figure 7.1: Illustration of analysed foot measures (see Table 7.3 for the descriptions ofthe foot measures)
86

Table 7.3: Analysed foot measuresFoot Measures Description Measurement
Phase
FootHeight
I-H Instep Height Highest point of the foot at 50 % of foot length. MTH1 Strike� Heel O�B-H Ball Height Highest point of the foot at 61.8 % (a.k.a. golden ratio) of foot length.
FootLength
F-L Foot LengthDistance between most posterior point of the heel and foremost point of the longesttoe parallel to the x-axis.
Toes Strike-Heel O�
M-BL Medial Ball LengthDistance between most posterior point of the heel and most medial point of MTH1parallel to the x-axis.
MTH1 Strike� Heel O�
LB-L Lateral Ball LengthDistance between most posterior point of the heel and most lateral point of MTH5parallel to the x-axis.
FootWidth
AB-W Anatomical Ball Width Distance between most medial point of MTH1 and most lateral point of MTH5. MTH1 Strike� Heel O�
OB-W Orthogonal Ball WidthDistance between most lateral and medial point of the forefoot measured orthogo-nally to the x-axis.
OH-W Orthogonal HeelWidth
Distance between most lateral and medial point of the heel measured orthogonallyto the x-axis between 14-20 % of foot length.
Heel Strike �Heel O�
FootGirth
AB-G Anatomical Ball GirthGirth around the anatomical landmarks MTH 1 and MTH5 (vertical to the standingsurface).
MTH1 Strike� Heel O�LB-G Last Ball Girth
Girth around the �rst point detected on the last at an angle of 22° relative to thevertical (perpendicular to the x-axis).
LW-G Last Waist GirthGirth around the second point detected on the last at an angle of 22° relative to thevertical (perpendicular to the x-axis).
LI-G Last Instep GirthGirth around the third point detected on the last at an angle of 22° relative to thevertical (perpendicular to the x-axis).
Anglesof theFoot
B-A Ball Angle Angle between the connecting line of MTH1 and MTH5 and the x-axis.MTH1 Strike� Heel O�T1-A Toe1 Angle
Angle between the x-axis and the connecting line of most medial points of Toe 1and MTH 1.
T5-A Toe5 AngleAngle between the connecting line of most lateral points of the heel and MTH 5and the connecting line of most lateral points of Toe 5 and MTH 5.
Foot measures are illustrated in Figure 7.1.

7 Di�erences between static and dynamic 3D foot morphology in developing feet
As a result of the markerless scanning, the anatomical landmarks of �rst (MTH1)
and �fth metatarsal heads (MTH5) were visually detected as the most medial or lateral
points judging from the x-axis. All landmarks were determined by one operator, similar
to Yamazaki et al. (2013) who de�ned anatomical landmarks on their dynamic model.
The visual detection of anatomical landmarks entails some bias, but eliminates the dis-
advantage of moving soft tissue. The resulting error was calculated in this study design
and used for discussing the relevance of the results.
The maximum of each foot measure is called MaxDyn. To realize the comparability
of MaxDyn values, it was necessary to extract MaxDyn for each foot measure within a
speci�ed measurement phase. Furthermore, MaxDyn of each foot measure is relevant
within a speci�c measurement phase. A measurement phase is relevant when most
load is expected due to shifting body weight over the respective foot area (Gefen et al.
2000).The measurement phases were de�ned by characteristic instants according to Blanc
et al. (1999). These characteristic instants were visually detected for each sequence of
frames of the roll-over process (see Figure 7.2). Heel strike was de�ned as the instant
when 70% of the heel surface had contact with the ground (Heel Strike). This threshold
was visually detected from a plantar perspective. The same was de�ned for the contact
of the MTHs (MTH1 Strike).This instant was standardized as the contact of MTH1 and
MTH5 with the ground. Additionally, the instant when the toes hit the ground (Toes
Strike) was determined. The instants of the take-o� of the heel (Heel O�) and the MTHs
(MTH1 O�) were de�ned as the instants where the heel and the MTHs were no longer
in contact with the ground. Table 7.3 presents the measurement phase for each foot
measure.
7.2.3 Statistical analysis
All foot measures were tested for normality by the Shapiro-Wilk Test (Shapiro and Wilk
1965). Foot length, width, height, and girth measures were normalised to the respec-
tive foot length (F-L). To test the di�erences between loaded static and dynamic foot
measures, a one-way ANOVA with paired Students' t-test was calculated. The level of
signi�cance was adjusted by Bonferroni correction (Bland and Altman 1995). As no
relevant in�uence of gender, age, or body mass on the di�erences between static and
dynamic foot morphology was found (Barisch-Fritz et al., 2013), the results of the foot
measures normalized to F-L were merged.
88

7.2 Methods
Figure 7.2: Sequence of 30 frames of a standard dynamic foot scan
89

7 Di�erences between static and dynamic 3D foot morphology in developing feet
The repeatability of the procedure to calculate the foot measures was analysed to de-
termine the error. This was in particular important for foot measures dependent on the
visually detected landmarks MTH1 and MTH5. The visual detection of the anatomical
landmarks and the calculation of the foot measures were conducted twice within a smaller
sample of n=33 participants. Intra-tester reproducibility was calculated by intraclass cor-
relation coe�cient (ICC) as well as root mean squared error (RMSE) (Perini et al. 2005;
Shrout and Fleiss 1979). The RMSE, also known as technical error of measurement, is
a statistical indicator for the variance caused by error (Perini et al. 2005). It allows to
better estimate the relevant di�erences compared to ICC because of the representation
of absolute values in the same measurement unit. The statistical analyses were per-
formed using JMP version 9.0.2 (SAS, Cary, USA) as well as SPSS version 20 (SPSS
Inc. Chicago, IL, USA).
7.3 Results
7.3.1 Di�erences between static and dynamic foot measures
Table 7.4 presents mean values and standard deviations of absolute and relative foot mea-
sures and also F-ratios and p-values of each foot measure obtained by one-way ANOVA.
The di�erences between the three situations HWB, FWB, and MaxDyn of absolute and
relative foot measures indicated statistically signi�cant di�erences, except for absolute
F-L.
90

Table 7.4: Absolute and relative foot measures. The results of one-way ANOVA with comparison of HWB, FWB, andMaxDyn by paired Student´s t-test
Absolute Foot
Measure
N HWB FWB MaxDyn One-way ANOVA
Mean ± SD Mean ± SD Mean ± SD F-Ratio DF p-value
I-H [mm] 2032 55.9 ± 6.2 56.1 ± 6.1 59.8 ± 6.9 220.8 2 <0.001
B-H [mm] 2056 44.1 ± 4.6 44.2 ± 4.6 45.6 ± 4.9 65.5 2 <0.001
F-L [mm] 1655 227.2 ± 21.9 227.1 ± 22.0 226.1 ± 22.1 1.3 2 0.272MB-L [mm] 2036 165.2 ± 16.1 165.0 ± 16.0 166.6 ± 16.2 6.0 2 0.002
LB-L [mm] 2017 139.2 ± 13.0 138.5 ± 13.1 140.4 ± 13.1 10.6 2 <0.001
AB-W [mm] 2047 88.7 ± 8.8 89.3 ± 8.8 90.1 ± 8.9 11.9 2 <0.001
OB-W [mm] 2047 85.8 ± 7.9 86.3 ± 7.9 87.7 ± 8.0 30.3 2 <0.001
OH-W [mm] 2047 59.6 ± 5.7 59.5 ± 5.8 60.0 ± 6.2 4.7 2 0.010
AB-G [mm] 2034 215.3 ± 20.6 216.3 ± 20.7 212.8 ± 20.8 14.7 2 <0.001
LB-G [mm] 2032 206.4 ± 18.6 207.7 ± 18.7 202.3 ± 19.1 45.5 2 <0.001
LW-G [mm] 2032 207.4 ± 19.4 208.1 ± 19.3 203.5 ± 19.6 32.5 2 <0.001
LI-G [mm] 2031 214.8 ± 20.4 215.0 ± 20.4 211.4 ± 20.4 19.9 2 <0.001
B-A [°] 2033 73.1 ±3.1 72.7 ± 3.0 74.6 ± 3.3 189.7 2 <0.001
T1-A [°] 2051 3.9 ± 4.9 3.6 ± 4.9 7.5 ± 5.0 506.0 2 <0.001
T5-A [°] 2051 9.6 ± 4.8 10.0 ± 4.7 11.6 ± 4.9 130.7 2 <0.001
Relative Foot
Measure
N HWB FWB MaxDyn One-way ANOVA
Mean ± SD Mean ± SD Mean ± SD F-Ratio DF p-value
I-H [% F-L] 2032 24.6 ± 1.8 24.8 ± 1.8 26.4 ± 2.5 424.8 2 <0.001
B-H [% F-L] 2056 19.5 ± 1.4 19.6 ± 1.4 20.1 ± 1.5 132.3 2 <0.001
MB-L [% F-L] 2036 72.7 ± 1.4 72.7 ± 1.4 73.3 ± 1.5 144.6 2 <0.001
LB-L [% F-L] 2017 61.4 ± 2.1 61.1 ± 2.2 62.0 ± 2.2 79.8 2 <0.001
AB-W [% F-L] 2047 39.1 ± 2.0 37.4 ± 2.0 39.7 ± 2.1 44.7 2 <0.001
OB-W [% F-L] 2047 37.9 ± 1.9 38.1 ± 2.0 38.7 ± 2.1 96.8 2 <0.001
OH-W [% F-L] 2047 26.4 ± 1.8 26.3 ± 1.8 26.5 ± 1.9 8.6 2 <0.001
AB-G [% F-L] 2034 95.0 ± 4.5 95.4 ± 4.5 93.9 ± 4.7 59.0 2 <0.001
LB-G [% F-L] 2032 91.2 ± 4.4 91.8 ± 4.4 89.3 ± 4.6 159.5 2 <0.001
LW-G [% F-L] 2032 91.7 ± 4.7 92.0 ± 4.7 89.9 ± 4.9 105.5 2 <0.001
LI-G [% F-L] 2031 94.9 ± 4.5 95.0 ± 4.5 93.4 ± 4.8 76.4 2 <0.001
Abbreviations of foot measures see Table 7.1 and Table 7.3: HWB = half weight-bearing; FWB = full weight-bearing; MaxDyn =maximum during walking; SD = standard deviation; DF = degrees of freedom; p-value = result of paired Students' t-test

7 Di�erences between static and dynamic 3D foot morphology in developing feet
The mean di�erences and con�dence intervals (CI) with Bonferroni correction for the
relative foot length, width, height, and girth measures and the absolute foot angles are
presented in Table 5. The di�erences between the two static situations HWB and FWB
were statistically signi�cant for instep height (I-H), lateral ball length (LB-L), anatomical
ball width (AB-W), orthogonal ball width (OB-W), anatomical ball girth (AB-G), last
ball girth (LB-G), ball angle (B-A), and toe 5 angle (T5-A). The mean di�erences for the
relative foot measures ranged from 0.2 to 0.6 % of F-L. A negative signi�cant di�erence
of -0.3 % of F-L was found for LB-L. The di�erence between HWB and FWB of ball
height (B-H), medial ball length (MB-L), orthogonal heel width (OH-W), last waist girth
(LW-G), last instep girth (LI-G), and toe 1 angle (T1-A) were not statistically signi�cant.
The di�erences between MaxDyn and HWB, and MaxDyn and FWB of all relative foot
measures and all absolute foot angles were statistically signi�cant. The di�erences for
length, width, and height measures between MaxDyn and HWB were positively ranging
from 0.2 to 1.7 % of F-L. Smallest mean di�erences were found for OH-W (0.2% FL),
followed by LB-L (0.5% FL), AB-W (0.6% FL), MB-L (0.7% FL), B-H (0.7% FL) and
OB-W (0.8% FL). The highest mean di�erence was found for I-H (1.7% FL). The mean
di�erences of foot girth measures featured negative values of -1.9% (LB-G), -1.7% (LW-
G), -1.5% (LI-G), and -1.1 % of F-L (AB-G).
The di�erences between MaxDyn and FWB were similar to the di�erences between
MaxDyn and HWB. Mean di�erences of foot length, width, and height measures were
positively ranging from 0.2 to 1.6 % of F-L. The smallest mean di�erence was also
found for OH-W and the highest for I-H. Negative di�erences, in the same order of the
di�erences between MaxDyn and HWB, were found for all foot girth measures ranging
from -2.4 to -1.5 % of F-L.
The di�erences for absolute T1-A and T5-A were 3.9° and 2.2° for MaxDyn-HWB,
and 4.2° and 1.8° for MaxDyn-FWB, respectively. The di�erences in B-A were 1.5° for
MaxDyn-HWB and 1.8° for MaxDyn-FWB.
92

Table 7.5: Di�erences of relative foot measures between the three situations HWB, FWB, and MaxDyn analysed by one-wayANOVA
Foot Measure NFWB-HWB MaxDyn-HWB MaxDyn-FWB
MeanDi�erence
CI p-value MeanDi�erence
CI p-value MeanDi�erence
CI p-value
I-H [% F-L] 2032 0.2 0 0.3 0.006 1.7 1.6 1.9 <0.001 1.6 1.4 1.7 <0.001B-H [% F-L] 2056 0.1 0 0.2 0.075 0.7 0.6 0.8 <0.001 0.6 0.5 0.7 <0.001MB-L [% F-L] 2036 -0.1 -0.2 0.1 0.298 0.7 0.6 0.8 <0.001 0.7 0.6 0.8 <0.001LB-L [% F-L] 2017 -0.3 -0.5 -0.2 <0.001 0.5 0.4 0.7 <0.001 0.8 0.7 1.0 <0.001AB-W [% F-L] 2047 0.3 0.1 0.4 <0.001 0.6 0.5 0.8 <0.001 0.3 0.2 0.5 <0.001OB-W [% F-L] 2047 0.2 0.1 0.4 <0.001 0.8 0.7 1.0 <0.001 0.6 0.5 0.8 <0.001OH-W [% F-L] 2047 -0.1 -0.2 0.1 0.262 0.2 0 0.3 0.004 0.2 0.1 0.4 <0.001AB-G [% F-L] 2034 0.4 0.1 0.8 0.005 -1.1 -1.4 0.8 <0.001 -1.5 -1.9 -1.2 <0.001LB-G [% F-L] 2032 0.6 0.2 0.9 <0.001 -1.9 -2.2 -1.5 <0.001 -2.4 -2.8 -2.1 <0.001LW-G [% F-L] 2032 0.3 -0.1 0.7 0.050 -1.7 -2.1 -1.4 <0.001 -2.0 -2.4 -1.7 <0.001LI-G [% F-L] 2031 0.1 -0.3 0.5 0.476 -1.5 -1.9 -1.2 <0.001 -1.6 -2.0 -1.3 <0.001B-A [°] 2033 -0.3 -0. -0.1 0.001 1.5 1.3 1.7 <0.001 1.8 1.6 2.1 <0.001T1-A [°] 2051 -0.3 -0.7 -0.1 0.046 3.9 3.6 4.3 <0.001 4.2 3.9 4.6 <0.001T5-A [°] 2051 0.4 0.1 0.8 0.006 2.2 1.9 2.6 <0.001 1.8 1.5 2.2 <0.001
Abbreviations of foot measures see Figure 7.1 and Table 7.3: HWB = half weight-bearing; FWB = full weight-bearing;MaxDyn = maximum during walking; CI = con�dence interval with Bonferroni correction; p-value = result of pairedStudents' t-test

7 Di�erences between static and dynamic 3D foot morphology in developing feet
7.3.2 Repeatability of measurements
The repeatability of all foot measures is shown in Table 7.6. The ICC values of all
automatically analysed foot measures were close to one. There were no di�erences
between values of ICC analysed in static or dynamic situations. The ICC values of all
foot measures depending on the anatomical landmarks MTH1 and MTH5 (MB-L, LB-L,
AB-W, AG-W, B-A, T1-A, T5-A) deviated from one. Smallest values were found for B-A
in FWB 0.710 with a 95 % con�dence interval of 0.484-0.847.
Values of RMSE were close to zero for all measures not depending on manually detected
MTH1 and MTH5. Measures based on the anatomical landmarks showed RMSE values
deviant from zero. Values of MB-L ranged from 1.8 mm (FWB) to 2.3 mm (MaxDyn),
and for LB-L from 1.9 mm (MaxDyn) to 2.4 mm in (FWB). RMSE values of the angles
B-A, T1-A, and T5-A ranged from 0.4° (T1-A, HWB) to 2.4° (T1-A, MaxDyn).
94

Table 7.6: Intra-tester reliability of the calculation of the foot measures (including measures based on the visually detectedanatomical landmarks MTH1 and MTH5). Supplemented by the absolute di�erences between MaxDyn and staticHWB and the half increments based on shoe grading (French Scale).
FootMea-sure
HWB FWB MaxDyn [mean of 3 trials] MaxDyn -HWB
Halfincrement
N ICC 95 % CI RMSE N ICC 95 % CI RMSE N ICC 95 % CI RMSE Mean ± SD French Scale
I-H 32 1 1 1 0 mm 32 1 1 1 0 mm 26 0.999 0.998 1 0.4 mm 3.9 ± 3.4 mmB-H 32 1 1 1 0 mm 32 1 1 1 0 mm 26 0.998 0.996 0.999 0.3 mm 1.6 ± 1.6 mmF-L 32 1 1 1 0 mm 32 1 1 1 0 mm 22 1 1 1 0.1 mm -1.1 ± 2.0 mm 3.33 mmMB-L 32 0.978 0.956 0.989 2.3 mm 32 0.995 0.990 0.998 1.8 mm 26 0.992 0.983 0.997 2.3 mm 1.5 ± 3.4 mmLB-L 32 0.979 0.957 0.990 2.0 mm 32 0.955 0.911 0.978 2.4 mm 26 0.993 0.984 0.997 1.9 mm 1.2 ± 4.2 mmAB-W 32 0.996 0.991 0.998 0.6 mm 32 0.989 0.978 0.995 0.9 mm 26 0.996 0.991 0.998 0.9 mm 1.3 ± 2.0 mmOB-W 32 1 1 1 0 mm 32 1 1 1 0 mm 26 1 1 1 0.1 mm 1.9 ± 1.9 mm 1.00 mmOH-W 32 1 1 1 0 mm 32 1 1 1 0 mm 26 1 1 1 0.1 mm 0.4 ± 2.5 mmAB-G 32 0.997 0.994 0.999 1.1 mm 32 0.994 0.988 0.997 1.6 mm 26 0.997 0.983 0.999 1.2 mm -2.5 ± 4.5 mm 2.50 mmLB-G 32 1 1 1 0 mm 32 1 1 1 0 mm 26 1 1 1 0.4 mm -4.2 ± 3.7 mmLW-G 32 1 1 1 0 mm 32 1 1 1 0 mm 26 1 1 1 0.3 mm -3.9 ± 3.7 mmLI-G 32 1 1 1 0 mm 32 1 1 1 0 mm 26 1 1 1 0.2 mm -3.4 ± 4.2 mmB-A 32 0.837 0.695 0.916 1.7° 32 0.710 0.484 0.847 2.0° 26 0.814 0.586 0.917 1.9° 1.5 ± 3.0°T1-A 32 0.992 0.983 0.996 0.4° 32 0.956 0.912 0.978 1.0° 26 0.874 0.720 0.944 2.4° 3.9 ± 3.9°T5-A 32 0.987 0.974 0.994 0.5° 32 0.959 0.918 0.980 0.9° 26 0.965 0.923 0.984 1.1° 2.2 ± 3.4°
Abbreviations of foot measures see Figure 7.1 and Table 7.3; HWB = half weight-bearing; FWB = full weight-bearing; MaxDyn = maximumduring walking; ICC = intraclass correlation coe�cient; CI = 95 % con�dence interval; RMSE = Root Means Square Error; SD = standarddeviation; MaxDyn-HWB (mean and SD) is given for the whole group and can serve as a reference point to discuss the practical relevance.

7 Di�erences between static and dynamic 3D foot morphology in developing feet
7.4 Discussion
7.4.1 Static and dynamic di�erences
The aim of the present study was to identify di�erences between loaded static and
dynamic foot morphology. The foot morphology, which was calculated for the three
situations HWB, FWB and MaxDyn, was studied for a large sample size of developing
feet. Results of one-way ANOVA showed that the di�erences between the three situations
were statistically signi�cant for all foot measures except for F-L. Regarding the comparison
between static HWB as well as FWB and MaxDyn, it can be concluded that there are
signi�cant di�erences between static and dynamic foot morphology.
The practical relevance of the calculated di�erences was evaluated with respect to two
main concerns. First, the increment from one shoe size to the next was put in relation to
the di�erences between static and dynamic foot measures. The increment for shoe length
comprises 6.66 mm of French Scale (Rossi and Tennant 2011). The di�erence of a half
shoe size (3.33 mm of French Scale) is regarded as relevant di�erence for foot length
measures. Relevant di�erence means that if the di�erences between static and dynamic
situations of foot length measures exceed this value, the di�erence must be considered
in footwear construction. From one shoe size to the next, the increment of the girth of
a last is arithmetically graded by 5 mm in the French Scale (Joneja and Kit 2013). The
relation of LB-G and OB-W is often speci�ed as 60:40 (Maier and Killmann 2003). The
same principle, that half of the increment is relevant, is applied to foot girth and width
measures. Thus, a di�erence of 2.5 mm for girth measures and 1.0 mm for ball width is
practically relevant (see Table 7.6).
Second, the relevance of the detected di�erences depends on the repeatability of the
calculated foot measures (see Table 7.6). In this context, the RMSE of MaxDyn of
the foot measures is important. It re�ects errors due to visually detected landmarks.
The di�erences between MaxDyn and HWB are considered as practically relevant if they
exceed the values of RMSE of the foot measure.
In the present study, the di�erences between HWB and FWB were rather small for all
foot measures. Furthermore, these di�erences were smaller than the values regarded as
practically relevant. In the case of LB-G, the mean di�erence between HWB and FWB
was 0.6 % of F-L. For a foot length of 225 mm the di�erence is 1.4 mm. According to
the �rst concern, this di�erence is not practically relevant. This also holds for the other
96

7.4 Discussion
foot measures (see Table 7.5 and Table 7.6).
All di�erences between MaxDyn and HWB, as well as FWB were statistically signi�cant.
The di�erences of F-L are demonstrated by MB-L and LB-L. MB-L is representative for
the extension of the foot, as no extension from metatarsals ahead is expected (Cashmere,
Smith and Hunt 1999; Schmeltzpfenning et al. 2009). The mean values of the di�erences
between MaxDyn and HWB of MB-L and LB-L were smaller than the RMSE which means
that the practical relevance is limited and must be carefully discussed. However, there is
a tendency that MaxDyn of MB-L and LB-L exceed static loaded values. Based on the
structural characteristics of the medial longitudinal arch, an extension of the foot was
expected. The results showed this medial extension, as it has been reported before, from
early stance phase to foot �at (Scott and Winter 1993). To the best of our knowledge,
it has not been reported that LB-L increases during stance phase in a similar manner like
MB-L. This result con�rms the results of bone pin analyses, where considerable capacity
for motion of the lateral arch has been found (Lundgren et al. 2008). At the same time,
high standard deviations in both measures indicate strong individual variability. This is
possibly caused by high individuality of gait and overall low reproducibility of children´s
gait (Hausdor� et al. 1999). This may also interact with the weaker repeatability of this
foot measure due to the dependency on visually detected landmarks.
The extension of the foot during walking was expected and has already been considered
in footwear construction. Thus, the last has to be longer than the foot. This additional
space primarily has to account for the extension of the foot. This extension was found
for MB-L but was not visible regarding the entire foot length (F-L). The values of F-L
showed small di�erences. However, the dynamic captured F-L may not represent the
actual maximum during walking because of a shortened measurement phase. F-L was
observed from Toes Strike to Heel O�, which was a very short phase in the case of
several participants (see Figure 7.2). It can be assumed that most of body weight is
already shifted to the forefoot when the toes touch the ground. Therefore, the actual
maximum extension of F-L was not captured and thus not included in our considerations.
During walking, high forces and also peak pressure has been found beneath the heel
of the foot (Rodgers 1995). These higher forces raise the expectations for a marked
deformation of the heel width. The results of this study showed rather small di�erences
between static and dynamic heel width. These �ndings are in line with cadaveric studies
that have detected a non-linear viscoelastic behaviour (Wearing et al. 2009). This non-
97

7 Di�erences between static and dynamic 3D foot morphology in developing feet
linear viscoelastic behavior means that the soft tissue initially deforms to a signi�cantly
higher extent when force exerts. This deformation does not continue in the same manner
with increasing force. Therefore, most deformation of the heel can be expected between
non weight-bearing and half weight-bearing, which has been detected in healthy adults
(Tsung et al. 2003). The deformation was small between half and full weight bearing.
Consequently, the higher forces during the dynamic situation do not further deform the
heel.
Even if the deformation of the forefoot during walking can be expected and has been
observed in adult feet (Schmeltzpfenning et al. 2010), it is not considered in footwear
construction. Furthermore, the actual dimension of the deformation in developing feet is
unknown. The di�erences between static and dynamic OB-W of the current study can be
regarded as practically relevant. The reason is that the reproducibility of this measure was
very high because of its independence of the anatomical landmarks MTH1 and MTH5.
Furthermore, it is essential for the construction of a last and a mean di�erence of 0.8
% of F-L in OB-W is very important with respect to the improvement of footwear �t.
The pronounced widening of the forefoot during walking can be explained by its special
composition. In contrast to the heel, the forefoot is composed of several bones and
joints in combination with fat pads. Studies with bone pins have concluded that internal
movement (as a function of rotations) increases within the joints distal to the rearfoot.
Especially, the increased movements within the cuboid-�fth metatarsal joint, which has
been found to be larger than previously assumed, can contribute to the broadening of
the forefoot (Lundgren et al. 2008; Wolf et al. 2008a).
The reduction of the girth measures was not expected. Due to the �attening of the
arch and thus the midfoot, only a deferment but no increase or decrease of the girth
measures within the midfoot was expected. The smaller maximum values of all foot
girth measures, during stance phase of walking compared to static situations, has not
been reported before. It might be a consequence of contractions of intrinsic and extrinsic
muscles during walking (Gefen et al. 2000; Scott and Winter 1993). The reproducibility
of the girth measures LB-G, LW-G, and LI-G was very high, thus their di�erences were
practically relevant. The foot girth measures are important for well-�tting footwear and
even more important for last construction. The increase of the dynamic values of I-H and
B-H also re�ects the assumption of muscular activity within the midfoot during walking.
The di�erence between static and dynamic I-H was very high and points to the function
98

7.4 Discussion
of the medial longitudinal arch. I-H is also an automatically calculated measure and thus
practically relevant.
The angles of the foot are also important for the �t of footwear. B-A is important to
locate the �exible line of a shoe. This ensures the natural dorsi�exion of the foot. The
change of the foot angles during walking has not been analysed before. B-A was expected
to become more acute-angled due to extension of the medial ball length. However, B-
A was more obtuse-angled during walking which is in line with the forward motion of
MTH5. However, the RMSEs of MaxDyn for all foot angles were quite large because
of their dependency on MTH1 and MTH5. Thus, the increase of T1-A and T5-A must
be cautiously discussed. However, there is a tendency that the forefoot is more pointed
during walking. An implementation of this �nding would result in a more pointed forefoot
shape of the last which would push aside the toes during standing. This cannot be
recommended from a physiological point of view.
7.4.2 Limitations of the study
There are several limitations of the present study. Most of them are related to the highly
innovative measurement system and the challenge of processing the data. The prototype
system provides solutions for several technical di�culties. Currently, the system is sen-
sitive for changes in the environment (e.g. skin colour, ambient light). This sensitivity
results in a high dropout rate. However, the �nal sample size is still representative. The
software of the DynaScan4D was used to process the data. The automatically detected
and calculated foot measures showed high values of repeatability, even for the dynamic
values. However, the repeatability of foot measures dependant on the visually detected
anatomical landmarks was rather low, even if values of ICC were acceptable. Preferably,
all measures should be automatically detected, which will be the aim of further improve-
ments of the system. At present, the recorded 3D scan of the foot is reduced to discrete
measures. However, complete 3D information exists and can be used for future research.
Even if there were limitations in accuracy of the system and repeatability of the foot
measures based on visually detected landmarks, the reliability was better than reported
by Cheng et al. (1997) who have measured 2829 children and adolescents with a digital
foot measuring device in static situation. The �ndings of the current study were critically
discussed and can be used, in part, for last construction to improve the �t of footwear in
dynamic situations.
99
7 Di�erences between static and dynamic 3D foot morphology in developing feet
7.4.3 Conclusion
The present study aimed to identify di�erences between loaded static and dynamic foot
morphology of developing feet. With respect to the increments of last grading and the
calculation of the repeatability, the practically relevant di�erences can be summarised as
follows:
� Foot measures calculated in FWB situation di�ered from the maximum during
walking. Thus, FWB is not a quasi-dynamic situation and cannot be used to
assess dynamic foot morphology.
� Both static and dynamic foot measures must be considered for last construction.
Thus, for the construction of footwear for developing feet, thresholds or areas that
account for the di�erences between static and dynamic situations must be de�ned.
Additionally, resilient materials should be used to account for these di�erences.
� Dynamic MB-L is important to appropriately consider the required amount of the
allowance in front of the toes. This allowance is currently based on the experience
of last designers. However, MB-L must be carefully regarded as the RMSE reached
values up to 2.3 mm. Furthermore, to calculate the toe allowance additional infor-
mation about the space for growing and the in-shoe movement must be considered.
This was not in scope of this study.
� The mean increase of OB-W from HWB to MaxDyn was 0.8 % of F-L, which
must be considered in last construction. This part of the foot is highly sensitive to
external in�uences.
� The increase in OH-W from HWB to MaxDyn is negligible for footwear construc-
tion.
� All girth measures decreased in the dynamic situation. This is important in terms
of �holding� the foot during the roll over process to prevent slipping forward and
resulting compression of the toes. Resilient materials and improved lacings can
help improve the required hold and also account for the higher dynamic values of
B-H and I-H.
� As the dynamic values of T1-A and T5-A exceeded the static values, it is not
recommended to consider them for last construction. The base for construction of
100

7.4 Discussion
T1-A and T5-A should be the static values to protect against increased lateral and
medial pressure. Thus, the �toe box� should be more rounded.
� Previous suggestions to �t a shoe in the static loaded situation (Cheng et al. 1997)
are in line with our �ndings. However, dynamic characteristics must be known and
implemented in footwear design.
These results can be transferred into last construction and must be considered when it
comes to the choice of upper materials or lacing. The recommendations can improve the
dynamic �t of footwear and thus help to maintain a physiological development of feet.
Acknowledgement
We would like to thank all the helping hands who made the recording of this huge sample
possible and Lisa Peterson for her linguistic assistance.
Reference List
Alvarez, C., De Vera, M., Chhina, H. and Black, A., 2008. Normative data for the
dynamic pedobarographic pro�les of children. Gait & Posture, 28, 309-315.
Barisch-Fritz, B., Schmeltzpfenning, T., Plank, C., Hein, T., Grau, S., 2013. The e�ects
of gender, age, and body mass on dynamic foot shape and foot deformation in
children and adolescents. Footwear Science (In Press).
Blanc, Y., Balmer, C., Landis, T. and Vingerhoets, F., 1999. Temporal parameters and
patterns of the foot roll over during walking: normative data for healthy adults.
Gait & Posture, 10, 97-108.
Bland, J. M. and Altman, D. G., 1995. Multiple signi�cance tests: the Bonferroni
method. BMJ, 310, 170.
Bosch, K., Gress, J. and Rosenbaum, D., 2007. Preliminary normative values for foot
loading parameters of the developing child. Gait & Posture, 26, 239-247.
Cashmere, T., Smith, R. and Hunt, A., 1999. Medial longitudinal arch of the foot:
stationary versus walking measures. Foot Ankle Int, 20, 112-118.
Cheng, J. C. T., Leung, S. S. F., Leing, A. K. L., Guo, X., Sher, A. and Mak, A. F.
K., 1997. Change of foot size with weightbearing. Clin Orthop Relat Res, 342,
123-131.
101

7 Di�erences between static and dynamic 3D foot morphology in developing feet
Chung, M. J. and Wang, M.J., 2012. Gender and walking speed e�ects on plantar
pressure distribution for adults aged 20-60 years. Ergonomics, 5, 194-200.
Coudert, T., Vacher, P., Smits, C. and van der Zande, M., 2006. A method to obtain
3D foot shape deformation during the gait cycle. Ninth International Symposium
on the 3D Analysis of Human Movement. Valenciennes, France.
DiMeglio, A., 2001. Growth in pediatric orthopaedics. J Pediatr Orthop, 21, 549-555.
Gefen, A., Megido-Ravid, M., Itzchak, Y. and Arcan, M., 2000. Biomechanical Analysis
of the Three-Dimensional Foot Structure During Gait: A Basic Tool for Clinical
Applications. J Biomech Eng, 122, 630-639.
González, J. C., Olaso, J., Alemany, S., Garrido, D., Domin, M., Such, M. J., Carcia,
A. C. and Vera P., 2005. Footwear´s in�uence on young children´s gait pattern.
In: Hamill, J., Hardin, E., and Williams, K. Proc. of the 7th Symp. on Footwear
Biomechanics. Cleveland, USA.
Hausdor�, J. M., Zemany, L., Peng, C. and Goldberger, A. L., 1999. Maturation of gait
dynamics: stride-to-stride variability and its temporal organization in children. J
Appl Physiol, 86, 1040-1047.
Hennig, E. M. and Rosenbaum, D., 1991. Pressure distribution patterns under the feet
of children in comparison with adults. Foot Ankle, 11, 306-311.
Hong, Y., Wang, L., Xu, D. Q., 2013. Gender di�erences in foot shape: a study of
Chinese young adults. Sports Biomechanics, 10, 85-97.
Joneja, A. and Kit, F. S., 2013. Computer-aided design of footwear. In R. S. Goonetilleke
(Ed) The science of footwear. Boca Raton: Taylor and Francis, 213-260.
Kimura, M., Mochimaru, M. and Kanade, T., 2009. Measurement of 3D Foot Shape
Deformation in Motion. International Conference on Computer Graphics and In-
teractive Techniques. Proceedings of the 5th ACM/IEEE International Workshop
on Projector camera systems. New York, USA.
Klein, C., Groll-Knapp, E., Kindi, M. and Kinz, W., 2009. Increased hallux in children
and its association with insu�cient length of footwear: A community based cross-
sectional study. BMC Musculoskelet Disord, 10, 1-7.
Kouchi, M., Kimura, M. and Mochimaru, M., 2009. Deformation of foot cross-section
shapes during walking. Gait & Posture, 20, 482-486.
Krauss, I., Grau, S., Mauch, M., Maiwald, C. and Horstmann, T., 2008. Sex-related
di�erences in foot shape. Ergonomics, 51, 1693-1709.
102

7.4 Discussion
Kromeyer-Hauschild, K., Wabitsch, M., Kunze, D., Geller, F., Geiÿ, H.C., Hesse, V., von
Hippel, A., Jaeger, U., Johnson, D., Korte, W., Menner, K., Müller, G., Müller,
J.M., Niemann-Pilatus, A., Remer, T., Schaefer, F., Wittchen, H.-U., Zabransky,
S., Zellner, K., Ziegler, A. & Hebebrabd, J., 2001. Perzentilen für den Body-mass-
Index für das Kindes- und Jugendalter unter Heranziehung verschiedener deutscher
Stichproben. Monatsschrift Kinderheilkunde, 8, 807-818.
Lundgren, P., Nester, C., Liu, A., Arndt, A., Jones, R., Staco�, A., Wolf, P. and Lund-
berg, A., 2008. Invasive in vivo measurement of rear-, mid-and forefoot motion
during walking. Gait & Posture, 28, 93-100.
Maier, E. and Killmann, M., 2003. [Kinderfuÿ und Kinderschuh. Entwicklung der
kindlichen Beine und Füÿe und die Anforderung an den fuÿgerechten Schuh.].
München: Verlag Neuer Merkur.
Mauch, M., 2007. [Kindliche Fuÿmorphologie. Ein Typisierungsmodell zur Erfassung
der dreidimensionalen Fuÿform im Kindesalter.]. Saarbrücken: VDM Verlag Dr.
Müller.
Mauch, M., Grau, S., Krauss, I., Maiwald, C. and Horstmann, T., 2009. A new approach
to children's footwear based on foot type classi�cation. Ergonomics, 52, 999-1008.
Menz, H., 2004. Two feet, or one person? Problems associated with statistical analysis
of paired data in foot and ankle medicine. The Foot, 14, 2-5.
Mitchell, S.R., Jones, R. and Newman, S.T., 1995. A structured approach to the design
of shoe lasts. Journal of Engineering Design, 6, 149-166.
Perini, T. A., de Oliveira, G., dos Santor Ornellas, J. d. S. and de Oliveira, F. P., 2005.
Technical error of measurement in anthropometry. Revista Brasileira de Medicina
do Esporte, 11, 81-85.
Rao, U. B. and Joseph, B., 1992. The in�uence of footwear on prevalence of �at foot.
J Bone Joint Surg, 74-B, 525-527.
Rodgers, M. M., 1995. Dynamic foot biomechanics. J Orthop Sports Phys Ther, 21,
306-316.
Rossi, W. A. and Tennant, R., 2011. Professional shoe �tting. Tucson, Arizona: National
Shoe Retailers Association.
Schmeltzpfenning, T., Plank, C., Krauss, I., Aswendt, P. and Grau, S., 2009. Dynamic
foot scanning: A new approach for measurement of the human foot shape while
walking. Footwear Science, 1, 28-30.
103

7 Di�erences between static and dynamic 3D foot morphology in developing feet
Schmeltzpfenning, T., Plank, C., Krauss, I., Aswendt, P. and Grau, S., 2010. Dy-
namic foot scanning. Prospects and limitations of using synchronized 3D scanners
to capture complete human foot shape while walking. Karwowski, W. and Sal-
vendy, G. 3rd International Conference on Applied Human Factors and Ergonomics.
Louisville, USA.
Scott, S.H. and Winter, D. A., 1993. Biomechanical model of the human foot: kinematics
and kinetics during the stance phase of walking. J Biomech, 26, 1091.
Shapiro, S. S. and Wilk, M. B., 1965. An analysis of variance test for normality (complete
samples). Biometrika, 52, 591-611.
Shrout, P. E. and Fleiss, J. L., 1979. Intraclass correlations: uses in assessing rater
reliability. Psychol Bull, 86, 420.
Staheli, L. T., 1991. Shoes for Children: A Review. Pediatrics, 88, 371-375.
Stavlas, P., Grivas, T. B., Michas, C., Vasiliadis, E. and Polyzois, V., 2005. The Evolution
of Foot Morphology in Children between 6 and 17 Years of Age: A Cross-Sectional
Study Based on Footprints in a Mediterranean Population. J Foot and Ankle Surg,
44, 424-428.
Sutherland, D., 1997. The development of mature gait. Gait & Posture, 6, 163-170.
Tsung, B. Y. S., Zhang, M., Fan, Y. B. and Boone, D. A., 2003. Quantitative comparison
of plantar foot shapes under di�erent weight-bearing conditions. J Rehab Res Dev,
40, 517-526.
Walther, M. H. D., Sinderhauf, A., Körger, H., Kleindienst, F. and Krabbe, B., 2005.
[Anforderungen an den Kindersportschuh vor dem Hintergrund der Entwicklung
des Kinderfuÿes]. Fuss Sprungg, 3, 23-33.
Wang, J., Saito, H., Kimura, M., Mochimaru, M. and Kanade, T., 2006. Human Foot
Reconstruction from Multiple Camera Images with Foot Shape Database. IEICE
Trans.Inf.& Syst., E89-D, 1732-1742.
Wearing, S. C., Smeathers, J. E., Yates, B., Urry, S. R. and Dubois, P., 2009. Bulk
compressive properties of the heel fat pad during walking: A pilot investigation in
plantar heel pain. Clin.Biomech.(Bristol., Avon.), 24, 397-402.
Wheelwright, E. F., Minns, R. A., Law, H. T. and Elton, R. A., 1993. Temporal and
spatial parameters of gait in children. I: Normal control data. Development Med
and Child Neurol, 35, 102-113.
Wolf, P., Staco�, A., Liu, A., Nester, C., Arndt, A., Lundberg, A. and Stuessi, E., 2008a.
104

7.4 Discussion
Functional units of the human foot. Gait & Posture, 28, 434-441.
Wolf, S., Simon, J., Patikas, D., Schuster, W., Armbruster, P. and Döderlein, L., 2008b.
Foot motion in children shoes - A comparison of barefoot walking with shod walking
in conventional and �exible shoes. Gait & Posture, 27, 51-59.
Yamazaki, S., Kouchi, M., Mochimaru, M., Saito, S., Yoshida Y. and Aoki, Y., 2013.
Homologous shape modelling of deforming human foot. Footwear Science, 5,
S120-S121.
105


Research Paper III
E�ects of gender, age, and body
mass on dynamic foot
morphology and dynamic
deformation
Summary: The e�ect of anthropometric variables on dynamic foot morphology of de-
veloping feet has not been evaluated before. However, e�ect can be hypothesized as they
have been identi�ed on static foot morphology. This original article is concerned with
the e�ects of gender, age, and body mass on the maximum during dynamic situation as
well as the di�erence between dynamic maximum and static half weight-bearing. Thus,
this article exmaines hypothesis 3.
Published in: Footwear Science, Online since 09/2013
DOI: 10.1080/19424280.2013.834982
107


8 The e�ects of gender, age, and body
mass on dynamic foot shape and
foot deformation in children and
adolescents
Bettina Barisch-Fritz, Timo Schmeltzpfenning, Clemens Plank, Tobias Hein and Stefan
Grau
University of Tuebingen, Department of Sports Medicine, Hoppe-Seyler-Str. 6, Tuebin-
gen, 72076 Germany;
(Received May 16, 2013; accepted August 12, 2013)
Abstract
Purpose: The aim of the present study is to identify in�uences of gender, age, and
body mass on the dynamic foot morphology and foot deformation of maturing feet. Only,
advancements in scanner technology allow for record foot morphology during walking.
Methods: Static and dynamic foot morphology of 2554 participants (6-16 years) were
measured with DynaScan4D. Di�erent foot measures corresponding to measures used in
last construction were de�ned. In�uences of gender, age, and body mass were calculated
within the whole sample by multiple linear regression analysis and within matched groups
by Student's t-test.
Results: The results of multiple linear regression analysis show similar patterns in boys
and girls. The explained variance (R2) of the di�erences between static and dynamic
foot morphology is low. R2 is higher for the maximum dynamic foot measures where the
109

8 The e�ects of gender, age, and body mass on dynamic foot shape and foot deformation
respective static value mainly predicts the dynamic value. Relative maximum dynamic
values of foot height, width, and girth are higher in overweight, younger, and male
participants. The deformation of the instep height and the angle of the �fth toe di�er
between overweight and normal weight participants. Between boys and girls as well as
children and adolescents there are di�erences in the deformation of the ball area.
Conclusion: There are e�ects of gender, age, and body mass on dynamic foot mor-
phology and deformation. The di�erences are small regarding the high variability. Thus,
dynamic adjustments are applicable without customizing to gender, age, and body mass.
However, it is important to account for the high variability and for static and dynamic
situations. This must be discussed with focus on resilient materials. These results can
improve footwear design and thus contribute to a healthy foot development.
Keywords: 3-D deformation; Children�s footwear; 3-D scanning; dynamic foot morphol-
ogy; footwear
8.1 Introduction
Shoes have to function as a safeguard to protect our feet daily, especially during locomo-
tion. However, shoe design is mainly based on static foot measurements or on experiences
of last designers gathered over centuries. To optimize the �t of shoes, dynamic charac-
teristics of the foot are important and often requested (Kimura et al., 2009; Tsung et
al., 2003). Technical advancements in three-dimensional (3D) scanner technology allow
recording of the foot during natural walking (Coudert et al., 2006; Kimura et al., 2009;
Schmeltzpfenning et al., 2009; Wang et al., 2006). Di�erent studies focused on the
feasibility as well as potentials and limitations of several scanner systems (Kimura et al.,
2009; Wang et al., 2006). However, no study has examined the e�ects of gender, age,
and body mass on dynamic foot morphology in maturing feet.
Shoe �t is in particular important for maturing feet. Predominantly, shoes for children
and adolescents should not a�ect physiological maturation. Several e�ects of shoes on
gait characteristics but also foot structure and function have been reported (Wegener
et al., 2011; Wolf et al., 2008). Therefore, ill-�tting shoes are associated with di�erent
pathologic deformities like hallux valgus, hammer toes, or pes plans (Klein et al., 2009;
Rao and Joseph, 1992; Staheli, 1991).
110
8.1 Introduction
Even if the external foot shape of a new-born can be taken for an adult's foot, essential
structural and functional characteristics are di�erent and have to mature gradually. The
morphogenesis of the foot starts in the embryonic and foetal states when converting
from an organ for grabbing to an organ for weight-bearing (Fritz and Mauch, 2013).
Main changes in foot shape and functionality occur with increased forces due to upright
standing and walking (Maier et al., 1980). The foot matures during childhood and
adolescence according to a prede�ned genetic program. At the same time, the maturing
foot is prone to environmental in�uences, like shoes (Hennig and Rosenbaum, 1991;
Hennig et al., 1994; LeVeau and Bernhardt, 1984).
Di�erent studies have examined developmental di�erences according to age and gen-
der (Anderson et al., 1956; Cheng et al., 1997; Mauch, 2007). Most commonly, the
development of foot length was analysed. Main �ndings are that at the age of �ve to
twelve years boys have on average two mm longer feet than girls (Walther et al., 2005).
Final foot length is reached in girls by the age of 12 to 13 years. Whereas, boy's foot
growth stops approximately two years later (Anderson et al., 1956; Cheng et al., 1997;
Gould et al., 1990; Maier and Killmann, 2003; Walther et al., 2005). The whole foot
morphology of children aged between three and �ve years showed no di�erences according
to gender. This was found by Mickle et al. who normalised the foot measures to foot
length. However, they found a thicker fat pad under the midfoot in boys and concluded
that feet of boys and girls do not di�er structurally but the feet of boys manifest a retard
in maturation (Mickle et al., 2008).
Feet are already large at the time of birth (Dimeglio, 2001) to be prepared carrying
future body weight. In particular during puberty, the body weight quickly increases
(Debrunner, 1965; Maier and Killmann, 2003). However, what about heavy load before
puberty? Many studies have tried to identify di�erences between feet of overweight and
normal weight children (Dowling et al., 2001; Mauch et al., 2008; Riddiford-Harland
et al., 2000). Some authors analysed di�erences in static foot morphology (Dowling
et al., 2001; Mauch et al., 2008), or static and dynamic plantar pressure (Dowling et
al., 2001; Filippin et al., 2007; Jiménez-Ormeno et al., 2013; Mickle et al., 2006a).
Other studies focused on di�erences in characteristics of gait identi�ed by time-space
parametric, kinematic or electromyographic analysis (Hills et al., 2002; McGraw et al.,
2000; Nantel et al., 2006; Speiser et al., 2005).
111

8 The e�ects of gender, age, and body mass on dynamic foot shape and foot deformation
Signi�cant di�erences between overweight and normal weight children were found for
static foot structure (Dowling et al., 2001; Hills et al., 2002; Mauch et al., 2008; Morrison
et al., 2007; Riddiford-Harland et al., 2000). The contact area of overweight participants,
over which the higher forces due to overweight are transmitted, was identi�ed and found
to be larger than in normal weight participants (Nyska et al., 1997). As a result, plantar
pressure values are not increased in overweight children (Dowling et al., 2001; Filippin et
al., 2007; Nyska et al., 1997).
Previous research does not highlight whether it is necessary to o�er customized shoes
for special groups according to age, gender, or body mass. A foot type classi�cation by
cluster analysis of static foot measures showed that the voluminous foot type is more
frequent in overweight children (Mauch et al., 2009). However, in�uences on the dynamic
foot morphology as well as the di�erences between static and dynamic foot morphology
have not been evaluated. Furthermore, the transfer of previously identi�ed in�uences
into footwear construction in terms of customization to di�erent subgroups has not been
conducted. This is in particular important for feet that are not fully matured because
the sti�ness and resistance of all soft tissues and full ossi�cation is not attained before
late adolescence (Maier and Killmann, 2003; Walther et al., 2005).
The aim of the present study is to identify in�uences of gender, age, and body mass in
maturing feet. The core hypothesis is that gender, age, and body mass are in�uences on
the dynamic foot morphology as well as on the di�erences between static and dynamic
foot morphology. It is important to identify these in�uences in order to know if footwear
should account for these in�uencing variables. This may improve the dynamic �t of
footwear for maturing feet. In consideration of these results, footwear designers and
paediatrics as well as parents can support a physiological development of children´s and
adolescents' feet.
8.2 Methods
8.2.1 Final sample size and matched groups
The study was approved by the ethics committee of the University Clinic of Tuebingen
(Germany). The measurements took place between April 2010 and December 2011.
2554 children and adolescents, aged between six and 16 years, participated in the study.
The children and adolescents were recruited with the assistance of 15 schools in the
112

8.2 Methods
southern part of Germany. The measurements took place in each school, where children
and adolescents could freely decide whether to participate. In the preliminary stage, all
children and adolescents as well as their parents were informed by their teachers and
received written information about aims and contents of the study. Exclusion criteria
comprised all kinds of problems in�uencing normal gait, like injuries or diseases of the
lower extremities, serious foot deformities, or diagnosed neurological de�cits concerning
balance. Further pre-condition was the written consent of one legal guardian.
The �nal sample size is dependent on each foot measure and comprises 2056 to 2071.
The reasons for excluding participants were diverse. In some cases the quality of the scans
was not su�cient to analyse the targeted foot measures. Reasons for insu�cient quality
of the scan data comprised measurement problems due to wrong alignment of shutter
time and saving processes as well as trigger function. Other problems were caused by
high sensitivity of the scanner system to ambient light or de�cits to adjust to skin type.
In other cases anthropometric or scanned data was missing.
From this pool, three matched groups were formed to compare di�erences due to age,
gender, or body mass (see Table 8.1). This procedure was used before by other studies
that analysed in�uences on foot variables (Dowling et al., 2001; Fritz et al., 2013).
The matched groups were formed by individually creating pairs of participants. If one
participant could not be matched to a counterpart it was excluded. The criteria for
assigning the participants were the following:
� Male versus female: Comparison of male and female participants, matched accord-
ing to foot length, age, and BMI-percentile.
� Overweight versus normal weight: Comparison of overweight (≥90th BMI-percentile)
and normal weight (35th BMI-percentile≤mean normal weight≥65th BMI-percentile),
matched according to foot length, age, and gender.
� Younger versus older: Comparison of pre-pubescent children (6-9 years) and pubescent
adolescents (12-16 years), matched according to gender and BMI-percentile. In this
case, foot length was not a matching criterion because of the high correlation to
age.
113

Table 8.1: Characteristics of the whole sample and the matched groupsGroup Characteristics N Age
[years]BodyHeight[m]
BodyWeight[kg]
BMI-Percent-
ile
ShoeSize[ParisPoint]
FootLength[mm]
Gender
Whole sample 2554 10.6 (2.5) 1.45(0.16)
38.9(13.9)
52.0(29.0)
36 (4) 228.3(24.6)
♀ 1285 ♂ 1269
GenderMale 490 10.1 (2.2) 1.41
(0.13)36.1(11.1)
51.6(28.8)
35 (3) 224.6(20.6)
♂ 490
Female 490 10.3 (2.2) 1.44(0.15)
37.5(12.8)
51.4(28.8)
35 (3) 224.6(20.6)
♀ 490
BMI-PercentileOverweight 253 10.8 (2.5) 1.50
(0.15)54.8(17.2)
95.6(3.0)
37 (3) 236.9(20.0)
♀ 112 ♂ 141
Normal Weight 253 11.0 (2.4) 1.49(0.15)
40.3(11.0)
49.6(9.3)
37 (3) 236.7(21.7)
♀ 112 ♂ 141
Age13-16 years 478 13.9 (1.0) 1.63
(0.09)53.8(12.5)
52.1(29.2)
39 (3) 250.1(16.1)
♀ 251 ♂ 227
6-9 years 478 7.6 (1.0) 1.29(0.08)
27.1(6.0)
52.1(28.2)
32 (2) 203.4(14.4)
♀ 251 ♂ 227
Mean values of anthropometric values with the standard deviation (SD) in brackets.

8.2 Methods
8.2.2 Measurement system
The dynamic and static foot morphology was measured with the scanner system Dy-
naScan4D. This system, which is based on the principle of full-�eld triangulation by
structured light projection, was developed at the University of Tuebingen (Germany).
In order to capture objects during locomotion, �ve scanner units have been used that
are synchronized by a special software program. The scanner units (z-Snapper, ViALUX
GmbH, Chemnitz, Germany) are installed on a 4.6 m long and 0.8 m high walkway; two
scanner systems on the right, two on the left side and one below under a 0.6 x 0.4 m
glass plate (Schmeltzpfenning et al., 2010). Each scanner unit is composed of a project-
ing and a recording (Pike F-032 B/W, Allied Vision, Stadtroda, Germany) device. The
cameras record 205 frames per second with a resolution of 640 x 480. The projecting de-
vices, based on digital light processor technology, include the Digital Micromirror Device
(DMDTM, Texas Instruments Inc., USA). ViALUX has developed a special accessory light
modulator package that guarantees, amongst other things, maximum DMDTM speed and
precise synchronization of camera and projector (Hoe�ing and Ahl, 2004). The calcula-
tion of the elevation information is realized according the equations of Frankowski et al.
(Frankowski et al., 2000).
The measurement frequency comprises 46 Hz. This high frequency is achieved by a
reduced spatial resolution (4x4 binning mode). The captured scenery has a volume of
approximately 55 x 35 x 25 cm. To merge the recording of the �ve scanner units, the
system is calibrated in advance. This guarantees that the recordings of the �ve scanners
are in a single coordinate system. The accuracy of the system was tested by recording a
bowl in static condition with full resolution and in dynamic condition with a 4x4 binning
mode and a velocity of 0.8 m/s. The error (calculated as root mean square error or
technical error of measurement) is for the static condition 0.23 mm and for the dynamic
condition 0.89 mm. The repeatability of the foot measures that are independent of the
anatomical landmarks metatarsal head one (MTH1) and �ve (MTH5) is less than 0.4
mm.
A strain gauge controls the capturing of the 3D shape of the foot. Light barriers
are used to detect the walking speed of the participants. To reduce interruption due to
di�erent illumination conditions, the surrounding area is shaded and synthetic light is
used.
115
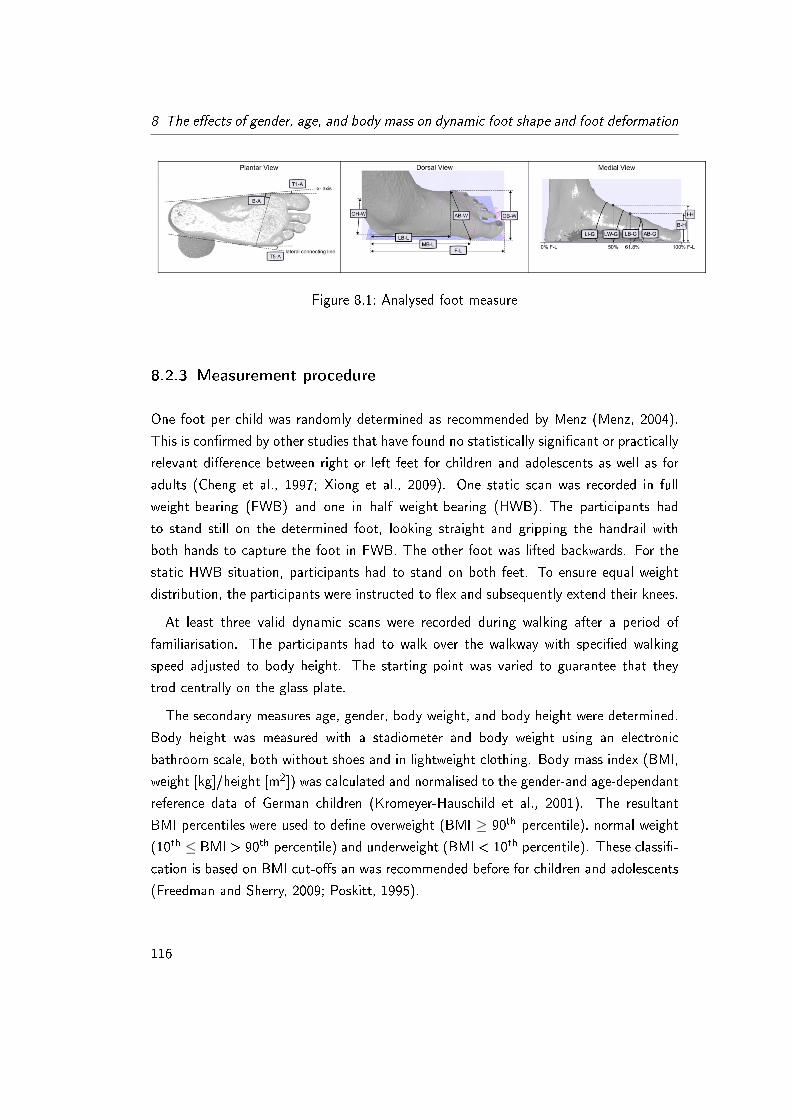
8 The e�ects of gender, age, and body mass on dynamic foot shape and foot deformation
Figure 8.1: Analysed foot measure
8.2.3 Measurement procedure
One foot per child was randomly determined as recommended by Menz (Menz, 2004).
This is con�rmed by other studies that have found no statistically signi�cant or practically
relevant di�erence between right or left feet for children and adolescents as well as for
adults (Cheng et al., 1997; Xiong et al., 2009). One static scan was recorded in full
weight-bearing (FWB) and one in half weight-bearing (HWB). The participants had
to stand still on the determined foot, looking straight and gripping the handrail with
both hands to capture the foot in FWB. The other foot was lifted backwards. For the
static HWB situation, participants had to stand on both feet. To ensure equal weight
distribution, the participants were instructed to �ex and subsequently extend their knees.
At least three valid dynamic scans were recorded during walking after a period of
familiarisation. The participants had to walk over the walkway with speci�ed walking
speed adjusted to body height. The starting point was varied to guarantee that they
trod centrally on the glass plate.
The secondary measures age, gender, body weight, and body height were determined.
Body height was measured with a stadiometer and body weight using an electronic
bathroom scale, both without shoes and in lightweight clothing. Body mass index (BMI,
weight [kg]/height [m2]) was calculated and normalised to the gender-and age-dependant
reference data of German children (Kromeyer-Hauschild et al., 2001). The resultant
BMI percentiles were used to de�ne overweight (BMI ≥ 90th percentile), normal weight
(10th ≤ BMI > 90th percentile) and underweight (BMI < 10th percentile). These classi�-
cation is based on BMI cut-o�s an was recommended before for children and adolescents
(Freedman and Sherry, 2009; Poskitt, 1995).
116

8.2 Methods
8.2.4 Analysis Procedure
The DynaScan4D software was used to capture and store the 3D foot scans. Further
processing to calculate and analyse the foot measures was also realized within this soft-
ware. It aligns the foot scans to the x-axis which is the connecting line between the
most medial point of heel and MTH1. Foot measures that are commonly used in last
design were de�ned and analysed. The foot girth measures were taken on the points that
are usually marked on the last by a last marking device (Behrens, Germany). All foot
measures are illustrated in Figure 8.1 and described in Table 8.2.
117

Table 8.2: Analysed foot measuresFoot Measures Description Measurement
Phase
FootHeight
I-H Instep HeightHighest point of the foot at 50 % of foot length (measured on a cross sectionperpendicular to the x-axis).
MTH1 Strike� Heel O�
B-H Ball HeightHighest point of the foot at 61.8 % (a.k.a. golden ratio) of foot length (measuredon a cross section perpendicular to the x-axis).
FootLength
F-L Foot LengthDistance between most posterior point of the heel and foremost point of the longesttoe parallel to the x-axis.
Toes Strike-Heel O�
M-BL Medial Ball LengthDistance between most posterior point of the heel and most medial point of MTH1parallel to the x-axis.
MTH1 Strike� Heel O�
LB-L Lateral Ball LengthDistance between most posterior point of the heel and most lateral point of MTH5parallel to the x-axis.
FootWidth
AB-W Anatomical Ball Width Distance between most medial point of MTH1 and most lateral point of MTH5. MTH1 Strike� Heel O�
OB-W Orthogonal Ball WidthDistance between most lateral and medial point of the forefoot measured orthogo-nally to the x-axis.
OH-W Orthogonal HeelWidth
Distance between most lateral and medial point of the heel measured orthogonallyto the x-axis between 14-20 % of foot length.
Heel Strike �Heel O�
FootGirth
AB-G Anatomical Ball GirthGirth around the anatomical landmarks MTH 1 and MTH5 (perpendicular to thex-axis).
MTH1 Strike� Heel O�LB-G Last Ball Girth
Girth around the �rst point (usually detected on the last by Behrens last markingdevice) at an angle of 22° relative to the vertical (perpendicular to the x-axis).
LW-G Last Waist GirthGirth around the second point at an angle of 22° relative to the vertical (perpendic-ular to the x-axis).
LI-G Last Instep GirthGirth around the third point at an angle of 22° relative to the vertical (perpendicularto the x-axis).
Anglesof theFoot
B-A Ball Angle Angle between the connecting line of MTH1 and MTH5 and the x-axis.MTH1 Strike� Heel O�T1-A Toe1 Angle
Angle between the x-axis and the connecting line of most medial points of Toe 1and MTH 1.
T5-A Toe5 AngleAngle between the connecting line of most lateral points of the heel and MTH 5and the connecting line of most lateral points of Toe 5 and MTH 5.
Foot measures are illustrated in Figure 8.1.

8.2 Methods
All foot measures were calculated for static HWB as well as dynamic condition. The
dynamic values were evaluated within de�ned phases during the roll-over process in which
most load and therefore most deformation is expected (Gefen et al., 2000). Characteristic
positions according to Blanc et al. were manually determined (Blanc et al., 1999), to
standardize the measurement phases. The �rst position is the striking of the heel on
the glass plate (Heel Strike). This position was standardized as the second frame of heel
contact, to ensure that not only a small part of the heel has contact to the ground (Gefen
et al., 2000). The second position is the contact of the metatarsal heads (MTH1 Strike)
standardized as the complete contact of MTH1 and MTH5. Additionally, the position
when the toes hit the ground (Toes Strike) and the position when heel (Heel O�) and
metatarsal heads (MTH1 O�) take o� were detected. The take-o� was standardized as
the second frame of rising when the heel or metatarsal heads were no longer completely
loaded.
The marker-less scanning system provides the advantage that bias due to soft tissue
movement is eliminated. However, some anatomical landmarks are important to calculate
foot measures. Therefore, MTH1 and MTH5 were visually detected. The possible bias
due to this procedure must be considered for further interpretation and application of
the measures dependant on MTH1 and MTH5. All foot measures independent of the
visually detected landmarks showed high values of reliability.
To achieve the aim of the study, the maximum of each foot measure (MaxDyn) was
detected during the respective measurement phase. The mean of three dynamic trials
was used and compared with the foot measures of static HWB by calculation of the
di�erence. In the following this di�erence is abbreviated as MaxDyn-HWB for each foot
measure. The foot size has an e�ect on the comparison as it is highly correlated to
age. This e�ect was eliminated by normalisation of the foot measures to the foot length
measured in HWB of the respective foot. As in other studies concerned with in�uences
on foot measures, foot height, length, width, and girth measures were normalised to foot
length (Jiménez-Ormeno et al., 2013; Mauch et al., 2008; Mauch et al., 2009; Mickle et
al., 2008; Wunderlich and Cavanagh, 2001).
8.2.5 Statistical analysis
Normal distribution of each static and dynamic foot measure was tested by using the
Shapiro-Wilk Test (Shapiro and Wilk, 1965). A multiple linear regression analysis was
119

8 The e�ects of gender, age, and body mass on dynamic foot shape and foot deformation
conducted to identify in�uences of the anthropometric continuous variables, on the out-
come measures MaxDyn and MaxDyn-HWB for each foot measure. The multiple linear
regression analysis was calculated separately for male and female participants as an ex-
plorative procedure to obtain information about the magnitude of the e�ects as well
as the relationship between di�erent variables (Aiken et al., 1991). The variables age,
BMI-percentile, and the respective static value were added to the model by the step-
wise forward method. The critical p-value for inclusion of variables was p ≤ 0.25. The
model was calculated according to equation (1). The target values are symbolized by Y
and comprise MaxDyn and MaxDyn-HWB, respectively. Xi (i=1, n) are the in�uencing
variables.
E
(Y
X
)= β0 + β1X1 + β2X2 + · · · + βnXn + ε
The di�erences between the matched groups were analysed by Student's t-test for
independent samples. All analyses were performed by using JMP Version 9.0.2 (SAS,
Cary, USA).
8.3 Results
The sample comprises children and adolescents aged between six and 16 years, 49% male
and 51 % female. 12.6 % are overweight and obese, 80.2% were normal weight, and
7.2% underweight. The calculated shoe sizes (measured foot length + allowance) range
from 26 to 45 Paris Point.
8.3.1 Multiple linear regression analysis
The results of the multiple linear regression analysis for male and female participants are
presented in Table 8.3 and Table 8.4, respectively. The models, which were calculated
for each foot measure, provide rather small values of the explained variance (R2). The
values of R2 comprise 0 to 0.22 regarding the di�erences between static and dynamic
foot measures. The highest values were found in ball angle (B-A) for boys and girls.
R2 of the models for MaxDyn of each foot measure was higher by trend. For both
genders, the explained variance of T5-A and T1-A was high with R2 of 0.70 (boys and
girls) and 0.61 (boys) and 0.62 (girls), respectively. Whereas values of R2 for foot length
measures tend toward zero.
120

8.3 Results
The results showed similar patterns for male and female participants regarding the
variables in�uencing MaxDyn. Static values of the respective foot measures were included
in most models for MayDyn in female and male participants.
121

Table 8.3: Results of multiple regression analysis within all male subjectsMaxDyn-HWB MaxDyn
Inter-cept
StaticValue
BMI-Percentile
Age Coe�cientof Deter-mination(R²)
Intercept StaticValue
BMI-Percentile
Age Coe�cientof Deter-mination(R²)
Foot Measures [β] [β] [β] [β] [β] [β] [β] [β]
FootHeight
I-H [%FL] 2.18* -0.09* 0.01* 0.04 17.71* 0.29* -0.68* 0.32B-H [%FL] 1.57* -0.04* 0.00* 0.06* 0.03 13.55* 0.26* -0.47* 0.43
FootLength
MB-L [%FL] 5.60* -0.05* 0.01* 0.28* 0.08 0LB-L [%FL] 6.17* -0.06* 0.01* 0.25* 0.08 58.93* 0.06* -0.01* -0.49* 0.10
FootWidth
AB-W [%FL] 2.39* -0.02* 0.00* 0.04 30.42* 0.13* 0.01* -0.58* 0.29OB-W [%FL] 2.05* -0.02* 0.00* 0.03 32.04* 0.14* 0.01* -0.65* 0.33OH-W [%FL] 1.91* -0.06* 0.01* 0.13* 0.05 19.64* 0.21* -0.55* 0.38
FootGirth
AB-G [%FL] 2.33* -0.03* 0.02* 0.19* 0.03 81.95* 0.10* 0.04* -1.09* 0.31LB-G [%FL] -3.79* 0.01* 0.01* 0.04 75.83* 0.13* 0.03* -1.34* 0.36LW-G [%FL] -2.06* 0.01* 0.01 77.39* 0.12* 0.05* -1.29* 0.40LI-G [%FL] -1.83* 0.00* 0.01 83.05* 0.09* 0.05* -0.08* 0.37
AnglesB-A [°] 32.31* -0.40* -0.16* 0.17 32.31* 0.60* -0.16* 0.35T1-A [°] 5.92* -0.16* -0.15* 0.08 5.92* 0.84* -0.15* 0.61T5-A [°] 2.89* -0.16* 0.01* 0.09 2.89* 0.84* 0.70
* = p < 0.05 (signi�cance of the statistical test); Critical p-value for inclusion of variables = p ≤ 0.025;Abbreviations of foot measures are listed in Table 8.2 and Figure 8.1;Static Value = Half Weight Bearingv(HWB)

Table 8.4: Results of multiple regression analysis within all female subjectsMaxDyn-HWB MaxDyn
Inter-cept
StaticValue
BMI-Perc-entile
Age Coe�cient ofDetermination
(R²)
Inter-cept
StaticValue
BMI-Perc-entile
Age Coe�cient ofDetermination
(R²)Foot Measures [β] [β] [β] [β] [β] [β] [β] [β]
FootHeight
I-H [%FL] 3.26* -0.13* 0.04 16.71* 0.29* -0.58* 0.28B-H [%FL] 1.57* -0.02* 0.01 12.65* 0.26* -0.38* 0.41
FootLength
MB-L [%FL] 0 71.04* 0.02* -0.10* 0.02LB-L [%FL] 5.09* -0.06* 0.01* 0.25* 0.07 58.15* 0.06* -0.01* -0.35* 0.09
FootWidth
AB-W [%FL] 1.01* -0.04* 0.01 30.09* 0.17* 0.01 -0.51* 0.33OB-W [%FL] 2.10* -0.01* 0.01 32.08* 0.15* 0.01* -0.50* 0.30OH-W [%FL] 1.39* -0.05* 0.01* 0.13* 0.05 17.46* 0.23* -0.41* 0.33
FootGirth
AB-G [%FL] 0 74.38* 0.13* 0.03* -1.03* 0.31LB-G [%FL] -2.24* 0.01* 0.01 70.61* 0.14* 0.03* -1.14* 0.33LW-G [%FL] -2.06* 0.01* 0.01 69.60* 0.15* 0.03* -1.11* 0.35LI-G [%FL] 0 79.59* 0.10* 0.01 -0.92 0.33
AnglesB-A [°] 38.31* -0.48* -0.17* 0.22 38.31* 0.52* -0.17* 0.30T1-A [°] 5.93* -0.19* -0.16* 0.11 5.93* 0.81* -0.16* 0.62T5-A [°] 3.44* -0.15* 0.07 3.44* 0.85* 0.70
* = p < 0.05 (signi�cance of the statistical test); Critical p-value for inclusion of variables = p ≤ 0.025;Abbreviations of foot measures are listed in Table 8.2 and Figure 8.1;Static Value = Half Weight Bearing (HWB)

8 The e�ects of gender, age, and body mass on dynamic foot shape and foot deformation
8.3.2 Di�erences between overweight and normal weight participants
Table 8.5 presents the di�erences between overweight and normal weight children/adolescents.
Statistically signi�cant di�erences were found in MaxDyn of foot height, width, and girth
measures as well as the foot angles B-A and T5-A. MaxDyn values of foot height, width
and girth measures are higher in overweight participants. MaxDyn values of B-A and T5-
A are greater in overweight participants. No di�erences were found in MaxDyn of foot
length measures. Statistically signi�cant di�erences were only found in MaxDyn-HWB
of I-H and T5-A, with greater di�erences in overweight participants.
124
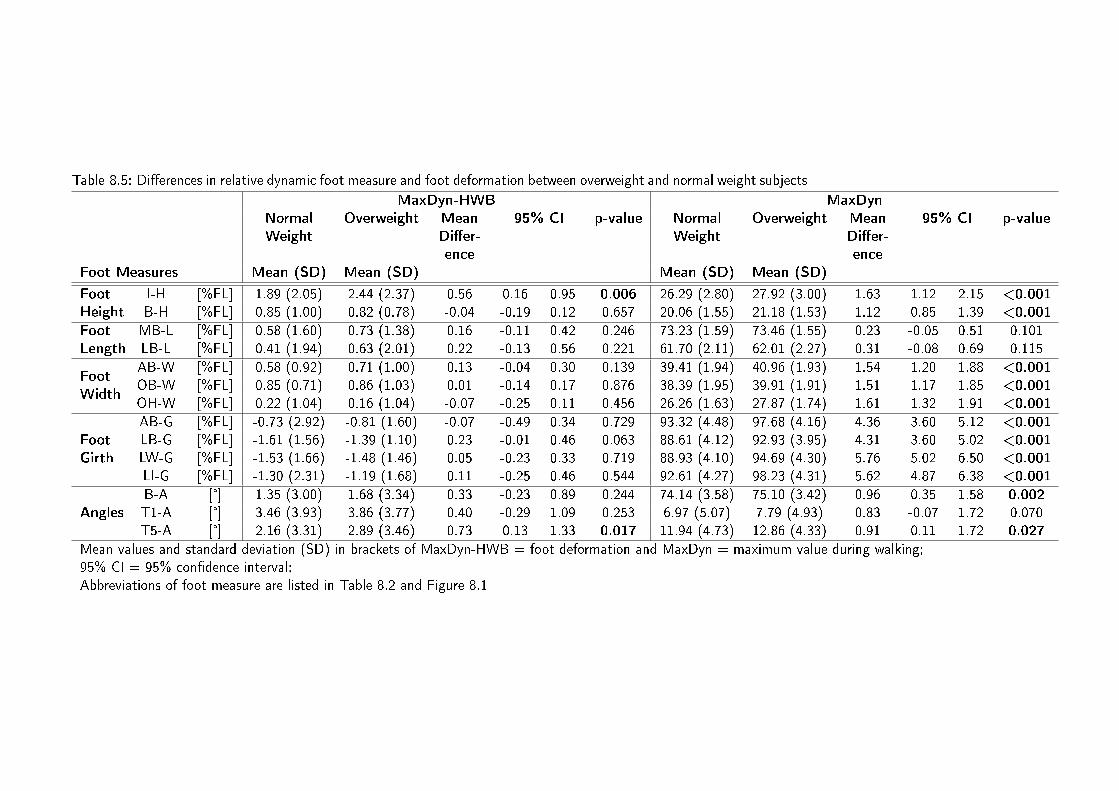
Table 8.5: Di�erences in relative dynamic foot measure and foot deformation between overweight and normal weight subjectsMaxDyn-HWB MaxDyn
NormalWeight
Overweight MeanDi�er-ence
95% CI p-value NormalWeight
Overweight MeanDi�er-ence
95% CI p-value
Foot Measures Mean (SD) Mean (SD) Mean (SD) Mean (SD)
FootHeight
I-H [%FL] 1.89 (2.05) 2.44 (2.37) 0.56 0.16 0.95 0.006 26.29 (2.80) 27.92 (3.00) 1.63 1.12 2.15 <0.001B-H [%FL] 0.85 (1.00) 0.82 (0.78) -0.04 -0.19 0.12 0.657 20.06 (1.55) 21.18 (1.53) 1.12 0.85 1.39 <0.001
FootLength
MB-L [%FL] 0.58 (1.60) 0.73 (1.38) 0.16 -0.11 0.42 0.246 73.23 (1.59) 73.46 (1.55) 0.23 -0.05 0.51 0.101LB-L [%FL] 0.41 (1.94) 0.63 (2.01) 0.22 -0.13 0.56 0.221 61.70 (2.11) 62.01 (2.27) 0.31 -0.08 0.69 0.115
FootWidth
AB-W [%FL] 0.58 (0.92) 0.71 (1.00) 0.13 -0.04 0.30 0.139 39.41 (1.94) 40.96 (1.93) 1.54 1.20 1.88 <0.001OB-W [%FL] 0.85 (0.71) 0.86 (1.03) 0.01 -0.14 0.17 0.876 38.39 (1.95) 39.91 (1.91) 1.51 1.17 1.85 <0.001OH-W [%FL] 0.22 (1.04) 0.16 (1.04) -0.07 -0.25 0.11 0.456 26.26 (1.63) 27.87 (1.74) 1.61 1.32 1.91 <0.001
FootGirth
AB-G [%FL] -0.73 (2.92) -0.81 (1.60) -0.07 -0.49 0.34 0.729 93.32 (4.48) 97.68 (4.16) 4.36 3.60 5.12 <0.001LB-G [%FL] -1.61 (1.56) -1.39 (1.10) 0.23 -0.01 0.46 0.063 88.61 (4.12) 92.93 (3.95) 4.31 3.60 5.02 <0.001LW-G [%FL] -1.53 (1.66) -1.48 (1.46) 0.05 -0.23 0.33 0.719 88.93 (4.10) 94.69 (4.30) 5.76 5.02 6.50 <0.001LI-G [%FL] -1.30 (2.31) -1.19 (1.68) 0.11 -0.25 0.46 0.544 92.61 (4.27) 98.23 (4.31) 5.62 4.87 6.38 <0.001
AnglesB-A [°] 1.35 (3.00) 1.68 (3.34) 0.33 -0.23 0.89 0.244 74.14 (3.58) 75.10 (3.42) 0.96 0.35 1.58 0.002T1-A [°] 3.46 (3.93) 3.86 (3.77) 0.40 -0.29 1.09 0.253 6.97 (5.07) 7.79 (4.93) 0.83 -0.07 1.72 0.070T5-A [°] 2.16 (3.31) 2.89 (3.46) 0.73 0.13 1.33 0.017 11.94 (4.73) 12.86 (4.33) 0.91 0.11 1.72 0.027
Mean values and standard deviation (SD) in brackets of MaxDyn-HWB = foot deformation and MaxDyn = maximum value during walking;95% CI = 95% con�dence interval;Abbreviations of foot measure are listed in Table 8.2 and Figure 8.1

8 The e�ects of gender, age, and body mass on dynamic foot shape and foot deformation
8.3.3 Di�erences between children and adolescents
The di�erences in foot measures between children's (6-9 years) and adolescents' feet (13-
16 years) are shown in Table 8.6. Statistically signi�cant di�erences were found between
MaxDyn of all foot measures except T1-A and MB-L. Higher values in MaxDyn of foot
height, width, and girth measures were found in children.
Children (6-9 years) showed higher values in MaxDyn-HWB of I-H, AB-W, LB-G, T1-
A, and T5-A. The values for MaxDyn-HWB of LB-L were higher in adolescents. Children
showed smaller dynamic OH-W compared to the static value, whereas adolescents showed
higher dynamic values for OH-W (Table 8.6).
126

Table 8.6: Di�erences in relative dynamic foot measure and foot deformation between children and adolescentsMaxDyn-HWB MaxDyn
13-16 years 6-9 years MeanDi�e-rence
95 % CI p-value 13-16 years 6-9 years MeanDi�er-ence
95 % CI p-value
Foot Measures Mean (SD) Mean (SD) Mean (SD) Mean (SD)
FootHeight
I-H [%FL] 1.64 (1.55) 3.02 (4.63) 1.38 0.94 1.82 <0.001 26.32 (2.55) 27.97 (5.08) 1.66 1.14 2.19 <0.001B-H [%FL] 0.68 (0.68) 0.65 (1.30) -0.03 -0.17 0.10 0.635 19.93 (1.41) 20.63 (1.55) 0.70 0.51 0.89 <0.001
FootLength
MB-L [%FL] 0.69 (1.66) 0.70 (1.64) 0.02 -0.20 0.23 0.889 73.23 (1.50) 73.36 (1.59) 0.13 -0.07 0.33 0.200LB-L [%FL] 0.82 (2.26) 0.52 (2.03) -0.30 -0.58 0.03 0.032 61.54 (2.27) 62.65 (2.13) 1.11 0.83 1.39 <0.001
FootWidth
AB-W [%FL] 0.47 (1.17) 0.71 (0.87) 0.25 0.11 0.38 <0.001 39.32 (2.09) 40.31 (2.00) 0.98 0.72 1.24 <0.001OB-W [%FL] 0.74 (0.98) 0.86 (1.30) 0.11 -0.03 0.26 0.128 38.15 (1.99) 39.61 (2.03) 1.47 1.21 1.73 <0.001OH-W [%FL] 0.28 (1.07) -0.11 (1.30) -0.40 -0.55 -0.24 <0.001 26.15 (1.85) 27.19 (1.84) 1.04 0.80 1.27 <0.001
FootGirth
AB-G [%FL] -1.27 (1.98) -1.09 (2.44) 0.18 -0.11 0.46 0.219 93.21 (4.71) 95.30 (4.73) 2.08 1.48 2.69 <0.001LB-G [%FL] -1.79 (2.08) -2.39 (4.41) -0.60 -1.04 -0.23 0.008 88.16 (4.58) 91.21 (4.41) 3.05 2.48 3.63 <0.001LW-G [%FL] -1.80 (1.49) -2.09 (3.86) -0.29 -0.67 0.09 0.130 88.91 (4.85) 91.70 (4.86) 2.78 2.16 3.41 <0.001LI-G [%FL] -2.03 (2.46) -2.44 (3.00) -0.42 -0.88 0.04 0.080 81.28 (8.76) 99.22 (10.25) 17.94 16.32 19.56 <0.001
AnglesB-A [°] 1.65 (3.05) 1.71 (3.35) 0.06 -0.35 0.47 0.778 73.89 (3.51) 76.05 (3.32) 2.16 1.72 2.60 <0.001T1-A [°] 3.18 (4.34) 5.47 (4.70) 2.29 1.70 2.87 <0.001 8.25 (5.67) 7.70 (5.63) -0.55 -1.28 0.17 0.135T5-A [°] 1.52 (5.42) 2.80 (3.84) 1.27 0.67 1.88 <0.001 13.25 (6.94) 10.47 (4.91) -2.77 -3.55 -2.01 <0.001
Mean values and standard deviation (SD) in brackets of MaxDyn-HWB = foot deformation and MaxDyn = maximum value during walking;95% CI = 95% con�dence interval;Abbreviations of foot measure are listed in Table 8.2 and Figure 8.1
8 The e�ects of gender, age, and body mass on dynamic foot shape and foot deformation
8.3.4 Di�erences between male and female participants
Gender-speci�c di�erences are presented in Table 8.7. Di�erences according to gender
were found in MaxDyn of foot height, width, and girth measures as well as T1-A. Female
participants showed smaller values in MaxDyn of foot height, width, and girth measures
compared to their male counterparts. MaxDyn of T1-A in female participants is bigger
than in males.
MaxDyn-HWB of B-H, MB-L, AB-G, and both measures of ball width (AB-W and
OB-W) di�er between male and female participants. In girls, higher values in MaxDyn-
HWB of B-H and AB-G were found with negative values for MaxDyn-HWB of AB-G.
MaxDyn-HWB of MB-L is smaller in female compared to male participants. MaxDyn-
HWB of OB-W was higher in girls, whereas MaxDyn-HWB of AB-W was smaller in the
same group.
128

Table 8.7: Di�erences in relative dynamic foot measure and foot deformation between female and male subjectsMaxDyn-HWB MaxDyn
♂ ♀ MeanDi�er-ence
95% CI p-value ♂ ♀ MeanDi�er-ence
95% CI p-value
Foot Measures Mean (SD) Mean (SD) Mean (SD) Mean (SD)
FootHeight
I-H [%FL] 1.64 (1.62) 1.79 (1.77) -0.15 -0.37 0.06 0.166 26.63 (2.48) 26.05 (2.64) 0.58 0.25 0.90 <0.001B-H [%FL] 0.57 (0.77) 0.71 (0.70) -0.15 -0.24 -0.05 0.002 20.40 (1.48) 19.87 (1.49) 0.53 0.34 0.72 0.001
FootLength
MB-L [%FL] 0.78 (1.55) 0.50 (1.38) 0.29 0.10 0.47 0.002 73.44 (1.56) 73.27 (1.52) 0.18 -0.02 0.37 0.075LB-L [%FL] 0.43 (2.03) 0.46 (1.83) -0.03 -0.27 0.21 0.810 62.08 (2.32) 61.85 (2.08) 0.23 -0.05 0.51 0.108
FootWidth
AB-W [%FL] 0.71 (0.86) 0.54 (0.81) 0.17 0.07 0.28 0.002 40.05 (1.99) 39.33 (2.07) 0.71 0.46 0.98 <0.001OB-W [%FL] 0.78 (0.74) 0.91 (1.00) -0.13 -0.24 -0.02 0.020 39.11 (2.01) 38.46 (2.06) 0.65 0.39 0.91 <0.001OH-W [%FL] 0.17 (1.00) 0.22 (1.26) -0.05 -0.19 0.10 0.540 26.85 (1.79) 26.29 (1.89) 0.56 0.33 0.79 <0.001
FootGirth
AB-G [%FL] -0.90 (2.11) -1.22 (1.87) 0.33 0.07 0.58 0.012 94.71 (4.58) 93.17 (4.78) 1.54 0.95 2.13 <0.001LB-G [%FL] -1.84 (1.69) -1.78 (1.96) -0.06 -0.29 0.18 0.637 90.18 (4.47) 88.68 (4.69) 1.50 0.92 2.08 <0.001LW-G [%FL] -1.63 (2.30) -1.65 (1.42) 0.02 -0.22 0.27 0.137 91.12 (4.89) 88.96 (4.85) 2.16 1.54 2.77 0.001LI-G [%FL] -1.41 (2.07) -1.46 (1.46) 0.04 -0.18 0.27 0.705 94.58 (4.59) 92.21 (4.69) 2.38 1.79 2.97 <0.001
AnglesB-A [°] 1.39 (3.14) 1.72 (3.12) -0.33 -0.73 0.07 0.103 74.92 (3.58) 74.56 (3.29) 0.34 -0.08 0.80 0.108T1-A [°] 4.13 (3.87) 3.66 (3.93) 0.47 -0.03 0.97 0.065 6.88 (5.07) 7.74 (5.07) -0.86 -1.49 0.22 0.008T5-A [°] 2.21 (3.32) 2.45 (3.41) -0.24 -0.68 0.10 0.275 11.27 (4.56) 11.60 (4.51) -0.34 -0.92 0.25 0.263
Mean values and standard deviation (SD) in brackets of MaxDyn-HWB = foot deformation and MaxDyn = maximum value during walking;95% CI = 95% con�dence interval;Abbreviations of foot measure are listed in Table 8.2 and Figure 8.1.

8 The e�ects of gender, age, and body mass on dynamic foot shape and foot deformation
8.4 Discussion
8.4.1 Multiple linear regression analysis
The linear regression analysis was conducted to give a �rst overview of potential predictors
for MaxDyn and MaxDyn-HWB as well as possible interactive e�ects (see Table 8.3 and
Table 8.4). The magnitude of the explained variances (R2) was small for the calculated
models of MaxDyn-HWB. Therefore, the variance of MaxDyn-HWB cannot be su�ciently
explained by the used variables. The explained variance in MaxDyn of foot measures
showed higher values. For instance, 60-70% of the variance in MaxDyn of the angles of
the �rst and �fth toe could be explained by the included variables.
In adults, values of explained variance were higher on average regarding dynamic plantar
foot morphology (Fritz et al., 2013). According to the current data, the reasons for the
discrepancy cannot be explained but should be analysed in following studies. One possible
reason could be the very high standard deviation in foot measures of children as reported
before (Kouchi, 1998; Mauch et al., 2009).
The patterns of in�uencing variables are similar for male and female. The respective
static value provides the highest contribution for the explained variance of MaxDyn.
Therefore, it can be concluded that for most instances dynamic foot morphology can be
predicted by static values. This was also found in adults plantar foot shape (Fritz et
al., 2013). Without confounding factors, the in�uences were identi�ed in a second step
within matched groups.
8.4.2 Di�erences between overweight and normal weight participants
There are di�erences between overweight and normal weight participants in MaxDyn of
the foot measures normalised to foot length. Feet of overweight children and adolescents
are higher, broader, and more voluminous in dynamic situation compared to their normal
weight counterparts. This is in line with most results reported for static foot morphology
(Mauch et al., 2008; Morrison et al., 2007). In contrast, some studies could not �nd
statistically signi�cant di�erences between overweight and normal weight children when
normalising the foot measures to foot length (Jiménez-Ormeno et al., 2013).
The di�erences between static and dynamic foot morphology is higher for overweight
participants. In particular, the increased values of the instep height (I-H) normalised to
foot length are noticeable. The height at 50% of foot length divided by foot length is
130

8.4 Discussion
often used to identify functionality of the medial longitudinal arch (Williams and McClay,
2000). Overweight participants showed higher maximum values of I-H during walking.
This might be caused by increased adipose tissue. The higher value during walking
compared to the lower value during standing is in contrast to the assumptions that the
medial longitudinal arch �attens more in overweight children (Dowling et al., 2001; Mickle
et al., 2006b; Riddiford-Harland et al., 2000). Thus, these �ndings tend to con�rm studies
which stated that an excess of adipose tissue is source of the supposed ��attening� and
not a drop of the medial longitudinal arch (Mickle et al., 2006b; Morrison et al., 2007;
Nass et al., 1999). However, by the use of this foot measure a clear statement cannot be
given regarding the medial longitudinal arch. At this point, the criticism of the validity of
used indices to estimate arch height and thus functionality of the foot must be reactivated
(Hawes et al., 1992; McPoil and Cornwall, 2006; Wearing et al., 2006). To get a clearer
understanding of the function of the medial longitudinal arch and their dependencies,
bone pin or radiographical analysis would be bene�cial. Furthermore, this study did not
focus on the function of the medial longitudinal arch which is initially not important for
footwear construction.
Another signi�cant di�erence between normal weight and overweight participants is
that the angle of the �fth toe (T5-A) is bigger in overweight participants, which means
that the forefoot is pointier during walking. One possible reason is the additional fat
tissue under MTH5 which deforms more during walking. This result must be interpreted
carefully as the values of standard deviation are very high. An explanation of the higher
di�erences and the variability of T5-A is given by Lundgren et al. (Lundgren et al., 2008).
The authors found, using bone pin analysis, a considerable capacity of the motion on the
lateral part of the foot which might be pronounced by increasing forces due to overweight
(Lundgren et al., 2008).
8.4.3 Di�erences between children and adolescents
The in�uence of age on the foot morphology was previously analysed with respect to
foot growth (Anderson et al., 1956; Debrunner, 1965). Previous research focused on
associations between di�erent foot measures normalised to foot length and age and found
changing proportions of the foot (Gould et al., 1990; Kouchi, 1998). These changes in
foot proportion are also obvious in MaxDyn as the static foot morphology is the main
predictor for dynamic foot morphology. Our results con�rm that feet of children are
131

8 The e�ects of gender, age, and body mass on dynamic foot shape and foot deformation
relatively broader, higher, and more voluminous than feet of adolescents. This is most
obvious in the girth around the instep (LI-G).
The novel �ndings considering the di�erences in static and dynamic foot morphology
between children and adolescents must be discussed carefully because of the high standard
deviations. I-H is higher during walking compared to static HWB in children. This was not
reported before and is in contrast to statements that younger feet are softer and more
deformable (Maier and Killmann, 2003). Further analysis on temporal and muscular
information would be bene�cial to interpret the results in terms of the functionality of
the medial longitudinal arch. The di�erences in ball width measures in children are
contrary to the di�erences in adolescents. It is possible that the anatomical ball width
(AB-W), which is dependent on the anatomical landmarks MTH1 and MTH5 changes in
a di�erent pattern compared to the absolute orthogonal ball width (OB-W). Especially
MTH5 changes in a di�erent pattern in children compared to adolescents. The higher
deformation of the angles T1-A and T5-A as well as last ball girth (LB-G) in children
also suggest di�erent deformation patterns within the area of the forefoot. The higher
values for the orthogonal heel width (OH-W) in dynamic situations are also subjected to
the high standard deviation which might be point to high variability of gait in children
(Hausdor� et al., 1999).
8.4.4 Di�erences between male and female participants
Gender-speci�c di�erences have been subject of di�erent studies in adults (Krauss et al.,
2008; Zifchock et al., 2006) as well as children (Mauch et al., 2009; Mickle et al., 2008).
In the present study MaxDyn of foot height, width, and girth measures normalised to
foot length are greater for male participants. Similar results, even less distinctive, were
reported in adults (Fritz et al., 2013; Krauss et al., 2008; Wunderlich and Cavanagh,
2001). In three to �ve year old children, Mickle et al. found no signi�cant di�erences
when normalising the foot measures to the respective foot length (Mickle et al., 2008).
Female participants have higher maximum dynamic values of the angle of the �rst toe.
Even if the prevalence of hallux valgus was not studied, these results are in line with
�ndings of Jerosch and Mamsch et al. who reported that more girls (10-12 years) have
Hallux valgus deformations (Jerosch and Mamsch, 1998). In younger children (3-6.5
years) higher risk for Hallux valgus was found for boys (Klein et al., 2009). In adults,
the prevalence of Hallux valgus increases with age and is more often observed in women
132

8.4 Discussion
(Nix et al., 2010). The responsibility of genetics or ill-�tting shoes is not completely
explained.
Di�erences within MaxDyn-HWB are more pronounced in girls for ball height, orthog-
onal ball width, and anatomical ball girth. Less deformation can be found in anatomical
ball width and medial ball length. The results point to a di�erent deformation pattern
of the forefoot in girls. Higher values of deformation were also found in women ´s feet
during stance phase (Fritz et al., 2013).
8.4.5 Practical relevance and conclusion
The core hypothesis of this study can be veri�ed. The maximum dynamic values of
relative foot height, width, and girth measures as well as angles of the foot are a�ected by
gender, age, and body mass. The deformation (comparing static and dynamic situations)
of the ball area showed di�erent patterns in male compared to female participants as
well as children compared to adolescents. The instep height of the feet of overweight
participants does not decrease more than in feet of their normal weight counterparts.
Furthermore, the di�erences between static and dynamic situation are not distinctively
higher in overweight participants.
The di�erences between matched groups are small considering the mean values. On
the other hand the variability within the foot measures is extremely high. Therefore, the
transfer into footwear design is more complex. First of all, it is important to account for
the high variability. One procedure to satisfy the high variability of feet is presented by
Mauch et al. (Mauch et al., 2009). This procedure, based on a cluster analysis, can be
still seen as the starting point of the implementation for the dynamic changes. Since,
the dynamic values are best predicted by the respective static values, the cluster analysis
could be primarily used to improve the static �t. In a second step further improvements
can be achieved by de�ning areas where most deformation or variability of the deformation
was found. According to our �ndings this is in particular the ball area.
The dynamic customization can be implemented without consideration of gender, age,
or body mass. Therefore, the dynamic adjustments can be conducted in the same way for
all subgroups. However, these adjustments must be discussed individually for each foot
measure. With respect to the high variability within the foot measures, the meaning of
mean values of deformation must be discussed. A mean deformation value of a normally
distributed foot measure implies that it accounts for only approximately 50% of the
133

8 The e�ects of gender, age, and body mass on dynamic foot shape and foot deformation
users. Thus, the threshold should be considered for each foot measure and it can be
recommended to use di�erent quantile values instead of mean values.
Another relevant aspect is that both static and dynamic values have to be considered.
The static HWB is important in two ways: First, HWB represents the foot morphology
during standing as one basic task of the foot that has to be una�ectedly allowed by the
shoe. Second, this situation is also one part of walking named by the double support
phase. Thus, the designer should not rely on consulting only one threshold for a foot
measure of a special size when constructing a last. It is recommended to de�ne an area
for the location of MTH1 and MTH5. Furthermore, the broadening of the ball width
must be allowed. This can be implemented by the insertion of resilient materials. These
kinds of material could further accommodate the reduced girth measures of the midfoot
during walking. In this context, the improvement of lacings can also make a contribution.
Future research should focus on the dynamic foot morphology and deformation to
verify the �ndings of the study. Furthermore, it is important to improve the scanner
technology in terms of high measurement frequency and simultaneously high spatial res-
olution. Especially, the reduced spatial resolution of the current scanner system must
be mentioned as one limitation. However, the reproducibility of the automatically calcu-
lated foot measures is very high. It is only reduced in foot measures that depend on the
anatomical landmarks MTH1 and MTH5. Thus, improved software systems are necessary
to guarantee a high reliability of all foot measures.
Overall, the current study con�rms the high potential of dynamic scanning with the aim
to customize footwear to di�erent requirements. Furthermore, the dynamic customisation
of footwear contributes to a healthy foot development in children and adolescents which
is important for the whole body and a physically active lifestyle.
References
Aiken, L.S. and West, S.G., 1991. Multiple Regression: Testing and interpreting interac-
tions. Newbury Park, CA: Sage Publications.
Blanc, Y., et al., 1999. Temporal parameters and patterns of the foot roll over during
walking: normative data for healthy adults. Gait & Posture, 10, 97-108.
Chen, J.P., Chung, M.J. and Wang, M.J., 2009. Flatfoot Prevalence and Foot Dimen-
sions of 5- to 13-Year-Old Children in Taiwan. Foot & Ankle International, 30,
326-332.
134

8.4 Discussion
Cheng, J.C.Y., et al., 1997. Change of Foot Size With Weightbearing; A Study of 2829
Children 3 to 18 Years of Age. Clinical Orthopaedics and Related Research, 342,
123-131.
Coudert, T., et al., 2006. A method to obtain 3D foot shape deformation during the gait
cycle. Ninth International Symposium on the 3D Analysis of Human Movement .
28-30 June, Valencienne, France.
Debrunner, H.U., 1965. [Growth and development of the foot in adolescents]. Stuttgart:
Enke.
DiMeglio, A., 2001. Growth in pediatric orthopaedics. J Pediatr Orthop, 21, 549-555.
Dowling, A.M., Steel, J.R. and Baur, L.A., 2001. Does obesity in�uence foot structure
and plantar pressure patterns in prepubescent children? International Journal of
Obesity, 25, 845-852.
Filippin, N.T., et al., 2007. E�ects of obesity on plantar pressure distribution in children.
Revista Brasileira de Fisioterapia, 11, 495-501.
Frankowski, G., Chen, M. and Huth, T., 2000. Real-time 3D Shape Measurement with
Digital Stripe Projection by Texas Instruments Micromirror Devices DMD. Pro-
ceedings of SPIE, San Jose USA, 3958, 90-106,.
Freedman, D.S. and Sherry, B., 2009. The validity of BMI as an indicator of body fatness
and risk among children. Pediatrics, 124, S23.
Fritz, B., et al., 2013. Anthropometric in�uences on dynamic foot shape: Measurements
of plantar three-dimensional foot deformation. Footwear Science, 5, 121-129.
Fritz, B. and Mauch, M., 2013. Foot development in children and adolescents. In: A.
Luximon. Handbook of Footwear Design and Manufactur. Woodhead Publishing,
Cambridge.
Gefen, A., et al., 2000. Biomechanical Analysis of the Three-Dimensional Foot Structure
During Gait: A Basic Tool for Clinical Applications. J Biomech Eng, 122, 630-639.
Gould, N., et al., 1990. Foot growth in children age one to �ve years. Foot Ankle, 10,
211-213.
Hausdor�, J.M., et al., 1999. Maturation of gait dynamics: stride-to-stride variability
and its temporal organization in children. J Appl Physiol, 86, 1040-1047.
Hawes, M.R., et al., 1992. Footprint parameters as a measure of arch height. Foot
Ankle, 13, 22-26.
Hennig, E.M. and Rosenbaum, D., 1991. Pressure distribution patterns under the feet
135

8 The e�ects of gender, age, and body mass on dynamic foot shape and foot deformation
of children in comparison with adults. Foot Ankle, 11, 306-311.
Hennig, E.M., Staats, A. and Rosenbaum, D., 1994. Plantar pressure distribution pat-
terns of young school children in comparison to adults. Foot Ankle Int., 15, 35-40.
Hills, A.P., et al., 2002. The biomechanics of adiposity structural and functional limita-
tions of obesity and implications for movement. Obesity Reviews, 3, 35-43.
Hoe�ing, R. and Ahl, E. 2004. ALP: universal DMD controller for metrology and testing.
Proceedings of SPIE-IS&T Electronic Imaging, 5289, 322-329.
Jerosch, J. and Mamsch, H., 1998. [Deformities and misalignment of feet in children--a
�eld study of 345 students]. Zeitschrift für Orthopädie und ihre Grenzgebiete, 136,
215.
Jiménez-Ormeno, E., et al., 2013. Foot morphology in normal-weight, overweight, and
obese schoolchildren. European Journal of Pediatrics, 172, 645-652.
Kimura, M., Mochimaru, M. and Kanade, T., 2009. Measurement of 3D Foot Shape
Deformation in Motion. International Conference on Computer Graphics and In-
teractive Techniques. Proceedings of the 5th ACM/IEEE International Workshop
on Projector camera systems, New York, USA.
Klein, C., et al., 2009. Increased hallux in children and its association with insu�cient
length of footwear: A community based cross-sectional study. BMC Musculoskelet
Disord, 10, 1-7.
Kouchi, M., 1998. Foot dimensions and foot shape: di�erences due to growth, generation
and ethnic origin. Anthropological Science, 106, 161-188.
Krauss, I., et al., 2008. Sex-related di�erences in foot shape. Ergonomics, 51, 1693-1709.
Kromeyer-Hauschild, K., et al., 2001. [Percentiles of the body mass index for child-
hood and adolescence consulting several German samples]. Monatsschrift Kinder-
heilkunde, 8, 807-818.
LeVeau, B.F. and Bernhardt, D.B., 1984. Developmental Biomechanics E�ect of Forces
on the Growth, Development, and Maintenance of the Human Body. Physical
Therapy, 64, 1874-1882.
Lundgren, P., et al., 2008. Invasive in vivo measurement of rear-, mid-and forefoot
motion during walking. Gait & Posture, 28, 93-100.
Maier, E., et al., 1980. [The maturation of the child's foot]. Tagung der Deutschen
Gesellschaft für Orthopädie und Traumtologie. Münster/Westf., Germany.
Maier, E. and Killmann, M., 2003. [Children's feet and children's shoes. Development
136

8.4 Discussion
of children's legs and feet and the requirements for suitable shoes for their feet].
Munich: Verlag Neuer Merkur.
Mauch, M., 2007. [Foot Morphology of Children. A typing model to capture three-
dimensional shape of the foot in childhood]. VDM Verlag Dr. Müller, Saarbrücken.
Mauch, M., et al., 2008. Foot morphology of normal, underweight and overweight
children. International Journal of Obesity, 32, 1068-1075.
Mauch, M., et al., 2009. A new approach to children's footwear based on foot type
classi�cation. Ergonomics, 52, 999-1008.
McGraw, B., et al., 2000. Gait and postural stability in obese and nonobese prepubertal
boys. Archives of Physical Medicine and Rehabilitation, 81, 484-489.
McPoil, T.G. and Cornwall, M.W., 2006. Use of plantar contact area to predict medial
longitudinal arch height during walking. Journal of the American Podiatric Medical
Association, 96, 489-494.
Menz, H., 2004. Two feet, or one person? Problems associated with statistical analysis
of paired data in foot and ankle medicine. The Foot, 14, 2-5.
Mickle, K.J., Steele, J.R. and Munro, B.J., 2006a. Does excess mass a�ect plantar
pressure in young children? Int.J.Pediatr.Obes., 1, 183-188.
Mickle, K.J., Steele, J.R. and Munro, B.J., 2006b. The feet of overweight and obese
young children: are they �at or fat? Obesity, 14, 1949-1953.
Mickle, K.J., Steele, J.R. and Munro, B.J., 2008. Is the foot structure of preschool
children moderated by gender? Journal of Pediatric Orthopaedics, 28, 593-596.
Morrison, S.C., et al., 2007. Anthropometric Foot Structure of Peripubescent Children
with Excessive versus Normal Body Mass A Cross-sectional Study. Journal of the
American Podiatric Medical Association, 97, 366-370.
Nantel, J., Brochu, M. and Prince, F., 2006. Locomotor Strategies in Obese and Non-
obese Children. Obesity, 14, 1789-1794.
Nass, D., Hennig, E.M. and Van Treek, R., 1999. The thickness of the heel pad loaded
by bodyweight in obese and normal weight adults. Women, 49, 6.
Nix, S., Smith, M. and Vicenzino, B., 2010. Prevalence of hallux valgus in the general
population: a systematic review and meta-analysis. J Foot Ankle Res, 3, 21.
Nyska, M., et al., 1997. The adaptation of the foot to heavy loads: plantar foot pressures
study. Clinical Biomechanics, 12, 8.
Poskitt, E.M.E., 1995. De�ning childhood obesity: the relative body mass index (BMI).
137

8 The e�ects of gender, age, and body mass on dynamic foot shape and foot deformation
Acta Paediatrica, 84, 961-963.
Rao, U.B. and Joseph, B., 1992. The in�uence of footwear on prevalence of �at foot. J
Bone Joint Surg, 74-B, 525-527.
Riddiford-Harland, D.L., Steele, J.R. and Storlien, L.H., 2000. Does obesity in�uence foot
structure in prepubescent children? International Journal of Obesity, 24, 541-544.
Schmeltzpfenning, T., et al., 2009. Dynamic foot scanning: A new approach for mea-
surement of the human foot shape while walking. Footwear Science, 1, 28-30.
Schmeltzpfenning, T., et al., 2010. Dynamic foot scanning. Prospects and limitations
of using synchronized 3D scanners to capture complete human foot shape while
walking. 3rd International Conference on Applied Human Factors and Ergonomics.
Louisville, USA.
Shapiro, S.S. and Wilk, M.B., 1965. An analysis of variance test for normality (complete
samples). Biometrika, 52, 591-611.
Speiser, P.W., et al., 2005. Childhood obesity. Journal of Clinical Endocrinology &
Metabolism, 90, 1871-1887.
Staheli, L.T., 1991. Shoes for Children: A Review. Pediatrics, 88, 371-375.
Tsung, B.Y.S., et al., 2003. Quantitative comparison of plantar foot shapes under dif-
ferent weight-bearing conditions. J Rehab Res Dev, 40, 517-526.
Walther, M.H.D., et al., 2005. [Requirements for the child's sport shoe against the
background of foot development]. Fuss Sprunggelenk, 3, 23�33.
Wang, J., et al., 2006. Human Foot Reconstruction from Multiple Camera Images with
Foot Shape Database. IEICE Trans.Inf.& Syst., E89-D, 1732-1742.
Wearing, S.C., et al., 2006. Musculoskeletal disorders associated with obesity: a biome-
chanical perspective. Obes.Rev., 7, 239-250.
Wegener, C., et al., 2011. E�ect of children's shoes on gait: a systematic review and
meta-analysis. J Foot Ankle Res, 4.
Williams, D.S. and McClay, I.S., 2000. Measurements used to characterize the foot
and the medial longitudinal arch: reliability and validity. Physical Therapy, 80,
864-871.
Wolf, S., et al., 2008. Foot motion in children shoes - A comparison of barefoot walking
with shod walking in conventional and �exible shoes. Gait & Posture, 27, 51-59.
Wunderlich, R.E. and Cavanagh, P.R., 2001. Gender di�erences in adult foot shape:
implications for shoe design. Med.Sci.Sports Exerc., 33, 605-611.
138

8.4 Discussion
Xiong, S., et al., 2009. Foot deformations under di�erent load-bearing conditions and
their relationships to stature and body weight. Anthropological Science, 117, 77-
88.
Zifchock, R.A., et al., 2006. The e�ect of gender, age, and lateral dominance on arch
height and arch sti�ness. Foot Ankle Int., 27, 367-372.
139


9 Discussion
The discussion of this thesis focuses on the examination of the hypotheses and the
research question. Section 9.1 presents comprehensive considerations and supplementary
aspects with regard to the three hypotheses. Already discussed aspects that are relevant
for the examination of the three hypotheses are only mentioned and it is referred to details
within the three research articles. In Section 9.2, �ndings of this thesis are critically
discussed along technical and non-technical limitations as well as consequences on the
performance criteria. The �ndings, consolidated with the theoretical background, result
in recommendations for footwear and footwear construction (see Section 9.3).
9.1 Research question and hypotheses
This section aims to prove the three hypotheses (see Table 9.1) that are addressed
within the three research articles. The following subsections discuss each hypothesis in
the following way. First, the key �ndings contributing to the hypothesis are summarized.
Second, the contribution to research question is elaborated. Third, the relationship
among the three hypotheses are detailed.
Table 9.1: Overview of the research question and the three hypothesesResearch question: How does foot morphology di�er between static and dynamic
situations?Hypothesis 1: There are di�erences in dynamic foot morphology of adults
according to age, gender, and body mass.Hypothesis 2: Dynamic foot morphology of developing feet di�ers from
static foot morphology.Hypothesis 3: Gender, age, and body mass a�ect the dynamic foot mor-
phology and the di�erences between static and dynamic footmorphology of developing feet.
141

9 Discussion
9.1.1 First hypothesis
The �rst hypothesis is veri�ed by the adult sample which comprises 129 participants.
Several di�erences are found according to age, gender, and body mass for the three-
dimensionally measured plantar foot shape of adults. The dynamic foot morphology is
evaluated by the absolute change (∆Dyn) of each foot measure within a speci�ed phase
and the maximum of the foot measure (MaxDyn) identi�ed in the same phase. The
�ndings of the in�uences on the dynamic foot morphology, presented in Chapter 6, are
novel and complement existing research results on static foot morphology (Krauss et al.,
2010; Wunderlich and Cavanagh, 2001; Zifchock et al., 2006). In the following, these
�ndings are summarized for each analysis method.
The �rst analysis method, based on matched pairs, revealed complex relations be-
tween dynamic foot morphology and anthropometric variables. The di�erences accord-
ing to age, gender, and body mass are not statistically signi�cant for all dynamic plantar
foot measures. There are no di�erences between men and women for the maximum
dynamic values of all foot measures normalized to foot length. However, the width of
the ball and arch deforms to a greater extend in women (discussed in Section 6.4.1).
The maximum dynamic value of all plantar foot width measures is higher for overweight
participants. This is discussed with respect to increased forces due to increased body
mass and coexisting similar pressure distribution patterns as a result of a greater contact
area. Furthermore, overweight participants show a wider range for the deformation of
medial ball length, ball width as well as angles of the ball and toes. Thus, it can be
concluded that their longitudinal arch �attens more and their ball width widens more
(discussed in Section 6.4.2). The deformation of the ball angle of older participants is
more pronounced during dynamic situations, compared to middle-aged participants. Fur-
thermore, the maximum of the heel width of older participants is broader during walking
(discussed in Section 6.4.3). All identi�ed di�erences indicate that gender, age and body
mass a�ect dynamic foot morphology and deformation. However, the in�uences must be
individually considered, in particular as di�erent areas of the foot are unequally a�ected.
A second statistical analysis, a multiple linear regression analysis, is used to evaluate
possible relationships between the variables as well as their contribution to the explained
variance. The explained variance is very low for the ∆Dyn of all foot measures. Thus,
this dimension cannot be su�ciently predicted by the used variables (see Section 6.3.2).
The explained variance of the maximum of all foot measures is higher. The respective
142
9.1 Research question and hypotheses
static value of each foot measures is main predictor of the value for the maximum during
walking. Additionally, gender and body height contribute to the explained variance of
measures that describe the arch as well as the lateral ball length.
These �ndings contribute to the research question in the following way. The di�er-
ences and thus in�uences are more complex and not consistent regarding all plantar foot
measures. In general, the detected in�uences are rather small. The contribution of the
�rst research article to the research question is that in�uences of gender, age, and body
mass are found for the dynamic foot morphology. The identi�ed in�uences on the max-
imum values during walking area generally in line with literature �ndings for static foot
morphology. With respect to these �ndings, it is essential to know the dimension of static
foot morphology and the di�erences between static and dynamic situations. In terms of
footwear �t it can be assumed that the implementation of these di�erences will improve
the dynamic behaviour of footwear.
The �ndings of the �rst research article are important to understand the nature of inter-
individual di�erences of dynamic foot morphology. However, additional foot measures are
necessary for the implementation in footwear. Especially, girth measures are important to
improve the �t of footwear. Furthermore, the analysis procedure needs to be improved to
generate highly reliable foot measures by automated procedures. Generally, the knowledge
of foot deformation is most important for developing feet to contribute to a physiological
foot development. Therefore, children and adolescents are recruited to evaluate the
dynamic foot morphology which is presented in the second and third research article.
9.1.2 Second hypothesis
The second hypothesis is proven by a large sample of children and adolescents (n = 2554).
For the underlying aim to identify di�erences that are relevant for footwear construction,
foot measures, corresponding to measures usually used for last construction, are de�ned.
To achieve a high reliability, most of the foot measures are automatically calculated.
The second hypothesis is veri�ed for all foot measures except the measure of foot
length (discussed in Section 7.4.1). The di�erences between static and dynamic 3D foot
morphology of developing feet have not been evaluated before. Di�erences are found
between dynamic situation and static half weight-bearing as well as full weight-bearing
situation. The di�erences between the two static situations are not statistically signi�-
cant. However, there are statistically signi�cant di�erences between the foot measures
143

9 Discussion
of standing and walking, which are relevant for the implementation. These di�erences
can be summarized, at �rst, with respect to their direction, followed by their practical
relevance. Regarding the direction of the di�erences, there are increased values during
dynamic situations compared to loaded static situations in foot length, width, and height
measures as well as angles of the ball. However, di�erences between static and dynamic
heel width are small. The identi�ed di�erences of medial and lateral ball length showed
similar mean value, which has not been reported before (discussed in Section 7.4.1). The
values of the angles increase in the dynamic situation. The ball angle is more obtuse-
angled during walking. The increased angles of the toes indicate that the forefoot is
pointier during the dynamic situation. Thus, the dynamic values of the toe angles can-
not be used as a guideline for last construction. The consequence of using these dynamic
values would be a permanent pressure during standing which would in�uence the phys-
iological development. All midfoot girth measures are decreased in dynamic situations
compared to loaded static situations. This is discussed with respect to muscular activ-
ity and it is related to higher values of the instep height during walking (discussed in
Section 7.4.1).
In order to consider the relevant di�erences for implementation, the repeatability of
each foot measure is calculated. This is conducted by a repeated performance of the
analysis procedure. The intra-class correlation coe�cient (ICC) and the root mean square
error (RMSE) are calculated within a smaller sample. Information about the reliability as
well as increments of the grading of shoes is evaluated to interpret the results in terms
of their relevance for the implementation in footwear design (see Table 7.6, discussed
in Section 7.4.1). The reliability of foot measures that are independent from visually
detected anatomical landmarks is high. Furthermore, the reliability is still acceptable for
the foot measures depending on the anatomical landmarks. The di�erences between static
and dynamic values of orthogonal ball width and all midfoot girth measures are practically
relevant. These measures are highly reliable and the magnitude of their di�erences
comprise on average half of the grading increments (discussed in Section 7.4.1).
The second hypothesis is veri�ed along the presented research article. Furthermore,
the results are assessed regarding their practical relevance. The con�rmation of the
second hypothesis provides an essential contribution to the research question. There are
relevant di�erences between static and dynamic foot morphology of developing feet. Up
to now, di�erences between static and dynamic foot morphology have only been assumed
144
9.1 Research question and hypotheses
in footwear construction and mainly focused on foot length. The �ndings of this research
article show that all foot measures di�er between static and dynamic situations. Thus,
dynamic customization is important to improve the dynamic �t of footwear.
The �ndings of the second research article provide important information to improve
the dynamic �t of footwear for developing feet. However, the high variance within each
foot measure does not allow to directly implement the results. Prior to that, it must be
clari�ed if there are in�uences on the dynamic deformation that can explain the varaince.
As some in�uences of gender, age, and body mass were found wthin the adult sample,
these in�uences has to be analysed within the sample of children and adolescents. The
third research article analyses these in�uences to �nally clarify if the customization must
be adjusted to gender, age, or body mass.
9.1.3 Third hypothesis
The in�uences of gender, age, and body mass on the di�erences between static and dy-
namic foot morphology are very important to decide if dynamic customization must be
further speci�ed according to these anthropometric variables. The in�uences are iden-
ti�ed by two di�erent statistical procedures: First, a comparison of matched pairs and
second, a multiple linear regression analysis. The multiple linear regression analysis is cal-
culated within the whole sample. In addition, matched pairs are formed out of the whole
sample according to gender, age, and body mass (see Section 8.2.1 and Section 8.2.5).
The third hypothesis is veri�ed acording to the results of the third research article.
There are in�uences of gender, age, and body mass on the dynamic foot morphology
and the di�erences between static and dynamic foot morphology. However, these in-
�uences must be individually regarded and assessed for each foot measure (discussed
in Section 8.4). Furthermore, the high variance within each foot measure has to be
considered. The explained variance of the di�erences between static and dynamic foot
measures is small. Thus, the relevance of the identi�ed in�uences is reduced and it can
be concluded that the dynamic customization can be conducted without consideration
of gender, age, or body mass. The comparisons of the matched pairs show that there
are di�erent patterns of deformation of the ball area especially between male and fe-
male as well as children and adolescents. The di�erences of the maximum value during
walking between male and female, overweight and normal weight, and younger and older
subgroups are more distinctive. This can be further explained with consideration of the
145

9 Discussion
results of the multiple linear regression analysis. The respective static value is included
in each model and the conclusion is that the static value best predicts the dynamic value
(discussed in Section 8.4.1). This explains the similar in�uences of gender, age, and body
mass on static and dynamic foot morphology. The conclusion is that the static loaded
situation is still important for �tting footwear.
The contribution to the research question is that these �ndings explain the nature of
the di�erences from a more qualitative point of view. The variance of the di�erences
between the static and dynamic foot morphology could not be su�ciently explained.
Possibly, there are other variables that can explain this variance. The more practical
conclusion is that the dynamic customization can be conducted without consideration of
gender, age, and body mass. However, the variance must be re�ected for example by the
application of resilient materials.
The �ndings of the in�uences are also more complex, similar to the identifed in�u-
ences within the adults sample. In addition to the second resserach article, these results
allow formulating comprehensive recommendations for the construction of footwear for
developing feet (presented in Section 9.3).
9.2 Limitations
Content of this chapter is a critical assessment of the overall results. This is carried out
with regard to technical limitations but also non-technical limitations. All aspects are
used to assess the consequences for quality criteria.
9.2.1 Technical limitations
The results of this study must be critically discussed, particularly, in view of the scanner
system and its limitations. The main limitation of the current system is the reduced spa-
tial resolution which is chosen to guarantee the high measurement frequency. The used
binning mode results in a reduced density of the calculated points of the point cloud.
Thus, it can be assumed that some information might be lost. However, the accuracy of
the current system is very high as presented in Appendix A.3 (see Table A.1). Further-
more, the calculation of the root mean square error (or technical error of measurement)
in di�erent spatial resolution modulations provides reliable results. This analysis is per-
formed by measuring a bowling ball in static situation as well as dynamic situations with
146

9.2 Limitations
controlled and varied velocity (see Table A.1). Thus, the validity and reliability of the
scanner system is high and allows the conclusion that the lost information due to reduced
spatial resolution is negligible.
The results of the comparison of di�erent spatial resolutions and measurement situa-
tions show a trend of a higher variance with increasing velocity of the bowling ball. This
is also obvious in the dynamic sequences of the recorded feet. The quality of the 3D
point clouds is reduced when feet move faster. This is the case when the forefoot heads
to touch the ground and also when the hindfoot takes o�. Thus, the interpretation of
foot measures is only legitimated when the respective area is on the ground and thus
movement velocity is lower. This is in line with information, needed for dynamic cus-
tomization of footwear. Hereby, the maximum deformation is relevant which is expected
when the respective foot area has contact with the ground and body weight is operating
on this area.
The technical limitations of the scanner system are also responsible for a high pro-
portion of dropouts. In particular, the illumination of the feet is challenging and very
sensitive for the colour of the skin. The solution for the captured samples was to individ-
ually adjust the illumination of each projector to each subject and situation to ensure best
possible results. Therefore, considerable time was required to scan each foot and some
obtained scans still showed limited quality. The modulation of the illumination could not
be optimally performed for some subjects with dark coloured or irregularly tanned feet,
which led to several dropouts.
The analysis procedure is automated for most of the foot measures. However, some
measures depend on the anatomical landmarks MTH1 and MTH5. These landmarks are
visually detected as a result of the decreased repeatability of the automated calculation.
The repeatability is mainly reduced for the ball angle that relies on both visually detected
landmarks (MTH1 and MTH5). Thus, the applicability of the �ndings regarding the ball
angle is reduced which is taken into account for the formulation of the recommendations.
Another critical aspect is that calculated measures only provide a subset of the infor-
mation, even if the 3D object is available. This can be legitimated by the aim to supply
applicable results for last construction and to improve the �t of footwear. The typical
procedure for the design of lasts is described in Section 3.1. This highlights the reliance
to traditional handcraft. Thus, the focus of the de�ned measures was to derive practically
relevant �ndings for implementation.
147

9 Discussion
The extraction of the maximum out of each dynamic trial must also be critically
considered. This procedure possibly disregards some qualitative information about the
changes during the dynamic phase. The reason for considering the maximum of each foot
measures is that the main aim is to improve the dynamic �t of footwear. Goonetileke et
al. found that more pressure e�ects more discomfort (Goonetilleke et al., 1994). Thus,
the maximum of deformation is relevant to improve the dynamic �t of footwear as it
re�ects the spatial need of the foot during walking.
Future challenge is to develop appropriate software that allows a more comprehensive
interpretation of the roll-over process. For example, surface areas or volumes can provide
additional information which can be used to improve material characteristics or allow the
de�nition of areas where special material characteristics are required.
9.2.2 Non-technical limitations
In general, it is not predictable if the foot would feature the same dynamic characteristics
when it is supported by a shoe that is constructed on the described �ndings. However,
it can be assumed that especially improved material characteristics within the identi�ed
areas can reduce dynamic pressure and friction which is often seen as main reason for
foot deformities or injuries.
Another limitation of the presented results is the high variance within the foot mea-
sures. This is a main challenge for the implementation of the results. Reasons for the
high variance are presented in Section 2.4. A procedure to account for the high variability
of feet and thus to improve the �t of footwear is based on static foot scans presented by
Mauch et al. (Mauch et al., 2009). This is still regarded as the �rst step for the improve-
ment of footwear �t. Building on these static foot types, the dynamic customization can
further enhance footwear �t.
The aim of this thesis is to give recommendations for last construction. For this
reason, the de�cits of lasts have to be speci�ed. Thus, comparisons between already
improved lasts on the base of the mentioned procedure of Mauch et al. (Mauch et al.,
2009) and children feet are conducted to ascertain de�cits of lasts. The comparisons are
performed for lasts of three di�erent foot types for the sizes EU 33 and 37. Detailed
�ndings are presented in the Appendix A.4 (see Table A.2 and Table A.3). In summary
the di�erences are apparent for all shoe sizes and foot types and mainly concern the
construction of MTH1 and MTH5, all girth measures, forefoot width and the design of
148

9.2 Limitations
the toe box (see Appendix A.4, Table A.2 and Table A.3). Especially, the di�erences of
the lateral ball length are alarming and may cause increased pressure along with changed
functional characteristics of the shoe. Another concern is the design of the toe box. The
more pointy shape of the shoe exert pressure toward the �rst and �fth toe. The girth
measures are increased on the lasts. This can be explained by the production-related needs
to remove the last from the manufactured shoe but also the opportunity to individually
adjust this area by lacings. Nonetheless, it is recalled that the girth measures are very
important for holding the foot within the shoe. This must be discussed together with
the allowance in front of the toes. The representative �ndings are particularly important
to con�rm the necessity to give recommendation for last construction.
Nevertheless, it is essential to conduct constructive studies to evaluate the improve-
ment of the dynamic �t of footwear by the presented �ndings. These studies should
be designed for younger and older subjects to identify short-term as well as long-term
e�ects. De�nitely, longitudinal studies in consideration with individual behaviour as well
as genetic dispositions are essential to identify and �nally assess the e�ects of improved
footwear.
9.2.3 Evaluation of quality criteria
The quality criteria based on the classical test theory include objectivity, validity, and
reliability. Considering this classical test theory, it is attempted to derive the true value
on the base of the measurement value. The focus is on the accuracy of measurements,
i.e. the measurement error. Only a small measurement error allows the conclusion that
the method and as a consequence the approximation to the true value is reliable. The
three quality criteria are considered for the �ndings of this thesis.
The objectivity of the �ndings of this thesis is considered by standardizing several pro-
cesses prior to the measurements. The measurement protocol was de�ned and followed
for all measurements. Particular emphasis was placed on equal performance and instruc-
tions of walking and standing tasks. Furthermore, the recording of dynamic situations was
standardized by prede�ning walking speed which was adjusted to body height (Chapter 7,
Table 7.2). The subsequent examination of the foot measures was also standardized and
furthermore operated by one person. The objectivity was further improved regarding
the analysis procedure of the second sample of children and adolescents (see Chapter 7
and Chapter 8). Most of the analysed foot measures were automatically detected and
149

9 Discussion
calculated to ensure the independency of tester. Therefore, it can be concluded that the
objectivity of the obtained results is high.
The validity, as the question of the true value, was determined by recording a bowling
ball in static and dynamic situations and calculating the root mean square error (RMSE),
also known as technical error of measurement (TEM). The results presented in the Ap-
pendix A.3 (see Table A.1) show that the deviance of the measured girth of the bowling
ball is rather small but depends on the situation as well as the modulations. As no com-
parable dynamic scanner system is available the validity of the foot measures must be
indirectly estimated by the evaluation of reliability.
The reliability of the results is a�ected by the analysis procedure. Thus, the repeata-
bility of the analyses procedure was examined. This is performed within a smaller sample
and determined by ICC as well as RMSE (Chapter 7, Table 7.6). Regarding the values
for ICC, the conclusion is that all foot measures o�er a very high reliability. However, the
�ndings must be more critically assessed by the consideration of the values for RMSE. The
RMSE presents values in the same measuring unit as the respective foot measures. Thus,
it can be concluded that the automatically calculated foot measures are highly reliable.
Whereas, the foot measures depending on the visually detected anatomical landmarks
MTH1 and MTH5 o�er restricted reliability. The future aim must be to fully automate
the calculation of all foot measures.
9.3 Recommendations for footwear
All three hypotheses provide an important contribution to better understand the di�er-
ences between static and dynamic foot morphology and thus help to answer the research
question. The design of the second and third study aimed to identify relevant di�er-
ences for last and footwear construction. Thus, the recommendations for footwear and
footwear construction are mainly derived by �ndings of the second and third research
article. Furthermore, it can be stated that these improvements are most important for
shoes of developing feet as they are especially prone to external in�uences.
The special requirements of footwear to satisfy the dynamic �t was already stated by
Golding in 1902: �Boots that may be correct to stand in may not be correct to walk
in.� (Golding, 1902, p. 37). To improve the dynamic �t of footwear, the results of the
study are used in combination with the theoretical background. The recommendations
consider both the construction of lasts as well as the used material for footwear.
150

9.3 Recommendations for footwear
Recommendation 1: Dynamic foot morphology must be considered in footwear con-
struction.
In general, the full weight-bearing situation cannot be used as a quasi-dynamic situa-
tion. There are changes between full weight-bearing and the maximum during walking for
each foot measure. Thus, information about dynamic changes must be used to improve
dynamic �t of footwear.
Recommendation 2: Static foot morphology is the starting point for improving footwear
�t.
The results of the �rst and third research articles recommend using the static value as a
starting point of the improvement of footwear �t. The static values are highly in�uenced
by anthropometric variables like gender age, and body mass and provide a high variability.
The same applies to the maximum values of dynamic foot measures. Furthermore,
these dynamic values can be best predicted by the static values and the variance of
the di�erences between static and dynamic values cannot be explained by the same
anthropometric variables. The recommended two-step procedure to achieve best footwear
�t is to adopt the approach, based on cluster analysis, of Mauch et al. (Mauch, 2007;
Mauch et al., 2009) to account for the variance of feet. The second step is the dynamic
customization. This dynamic customization is speci�ed in recommendation 5. This
procedure is supposed to achieve best static and dynamic �t of footwear. Furthermore, it
is in line with previous suggestions to �t shoes in loaded situations (Cheng et al., 1997).
Recommendation 3: Anthropometric variables must not be considered for dynamic
customization.
There is no need to account for the anthropometric variables gender, age, or body mass
to implement the examined dynamic changes. The variance of the di�erences between
static and dynamic foot morphology cannot be explained by these variables. Therefore,
the dynamic customization can be equally implemented for all shoes.
Recommendation 4: Mean values are not suitable to account for the variance of foot
morphology.
The high variance of the values for the foot measures proposes to use alternatives
to mean values. The presented results show that mean values cannot account for the
variance within foot measures. This is even more obvious when comparing measures
151

9 Discussion
taken on a last with foot measures (see Appendix A.4, Table A.2 and Table A.3). To
account for the variance of foot measures, thresholds must be de�ned using quantiles
(i.e. percentiles). The reason to use quantiles instead of mean values is that there
might be serious restrictions if values are used that cover about the half of the sample.
This comes true when the foot measure is normally distributed, i.e. the median and
the mean value are very close togehter. This must be individually considered for each
foot measure. Furthermore, material charecteristics must be taken into account for this
discussion. Thus, �intelligent� materials could be used, which do not restrict feet that
deform more but also support feet that do not need more space. This can point the way
for future research and material development as well as testing of footwear.
Recommendation 5: Joint consideration of static and dynamic foot morphology for
footwear construction.
Static and dynamic foot measures must be considered for the improvement of shoe
lasts. Both situations are performed within the shoe and no situation should be impeded.
Therefore, static loaded and dynamic values of each foot measure must be considered. It
is important that the customization is discussed individually for each foot measure. The
recommendations for improving footwear �t, based on consideration of foot deformation,
are speci�ed with respect to three aspects. First, the discrepancy between shoe lasts and
children's feet (see Appendix A.4, Table A.2 and Table A.3) is considered. Second, the
tendency of the dynamic change compared to static foot morphology is re�ected. Third,
the relevance of the dynamic changes with regard to repeatability of foot measure as well
as sizing and grading of footwear (discussed in Chapter 7, p. and Table 6, p. ) is taken
into account.
Recommendation 5.1: MTH1 and MTH5 move forward during dynamic situations.
Especially, MTH5 is located too far forward on lasts. The construction of MTH1 and
MTH5 should base on a de�ned area to account for the static and dynamic situations.
Furthermore, to cover the high variance for example 10th percentile of static foot mea-
sures and the 90th percentile of dynamic measures can be used.
Recommendation 5.2: The forefoot width increases during dynamic situations. The
comparison of lasts and feet shows that in general the forefoot width is reduced on lasts.
Furthermore, the widest part on the last is not located at the same area, compared to
152

9.3 Recommendations for footwear
the foot. Two solutions are feasible: First, the last is constructed on the base of the
dynamic maximum (for example 90th percentile). Second, resilient materials, allowing
the widening in this area, are used.
Recommendation 5.3: The midfoot girth measures are reduced during dynamic situ-
ations. On the last, all values of girth measures are higher than the values measured on
the feet. To ensure the necessary hold within the shoe, this must be considered, either by
using improved lacings or by resilient materials. These materials need excellent recovery
properties to optimally support the foot during walking without exerting �rm pressure
during static loaded situation.
Recommendation 5.4: The toe angles increase during dynamic situations which means
that the forefoot is more pointy during walking. The angles measured on lasts are further
increased. The recommendation is to use static values to avoid high lateral pressure
against the toes and thus a de�ection of the toes in static loaded situations.
Recommendation 5.5: The heel width increases during walking. The changes between
static loaded situation and maximum during walking are rather small. The discrepancy
between the used lasts and the children's feet is also small. The lasts should be con-
structed based on the maximum dynamic values of the heel width. However, the need
for action is rather low.
Recommendation 5.6: Instep and ball height are generally higher during dynamic
situations compared to static loaded situations. The height values are higher on lasts.
The reason for that is the possible adjustment of this area due to lacing. Thus, this
discrepancy is not alarming but should be considered with respect to used materials and
lacings. The ball height must be considered with focus on resilient materials.
Recommendation 6: The allowance of about 12 mm is su�cient for all shoe sizes.
The allowance is calculated for each shoe size and is presented in the Appendix A.5 (see
Table A.4 and Table A.5). The sum of foot extension and advance as well as semi-annual
growth rate is rather small and not in�uenced by foot length. However, the used mean
values only account for approximately half of the sample (as the values are normally
distributed). Thus, another calculation approach is used based on the 90th percentile.
153

9 Discussion
These results are novel as it is the �rst approach to calculate the allowance out of scanned
3D data. The conclusion of this calculation is that the foot do not need that much space
for extension and advance. However, the space for growing is very important and as a
consequence the �t of children's shoes must be regularly checked. The amount of the
toe allowance is smaller than previously assumed. There is very little literature that gives
data for the amount of the toe allowance. The suggestions from Maier and Killmann
are generated from footprints and thus the approximated values are higher (Maier and
Killmann, 2003).
154

10 Conclusion and perspectives
This thesis presents di�erent aspects to answer the question of how foot morphology
di�ers between static and dynamic situations. The answer to that question is signi�cant
from di�erent perspectives: First, the �ndings contribute to the �eld of fundamental
research, as there is still a lack of three-dimensional data for dynamic foot morphology.
Second, the comparison of static and dynamic foot morphology can help to improve
the �t of footwear and thus contribute to applied research in the �eld of footwear sci-
ence. Recent advancements in scanner technology and the development of a dynamic
foot scanner system (DynaScan4D) are preconditions for this thesis. Furthermore, liter-
ature based considerations are used to formulate the hypothesis but also to allow giving
recommendations for the construction of lasts and footwear.
In Chapter 2, the anatomical and functional basics of the foot are described with focus
on functional characteristics. In this context, the developmental processes are outlined
which strongly interact with functional changes due to upright standing and walking.
The challenge of �the shoe� that �ts is re�ected in the last section of this chapter which
discusses the variety of foot shapes with reference to the inter-individual di�erences.
Finally, known intra-individual di�erences are highlighted.
Chapter 3 presents fundamentals of footwear, starting with basic knowledge of how
a shoe arises. Feet are as diverse as each fashion taste, thus, shoe manufacturers are
compelled to produce di�erent sizes. The aspects of sizing and grading are discussed
with a view to standardization. Even if several sizes, widths, and shapes of shoes are
available, not every foot is optimally supported by intent or grossly negligent behaviour.
Thus, knowledge about the e�ects of shoes on feet but also knowledge about footwear �t
is elaborated based on current literature. As it is stated that foot shape and shoe or last
shape must be matched, it goes back to the point of measuring feet by basic methods
but also current approaches of dynamic scanning.
On the base of the literature, three hypotheses are formulated in Chapter 4. These
hypotheses provide relevant contributions to the research questions. The �rst hypothesis
155

10 Conclusion and perspectives
is that there are di�erences in dynamic foot morphology of adults according to age, gen-
der, and body mass. This hypothesis was veri�ed within Chapter 6. The analysis of 129
adult feet during walking showed that there are di�erences which must be di�erentiated.
The second hypothesis is veri�ed within Chapter 7. Dynamic foot morphology of
developing feet di�ers from static foot morphology. This was proven for all foot measures;
however, the di�erences vary depending on the foot measure. The relevance of these
di�erences was assessed with regard to the sizing and grading systems but also to the
values for the error (RMSE).
In Chapter 8, the third hypothesis was evaluated. The hypothesis that gender, age,
and body mass a�ect the dynamic foot morphology and the di�erences between static
and dynamic foot morphology of developing feet was veri�ed. However, the in�uences of
anthropometric variables are more complex. In general, for the maximum during walking
they are comparable to the in�uences on the static foot morphology. The variance of the
di�erence between static and dynamic foot morphology cannot be su�ciently explained
by gender, age, and body mass.
The con�rmation of the hypotheses is summarized and the contribution to the research
question is re�ected in Chapter 9. This chapter additionally includes critical considera-
tions of the results with reference to technical and non-technical limitations. Furthermore,
the quality criteria, objectivity, validity, and reliability, are discussed. The results mainly
obtained from the second sample (Chapter 7 and Chapter 8) in combination with litera-
ture review and practical aspects but also in consideration of the limitations are used to
provide recommendations for the improvement of the dynamic �t of footwear.
The �ndings of this thesis are important to improve basic knowledge of foot deforma-
tion. Furthermore, the elaborated recommendations can contribute to further improve-
ments for comfortable and functional footwear. Even if these �ndings must be validated
by other scanner systems, it can be stated that they contribute to healthy feet which is
essential during development.
A high potential to improve footwear �t might be reached by material characteristics
which can be implemented in de�ned areas. To achieve this, the analysis approach of
the 3D scan data must be further developed, i.e. description of surface deformation or
calculation of volumes. However, the presented �ndings can encourage last designers and
shoe manufacturers to implement these aspects and probably pursue new approaches for
standardization.
156
The aim of further studies should be to evaluate the dynamic �t of footwear. For that
reason, prototype shoes must be constructed and several standardized tests as well as sur-
veys should be performed. In terms of detailed and reliable feedback, it is recommended
to perform this evaluation of improved footwear with adolescents or adults. The reason
for this can be found in the not fully matured sensor function of children's feet which
might confound the evaluation. Furthermore, a considerable scienti�c bene�t would be
to investigate the long term e�ect of these shoes. This is undoubtedly challenging but
also pro�table regarding the economic burdens of the health care systems, caused by foot
problems.
This thesis shows an area of application for dynamic scanner systems in which bene�cial
�ndings were generated on the base of comprehensive samples. Additionally, it provides
suggestions regarding further development of dynamic foot scanner systems. The calcu-
lation of the foot measures must be optimized, in terms of automation, to ensure the
reliability of the foot measures. Furthermore, additional information about the quality of
footwear for example by interpretation of the path of curves, or the assessment of the
surface deformation of special areas can improve the understanding of foot deformation
and the requirements within a shoe.
Regarding the scanner technology, it would be bene�cial to supply a higher resolution
but also a higher measurement frequency. These advancements would allow capturing
faster and also highly demanding movements. To this end, further studies can provide a
substantial contribution for functional footwear in the �eld of safety or sport shoes.
Finally, the �ndings of this thesis can contribute to the health of us all. Hopefully, some
sensitising details serve suggestions to think about our feet before they are hurting and
before serious health implications arise. From an evolutionary perspective, provocatively,
it cannot be our aim that once our feet look like our shoes as �Nature does nothing in
vain� as Aristotle (384-322 B.C.) said (Columbia World of Quotations, 1996).
157


Reference list
Adrian, K. C. (1991). American last making. Procedures, scale comparison, sizing and
grading information, basic shell layout, bottom equipment standards. Arlington,
MA, USA: Shoe Trade Publishing.
Aerts, P., Ker, R. F., De Clercq, D., Ilsley, D. W. and Alexander, R. (1995). The
mechanical properties of the human heel pad: a paradox resolved. J. Biomech.,
28, 1299-1308.
Aiken, L. S., West, S. G. Reno, R. R. (1991). Multiple regression: Testing and interpret-
ing interactions. Sage Publications, Inc.
Alvarez, C., De Vera, M., Chhina, H. and Black, A. (2008). Normative data for the
dynamic pedobarographic pro�les of children. Gait & Posture, 28, 309-315.
Anderson, M., Blais, M. M. and Green, W. T. (1956). Lengths of the growing foot. J.
Bone Joint Surg. Am., 38-A, 998-1000.
Anetzberger, H. and von Liebe, A. (2000). Entwicklung und funktionelle Anatomie des
kindlichen Fusses. Orthopädieschuhtechnik, 12, 41-43.
Anil, A., Peker, T., Turgut, H. B. and Ulukent, S. C. (1997). An examination of the
relationship between foot length, foot breath, ball girth, height and weight of
Turkish university students aged between 17 and 25. Anthropol. Anz., 55, 79-87.
Appell, H. J. and Stang-Voss, C. (2008). Funktionelle Anatomie: Grundlagen sportlicher
Leistung und Bewegung. Berlin: Springer Verlag.
Arndt, A., Westblad, P., Winson, I., Hashimoto, T. and Lundberg, A. (2004). Ankle
and subtalar kinematics measured with intracortical pins during the stance phase
of walking. Foot and Ankle Int., 25, 357-364.
Baehler, A. (1986). Einlagenversorgung des kindlichen Knick-Senkfuÿes. Orthopädie,
15, 205-211.
Barisch-Fritz, B. and Mauch, M. (2013). Foot development in children and adolescents.
In A. Luximon (Ed). Handbook of footwear design and manufacture. Cambridge:
Woodhead Publishing.
159

Reference list
Barisch-Fritz, B., Schmeltzpfenning, T., Plank, C., Hein, T. and Grau, S. (2013). The
e�ects of gender, age, and body mass on dynamic foot shape and foot deformation
in children and adolescents. Footwear Sci., in Press.
Bataller, A., Alcantara, E., Gonzalez, J. C., Garcia, A. C. and Alemany, S. (2001).
Morphological grouping of Spanish feet using clustering techniques. Proceeding of
the 7th Symposium on Footwear Biomechanics. Zürich, Schweiz.
Beilby, G. T. (1921). Aggregation and �ow of solids. London: Macmillan.
Bertani, A., Cappello, A., Benedetti, M. G., Simoncini, L. and Catani, F. (1999). Flat
foot functional evaluation using pattern recognition of ground reaction data. Clin.
Biomech., 14, 484-493.
Bhatia, S., Sarkar, A., Bansal, N. and Gupta, T. (2010). Comparative study of non-obese
and obese normal children feet using various external foot measurements and foot
print. Physiotherapy and Occupational Therapy Journal, 3, 49-56.
Birtane, M. and Tuna, H. (2004). The evaluation of plantar pressure distribution in obese
and non-obese adults. Clin. Biomech. (Bristol., Avon.), 19, 1055-1059.
Blanc, Y., Balmer, C., Landis, T. and Vingerhoets, F. (1999). Temporal parameters and
patterns of the foot roll over during walking: normative data for healthy adults.
Gait and Posture, 10, 97-108.
Bland, J. M. and Altman, D. G. (1995). Multiple signi�cance tests: the Bonferroni
method. BMJ, 310, 170.
Blattner, M. (2007). Fachbuch. Alles über Schuhe. Liestal: Lüding AG.
Blenkinsopp, R., Harland, A., Price, D., Lucas, T. and Roberts, J. (2012). A Method
to Measure Dynamic Dorsal Foot Surface Shape and Deformation During Linear
Running Using Digital Image Correlation. Procedia Engineering, 34, 266-271.
Bojsen-Moller, F. and Flagstad, K. E. (1976). Plantar aponeurosis and internal architec-
ture of the ball of the foot. J. Anat., 121, 599.
Bosch, K., Gress, J. and Rosenbaum, D. (2007). Preliminary normative values for foot
loading parameters of the developing child. Gait and Posture, 26, 239-247.
Bosch, K. and Rosenbaum, D. (2010). Gait symmetry improves in childhood - a 4-year
follow-up of foot loading data. Gait and Posture, 32, 464-468.
Brinckmann, P., Frobin, W., Leivseth, G. and Drerup, B. (2012). Orthopädische Biomechanik.
Münster: MV-Verlag.
Carlsoo, S. and Wetzenstein, H. (1968). Change of form of the foot and the foot skeleton
160

Reference list
upon momentary weight-bearing. Acta Orthop. Scand., 39, 413-423.
Cashmere, T., Smith, R. and Hunt, A. (1999). Medial longitudinal arch of the foot:
stationary versus walking measures. Foot Ankle Int., 20, 112-118.
Cavanagh, P. R. (1980). The running shoe book. Mountain View, CA: Anderson World.
Cavanagh, P. R. (1999). Plantar soft tissue thickness during ground contact in walking.
J. Biomech., 32, 623-628.
Cavanagh, P. R., Rodgers, M. M. and Iiboshi, A. (1987). Pressure distribution under
symptom-free feet during barefoot standing. Foot Ankle, 7, 262-276.
Chen, H., Nigg, B. M. and De Koning, J. (1994). Relationship between plantar pressure
distribution under the foot and insole comfort. Clin. Biomech., 9, 335-341.
Chen, J. P., Chung, M. J. and Wang, M. J. (2009). Flatfoot Prevalence and Foot
Dimensions of 5- to 13-Year-Old Children in Taiwan. Foot Ankle Int., 30, 326-332.
Cheng, J. C. Y., Leung, S. S. F., Leung, A. K. L., Guo, X., Sher, A. & Mak, A. F. K.
(1997). Change of foot size with weightbearing; A Study of 2829 Children 3 to 18
years of age. Clin. Orthop. Relat. Res., 342, 123-131.
Cheskin, M. P. (1987). The complete handbook of athletic footwear. New York: Fairchild
Publications.
Chung, M. J. and Wang, M.J., 2012. Gender and walking speed e�ects on plantar
pressure distribution for adults aged 20-60 years. Ergonomics, 5, 194-200.
Columbia World of Quotations (1996). Columbia University Press, 23 Sep. 2013. Dictio-
nary.com http://quotes.dictionary.com/Nature_does_nothing_in_vain.
Coudert, T., Vacher, P., Smits, C. and van der Zande, M. (2006). A method to obtain
3D foot shape deformation during the gait cycle. Ninth International Symposium
on the 3D Analysis of Human Movement. Valenciennes, France.
Cummins, H. (1929). The topographic history of the volar pads (walking pads; tastballen)
in the human embryo. Contrib. Embryol., 20, 103-126.
D'Aout, K., Pataky, T., De Clercq, D. and Aerts, P. (2009). The e�ect of habitual
footwear use: foot shape and function in native barefoot walkers. Footwear Sci.,
1, 81-94.
D'Apuzzo, N. (2007). 3D body scanning technology for fashion and apparel industry.
SPIE 6491. SPIE-IS&T Electronic Imaging, Videometrics IX. San Jose.
Daneshmandi, H., Rahnema, N. and Mehdizadeh, R. (2009). Relationship between obe-
sity and �atfoot in high-school boys and girls. Int. J. Sports Sci. Med., 3, 43-49.
161

Reference list
De Clercq, D., Aerts, P. and Kunnen, M. (1994). The mechanical characteristics of the
human heel pad during foot strike in running: An in vivo cineradiographic study.
J. Biomech., 27, 1213-1222.
DeAsla, R. J. and Deland, J. T. (2004). Anatomy and biomechanics of the foot and ankle.
In D. B. Thordarson (Ed): Foot and ankle. Philadelphia: Lippincott Williams and
Wilkins.
Debrunner, H. U. (1965). Wachstum und Entwicklung des Fuÿes beim Jugendlichen.
Stuttgart: Enke.
DiMeglio, A. (2001). Growth in pediatric orthopaedics. J. Pediatr. Orthop., 21, 549-555.
Dowling, A., Steele, J. and Baur, L. (2005). How does obesity and gender a�ect foot
shape and structure in children. ISB XXth Congress. Cleveland, USA.
Dowling, A. M., Steel, J. R. and Baur, L. A. (2001). Does obesity in�uence foot structure
and plantar pressure patterns in prepubescent children? Int. J. Obesity, 25, 845-
852.
Dowling, A. M., Steele, J. R. and Baur, L. A. (2004). What are the e�ects of obesity in
children on plantar pressure distributions? Int. J. Obesity, 28, 1514-1519.
Drenckhahn, D. (2003). Zellenlehre. Benningho�-Drenckhahn Anatomie. München/Jena:
Urban and Fischer.
Drennan, J. C. (1992). Anatomy. In J. C. Drennan (Ed) The child foot and ankle.. New
York: Raven Press, Ltd.
Echarri, J. J. and Forriol, F. (2003). The development in footprint morphology in 1851
Congolese children from urban and rural areas, and the relationship between this
and wearing shoes. J. Pediatric Orthopaed. B, 12, 141-146.
Elftman, H. (1939). Forces and energy changes in the leg during walking. Am. J.
Physiol., 125, 339-356.
Emslie, M. (1939). Prevention of foot deformities in children. The Lancet, 234, 1260-
1263.
Evans, A. M. (2011). The paediatric �at foot and general anthropometry in 140 Aus-
tralian school children aged 7-10 years. J. Foot Ankle Res., 4, 1-8.
Filippin, N. T., Barbosa, V. L. P., Sacco, I. C. N. and Lobo da Costa, P. H. (2007).
E�ects of obesity on plantar pressure distribution in children. Revista Brasileira de
Fisioterapia, 11, 495-501.
Fixsen, J. A. (1998). Problem feet in children. J. R. Soc. Med., 91, 18-22.
162

Reference list
Forriol, F. and Pascual, J. (1990). Footprint analysis between three and seventeen years
of age. Foot Ankle, 11, 101.
Frankowski, G., Chen, M. and Huth, T. (2000). Real-time 3D Shape Measurement
with Digital Stripe Projection by Texas Instruments Micromirror Devices DMD.
Proceedings SPIE 3958, 90-106.
Freedman, D. S. and Sherry, B. (2009). The validity of BMI as an indicator of body
fatness and risk among children. Pediatrics, 124, S23.
Frey, C. (2000). Foot health and shoewear for women. Clin. Orthop. Relat. Res., 32-44.
Fritz, B., Schmeltzpfenning, T., Plank, C., Hein, T. and Grau, S. (2013). Anthropometric
in�uences on dynamic foot shape: Measurements of plantar three-dimensional foot
deformation. Footwear Sci., 5, 121-129.
Fukano, M. and Fukubayashi, T. (2012). Gender-based di�erences in the functional
deformation of the foot longitudinal arch. Foot (Edinb.), 22, 6-9.
Gajeweski, R. (1999). Anthropometrical measurements of Polish children´s feet. Zlin.
1st Technical Meeting. Czech Republic.
García-Rodríguez, A., Martín-Jiménez, F., Carnero-Varo, M., Gómez-Gracia, E., Gómez-
Aracena, J. and Fernández-Crehuet, J. (1999). Flexible �at feet in children: a real
problem? Pediatrics, 103, 84.
Gefen, A. (2003). The in vivo elastic properties of the plantar fascia during the contact
phase of walking. Foot Ankle Int., 24, 238-244.
Gefen, A., Megido-Ravid, M., Itzchak, Y. and Arcan, M. (2001). Biomechanical Analysis
of the Three-Dimensional Foot Structure During Gait: A Basic Tool for Clinical
Applications. J. Biomech. Eng., 122, 630-639.
Golding, F. Y. (1902). The manufacture of boots and shoes. London: Kessinger Legacy
Reprint.
González, J. C., Olaso, J., Alemany, S., Garrido, D., Domin, M., Such, M. J., Carcia,
A. C. and Vera P. (2005).Footwear´s in�uence on young children´s gait pattern.
Hamill, J., Hardin, E., and Williams, K. Proceeding of the 7th Symposium on
Footwear Biomechanics. Zürich, Schweiz.
Goonetilleke, R. S. and Eng, T. J. (1994). Contact area e�ects on discomfort. Pro-
ceedings of the Human Factors and Ergonomics Society Annual Meeting 38, Santa
Monics, USA, 688-690.
Goonetilleke, R. S., Luximon, A. and Kwok, L. T. (2000). The quality of footwear �t:
163
Reference list
What we know, don't know and should know. Proceedings of the IEA 2000/HFES
2000 Congress.
Goonetilleke, R. S. and Luximon, A. (2001). Designing for comfort: a footwear applica-
tion. Proceedings of the computer-aided ergonomics and safety conference, Maui,
USA.
Götz, W. (2001). Funktionelle Anatomie des Fuÿes. In R. Baumgartner and H. Stinus
(Eds): Die orthopädietechnische Versorgung des Fuÿes. Stuttgart; New York:
Thieme.
Gould, N., Moreland, M., Trevino, S., Alvarez, R., Fenwick, J. and Bach, N. (1990).
Foot growth in children age one to �ve years. Foot Ankle, 10, 211-213.
Gravante, G., Russo, G., Pomara, F. and Ridola, C. (2003). Comparison of ground
reaction forces between obese and control young adults during quiet standing on
a baropodometric platform. Clin. Biomech. (Bristol., Avon.), 18, 780-782.
Greisberg, J. (2007). Foot and ankle anatomy and biomechanics (pp. 1-9). In C. W.
DiGiovanni and J. Greisberg (Eds): Core knowledge in orthopaedics: Foot and
ankle. Philadelphia: Elsevier.
Grundy, M., Tosh, P. A., McLeish, R. D. and Smidt, L. (1975). An investigation of
the centres of pressure under the foot while walking. J. Bone Joint Surg., British
Volume, 57, 98-103.
Grünewald, K. (2002). Theorie der medizinischen Fuÿbehandlung. München: Verlag
Neuer Merkur.
Hausdor�, J. M., Zemany, L., Peng, C. and Goldberger, A. L. (1999). Maturation of gait
dynamics: stride-to-stride variability and its temporal organization in children. J.
Appl. Physiol., 86, 1040-1047.
Hawes, M. R., Nachbauer, W., Sovak, D. and Nigg, B. M. (1992). Footprint parameters
as a measure of arch height. Foot Ankle, 13, 22-26.
Hawes, M. R. and Sovak, D. (1994). Quantitative morphology of the human foot in a
North American population. Ergonomics, 37, 1213-1226.
Hefti, F. (2000). Deviations in the axes of the lower extremities. Der Orthopäde, 29,
814.
Hefti, F. and Brunner, R. (1999). Flexible arch of the foot. Der Orthopäde, 28, 159-172.
Hennig, E. M. and Milani, T. L. (1993). The tripod support of the foot. An analysis of
pressure distribution under static and dynamic loading. Zeitschrift für Orthopädie
164

Reference list
und ihre Grenzgebiete, 131, 279-284.
Hennig, E. M. and Rosenbaum, D. (1991). Pressure distribution patterns under the feet
of children in comparison with adults. Foot Ankle, 11, 306-311.
Hennig, E. M., Staats, A. and Rosenbaum, D. (1994). Plantar pressure distribution
patterns of young school children in comparison to adults. Foot Ankle Int., 15,
35-40.
Hicks, J. H. (1954). The mechanics of the foot: II. The plantar aponeurosis and the
arch. J. Anat., 88, 25.
Hills, A. P., Hennig, E. M., Byrne, N. M. and Steele, J. R. (2002). The biomechanics
of adiposity structural and functional limitations of obesity and implications for
movement. Obesity Rev., 3, 35-43.
Hills, A. P., Hennig, E. M., McDonald, M. and Bar-Or, O. (2001). Plantar pressure
di�erences between obese and non-obese adults: a biomechanical analysis. Int. J.
Obesity, 25, 1674-1679.
Hoe�ing, R. and Ahl, E. (2004). ALP: universal DMD controller for metrology and
testing. Proceedings SPIE, 5289, Electronic Imaging, 322-329.
Hong, Y., Wang, L., Xu, D. Q., 2013. Gender di�erences in foot shape: a study of
Chinese young adults. Sports Biomechanics, 10, 85-97.
Houston, V. L., Luo, G., Mason, C. P., Mussman, M., Garbarini, M. & Beattie, A. C.
(2006). Changes in male foot shape and size with weightbearing. J. Am. Podiatric
Med. Assoc., 96, 330-343.
Hsu, C. C., Tsai, W. C., Chen, C. P. C., Shau, Y. W., Wang, C. L., Chen, M. J. L. and
Chang, K. J. (2005). E�ects of aging on the plantar soft tissue properties under
the metatarsal heads at di�erent impact velocities. Ultrasound Med. Biol., 31,
1423-1429.
Hsu, T. C., Wang, C. L., Tsai, W. C., Kuo, J. K. and Tang, F. T. (1998). Comparison of
the mechanical properties of the heel pad between young and elderly adults. Arch.
Phys. Med. Rehabil., 79, 1101-1104.
ISO 7250 (1996). Basic human body measurements for technology design. International
Organisation of Standardization.
ISO 9407 (1991). Shoe sizes - Monodpoint system of sizing and marking. International
Organisation of Standardization.
Jani, L. (1986). Pediatric �atfoot. Der Orthopäde, 15, 199.
165

Reference list
Janisse, D. J. (1992). The art and science of �tting shoes. Foot Ankle, 13, 257-262.
Jerosch, J. and Mamsch, H. (1998). Deformities and misalignment of feet in children--a
�eld study of 345 students]. Zeitschrift für Orthopädie und ihre Grenzgebiete, 136,
215.
Jezersek, M. and Mozina, J. (2009). High-speed measurement of foot shape based on
multiple-laser-plane triangulation. Optical Engineering 48, 113604.
Jiménez-Ormeno, E., Aguado, X., Delgado-Abellán, L., Mecerreyes, L. & Alegre, L. M.
(2013). Foot morphology in normal-weight, overweight, and obese schoolchildren.
Eur. J. Pediatrics, 1-8.
Joneja, A. and Kit, F. S. (2013). Computer-aided design of footwear (pp. 213-260). In
R. S. Goonetilleke (Ed): The science of footwear. Boca Raton: Taylor and Francis.
Jordan, C., Payton, C. and Bartlett, R. (1997). Perceived comfort and pressure distribu-
tion in casual footwear. Clin. Biomech., 12, 5.
Kelikian, A. S. and Sarra�an, S. (2011). Sarra�an's Anatomy of the Foot and Ankle:
Descriptive, Topographic, Functional. Lippincott Williams and Wilkins.
Kenedi, R. M., Gibson, T., Evans, J. H. and Barbenel, J. C. (1975). Tissue mechanics.
Phys. Med. Biol., 20, 699.
Ker, R. F., Bennett, M. B., Bibby, S. R., Kester, R. C. and Alexander, R. M. (1987).
The spring in the arch of the human foot. Nature, 325, 147-149.
Kernozek, T. W. and LaMott, E. E. (1995). Comparisons of plantar pressures between
the elderly and young adults. Gait & Posture, 3, 143-148.
Kimura, M., Mochimaru, M. and Kanade, T. (2009). Measurement of 3D Foot Shape
Deformation in Motion. International Conference on Computer Graphics and In-
teractive Techniques. Proceedings of the 5th ACM/IEEE International Workshop
on Projector camera systems. New York, USA.
Kimura, M., Mochimaru, M. and Kanade, T. (2011). 3D measurement of feature cross-
sections of foot while walking. Machine Vision and Applications, 22, 377-388.
Kimura, M., Mochimaru, M., Kouchi, M., Saito, T. and Kanade, T. (2005). 3D cross-
sectional shape measurement of the foot while walking. Proceedings of the 7th
Symposium on Footwear Biomechanics, Cleveland, USA.
Klein, C., Groll-Knapp, E., Kindi, M. and Kinz, W. (2009). Increased hallux in children
and its association with insu�cient length of footwear: A community based cross-
sectional study. BMC Musculoskelet. Disord., 10, 1-7.
166

Reference list
Koebke, J. (1993). Funktionelle Anatomie der unteren Extremität, speziell der Fuÿ.
Sportverletz. Sportschaden, 7, 163-166.
Kouchi, M. (1995). Analysis of foot shape variation based on the medial axis of foot
outline. Ergonomics, 38, 1911-1920.
Kouchi, M. (1998). Foot dimensions and foot shape: di�erences due to growth, genera-
tion and ethnic origin. Anthropol. Sci., 106, 161-188.
Kouchi, M., Kimura, M. and Mochimaru, M. (2009). Deformation of foot cross-section
shapes during walking. Gait and Posture, 20, 482-486.
Kouchi, M., Mochimaru, M., Nogawa, H. and Ujihashi, S. (2005). Morphological �t of
running shoes, Perception and Physical Measurements. Proceedings of the 7th
Symposium on Footwear Biomechanics, Cleveland, USA, 38-39.
Krauss, I. (2006). Frauenspezi�sche Laufschuhkonzeption. Eine Betrachtung aus klin-
ischer, biomechanischer und anthropometrischer Sicht. Dissertation, Fakultät für
Sozial- und Verhaltenswissenschaften der Eberhard-Karls-Universität Tübingen.
Krauss, I., Grau, S., Mauch, M., Maiwald, C. and Horstmann, T. (2008). Sex-related
di�erences in foot shape. Ergonomics, 51, 1693-1709.
Krauss, I. and Mauch, M. (2013). Foot morphology. In R. S. Goonetilleke (Ed): The
science of footwear. Boca Raton: Taylor and Francis Group.
Krauss, I., Valiant, G., Horstmann, T. and Grau, S. (2010). Comparison of female foot
morphology and last design in athletic footwear -are men's lasts appropriate for
women? Res. Sports Med., 18, 140-156.
Kristen, H. (1968). Der Kinderfuÿ in Österreich. Zeitschrift für Orthopädie und ihre
Grenzgebiete, 104, 318-333.
Kristen, K. H., Kastner, J., Holzreiter, S., Wagner, P. and Engel, A. (1998). Funk-
tionelle Beurteilung von Kinderschuhen anhand der Ganganalyse von Kindern im
Lau�ernalter. Zeitschrift für Orthopädie, 136, 457-462.
Kromeyer-Hauschild, K., Wabitsch, M., Kunze, D., Geller, F., Geiÿ, H. C., Hesse, V., von
Hippel, A., Jaeger, U., Johnson, D., Korte, W., Menner, K., Müller, G., Müller, J.
M., Niemann-Pilatus, A., Remer, T., Schaefer, F., Wittchen, H.-U., Zabransky, S.,
Zellner, K., Ziegler, A. and Hebebrabd, J. (2001). Perzentilen für den Body-mass-
Index für das Kindes- und Jugendalter unter Heranziehung verschiedener deutscher
Stichproben. Monatsschrift Kinderheilkunde, 8, 807-818.
Kwan, R. L. C., Zheng, Y. P. and Cheing, G. L. Y. (2010). The e�ect of aging on the
167

Reference list
biomechanical properties of plantar soft tissues. Clin. Biomech., 25, 601-605.
Larrabee, W. F. (1986). A �nite element model of skin deformation. I. Biomechanics of
skin and soft tissue: A review. The Laryngoscope, 96, 399-405.
Leardini, A., Chiari, L., Della, C. U. and Cappozzo, A. (2005). Human movement
analysis using stereophotogrammetry. Part 3. Soft tissue artifact assessment and
compensation. Gait and Posture, 21, 212-225.
Leardini, A., Sawacha, Z., Paolini, G., Ingrosso, S., Nativo, R. & Benedetti, M. G. (2007).
A new anatomically based protocol for gait analysis in children. Gait and Posture,
26, 560-571.
Ledoux, W. R. and Blevins, J. J. (2007). The compressive material properties of the
plantar soft tissue. J. Biomech., 40, 2975-2981.
LeVeau, B. F. and Bernhardt, D. B. (1984). Developmental Biomechanics E�ect of
Forces on the Growth, Development, and Maintenance of the Human Body. Phys.
Therapy, 64, 1874-1882.
Lion Systems S.A. Dynamic FootMorphology. www.lionssystem.lu . Zugri� am 05.07.2013.
Lloyd, D. G., Besier, T. F., Winby, C. R. and Bachanan, T. S. (2008). Neuromuscu-
loskeletal modelling and simulation of tissue load in the lower extremities. In Y.
Hong and R. Bartlett (Eds): Handbook of biomechanics and human movement
science. New York: Taylor and Francis.
Logan, A. L. (1995). The foot and ankle: Clinical application. Gaithersburg: Aspen
Publication.
Lundgren, P., Nester, C., Liu, A., Arndt, A., Jones, R., Staco�, A., Wolf, P. and Lund-
berg, A. (2008). Invasive in vivo measurement of rear-, mid- and forefoot motion
during walking. Gait & Posture, 28, 93-100.
Luo, G., Houston, V. L., Mussman, M., Garbarini, M. and Beattie, A. C. (2009). Com-
parison of Male and Female Foot Shape. J. Am. Podiatric Med. Assoc., 99,
383-390.
Luximon, A., Goonetilleke, R. S. and Tsui, K. L. (2001). A �t metric for footwear
customization. Proceedings of the 2001 World Congress on Mass Cusomization
and Personalization. Hon Kong, China.
Luximon, A. and Luximon, Y. (2009). Shoe-last design innovation for better shoe �tting.
Comput. Ind., 60, 621-628.
Luximon, A. and Luximon, Y. (2013). Shoe-last design and development. In R. S.
168

Reference list
Goonetilleke (Ed): The science of footwear. Boca Raton: Taylor and Francis
Group.
Maier, E. (1999). Über den Gestaltwandel der kindlichen Beine und Füÿe. Orthopädi-
eschuhtechnik, 4, 24-30.
Maier, E., Bareis, M., Bickel, C., Dhom, G., Pfanebecker, B. and Wahle, R. (1980). Die
Reifung des Kinderfuÿes. Tagung der Deutschen Gesellschaft für Orthopädie und
Traumtologie. Tagung der Deutschen Gesellschaft für Orthopädie und Traumtolo-
gie. Münster, Deutschland.
Maier, E. and Killmann, M. (2003). Kinderfuÿ und Kinderschuh. Entwicklung der
kindlichen Beine und Füÿe und die Anforderung an den fuÿgerechten Schuh. München:
Verlag Neuer Merkur.
Manna, I., Pradhan, D., Ghosh, S., Kumar Kar, S. and Dhara, P. (2001). A Comparative
Study of Foot Dimension between Adult Male and Female and Evaluation of Foot
Hazards due to Using of Footwear. J. Physiol. Antrhop. Anthropol. Applied Hum.
Sci., 20, 241-246.
Matthews, J. G. (1998). The developmental anatomy of the foot. The Foot, 8, 17-25.
Mattingly, B., Talwalkar, V., Tylkowski, C., Stevens, D. B., Hardy, P. A. and Pienkowski,
D. (2006). Three-dimensional in vivo motion of adult hind foot bones. J. Biomech.,
39, 726-733.
Mauch, M. (2007). Kindliche Fuÿmorphologie. Ein Typisierungsmodell zur Erfassung der
dreidimensionalen Fuÿform im Kindesalter. Saarbrücken: VDM Verlag Dr. Müller.
Mauch, M., Grau, S., Krauss, I., Maiwald, C. and Horstmann, T. (2008). Foot morphol-
ogy of normal, underweight and overweight children. Int. J. Obesity (Lond), 32,
1068-1075.
Mauch, M., Grau, S., Krauss, I., Maiwald, C. and Horstmann, T. (2009). A new approach
to children's footwear based on foot type classi�cation. Ergonomics, 52, 999-1008.
McGraw, B., McClenaghan, B. A., Williams, H. G., Dickerson, J. and Ward, D. S. (2000).
Gait and postural stability in obese and nonobese prepubertal boys. Arch. Physical
Med. Rehab., 81, 484-489.
McGraw-Hill Concise Dictionary of Modern Medicine (2002). The McGraw-Hill Compa-
nies, Inc. Zugri� am 09.07.2013.
McPoil, T. G. and Cornwall, M. W. (2006). Use of plantar contact area to predict
medial longitudinal arch height during walking. J. Am. Podiatric Med. Assoc., 96,
169

Reference list
489-494.
Menz, H. (2004). Two feet, or one person? Problems associated with statistical analysis
of paired data in foot and ankle medicine. The Foot, 14, 2-5.
Menz, H. B. and Morris, M. E. (2005). Footwear characteristics and foot problems in
older people. Gerontology, 51, 346-351.
Menz, H. B. and Morris, M. E. (2006). Clinical determinants of plantar forces and
pressures during walking in older people. Gait & Posture., 24, 229-236.
Merriam Webster (2002). Webster's Third International Dictionary.
Meyer, H. (1888). Zur Schuhfrage. Zeitschrift für Hygiene, 3, 487-507.
Michel, F., Kälin, X., Metzger, A., Westphal, K., Schweizer, F., Campe, S. and Segesser,
B. (2009). The Functional sport shoe parameter "Torsion" within Running Shoe
research - a Literatur Review. Sportverletz. Sportschaden, 23, 197-205.
Mickle, K. J., Munro, B. J., Lord, S. R., Menz, H. B. and Steele, J. R. (2010). Foot
shape of older people: implications for shoe design. Footwear Sci., 2, 131-139.
Mickle, K. J., Steele, J. R. and Munro, B. J. (2006a). Does excess mass a�ect plantar
pressure in young children? Int. J. Pediatric Obesity, 1, 183-188.
Mickle, K. J., Steele, J. R. and Munro, B. J. (2006b). The feet of overweight and obese
young children: are they �at or fat? Obesity (Silver.Spring), 14, 1949-1953.
Mickle, K. J., Steele, J. R. and Munro, B. J. (2008). Is the foot structure of preschool
children moderated by gender? J. Pediatric Orthop., 28, 593-596.
Miller, J. E., Nigg, B. M., Liu, W., Stefanyshyn, D. J. and Nurse, M. A. (2000). In�uence
of foot, leg and shoe characteristics on subjective comfort. Foot Ankle Int., 21,
759-767.
Miller, R. G. (1989). Manual of shoemaking. England-Clarks Ltd.
Mitchell, S. R., Jones, R. and Newman, S. T. (1995). A structured approach to design
the design of shoe lasts. J. Eng. Des., 6, 149-166.
Morio, C., Lake, M. J., Gueguen, N., Rao, G. and Baly, L. (2009). The in�uence of
footwear on foot motion during walking and running. J. Biomech., 42, 2081-2088.
Morley, A. J. M. (1957). Knock-knee in children. Br. Med. J., 2, 976.
Morrison, S. C., Durward, B. R., Watt, G. F. and Donaldson, M. D. C. (2007). Anthro-
pometric Foot Structure of Peripubescent Children with Excessive versus Normal
Body Mass A Cross-sectional Study. J. Am. Podiatric Med. Assoc., 97, 366-370.
Mündermann, A., Nigg, B. M., Humble, R. N. and Stefanyshyn, D. J. (2003). Orthotic
170

Reference list
comfort is related to kinematics, kinetics, and EMG in recreational runners. Med.
Sci. Sports Exercise, 195, 3510-1710.
Mündermann, A., Nigg, B. M., Stefanyshyn, D. J. and Humble, R. N. (2002). Devel-
opment of a reliable method to assess footwear comfort during running. Gait and
Posture, 16, 38-45.
Nakai, T., Takakura, Y., Tanaka, Y., Sugimoto, K., Tamai, S. & Kurumatani, N. (2000).
Morphologic changes of the ankle in children as assessed by radiography and
arthrography. J. Orthop. Sci., 5, 134-138.
Nantel, J., Brochu, M. and Prince, F. (2006). Locomotor Strategies in Obese and Non-
obese Children. Obesity, 14, 1789-1794.
Nass, D., Hennig, E. M. and Van Treek, R. (1999). The thickness of the heel pad loaded
by bodyweight in obese and normal weight. Proceedings of the 4th Symposium on
Footwear Biomechanics, Calgary, Canady, 74-75.
Nester, C., Jones, R. K., Liu, A., Howard, D., Lundberg, A., Arndt, A., Lundgren, P.,
Staco�, A. and Wolf, P. (2007). Foot kinematics during walking measured using
bone and surface mounted markers. J. Biomech., 40, 3412-3423.
Netter, F. (2001). Netters Orthopädie. Stuttgart: Thieme.
Nigg, B. M. and Segesser, B. (1992). Biomechamical and orthopedic concepts in sport
shoe construction. Med. Sci. Sports Exercise, 24, 595.
Nix, S., Smith, M. and Vicenzino, B. (2010). Prevalence of hallux valgus in the general
population: a systematic review and meta-analysis. J. Foot Ankle Res., 3, 21.
Nyska, M., Linge, K., McCabe, C. and Klenerman, L. (1997). The adaptation of the
foot to heavy loads: plantar foot pressures study. Clin. Biomech. (Bristol, Avon),
12, 8.
Oladipo, G., Bob-Manuel, I. and Ezenatein, G. (2009). Quantitative comparison of
foot anthropometry under di�erent weight bearing conditions amongst Nigerians.
Internet. J. Biol. Anthrop., 3, 1-8.
Pascual Huerta, J. and Alarcon Garcia, J. M. (2007). E�ect of gender, age and anthropo-
metric variables on plantar fascia thickness at di�erent locations in asymptomatic
subjects. Eur. J. Radiol., 62, 449-453.
Patel, A. and Horton, G. (2012). Anatomy of the foot and ankle. In D. W. Altchek,
C. DiGiovanni and J. Dines (Eds): Foot and ankle sports medicine. Philadelphia:
Lippincott Williams and Wilkins.
171
Reference list
Perini, T. A., de Oliveira, G., dos Santor Ornellas, J. d. S. and de Oliveira, F. P. (2005).
Technical error of measurement in anthropometry. Revista Brasileira de Medicina
do Esporte, 11, 81-85.
Pfei�er, M., Kotz, R., Ledl, T., Hauser, G. and Sluga, M. (2006). Prevalence of �at foot
in preschool-aged children. Pediatrics, 118, 634-639.
Piller, F. T. (2002). The market for customized footwear in Europe: market demand
and consumer's preferences. A project report from the EuroShoe Project within
European Fifth Framework Program. Munich/Milan.
Pioletti, D. P. and Rakotomanana, L. R. (2000). Non-linear viscoelastic laws for soft
biological tissues. Eur. J. Mech. A. Solids, 19, 749-759.
Poskitt, E. M. E. (1995). De�ning childhood obesity: the relative body mass index
(BMI). Acta Paediatrica, 84, 961-963.
Prichasuk, S., Mulpruek, P. and Siriwongpairat, P. (1994). The heel-pad compressibility.
Clin. Orthop. Relat. Res., 300, 197-200.
Putti, A. B., Arnold, G. P. and Abboud, R. J. (2010). Foot pressure di�erences in men
and women. Foot Ankle Surg., 16, 21-24.
Putz, R. and Müller-Gerbel, M. (1991). Funktionelle Anatomie des Fuÿes (pp. 2-10). In
R. Bauer, N. Gschwend, D. Hohmann, E. Morscher, L. Schweiberer, H. Tscherne
and H. Wagner (Eds): Der Orthopäde. Berlin: Springer Verlag.
Rabl, C. R. H. and Nyga, W. (1994). Orthopädie des Fuÿes. Stuttgart: Enke.
Rao, U. B. and Joseph, B. (1992). The in�uence of footwear on prevalence of �at foot.
J. Bone Joint Surg., 74-B, 525-527.
Richter, M. and Schaefer, K. (2009). Der deutsche Fuÿreport. Teil II - Der Schuhbezug,
1-28.
Riddiford-Harland, D. L., Steele, J. R. and Baur, L. A. (2011). Medial midfoot fat pad
thickness and plantar pressures: are these related in children? Int. J. Ped. Obes.,
6, 261-266.
Riddiford-Harland, D. L., Steele, J. R. and Storlien, L. H. (2000). Does obesity in�uence
foot structure in prepubescent children? Int. J. Obes., 24, 541-544.
Rodgers, M. M. (1995). Dynamic foot biomechanics. J. Orthop. Sports Phys. Ther.,
21, 306-316.
Rossi, W. A. (1980). The Last. Heart of the shoe. Footwear and the podiatrist 70 [10],
533-534.
172

Reference list
Rossi, W. A. (2000). The complete footwear dictionary. Florida: Krieger.
Rossi, W. A. and Tennant, R. (2011). Professional shoe �tting. Tucson, Arizona: Na-
tional Shoe Retailers Association.
Sander, K. (1991). Landmarks in developmental biology. Dev. Genes Evolution, 200,
1-3.
Sarra�an, S. K. and Kelikian, A. S. (2011). Development of the Foot and Ankle (pp.
3-39). In A. S. Kelikian (Ed): Anatomy of the Foot and Ankle. Descriptive,
Topographic, Functional. Philadelphia: Wolters Kluwer and Lippincott Williams
and Wilkins.
SATRA (1993). How to �t footwear. UK: Footwear Technology Centre.
Saunders, C. G. and Chang, J. (2013). 3D shape capture of human feet and shoe lasts.
In R. S. Goonetilleke (Ed): The Science of Footwear. Bocan Raton: Taylor and
Francis Group.
Schilling, F. W. (1985). The medial longitudinal arch of the foot in young children.
Zeitschrift für Orthopädie und ihre Grenzgebiete, 123, 296.
Schmeltzpfenning, T. (2011). Dynamisch-optische Ober�ächenvermesung des plantaren
Fuÿes. Dissertation, Wirtschafts- und Sozialwissenscahftliche Fakultät der Eberhard-
Karls-Universität Tübingen.
Schmeltzpfenning, T., Plank, C., Krauss, I., Aswendt, P. and Grau, S. (2009). Dynamic
foot scanning: A new approach for measurement of the human foot shape while
walking. Footwear Sci., 1, 28-30.
Schmeltzpfenning, T., Plank, C., Krauss, I., Aswendt, P. and Grau, S. (2010). Dynamic
foot scanning. Prospects and limitations of using synchronized 3D scanners to
capture complete human foot shape while walking. 3rd International Conference
on Applied Human Factors and Ergonomics. Louisville, USA.
Scott, G., Menz, H. B. and Newcombe, L. (2007). Age-related di�erences in foot struc-
ture and function. Gait and Posture, 26, 68-75.
Shapiro, S. S. and Wilk, M. B. (1965). An analysis of variance test for normality (com-
plete samples). Biometrika, 52, 591-611.
Shrout, P. E. and Fleiss, J. L. (1979). Intraclass correlations: uses in assessing rater
reliability. Psychol. Bull., 86, 420.
Soysa, A., Hiller, C., Refshauge, K. and Burns, J. (2012). Importance and challenges of
measuring intrinsic foot muscle strength. J. Foot Ankle Res., 5, 29.
173

Reference list
Speiser, P. W., Rudolf, M. C. J., Anhalt, H., Camacho-Hubner, C., Chiarelli, F., Eliakim,
A., Freemark, M., Gruters, A., Hershkovitz, E. & Iughetti, L. (2005). Childhood
obesity. J. Clin. Endocrinol. Metab., 90, 1871-1887.
Staheli, L. T. (1991). Shoes for Children: A Review. Pediatrics, 88, 371-375.
Staheli, L. T., Chew, D. E. and Corbett, M. (1987). The longitudinal arch. A survey
of eight hundred and eighty-two feet in normal children and adults. J. Bone Joint
Surg. Am., 69, 426-428.
Stástná, P. (1999) Results of measuring children´s feet in the Czech Republic. Zlin. 1st
Technical Meeting. Czech Republic.
Stavlas, P., Grivas, T. B., Michas, C., Vasiliadis, E. and Polyzois, V. (2005). The
Evolution of Foot Morphology in Children between 6 and 17 Years of Age: A
Cross-Sectional Study Based on Footprints in a Mediterranean Population. J Foot
and Ankle Surg., 44, 424-428.
Stracker, O. A. (1966). Kinderfuÿ und Kinderschuh. Archiv für orthopädische und
Unfall-Chirurgie, 59, 286-294.
Sullivan, J. A. (1999). Pediatric �atfoot: evaluation and management. J. Am. Acad.
Orthop. Surg., 7, 44-53.
Sullivan, L. H. (1947). The tall o�ce building artistically considered. In I. Athey (Ed)
The documents of modern art (pp. 202-213). New York: George Wittenborn
Incorporated.
Sutherland, D. (1997). The development of mature gait. Gait & Posture, 6, 163-170.
Telfer, S. and Woodburn, J. (2010). The use of 3D surface scanning for the measurement
and assessment of human foot. J. Foot Ankle Res., 3, 1-9s.
Teoh, J. C., Lee, T., Lim, C. H. and Low, J. H. (2012). Assessment of ageing e�ect on
plantar tissue sti�ness. J. Biomechanics, 45, 1.
Thabet, A. K., Trucco, E., Salvi, J., Wang, W. and Abboud, R. J. (2011). A dynamic
3D foot reconstruction system. 33rd Annual International Conference of the IEEE
EMBS, Boston, USA, 599-602.
Tittel, K. (2003). Beschreibende und funktionelle Anatomie des Menschen. Elsevier,
Urban and Fischer Verlag.
Tsung, B. Y. S., Zhang, M., Fan, Y. B. and Boone, D. A. (2003). Quantitative compar-
ison of plantar foot shapes under di�erent weight-bearing conditions. J. Rehab.
Res. Dev., 40, 517-526.
174
Reference list
Tsung, B. Y. S., Zhang, M., Mak, A. F. and Wong, M. W. (2004). E�ectiveness of
insoles on plantar pressure redistribution. J. Rehab. Res. Dev., 41, 767-774.
Unger, H. and Rosenbaum, D. (2004). Gender-speci�c di�erences of the foot during the
�rst year of walking. Foot Ankle Int., 25, 582-587.
Van Boerum, D. H. and Sangeorzan, B. J. (2003). Biomechanics and pathophysiology
of �at foot. Foot and Ankle Clinics, 8, 419.
Volpon, J. B. (1994). Footprint analysis during the growth period. J. Pediatric Or-
thopaedics, 14, 83.
von Lanz, T. and Wachsmuth, W. (1972). Praktische Anatomie: Bein und Statik. Berlin:
Springer Verlag.
Walther, M., Herold, D., Sinderhauf, A., Körger, H., Kleindienst, F. & Krabbe, B. (2005).
Anforderungen an den Kindersportschuh vor dem Hintergrund der Entwicklung des
Kinderfuÿes. Fuss Sprungg., 3, 23-33.
Wang, C. L., Hsu, T. C., Shau, Y. W., Shieh, J. Y. and Hsu, K. H. (1999). Ultrasono-
graphic measurement of the mechanical properties of the sole under the metatarsal
heads. J. Orthop. Res., 17, 709-713.
Wang, J., Saito, H., Kimura, M., Mochimaru, M. and Kanade, T. (2005). Shape recon-
struction of human foot from multi-camera images based on PCA of human shape
database. Fifth International Conference on 3-D Digital Imaging and Modeling.
IEEE. Ottawa, Canada.
Wang, J., Saito, H., Kimura, M., Mochimaru, M. and Kanade, T. (2006). Human Foot
Reconstruction from Multiple Camera Images with Foot Shape Database. IEICE
Trans. Inf. Syst., E89-D, 1732-1742.
Wearing, S. C., Hennig, E. M., Byrne, N. M., Steele, J. R. and Hills, A. P. (2006).
Musculoskeletal disorders associated with obesity: a biomechanical perspective.
Obes. Rev., 7, 239-250.
Wearing, S. C. and Smeathers, J. E. (2011). The heel fat pad: mechanical properties
and clinical applications. J. Foot Ankle Res., 4, I14.
Wearing, S. C., Smeathers, J. E., Yates, B., Urry, S. R. and Dubois, P. (2009). Bulk
compressive properties of the heel fat pad during walking: a pilot investigation in
plantar heel pain. Clin. Biomech. (Bristol., Avon.), 24, 397-402.
Wegener, C., Hunt, A. E., Vanwanseele, B., Burns, J. and Smith, R. M. (2011). E�ect
of children's shoes on gait: a systematic review and meta-analysis. J. Foot Ankle
175

Reference list
Res., 4.
Wetz, H. H. and Debrunner, H. U. (2001). Wachstum des Fuÿes. In R. Baumgartner and
H. Stinus (Eds): Die orthopädietechnische Versorgung des Fuÿes. Georg Thieme
Verlag.
Wheelwright, E. F., Minns, R. A., Law, H. T. and Elton, R. A. (1993). Temporal and
spatial parameters of gait in children. I: Normal control data. Dev. Med. Child
Neurol., 35, 102-113.
Williams, D. S. and McClay, I. S. (2000). Measurements used to characterize the foot
and the medial longitudinal arch: reliability and validity. Physical Therapy, 80,
864-871.
Witana, C. P., Feng, J. and Goonetilleke, R. S. (2004). Dimensional di�erences for
evaluating the quality of footwear �t. Ergonomics, 47, 1301-1317.
Witana, C. P., Xiong, S., Zhao, J. and Goonetilleke, R. S. (2006). Foot measusements
from three-dimensional scans: A comparison and evaltuation of di�erent methods.
Int J. Ind. Ergon., 36, 789-807.
Wolf, P., Staco�, A., Liu, A., Nester, C., Arndt, A., Lundberg, A. & Stuessi, E. (2008a).
Functional units of the human foot. Gait & Posture, 28, 434-441.
Wolf, S., Simon, J., Patikas, D., Schuster, W., Armbruster, P. & Döderlein, L. (2008b).
Foot motion in children shoes - A comparison of barefoot walking with shod walking
in conventional and �exible shoes. Gait and Posture, 27, 51-59.
Wunderlich, R. E. and Cavanagh, P. R. (2001). Gender di�erences in adult foot shape:
implications for shoe design. Med. Sci. Sports Exercise, 33, 605-611.
Xiong, S., Goonetilleke, R. S., Zhao, J., Li, W. and Witana, C. P. (2009). Foot defor-
mations under di�erent load-bearing conditions and their relationships to stature
and body weight. Anthropol. Science, 117, 77-88.
Yamazaki, S., Kouchi, M., Mochimaru, M., Saito, S., Yoshida Y. and Aoki, Y., 2013.
Homologous shape modelling of deforming human foot. Footwear Science, 5,
S120-S121.
Zifchock, R. A., Davis, I., Hillstrom, H. and Song, J. (2006). The e�ect of gender,
age, and lateral dominance on arch height and arch sti�ness. Foot Ankle Int., 27,
367-372.
Zipfel, B. and Berger, L. R. (2007). Shod versus unshod: The emergence of forefoot
pathology in modern humans? The Foot, 17, 205-213.
176

Appendix A
A.1 Information about the aim and content of the study
for children and their parents
177

Appendix A
178

A.1 Information about the aim and content of the study for children and their parents
179

Appendix A
180

A.1 Information about the aim and content of the study for children and their parents
181


A.2 Case report form
A.2 Case report form
183

Appendix A
184

A.2 Case report form
185


Comparison of measurements of a bowling ball
A.3 Comparison of measurements of a bowling ball with
varying spatial resolution and several static and
dynamic situations
187

Table A.1: Measurement results of a bowling ball measured in static and dynamic situation with di�erent spatial resolutionTrial Static Dynamic 2x2 binning mode Dynamic 4x4 binning modeBowling ball
cirumference Fullresolution
2x2binningmode
0.28 m/s 0.46 m/s 0.64 m/s 0.25 m/s 0.45 m/s 0.65 m/s 0.80 m/s
[mm] [mm] [mm] [mm] [mm] [mm] [mm] [mm] [mm] [mm]
T1 30.25 30.34 30.35 30.40 30.32 30.28 30.30 30.28 30.14 30.20T2 30.25 30.34 30.35 30.38 30.41 30.30 30.36 30.22 30.12 30.07T3 30.25 30.35 30.37 30.40 30.38 30.31 30.33 30.25 30.13 30.20T4 30.25 30.35 30.35 30.41 30.33 30.28 30.29 30.38 30.06 30.35T5 30.25 30.34 30.34 30.40 30.36 30.27 30.32 30.28 30.14 30.03T6 30.25 30.34 30.33 30.41 30.36 30.28 30.27 30.23 30.12 30.13T7 30.25 30.32 30.31 30.46 30.36 30.28 30.34 30.35 30.26 30.08T8 30.25 30.37 30.34 30.47 30.36 30.28 30.27 30.23 30.06 30.01T9 30.25 30.36 30.34 30.42 30.37 30.27 30.30 30.26 30.17 30.04T10 30.25 30.32 30.38 30.46 30.43 30.281 30.31 30.26 30.24 30.06Mean 30.25 30.34 30.35 30.42 30.37 30.28 30.31 30.28 30.14 30.12SD 0 0.02 0.02 0.03 0.03 0.01 0.03 0.05 0.06 0.10RMSE 0 0.07 0.07 0.12 0.09 0.02 0.05 0.04 0.09 0.12
SD = standard deviation; RMSE = root mean square error

A.4 Comparison of last and foot measures
A.4 Comparison of last and foot measures
Comparison of foot measures taken on scanned lasts compared to the children's feet with
the respective foot length. The type of the last as well as of each foot was determined
by the procedure of Mauch et al. (Mauch et al. 2009).
189

AppendixATable A.2: Mean and standard deviation of the foot measures calculated from scanned lasts and children's feet of shoe size
EU 33Size [EU] 33
Type mini midi maxiSide left right left right left right
N 21 26 32 26 25 29
Last 162.2 165.0 165.0 162.6 171.1 163.3HWB 148.6 ± 3.3 149.8 ± 3.2 149.9 ± 3.0 148.2 ± 3.3 149.5 ± 4.0 148.5 ± 3.3FWB 148.7 ± 3.6 149.5 ± 3.1 149.3 ± 3.5 148.5 ± 3.3 149.2 ± 3.8 148.4 ± 2.8
Medial balllength [mm]
MaxDyn 150.2 ± 3.5 150.5 ± 3.9 150.7 ± 3.4 149.8 ± 4.3 151.1 ± 3.4 149.6 ± 4.1
Last 139.3 137.6 136.6 142.5 136.5 143.6HWB 128.0 ± 4.6 128.2 ± 3.2 126.8 ± 3.9 127.5 ± 4.4 125.7 ± 4.3 125.4 ± 5.3FWB 126.6 ± 3.6 127.7 ± 3.3 126.0 ± 4.2 128.9 ± 3.4 124.4 ± 4.4 124.2 ± 4.1
Lateral balllength [mm]
MaxDyn 128.2 ± 4.8 128.1 ± 4.1 127.8 ± 4.0 128.1 ± 6.2 126.9 ± 4.8 126.1 ± 4.3
Last 73.0 72.3 74.8 74.5 79.9 79.8HWB 76.4 ± 3.0 77.0 ± 2.3 78.7 ± 2.6 78.1 ± 2.4 83.1 ± 2.3 83.3 ± 3.4FWB 77.1 ± 3.3 77.5 ± 2.3 79.3 ± 2.9 78.3 ± 2.3 83.6 ± 2.6 83.2 ± 3.0
Orthog. ballwidth [mm]
MaxDyn 78.0 ± 3.4 78.8 ± 2.2 80.8 ± 3.1 79.9 ± 2.7 85.2 ± 2.3 84.9 ± 3.4
Last 55.1 54.6 54.6 54.1 56.7 56.8HWB 54.4 ± 3.9 54.9 ± 2.8 55.4 ± 4.3 54.3 ± 2.6 57 8 ± 4.3 56.3 ± 3.5FWB 54.1 ± 3.8 54.8 ± 3.1 55.2 ± 4.0 54.0 ± 2.5 57.5 ± 4.3 56.3 ± 3.4
Orthog. heelwidth [mm]
MaxDyn 54.3 ± 4.3 54.8 ± 3.3 55. 5 ± 3.9 53.5 ± 3.5 57.8 ± 2.7 55.8 ± 3.4
Last 188.1 187.1 193.2 192.5 203.5 203.2HWB 184.6 ± 5.9 185.6 ± 5.1 185.6 ± 5 185.6 ± 5.2 200.0 ± 3.8 197.8 ± 6.9FWB 185.4 ± 6.2 188.4 ± 12.2 192.4 ± 5.6 189.3 ± 4.9 201.2 ± 4.6 199.4 ± 6.7
Last ball girth[mm]
MaxDyn 179.8 ± 6.5 181.5 ± 4.6 187.5 ± 6.3 184.0 ± 6 195.8 ± 5.1 194.8 ± 7.9
Last 189.6 189.4 195.2 195.3 204.5 205.1HWB 185.8 ± 6.9 185.0 ± 5.6 192.1 ± 6.2 188.3 ± 4.8 200.2 ± 5.3 199.3 ± 6.8FWB 186.9 ± 7.2 185.6 ± 5.3 193.1 ± 6.6 188.8 ± 4.7 201.0 ± 5.7 199.8 ± 6.7
Last waist girth[mm]
MaxDyn 181.8 ± 7.3 181.7 ± 6.7 188.2 ± 8.0 184.2 ± 5.4 196.5 ± 7.2 194.9 ± 8.3
Last 201.8 201.4 207.3 206.6 217.5 217.1HWB 191.9 ± 7.7 191.1 ± 5.2 198.9 ± 7.2 194.5 ± 5.1 206.5 ± 7.3 203.6 ± 6.4FWB 192.6 ± 7.8 191.3 ± 5.1 199.3 ± 7.4 194.5 ± 4.9 206.5 ± 7.1 203.6 ± 6.0
Last instep girth[mm]
MaxDyn 189.0 ± 7.8 188.6 ± 5.7 195.6 ± 8.4 190.6 ± 6.5 202.3 ± 8.9 200.3 ± 7.5
Last 87.3 90 86.1 90.5 82.0 79.6HWB 74.3 ± 3.3 74.0 ± 2.1 73.3 ± 3.2 75.2 ± 3.5 73.9 ± 3.1 73.6 ± 3.6FWB 73.3 ± 3.5 73.9 ± 2.3 73.0 ± 3.2 73.9 ± 2.6 73.3 ± 3.2 73.2 ± 2.9
Ball angle [°]
MaxDyn 75.2 ± 2.9 75.5 ± 3.6 75.5 ± 3.0 76.4 ± 3.6 75.3 ± 2.8 75.5 ± 3.4
Last 9.4 9.9 10.1 11.2 10.8 9.9HWB 1.9 ± 4.4 3.4 ± 4.7 2.6 ± 4.0 2.8 ± 4.3 4.2 ± 4.3 2.7 ± 4.6FWB 1.0 ± 5.0 2.7 ± 4.2 2.4 ± 4.1 2.9 ± 4.3 3.1 ± 5.6 2.2 ± 4.8
Toe 1 angle [°]
MaxDyn 6.3 ± 6.1 7.8 ± 4.6 7.0 ± 4.2 9.2 ± 5.7 6.9 ± 5.8 7.9 ± 4.8
Last 14.5 13.5 16.6 15.5 26.1 16.5HWB 5.9 ± 3.4 6.4 ± 4.4 8.1 ± 4.2 9.2 ± 4.0 9.7 ± 3.4 10.7 ± 5.0FWB 6.6 ± 3.1 7.3 ± 4.0 8.7 ± 3.6 8.9 ± 4.3 9.8 ± 3.2 10.6 ± 4.6
Toe 5 angle [°]
MaxDyn 8.8 ± 3.7 11.0 ± 5.0 10.3 ± 3.3 11.3 ± 5.2 11.4 ± 3.2 11.5 ± 5.6
190

A.4
Com
parison
oflast
andfoot
measu
res
Table A.3: Mean and standard deviation of the foot measures calculated from scanned lasts and children's feet of shoe sizeEU 37
Size [EU] 37Type mini midi maxiSide left right left left right
N 22 30 31 43 65
Last 175.5 177.4 179.1 188.3 184.3HWB 169.9 ± 3.5 167.2 ± 2.5 169.4 ± 3.8 169.1 ± 3.2 168.4 ± 3.0FWB 169.6 ± 3.7 168.2 ± 3.6 169.2 ± 3.8 168.1 ± 3.0 169.0 ± 3.3
Medial balllength [mm]
MaxDyn 172.0 ± 3.1 168.4 ± 2.8 170.3 ± 5.4 169.8 ± 3.5 169.7 ± 3.2
Last 149.9 157.4 148.9 153.2 153.9HWB 142.3 ± 3.9 142.8 ± 4.5 141.5 ± 4.0 140.3 ± 5.1 141.3 ± 4.8FWB 142.0 ± 3.4 143.7 ± 5.7 141.3 ± 4.1 139.8 ± 4.2 140.6 ± 4.7
Lateral balllength [mm]
MaxDyn 144.1 ± 4.4 143.8 ± 4.6 142.2 ± 5.3 141.2 ± 4.4 143.1 ± 5.3
Last 81.6 79.7 83.3 88.7 87.6HWB 83.9 ± 4.0 84.1 ± 3.1 86.6 ± 2.7 89.6 ± 3.4 90.1 ± 3.2FWB 84.7 ± 4.0 84.5 ± 3.1 87.2 ± 2.6 90.1 ± 3.1 90.6 ± 3.3
Orthog. ballwidth [mm]
MaxDyn 86.0 ± 4.6 85.5 ± 4.2 89.2 ± 3.9 91.4 ± 3.6 92.3 ± 4.2
Last 60.1 59.5 60.3 62.7 62.2HWB 58.5 ± 3.7 58.4 ± 3.0 60.5 ± 3.1 60.3 ± 3.0 61.7 ± 4.0FWB 58.3 ± 3.6 58.5 ± 2.9 60.1 ± 3.0 60.3 ± 3.1 61.7 ± 4.1
Orthog. heelwidth [mm]
MaxDyn 59.5 ± 4.1 58.4 ± 3.9 60.7 ± 3.5 61.6 ± 3.3 62.4 ± 4.0
Last 207.1 206.8 213.7 224.8 224.4HWB 202.8 ± 8.7 201.8 ± 7.1 208.2 ± 5.7 214.1 ± 7.7 215.9 ± 7.6FWB 204.2 ± 8.6 203.1 ± 7.1 209.5 ± 5.8 215.5 ± 7.3 217.1 ± 7.8
Last series ballgirth [mm]
MaxDyn 198.6 ± 10.3 197.5 ± 9.2 204.7 ± 6.3 209.5 ± 9.3 212.2 ± 9.2
Last 209.5 208.7 216.5 226.7 226.3HWB 202.3 ± 9.4 202.0 ± 7.5 209.6 ± 7.1 216.0 ± 8.7 217.8 ± 8.9FWB 203.2 ± 9.2 202.9 ± 7.4 210.3 ± 7.0 216.5 ± 8.6 218.4 ± 8.9
Last waist girth[mm]
MaxDyn 199.0 ± 9.7 197.8 ± 8.7 206.4 ± 8.9 211.7 ± 10.5 213.8 ± 10.4
Last 223.1 222.9 229.4 239.9 239.6HWB 211.3 ± 7.9 210.3 ± 7.7 217.4 ± 6.8 221.8 ± 7.9 224.3 ± 9.9FWB 211.8 ± 7.8 210.7 ± 7.4 217.6 ± 6.6 221.7 ± 8.0 224.5 ± 10.0
Last instep girth[mm]
MaxDyn 208.3 ± 8.4 206.7 ± 8.8 214.4 ± 8.6 218.3 ± 8.4 219.8 ± 10.2
Last 83.8 90.9 88.4 81.9 82.0HWB 71.4 ± 2.1 73.4 ± 3.0 71.7 ± 2.7 72.0 ± 3.5 73.0 ± 2.8FWB 71.6 ± 2.5 72.9 ± 3.0 71.8 ± 2.2 72.3 ± 2.9 72.2 ± 2.6
Ball angle [°]
MaxDyn 73.3 ± 2.8 75.1 ± 2.8 73.3 ± 3.9 73.5 ± 3.4 74.8 ± 3.1
Last 10.1 9.7 10.7 10.5 9.5HWB 5.2 ± 4.5 3.2 ± 5.3 5.5 ± 4.2 4.9 ± 4.3 4.2 ± 4.1FWB 4.9 ± 4.6 2.7 ± 5.1 5.3 ± 4.7 4.0 ± 4.7 4.2 ± 4.5
Toe 1 angle [°]
MaxDyn 6.9 ± 4.7 7.9 ± 5.5 8.9 ± 4.3 8.4 ± 5.1 7.3 ± 4.8
Last 12.7 13.5 14.7 14.6 13.2HWB 7.5 ± 4.5 9.6 ± 5.3 7.5 ± 3.3 12.5 ± 4.2 12.5 ± 3.9FWB 7.8 ± 4.2 9.9 ± 4.8 8.0 ± 3.2 12.8 ± 4.1 12.3 ± 4.1
Toe 5 angle [°]
MaxDyn 11.2 ± 5.7 10.3 ± 5.2 10.9 ± 3.4 14.4 ± 5.2 13.2 ± 4.4
191


A.5 Calculation of the toe allowance based on the three components
A.5 Calculation of the allowance based on the three
components semi-annual growth rate, foot advance
and foot extension
193

AppendixA
Table A.4: Toe allowance calculated on the base of mean valuesShoe size Foot length Semi-annual growth Mean advance Mean extension Allowance[EU] [mm] [mm] [mm] [mm] [mm]29 175.5-181.9 5.1 1.7 0.7 7.530 181.9-188.4 4.5 1.7 1.6 7.831 188.4-194.9 4.5 1.7 1.1 7.332 194.9-201.6 4.5 1.8 1.9 8.233 201.6-208.3 4.5 1.8 1.2 7.534 208.3-214.9 4.5 1.8 1.4 7.735 214.9-221.6 4.5 1.7 1.8 8.036 221.6-228.3 3.5 1.7 1.4 6.637 228.3-234.9 3.5 1.7 1.3 6.538 234.9-241.6 3.5 1.7 1.7 6.939 241.6-248.3 3.5 1.7 1.4 6.640 248.3-254.9 3.5 1.7 1.7 6.941 254.9-261.6 3.5 1.8 1.6 6.942 261.6-268.3 3.5 1.9 1.6 7.043 268.3-274.9 3.5 1.9 1.6 7.0
EU = European Scale aka French Scale
194

A.5
Calcu
lationof
thetoeallow
ance
based
onthethree
components
Table A.5: Allowance calculated on the base of the 90th percentileShoe size Foot length semi-annual growth 90% quantile advance 90% quantile extension Allowance[EU] [mm] [mm] [mm] [mm] [mm]29 175.5-181.9 5.1 2.7 3.7 11.530 181.9-188.4 4.5 3.2 5.8 13.531 188.4-194.9 4.5 3.1 4.3 11.932 194.9-201.6 4.5 3.4 5.4 13.333 201.6-208.3 4.5 3.3 4.4 12.234 208.3-214.9 4.5 3.3 5.2 13.035 214.9-221.6 4.5 3.3 5.6 13.436 221.6-228.3 3.5 3.3 5.2 12.037 228.3-234.9 3.5 3.0 4.6 11.138 234.9-241.6 3.5 3.1 5.4 12.039 241.6-248.3 3.5 3.5 5.2 12.240 248.3-254.9 3.5 3.3 5.4 12.241 254.9-261.6 3.5 3.1 5.2 11.842 261.6-268.3 3.5 3.3 5.8 12.643 268.3-274.9 3.5 3.5 5.7 12.7
EU = European Scale aka French Scale
195


A�dativ
I, Bettina Barisch-Fritz, born in Sigmaringen on 10th May 1982, hereby declare that I
wrote this dissertation at hand on my own, that I did only use the sources and materials
referred to and that each citation is made explicit. Moreover, I declare that I did neither
use the dissertation in this or any other form as a thesis nor submit the work as a
dissertation to another faculty.
Tübingen, 18th February 2014
Bettina Barisch-Fritz
197


Contributions to research articles
This thesis includes chapters that have been published as journal articles:
� Chapter 6: Fritz, B., Schmeltzpfenning, T., Plank, C., Hein, T., Grau, S. (2013).
Anthropometric in�uences on dynamic foot shape: Measurements of plantar three-
dimensional foot deformation. Foot Science; 5 (2): 121-129.
� Chapter 7: Barisch-Fritz, B., Schmeltzpfenning, T., Plank, C., Grau, S. (2014).
Foot deformation during walking: Di�erences between static and dynamic three-
dimensional foot morphology in children and adolescence. Ergonomics (Accepted
February 2014).
� Chapter 8: Barisch-Fritz, B., Schmeltzpfenning, T., Plank, C., Hein, T., Grau, S.
(2013). The e�ects of gender, age, and body mass on dynamic foot shape and
foot deformation in children and adolescents. Footwear Science (published online
September 2013).
All three manuscripts were written by the candidate, Bettina Barisch-Fritz. For the
�rst article, she contributed in data acquisition, statistical analysis and data interpreta-
tion. She was responsible for preparation and submission of the manuscript as well as
responding to reviewer's comments.
The second and third article arose under her full responsibility. She developed the
study and analysis design, recruited the participants, and performed the data acquisition
and analysis. She prepared and submitted the manuscripts and responded to reviewer's
comments.
Bettina Barisch-Fritz
Candidate
199


Curriculum vitae
Personal Data
Name: Bettina Barisch-Fritz
Date of birth: 10.05.1982
Location of birth: Sigmaringen
Education
1988 � 1992 Elementary School, Irndorf
1992 � 1998 Secondary School (Realschule), Mühlheim
1998 � 2001 Secondary School (Ernährungswissenschaftliches Gymnasium),
Tuttlingen
Academic Education
2002 � 2008 Diploma of Sport Science
University of Tübingen
2010 � 2013 PhD studies in the �eld of Biomechanics
University Clinic Tübingen
Academic Activities
2005 � 2006 Student Assistant at the Institute of Sports Science
University of Tübingen
2006 � 2009 Student Assistant at the Department of Sports Medicine
University Clinic Tübingen
2012 � 2013 Research Fellowship at the Biomechanics Research Laboratory
University of Wollongong, Australia (4 months)
2010 � 2013 Research Associate at the Department of Sports Medicine
University Clinic Tübingen
201


Danksagung
Der Dank geht an viele Menschen, die mich auf dem Weg der Promotion begleitet und
unterstützt haben. Allen voran danke ich Prof. Dr. Thomas Milani für die Betreuung
und Begutachtung der Dissertation. Mein Dank geht besonders an Prof. Dr. Stefan
Grau, der mein Vorhaben zu promovieren entfesselt und vorangetrieben hat. Durch sein
Vertrauen, seine Unterstützung und Motivation konnte ich viele wichtige Erfahrungen
durch Kongresse aber auch durch den Forschungsaufenthalt in Australien sammeln.
Dr. Timo Schmeltzpfenning danke ich für die Entwicklung des Messsystems. Die
Zusammenarbeit hinsichtlich der dynamischen Fuÿvermessung war ganz besonders unter-
haltsam und lehrreich für mich. Eine wichtige Person, die immer �eiÿig im Hintergrund
gearbeitet hat, ist Clemens Plank. Ihm habe ich zu verdanken, dass am Ende immer
alles funktioniert habt. Aber vor allem, dass durch seine Gelassenheit, seine Kreativ-
ität und seinen Tatendrang die Mess- und Auswertesoftware optimiert wurde und neue
�Spezialwünsche� implementiert werden konnten.
Danken möchte ich Dr. Detlef Axmann für seine methodische Unterstützung im Bere-
ich Statistik. Seine Denkanstöÿe waren immer auÿerordentlich gut und darauf bedacht
Lernfortschritte des Gegenübers sowie eine krititsche Re�exion zu ermöglichen. Lisa Pe-
terson danke ich für die perfekte linguistische sowie freundschaftliche Unterstützung. Für
die immer zuverlässige Mitarbeit danke ich Stefanie Hengst, die auch für den notwendigen
sportlichen Ausgleich immer zur Stelle war.
Dem weiteren Team der Sportmedizin mit PD Dr. Inga Krauÿ, Dr. Tobias Hein,
Dr. Benjamin Steinhilber, Georg Haupt, Regina Miller, Dr. Pia Janÿen und allen an-
deren danke ich für das einzigartige Klima sowie fachliche und kritische Diskussionen.
Prof. Dr. Andreas Nieÿ danke ich für die groÿartige Unterstützung, insbesondere für
die Bereitstellung der benötigten Ressourcen während Messphasen. Hierbei gilt der Dank
den vielen Bufdis, Hiwis, Praktikant/innen und Absolvent/innen, die mit viel Engagement
und Tatendrang ermöglicht haben eine so groÿe Stichprobe zu erfassen.
Herr Peter Lauer war ein wertvoller Diskussionpartner. Durch seine O�enheit und seine
203
Appendix A
Erfahrung ermöglichte er mir tiefe Einblicke in die Schuhindustrie.
Meinen Freunden, besonders den Tübinger Mädels, bin ich dankbar für ihr Verständnis
während dieser Zeit. Die vielen gemeinsamen Unternehmungen haben mir Kraft und
Bestätigung für meinen Weg gegeben.
Besonderer Dank geht an meine Eltern Herta und Rudolf, die mich immer unterstützt
haben und immer für mich da sind.
Zuletzt danke ich der wichtigsten Person in meinem Leben, meinem Mann Dr. Marc
Barisch, der diese Zeit am nächsten miterlebt hat. Er hat mich unglaublich unterstützt,
methodisch und mental aber vor allem durch seine Liebe.
204