dutch flexibility policy: an analysis of flexibility ... · professor energy planning faculty of...
TRANSCRIPT

DUTCH FLEXIBILITY POLICY: AN ANALYSIS OF FLEXIBILITY
POLICY AND REGULATION TO ACCOMMODATE VARIABLE
RENEWABLE ENERGY
By
Koen Gorrissen
A Thesis Submitted to the
Faculty of Engineering at Cairo University
and Kassel University
in Partial Fulfilment of the
Requirements for the Degree of
MASTER OF SCIENCE
In Renewable Energy and Energy Efficiency
for the MENA Region
REMENA
University of Kassel - Kassel, Germany
University of Cairo - Giza, Egypt
November - 2017

DUTCH FLEXIBILITY POLICY: AN ANALYSIS OF FLEXIBILITY
POLICY AND REGULATION TO ACCOMMODATE VARIABLE
RENEWABLE ENERGY
By
Koen Gorrissen
A Thesis Submitted to the
Faculty of Engineering at Cairo University
and Kassel University
in Partial Fulfilment of the
Requirements for the Degree of
MASTER OF SCIENCE
In Renewable Energy and Energy Efficiency
for the MENA Region
REMENA
Under the Supervision of
Prof. Dr. K. Rohrig
……………………………….
Prof. Dr. M. S. Elsobki
……………………………….
Professor of Integrated Energy Systems
Faculty of Electrical engineering and
computer science, Kassel University
Professor Energy Planning
Faculty of Engineering, Cairo University
University of Kassel - Kassel, Germany
University of Cairo - Giza, Egypt
November - 2017

DUTCH FLEXIBILITY POLICY: AN ANALYSIS OF FLEXIBILITY
POLICY AND REGULATION TO ACCOMMODATE VARIABLE
RENEWABLE ENERGY
By
Koen Gorrissen
A Thesis Submitted to the
Faculty of Engineering at Cairo University
and Kassel University
in Partial Fulfilment of the
Requirements for the Degree of
MASTER OF SCIENCE
In Renewable Energy and Energy Efficiency
for the MENA Region
REMENA
Approved by the
Examining Committee
........................................................
Prof. Dr. sc. Techn. D. Dahlhaus, University of Kassel
........................................................
Prof. Dr. K. Rohrig, University of Kassel
........................................................
Prof. Dr. M. S. Elsobki, Faculty of Engineering, Cairo University
........................................................
Prof. Dr. S. Kaseb, Faculty of Engineering, Cairo University
University of Kassel - Kassel, Germany
University of Cairo - Giza, Egypt
November – 2017

Engineer’s Name: Koen Gorrissen
Date of Birth: 22/06/1991
Nationality: Dutch
E-mail: [email protected]
Phone: +31 (0)6 44613643
Address: Opsterland 34, 3524 CH,
Utrecht, The Netherlands
Registration Date: 9/11/2017
Awarding Date: ………………….
Degree: Master of Science
Department: …………………..
Supervisors: Prof. Dr. K. Rohrig
Prof. Dr. M. S. Elsobki
Examiners:
Prof. Dr. D. Dahlhaus
Prof. Dr. S. Kaseb
Prof. Dr. M. S. Elsobki
Title of Thesis:
Dutch flexibility policy: An analysis of flexibility policy and regulation to accommodate variable
renewable energy
Key Words:
Flexibility; Policy; The Netherlands; Variable Renewable Energy integration
Summary:
An energy transition is unfolding in the Netherlands. Increasing shares of variable renewable energy demand the
consideration of power system flexibility by policy and regulation. This paper investigates current Dutch flexibility
policy and discussions surrounding the flexibility of the power system. It investigates whether new arguments and
new policy or regulatory perspectives from literature and foreign practice could enrich these discussions. To do so,
Dutch policy, foreign practices and academic literature are reviewed, and experts from various sides of the Dutch
power sector are interviewed. Findings include a good positioning for further mass integration of variable
renewables, with only some local grid congestion challenges on the short-term. Energy supply and balancing are
relatively unproblematic at least until 2030 due to overcapacity of conventional power plants. The interviews showed
strong agreement about i.a. the introduction of 15-minute pricing, the enabling of distribution system operators to
contract flexibility products and the undesirability of capacity mechanisms. Discussion, on the other hand, is apparent
about the merit of dynamic electricity prices and grid tariffs for household consumers, the most viable model for
aggregation services, the merit of locational pricing and the merit of strengthening export and import capacities.
Underlying these discussions are important differences in political values. These values are the adherence to cost-
causing principles versus the socialisation of costs, decentralisation versus centralisation, market primacy versus
government intervention and the level of policymaking. The outcomes of the discussions are at least partially
grounded in differences in interests of actors in the sector.
Dutch flexibility policy: An analysis of flexibility policy and
regulation to accommodate variable renewable energy
Koen Gorrissen | 33422749
Submitted to the Faculty of Electrical Engineering and Computer Science University of
Kassel in partial fulfilment of the requirements for M.Sc. degree in Renewable Energy and
Energy Efficiency for the MENA Region REMENA
November 2017
Prof. Dr. K. Rohrig Prof. Dr. M.S. Elsobki Prof. Dr. D. Dahlhaus Prof. Dr. S. Kaseb
€
€
?
X
?
?
€
!
X
€
1101100111100
0111100001010
1110110011110
001111000……… X
XX

i
Abstract An energy transition is unfolding in the Netherlands. Increasing shares of variable renewable energy
demand the consideration of power system flexibility by policy and regulation. This paper investigates
current Dutch flexibility policy and discussions surrounding the flexibility of the power system. It
investigates whether new arguments and new policy or regulatory perspectives from literature and
foreign practice could enrich these discussions. To do so, Dutch policy, foreign practices and academic
literature are reviewed, and experts from various sides of the Dutch power sector are interviewed.
Findings include a good positioning for further mass integration of variable renewables, with only some
local grid congestion challenges on the short-term. Energy supply and balancing are relatively
unproblematic at least until 2030 due to overcapacity of conventional power plants. The interviews
showed strong agreement about i.a. the introduction of 15-minute pricing, the enabling of distribution
system operators to contract flexibility products and the undesirability of capacity mechanisms.
Discussion, on the other hand, is apparent about the merit of dynamic electricity prices and grid tariffs
for household consumers, the most viable model for aggregation services, the merit of locational pricing
and the merit of strengthening export and import capacities. Underlying these discussions are important
differences in political values. These values are the adherence to cost-causing principles versus the
socialisation of costs, decentralisation versus centralisation, market primacy versus government
intervention and the level of policymaking. The outcomes of the discussions are at least partially
grounded in differences in interests of actors in the sector.

ii
Acknowledgements I would like to thank all colleagues at Agora Energiewende for their valuable support, insights and
discussions, and especially Christian Redl for his supervision, guidance and advice during my three-
month internship in Berlin. My sincere thanks as well to all interviewees for their time, attention, and,
more importantly, for openly sharing their knowledge and insights which have been of crucial
importance to this research. I would like to thank my supervisors Prof. Kurt Rohrig and Prof. Elsobki for
showing me the importance of working on this subject, for the independence they provided me with,
and for their guidance. My sincere thanks to all my classmates and REMENA staff for their help and
concern. Finally, I would like to thank my friends, family and especially Arin Koreman for their support
and commenting on my work.

iii
Statement of originality
To the best of my knowledge, I do hereby declare that this thesis is my own work. It has not
been submitted in any form of another degree or diploma to any other university or other
institution of education. Information derived from the published or unpublished work of others
has been acknowledged in the text and a list of references is given.
Date: 8-11-2017
Place: Utrecht
Name: Koen Gorrissen
Signature ....................................................................................

iv
Contents
Abstract .......................................................................................i
Acknowledgements ................................................................ ii
Statement of Originality ...................................................... iii
Contents ................................................................................... iv
List of figures .......................................................................... iv
List of tables ............................................................................ iv
List of abbreviations ................................................................v
1. Introduction .................................................................... 1
2. Methods and sources .................................................. 2 2.1. Literature review .................................................. 2 2.2. Interviews ............................................................. 3
3. literature review results .............................................. 3 3.1. Global Energy transition ...................................... 4 3.2. The Dutch energy transition ................................. 6 3.3. Flexibility .............................................................. 9
3.3.1. Flexibility challenges ................................. 11 3.3.2. Flexibility options ...................................... 14
3.3.2.1. Demand-side flexibility ......................... 14 3.3.2.2. Market Design ...................................... 18 3.3.2.3. System flexibility ................................... 24 3.3.2.4. Supply-side flexibility ............................ 28
4. Interview Results ......................................................... 31 4.1. Challenges .......................................................... 31 4.2. Flexibility options ............................................... 32
4.2.1. Demand-side flexibility.............................. 32 4.2.2. Market design ........................................... 36 4.2.3. System flexibility ....................................... 42 4.2.4. Supply-side flexibility ................................ 44
4.3. Overarching discussions and underlying values . 45
5. Discussion .................................................................... 46
6. Conclusion ................................................................... 48
7. References .................................................................... 50
Annex A: Interview questions ........................................... 57
Annex B: list of interviewees .............................................. 66
List of figures figure 1: Overview of relevant actors in the
Dutch power sector and their relations. 7
figure 2: Historical data up to and including
2015 and projection of electricity
production from 2016 by energy source
in the Netherlands. ....................................... 8
figure 3: Percentages of VRES technologies
with respect to total power generation
in several jurisdictions ................................. 9
figure 4: Schematic overview of the
integration challenge, its causes and its
solutions .......................................................... 15
figure 5: Schematic overview of the different
power markets, their bidding periods,
gate closure times and contract
durations ......................................................... 19
figure 6: Results of a Fraunhofer power
generation simulation at different levels
of spatial aggregation ............................... 20
figure 7: Installed capacity per generation
type in the Netherlands ............................ 29
List of tables table 1: Grid properties of electrical Networks
in the countries under consideration .... 10
table 2: Categorization of flexibility options . 16
table 3: Categorization of storage types ...... 27

v
List of abbreviations ACM (Dutch) Authority Consumer and
Market
BMWi (German) Federal Ministry for
economic affairs and energy
(Bundesministerium für Wirtschaft
und Energie)
BRP Balancing Responsible Party
BSP Balancing Service Providers
CAES Compressed-Air Energy Storage
CCS Carbon Capture and Storage
CH4 Methane
CWE Central-West Europe
DAM Day-Ahead Market
DRES Distributed Renewable Energy
Source
DSM Demand Side Management
DSO Distribution System Operator
EES Electrical Energy Storage
ETS Emission Trading System
EU European Union EV Electric Vehicle
EZ Dutch ministry of economic affairs FiT Feed-in Tariff
FTR Financial Transmission Rights
H2 Hydrogen gas
ICT Information and Communication
Technology
IDM Intraday Market
IOU Investor-Owned Utility
ISO Independent System Operator
kWh kiloWatt-hour (energy)
MW Mega Watt (power)
MW/h MegaWatt per hour (ramp-rate)
MWh MegaWatt-hour (energy)
NWE North-West Europe
PHES Pumped-Hydro Energy Storage
PLEF Pentalateral Energy Forum
PtH Power-to-Heat
PV Photo-Voltaic
R1 Primary Reserve Market
R2 Secondary Reserve Market
R3 Tertiary Reserve Market
RE(S) Renewable Energy (Source)
RfG Requirements for Generators
ToU Time-of-use
TSO Transmission System Operator
TYNDP Ten-year Network Development Plan
VoLL Value of Lost Load
VRE(S) Variable Renewable Energy (Source)
XBID Cross-Border Intraday
1
1. Introduction The transition towards a renewable energy
system in The Netherlands is developing slowly,
but picking up speed. According to the National
Energy Survey,1 the goal of 16% renewable
energy out of the total energy consumption in
2023 will be reached with only a minor
deficiency of 0,1% (Schoots, Hekkenberg, &
Hammingh, 2016). The growth of RE usage in
the electricity sector has been much higher and
will expectedly rise from 15,0% in 2016 to 37,7%
in 2020 and to 41,1% in 2023. New capacity is
dominated by wind power and, to a lesser
extent, by solar power. These variable
renewable energy sources (VRES) are
fundamentally different from technologies that
generate electricity by burning fossil fuels. The
intermittent character causes several challenges
which together are often described as the
‘integration challenge’ or ‘flexibility challenge’
(Agora Energiewende, 2015).
The challenge is caused by the simultaneity
of supply and demand of electricity, which
requires power to be produced at the same time
as it is consumed by the end-user. Moreover,
supply and demand should be matched over
space, while they find their origin at different
locations. Because VRE supply is dependent on
external conditions such as wind and solar
irradiation, the time and place of power
production are less controllable and less
predictable. A power system that is increasingly
based on VRES, therefore, needs to deal with
reducing flexibility on the supply side and
requires the incorporation of other flexible
resources. Flexibility, herein, is understood as
the ability of the power system to match
demand and supply economically and
efficiently, both temporally and spatially.2 The
flexibility challenge, therefore, consists of
integrating flexible resources or limiting the
increasing flexibility needs. The methods to
1 This paper has made use of the national energy survey serveral times. Altough the most recent national energy
survey was published just before finalising this paper, it could not be included due to lack of time.
2 Many different definitions of flexibility exists, but they usually include the same aspects, albeit putting different
weights on certain aspects. See for example those of ACER and CEER (2017b), CE Delft and Microeconomics
(2016), Triple E (2015), and Grave, Papaefthymiou and Dragoon (2014).
address this challenge are collectively denoted
as flexibility options. Whereas the challenge is
relatively mild at low percentages of VRE
injection in the grid, it becomes much more
pervasive when the fraction of VRE technologies
rises, which is the case in many power systems
all over the world.
Research into the integration challenge has
been widely performed (e.g. CE Delft &
Microeconomix, 2016; Fraunhofer IWES, 2015;
IEA, 2014a; Martinot, 2016; SWECO, Ecofys,
Tractebel engineering, & PWC, 2015). Flexibility
needs and options for the Netherlands have
been discussed for the electricity market by, for
example, Triple E (2015), within the policy
analysis of the International Energy Agency (IEA,
2014a), within the National Energy Survey
(Schoots et al., 2016) and other research
(Frontier Economics, 2015; Hers, Rooijers,
Afman, Croezen, & Cherif, 2016; Hout, Koutstaal,
Ozdemir, & Seebregts, 2014; Van der Welle &
De Joode, 2011). The Ministry of Economic
Affairs (EZ) has also discussed policy aspects of
VRE integration (EZ, 2016a, EZ, 2016b). Yet,
considering the flexibility of energy systems is
one of the key issues for a sustainable energy
transition, the challenges of integration did not
receive enough dedicated attention yet.
Especially the non-technical issues of market
development, planning, the design of policy,
institutions and regulation, and the economic
aspects are under-exposed. While technical
assessments are available, there is room for an
overarching understanding of and discussion
about policy and regulation for maintaining a
flexible power system while integrating higher
percentages of VRES.
This research will take these aspects into
account to discuss the Dutch renewable energy
integration policy and its missing links. To do so,
it will look both to solutions under discussion
within the country and solutions brought
2
forward in selected countries with high VRE
penetration grades and academic literature.
Thus, this research attempts to answer the
following question:
How does Dutch policy currently address the
effects of the integration of variable
renewable energy on the flexibility of the
power system, what are the relevant
discussions to adapt policy, institutions, and
markets to maintain flexibility, and what are
the positions and arguments in these
discussions?
This research intends to create a deeper
understanding of the policy framework that is
currently in place while describing and feeding
the discussions with options found in literature
and the context of high VRE penetration
countries. The overview of the policy landscape
should enable further planning of an energy
system with growing dependencies on
renewable technologies. As will be explained in
the methodology section of this thesis, this
would be done by the combination of a
literature study and interviews with experts in
research, industry and governmental institutes.
The next section will discuss the methods
and sources used for both parts of the research.
Subsequently, the results are presented for the
literature review (chapter 3) and the interviews
(chapter 4) respectively. Chapter 5 discusses the
findings and implications for research and
policy. Finally, chapter 6 reflects on and
summarizes the paper.
2. Methods and sources As has been mentioned in the introduction, the
research question will be addressed through a
combination of a literature review and
stakeholder interviews. The literature review will
give an overview of relevant policy discussions
and possible measures in the Netherlands and
selected countries. The interviews are meant to
create an in-depth understanding of the
positions of Dutch stakeholders in these
discussions.
For both the literature review and the
interviews, this paper focusses on policy steps
until 2030. This time frame is chosen because an
important stretch in the Dutch energy transition
is expected to be made before that date, as will
be further clarified in the results sections itself.
However, since other emission goals are
determined until 2050, some attention is given
to the longer term as well.
Furthermore, while this research is
delineated around Dutch policy, it does include
considerations out of international perspective.
Since the Dutch power system is physically
highly interlinked with neighbouring countries
and politically dependent on the European
Union (EU) and other cooperations such as the
Pentalateral Energy Forum (PLEF), some if not
much of the policy decisions take place on other
levels than the national one.
The following sections describe the methods
and sources used for the literature review and
the interviews respectively.
2.1. Literature review
The main purpose of the literature reviews is to
create an overview of the relevant discussion for
power system flexibility in the Netherlands and
other countries. Besides having value in itself, it
will also serve as input for the interview
questions.
Firstly, the literature review will discuss, in
general terms, the challenges to accommodate
higher percentages of renewable energy to
better understand current policy frameworks
around VRE. Secondly, it will discuss the
structure of the Dutch energy system and its
ongoing transition. Thirdly, the flexibility
challenge is discussed in detail. The third section
will be split into two parts. While the first part
covers the flexibility challenges caused by the
integration of higher percentages of VRES, the
second part discusses the options available in
literature and other countries to address these
challenges.
The sources used for the literature review are
not limited to scientific work but include a range
of reports and policy papers. While scientific
research is an important source for flexibility
policy, it is necessary to include further

3
information about installed policy as well as
positions on policy from different angles.
Some methodological considerations are
taken from Flyvbjerg’s phronetic planning
approach (Flyvbjerg, 2004, 2009). According to
his work, although rationality is often
considered to be the single most important
base of planning, it bases itself on certain
‘truths’ which are actually debatable. Instead of
taking these truths for granted, he
acknowledges that the value of certain truths is
determined by power relations and interests.
Since multiple ‘truths’ exist serving different
interest, there is no single ‘rational’ answer to
political issues. For policy making, this means
that instead of searching for a single best
answer, one could, for a range of policy options,
determine which parties would benefit and
which would be harmed by it. Concretely for this
research, it means that because these sources
are subject to the interests and capabilities of
the authoring entities, they are treated as views
of the relevant institutions rather than valued as
undisputable solutions. Because of this, the
literature review becomes an overview of the
various discussions about flexibility policy and
different positions in these discussions, rather
than an overview of a body of knowledge.
2.2. Interviews
While the literature review gives an overview of
different discussions and considerations, the
interviews are meant to get a more personal
and in-depth understanding of these positions
and a more specific application to the Dutch
(and European) context. Like the literature
review, the interview does not attempt to find
single answers or solutions, nor takes positions
in the various discussions. Since the
interviewees represent not only themselves but
are also interviewed from a position of an
institution, this part of the research will, indeed,
attempt to shed light on interests of institutions.
As mentioned in the previous section, the
questions prepared for the interviews are based
on the literature review. Since the literature
review will highlight the relevant discussions, its
findings can be used to enable a more precise
and informed discussion. The interview
questions (in Dutch) are included in annex A.
The interviewees are selected to represent a
range of various institutions dealing with the
Dutch power system, including the Ministry of
Economic Affairs (EZ), academia, other research
institutions, the transmission system operator
(TSO), a distribution system operator (DSO), and
an energy company. The interviewed experts
are all active in discussions surrounding the
flexibility challenge. A total of 17 persons are
interviewed, representing 11 different
institutions in 11 separate interview sessions. The
interviewees are listed in annex B.
The interviews are semi-structured according
to the questions in annex A and approximately
last an hour. Yet, depending on the interviewee
and the time available, more or less time is
taken to conduct these interviews. Most
interviews are conducted face-to-face with
some exceptions which are conducted by
phone. The interviews are recorded and
transcribed. Subsequently, for each interview,
relevant information is coded and organized
per theme.
The interview results are presented
thematically in the same structure as the
literature review. Where quotes are taken up in
the interview results, they are checked with the
respective interviewee and, in some cases,
edited upon his or her request to reflect his or
her position more clearly. Where necessary, the
interview results are compared with the
literature review.
3. Literature review results As discussed in the introduction, VRE
technologies such as solar and wind energy, are
fundamentally different from technologies that
generate electricity by burning fossil fuels.
These technologies differ not only
technologically but also have distinct economic
and social impacts.
Technologically, the amount of electricity
generated by VRES depends on the availability
of resources on a very short timescale and is,
therefore, fluctuating or variable (Agora

4
Energiewende, 2015). Their output is not as
easily dispatchable as compared to the output
of gas, coal, oil and oil product technologies,
and is also less controllable than other
renewable resources such as or biomass. As
these variations depend on external conditions,
more uncertainty is introduced into power
system management because of larger forecast
errors (CE Delft & Microeconomix, 2016).
Furthermore, the generating capacities of
distributed VRE technologies such as rooftop
solar power and wind turbines are typically
many times smaller than those of conventional
power plants.3 This leads to a much more
dispersed electricity generation than in a system
with only conventional thermal power plants.
VRES and conventional power generation are
economically disparate as well since the cost for
VRE technologies is largely determined by their
investment while they run at virtually no
marginal costs (Agora Energiewende, 2015).4
This contrasts sharply with fossil fuel
technologies where the costs are largely
determined by the energy resources they need,
which leads to a higher marginal fraction.
A socio-economic difference between the
VRES and conventional technology is identified
by the actors that are relevant to the
development of the technologies. As is shown
by e.g. Geels (2014), the actors that represent
the development of VRES are not the same
actors as those that represent the conventional
power production.5
Two final characteristics of VRES have
opposing effects on its local acceptance. The
strong visibility of VRES power plants has led to
3 The difference in capacities can be in the order of several hundred times the rated power. While e.g. a modern
wind power generator has the capacity of between 1 to 6 MW, a gas or coal fired power plant can produce
from several hundred MW to multiple GW.
4 The concept of marginal costs refers to the amount of costs that is related to produce one unit more of the
same good. While for fossil fuel power generation these costs are largely determined by its fuels, renewable
energy does not have substantial different costs when running at low or at high capacities.
5 As is discussed in the next paragraph, Geels (2014) claims that the difference in interest between the current
regime actors, representing conventional power generation, versus the niche actors, representing the
development of VRES, causes a hindrance in the process of low-carbon transitions.
the opposition against their development in
many areas. Yet, the absence of pollutants and
greenhouse gas emissions during generation of
electricity is a driver for these technologies.
These and other distinctions between
conventional power generation and VRES cause
several transformation issues in the energy
system. The first two sections of this chapter will
discuss the problems and solutions for the
diffusion of more variable as well as
dispatchable renewable energy technologies to
provide the thesis with both a global and a
national context of the energy transition
respectively. The third paragraph thematically
discusses the set of issues related specifically to
the integration of higher percentages of
variable renewable energy sources into the grid.
It will discuss the problems, theoretical
solutions, policy in the Netherlands and policy
in selected frontrunner countries.
3.1. Global Energy transition
This section introduces problems and solutions
in adopting larger fractions of renewable
energy sources (RES) into the power system.
Although the adoption of renewables is
intrinsically linked with the problems of grid
integration, flexibility, and balancing, this
section is limited to the problems and solutions
in creating a space for the RE technologies
themselves, independent of their integration
into the system. Yet, a complete overview of the
integration and flexibility challenges requires
knowledge of the other barriers to the
development of a renewable energy system and
is, therefore, included here.

5
The past few years, cost reductions,
improved policy frameworks, increased
possibilities for financing, political importance,
energy security concerns, and rising energy
demand have caused the diffusion of renewable
energy technology to rise rapidly (REN21, 2016).
Investments in RES are rising, so are their
installed capacity and their yearly energy
production. The total global capacity of
renewables rose in 2014 by 9% up to 1 849 GW
at the end of the year, which is 23,7% of all
global electricity production.6 The yearly global
capacity additions of renewable energy have
become greater than those of all fossil fuel
technologies (REN21, 2016).
Even though the development has been
steady, RES are still heavily dependent on policy
and, therefore, on political commitment.
Commitment to ensure growth in the usage of
renewable energy has created several
agreements, including most prominently the
agreement between 195 countries at the 21st
Conference of Parties (COP21) in Paris by United
Nations Framework Convention on Climate
Change in December 2015. However, these
commitments need to be converted into
concrete policies, investments, research and
development of technologies to meet the
specified targets. Whether policy frameworks
and practices are well-adapted and successful in
further stimulating growth in the development
of RE technologies depends on whether and
how effectively they address the relevant
problems. These problems with the adoption of
renewable energy technologies can roughly be
divided into social, economic, technological and
political aspects.
Several social aspects can be identified for
the adoption of renewable energy technologies.
Firstly, and most importantly, public acceptance
of new and often very visible technologies plays
6 It should be noted that the capacities added for renewables are not directly comparable to those for fossil
fuels, since their capacity factors are limited by the supply of the relevant natural resources such as solar
irradiation, wind speeds, and amount of precipitation.
7 For a discussion in recent cost developments of renewable energy and a comparison with the costs of fossil
fuels see IRENA (2015).
a role in many areas. The role of public
acceptance is seen to be a barrier to adoption,
particularly in the case of wind energy (see e.g.
Wüstenhagen, Wolsink, & Bürer, 2007). The high
visibility and landscape impact of wind turbines
and solar power fields often lead to community
protests and lack of acceptance. To tackle this
problem, Zoellner, Schweizer-Ries, &
Wemheuer (2008) have shown that aspects of
particular importance influencing project
acceptance are the participation of the general
public and local authorities into the decision-
making process, the transparency of the project
planning and decision-making processes, and
economic benefits as perceived by the
community.
A major barrier to mass adoption of RES is its
initial capital cost, albeit decreasingly so (Beck &
Martinot, 2004; IRENA, 2015; REN21, 2016).
While costs have been reduced strongly for
most RES, mainly for solar and wind power, it
depends strongly on the location of the project
whether investments are recoverable. Since the
production of power depends on the number of
natural resources such as solar irradiation and
wind speeds at the project location and is
variable with time, load factors and, therefore,
competitiveness of these RES vary considerably
(IRENA, 2015, p. 28).7
Furthermore, as will be discussed in the next
chapters, considerable costs exist for
maintaining system balance and RES
integration. Measures that have addressed the
redistribution of costs and remunerations in
order to promote sustainable development are
numerous, as discussed for example by Haas et
al. (2011). Notably, the role of feed-in tariffs (FiT)
has impacted investments in renewable energy
by giving long-term certainty to investors and
above market price remunerations for their

6
generated energy.8 However, some economies
such as Germany are moving to more dynamic
and market-based principles (Lang & Lang,
2015). Another important mechanism to
increase investments into renewables instead of
fossil-fuelled power is to internalize the external
costs of CO2 emissions,9 for example by CO2
taxation or cap-and-trade schemes such as the
European Union Emission Trading Scheme (EU-
ETS).
An important economic and political barrier
is the vested interest of the incumbent power
industry in the fossil fuel market, which is
threatened by the rise of distributed renewable
energy sources (DRES) (Creutzig &
Goldschmidt, 2008; Geels, 2014). Geels (2014)
claims that ‘incumbent regime actors’ have
considerable power to “hinder the progress of
low-carbon transitions” (p. 16). According to
Geels, politics should not only focus on the
investments and further development of
innovations such as RES but should actively
participate in the destabilization of the current
regime. Political barriers for RES deployment are
often founded in resistance to the perceived
and real investment costs of an energy
transition but are also related to the close
relations between political actors and the
current powerful utility industry (Creutzig &
Goldschmidt, 2008). Effendi and Courvisanos
(2012) also argue for Australia that while political
actors claim that technology is the main barrier
for further development RES, these arguments
are in fact “camouflage in their attempts to
maintain economic and political power” (p. 251).
Although technological barriers are real, they
mostly concern the grid integration challenges,
as will be discussed in the next chapters.
8 Feed-in-Tarriffs are governmentlly regulated fees for electricity fed into the grid.
9 The concept of External costs refers to the costs “that affects people other than those involved in the economic
activity that produced it and that is not reflected in prices” (“Externality,” 2016). The internalization refers to
mechanisms that reflect these costs in the market prices of such goods. In the case of CO2, this means that the
costs related to the negative effects of CO2 emission induced climate change are taken into account for
determining the costs of energy. If the costs for producing a unit of energy becomes more expensive for a
power produced by means of e.g. CO2 taxation, this leads to economic decisions, with a preference for low-
carbon technologies such as wind or solar power.
Another set of barriers is identified within the
framework of innovation systems, according to
which “the speed, direction, and success of
innovation processes are strongly influenced by
the environment in which innovations are
developed” (Negro, Alkemade, & Hekkert, 2012,
p. 3837). Negro, Alkemade, and Hekkert (2012)
show that “systemic problems” in the renewable
energy transition can be categorized into
market structure problems, infrastructural
problems, institutional problems, interaction
problems and capability problems. The main
identified issues in the energy transition were
inconsistent policy, incompatibility of RES with
existing market structures, lack of legitimacy of
supporting institutions, strong influence by
opposing institutions, a lack of knowledge
development, knowledge networks, skills and
organizational maturity, too weak interactions
between actors, and too strong interactions and
dependence between incumbents, leaving little
space for new entrants (Negro et al., 2012).
3.2. The Dutch energy transition
The Dutch electricity market has been
liberalized in 1998. Since then, the number of
players in the sector has become larger and
responsibilities are separated between different
actors. The relevant groups and their relations
are summarized in figure 1.
Policy making is done in the first place by the
Ministry of Economic Affairs (EZ). However, “to
a large extent, the conditions are set by the
European framework” (EZ, 2016a). At the same
time, international agreements, such as the
climate agreement, can impact policy decisions.
The ministry of infrastructure and environment
(I&M) has some responsibilities but is not
involved in energy policy to the same extent as
EZ. The regulation of the electricity sector is

7
performed by the Authority Consumer and
Market (Authoriteit Consument en Markt
[ACM], n.d.). ACM regulates and supervises the
prices, services, conditions, responsibilities, and
gives permissions to grid operators, electricity
producers, market platforms, and energy
retailers. Power production and power retail are
wholly performed by market players. Although
these functions are often combined into one
company, retailers can also buy power from
electricity markets or other companies. On the
other hand, the Transmission System Operator
(TSO) TenneT and the Distribution System
Operators (DSOs) are government-owned
companies and their operations are strongly
regulated. The whole country has one TSO and
several DSO’s divide the distribution grid.
Another type of player is the so-called
balancing responsible party (BRP). Their role is
to ensure the balance in the system by ensuring
that the planning for electricity demand and
supply are equal. Each producer and retailer
either need to employ or become a BRP, which
is certified by and delivers their planning to the
TSO (TenneT, n.d.-a). Small consumers are
connected to the grid by DSO’s, but just uphold
a direct relation with the energy companies,
which not only sell the energy to the consumers
but also arrange the fees for grid connection for
the DSO’s. A recent development is that some
consumers started to produce energy either by
themselves or in the form of a local renewable
Transmission system
operator (TenneT)
Energy retailers
Ministry of
Economic affairs
Regulation, notably ACM
Power production,
import and export
Research,
NGO’s,
pressure
groups
Power consumer, prosumers and energy cooperations
Ministry of environment
and infrastructure
Power Markets
Distribution system
operators
figure 1: Overview of relevant actors in the Dutch power sector and their relations. Note that power production, energy retail
and the fulfillment of program responsibility (BRP’s) is often performed by the same companies which are commonly called
‘energy companies’. Adapted from (IEA, 2014a, pp. 74–75).
BRP
Policy making
Regulation
Power flow
Economic relations
Information,
pressure, steering
European, regional and worldwide policy
agreements

8
energy organisation, referred to in figure 1 as
prosumers and energy cooperations
respectively. Besides these actors, which are all
directly involved in the sector, figure 1 shows
that research, NGO’s and other organizations
can induce changes or influence this system,
which is particularly relevant in the light of the
current energy transition.
The Dutch power system is strongly reliant
on its gas-fired power plants, which are
currently the main supplier of electricity with
about 42% of the total electricity production
(see figure 2). The electricity produced by RE is
dominated by wind energy, especially by land-
based turbines. According to the estimates in
the National Energy Survey, by 2023 wind power
will become the most important electricity
source. The off-shore fraction of wind power will
be the most important technology by 2030, with
a share of 25% of the power production. The
role of solar energy is relatively small but will
increase to about 9% of the electricity produced
by 2030. The total amount of electricity
production is expected to increase by 38% from
380 PJ in 2016 to 525 PJ in 2030 (Schoots et al.,
2016).
As regulated in its renewable energy targets,
The Netherlands has dedicated itself to use 14%
of its gross final consumption from renewables
in 2020 and 16% in 2023 (Sociaal Economische
raad [SER], 2013). Yet, despite its accelerating
adoption of renewable energy, it is lagging at
5,8% in 2015 and is expected to keep behind on
its target, reaching only 12,5% in 2020. However,
the second goal in 2023 of 16% is expected to
be reached with a minor deficiency of 0,1%
(European Commission, 2015b; Schoots et al.,
2016). The growth of renewable energy usage in
the electricity sector has been much higher and
will expectedly rise from 15,0% in 2016 to 37,7%
in 2020 and 41,1% in 2023, as shown in figure 2.
The most important policy measure that has
enabled the government to influence the
achievement of the renewable energy targets is
the so-called SDE+ market premium scheme.
Instead of a fixed tariff for each unit of energy
delivered as with FiT schemes, the SDE+
program offers only the difference between the
market prices of power and the cost price of the
figure 2: Historical data up to and including 2015 and projection of electricity production from 2016 by energy source in the
Netherlands. Own representation of data from the National Energy Survey (Schoots et al., 2016).
0%
25%
50%
75%
0
100
200
300
400
500
2000 2005 2010 2015 2020 2025 2030
Ren
ewab
le g
ener
atio
n/
tota
l gen
erat
ion
Elec
tric
ity
pro
du
ctio
n (
PJ)
solar PV Wind offshore Wind onshore
Biomass other renewable Coal
Gas other non-renewable percentage renewable

9
technology.10 The premium is paid for by a
surcharge on the energy tax for household
consumers. Other measures in the energy
agreement are tax breaks for local energy
cooperations and the stimulation of R&D (SER,
2013). The climate agenda (Ministery of
Infrastructure and Environment [IM], 2013) and
energieagenda (EZ, 2016a) reaffirm the role of
the SDE+ scheme while stating that the EU-ETS
should gradually take over the main role as a
stimulus for sustainable development once it
becomes more effective.11
One of the most important barriers to the
growth of RE adoption in the Netherlands has
been the relative instability of policy (IEA, 2014a;
Negro et al., 2012). However, the most recent
policy agenda indicates a continuation of the
SDE+ scheme as primary instrument even after
2023 when the 2013 renewable energy targets
of the energy agreement expire (EZ 2016a).
10 As an example, in a fixed FiT scheme, a wind turbine operator would receive a regulated fixed amount per unit
of energy fed into the grid, e.g. 7 €-ct per kWh. In a market premium scheme, the same wind turbine generator
would receive only the difference between cost price, e.g. 7 €-ct per kWh, and the average market price, e.g.
4 €-ct per kwh. The operator receives a variable market price, and a fixed-feed in premium of 3 €-ct per kWh.
11 While the European Union Emission Trading Scheme (EU-ETS) should already have impacted sustainable
development, low carbon prices due to a surplus of emission allowances have limited this effect (European
Commission, 2016). Yearly allowances should decrease untill 2030, thus increasing scarcity, which leads to
higher carbon prices.
Other barriers, as mentioned by the IEA, are the
lead time until the plants are connected to the
grid, environmental protection and public
acceptance (IEA, 2014a).
3.3. Flexibility
The previous sections introduced a set of
barriers for the steady diffusion of renewable
energy technology. This section will discuss and
compare policies and regulation in The
Netherlands, in the selected high VRES
penetration countries, and research that
addresses problems of flexibility and grid
integration of VRES specifically.
Countries engaged in an energy transition
are quickly moving towards larger fractions of
variable renewables in their system. figure 3
shows some of the countries with the highest
percentages of variable renewable energy
generation, as well as the Netherlands and its
figure 3: Percentages of VRES technologies with respect to total power generation in several jurisdictions (large stacked colums). The
amount of total renewable generation as percentage of total electricity production is given as points. The smaller colums represent
the 2 yearly development of VRE generation from 2006 to 2014. The graphs are based on 2006 to 2014 data by the IEA (2016), except
for electricity generation in California and Texas. The graphs of these USA jurisdictions are based on 2008 to 2014 data by the
California Energy Commission (2016) and 2016 data of ERCOT (2017) respectively. Note that the total renewable energy electricity
generation of Norway is not shown, because it lies outside the graph at 98% renewable energy.
0%
10%
20%
30%
40%
50%
60%
Denmark Portugal Spain Ireland Texas Germany California UK Belgium Netherlands Norway
Solar Thermal Wind
Solar PVTotal Renewable

10
neighbouring (interconnected) countries.
Renewable energy production has risen in each
of these countries since 2006. The growth is
dominated by the VRE technologies of wind and
solar power. VRE generation in this period grew
on average by 3,6 %-point per year in Denmark
while only by 0,4 %-point per year in the
Netherlands. The jurisdictions taken into
consideration for the analysis of flexibility policy
are Denmark, Spain, Ireland, Texas, Germany
and California. The selection is based upon their
status in the energy transition, experience with
VRES and diversity of grid situations. Although
Portugal also belongs to one of the most
advanced countries with regards to its VRES
integration share, the similar grid and
environmental situation to Spain reduces the
added value of analysis. While Norway is one of
the countries with the largest percentages of RE
penetration (98%, see figure 3), it relies almost
exclusively on hydro-electricity and is therefore
of limited interest for flexibility policy in high
VRES countries. The other countries that are
shown in figure 3, however, are subject to a
variety of situations.
The diversity of grid situations of these
countries is shown in table 1. Relevant
properties according to IEA-RETD (2015a) are (1)
the VRE portfolio, (2) the geographical
distribution of VRE, (3) the interconnection with
other jurisdictions and networks, and (4) the
flexibility of the system (see table 1). The amount
of VRE in their portfolios vary from 13,7% to
42,5%. All of them have shown an increase in
VRE generation over the period from 2006 to
2014, on average by 1,9 %-point per year (see
table 1: grid properties of electrical Networks in the countries under consideration.
Property Netherlands Denmark Spain Ireland Texas
(ERCOT)
Germany California
(CAISO)
Variable
Renewable
energy in
portfolio*
7,7%
(low) 42,5%
(high wind)
23,6%
(high wind
and solar)
19,5%
(high wind)
15,0%
(mid
wind)
14,9%
(mid wind
and solar)
13,7%
(mid wind
and solar)
Geographica
l distribution
of VRE**
Mostly
distributed1
Mostly
distributed
Well
distribute
d
Mostly
distributed
Mostly
in one
Area
High
concentrat
ion in few
areas
Mostly
distributed
Interconnec-
tion with
other
Jurisdiction-
**
Strong2 Strong Weak Synchronously
Independent
Synchro-
nously
indepen
dent
Strong Strong
Flexibility of
the system**
High
flexibility
High
flexibility
High
flexibility
High flexibility Mid-
flexibility
Mid-
flexibility
High
flexibility
* Own calculation. For data source see note under figure 3.
** Based on a report by IEA-RETD (2015a), except The Netherlands. See justifications below. 1 Currently, power plants are distributed quite evenly, but because of development of off-shore
wind power, the concentration is moving towards the shores (TenneT, 2016). 2 Interconnection capacities with neigbouring counties are ‘substantial’ at about 33% of its peak
load (Frontier Economics, 2015): 3 Dispatch: currenty large amount of dispatchable gas fired power plants (Frontier Economics,
2015). Storage: scarcely available and is not expected to be used untill 2035 (Frontier
Economics, 2015). Demand side response: not expected to be used to a large scale untill 2030
(Frontier Economics, 2015)

11
figure 3). To cope with the changing power
supply situation, a large set of varying solutions
has been proposed, planned and adopted in
these countries.
In the Netherlands, the VRES penetration is
in the low range with 7,7% of the electricity
produced by solar photovoltaic (PV) and wind
power combined in 2014 (IEA, 2016).12 Secondly,
the geographical distribution of power
production is quite homogeneous but expected
to be more concentrated at the shores in the
future, demanding stronger connections with
the rest of the country (TenneT, 2016). Thirdly,
the country has strong grid connections with
the neighbouring countries, including plans for
strengthening further interconnection capacity
(Frontier Economics, 2015).13 Finally, according
to IEA-RETD (2015), flexibility is governed by the
dispatch, storage, and demand-side response
abilities. Whereas storage and demand-side
response are rarely developed, dispatchable
gas-fired power plants can provide more
flexibility than currently necessary (Frontier
Economics, 2015). As will be discussed in further
chapters, however, other flexibility options will
need to take over this role when moving
towards higher percentages of VRES and with
dispatchable plants decreasing in importance.
3.3.1. Flexibility challenges
As has been mentioned in the introduction of
this chapter the variability of VRES leads to a
number of issues that need to be addressed in
the short and long-term in order to maintain the
reliability of the electricity grid while minimizing
the cost of integrating high shares of VRES
(Martinot, 2016). The most relevant variations
are those in residual load, which refers to the
energy demand while subtracting the available
12 The IEA-RETD (2015a) considers the German share of VRES as “high wind penetration”, while wind energy just
covers 9% and solar energy 6% of the total electricity production (IEA, 2016). A mid VRES penetration region
according to IEA-RETD (2015) is California, where the wind share is 6% and and solar (PV and thermal) share is
8% (California Energy Commission, 2016).
13 Meant here is the physical grid interconnection capacity. However, market integration with other countries is
an ongoing process as well and equally important for the efficient usage of the interconnection capacity and
therefore for the smoothing effect of VRE generation when aggregated over larger geographical regions. For
the smoothing effect, see the market design section 3.3.2.2.
14 This latter situation will happen more often when the share of renewables rises.
variable power. Residual load, therefore, shows
the amount of power that needs to be covered
by flexible resources. What is necessary from
these resources is determined by the
characteristics of the residual load fluctuations.
In case of positive residual load, it needs to be
covered either by a flexible power supply or by
reducing the load through demand-side
resources. In case of negative residual load,
either supply resources need to be curtailed, or
demand needs to be increased.14 The
characteristics of such variations can be
described by three different dimensions (Van de
Vegte, 2015). Firstly, the timescale in which the
variations occur is of importance. Variations in
seconds require different measures than
variations that occur seasonally. Secondly, the
difference in power needed (in e.g. MW) during
a fluctuation determines the required capacity
to respond to it. Thirdly, the amount of energy
(MWh) that needs to be covered during
fluctuations determines the reserve energy that
should be ready for usage in case of expected
or unexpected fluctuations of the residual load.
These variations manifest themselves in
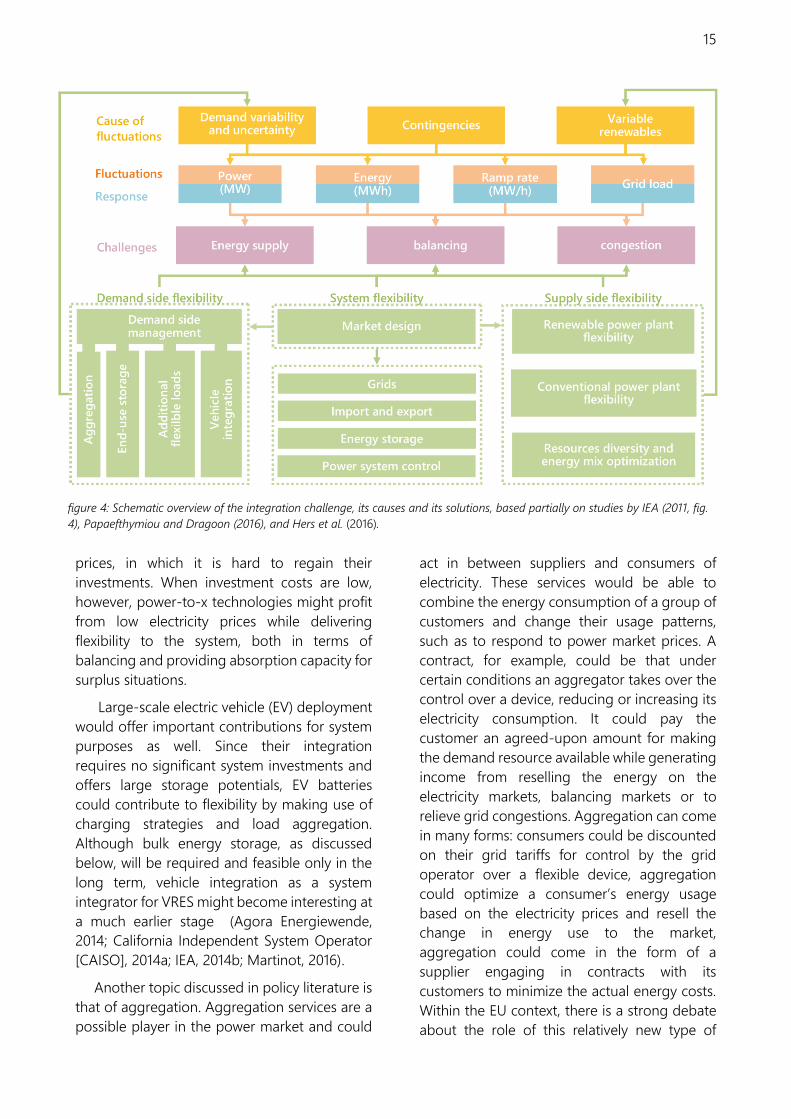
distinct challenges, as has been categorized by
Hers et al. (2016b). These challenges are energy
supply, balancing and network congestion.
Firstly, energy supply refers to the response
to long-term variations. At different times,
seasonally occurring variations will both create
scarcity and abundance in electricity supply.
This occurs both in the cases of wind and solar
power. Therefore, when VRES occupy larger
percentages of the available power capacity, the
system increasingly needs to deal with
shortages and surpluses. In case of shortages,
the system either needs to have enough flexible

12
capacity available or decrease demand to cover
the gap caused by low VRES production. In case
of energy abundance, VRES will need to be
curtailed, or demand needs to be increased.
Balancing refers to the response to variations
occurring on shorter timescales. While the
fluctuations might not be great in terms of
energy, power supply in a VRES-heavy system
might increase or decrease steeply from one
moment to the other and might do so
unexpectedly. To respond to such variations
sufficient power and energy needs to be
available but, at the same time, it should be able
to follow the rate of change of the residual load.
Therefore, not only should sufficient capacity
and energy be readily available, but ramp rates
(in e.g. MW/h) should be high enough as well to
cope with fast and unpredicted variations.
The final dimension of the flexibility
challenge considers its spatial aspect. While
VRES are variable over time, they also cause
changes in power flows through the grid
system. At some points, peak loads on the grid
will increase, requiring either grid strengthening
or options to take the load off the grid. A clear
case of congestion due to the increase in VRE is
the high wind power feed-in in the north-west
of Germany during hours of strong wind, while
demand is mostly found in the south. The
resource dependent, rather than load
dependent placement of resources creates
stronger segregation of load and consumption
centres and therefore, dependence on a
strengthened grid system to connect them.
While it is technologically possible to
respond to each of these challenges, both
consequences of the problems as well as its
solutions come at certain costs. A body of
research is performed on such ‘integration
costs’. Integration costs are defined by Hirth,
Ueckherdt and Edenhofer (2015) as the gap
between the market value of energy from a
certain VRE technology and the average market
price of energy while assuming a perfect
market. According to them, integration costs of
VRES technologies tend to increase once their
penetration increases. This economic
perspective is consistent with the assessments
mentioned earlier: increasing penetration
grades increase the challenge for energy
supply, balancing as well as congestion. In the
words of Hirth, et al. (2015):
We propose a decomposition of
integration costs along three inherent
properties of VRE: uncertainty causing
balancing costs, locational inflexibility
causing grid-related costs, and temporal
variability causing profile costs. (p. 935)
Thus, besides a technical and social issue, the
flexibility challenge can be understood as an
economic development. Market design and
regulation are, therefore, important aspects in
responding to it. Moreover, because policy and
regulation can introduce measures to increase
the value of VRE, it can decrease integration
costs. As an example, while the value of wind at
a certain moment might be low due to low
demand, a measure to improve the market
might be able to increase demand at that time
and therefore, increase the value of the
electricity.
A related discussion about the economic
aspects of VRE integration centres around the
so-called merit-order and compression effects
(see e.g. IEA (2014b, pp. 29–31) and Hirth (2013)).
Because of the low variable costs of renewables,
their bid prices in the market are usually much
lower than that of conventional power
technologies. Since the market dispatches the
lowest bids first, higher-merit technologies such
as gas-fired power plants are pushed further
out of the market. With the increase of VRES
penetration, market prices decrease at times of
high wind and solar feed-in. This is referred to
as the merit-order effect. The compression
effect refers to the decreasing capacity factors
of power plants that have higher variable costs
(IEA, 2014b). At the same time, VRES also erode
their own market, as returns on investments
decrease with decreasing market prices.
Although their variable costs are usually low,
their investment costs are high, because of
which high margins are needed to get a positive
return on investment. A Regulatory Assistance
Project (RAP) report, on the other hand,
indicates that:

13
contrary to a common misconception,
marginal clearing prices in a properly
functioning, fully competitive market
reflect the value of the marginal kWh of
electricity – this may or may not equal the
marginal cost to produce that kWh, and
in many scheduling periods it clearly does
not nor should it. (Keay-bright, 2013, fig.
20, emphasis my own)
The author indicates that although prices might
decrease, this is not a permanent effect of VRES
integration, as scarcity will increase them again.
A CEPS report confirms that depressed prices in
Germany were only partially caused by the
merit-order effect. The reason for the merit-
order effect, moreover, is understood not to be
caused by the market, but rather as an effect of
dedicated policy instruments to stimulate RES
(Genoese & Egenhofer, 2015). Therefore, not the
properties of VRES determine low average
prices on the market, but rather its top-down
stimulation taking place outside of the market.
As mentioned in the RAP report, the price of
electricity indicates its marginal value, rather
than its marginal costs. However, as much of the
renewable energy production is correlated
(taking place at the same time), surplus still
reduces the prices for electricity, particularly
affecting VRES. As with the ‘integration cost’
interpretation of the economic effect of VRES,
understanding of the merit-order effect can also
show how introducing flexibility into the power
system can reduce their decreasing value. E.g.
Hirth (2013) shows that the integration of
flexibility options could increase the value of
VRES since it reintroduces additional value to
energy at a certain point in time or place.
The flexibility needs and challenges of the
Netherlands have, most notably, been
considered by Frontier Economics (2015), as
commissioned by EZ, and by CE Delft (Hers et
al., 2016). Both studies, however, show that
15 Peak load refers here to load values occuring less than 1500 hours per year. While the peak load in 2023 is
between 16 and 18,5 GW, the residual peak load occurs between 13 GW and 18,5 GW. Therefore, a greater
amount of load is needed to cover the top 1500 hours of a year. The middle load refers to capacity that is
dispatched 1500 to 7000 hours per year. The baseload refers to capacity that is dispatched more than 7000
(out of 8760) hours per year.
flexibility is currently not very challenging within
the foreseeable future, considering a large
capacity of flexible power plants (as will be
discussed under supply-side flexibility in
chapter 3.3.2.4). Yet, the CE Delft report does
show an increase in flexibility needs until 2023.
The demand for peak capacity might increase
by 30% with respect to 2013 (to 5 GW). The
demand for balancing capacity increases by
40% (to 1,2 GW). Grid congestion in capacity
shortages might arise of about 0,5 GW in the
low voltage grid, 1,2 GW on the medium voltage
grids, and 1,3 GW on the high voltage grids.
(Hers et al., 2016).
Changes due to the integration of VRES can
be understood by the analysis of the difference
between duration curves for load and residual
load. One can see from the duration curves for
2023 by Hers et al. (2016, fig. 9), that peak load
increases from 2,5 to 5,5 GW. At the same time,
the middle load remains equal and the reliance
on baseload decreases from 11 to 8 GW.15 This
confirms the compression effects as discussed
earlier: capacity factors decrease due to
stronger variation. The same duration curves
show that the occurrence of certain loads is
significantly reduced due to the introduction of
VRES. It shows, for example, that the situation
with of 8 GW or more load occurs 20% less
often. This means that the capacity factor of
power plants dispatched at this load is, on
average, reduced by 20%. For power plants
dispatched around 14 GW, the compression
effect is much greater with a 75% reduction of
their capacity factors.
Still, according to Frontier Economics (2015),
the flexible production capacity will be sufficient
until at least 2035 to ensure resource adequacy
(energy supply) as well as balancing. Sufficient
interconnection capacities with neighbouring
countries, flexible gas-fired power plants, and
low internal congestion cause the Dutch market

14
to be well positioned for mass integration of
VRES (Frontier Economics, 2015).
3.3.2. Flexibility options
The set of solutions related to the integration
challenges are often labelled as ‘flexibility
options’, referring the ability of certain policies
and practices to deal with variations in power
production caused by VRES or to decrease the
fluctuations of VRES itself (Fraunhofer IWES,
2015; Hogan, Weston, & Gottstein, 2015; IEA,
2014a; Papaefthymiou & Dragoon, 2016;
SWECO et al., 2015). According to
Papaefthymiou and Dragoon (2016), these
challenges can be addressed by 9 different
directions that address the flexibility challenge.
In this paper, these directions were merged into
four categories, as shown in table 2, also based
on IEA (2011). The flexibility options address
energy supply adequacy, as well as the
balancing and grid congestion challenges.
The following paragraphs will discuss the
problems and solutions offered by The
Netherlands, other countries, research, and
stakeholders within the range of each of these
Flexibility options. The flexibility challenges as
described in the last section and the flexibility
options have been summarized in figure 4.
3.3.2.1. Demand-side flexibility
Firstly, Demand Side Management (DSM) refers
to the ability of loads to respond to the
availability of electricity generated in the power
system. This includes not only the activation of
the flexibility of existing loads but also the
creation of additional flexible loads and
electrification of non-electricity powered
sectors (Papaefthymiou, Hasche, & Nabe, 2012;
SWECO et al., 2015).
Albadi and El-Saadany (2008) classify
demand-response programmes into two broad
categories: incentive-based programs and
price-based programs. Whereas incentive-
16 Some of these practices are inherently linked with storage, since the flexibility in the timing of the usage of
these devices and processes is often determined by their ability to store the final energy for later use. Even
though in table 2 storage is included in system flexibility, the first category includes the options here that
Papaefthymiou and Dragoon (2016) describe as end-use storages, since they always take place at the demand
side (see table 3).
based programs engage electricity consumers
to offer their demand flexibly by offering
specific incentives for the bidding into balancing
markets, or for direct control over the load,
price-based programs intend to offer flexible
prices to consumers such that they are self-
motivated to shift their load to off-peak times
or shave their peak energy usage.
The conversion of power into heat (power-
to-heat) and cooling, the use of electricity for
desalination, electric vehicle integration, several
industrial processes (power-to-products) and
power-to-gas are of particular importance for
creating demand-side flexibility. The ability to
cope with variations can be determined by the
inertia of the technology, its energy storage
possibilities, and the ease of a time-shift of the
process (IEA, 2014b).16
Thermal storage in buildings and industrial
heating and cooling allow a shift in the usage of
electricity to improve the match of consumption
with the VRES electricity production. The shift in
time could both reduce peaks and valleys of
residual load, which otherwise would need to be
covered by other flexibility options
(Papaefthymiou et al., 2012). Since water can
also be stored relatively easily at relatively low
cost, the flexibility of electricity driven
applications such as water pumps and Reverse
Osmosis desalination plants enables them to
participate in the markets for ancillary grid
services (Kim, Chen, & Garcia, 2016). Shifts in
usage patterns are possible for all devices that
have some flexibility in their time of use, such
as industrial processes that can obtain a variable
production in combination with a buffer for
their produced goods. Such power-to-x type of
technologies can be used to absorb energy at
times of surplus. It is problematic, however, that
if such a technology has large investment costs,
they are not likely to be viable. They depend on
a small number of hours with very low electricity
15
prices, in which it is hard to regain their
investments. When investment costs are low,
however, power-to-x technologies might profit
from low electricity prices while delivering
flexibility to the system, both in terms of
balancing and providing absorption capacity for
surplus situations.
Large-scale electric vehicle (EV) deployment
would offer important contributions for system
purposes as well. Since their integration
requires no significant system investments and
offers large storage potentials, EV batteries
could contribute to flexibility by making use of
charging strategies and load aggregation.
Although bulk energy storage, as discussed
below, will be required and feasible only in the
long term, vehicle integration as a system
integrator for VRES might become interesting at
a much earlier stage (Agora Energiewende,
2014; California Independent System Operator
[CAISO], 2014a; IEA, 2014b; Martinot, 2016).
Another topic discussed in policy literature is
that of aggregation. Aggregation services are a
possible player in the power market and could
act in between suppliers and consumers of
electricity. These services would be able to
combine the energy consumption of a group of
customers and change their usage patterns,
such as to respond to power market prices. A
contract, for example, could be that under
certain conditions an aggregator takes over the
control over a device, reducing or increasing its
electricity consumption. It could pay the
customer an agreed-upon amount for making
the demand resource available while generating
income from reselling the energy on the
electricity markets, balancing markets or to
relieve grid congestions. Aggregation can come
in many forms: consumers could be discounted
on their grid tariffs for control by the grid
operator over a flexible device, aggregation
could optimize a consumer’s energy usage
based on the electricity prices and resell the
change in energy use to the market,
aggregation could come in the form of a
supplier engaging in contracts with its
customers to minimize the actual energy costs.
Within the EU context, there is a strong debate
about the role of this relatively new type of
figure 4: Schematic overview of the integration challenge, its causes and its solutions, based partially on studies by IEA (2011, fig.
4), Papaefthymiou and Dragoon (2016), and Hers et al. (2016).

16
player. In the ‘clean energy for all Europeans’,
also called ‘winter package’, the EU commission
proposed that every member country should
“define frameworks for independent
aggregators (…) along principles that enable
their full participation in the market” (European
Commission, 2017). While aggregation services
are already possible in many jurisdictions, they
do not have independence because companies
still need to cooperate and engage in contracts
with them. Since aggregation is not necessarily
in their best interest, CE Delft and
Microeconomix (2016), claim that a position
independent of energy companies is desirable
to facilitate the development of aggregators.
The question is, however, which model should
be incorporated to do so. A number of different
formats have been proposed by USEF to define
17 Because the possible formats for the independent aggregator is a subject in itself, it cannot completely be
discussed here. For more information, please refer to USEF (2015, 2017), and De Heer and Van der Laan (2017).
the aggregators’ balancing responsibility and
their relation to suppliers (USEF, 2017).17
Some possibilities for demand-side
management are identified and acted upon in
the Netherlands. Firstly, Dutch policy aims to
achieve flexibility for household consumers by
moving towards a quarter-hourly dynamic
pricing of power. To do so, ICT-systems are
planned to be modernized while the mass-
rollout of smart meters is expected to be at
more than 80% of all connections by 2019.
These developments are planned such as to
allow and stimulate dynamic consumer tariffs
on a large scale from 2019 (EZ, 2016c).
Concerning the aggregation discussion, EZ
currently considers its possibilities for
aggregating entities to operate more freely.
According to CE Delft and Microeconomix
(2016), currently, no regulatory arrangements
table 2: categorization of flexibility options, as adapted from Papaefthymiou and Dragoon (2016).
Categories in Dragoon and
Papaefthymiou (2015) #
Categories in this
research Description
1. Demand side management
1 Demand side flexibility
Activation of the flexibility of demand to respond
to the availability of energy resources, with or
without the help of an aggregating entity. This
includes efficiently increasing the used energy in
case demand exceeds supply and vice-versa, and
end-use storage options such as battery home
systems or electric vehicles.
2. Surplus Energy
7. Power markets 2 Market design
Adapting of the design of the power markets to
optimize incentives for flexibility and enable
participation of VRES in markets.
3. Distribution networks – smart
grids
3 Sytem flexibility
Measures that impact flexibility of the power
system in between supply and demand. This
includes transmission and distributions grids and
energy storage.
4. Flexible transmission systems –
supergrids
5. Energy storage
6. Non-synchronous generation
8. VRES control
4 Supply side flexibility
Using the potential which the supply side holds to
respond to an imbalance in demand and supply.
This includes stimulating the flexibility of individual
generators, but also their mix, their control, and
prediction of VRES availability 9. Resource diversity
17
are made to facilitate the independent
aggregation of demand-side resources. Yet, the
contractual relations necessary between the
supplier or BRP on the one hand and the
aggregator on the other are usually not
considered problematic in the Netherlands. The
availability of many parties and the related
presence of competition prevent energy
companies from blocking their entrance (Hers
et al., 2016). Finally, the barriers that exist for the
system-friendly integration of electric mobility,
thus enabling its demand-side potential, is also
being revised through a set of new laws18
(Movares, 2016).
In Denmark, since 2005, electricity usage
during high wind injection is stimulated in the
district heating system. If CHP capacity is
available in the district heating system, tax
reductions are given for electricity used by
boilers. In this tax system, district heating
companies are inclined either to shift their CHP
output from electricity to heat or use electric
boilers at high wind injection. Furthermore,
since 2013, tax for electricity usage for comfort
heating has been reduced to stimulate
investment in heat pumps and household
electricity boilers. Although through these
policies, Denmark grew considerably in its
flexible CHP capacity, electric boiler capacity is
still limited. Nevertheless, the integration of the
heating and power sector is responsible for a
large part of the Danish system flexibility
(Danish Ministry for Climate Energy and
Building, 2013; Ea, 2015). The Danish
government, similarly to the Netherlands,
formulated plans for a smart meter roll-out, and
are planning towards allowing flexible pricing in
a smart-grid strategy (Danish Ministry for
Climate Energy and Building, 2013).
The German policy for demand-side
management focusses on its market structure:
“Demand side management is a commercial
18 However, The instute ElaadNL, which gathers experience in the area of smart charging, opposed the law that
was passed recently. According to them, the law ‘VET’ hampers the development of the smart integration of
electro-mobility, since it does not allow grid operators to experiment in this area (Onoph Caron, 2017). Grid
operators are restricted in their operations because of their limited role, and regulated position within the
energy market. As will be mentioned later, the position of grid operators is subject to a wider discussion.
decision. In the electricity market 2.0,
companies take their decisions on a commercial
basis” (Bundesministerium für Wirtschaft und
Energie [BMWi], 2015b). The strategy is to allow
maximum flexibility of power prices and, thus,
let the market incentivize demand-side
management where necessary. The market-
based strategy, however, is yet only of interest
for companies that are ‘capacity profiled’. For
household consumers, the introduction of
smart meters is part of the Ministry of Economic
Affairs and Energy’s (BMWi’s) planning already
since the 2009 EU Directive that required
member states to do so. The smart meter roll-
out yet needs to take place and is restricted to
consumers with high energy demand (Lang,
Heun, & Assion, 2016).
In Spain, the mass rollout of smart meters
and variable pricing for small consumers,
however, has been implemented to a much
further extent and is planned to be finished by
2018. A ‘Voluntary price for small consumers’ is
already in place since 2014 (Comisión Nacional
de los Mercados y la Competencia [CNMC],
2015). Until now, however, economic signals for
domestic consumers have been too weak for
this group to join in demand response
(Fernández, Payán, Santos, & García, 2017).
California is also changing its electricity tariffs
to better reflect market prices and, therefore,
availability. California already has a Time-of-Use
(ToU) scheme for non-residential load, with
different tariffs for peak hours and off-peak
hours. According to the regulator California
Public Utilities Commission (CPUC), however,
these do not properly reflect the price
fluctuations in the electricity market since they
are not designed for integrating VRES. CPUC
has initiated pilots with ToU schemes of utility
companies, which are expected to lead either to
better aligned ToU with actual market prices or
dynamic rates over smaller timescales.

18
3.3.2.2. Market Design
Market design and cost allocation includes all
policy and regulatory actions considering the
energy market and economic incentives to
enable flexibility from the supply side, demand
side as well as the system. This section considers
eight subjects of market design: market access,
market completeness, market pricing, VRES
participation, market coupling and integration,
representation of grid conditions, and a
discussion of capacity mechanisms. The first
three concepts are discussed together, as these
subjects are highly interlinked.
Firstly, the concept of market access denotes
the possibilities and barriers that exist for
demand-side resources and VRES to participate
in wholesale markets. For demand side
resources it is important that they have access
to bid into the day-ahead market (DAM),
Intraday market (IDM) and reserve markets, but
it is critical that aggregators are allowed to do
so independently of energy companies:
“aggregation services should be allowed
without the explicit consent of the supplier, so
long as compensation for the impact on the
supplier’s balancing area is assured” (CE Delft &
Microeconomix, 2016, p. 47). Furthermore,
prequalification requirements by TSO’s can be
restrictive and based on the original centralised
power system. Product specifications for bids
into the market can further limit the ability of
demand-side resources and distributed VRES to
enter markets. Both minimum energy volumes
and product durations of reserve power can be
too large for many types of demand-side
resources and VRES. The same accounts for the
obligation that exists in some regions that
reserve power needs to be offered
symmetrically. This means that if an actor
decides to bid into the downward reserve
market, it must bid the same amount into the
upwards reserve market and vice-versa. Since
this is not possible for all balancing services
providers (BSP), some are unnecessarily
excluded (CE Delft & Microeconomix, 2016).
Secondly, market completeness is achieved
when there is a continuous set of markets
ranging from very early bids to real-time
markets. Oversimplified markets can cause
inefficiencies. The most important reasons for
markets to be incomplete are either the
impossibility of market players to hedge their
risks or transaction costs caused by trading
constraints (Willems & Morbee, 2008). An
important aspect of completing the market is
the alignment of trading periods and the
alignment of delivery periods. Decreasing the
gate closure time and decreasing the temporal
granularity of the traded products improves the
ability of all market players to bid into the
market efficiently, including VRES and
aggregators. Decreasing the gate closure time,
the time difference between the closure of the
market and the delivery of the product
significantly reduces the forecast errors of wind
power producers (Holttinen et al., 2016).
Reducing the gate closure time, therefore,
increases the ability to bid their produced
energy into the right market. The temporal
granularity defines the length of the product
offered by the producer. Since wind and solar
power generation can have strong variations
over short time scales, shorter duration of
energy and balancing power products lead to
improved integration into the power markets
(Brijs, De Jonghe, Hobbs, & Belmans, 2017;
Henriot & Glachant, 2013; Neuhoff et al., 2015).
Another discussion within the subject of market
completeness is whether markets should be
continuous or in the form of discrete auctions.
There are two reasons that this is relevant to the
flexibility discussion. Firstly, the addition or shift
to auctions might lead to a more liquid and,
therefore, stronger intraday markets (IDM).
Since a stronger IDM improves the ability of
VRES and demand resources to predict their
production, it increases their ability to offer their
flexibility (Neuhoff, Ritter, Salah-Abou-El-Enien,
& Vassilopoulos, 2016). The second reason
relates more to the locational challenge
because auctions allow flow-based allocation of
grid capacity. While such a system is only in
place for cross-border day-ahead markets
(DAM), auctions could enable this for the IDM
as well (Neuhoff et al., 2016). The discussion of
this latter implication of IDM auctions will be
continued when discussing market coupling, as

19
it currently would affect cross-border capacity
allocation only.
Market pricing refers to the way prices are
determined. For wholesale markets such as the
IDM and DAM, prices can be determined on a
continuous or auction basis. While in
continuous markets prices are determined by
the individual bids, auctions are determined
based on all bids bound together, known as a
bid stack. Likewise, prices for balancing energy
in the balancing markets might either be based
on pay-as-bid principles or pay-as-cleared
principles. According to CE Delft and
Microeconomics (2016), pay-as-bid induces
inefficiencies, and therefore increases system
balancing costs, while a pay-as-cleared model
leads to an optimal marginal pricing based
market.
Within these three subjects of short-term
market design, the Dutch market is quite well
adapted to the changing situation due to the
integration of VRES. Firstly, low minimum, high
maximum and negative prices on the spot
markets for electricity allow strong incentives to
deal with shortages and overgeneration.19
19 Still, CE Delft and Microeconomix (2016) claim that even this price cap is unnecessary and undesirable. Only
configurations where no price caps exist at all, which is the case for the Dutch primary reserve market only, are
deemed well adapted for flexibilization of the energy system.
Secondly, the Dutch system of balancing
responsibility applies both to normal as well as
to VRES suppliers. The pricing scheme for
imbalance payment, which is paid to the TSO in
the case of deviation from the program,
incentivizes producers to either sell the power,
curtail where necessary and improve their ability
to predict their power production. Thirdly, the
short gate closure time of five minutes on the
IDM enables parties to have reasonably precise
forecasts of VRES produced during the delivery
period (figure 5). Fourthly, even after the gate
closure, all parties can participate in balancing
through the system of passive contributions. If a
balancing responsible party deviates from its
scheduled programme but this contributes to
alleviating the system imbalance, it will be
rewarded the balancing price instead of paying
for its own imbalance.
Yet, CE Delft and Microeconomix (2016)
show that improvements are possible in a
number of market design aspects to create or
exploit flexibility. Firstly, there are no regulatory
arrangements for independent aggregation
services, as for France and Switzerland in all
their markets. Secondly, unit-based
figure 5: Schematic overview of the different power markets, their bidding periods, gate closure times and contract durations. The
colour coding represents how well different aspects are adapted to the integration of variable renewables in the system. Based on
data compiled by CE Delft and Microeconomix (2016). It should be noted that the IDM is moving to 15-minute contracts.

20
prequalification for the primary reserve market
excludes small-scale renewable energy and
demand-side from participation by pooling
them (Smart Energy Demand Coalition [SEDC],
2014). Thirdly, as shown in figure 5, reserve
capacities in the balancing market (BM) are
contracted for long periods and far in advance.
The primary reserve capacity (R1) is contracted
weekly. The secondary (R2) and tertiary reserve
capacity (R3) markets are both contracted 50%
quarter-yearly, and 50% yearly (CE Delft &
Microeconomix, 2016). Furthermore, Van der
Welle (2016) shows that the dissimilarity of the
gate closure times of the energy markets (DAM
& IDM) on one hand and the reserve capacity
(R1-3) markets on the other prevent market
actors to make well-informed trade-offs
between bidding into the one or the other.
Fourthly, the time blocks for energy bids, both
in the DAM and IDM, are too long (60 minutes)
for full market integration of VRES and demand-
side resources. As a solution, an ECN report
suggests moving to a 15-minute time resolution,
corresponding to the balancing energy
settlement period (Van der Welle, 2016).
According to the EPEX market platform,
however, this step will already be made soon for
20 This point is confirmed by Van der Welle (2016).
the IDM (EPEX Spot, 2017). Fifthly, primary
reserve capacity currently needs to be offered
symmetrically, implying that a bid must offer
equal upward and downward regulation at the
same time, which is often not possible for
demand-side resources.20
Another important market design aspect for
flexibility is whether VRES are required to
participate in the market. A notable cause for a
priority position outside the market is found in
VRES stimulation policy. Although fixed feed-in
tariffs provide strong incentives to investors,
which is necessary for the growth of the sector,
it can hamper flexibility. A continuous feed-in of
electricity, no matter what the market situation
is, reduces or nullifies the ability of system
friendly integration of VRES. ACER and CEER
(2017), both cooperations of EU energy market
regulators, posed that priority dispatch should
be removed, (also for existing RES), net-
metering schemes should be avoided as well as
any other non-market approach to redispatch
and RES curtailment.
In the Netherlands, the market participation
of renewables has already been partially
provided by the design of the SDE+ incentive
figure 6: Results of a Fraunhofer power generation simulation at different levels of spatial aggregation. The pixel level represents
an area of 2,8 by 2,8 km. PLEF stands for the Pentalateral Energy Forum and consists of Austria, Belgium, France, Germany,
Luxembourg, the Netherlands and Switzerland. Figure courtesy of Fraunhofer IWES (Fraunhofer IWES, 2015).

21
scheme. The SDE+ is a market premium
scheme, which exposes electricity producers to
market conditions and thus to variable prices.
Such an incentive scheme decreases flexibility
needs when compared to fixed feed-in tariffs
(Couture, Cory, Kreycik, & Williams, 2010). The
income flow from the market premium is
determined yearly, based on the average
market price of electricity. The income flow from
the market itself is dependent on real-time
market conditions. This means that the total
revenue for VRE producers varies with the
market. These producers, therefore, have an
incentive to adapt their production to demand
and vice versa, thus promoting self-balancing
(Huntington, Rodilla, Herrero, & Batlle, 2017).
Moreover, since 2016 the market premium is no
longer granted during prolonged negative
market prices, to prevent overproduction
during overgeneration (Netherlands Enterprise
Agency [RVO], 2017). For small-scale household
production, a net-metering or offsetting
scheme is still available in the Netherlands. To
promote investment, mainly in rooftop solar
power systems, electricity produced can be
subtracted from electricity consumed, thus, in
fact, granting household consumers a
remuneration of their produced electricity equal
to the retail prices. These prices are much higher
than those on the wholesale market since they
include energy taxes and levies. While this is
considered a clear stimulation policy, it does not
consider the actual value of electricity and is
therefore considered to be disruptive to the
market and ‘undermine flexibility’ (ACER &
CEER, 2017).
Although fixed feed-in tariffs have been the
most popular incentive scheme, many countries
have been moving to more market-based
schemes in the past few years. Whereas
Germany’s dominant incentive policy was based
on fixed feed-in tariffs, it was replaced by a
market-premium scheme in 2014 and gave VRE
producers the same balancing obligations as
other producers (BMWi, 2015a). Like the
Netherlands, the premium has been retracted
for negative market prices since 2016. Denmark
utilizes a market premium scheme as well and
applies the same conditions during negative
spot market prices (Ea, 2015).
The next aspect of market design considers
the market coupling with other countries and
jurisdictions. When the generation by VRES,
especially that of wind power, and power
demand is combined in a larger region, it seizes
to depend on local resource conditions, causing
much lower peaks and valleys in the system
(Fraunhofer IWES, 2015). The expansion of the
balancing area, therefore, strongly reduces the
need for the system to cope with fluctuations
caused by VRES integration. The smoothing
effect that would take place in case of perfect
market and grid connections in 2030 becomes
clear from figure 6. The peaks have reduced
significantly and power production becomes
clearly more continuous when perfect
transmission is assumed all over Europe. While
physical interconnection capacity is necessary
for further aggregation over a wider region (as
will be discussed in the next section 3.3.2.3), the
connections might remain unused if markets are
not connected appropriately.
The coupling of DAM in the North-West
European (NWE) region already improves
market liquidity, decreases overall prices, and
increases flexibility. Prices on the DAM are
coupled through ‘flow-based market coupling’.
This method considers the available
interconnection capacity and allocates expected
flows based on the DAM bid stack. The system
increases the price convergence and smoothing
effect through aggregation of power over a
larger region (IEA, 2014a). The Cross-Border
Intraday (XBID) project, which links the prices in
different bidding zones for the IDM, however, is
still being developed. Although this coupling
system of the IDM over the NWE region has
been postponed several times due to technical
and legal challenges, it is expected to go live in
the first quarter of 2018 (Cross-Border Intraday
Market Project, 2017). The XBID project, unlike
the DAM market coupling, is based on a
continuous market. Because the implicit
allocation of interconnection capacity is not
possible, it cannot adopt the same flow-based
market coupling method. This might be

22
problematic since EU guidelines for Capacity
Allocation and Congestion Management
(CACM) prescribe a market coupling
methodology that based on a continuous
market while incorporating interconnection
capacity implicitly in the prices (European
Commission, 2015a). Yet, since this combination
is impossible, the project has dropped the goal
of implicit allocation. Neuhoff et al. (2016) show
that discrete auctions, besides some other
advantages, would enable flow-based market
coupling and, therefore, more efficient
allocation of transmission capacity.
Yet, whereas market coupling strives for the
representation of interconnector capacities
between countries, the limitations within the EU
member countries’ national grids are not
reflected in their electricity prices and are
completely socialized over the country. The
price for electricity is the same wherever it is
sold or bought within the national grids.
Locational marginal pricing (nodal pricing) is an
alternative pricing mechanism which implicitly
considers network congestion similar to the
method currently used for interconnection
capacity. In a nodal pricing system, price
differences arise between different locations if
the connection between these two locations is
congested. Prices close to the electricity
generation centres will be lower than average,
while prices further from them increase if the
grid in between is congested. Nodal pricing
could have considerable benefits for system
flexibility and costs of VRES integration, as it
leads to system-efficient decisions. This method
of cost allocation could be considered to be a
method of perfect adherence to the cost-
causing principle.
Such a methodology is, to the author’s
knowledge, not under consideration for the
Netherlands, nor within the European context
for its internal market. In several jurisdictions in
the US, however, nodal pricing has occupied an
important position. The Texan ERCOT, California
21 So called Financial Transmission Rights (FTR) can be auctioned to market participants to insure them against
financial burden in case of congestion in the grid. They give the right to the income equal to the price difference
between the source location and destination location (see e.g. Lyons, Fraser and Parmesano (2000)).
ISO (CAISO), MISO, New England ISO, New York
ISO, SPP and PJM grids have transitioned from
a zonal to a nodal market (CAISO, 2017; Daneshi
& Srivastava, 2011; Neuhoff et al., 2013). While
nodal pricing might be the best option to
organize the market according to i.a. Kunz,
Neuhoff and Rosellón (2016), and Hogan,
Weston and Gottstein (2015), the market would
require a more centralised structure, faces some
liquidity risks and is considered by some market
players as a risk, because of a redistribution of
costs (Van der Welle, 2012). Kunz, Neuhoff and
Rosellón (2016), however, show that such risks
can be hedged through financial transmission
rights (FTR), a system that would financially
compensate the ‘victims’ during a transition
towards nodal pricing.21 Another option for a
market representation of grid conditions would
be to approach nodal pricing by defining
smaller bidding zones, which currently coincide
with the national borders in most EU countries.
Thus, differences in prices would arise,
representing congestion taking place in
between the zones. Such a system would
replicate the flow-based market coupling as
done for international (interzonal)
interconnectors. Therefore, it would also need
to deal with the same issues as the XBID project
to incorporate implicit interzonal capacity
allocation for a continuous market.
A final important discussion for market
design is that of capacity mechanisms. The
market models discussed until now remunerate
energy while capacity is remunerated only to
the extent of balancing products. Proponents of
‘energy-only’ markets claim that once price caps
are removed and markets released, scarcity
pricing will continue to give the right incentives
for investments in capacity. On the other hand,
since increasing shares of VRES lead to the
compression of capacity factors of conventional
power plants, the profitability of the latter is
under pressure. According to some, while the
energy only market might be efficient in theory,
it cannot guarantee the security of supply,
23
because decreasing profitability in combination
with inefficiencies makes the market too
uncertain to invest in capacity. Interference in
the market through e.g. price caps further limit
the scarcity effect of pricing in an energy-only
market (De Vries, 2007; Hogan et al., 2015;
Petitet, Finon, & Janssen, 2017). Proponents of
capacity mechanisms claim, that these energy-
only market shortcomings justify additional
market products that remunerate capacity to
give a clear and steady investment signal
through the remuneration of capacity instead of
energy. Both sides are subject to certain risks.
The risk in an energy-only market is mostly that
existing inefficiencies lead to distorted price
signals with inadequate price signals causing
investment risks and, therefore, resource
inadequacy (De Vries, 2007; Petitet et al., 2017).
Capacity mechanisms run the risk of distorting
scarcity pricing, overinvestment, and, therefore,
a “needless escalation of the costs of the
transition” (Hogan et al., 2015, p. 11). Capacity
mechanisms come in many forms as described
by De Vries (2007) and a European Parliament
briefing (2017). Notable examples are capacity
payments, capacity auctions, strategic reserves,
and capacity requirements or obligations.
Capacity payments simply remunerate any
investment in capacity through regulated tariffs
or by auctioning a certain volume of capacity.
With strategic reserves, capacity is purchased or
leased to engaged it only by the system
operator in case of shortage. Capacity
requirements or obligations regulate capacity
investment instead of influencing the market
and might, therefore, not be considered market
design instruments, but rather to belong to
supply-side flexibility measures.
As became clear earlier, the Dutch market
system is an energy-only market. Yet, a
mechanism has been introduced which can be
considered both a strategic reserve as well as a
tertiary reserve market. This so-called
‘noodvermogen’ or emergency power is
contracted yearly by TenneT to cover the
difference in demand and supply if offers in the
primary and secondary reserve markets are
insufficient (TenneT, n.d.-b). In the discussion
whether a market-wide capacity payment needs
to be installed as well, there is a tendency not
support it. The energy-only market is
considered to work efficiently and its scarcity
prices to create the right incentives.
Furthermore, as will be shown under the
heading of supply-side flexibility 3.3.2.4, The
Dutch power system is currently characterized
by over-capacity rather than a shortage.
According to several studies commissioned
by the German BMWi, a capacity market would
not be needed to create sufficient flexible
capacity, as supply-side flexible resources are
deemed adequate for the foreseeable future
(Frontier Economics & Consentec, 2014; Frontier
Economics & Formeat Services, 2014). Because
of that, BMWi decided it would not adopt a
capacity market, but it does include a capacity
reserve outside of the electricity market to
ensure power stability (BMWi, 2015b).
Other EU countries have adopted capacity
mechanisms as well, including strategic reserves
in Denmark, capacity requirements in France,
capacity payments in Spain and Portugal, and
capacity auctions in Great-Britain (ACER & CEER,
2015). Besides the consequences this might
have for the national energy markets, capacity
mechanisms also affect markets in
neighbouring countries. If cross-border
capacities are not considered, capacity
mechanisms in other countries might lead to
over-procurement and, therefore, higher costs
than necessary for the energy transition (ACER
& CEER, 2015).
For an island system that is synchronously
independent such as the Irish grid, supply-side
flexibility is especially important. A generation
capacity statement by EirGrid determines that
generation deficits will occur by 2020 in
Northern Ireland and over the whole Island
possibly by 2023. These capacity adequacy
problems are related to the introduction of wind
power, and its related reduction of the
wholesale market price of electricity. Fossil fuel
plants, having higher marginal costs, therefore,
are less able to recover their investments. If
these power plants are not remunerated for the
availability of their capacity, they will leave the
market, leaving the system with potential
24
deficits. Because of that, the regulators decided
to include a capacity payment mechanism into
the so-called Single Integrated Electricity
Market22 (EirGrid Group, 2016).
Yet one more option to stimulate flexibility in
markets is to offer additional products to
remunerate ramping ability. Whereas the Dutch
power market does not make use of such
products, California initiated the so-called
flexible ramping product to monetize the
capability of producers and demand side
resources to make capacity available at faster
rates (Xu & Tretheway, 2012). California also
makes use of a certain form of capacity
obligations. This, however, will be discussed
under supply-side flexibility (3.3.2.4), as this is
not primarily a market instrument.
3.3.2.3. System flexibility
This section includes policy and regulatory
measures that address the flexibility of the
system in between supply and demand apart
from the wholesale and balancing markets to
cope with the energy supply, balancing and
congestion challenges. This includes smart
grids, distribution grid strengthening and
automation, transmission grid expansion and
strengthening and energy storage.
The concept of a Smart grid can be defined
as:
an electricity network that can efficiently
integrate the behaviour and actions of all
users connected to it - generators,
consumers and generator/consumers - in
order to ensure an economically efficient,
sustainable power system with low losses
and a high quality and security of supply
and safety (European Commission, 2011).
22 Irelands Single Integrated Electricity market (I-SEM) refers to the combination of the Northern-Ireland and
Ireland power markets.
23 Virtual power plants are a concept to describe the control and market participations of the aggregation of
distributed energy sources and demand resources.
24 Allthough Thomsen et al. (2015) claim that participation on markets for households is possible, the potential is
relatively small. However, they expect that the possibility of the industry participating in markets with DSM
resources by means of an aggregating entity is more likely and manageable.
The concept of smart grids is, furthermore,
always connected with information and
communication technology (ICT) (Erlinghagen
& Markard, 2012). Smart grid development
activates the knowledge of the ICT sector to
control generators and consumers. It enables
balancing and control in the distribution system
by DSM, distributed energy storage, and
Distributed Renewable Energy Source (DRES)
integration. While otherwise consumer loads
and DRES are otherwise hardly controllable,
considering their great numbers and small sizes,
smart grids can employ a set of technologies to
aggregate them. The aggregation of small loads
and DRES enables effective control of the
system. Not only do smart grids activate the
technological benefits of system support, but
the aggregation of DRES also allows them to
participate in the energy market in the form of
Virtual Power Plants (VPP).23 This leads both to
technical and economic integration (El Bakari,
2014; Martinot, 2016). The same is valid for the
integration of loads in a controllable DSM pool,
which would enable them to join in ancillary and
spot markets (Thomsen, Roulland, Kellermann,
Hartmann, & Schlegl, 2015).24 As has been
discussed, another asset of smart-grids for DSM
is their ability to support dynamic pricing
models. Because metering can be carried out in
real-time, energy prices are allowed to change
on short time scales as well.
Strengthening the distribution grid, by
increasing cable capacities, will also be
necessary. Even though the smartening of the
grid lessens the necessity of increasing grid
capacity, it seems likely that the development of
higher percentages of DRES and increasing
loads such as electric vehicles in the distribution
system will require it to some extent
(Overlegtafel Energievoorziening, 2015).

25
The Dutch development of smart-grids is in
an exploratory stage. Smart grids are stimulated
through the Innovation Programme Intelligent
Networks (IPIN) in the form of 12 pilot projects
(RVO, n.d.). Locally, a strong penetration of
renewable energy produced is already causing
congestion in low voltage grids at some points.
Although “expectedly the existing grid can
accommodate much [solar photovoltaic
energy,] this does not alter the fact that
problems can arise precisely in the capillaries of
the network if the supply of [solar power] is
higher than for which [the network] is
constructed” (Overlegtafel Energievoorziening,
2015, p. 24, translation). Since virtually no
incentives exist to investigate alternatives, grid
operators have limited options except to
strengthen the grid, while this does not
necessarily entail the highest societal benefits
(Overlegtafel Energievoorziening, 2015). As has
been mentioned under demand-side
management, however, there is a strong focus
on the development of smart meters in the
short run, which is a major first step in the
direction of more technologically advanced
grids.
The development of smart grids in other
countries and states under analysis is often in
the same stage of testing and pilot mostly. Yet,
the roll-out of smart meters is seen in many
jurisdictions (Colak, Fulli, Sagiroglu, Yesilbudak,
& Covrig, 2015). In the EU, Denmark shows the
highest investment in smart grid development
per capita. Germany is considered as the first
country to move from research and
development to demonstration and
deployment projects (Colak et al., 2015).
However, because the work in the smart-grid
development sector is project based and
research in distribution grids is a local matter, it
is hard to identify national policy.
Yet, the Danish Ministry of Energy and
Buildings (2013) has published a smart grid
strategy. Although the document includes a
planning for the introduction of smart meters
25 IOU’s are the private energy companies that operate within the Californian jurisdiction.
and variable tariffs, it discusses flexibility options
that are not directly related to smart-grids as
well, such as heating sector integration. Except
smart metering, smart grid development is just
a small part of the smart grid strategy.
The Californian independent system
operator CAISO published a roadmap for smart
grids on a more operational and technical level
than the Danish strategic roadmap (CAISO,
2010). It describes in detail the actions that will
be undertaken until 2020 for advanced
forecasting, to measure and control grid
conditions using advanced grid applications,
building automation systems and integrating
home area networks, and providing options for
demand response, storage and distributed
energy resources. Moreover, it includes an
architecture of changes to the ISO rising from
smart grid development. An annual smart grid
report by the regulator CPUC is a continuous
check what the Investor Owned Utilities (IOU)
should do and have done for smart grid
developments.25 According to the report, IOU’s
are required to invest and have already invested
in deploying smart meters (CPUC, 2015).
While policy and regulation for the
distribution system mainly address congestion
issues, transmission system expansion and
strengthening address the balancing and
energy supply challenges as well. As has been
discussed in terms of market coupling,
aggregation of demand and supply over a wider
region causes a reduction in flexibility needs
due to a smoothing effect. The amount of
smoothing depends strongly on the ability of
transmission grid to transfer the power from
generation centres to load centres and
therefore on the grid transmission capacity and
other limiting factors such as the market. The
development of modern HVDC technologies
contributes to the ease of long-distance and
low-loss power transmission (Weigt, Jeske,
Leuthold, & von Hirschhausen, 2010). The
automation of control aspects of transmission
system improvement can further improve

26
flexibility by utilizing more of their potential with
real-time control of the capacity based on its
conditions.26
In the Netherlands, the internal transmission
grid congestion is low, and interconnection with
neighbouring countries is already substantial
(Frontier Economics, 2015) and is planned to be
increased (TenneT, 2016). Entso-e’s Ten-Year
Network Development Plan (TYNDP) attempts
on a European scale to reduce congestions
between countries considering long-term
development plans for VRES and changes in
demand. Moreover, the framework of The
North Sea Countries’ Offshore Grid Initiative is
to create a stronger cooperation and planning
for offshore power lines needed both for the
connection of wind parks as well as to harvest
the smoothing potential by stronger
interconnection.27
Because in Germany the supply centres of
renewable energy and demand centres are far
apart, the country experiences pressure on the
transmission grids, which is expected to
increase. Whereas supply centres of wind power
are in the north-west, demand centres are in the
south. Therefore, it plans the expansion of
transmission capacity, most importantly from
north to south by use of high voltage direct
current (HVDC) transmission lines (see e.g.
Agora Energiewende, 2015, fig. 22).
In Denmark, the flexibility of the electricity
system relies on strong integration with
neighbouring grids of Europe including the
well-developed Nord Pool market as well as the
Central West European (CWE) market. These
interconnections enable them not only to profit
from the smoothing effect but also to make use
of the large hydro storage capacities in the
Nordic countries for balancing purposes (Ea,
2015; Martinot, 2016).
26 For example, Entso-E (2015) proposes a dynamic transmission line rating depending on atmospheric
conditions. Using ICT, tranmission system operators can control the amount of power flow over a tranmission
line, depending on its conditions, enabling at times higher capacities than when rated based on the most
hottest conditions.
27 The North Sea Countries Offshore Grid Initiative consist of France, Luxembourgh, Germany, Switzerland, The
United Kingdom, Ireland, Norway, Sweden, Belgium and The Netherlands.
As opposed to several European countries,
the regulator California Public Utilities
Commission (CPUC) identifies that: ”California
may have many low‐cost and “no regrets”
options to pursue before considering
transmission strengthening" (CPUC, 2015, p. 42).
According to the CPUC, the system would
benefit much less from a strengthened
transmission grid as compared to European
grids. In Europe, stronger regional imbalances
between supply centres and demand centres
cause congestion whereas, in the Californian
case, grid strengthening is a relatively expensive
solution to reduce fluctuations in residual load,
because of its limited effect (CPUC, 2015).
Energy storage is another system asset that
could generate flexibility by serving as a buffer
between supply and demand. It is expected that
it will become important only in the longer term
(Agora Energiewende, 2014; Papaefthymiou &
Dragoon, 2016). The role of storage as a
flexibility option is self-evident: it can be used to
absorb energy during the strong availability of
VRES and re-inject the energy into the system
or use it in times of shortage. As has been
discussed under DSM, notable storage media in
the end-use sector are water storage, thermal
storage, and electrical storage. This section,
however, only discusses Electrical Energy
Storage (EES). As shown in table 3, EES only
covers technologies that convert electricity into
other energy forms with the intention to be
converted back into electricity. Within this
category, Papaefthymiou and Dragoon (2016)
include Pumped-Hydro Energy Storage (PHES),
Compressed-Air Energy Storage (CAES) and
battery storage. An addition to these are other
chemical storage technologies such as power-
to-gas and mechanical storage such as
flywheels. PHES makes use of gravitational
energy, storing water at heights by pumping to

27
retrieve it with turbines. The technology is
regarded as the most feasible bulk storage
options to increase system flexibility, both for
large grids and island systems. However, the
potential is limited considering the dependency
on water and specific landscape conditions. The
round-trip (or cycle) efficiency is relatively high
at about 70 to 85% (Kloess & Zach, 2014;
Rehman, Al-Hadhrami, & Alam, 2015). CAES is
another relatively mature technology, in which
air is compressed into containers, which is used
later as a source for a gas turbine to generate
electricity. Several alternatives exist, with
diabetic CAES as the lower-cost but less efficient
(40-50% cycle efficiency) and the adiabatic
CAES as the more expensive and more efficient
(60-80% cycle efficiency) technology. In
comparison, CAES faces several drawbacks:
relatively low efficiencies, low energy density
and, in the case of Diabetic CAES, the need for
additional fossil fuels (Gallo et al., 2016).
Chemical storage has been opted in the form of
gas production by electricity (power-to-gas).
The gas produced can be either hydrogen (H2)
or methane (CH4). Even though all round-trip
efficiencies for all power-to-gas variations are
relatively low, storage of the gas is much
cheaper and are well-adapted to the current
energy system (Lehner, Tichler, Steinmüller, &
Koppe, 2014). The ability to store CH4 for longer
terms (weekly, monthly, and even seasonally) by
making use of the large capacities in the existing
gas grid makes the technology relevant as a
flexibility option. Due to the high costs of
electricity generated from synthetic gas, its
viability depends strongly on the development
of power market prices (Kloess & Zach, 2014).
Battery storage is the most well-known example
of electricity storage, but it remains relatively
unlikely that it will play a significant role for bulk
energy storage, as its life cycle costs are much
higher than those for PHES and CAES and it is
not available for long-term storage (Zakeri &
Syri, 2015). It should be noted that there is a
considerable difference between technologies
meant to respond within the balancing time-
scale and those that reduce long-term
imbalances (energy supply). Long-term energy
storage is more likely to take place using H2 and
CH4 storage, while short-term energy storage
will probably be dominated by PHES and CAES.
As mentioned, the integration of energy storage
and system inertia is expected to start playing
an important role only in the longer term at
higher percentages of VRES.
Specifically for the Netherlands, Frontier
economics (2015) mentions in its report that
storage will not be necessary at least until 2035.
Yet, considering the role that storage might play
eventually, postponing clear regulation and
stimulation would be a missed opportunity.
According to DNV-GL’s roadmap energy
storage 2030, however, lacking policy focus and
coordination within the area of energy storage
is one of the barriers to its further development
table 3: Categorization of storage types based on Papaefthymiou and Dragoon (2016)
Storage type Description Examples
Primary storage Storage of primary energy
inputs, before conversion to
electricity.
Gas and oil fields, hydro reservoirs,
molten salt.
Electrical Energy Storage Conversion of electricity into
another energy form for
conversion back into
electricity at a later time.
Pumped hydro, compressed air, batteries,
power to fuel, flywheels.
End-use energy storage Storage after final
conversion from electricity
into another energy form .
Hot and cold storage (e.g. building
heating or inertia), water storage,
product (material) storage.

28
(Van de Vegte, 2015). As one of the only policy
actions mentioned in the energy agenda, EZ
considers taking away a taxation barrier that
unjustly taxes electricity doubly when stored by
a third party (EZ, 2016a).
The German system has several pumped-
hydro reservoirs at its disposal that are
participating on the balancing markets.
According to the German BMWi, however,
“Additional novel long-term storage
installations which can offset seasonal
fluctuations are only required when there are
very high shares of renewable energy” (2015b,
p. 12). Whereas the short-term balance can be
maintained by the participation of storage
systems in these markets, seasonal fluctuations
will not be addressed by pumped hydro
technology.
As has been discussed, the flexibility strategy
of Denmark has focussed on sector integration
between the power and heat sectors. As far as
storage is concerned, “Denmark has no plans
for electricity storage, relying instead on heat
storage” (Martinot, 2016, p. 12). Furthermore,
abundant storage capacity and flexible
renewable supply are available over the border
in the Nordic grid, the technical and market
access to which is seen as one of the most
important flexibility sources of Denmark (Ea,
2015).
In California, the CPUC decided to initiate
targets for the procurement of storage facilities
by IOU’s. A federal order intends to push utilities
to invest in a total of 1325 MW of storage
capacity by 2020 (Kintner-Meyer, 2014). A
roadmap for energy storage discusses further
actions that need to be undertaken by
regulators to create business cases for storage,
reduce the cost of its grid integration and
decrease uncertainty in the development of
storage facilities (CAISO, CPUC, California
Energy Commission, 2014).
3.3.2.4. Supply-side flexibility
On the supply side, flexibility is provided by
conventional as well as renewable capacity,
including VRES. Different technologies have
different capabilities for flexibility. While nuclear
power is not easily switched off and older coal
power plants can only shut down or start up
very slowly, modern gas-fired power plants
respond very quickly. Important metrics are
capacity, ramp-rate, and controllability of the
supply resources. The ramp-rate is mainly
important to address the balancing challenge,
the energy supply challenge is rather about
having enough readily available capacity. While
wind power can decrease its power production
very quickly, it can only do so if it already
produces, which is dependent on the wind
conditions. Therefore, while wind power is
compatible with the intraday market, it cannot
sell its capacity for balancing purposes over
long time frames.
Flexibility by design of variable renewables
lies in the hand of VRES producing companies.
However, their flexibility can be stimulated by
requiring or incentivising flexible generation
and market participation, as discussed in market
design.
Another important aspect of supply-side
flexibility is the aggregation of distributed VRES.
Since aggregation supports the ability for
supply to match demand, it might help
exploiting their flexibility. Whereas large
producers are already exposed to market
conditions in the Netherlands, smaller-scale
producers have an incentive to feed-in
whenever resources are available. Because
aggregators can sell the distributed VRES under
their portfolio on the balancing markets, they
will adapt the use of their generators to market
conditions. Notably, these actors will curtail
power production under negative prices on the
spot market.
As shown in figure 7, a large fleet of gas-fired
power plants is available in the Netherlands.
Since these can provide flexibility in all markets,
there is no direct need for further flexibilization
by other means. The figure also shows a strong
overcapacity within the conventional share of
power plants. In 2017, the amount of
conventional capacity is much higher than the
peak load. As shown in figure 2, the generation
by gas-fired power plants in 2030 will be much
lower than in the current mix, both in absolute
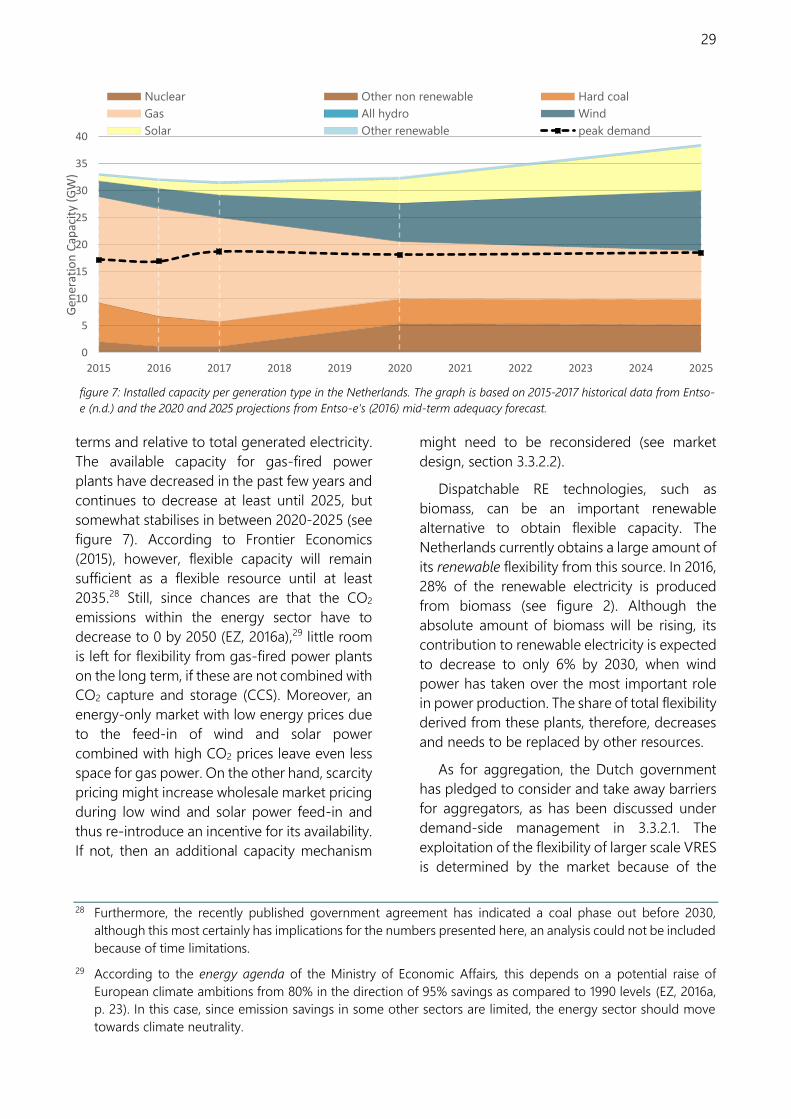
29
terms and relative to total generated electricity.
The available capacity for gas-fired power
plants have decreased in the past few years and
continues to decrease at least until 2025, but
somewhat stabilises in between 2020-2025 (see
figure 7). According to Frontier Economics
(2015), however, flexible capacity will remain
sufficient as a flexible resource until at least
2035.28 Still, since chances are that the CO2
emissions within the energy sector have to
decrease to 0 by 2050 (EZ, 2016a),29 little room
is left for flexibility from gas-fired power plants
on the long term, if these are not combined with
CO2 capture and storage (CCS). Moreover, an
energy-only market with low energy prices due
to the feed-in of wind and solar power
combined with high CO2 prices leave even less
space for gas power. On the other hand, scarcity
pricing might increase wholesale market pricing
during low wind and solar power feed-in and
thus re-introduce an incentive for its availability.
If not, then an additional capacity mechanism
28 Furthermore, the recently published government agreement has indicated a coal phase out before 2030,
although this most certainly has implications for the numbers presented here, an analysis could not be included
because of time limitations.
29 According to the energy agenda of the Ministry of Economic Affairs, this depends on a potential raise of
European climate ambitions from 80% in the direction of 95% savings as compared to 1990 levels (EZ, 2016a,
p. 23). In this case, since emission savings in some other sectors are limited, the energy sector should move
towards climate neutrality.
might need to be reconsidered (see market
design, section 3.3.2.2).
Dispatchable RE technologies, such as
biomass, can be an important renewable
alternative to obtain flexible capacity. The
Netherlands currently obtains a large amount of
its renewable flexibility from this source. In 2016,
28% of the renewable electricity is produced
from biomass (see figure 2). Although the
absolute amount of biomass will be rising, its
contribution to renewable electricity is expected
to decrease to only 6% by 2030, when wind
power has taken over the most important role
in power production. The share of total flexibility
derived from these plants, therefore, decreases
and needs to be replaced by other resources.
As for aggregation, the Dutch government
has pledged to consider and take away barriers
for aggregators, as has been discussed under
demand-side management in 3.3.2.1. The
exploitation of the flexibility of larger scale VRES
is determined by the market because of the
figure 7: Installed capacity per generation type in the Netherlands. The graph is based on 2015-2017 historical data from Entso-
e (n.d.) and the 2020 and 2025 projections from Entso-e’s (2016) mid-term adequacy forecast.
0
5
10
15
20
25
30
35
40
2015 2016 2017 2018 2019 2020 2021 2022 2023 2024 2025
Gen
erat
ion
Cap
acit
y (G
W)
Nuclear Other non renewable Hard coal
Gas All hydro Wind
Solar Other renewable peak demand

30
market exposure trough the feed-in premium
scheme (as has been discussed in 3.3.2.1).
On the supply side, Germany copes with its
flexibility needs using flexible generation of coal
and, to some extent, gas and pumped hydro
facilities (Fraunhofer IWES, 2015, Chapter 5.1;
Martinot, 2015). However, nuclear power plants
are phased out, variable renewable energy
generation is increasing and the growth
potential of pumped hydro is limited. To ensure
resource adequacy, a strategic reserve is
installed as mentioned under market design
(section 3.2.2.2).
In California, supply-side flexibility has been
stimulated by the Californian ISO through a set
of policies. Since the state electricity system is
coping with especially increasing fast and large
ramps, CAISO has introduced the flexible
ramping product, negative pricing on the real-
time market,30 and flexible resource adequacy
criteria and must offer obligations. The ramping
product and negative market prices, as
discussed before, incentivise flexibility through
market signals. The flexible resource adequacy
criteria and must offer obligation (FRAC-MOO),
in contrast, are prerequisites to connected
entities as defined by the system operator,
which can be categorized as capacity
requirements as discussed under market design
(section 3.3.2.2). These criteria and obligations
demand local grid operators and power
generators to comply with the ISO’s flexibility
needs. The flexible resource adequacy criteria
require from local grid operators to ensure the
availability of flexible capacity in their
jurisdiction. The must-offer obligation requires
flexible resources to make bids in the day-ahead
or real-time market when necessary (CAISO,
2014b; CPUC, 2015). CAISO also considers rules
and regulation for the aggregation of
distributed energy resources (CAISO, 2016;
CAISO, CPUC, & CEC, 2014). The so-called
distributed energy resource provider can
aggregate resources to achieve a minimum of
0,5 MW of capacity which it can use to
30 Real-time markets are the equivalent of the European intraday markets.
participate on the day-ahead, real-time and
ancillary service markets.
Supply-side flexibility in Denmark is
stimulated by incentivising system friendly wind
turbine designs. High capacity wind turbines
magnify the peak because their maximum
power production often lies at higher wind
speeds. During times of high wind speeds,
however, such peaks are less valuable. In 2014
legislation has been changed and the amount
of electricity over which the producers receive
feed-in premium now depends on both the
generator size and the rotor size. This has
reduced the skewed incentive to invest in
system unfriendly wind turbines with their peaks
at high wind speeds (Ea, 2015).
Another subject within the category supply-
side flexibility is the role of requirements for
generators (RfG) as defined in grid codes. While
in the Netherlands, all connected generator
technologies need to satisfy the same
requirements, e.g. Denmark and Ireland have
dedicated grid codes for VRES technologies. In
Denmark, differences exist between the RfG for
small power plants (<11 kW), larger PV plants,
larger wind generators, medium size and large
(>1,5 MW) thermal power plants (Energinet.dk,
2017). Ireland has a special category for wind
power as well (IEA-RETD, 2015b). ENTSO-E
names two reasons that dispute the merit of
dedicated RfG per generation type. Firstly, a
single code contributes to the aim for an even
treatment of users of the grid and hence
technology neutrality. Secondly, technology-
specific codes “would have been highly
inefficient in terms of keeping the network code
as simple as possible” (ENTSO-E, 2012, p. 23). A
single code has some disadvantages for the
integration challenge as well. A single grid code
might contain impractical requirements for
VRES and specific properties of VRES can
potentially disrupt system balance, power
quality, or voltage level. Dedicated codes might
be able to improve the integration of wind and
solar power by taking into account their specific
properties.

31
Another final method of reducing flexibility
needs on the supply side is to diversify energy
sources and optimize the energy mix. In the
Netherlands and most other EU countries,
however, the mix is largely decided by the
market, rather than planned top-down. Since
the electricity market has been liberalized, such
design would only partially be possible in the
Netherlands. The abilities to do so would be
limited to stimulation of certain technologies by
subsidies or other programmes. This, however,
would strongly deviate from the technology-
neutral approach as currently pursued.
Nevertheless, the energy report by EZ states that
“an integral approach offers more flexibility and
leads, economically and socially, to more
optimal outcomes than the optimization of
fragments of the system” (EZ, 2016b, own
translation). However, the policy publication
energy agenda (EZ, 2016a) does not refer to
decreasing the flexibility needs as one of the
reasons for aiming at a certain energy mix.
4. Interview Results As is mentioned in the methodology section,
the interviews that were held were semi-
structured (for the questions and interviewees,
see annex A and annex B respectively). The
results will be presented in the same order. The
first section presents general challenges and
discussion in the Dutch power system related to
flexibility, flexibility policy and changing roles in
the power sector. The second section describes
the positioning and ideas of stakeholders in
discussions surrounding policies for flexibility.
4.1. Challenges
As has been mentioned in the methodology
section, the interviews were designed to find the
31 In Germany this situations is often referred to as a kalte Dunkelflaute. This translates to a cold, dark and windless
period of time. In these situations both demand is high due to heating, while power supply by solar and wind
resources is at its lowest. For these situations long-term storage, or additional flexible capacity is necessary,
potentially using power-to-x type resources such as hydrogen or sythentic methane, or natural gas possible in
combination with CCS.
32 As will be discussed further in the next section when discussing capacity mechanims under the market design
heading, interviewees indicated that there are currently a number of signs that there is an overcapacity,
because of strong investments in the last decade. Also refer to the literature sections about market design
(3.3.2.2) and supply-side flexibility (3.3.2.4)
different positions within the discussions
surrounding flexibility policy of different actors
within the Dutch power system. Yet, a high
degree of unanimity was found on many points,
certainly when speaking more generally about
the challenges and flexibility options. The
urgency of flexibility challenges in the power
system was considered unanimously by the
interviewees to be low within all its dimensions:
energy supply, balancing and congestion. An
exception, however, albeit on a relatively small
scale, was that of local congestion problems,
depending on local grid conditions, rooftop PV,
EV, and heat pump penetration grades.
Congestion in the high-voltage grid operated
by TenneT is mostly considered as
unproblematic. Balancing problems were
mentioned to be virtually non-existent at this
point in time. In the words of Frank Wiersma
(TenneT) “We do not think there are
fundamental problems, but there are
developments that need investments to prepare
the system for them.” Yet, energy supply during
the dark and cold hours of the year was
mentioned by different stakeholders as an
important issue that requires more thought.31
These periods are characterised by peak
demand during low wind and solar feed-in.
Certainly when variable resources are combined
with the electrification of heating, seasonal
peaks further increase due to the simultaneous
electricity use in cold winter hours. Yet again,
while the issue is considered to be an important
one, the urgency until now is very low due to
the current overcapacity rather than a
shortage.32 This problem was expected to be
unlikely to arise before 2030, but will probably
continue to grow after that until 2050, in which
year the power sector might possibly be

32
required to have moved towards climate
neutrality (see footnote 29). In the other
direction, dealing with the surplus of energy
during high wind and solar feed-in is also
problematic. This could, however, be improved
fairly easily by creating a better business case
for power-to-x facilities through changes in the
grid tariff structure, as will be further discussed
in the next section under demand-side flexibility
(section 4.2.1).
The reason that the Netherlands was
considered to be largely on track to follow the
developments in the integration of VRES and
electrification of the heat and mobility sectors,
was mentioned to be the well-functioning
electricity market, its many players and its
healthy competition. The liberalized markets,
which were contrasted with other EU member
countries such as France, create relative
freedom and availability of a larger number of
players. Interviewees mentioned, furthermore,
the strength of this market is that it shows
variations in prices according to scarcity and
parties respond to these prices. The ability of
the market prices to vary with availability is
shown i.a. by low prices occurring currently,
which are explained by the amount of
overcapacity available. The Dutch system was
also praised for its clear system of balancing
responsibility and well-defined balancing
markets with access for a wide range of actors.
Finally, the actors active in the Dutch power
system are aware of the changes that occur due
to increasing shares of renewable energy and
other developments. Market players were
praised for their agility and creativity in adapting
and testing new concepts and authorities for
creating enough space for pilot projects.
33 It should be noted that adjacent to the discussion of flexibility needs due to VRE integration are several other
important developments that influence this discussion. Not only the increase in VRE causes an increase in
flexibility needs in grids, balancing and energy supply. E.g. the electrification of the heating sector could
strongly increase peak demand during cold winter hours. Also, notwithstanding the synergies that exist
through different vehicle to grid opportunities, the electrification of the mobility sector will impact distribution
grid needs. A complete discussion of flexibility needs ought to include such developments as well, but is
considered secondary in this paper for conciseness.
4.2. Flexibility options
As mentioned in the previous section, problems
regarding local congestion were rated as most
urgent, problems regarding shortages and
surpluses were expected to arise further ahead,
and balancing problems are not likely to come
anytime soon. Naturally, the most urgent issues
create the strongest demand for flexibility
options. Because of that, flexibility options in the
distribution grid, supply-side flexibility and
power-to-x technologies were mentioned to be
important. However, since most interviewees
thought that the role of policy and regulation
was mostly to ensure a level playing field in the
market (see section 4.3), they named market
design as one of the major aspects from a
governance perspective to create flexibility. As
becomes clear from figure 4 as well, the market
design is key to deal with changes in the power
system due to the influx of VRES. System
planning and the integration of energy storage
were considered less important for policy and
regulation. As mentioned in the literature
section, system planning was not regarded as a
task of governmental institutions but regarded
to be fundamentally dependent on the market.
Similarly, the integration of energy storage
should compete on equal terms with demand-
side management and supply-side flexibility.
The next subsections discuss the interview
findings on the various flexibility options.33
4.2.1. Demand-side flexibility
Most interviewees regarded demand-side
solutions as an important response to flexibility
challenges. It should be noted, however, that
different demand-side management options,
impact different aspects of the flexibility
challenge. While some flexibility options impact
balancing and energy requirements others
33
address grid needs. Dynamic prices and
aggregation are two flexibility options that can
be used to do both.
For creating a stronger price elasticity by
allowing variable prices for end-consumers,
dynamic pricing was discussed as an option. The
interviews showed that, although dynamic
pricing should be allowed as an option for
energy companies, this option has several
barriers and even some disadvantages for the
system. While dynamic pricing of end
consumers allows them to respond to
differences in prices in the wholesale market, it
was the general belief of the interviewees that
price differences would be too low for end
consumers to have an actual impact. While end
consumers pay about 20 €-cent per kWh of
electricity, only about 5 €- cent is paid for the
power itself. The other 15 €-cents remain
invariable under dynamic tariffs, causing only
small fluctuations when compared to the total
tariff. Although the co-variation of energy taxes
with power market prices would have an
additional effect, this would be a complicated
change in the tax system, on which the Finance
Ministry is dependent: “the energy tax is no
guiding tax anymore (…) it is mainly a source of
income, (…), that blocks giving good market
incentives” (J.L. de Ridder, EZ). Moreover, not
only the tax components would remain fixed,
but grid fees would also remain independent of
the time of use. Except further ‘damping’ of the
total variations in electricity tariffs, this also
causes another issue. Two interviewees pointed
out that if consumers respond to power prices,
dynamic energy pricing will increase the
simultaneity in electricity use and might,
therefore, increase the stress on local
distribution grids. The variation in dynamic
electricity tariffs as proposed is only dependent
on the wholesale market prices and does not
consider congestion at certain times and places.
The randomness that occurs now, is
something that grid operators enjoy.
[Dynamic pricing takes] the randomness
out, and you will get artificial peaks in the
low voltage grid. The costs of
strengthening [to accommodate that
peak] are probably much greater than the
savings you get by the use of the available
wind power. (T. van Melle, Ecofys)
Grid fees, however, could be included in
dynamic pricing. Thus, dynamic pricing would
address grid congestion as well, rather than only
responding to the energy supply and balancing
challenges. Various possibilities are available.
Alliander, for example, uses ToU schemes for
newly installed EV connections, just to prevent
peaks on the grid due to simultaneous EV
charging in the evening (M. Bongaerts,
Alliander). Price differences could also be more
dependent on the actual situation, by feeding
real-time prices for grid use to the consumer.
Another option was mentioned by Machiel
Mulder (Universiteit Groningen) and Jan Luuk
de Ridder (EZ). According to them, EZ and grid
operators are considering a ‘traffic light’ system.
In case of a green light, consumers could use
the grid as much as they need, since there is
enough capacity available. With orange light,
the consumer should remain under his or her
contracted capacity. A red light might e.g. mean
that the consumer would get an incentive to cut
its use down. Yet:
This is difficult too because parties could
start to act strategically. If you can go over
the contracted capacity in 90% of the
cases, you might as well contract a low
maximum capacity. This means that with
costs stay equal for the grid operator,
costs are redistributed towards less
flexible parties. (J.L de Ridder, EZ)
This last point relates to the discussion in section
4.3 about the redistributive effects of some
flexibility options, which in some cases have the
strongest effect on those with the least ability to
invest. Yet, these effects do represent the actual
costs of grid use, or in the case of dynamic
pricing, the actual cost of electricity at a certain
point in time. All in all, dynamic pricing for
household consumers was not considered as a
large source of flexibility because there is
uncertainty about price variation and the actual
response to them. Thus, savings would be small,
responding to prices would require much effort
or extensive automation of devices, flexible

34
resources in households are limited, and it
would have debatable redistributive effects.
Dynamic pricing for energy is already standard
in the industry, but neither are they subject to
any incentive for the time of use of the grid. This
important aspect of grid tariffs will be discussed
later this section under sector integration.
Aggregation, in contrast to dynamic pricing,
was expected by the interviewees to have a
much larger impact on the flexibility of the
demand side, both for small consumers and
industry, both for grid purposes and balancing.
While the response to variable tariffs is quite
unpredictable, aggregation is based on
contracts and would, therefore, be more
predictable. Aggregating services are already
quite active in the Dutch market in several
formats. Generally, the position among the
interviewees is that any aggregating party
influencing the power system is and should
remain balance responsible itself, or contract a
balancing responsible party (BRP): “balancing
responsibility or a comparable mechanism is a
requirement. I think that it is a critical factor for
the system and, therefore, for the market. (…)
One should not meddle with that” (S. Hers, CE
Delft). Indeed, as mentioned in section 4.1,
balancing responsibility is considered a crucial
aspect of the power system, a change in which
could have detrimental effects. Secondly, most
interviewees were convinced of the need for
aggregation entities to continue to engage in a
contractual relationship with the energy
supplier of a certain connection: “if you would
like to make agreements with a small consumer,
which also has an energy supplier, then this is
possible in our market model, but it demands a
consistency between the two agreements” (F.
Wiersma, TenneT). The requirements favoured
by the interviewees seems to come closest to
the USEF contractual model (see USEF (2017, p.
35)). This model requires full balancing
responsibility, contractual arrangements with
the supplier, and the possibility of a third party
(outside of consumer and supplier) on one
connection. Yet interviewees mentioned that in
the case of the contractual model, more
experience would be needed in the form of
these contracts:
It is really about efficiency and therefore
about minimalizing transaction costs, if
one would like to make a deal with such a
small party, then margins are small.
Therefore, standardized agreements
between BRP’s and aggregators are very
important, there is a learning curve we
can expect. (S. Glismann, TenneT)
However, two interviewees mentioned that the
aggregator is a role that should rather be
fulfilled by the supplier itself. This idea points
more in the direction of the USEF integrated
model, in which both functions of aggregation
and energy supply are combined in one
organisation, avoiding such contractual
relations:
An aggregator that turns a refrigerator off
or on would, according to me, be a task
for the supplier and not for an
independent player, because (…) a
producer could not price its customer
properly. It is unnecessarily complex. The
independent player could request a
supplier permit itself if it would like to
offer its services to a client. This would fit
in a liberalised market in which parties
compete on equal conditions. (D. Plomp,
Vattenfall)
Moreover, since energy suppliers price their
consumer on their expected energy use, some
claim not to be able to do so with another party
operating on the same connection. The point of
multiple parties on one connection was also
considered problematic by Jan Luuk de Ridder
(EZ):
If an independent aggregator is active on
your connection and starts shifting your
consumption or feed-in, this affects the
portfolio of the supplier or its balancing
responsible party. Suppliers and
aggregators should agree about who is
responsible for the changes and who
should bear its costs. That would be in line
with the [EU] Electricity Balancing
Guideline: ‘all injections and withdrawals
are subject to balancing responsibility’.”
(J.L. De Ridder, EZ)

35
A change in the grid codes to accommodate
two suppliers on one connection has been
proposed by Netbeheer Nederland and NEDU
and is currently under consideration by ACM
(ACM, 2017). In any case, the other set of
requirements that have to be fulfilled are usually
not seen as an issue in the Dutch system,
because of the aforementioned
competitiveness of the market:
The discussion about the role of the
aggregator is being discarded by several
stakeholders as a non-issue, because we
have a market with many parties and,
therefore, competition. Yet, it is the
question whether the sitting parties would
like to move along. (S. Hers, CE Delft)
Although the discussion is much livelier in other
countries with smaller amounts of players and
more market power such as France,
interviewees deemed the role of aggregator
important but noted it should not be favoured
over other parties. Neither should any regulated
tariffs for supplier compensation be installed,
which instead should be taken care off by the
market itself through contractual agreements.
Although aggregation is often used in the
context of small consumers, it might well, and
perhaps more easily, be used for industry. For
aggregation as an added value to the balancing
challenge, the industry would probably be the
better client. Timme van Melle (Ecofys)
mentioned that aggregation on the low voltage
grid can lead to the same simultaneity problem
as with dynamic pricing, thus creating artificial
peaks. Moreover, margins for the aggregation
of industrial electricity consumption would be
much larger. On the contrary, he noted that the
value of aggregation for grid purposes would
be higher on the low voltage grids and
therefore usually at household and other small
34 Altough demand-side management would be an important source for such flexible resources for grid
purposes, the subject is broader than that, since storage technologies or supply side flexibility might equally
be used. For this reason the subject is categorized under system flexibility.
35 Arbitratrage refers to the market mechanism of profiting from differences in prices in different markets, or at
different times. In the case of strorage technologies, the operators profit by buying electricity at low prices,
and selling them at high prices. Storage operators are dependent on these price differences that occur in the
market.
consumers. Since grid problems are more likely
to occur on low-voltage grids, load and
rooftop-PV aggregation on the household level
can contribute to this challenge.
Centring this latter subject is a debate about
the role and responsibilities of the DSO in the
context of unbundling. Although the changing
power sector requires alternative possibilities to
deal with grid congestion, DSO’s in the
Netherlands are required by law to strengthen
the grid at any congestion against any cost.
Congestion management through DSM, for
example, could be considered to conflict with
this requirement. Secondly, unbundling rules for
distribution and energy functions of the power
system do not allow DSO’s to engage in energy
sales and can therefore not act as aggregating
entities. This subject will be further discussed
under the heading of system flexibility.34
Except for the use of the existing flexible
resources on the demand side, flexibility might
also be found by the integration of other sectors
in the power sector and the flexible conversion
of electricity to other forms of energy. Power-
to-x type technologies were seen as an
important aspect to create absorption capacity,
enabling a response to low electricity prices.
While storage as a flexibility option generates
revenue from arbitrage,35 power-to-x
technologies profit from the relatively stable
value of their products (heat, synthetic gas,
hydrogen or ammonia). Power-to-x only needs
enough hours per year with low prices. Further
emphasis was placed on the option of power-
to-heat (PtH) specifically. The advantage of PtH
is the relatively low investment cost for electric
boilers. Although the efficiency of electric
boilers is actually very low as compared to e.g.
heat pumps, they are much less expensive in
investment (CAPEX). While their operating costs

36
(OPEX) are much higher, they are more
economical and pose less investment risk when
used for surplus (low electricity price) situations.
Sebastian Hers (CE Delft) explained that another
advantage for the Dutch context is the already
available infrastructure of CHP plants. Many of
these plants are already flexible, turn off their
power production at low prices, have large
electricity connections and require relatively
modest investments for electric boilers to use
low priced power for heat production. Power-
to-x and especially PtH have strong business
cases in a scenario with increasing VRE and,
therefore, an increasing amount of time with
low electricity prices. Yet, at least two policy
barriers exist for them from flourishing and to
compete on equal footing with other flexibility
options. Firstly, Frank Wiersma (TenneT) and
Timme van Melle (Ecofys) mentioned the
barriers of CO2 allocation:
with power-to-heat [the district heating
sector] uses more than average wind
power, while they pay for an average
emission factor. [They] are not rewarded
for the fact they demand electricity at
times with much wind and solar [power]
in the system, which yields low CO2 heat.
(T. van Melle, Ecofys)
Since power is used mostly during strong VRE
feed-in, heating system operators claim that this
leads to less-than-average CO2 emissions, for
which they are not recognized. The second
barrier is found in the tariff structure of grid fees.
Sebastiaan Hers (CE Delft) and Wieger
Wiersema (ACM) mentioned the importance of
changing this structure:
The problem is that we need absorption
capacity only for 500 hours per year (…).
The transport tariffs are very expensive
(…) for something that is barely used, but
sporadically at very high capacity. (…) One
could question whether capacity-use
should always be discouraged so
stringently, or only when there is a risk of
overload because the dimensioning of
the grids cannot handle the transport
demand. If high feed-in of wind and,
therefore, low prices coincide with the
moments of low grid load (…) one could
choose to limit the costs for capacity use
for consumers, such that it remains
attractive to respond to the price signal
and contribute to system balance. (S.
Hers, CE Delft)
Since the tariff for the maximum capacity grid
capacity used is independent on the time-of-
use of the grid, power-to-x technologies would
pay the same capacity tariff, while it is likely they
use the grid only a small number of hours per
year during surplus of available grid capacity.
The grid fees deteriorate the business case of
power-to-x technologies since they do not
adhere to the cost-causing-principle.
Like PtH solutions, the electrification of
heating in the household sector might increase
flexible capacity to cope with short-term power
surplus and the supply of balancing services.
However, when households move to fully
electric heating systems, electrification will most
probably also increase seasonal imbalances:
“You would have an enormous peak when heat
for households is supplied using power. (…) it
could bring a certain rigidity because you will
need enough power plants to keep the house
warm. “ (D. Klip, CIEP). While heating systems
might have a reasonable ability to deal with
short-term fluctuations, by making use of heat
storage tanks or heating inertia of buildings,
winter demand will remain much higher than
summer demand. Since the dimensioning of the
power system is dependent on peak demand,
the increase in seasonal peaks could lead to
higher system cost.
4.2.2. Market design
Some market design issues have been
discussed in the last section because demand
resources are part of the market as well. This
section, however, discusses the market design
itself, with emphasis on the wholesale and
balancing markets. As in the literature study, the
market design contains the subjects of market
access, completeness, pricing, VRES
participation, representation of grid conditions,
integration with neighbouring countries, and
the capacity mechanism discussion.

37
Generally, the market was considered the be
open, complete and to have the right incentives
for different needs of the system. “The market
works well, more and more types of player are
joining, there are more and more products on
the market, in both actively and passively. I am
honestly quite positive about it” (M. Mulder,
RUG). Market access is well accounted for,
providing the ability for (Distributed) VRES,
aggregation services and demand-side entities
to enter the markets as long as they are
balancing responsible. Yet:
Fundamentally, our market model is
technology neutral in, for example, the
specification of balancing products, but if
you look at it in more detail then it
contains elements which have been
designed for large power plants. One
could think about how to tweak this such
that these are not favoured over DSM and
aggregation. (F. Wiersma, TenneT)
One of these possibilities is to equalize access
to balancing market for large consumers which
could act as balancing agents on the demand
side (W. Wiersema, ACM). According to Timme
van Melle (Ecofys), Sebastiaan Hers (CE Delft)
and Machiel Mulder (RUG) it is rather the
attention and knowledge of the industry that is
lacking than the accessibility: “The barrier is not
only the market but also the attention of the
industry. They do not have the knowledge for it
[and] do not start with it because they save too
little for the complexity it brings” (T. van Melle,
Ecofys). Where access barriers do exist for
balancing markets, interviewees noted that they
are either justified or, when unjustified, there is
a tendency to reduce them. “There is a lot of
attention towards [market access barriers] in
legislation and regulation. For example, the
requirement for equal up- and downward
[symmetrical red.] capacity, such barriers are
gradually reduced“ (A. van der Welle, ECN).
36 This situation might occur because players make their actual contribution in real-time. Market participants,
therefore, do not know of one another what they are doing, while they only know the imbalance volume and
prices 5 minutes before real-time. For example, in case of a shortage, many parties might decide to make use
this system, which could overshoot the shortage. This might leave the system with a positive imbalance, which
still needs to be corrected by TenneT.
Finally, even when certain technologies
would be unable to sell their capacity or energy
in the balancing market, Sebastian Hers (CE
Delft) and Machiel Mulder (RUG) noted that the
way the Dutch system allows for passive
contributions is, in fact, another way of entry to
the balancing markets which makes relieving
these barriers less urgent. He noted, however,
that this system might start to lose its merit once
larger volumes are used in the passive
correction of imbalance and passive
contributions might ‘overshoot’ the actual
imbalance.36 Except for this note, the system
was widely regarded as an advanced and well-
designed market attribute.
The wholesale and balancing markets,
furthermore, were considered to be functional,
without too many disturbing or overregulated
elements. Still, many interviewees noted that
price caps disturb maximum and minimum
prices, even though these are rarely reached:
In certain situations, for which you need
very high prices to balance demand and
supply, then prices would be cut off (…).
These are precisely the moments that are
of great importance in the business case
of flexible capacity. That is why price caps
are not desirable. (F. Wiersma, TenneT)
The other option would be to couple the
maximum prices to the so-called value of lost
load (VoLL), referring to the value one would
place on not decoupling a certain load without
the consent of the consumer. The discussion
about the value this should have, however, is
considered very tough. In any case, most
interviewees mentioned to maximize the prices
caps as much as possible, to allow the maximum
price variations, such that any flexibility option
would receive the maximum incentive.
Even though market liquidity on the intraday
market is often mentioned one of the less well-
performing aspects of the Dutch power market,
38
it is the belief of some interviewees that it will
improve once the need for flexibility will
increase. The absence of liquidity in the ID
market is regarded merely as evidence that such
short-term trade is not necessary up to this
point:
Demand and supply in the intraday
market will probably grow compared to
the day-ahead and forward markets as
solar and wind power grow and shorter
forecasting times become relevant. It is a
development that (…) will be driven by
[demand for flexibility] and not something
for which the market should be arranged
fundamentally different. (F. Wiersma,
TenneT)
The suggestion of adding additional auctions to
the continuous trade, such as is the case in the
German IDM, was neither accepted as a good
proposal nor rejected. It was unclear which
effects this would have. While the addition of
auctions might attract market liquidity, it
concurrently takes away the freedom of bidding
at any time, which is possible in a continuous
market.
15-minute pricing, on the other hand, was
considered a no-regret change for the IDM and
might also be beneficial for the DAM. The
advantage of 15-minute instead of hourly
products is that portfolios can be managed
more precisely, which becomes more important
once fluctuations become more apparent within
the hour.37 The usefulness of shorter temporal
granularity also increases with improving
production and consumption forecasts. Only if
parties know their expected production and
consumption within the hour from a day ahead,
shorter products would be useful for the DAM.
The disadvantage, as noted by some of the
interviewees, is an increase in administration
both for market platforms and for market
37 If strong fluctuations of scarcity occur within the hour due to VRE abundance or scarcity, the imbalances that
occur within this hour are settled by the TSO, but against higher costs. 15-minute products would mean that
only imbalances within each quarter-hour need to be settled against imbalance prices.
38 The amount of electricity that is subsidized is based on a number of full-load hours, which is determined
differently for different technologies, and for wind power determined on the base of a project proposal (RVO,
2017).
players, because of a quadrupling of data.
According to David Plomp (Vattenfall) “15
minutes is a right balance between unnecessary
administrative work and the time needed to
balance the system. We should not move
towards 5 minutes.” All in all, the benefits are
likely to be greater than the disadvantages.
Another discussed topic is the degree of
market participation by VRES. The general
conclusion is that participation of VRES under
the SDE+ subsidy scheme is reasonably
accounted for. Since the SDE+ is a market
premium scheme, parties under the subsidy
scheme are exposed to the market as well. Yet,
unlike other technologies, SDE+ subsidized
generators are spared from some market risks.
Until a generator has produced the defined
number of full-load hours,38 it has an incentive
to produce at any above-zero price on the
power market to receive its subsidy. Once the
prices become negative for a prolonged time,
the market premium drops to zero. Although
one could claim that, theoretically, the subsidy
disturbs the way VRES act in the power market,
it does not give a strong perverted incentive. It
should be noted, however, that as mentioned in
section 4.1 some interviewees would rather see
the EU-ETS work as an overarching method.
This system is goal-based, minimizes
government intervention in the power market,
would give the least disturbances, and would,
therefore, work in favour of flexibility. In the
words of Frank Wiersma (TenneT):
A CO2 price based on societal costs would
be the social-economic ideal stimulation
model, but while we do not have that, the
SDE+ seems to be a good approach, as
long as the owners are required to
arrange their balancing responsibility and
are, therewith, subject to prices in the
energy market.

39
Net-metering is another subsidy scheme
which impacts the market, but more so the retail
than the wholesale market. Interviewees noted
that the scheme theoretically does not adhere
to the cost-causing principle, since grid costs,
caused by those responsible for peaks and
congestion, are socialised. However, net-
metering is not designed for this purpose. The
overall opinion was that net-metering has been
a huge success in its original functions of
creating public support and engagement in the
energy transition, overriding the critique that it
disengages household energy production from
the energy market and decouples them from
the variation in the value of electricity.
Moreover, the adverse effect of net-metering
on system balance should, according to
interviewees, not be overestimated. The only
real impact would take place at times of
negative prices on the power market, when
there is no incentive to shut off household PV
systems. Although this is expected to increase,
this situation currently rarely occurs. At any
positive price, a change in the scheme would
not change the balancing situation. An
alternative to yearly net-metering could be a
combination of dynamic tariffs and net-
metering, in which the costs are settled each 15-
minutes. This would create a stronger
adherence to the cost-causing principle.
Sebastiaan Hers (CE Delft) and Timme van
Melle, however, noted that this would remove
another unintentional positive aspect to yearly
net-metering. The inclusion of short-term
settlement would give household ‘prosumers’
the incentive to use their own power, and invest
e.g. in battery storage, since one saves on their
taxes this way. In case of a 15-minute settlement:
“one would have an incentive to use the power
him/herself, since you would save the [energy]
taxes, but saving taxes is a distributive effect and
not a saving for the economy” (T. van Melle,
Ecofys). This scheme would not be an optimal
situation from a system perspective, because it
would lead to extra costs for storage, but just
39 It is likely that it is because of this reason the investment subsidy would be preferred by the storage industry,
as mentioned by EZ according to Solar Magazine (2017). As mentioned, while the tax wegdge increases the
incentive to invest in household storage, this would be an inefficient investment for the economy.
shifts benefits from the state to the consumer.
Net-metering removes the ‘tax wedge’ between
energy bought and energy sold and, thus,
prevents inefficient investment in storage.
Although from a flexibility perspective one
might argue that any investment in storage
would be a desirable development. Yet, this
argument shows that storage as arbitrage
between low, tax-exempted, energy costs from
one's own resource and high, taxed energy
costs from an energy supplier is not efficient.
Since the revenue from the investment is based
on tax savings, it becomes clear that the market
value of the storage is actually much lower and
might not justify the investment. Investment in
storage would only be efficient if it would profit
by arbitrage between wholesale market power
prices or from relieving grid congestion. EZ,
however, is now considering to replace the net-
metering scheme for the period after 2023 by
either a feed-in subsidy or an investment
subsidy (Solar Magazine, 2017). The feed-in
subsidy would top up the feed-in payment by
the energy company. The investment subsidy
would be a one-off subsidy to reduce the total
investment costs. Since these options were only
announced during the interviews, these were
not discussed. It could be noted however, that
like net-metering, a feed-in subsidy would
reduce the tax wedge.39
Another point that was discussed in the
interview were the possibilities to incorporate
and represent grid conditions into prices for
grid users. While grid costs are charged to grid
users, this is done in a socialised matter.
Therefore, grid use is independent of the time
and location of use, both for industrial and small
consumers. As mentioned before, a change in
the tariff structure for grid fees could improve a
level playing field and, thus, improve the
business case of power-to-x technologies.
Nodal pricing would be an important option
coming to mind to integrate both locational and
temporal aspects into the energy prices.
40
Although some responses were positive about
nodal pricing, most interviewees thought it will
probably remain a theoretical discussion, and
did not believe it would have actual practical
applications in the near future for the
Netherlands. The arguments were disparate.
Firstly, on a descriptive level, nodal pricing was
considered politically unfeasible, because of the
expected distributive effects: “the disadvantage
is the distributive effects, and that makes the
opposition against such a system so great” (A.
van der Welle, ECN). As Sebastiaan Hers (CE
Delft) noted, society would never except that
your energy cost would increase because of
others in your neighbourhood who cause grid
congestion.40 Moreover, it would create
incentives to move to other locations, which
would be the purpose for industrial consumers
and producers, but would be undesirable for
households.41 Still, regarding political feasibility,
it was mentioned to be unlikely considering the
European integration efforts. Firstly, the
European integration efforts attempt to create
more uniformity, while nodal pricing would lead
to further disparity of prices: “There are
advantages to nodal pricing, but if you see the
European integration as a value, in which we try
to reach price convergence, it is not especially
good“ (S. Glismann, TenneT). Secondly, nodal
pricing does not fit in the European Target
model: “I think it would not fit in the current
system, then other member countries should do
it too, I do not see nodal pricing working next
to other systems in neighbouring countries“ (K.
de Bruin, ACM). If such a transition would take
place, in consequence, it should not be a
national, but a regional decision. Moreover, as
mentioned by Samuel Glismann (TenneT) and
Adriaan van der Welle (ECN) nodal pricing
presupposes a central dispatch market, where
40 If another consumer causes stronger grid congestion by e.g. installing a EV charging system, this could lead to
higher energy costs for those that did not cause to problem, but happen to be connected to the same
distribution system.
41 Another note that was not mentioned by the interviewees, that even if relocationing of people would be
desirable because of local congestion, the costs would likely be much too small to actually have that effect.
Because of that, it would likely just cause household consumers to have changed costs. This would, therefore,
not be a saving of system costs, but rather be a distributive effect.
production facilities are managed centrally by a
single algorithm, optimizing the whole system.
The European system is organized according to
a self-dispatch model, where producers are free
to make their own dispatch decisions and trade
bilaterally. As such, a transition to nodal pricing
would require a compromise on a certain
degree of freedom. Besides its political
feasibility, Timme van Melle (Ecofys) noted that
prices differences between nodes would
probably be very small due to the absence of
any structural congestions. Because of that, he
considered nodal pricing to be a high-risk
investment. Yet, Adriaan van der Welle (ECN)
noted the change to a nodal pricing system,
despite its drawbacks and political barriers, has
been implemented in several US ISO
jurisdictions within a short period of time, and
its implementation should, therefore, not be
ruled out. He as well as Machiel Mulder (RUG)
and Diederik Klip (CIEP) agreed that the system
would, at least theoretically, be superior. Yet, as
mentioned, that is not to say implementation is
likely or even desirable. If not a complete
implementation, Sebastiaan Hers (CE Delft)
mentioned that a process occurring
spontaneously might cause de facto locational
aspects to power prices:
Concepts are being developed that bring
about [locational pricing] via the back
door. If an aggregator develops a
platform which reflects local constraints
besides market provisions, (…) than you
are creating price differences outside of
the market. (Sebastiaan Hers, CE Delft)
Since aggregators might work for grid
operators as well as in the power market, they

41
might create locational incentives, without a
top-down market design for it.42
As an alternative to nodal pricing, many
interviewees mentioned smaller price zones
within the country. Like nodal pricing, however,
many disadvantages were raised by the same
group. The advantage would be that it could
address systematic congestion between certain
areas while remaining in the same self-dispatch,
market-based path. Some of the same
problems, however, remain present as well.
Inequality through multiple prices within the
country and its related political opposition
remain an issue. Moreover, it might lead to
issues of market power, market liquidity and
possibly arbitrary redefinitions of zones, while
attempting to solve a lacking structural
congestion problem.
Within the topic of market integration with
neighbouring countries, it was a general belief
that stronger European market connections are
already being made. According to Adriaan van
der Welle the Clean Energy Package (or winter
package) could give a boost to further
harmonisation. The XBID project was an
explicitly discussed example of such
harmonisation efforts. According to the largest
European market platform EPEX, the
introduction of XBID means that any market
player within its scope would be able to trade
on the intraday market with any other market
player, irrespective of its bidding zone. Thus,
zones share and hence increase their liquidity
(EPEX Spot, n.d.). Multiple interviewees (from
ECN, TenneT, Vattenfall, CE Delft) agreed with
this and mentioned that this project will
probably lead to an increase in IDM market
liquidity and therefore improve its effectiveness.
“That would be the big breakthrough for the
Dutch intraday market, if liquidity will increase
strongly with it, trading on this market will
become worth it” (S. Hers, CE Delft). Yet, some
noted that the advantages might only come
over time, once more reliance on the IDM would
42 Even though this subject might be an important point in nodal pricing and aggregator discussions, it was not
further discussed and only brought up by one of the interviewees.
become necessary because of stronger
variations and increased predictability.
Further integration and unification efforts
should, according to Adriaan van der Welle and
Martijn van Gemert (Vattenfall), be directed
towards shifting to more regional and less
national grip operation:
It is a very important issue for us that
system operations are still this
fragmented. An internal market means
one should not discriminate between a
power line within the Netherlands and, for
example, a power line from Amsterdam to
Berlin. We would prefer independent
regional grid operation. (Martijn van
Gemert, Vattenfall)
Supranational grid operation, however, needs
to deal with the barrier of significant differences
between EU member countries, including
different power market models. While the
Netherlands is strongly based on a competitive
market in its set-up, other countries depend
more on monopolies and governmental
intervention. Kick de Bruin (ACM), for instance,
mentioned that e.g. France is not equally willing
to change its market structure. It remains the
question, however, whether this will continue to
frustrate harmonisation efforts.
A final overarching discussion within the
market design for flexibility is resource
adequacy and whether a capacity mechanism is
required for that. A capacity mechanism would
operate next to the energy market to guarantee
the security of supply by either securing returns
on investment or requiring energy companies
to adhere to certain standards. The common
position among the interviewees was that a
market-wide capacity payment or auctioning
would not be desirable nor necessary, both
currently and within the foreseeable future.
Several arguments were used. Firstly, a capacity
market would contradict the efforts to have
clear, undisturbed scarcity pricing signals which
are present in the energy-only market.

42
Secondly, Machiel Mulder (RUG) posed that the
argumentation for investment security of
proponents of capacity markets is false.
Producers would like a capacity remuneration to
ensure profitability in a market with decreasing
prices while, according to him, these lower
prices actually indicate that there is no scarcity
and, therefore, no need for capacity
investments. Instead of an indication of market
failure, the low prices are an indication of the
absence of scarcity. The market did not fail to
show the scarcity value of capacity, but market
players rather failed to predict that their
combined investments would lead to an
overcapacity. More interviewees confirmed that
the market is functioning right, and through
that, does create the right investment signals. A
third argument mentioned by many
interviewees is the issue of governmental
intervention itself. In a capacity payment
mechanism, governmental institutions would
take up the task of determining and
remuneration capacity, which would be a shift
contrary to the liberalisation of the power
market. While, according to Sebastiaan Hers, a
governmentally organised power market is not
per definition inefficient, a capacity market
would lack the creativity which is present now,
and neutralize scarcity prices:
I think that a capacity market would
squeeze out all flexibility, depending on
how the market is designed. If one would
pay for available capacity based on a
singular objective, then available capacity
would always be valued, but scarcity
pricing does not occur any more.
Conventional capacity and perhaps in
some cases industrial demand-side
management might profit from this, but
flexible options with limited availability
would bring in insufficiently. (…) With that,
a lot of innovation in flexibilization, that
has set in with the energy transition,
would be nullified. (S. Hers, CE Delft)
Thus, capacity markets could completely shift
the situation in favour of some technologies,
while discriminating against others.
Furthermore, because its negatively impacts the
energy markets scarcity pricing, it could do
permanent damage to the current system.
Notwithstanding the general preference for an
energy only-market, Jos Sijm (ECN), Diederik
Klip (CIEP) and David Plomp (Vattenfall)
mentioned that a capacity mechanism should
not be ruled out, if it would become necessary
in the future. The form of the capacity
mechanism, however, should be designed such
that it ensures a level playing field, without it just
being a tool for the protection of the
conventional industry (J. Sijm & A. van der
Welle, ECN). To limit its impact, David Plomp
(Vattenfall) noted that if a capacity mechanism
would be installed, it should be a strategic
reserve rather than a market-wide capacity
payment.
4.2.3. System flexibility
As in the literature study, this section contains
the regulatory flexibility options in between
supply and demand apart from the market
design. Although much of the grid discussion
mostly covers issues of spatial aggregation,
some points are motivated by temporal
imbalances as well and, thus, address the
balancing and energy supply challenges.
One of the liveliest discussions within this
section is that of the role of the DSO in relieving
local congestion. The question is whether DSO’s
should be allowed to use a set of congestion
management methods as an alternative to grid
strengthening. The common opinion among
the interviewees was that although the DSO
should have other options than strengthening,
these alternatives should only be applied in a
predefined set of circumstances. As has been
mentioned under DSM, it is equally considered
important (from regulator ACM to grid operator
Alliander) that the assets are not owned by the
DSO, but are outsourced to a market player:
We are proponents of the concept that
grid operators do not [own flexible
resources] themselves, but tender it
unless the market is unable to deliver. This
would be in line with the proposals in the
Clean Energy Package of the [European]
Commission. (J.L de Ridder, EZ)
43
As an example, Martijn Bongaerts (Alliander)
mentioned a project by Alliander (largest DSO)
to tender their flexibility needed to manage a
local congestion. The supplier of flexibility,
whether it would be an aggregator or
otherwise, would have two income flows. Firstly,
it would receive a remuneration for relieving
grid congestions and, secondly, it could sell its
flexibility on balancing markets. This option was
favoured by most interviewees, because of the
strong emphasis on maintaining the unbundling
principles, which prevent DSO’s to be active on
the power market. While this construction
addresses the issue of the DSO role, it still
conflicts with the ‘strengthening only’
requirement. The overlegtafel
energievoorziening, a discussion group
comprising members from many different
institutions in the power system, has taken steps
to create a transparent methodology to
consider when strengthening is necessary and
when other options should be allowed (see e.g.
(Overlegtafel Energievoorziening, 2015)). This
should be installed to prevent corroding the
reliability of the grid and the freedom of grid
connection. Generally, the interviewees agreed
that emphasis should remain on strengthening,
unless circumstances would make it too
expensive or otherwise undesirable to do so.
Examples of such cases would be for congestion
occurring very rarely, or in the built environment
where strengthening would lead to
unacceptable costs compared to the added
value. Some doubts were expressed about the
value that congestion management would have
as well, considering that it will and should be
rarely applied:
Perhaps one should reassess the
expectations of a couple of years ago,
when everyone expected that
flexibilization in the context of preventing
grid strengthening would have a great
potential and would make possible great
costs savings. (…) I have the idea that the
size of the potential and of cost savings
are smaller than we thought a couple of
years ago. (J. Sijm, ECN)
Another note about congestion management
by Frank Wiersma and Samuel Glismann
(TenneT) identified a tension between different
interests. While short-term interests of
shareholders might pressurize DSO’s to achieve
short-term savings by applying congestion
management, this might contradict long-term
benefits that could have been harvested from
timely investment in strengthening. Timme van
Melle (Ecofys), however, indicated that
congestion management might be the lower
risk option in some cases, because of its shorter
depreciation period. If it is unknown whether
congestion will occur, or exactly how much
capacity will be needed to prevent it, congestion
management methods might be used as a more
temporary measure. Certainly when considering
the challenge of predicting power flows on the
distribution level for very long investment
terms, shorter-term investments in congestion
management assets might be an outcome to
observe the developments. Yet, most
interviewees found that it is more likely to be
necessary to restrict DSO’s in their efforts to
apply congestion management than it is to
stimulate it, because they have directed
themselves to such measures already. Data the
distribution grid, let alone about power flows far
in the future is scarce. To apply congestion
management, but also to make efficient
investments in grid strengthening, it would be
necessary to create an information
infrastructure. According to Sebastiaan Hers (CE
Delft) the investments become disproportionate
to the potential flexibility when speaking about
neighbourhood scale forecasting.
The transmission grid, on the other hand, has
a much greater data supply and is much less
dependent on individual changes in the grid.
The transmission system “is somewhat easier to
plan, because it happens on a bigger scale. You
know better what is happening, unlike the
distribution grid where one, so to speak, needs
to predict a single street“ (T. van Melle, Ecofys).
According to many interviewees the
transmission sector, including the
interconnections with neighbouring countries is
quite well organised. Just two discussions came
to light during the interviews. The first one,

44
which has already been touched as well in the
market design section, is the lack of regional
approach in network planning.
We have something called the TYNDP
[Ten-year network development plan],
but we should get much better at taking
a European perspective, for which we also
need a lot of solidarity. And if The
Netherlands profits from [foreign
investment into transmission capacity],
then it should not all come out of one
purse. A lot should change there, because
(…) how policy is made is determined by
voters in a certain region. (S. Glismann,
TenneT)
Since grid operation and its regulation is
determined nationally, intranational
strengthening receives more attention than
international strengthening. Grid operators are
primarily mandated to ensure enough national
capacity is available.
Whether further international connection
capacity and trade are more cost-effective than
other flexibility solutions, is not unambiguously
determined from the interviews. Jos Sijm
expected that further grid strengthening and
extension will be one of the most important
sources of flexibility, if not the most important
source. According to Sebastiaan Hers (CE Delft),
on the other hand:
You will get a peak load of 500 hours [per
year] for which you will need to scale
capacity, then it might become very
expensive because you speak about the
grid from Rotterdam to the German
border. I suspect that would be a bad
deal.
He considered that local conversion options to
hydrogen or further conversion might prove
more important than increasing interconnector
capacity.
Apart from the grid, the category of energy
storage contains another set of technologies
that enable flexibility in between supply and
demand, both for grid and for balancing
purposes. While most interviewees confirm that
storage plays and will continue to play a certain
role in providing short-term flexibility, they also
find it to be just one of the flexibility options. As
became clear earlier, the consensus about
technology neutrality means that, despite the
attention towards storage, it should not get any
preference above other options. As mentioned
by Martijn Bongaerts (Alliander), storage does
not have any value in itself and is only just as
valuable as the price differences of electricity at
different times. Storage, moreover, is thought to
have less urgency than many other flexibility
options by some interviewees:
Energy storage is definitely necessary
within the system later, but before that
situation, one can continue with options
that are more cost efficient such as
demand response, power-to-heat [and]
existing flexibility in the production park
while there is still gas. (J. de Joode, ACM)
As Sebastiaan Hers (CE Delft) and Frank
Wiersma (TenneT) mentioned, storage requires
the explicit acquisition of assets, while some
options are able to make use of the existing
infrastructure or require little extra investment
for flexibilization. It would, for example, be
much more interesting to make use of the
batteries in electric mobility, than investing in
storage explicitly for balancing. Yet, it is the role
of policy and regulation to ensure storage has
equal opportunities to provide services, if this
would be cost effective. The most obvious
barrier, as mentioned in the literature review, is
the double taxation of electricity when it is used
for storage and sold again as electricity.
However, according to Jan Luuk de Ridder (EZ),
this barrier is currently being considered and
probably relieved by the ministry of finance.
4.2.4. Supply-side flexibility
Most policy and regulatory actions necessary
for flexibility on the supply side qualify as
market design aspects, but this is partially so
because of the clear valuation of market
principles among the interviewees and in the
Dutch power market in general. Although the
Netherlands has little instruments and little wish
to set strong demands to power producers, this
is different in other regions. Except for some
basic requirements for generators as defined in

45
the grid codes, producers are essentially free to
use their resources as they please. Suggestions
in the interview for adopting measures to
demand a certain level of flexibility or
controlling the power park top-down to ensure
flexible resources (as discussed in section 4.1)
were generally not accepted. Neither were there
any obvious barriers to reap the possible
potential of the available flexibility. Flexibility on
the supply side was expected to come from a
mix of sources that is strongly dependent on
technology costs, new technology
developments and economic conditions. Some
interviewees mentioned that for the present, the
largest share will probably be taken up by the
gas-fired power production park. Certainly
when considering the recent coalition
agreement deciding on a coal power plant
phase-out before 2030, gas power is likely to be
the most important flexibility option. When
moving towards higher CO2 prices, however, it
is likely that either the role of gas power in
flexibility will reduce if not combined with CCS.
Which flexible technologies will take over this
role, remains to be seen, but likely some
combination of biogas, CCS and curtailment of
VRE.
4.3. Overarching discussions and
underlying values
Different positions within some of the preceding
discussions are explicable by underlying values
pursued in policy. While these values are often
discussed implicitly, making them explicit might
help in understanding different positions within
these discussions, because they might silently
explain the outcome of the position.
A first important discussion concerns the
socialisation of costs versus the application of a
cost-causing principle. Whereas socialisation
strives to share costs equally, the cost-causing
principle strives to apply tariffs for electricity and
grid use as much as possible according to the
costs caused by a certain user. An example
discussed in the last section is the application of
nodal pricing. A full application of nodal pricing
would cause a clear and precise incentive to the
producer and user of electricity depending on
the grid conditions. Yet, it would lead to
distributive effects and could cause users to
experience disadvantages due to the use by a
neighbouring user of the grid. Secondly, it
might give some the opportunity to profit, but
possibly to the cost of others which do not have
the opportunity to respond flexibly to time and
location dependent prices. Such issues play a
role in several different discussions about policy
and regulatory frameworks. The values of
flexibility in these cases are often at odds with
values that are met by socialisation of costs.
Other examples related to this point discussed
in the previous sections are dynamic pricing,
dynamic grid tariffs and RE subsidy schemes.
Secondly, some consider decentralisation as
a value, since it connects people more clearly to
their resources. Because of that, some power
consumers strive to be self-dependent and
disconnect from the grid. If this would be done
on a larger scale, however, due to e.g. falling
prices for electricity storage, interviewees
mentioned this could lead to high societal costs,
paid for by the group unable to invest in
‘autarky’. In the words of Timme van Melle
(Ecofys): “the connection of demand and supply
over the whole of the Netherlands does really
have an advantage, so let’s not try to make our
houses independent of each other, we neither
cultivate our own vegetables.” Because a shared
robust large system would lead to lower societal
costs shared more fairly, let alone creating a
stronger European integration, autarky is
considered unfavourable and should be
regulated.
Another overarching discussion is that of the
role of policy and regulation within the context
of flexibility. There was a wide consensus among
the interviewees about the primacy of the
market, which refers to the principle that the
energy (-only) market should solve any issue
itself, unless clearly shows to be failing. The role
of policy and regulation is to ensure a level
playing field for actors in the electricity market
and additional policy should be installed only in
case of danger to the system security. It should,
therefore, remain on the sideline as much as
possible and remain technology neutral when it
does interfere with the market. Not only was it
46
seen as impossible to make the right
assumptions about the future power system to
make the right policy decisions about certain
technologies, but making technology choices
would also “make one vulnerable to lobbying”
(J. de Jong, CIEP). If subsidy schemes, for
example, are aimed to favour a certain
technology, this could lead to sub-optimal
overstimulation while disregarding
technologies that could potentially do the same
thing more effectively, or at a lower cost.
Therefore, Influencing the power market should
be done as much as possible through market
design and placing incentives rather than
installing regulations outside of the energy-only
market. Since the interviewees generally
mentioned the Dutch market to be well
developed and open, to show price variations
according to scarcity, and to respond to those
varying prices, there is little reason for
restructuring, let alone political intervention.
Indeed, some respondents explicitly regarded
the possibility of political intervention in the
energy-only market in case of scarcity a possible
danger. This point plays a major role in the
discussion of i.a. capacity mechanisms,
technology support, system planning and the
role of aggregation. When taking this point of
non-interventionism to the furthest, no other
stimulating or steering policy should exist
except for CO2 pricing: “You could even take
[technology neutrality] that far, that you should
not have other policy than CO2 limits, not even
flanking policy such as renewable energy
directives” (D. Klip, CIEP).43
Some respondents mentioned, furthermore,
that the level (EU, national, sub-national) at
which policy and regulation are issued, is of
importance. Although the perspective of this
paper is national, many of the issues under
discussion are likely to be governed on a
European level, because they cross borders.44
While the market is mostly nationally regulated,
more tasks are likely to shift towards EU
43 Whether this would actually be desirable, was not thouroughly discussed in the interviews.
44 Except that issues cross borders, European integration was also mentioned as a value in itself, because it
strengthens the ties between the member countries by creating common interests.
institutions such as ACER and Entso-e. The
discussions of national regulation, therefore,
becomes of smaller importance. “The
Netherlands takes part in the CWE region and
has strived for further European integration, we
have to search for solutions together with other
countries, it is hard to make it alone” (A. van der
Welle, ECN). Yet, these discussions discussed in
this paper are equally important for the EU and
are, therefore, still relevant to discuss.
Moreover, even though there might be a
consensus about subjects involving the role of
policy and regulation in the Netherlands, issues
such as capacity mechanisms are strongly
debated in, and between, other EU member
states. Ideas about the Dutch system, therefore,
are a contribution to the EU discussions as well.
5. Discussion As mentioned in the introduction, this paper’s
foremost purpose is to assess the non-technical
barriers of flexibility in the mass grid integration
of VRES in the Netherlands. It has shown what
are the most important discussions when it
comes to policy addressing flexibility and which
factors are prioritized in the Netherlands, as
assessed by the interviewed experts. There are
two reasons that this means there are
limitations to what this paper can conclude
about such options, let alone what should be
decided on the basis of these arguments.
Firstly, the decision is inherently political,
since argumentation is often base on different
values. As has been mentioned in the
methodology, discussions can be often
explained by different interests of parties. This
paper, therefore, has not attempted to find
argumentation to defend one side of the
discussion, but rather to give an overview of the
various sides and to show its underlying values.
Some of such underlying discussions, as has
been noted in chapter 4.3 are socialisation
versus the application of a cost-causing
principle, centralisation versus decentralisation,

47
the primacy of the free market versus
intervention and control, and the level of
policymaking. These subjects came to light as
determining factors in many of the flexibility
options. Although sources might present an
option to be singularly positive or negative, they
are often disputable based on other values. The
choice between different values makes such
decisions inherently political and not as much
scientific.
The second reason that conclusions about
policy options presented here are limited is that
the data and argumentation is not exhaustive.
In some cases, this paper might have shown a
consensus, or a single side of the discussion. It
should be noted that in these cases, counter-
arguments might simply not have been
represented either in literature, or among the
interviews. Notably, when looking to figure 1,
which shows an overview of players in the
power market, the perspective of consumers
and power markets is missing from the
interviews. Although consumers are perhaps
the most important user group in the grid, the
level of organisation is low, certainly for small
household consumers. Because of that, it is hard
to get an overview of their needs. Besides the
lacking views of consumers in general,
interviews were taken of a limited number of
experts from each part of the system. While the
ideas and beliefs about flexibility policy from a
certain type of institution might seem
unambiguous, the experts’ positions are
certainly not directly to be generalised over
their respective fields. Different opinions and
arguments might have been missed. Although
the most important discussions are included,
not all sides of the discussion might have been
heard and represented.
Nevertheless, this paper does contribute to
policy discussions for power system flexibility.
Firstly, a methodological addition with respect
to existing literature is the integration of
phronetic planning principles. Because existing
literature usually either positions itself towards
the matter discussed, or supplies the discussion
with data, it does not always integrate other
values into its discussions, or perceives the
discussion from a perspective of power relations
in the field. Although an unexpected amount of
uniformity was found among the interviewed
experts in many discussions, it has shown the
difficulty of deciding in others. For example, a
consensus was apparent in that the primary
instrument to create flexibility in the market.
However, considerable discussion was apparent
around the subject of nodal pricing or other
locational pricing mechanisms. As mentioned,
this discussion is likely to be determined by the
underlying values of fairness in terms of the
responsible costs-causing party paying the
price on the one hand, and equality in terms of
the socialisation of costs on the other.
Academics have shown support for locational
pricing mechanisms which can be logically
explained considering its economic-theoretical
superiority through its adherence to cost-
causing principles. Policymaking and
consultancy experts have shown to be more
critical about it, because it might be impractical,
or not be effective, but perhaps more
importantly, because it leads to inequalities that
might be politically undesirable.
The methods have shown to be valuable as
it gives an overview rather than discussing
single solutions. Because of that, it shows the
connections between different aspects of the
flexibility challenge. The ‘market and flexibility’
report by CE Delft (Hers et al., 2016) is perhaps
closest to the currently used perspective. The
addition of this paper to these results are
twofold. Firstly, it incorporates more views on
the same flexibility options, such that it shows
counter-arguments. Secondly, the
consideration of foreign policy and its possible
application to the Netherlands, broadens the
view over possible and perhaps impossible
options.
Despite the limitations that were mentioned
about the ability of this paper to position itself
towards the discussed subjects, some issues
were quite clearly indicated by literature and
uniformly agreed upon by the interviewees. Due
to reasons of conciseness, the author refers to
the findings in chapter four to show this paper’s
policy implications.
48
Future research should keep the flexibility
challenge in mind, since many important
challenges still need to arise. While certain
policy options might not have been considered
relevant or useful by the interviewees in the
current situation, increasing shares of VRES and
scarcity of flexibility might change perspectives.
Moreover, new policy options might be
developed, the political situation might shift
towards other values, or new technologies
might reduce flexibility concerns. In all these
and other cases, research should attend to the
needs of the power system and to the
possibilities, arguments and counterarguments
for policy makers.
Besides continuous attention, further and
deeper investigation into many topics discussed
in this paper would be advisable on the short-
term. While, for example, nodal pricing, capacity
markets, and the role of the DSO have been
discussed here, it should be noted that each of
these subjects require a thorough investigation
in themselves. The methodology used here,
applied to specific options would be an
important addition to the existing literature. This
might deal with one of the limitations that were
mentioned, namely that of potentially missing
sides and argumentation. Dedicated Interviews
about such a topic would strongly improve the
completeness of its discussion, and the ability to
make a weighed political decision or agreement
possible. The width of the perspective used her
is this papers’ strength, but it is also its
weakness.
Another possible addition to the literature
would be a stronger focus on the existing power
relations in the electricity sector and to
determine where decisions are made and why.45
Although the Dutch ‘polder’ model of decision
making increases the chances all stakeholders’
positions are considered,46 less powerful parties
might still remain unheard. As has been
45 As an example for work on power structures see the work Energy, Power, Reason: the comprehensive look on
the energy transition (trans.) on power in the German Energy sector (Creutzig & Goldschmidt, 2008).
46 The ‘polder’ model refers to a mode of decision making in which stakeholders are activated in the discussion
about certain policy decisions, as has been the case with the energy agreement in 2013. The negotiation of
such agreements, instead of top-down decisions increase the engagement of all involved parties.
mentioned in the methodology section, the
truth of the powerful parties is often considered
more real, because of which that of others
might be considered fiction.
6. Conclusion An energy transition is clearly present in the
Netherlands, with important stretches of
renewable energy integration until 2030 (as
shown e.g. in figure 2 and figure 7). Besides a
set of other barriers for the adoption of
renewable energy, flexibility of the power
system should be considered a key issue to
large scale rollout of solar and wind power.
Therefore, this paper has set out to investigate
the state of Dutch flexibility policy, the
discussions for adapting it to increasing shares
of variable renewable energy sources and the
positions and arguments within these
discussions.
The flexibility challenge, consisting of the
various dimensions of balancing, energy supply
and congestion, is also under discussion in the
Netherlands, albeit in a relatively mild form.
This, however, does not surprise regarding the
modest impact VRES integration has had until
now. Both the literature and interviews generally
show the Netherlands to be well positioned to
deal with the rise in VRES expected until 2030,
certainly in the dimension of balancing. In some
local grids, congestion is expected to increase,
mainly due to the integration of rooftop PV
units. Energy supply is no issue at all in the
current situation due to overcapacity (see figure
7), but this situation might get less favourable
when power market prices decrease due to
compression and merit-order effects. These
concerns were voiced in the interviews as well,
which found that the combined impacts of
electrification of the heating sector and the
integration of VRES strongly increase seasonal
49
peaks, and, therefore, increases pressure on the
security of supply.
Several discussions have been highlighted
concerning the approach of policy and
regulation addressing demand-side flexibility,
market design, system flexibility and supply-side
flexibility. While some discussions were
characterized by considerable unanimity
among the interviewees, others showed
disagreement among different stakeholders.
Examples of the former are the necessity of
balancing responsibility of aggregators, the
merit of 15-minute prices on the intraday
market, the contracting of flexibility products by
distribution system operators and the
problematic aspects of capacity mechanisms.
Disagreement was found in discussions about
e.g. dynamic electricity prices and grid tariffs for
household consumers, the exact model for
aggregation services, the merit of nodal pricing,
and the merit of further strengthening the
export and import capabilities.
Implicit in the discussion of concrete
flexibility options are several underlying values.
Different positions could be understood better
by understanding differences in values pursued
by policy. Major discussions with implications
for flexibility policy concern the values of cost-
causing principles versus socialisation,
decentralisation versus a centralised power
system, market primacy versus intervention, and
the level of policy making. Although the
position of powerful players in these discussions
partially determine the outcome of discussions
in flexibility policy, each policy proposal and
parties favoured and harmed should be
considered with care. Because of that, this paper
proposed for research to direct continuous and
focussed attention towards the developments
of flexibility in the electricity sector and its policy
options, while taking into consideration its
underlying values, power structures and
interests.

50
7. References ACER, & CEER. (2015). ACER Market Monitoring
Report 2015. Luxembourg: Publications
Office of the European Union.
ACER, & CEER. (2017). European Energy
Regulators’ White Paper # 1: Renewables
in the Wholesale Market. ACER, CEER.
ACER, & CEER. (2017). European Energy
Regulators’ White Paper # 3: Facilitating
flexibility. ACER, CEER.
Agora Energiewende. (2014). Electricity Storage
in the German Energy Transition: Analysis
of the storage required in the power
market, ancillary services market and the
distribution grid. Berlin: Agora
Energiewende.
Agora Energiewende. (2015). Understanding the
Energiewende: FAQ on the ongoing
transition of the German power system.
Berlin: Agora Energiewende.
Agora Energiewende. (2016). The Power
Market Pentagon: A Pragmatic Power
Market Design for Europe’s Energy
Transition. Berlin: Agora Energiewende.
Albadi, M. H., & El-Saadany, E. F. (2008). A
summary of demand response in
electricity markets. Electric Power Systems
Research, 78, 1989–1996.
Authoriteit Consument & Markt [ACM]. (n.d.).
Energie. Retrieved December 20, 2016,
from
https://www.acm.nl/nl/onderwerpen/ener
gie/
Authoriteit Consument & Markt [ACM]. (2017).
Codewijziging meerdere leveranciers op
een aansluiting. Retrieved from
https://www.acm.nl/nl/publicaties/publica
tie/17003/Codewijziging-meerdere-
leveranciers-op-een-aansluiting
Beck, F., & Martinot, E. (2004). Renewable
Energy policies and Barriers. In
Encyclopedia of Energy (pp. 365–383).
Elsevier.
Brijs, T., De Jonghe, C., Hobbs, B. F., & Belmans,
R. (2017). Interactions between the design
of short-term electricity markets in the
CWE region and power system flexibility.
Applied Energy, 195, 36–51.
Bundesministerium für Wirtschaft und Energie
[BMWi]. (2015a). An Electricity Market for
Germany’s Energy Transition: Discussion
Paper of the Federal Ministry for
Economic Affairs and Energy (Green
Paper). Berlin: BMWi.
Bundesministerium für Wirtschaft und Energie
[BMWi]. (2015b). An Electricity Market for
Germany’s Energy Transition: White Paper
by the Federal Ministry for Economic
Affairs and Energy. Berlin: BMWi.
California Energy Commission. (2016). Electric
Generation Capacity & Energy.
Retrieved January 18, 2017, from
http://www.energy.ca.gov/almanac/electri
city_data/electric_generation_capacity.htm
l
California Independent System Operator
[CAISO]. (2010). Smart Grid: Roadmap and
Architecture.
California Independent System Operator
[CAISO]. (2014a). California vehicle-grid
integration (VGI) roadmap: enabling
vehicle-based grid services.
California Independent System Operator
[CAISO]. (2014b). Flexible resource
Adequacy Criteria and Must-Offer
Obligation.
California Independent System Operator
[CAISO]. (2016). Distributed Energy
Resource Provider: Participation Guide
with Checklist. CAISO.
California Independent System Operator
[CAISO]. (2017). Tariff archive. Retrieved
March 17, 2017, from
https://www.caiso.com/rules/Pages/Regul
atory/TariffArchive/Default.aspx
California Independent System Operator,
California Public Utilities Commission, &
51
California Energy Commission. (2014).
Advancing and maximizing the value of
Energy Storage Technology: A California
Roadmap.
California Public Utilities Commission [CPUC].
(2015). Beyond 33% Renewables: Grid
Integration Policy for a Low-Carbon
Future. San Francisco.
CE Delft, & Microeconomix. (2016). Refining
Short-Term Electricity Markets to Enhance
Flexibility. Study on behalf of Agora
Energiewende.
Colak, I., Fulli, G., Sagiroglu, S., Yesilbudak, M.,
& Covrig, C. F. (2015). Smart grid projects
in Europe: Current status, maturity and
future scenarios. Applied Energy, 152, 58–
70.
Comisión Nacional de los Mercados y la
Competencia. (2015). Spanish energy
regulator’s national report to the European
Commission 2015.
Couture, T. D., Cory, K., Kreycik, C., & Williams,
E. (2010). A Policymaker’s Guide to Feed-in
Tariff Policy Design. National Renewable
Energy Laboratory.
Creutzig, F., & Goldschmidt, J. C. (2008).
Energie, Macht, Vernunft: Der umfassende
Blick auf die Energiewende. Aachen:
Shaker Media.
Cross Border Intraday Market Project. (2017).
Cross-Border Intraday : Questions &
Answers.
Daneshi, H., & Srivastava, A. K. (2011). ERCOT
electricity market: Transition from zonal to
nodal market operation. IEEE Power and
Energy Society General Meeting, 1–7.
Danish Ministry for Climate Energy and
Building. (2013). Smart grid strategy - The
intelligent energy system of the future.
Danish Ministry of Climate, Energy and
Building.
De Vries, L. J. (2007). Generation adequacy:
Helping the market do its job. Utilities
Policy, 15, 20–35.
Dragoon, K., & Papaefthymiou, G. (2015). Power
System Flexibility Strategic Roadmap -
Preparing power systems to supply reliable
power from variable energy resources.
Berlin: Ecofys.
Ea. (2015). The Danish Experience with
Integrating Variable Renewable Energy.
Study on behalf of Agora Energiewende.
Effendi, P., & Courvisanos, J. (2012). Political
aspects of innovation: Examining
renewable energy in Australia. Renewable
Energy, 38, 245–252.
EirGrid Group. (2016). All-Island Generation
Capacity Statement 2016-2025. Dublin/
Belfast: SONI, EirGrid.
El Bakari, K. (2014). Enabling smart grids and
future electricity markets with virtual
power plants: development of Distributed
Energy Resources Aggregation System
(DERAS). Eindhoven: Technische
Universiteit Eindhoven.
Energinet.dk. (2017). Regulations for grid
connection. Retrieved March 21, 2017,
from
http://www.energinet.dk/EN/El/Forskrifter
/Technical-regulations/Sider/Forskrifter-
for-nettilslutning.aspx#3.2.5
ENTSO-E. (n.d.). Installed Capacity per
Production Type. Retrieved June 7, 2017,
from
https://transparency.entsoe.eu/generation
/r2/installedGenerationCapacityAggregati
on/show
ENTSO-E. (2012). ENTSO-E Network Code for
Requirements for Grid Connection
Applicable to all Generators: Frequently
Asked Questions. Brussels: ENTSO-E.
ENTSO-E. (2015). Dynamic Line Rating for
overhead lines – V6: CE TSOs current
practice. Brussels: ENTSO-E.
ENTSO-E. (2016). Mid-term Adequacy Forecast
- data package. Retrieved June 7, 2017,
from
https://www.entsoe.eu/outlooks/maf/Pag

52
es/default.aspx
EPEX Spot. (n.d.). XBID: Cross-Border Intraday
Market Project. Retrieved October 11,
2017, from
https://www.epexspot.com/en/market-
coupling/xbid_cross_border_intraday_mar
ket_project
EPEX Spot. (2017). Exchange Council approves
the introduction of 15-minute contracts
on the Belgian and Dutch market.
Retrieved from
https://www.epexspot.com/en/press-
media/press/details/press/Exchange_Cou
ncil_approves_the_introduction_of_15-
minute_contracts_on_the_Dutch_market_
ERCOT. (2017). 2016 Demand and Energy
Report. Retrieved February 8, 2017, from
http://www.ercot.com/content/wcm/lists/
89476/ERCOT2016D_E.xlsx
Erlinghagen, S., & Markard, J. (2012). Smart
grids and the transformation of the
electricity sector: ICT firms as potential
catalysts for sectoral change. Energy
Policy, 51, 895–906.
European Commission. (2011). Definition,
Expected Services, Functionalities and
Benefits of Smart Grids. Brussels: European
Commission.
European Commission. (2015a). Commission
Regulation (EU) 2015/1222 of 24 July 2015
establishing a guideline on capacity
allocation and congestion management.
Official Journal of the European Union,
1222, 24–72.
European Commission. (2015b). Renewable
energy progress report. Brussels.
European Commission. (2016). The EU
Emissions Trading System (EU ETS).
European Union Publications Office.
European Commission. (2017). Proposal for a
directive of the European Commission
and the the Council on common rules for
the internal market in electricity. Brussels.
European Parliamentary Research Service.
(2017). Capacity mechanisms for electricity.
Members’ Research Service.
Externality. (2016). In American Heritage
Dictionary of the English Language (fifth
edit). Houghton Mifflin Harcourt
Publishing Company.
Fernández, J. M. R., Payán, M. B., Santos, J. M.
R., & García, Á. L. T. (2017). The voluntary
price for the small consumer: Real-time
pricing in Spain. Energy Policy, 102, 41–51.
Flyvbjerg, B. (2004). Phronetic planning
research: theoretical and methodological
reflections. Planning Theory Practice, 5,
283–306.
Flyvbjerg, B. (2009). What is Rationality? What
is Power? Retrieved May 9, 2017, from
http://flyvbjerg.plan.aau.dk/whatispower.p
hp
Fraunhofer IWES. (2015). The European Power
System in 2030: Flexibility Challenges and
Integration Benefits. An Analysis with a
Focus on the Pentalateral Energy Forum
Region. Analysis on behalf of Agora
Energiewende.
Frontier Economics. (2015). Scenarios for the
Dutch electricity supply system. London:
Frontier Economics.
Frontier Economics, & Consentec. (2014).
Impact Assessment of Capacity
Mechanisms: Report for the Federal
Ministry for Economic Affairs and Energy
(BMWi). London: Frontier Economics.
Frontier Economics, & Formeat Services. (2014).
Electricity market in Germany – Does the
current market design provide security of
supply?: Report for the Federal ministry for
Economic Affairs and Energy (BMWi).
London: Frontier Economics.
Gallo, A. B., Simões-Moreira, J. R., Costa, H. K.
M., Santos, M. M., Moutinho, E., & Santos,
D. (2016). Energy storage in the energy
transition context: A technology review.
Renewable and Sustainable Energy
Reviews, 65, 800–822.

53
Geels, F. W. (2014). Regime Resistance against
Low-Carbon Transitions: Introducing
Politics and Power into the Multi-Level
Perspective. Theory, Culture & Society, 0,
1–20.
Genoese, F., & Egenhofer, C. (2015). Reforming
the Market Design of EU Electricity
Markets: Addressing the Challenges of a
Low-Carbon Power Sector. CEPS Task
Force Report. CEPS.
Grave, K., Papaefthymiou, G., & Dragoon, K.
(2014). Flexibility options in electricity
systems. Berlin: Ecofys by order of
European Copper Institute.
Haas, R., Panzer, C., Rescha, G., Ragwitz, M.,
Reecec, G., & Held, A. (2011). A historical
review of promotion strategies for
electricity from renewable energy sources
in EU countries. Renewable and
Sustainable Energy Reviews, 15, 1003–1034.
Henriot, A., & Glachant, J.-M. (2013). Melting-
pots and salad bowls: the current debate
on electricity market design for
integration of intermittent RES. Utilities
Policy, 27, 57–64.
Hers, S., Rooijers, F., Afman, M., Croezen, H., &
Cherif, S. (2016). Markt en Flexibiliteit:
Achtergrondrapport. Delft: CE Delft.
Hers, S., Rooijers, F., Afman, M., Croezen, H., &
Cherif, S. (2016). Markt en Flexibiliteit:
Hoofdrapport. Delft: CE Delft.
Hirth, L. (2013). The market value of variable
renewables: The effect of solar wind
power variability on their relative price.
Energy Economics, 38.
Hirth, L., Ueckerdt, F., & Edenhofer, O. (2015).
Integration costs revisited – An economic
framework for wind and solar variability.
Renewable Energy, 74, 925–939.
Hogan, M., Weston, F., & Gottstein, M. (2015).
Power Market Operations and System
Reliability in the Transition to a Low-
Carbon Power System: A Contribution to
the Market Design Debate. Brussels: The
regulatory Assistance Project.
Holttinen, H., Miettinen, J. J., Couto, A.,
Algarvio, H., Rodrigues, L., & Estanqueiro,
A. (2016). Wind power producers in
shorter gate closure markets and
balancing markets. In 2016 13th
International Conference on the European
Energy Market (EEM) (pp. 1–5). IEEE.
Hout, M. Van, Koutstaal, P., Ozdemir, O., &
Seebregts, A. (2014). Quantifying flexibility
markets. Petten: Energieonderzoek
Centrum Nederland.
Huntington, S. C., Rodilla, P., Herrero, I., &
Batlle, C. (2017). Revisiting support policies
for RES-E adulthood: Towards market
compatible schemes. Energy Policy, 104,
474–483.
IEA. (2011). A Guide to the Balancing Challenge.
Paris: IEA/ OECD.
IEA. (2014a). Energy Policies of IEA Countries:
The Netherlands 2014 Review. Paris:
IEA/OECD.
IEA. (2014b). The power of transformation: Wind
Sun and the Economics of Flexible Power
Systems. Paris: IEA/ OECD.
IEA. (2016). Electricity and Heat 2014. Retrieved
January 18, 2017, from
https://www.iea.org/statistics/statisticssear
ch/report/?country=Select&product=elect
ricityandheat&year=2014
IEA-RETD. (2015a). Volume I: main report. In M.
MacDonald & A. Conway (Eds.),
Integration of Variable Renewable Energy.
Utrecht.
IEA-RETD. (2015b). Volume II: Case studies. In
Mott MacDonald & A. Conway (Eds.),
Integration of Variable Renewable Energy.
Utrecht.
IRENA. (2015). Renewable Power Generation
Costs in 2014 : An Overview. Bonn: IRENA.
Keay-bright, S. (2013). Capacity Mechanisms
For Power System Reliability: Why the
traditional approach will fail to keep the

54
lights on at least cost and can work at
cross-purposes with carbon reduction
goals. Regulatory Assistance Project.
Kim, J. S., Chen, J., & Garcia, H. E. (2016).
Modeling, control, and dynamic
performance analysis of a reverse osmosis
desalination plant integrated within
hybrid energy systems. Energy, 112, 52–66.
Kintner-Meyer, M. (2014). Regulatory policy
and markets for energy storage in North
America. Proceedings of the IEEE, 102,
1065–1072.
Kloess, M., & Zach, K. (2014). Bulk electricity
storage technologies for load-leveling
operation - An economic assessment for
the Austrian and German power market.
International Journal of Electrical Power
and Energy Systems, 59, 111–122.
Kunz, F., Neuhoff, K., & Rosellón, J. (2016). FTR
allocations to ease transition to nodal
pricing: An application to the German
power system. Energy Economics, 60, 176–
185.
Lang, M., Heun, S.-E., & Assion, S. (2016).
Germany launches Smart Metering Roll-
Out. Retrieved February 16, 2017, from
https://www.twobirds.com/en/news/articl
es/2016/germany/july/germany-launches-
smart-metering-roll-out
Lang, M., & Lang, A. (2015). The 2014 German
Renewable Energy Sources Act revision –
from feed-in tariffs to direct marketing to
competitive bidding. Journal of Energy &
Natural Resources Law, 33, 131–146.
Lehner, M., Tichler, R., Steinmüller, H., &
Koppe, M. (2014). Power-to-Gas :
Technology and Business Model. Springer.
Lyons, K., Fraser, H., & Parmesano, H. (2000).
An Introduction to Financial Transmission
Rights. The Electricity Journal, 13, 31–37.
Martinot, E. (2015). How is Germany Integrating
and Balancing Renewable Energy Today?
Retrieved March 21, 2017, from
http://www.martinot.info/renewables2050
/how-is-germany-integrating-and-
balancing-renewable-energy-today
Martinot, E. (2016). Grid Integration of
Renewable Energy: Flexibility, Innovation,
Experience. Annual Review of Environment
and Resources 2016 February, 1–33.
Ministry of Economic Affairs [EZ]. (2016a).
Energieagenda: Naar een CO2-arme
energievoorziening. The Hague.
Ministry of Economic Affairs [EZ]. (2016b).
Energierapport: Transitie naar Duurzaam.
The Hague.
Ministry of Economic Affairs [EZ]. (2016c).
Kamerbrief over Tijdpad uitrol slimme
meter en dynamische leveringstarieven.
The Hague.
Ministry of Infrastructure and Environment.
(2013). Klimaatagenda: weerbaar,
welvarend en groen. The Hague.
Movares. (2016). De waarde van flexibel laden.
Utrecht: Study on behalf of ElaadNL.
Negro, S. O., Alkemade, F., & Hekkert, M. P.
(2012). Why does renewable energy
diffuse so slowly? A review of innovation
system problems. Renewable and
Sustainable Energy Reviews, 16, 3836–
3846.
Netherlands Enterprise Agency [RVO]. (n.d.).
Smart grids en slimme energiesystemen.
Retrieved January 23, 2017, from
http://www.rvo.nl/onderwerpen/duurzaa
m-ondernemen/energie-en-milieu-
innovaties/smart-grids
Netherlands Enterprise Agency [RVO]. (2017).
SDE+ najaar 2017. Zwolle: Rijksdienst voor
Ondernemend Nederland.
Neuhoff, K., Barquin, J., Bialek, J. W., Boyd, R.,
Dent, C. J., Echavarren, F., … Weigt, H.
(2013). Renewable electric energy
integration: Quantifying the value of
design of markets for international
transmission capacity. Energy Economics,
40, 760–772.
55
Neuhoff, K., Batlle, C., Brunekreeft, G.,
Konstantinidis, C. V., Nabe, C., Oggioni,
G., … Strbac, G. (2015). Flexible Short-Term
Power Trading: Gathering Experience in EU
Countries. Berlin: DIW.
Neuhoff, K., Ritter, N., Salah-Abou-El-Enien, A.,
& Vassilopoulos, P. (2016). Intraday
Markets for Power: Discretizing the
Continuous Trading? SSRN Electronic
Journal.
Onoph Caron. (2017). Schriftelijke bijdrage
Ronde tafelgesprek “Wetenschap en
Bestuur.” ElaadNL.
Overlegtafel Energievoorziening. (2015).
Nieuwe spelregels voor een duurzaam en
stabiel energiesysteem.
Papaefthymiou, G., & Dragoon, K. (2016).
Towards 100% renewable energy systems:
Uncapping power system flexibility.
Energy Policy, 92, 69–82.
Papaefthymiou, G., Hasche, B., & Nabe, C.
(2012). Potential of heat pumps for
demand side management and wind
power integration in the German
electricity market. IEEE Transactions on
Sustainable Energy, 3, 636–642.
Petitet, M., Finon, D., & Janssen, T. (2017).
Capacity adequacy in power markets
facing energy transition: A comparison of
scarcity pricing and capacity mechanism.
Energy Policy, 103, 30–46.
Rehman, S., Al-Hadhrami, L. M., & Alam, M.
(2015). Pumped hydro energy storage
system: A technological review.
Renewable and Sustainable Energy
Reviews, 44, 586–598.
REN21. (2016). renewables 2016: Global Status
Report. Paris: REN21.
Schoots, K., Hekkenberg, M., & Hammingh, P.
(2016). Nationale Energieverkenning 2016.
Petten: Energieonderzoek Centrum
Nederland.
Smart Energy Demand Coalition. (2014).
Mapping Demand Response in Europe
Today: 2015. Brussels: SEDC.
Sociaal Economische Raad. (2013).
Energieakkoord voor duurzame groei. The
Hague: SER.
Solar Magazine. (2017). Kamp over opvolger
salderingsregeling: “Subsidie op
teruglevering zonnestroom of
investeringssubsidie.” Retrieved October
9, 2017, from
https://solarmagazine.nl/nieuws-zonne-
energie/i14144/kamp-over-opvolger-
salderingsregeling-subsidie-op-
teruglevering-zonnestroom-of-
investeringssubsidie
SWECO, Ecofys, Tractebel engineering, & PWC.
(2015). Study on the effective integration of
Distributed Energy Resources for providing
flexibility to the electricity system.
Stockholm: SWECO.
TenneT. (n.d.-a). Balansveranwoordelijkheid.
Retrieved December 20, 2016, from
http://www.tennet.eu/nl/elektriciteitsmark
t/nederlandse-
markt/balansverantwoordelijkheid/
TenneT. (n.d.-b). Noodvermogen. Retrieved
October 30, 2017, from
https://www.tennet.eu/fileadmin/user_upl
oad/Company/Publications/Technical_Pu
blications/Dutch/Brochure_noodvermoge
n.pdf
TenneT. (2016). Kwaliteits-en
Capaciteitsdocument 2016: Deel II:
Investeringsplan. Arnhem.
Thomsen, J., Roulland, A., Kellermann, M.,
Hartmann, N., & Schlegl, T. (2015).
Decentralised market agent - Accessing
central markets with demand side
management technologies. In 2015 12th
International Conference on the European
Energy Market (EEM). IEEE.
Triple E. (2015). The Balance of Power –
Flexibility Options for the Dutch Electricity
Market Final Report. Rotterdam: Triple E
Consulting.
56
USEF. (2015). USEF Position Paper: The
independent Aggregator. USEF.
USEF. (2017). USEF:Workstream on aggregator
implementation models: Recommended
practices and key considerations for a
regulatory framework and market design
on explicit Demand Response. USEF.
Van de Vegte, H. (2015). Routekaart
Energieopslag 2030. Arnhem: DNV GL.
Van der Welle, A. (2012). Flow-based market
coupling : Stepping stone towards nodal
pricing ? The Hague: ECN.
Van der Welle, A. (2016). Required adjustments
of electricity market design for a more
flexible energy system in the short term.
Petten: ECN.
Van der Welle, A., & De Joode, J. (2011).
Regulatory road maps for the integration
of intermittent electricity generation:
Methodology development and the case
of The Netherlands. Energy Policy, 39,
5829–5839.
Weigt, H., Jeske, T., Leuthold, F., & von
Hirschhausen, C. (2010). “Take the long
way down”: Integration of large-scale
North Sea wind using HVDC transmission.
Energy Policy, 38, 3164–3173.
Willems, B., & Morbee, J. (2008). Risk
management in electricity markets:
hedging and market incompleteness.
Leuven: KU Leuven.
Wüstenhagen, R., Wolsink, M., & Bürer, M. J.
(2007). Social acceptance of renewable
energy innovation: An introduction to the
concept. Energy Policy, 35, 2683–2691.
Xu, L., & Tretheway, D. (2012). Flexible Ramping
Products Draft Final Proposal. CAISO.
Zakeri, B., & Syri, S. (2015). Electrical energy
storage systems : A comparative life cycle
cost analysis. Renewable and Sustainable
Energy Reviews, 41, 569–596.
Zoellner, J., Schweizer-Ries, P., & Wemheuer, C.
(2008). Public acceptance of renewable
energies: Results from case studies in
Germany. Energy Policy, 36, 4136–4141.

57
Annex A: Interview questions
1. Algemene vragen
1.1. Uitdagingen
1.1.1. Algemeen: Wat, in het algemeen, zijn volgen u de belangrijkste problemen die
worden veroorzaakt door de integratie van hogere percentages fluctuerende
duurzame energie voor de flexibiliteit van het elektriciteitssysteem
(Netwerkcongestie, balanshandhaving en tekorten en overschotten aan energie)?
1.1.2. Urgentie: In hoeverre is er in Nederland op de korte termijn aandacht nodig voor
de flexibilisering van het elektriciteitssysteem ten behoeve van de integratie van
fluctuerende duurzame energie?
1.1.3. Percentage: Vanaf welk percentage van variabele energiebronnen verwacht u
grootschalige veranderingen moeten worden gemaakt, zowel technisch als
sociaaleconomisch om de leveringszekerheid van het systeem te garanderen?
1.1.4. Paraatheid: In welke mate is Nederland voorbereid en loopt men op schema om de
snelheid van de integratie van fluctuerende energiebronnen bij te houden?
1.1.5. Organisatie specifiek: Welke uitdagingen gelden specifiek voor uw organisatie?
1.1.6. Rollen: Hoe verwacht u dat de rol van uw organisatie en dat van andere actoren in
het systeem zal veranderen tijdens de transitie naar hogere percentages variabele
duurzame energie?
2. Oplossingsrichtingen
2.1. Algemeen
In het literatuuronderzoek zijn een 8-tal richtingen geïdentificeerd met potentie om
flexibiliteit te vergroten of noodzaak voor aanvullende flexibiliteit te verminderen:
• Vraagsturing;
• Slimme distributienetten en verzwaring van het distributienetwerk;
• Versterking en automatisering van het transmissienetwerk, import en export
van elektriciteit;
• Integratie van energieopslag en elektromobiliteit;
• Marktontwerp en de allocatie van kosten voor flexibiliteit;
• Flexibiliteit aan de aanbodkant vergroten en exploiteren;
• Niet-markt gebonden systeemregulering en controle;
• Systeem brede planning optimalisatie en diversificatie;
Welke van deze oplossingsrichtingen zou u voor Nederland prioriteit toekennen
op de korte termijn, welke zouden op de langere termijn richting 2040 een rol gaan
spelen en welke onderdelen zijn minder belangrijk?

58
2.2. Vraagsturing
2.2.1. Dynamische tarieven kleinverbruik: Zijn het toelaten, stimuleren of vereisen van
dynamische tarieven voor kleinverbruik volgens u effectieve maatregelen om het
elektriciteitsverbruik te verplaatsen naar tijdstippen met een groot duurzaam
aanbod en pieken te verkleinen? Verwacht u dat de prijsverschillen die zullen
ontstaan sterk genoeg zijn om als prikkel een regulerend effect te hebben? Wat zijn
de nadelen van dynamische tarieven?
Het wordt in Nederland vanaf 2019 toegestaan om op grote schaal dynamische prijzen (per kwartier) aan
te bieden aan kleinverbruikers. In ander landen, zoals Spanje zijn hier al langer mogelijkheden voor.
Dynamische tarieven zijn volgens sommigen de juiste stimulans om flexibiliteit uit kleinverbruikers te
verkrijgen, het is volgens anderen echter de vraag of kleinverbruikers genoeg prikkel zullen ondervinden
om het zelf balanceren te stimuleren.
2.2.2. Aggregatoren: Denkt u dat aggregatoren zouden kunnen bijdragen aan de
flexibiliteit van het energiesysteem, en wat zou daarvoor moeten gebeuren? Op
welke schaal gebeurt dat al en wat zijn de barrières voor een effectieve inzet van
dergelijke marktpartijen?
Sommige vormen van vraag zouden kunnen worden gebruikt in de onbalansmarkten, maar in de gevallen
van kleinschalig verbruik moet dit kunnen worden opgeschaald door een aggregator om toegang te
krijgen tot deze markten. Het Ministerie van Economische Zaken zegt in de energieagenda te zullen kijken
naar de opties om de weg vrij te maken voor een dergelijke marktpartij.
2.2.3. Integratie met Warmtesector: In Denemarken wordt veel aandacht besteed aan
vraagsturing via de elektrificatie van de warmtevoorziening. Omdat dit een gebied
is waar flexibele consumptie verwacht wordt toe te nemen ligt er potentie om deze
flexibele consumptie in te zetten voor het opvangen van pieken en verminderen van
vraag tijdens lage invoeding van hernieuwbare bronnen. Zou Nederland dezelfde
strategie kunnen en moeten handhaven, en liggen er barrières tussen om dit te
bereiken?
2.2.4. Overig: Welke andere mogelijkheden en barrières ziet u voor Nederland om gebruik
te kunnen maken van de potentie voor vraagsturing?
2.3. Smart-Grids en netwerkverzwaring
2.3.1. Effect van slimme distributienetwerken: In welke mate denk u dat investeringen
in slimme distributienetten ondersteunend zijn voor het oplossen van
flexibiliteitsproblematiek?
59
Hoewel slimme distributienetwerken geen directe besparing opleveren, noch in staat zijn direct flexibiliteit
te leveren, kan een slimmer gebruik van de bestaand netten de randvoorwaarden leveren voor
vraagsturing, dynamisch de maximale netcapaciteit te benutten en te monitoren om congestie te
voorkomen.
2.3.2. Netverzwaring: Bent u het eens met de stelling dat netbeheerders geen andere
opties hebben dan de distributienetten te verzwaren terwijl dit vaak niet de
goedkoopste oplossing is? Zo ja, op welke manier zou dit veranderd kunnen
worden?
Volgens een rapport van de Overlegtafel Energievoorziening (2015) zijn distributienetwerken op sommige
plekken overbelast door grote hoeveelheden lokale zonne-energie.
2.3.3. Congestiemanagment: Bent u het eens met de stelling dat zeer korte pieken in het
netwerk betekenen dat de nadruk om hiermee om te gaan meer zou moeten liggen
op congestiemanagement dan op netverzwaring? Zo ja, wat is er beleidsmatig voor
nodig om congestiemanagment makkelijker mogelijk te maken?
Hoewel de interne congestie in Nederland klein is, wordt verwacht dat de gemiddelde piekbelasting op
het netwerk tot 2023 met gemiddeld ongeveer 6% zal stijgen terwijl de dalen juist dieper worden (Hers et
al., 2016). De korte duur van congestie zou kunnen betekenen dat de nadruk minder zou moeten liggen
op netverzwaring en meer op congestiemanagment.
2.4. Transmissienet verzwaring en import en export
2.4.1. Interne capaciteit: Denkt u dat de strategie om sterkere fysieke verbindingen te
creëren in het interne netwerk van Nederland belangrijk is voor het verminderen van
temporale fluctuaties of belangrijker zal worden bij hoge percentage variabele
duurzame energie in het systeem op de lange termijn?
Het uitbreiden van het gebied waarin gebalanceerd wordt is een manier om fluctuaties van variabele
duurzame energiebronnen te verminderen. Als bijvoorbeeld windkracht over grote gebieden samen wordt
samengenomen zonder enige barrière in het netwerk nemen de pieken en dalen van de totale variabele
opwek af.
2.4.2. Import- en exportcapaciteit: Geldt dit ook voor uitbreiding van de netcapaciteit
met buurlanden, inclusief de versterking van het overzeese netwerk met de
Noordzeelanden?
Denemarken heeft als belangrijke aanvulling op flexibele capaciteit sterke verbinding en marktintegratie
met de Scandinavische Nordpool markt. Doordat zich in deze regio veel flexibele duurzame energie uit
60
waterkracht en opslag in de vorm van gepompte waterkracht kan Denemarken relatief makkelijk omgaan
met fluctuaties.
2.5. Integratie van energieopslag
2.5.1. Rol van energieopslag: Bent u het eens met de stelling dat energieopslag op korte
termijn nog geen belangrijke rol hoeft te spelen? Denkt u dat opslag wel een
belangrijke rol zal gaan spelen en op welke termijn en bij welke percentages
variabele duurzame energie zal dit dan het geval zijn?
Volgens meerdere bronnen is in de huidige situatie opslag van elektriciteit nog niet noodzakelijk en hoeft
daarom nog niet op grote schaal te worden geïmplementeerd. Er zouden veel andere (goedkopere)
flexibiliteitsopties open staan die relatief eenvoudig meer flexibiliteit in de markt zouden kunnen brengen.
2.5.2. Rol beleid voor energieopslag: Als u verwacht dat energieopslag een grote rol
speelt, zal spelen of zou moeten spelen, wat zijn de grootste barrières en wat vindt
u dat beleid en regulering zou moeten doen om dit te verbeteren?
2.5.3. Doelstellingen voor industrie: In Californië worden doelstellingen voor de
elektriciteitsbedrijven uitgesproken voor energieopslag, terwijl het percentage
variabele duurzame energie nog slechts 12% is. Denkt u dat een dergelijke aanpak
zou kunnen helpen om te zorgen dat er op tijd voldoende wordt geïnvesteerd in
energieopslag?
2.5.4. Belasting op opslag: In de energieagenda wordt genoemd dat de overheid
overweegt om dubbele belasting op energie die wordt opgeslagen door derde
partijen weg te nemen. Denkt u dat dit een belangrijke zet zou zijn?
Op dit moment wordt belasting geheven over elektriciteit die wordt afgenomen door een installatie voor
energieopslag, ook als deze de opgenomen elektriciteit later weer in het net voedt.
2.6. Marktontwerp en kostenallocatie voor flexibiliteit
2.6.1. Markttoegang
2.6.1.1. Algemeen: In hoeverre en door welke barrières worden vraagsturing en
variabele energiebronnen volgens u verhinderd om in markten bieden, is het

61
belangrijk dit te veranderen en zo ja, welke beleidsacties zou men moeten
ondernemen om de situatie te verbeteren?
Vraagsturing en variabele duurzame energiebronnen hebben volgens verschillende bronnen
problemen om toegang te krijgen tot de elektriciteitsmarkten. (zie bijv. Van de Vegte, 2015).
2.6.1.2. Onafhankelijke aggregatie: Zou aggregatie onafhankelijk van PV partijen of
energieleveranciers een goede stap zijn om sneller en meer vraagsturing in de
markt te brengen?
In Zwitserland en Frankrijk worden onafhankelijke aggregatie diensten toegestaan, zonder dat
daarvoor een contract nodig is met een leverancier of programmaverantwoordelijke. In Nederland
is dit niet het geval en moeten aggregatoren contractuele relaties aangaan met een PV partij.
2.6.1.3. Productdefinities: Moeten, en zo ja op welke manier, de minimumeisen van
producten op de verschillende markten worden aangepast om verschillende
marktpartijen, en vooral kleinschalige productie en vraag, meer toegang te
verlenen?
Denk hierbij vooral aan verkleining van minimum volume en snelheid die gevraagd worden van
individuele leveranciers (CE Delft & Microeconomix, 2016).
2.6.2. Volledigheid van de markt
2.6.2.1. Algemeen: Zijn er volgens u missende verbanden tussen de korte-
termijnmarkten die door een vervormd prijssignaal voorkomen dat markten
de real-time waarde van elektriciteit laten zien? Zo ja wat zijn mogelijkheden
om sterkere verbanden te leggen tussen de verschillende markten?
Behalve toegangseisen kan ook missende continuïteit in de markt bepaalde actoren weerhouden
om op een weloverwogen manier in de markt te kunnen bieden. Bijvoorbeeld Agora Energiewende
(2016) stelt dat sterkere verbindingen in prijzen tussen de verschillende markten beter laten zien
wat de daadwerkelijke waarde van schaarste is. Voorbeelden van vervormingen in prijzen zijn de
socialisatie van balanskosten en niet geharmoniseerde productlengtes tussen de verschillende
korte-termijnmarkten.
2.6.2.2. Kwartierlijkse producten: Wat vindt u van het voorstel om de productduur
van day-ahead en intra-day markten te verkorten tot kwartierwaarden, wat
zouden de nadelen hiervan zijn?

62
2.6.2.3. Balansmarkt: Duitsland stapt voor zijn tertiaire, ofwel reservevermogen, over
op dagelijkse veiling. De Nederlandse markt kent in tegenstelling tot de Duitse
echter ook vrije biedingen in de markt voor reserve-energie, waarbij
onbalansdata kort voor real-time worden gepubliceerd. Denkt u dat een
combinatie van deze regelingen de markt beter bestendig zouden maken voor
de toekomst?
De markten voor reservevermogen worden in Nederland ver van tevoren gesloten. De primaire
regeling wordt wekelijks afgehandeld, regelvermogen en reservevermogen worden jaarlijks
verhandeld. Dit betekent dat actoren lastig inschatting kunnen maken of het interessanter is te
bieden in deze of in andere markten omdat nog niets bekend is over de marktprijzen op deze korte
termijn. Vrij biedingen met data over de onbalans vlak voor real-time maken ‘passieve’ bijdragen
aan het oplossen van de onbalans mogelijk.
2.6.2.4. Intraday veilingen: Denkt u dat intraday veilingen een belangrijke aanvulling
zou kunnen zijn op de huidige standaard van continue intraday markten? Wat
zouden de nadelen zijn van een dergelijke aanvullende markt in de APX?
Vanuit onderzoek wordt aangegeven dat ter aanvulling van de continue intraday markten, discrete
veilingen meer mogelijkheden bieden geven voor partijen om te bieden op de intraday markt en
daarmee het volume dat kort voor real-time wordt verhandeld zal vergroten. Door een preciezere
inschatting zou dit betere mogelijkheden geven te reageren op fluctuaties. (Zie bijv. Neuhoff et
al., 2016). Duitsland kent sinds eind 2014 dergelijke kwartierlijkse veilingen naast de continue
markt.
2.6.3. Marktparticipatie
2.6.3.1. SDE+: Denkt u dat het huidige stimuleringsmodel de juiste is om te zorgen
dat gesubsidieerde duurzame energiebronnen onderhevig zijn aan
marktcondities en dus voldoende prijsprikkels ontvangen om de door hen
mogelijk geleverde flexibiliteit te benutten?
Nederland heeft, in tegenstelling tot veel andere landen, al langer ervaring met een meer op de
markt gebaseerd model voor het bevorderen van duurzame energie met de SDE+. De meeste
andere landen hebben langer vastgehouden aan vaste ‘Feed-in Tariffs’. In dit model zijn
producenten van elektriciteit onderhevig aan marktprijzen, wat niet het geval is bij vaste
tarieven.
2.6.3.2. Saldering: Bent u het eens met de kritiek op de salderingsregeling voor
kleinverbruikers dat het slecht is voor de systeembalans? Denkt u dat bij een
afschaffing een alternatieve stimuleringsregeling nodig is, en hoe zou deze
eruit kunnen zien zonder over hetzelfde struikelblok te vallen?
63
In Nederland kennen we een salderingsregeling voor kleinverbruik, die ten minste tot 2020 zal
blijven bestaan. Behalve een effectieve stimuleringsmaatregel, wordt de salderingsregeling voor
kleinverbruikers ook gezien als problematisch voor de systeembalans, omdat de producenten
betaald worden voor elke geleverde kWh, op welk uur van de dag dan ook, onafhankelijk van
schaarste.
2.6.4. Marktverbinding met buurlanden
2.6.4.1. XBID: Verwacht u dat het XBID-project grote veranderingen met zich mee zal
brengen voor de Nederlandse Intra-Day markt en dat het daardoor zal leiden
tot een kleinere behoefte aan reservecapaciteit en daarom lagere totale kosten
voor balanshandhaving? Wat verwacht u voor eventuele problemen in deze
ontwikkeling?
Vanaf dit jaar wordt naar verwachting marktkoppeling van de intraday market in een
gemeenschappelijke Europese markt bewerkstelligd met het zogenaamde Cross-Border Intra-Day
ofwel XBID project. Naast het koppelen van de continue intraday markten heeft het als doel om
impliciet netwerkallocatie mee te nemen voor de netcapaciteit over de grens.
2.6.4.2. Internationale samenwerking: In welke mate is volgen u internationale
samenwerking, coördinatie en harmonisatie van belang voor beter verbonden
markten en fysieke verbindingen in de regio? Wat zou internationale net- en
marktintegratie kunnen versnellen op beleidsvlakken
2.6.5. Marktrepresentatie van netcondities
2.6.5.1. Nodal pricing: Denkt u dat nodal pricing een goede manier is om kosten voor
netwerkgebruik bij de juiste actoren te leggen en denkt u dat een dergelijk
systeem positieve effecten zou hebben binnen de Nederlandse markt? Denkt
u dat een dergelijk systeem in te passen zou kunnen zijn in het Nederlandse
markt gebaseerde systeem?
Nodal pricing, of Locational Marginal Pricing, is de standaard in een aantal Amerikaanse staten
en verscheidene andere regio’s. Deze methode wordt ook regelmatig door onderzoek aangedragen
als een goede manier om de kosten van het gebruik van het netwerk bij de juiste actoren te leggen
en als prikkel voor flexibele invoeding en verbruik, afhankelijk van de locatie.
2.6.5.2. FTR: Denkt u dat bij een eventuele verschuiving naar nodale prijzen, een FTR-
systeem voldoende tegen risico’s van prijsfluctuaties zouden kunnen
beschermen, en onder welke voorwaarden zou dat kunnen helpen voor de
investeringszekerheid?

64
Bij een eventuele verschuiving naar een nodaal prijssysteem voor elektriciteit worden Financiële
transmissierechten (FTR’s) aangedragen als oplossing om te voorkomen dat individuele actoren er
sterk op achteruitgaan en dat risico’s verminderd worden (Zie bijv. Kunz et al., 2016).
2.7. Flexibiliteit uit de aanbodzijde
2.7.1. Stimuleren netvriendelijk ontwerp: Denkt u dat het mogelijk is de SDE+ zo aan te
passen dat het een bijdrage zou kunnen leveren aan een stimulering van
systeemvriendelijke turbines en zonnesystemen, door niet alleen ingevoede
elektriciteit, maar ook andere aspecten mee te nemen?
In de SDE+ wordt een bepaald aantal jaar, een maximale hoeveelheid energie gesubsidieerd aan de hand
van de verwachte aantal vollasturen. In Denemarken is de hoeveelheid subsidiabele energie voor
windkracht afhankelijk van zowel de capaciteit van de generator als van de grootte van het oppervlak
van de wieken. Dit is zo geformuleerd om te voorkomen dat een prijsprikkel ontstaat om in windturbines
te investeren met relatief grote capaciteit die slechter zijn voor het systeem omdat het grotere pieken
heeft.
2.7.2. Duurzame flexibele bronnen: Denk u dat biomassa of eventueel andere flexibele
duurzame energiebronnen als een belangrijk deel van de oplossing zouden kunnen
in een scenario met zeer lage uitstoot in de elektriciteitssector rond 2050? Zo ja, hoe
zou deze technologie gestimuleerd moeten worden in de markt te blijven?
In een zeer vergevorderd stadium van de energietransitie blijft er waarschijnlijk weinig ruimte over voor
de flexibiliteit uit fossiele energiebronnen. Als een energy-only markt met lage elektriciteitsprijzen
gecombineerd wordt met hoge prijzen voor de uitstoot van CO2., zou de business case voor bijvoorbeeld
gascentrales aanzienlijk zijn verslechterd. Mogelijkerwijs is er wel ruimte voor technologieën met weinig
tot geen uitstoot.
2.7.3. Aggregatie: Zit aan de aggregatie van gedistribueerde energiebronnen nog
aanvullende uitdagingen vergeleken met de aggregatie van vraagzijde sturing?
Zoals besproken bij vraagsturing zouden aggregatoren meer ruimte kunnen krijgen om diensten te
leveren, zodat de door kleinverbruikers verbruikte elektriciteit kan worden ingezet op de balansmarkten.
Dit soort organisaties zouden gelijktijdig elektriciteit uit gedistribueerde bronnen kunnen verkopen op de
elektriciteitsmarkten, zoals de elektriciteit uit kleinschalige zon-pv installaties.
2.7.4. Capaciteitsmarkt of -reserves: Ziet u op de middellange termijn een noodzaak
voor een capaciteitsmechanisme, ofwel een capaciteitsmarkt ofwel een
capaciteitsreserve? Op welke manier zouden criteria in een dergelijk systeem de
flexibiliteit van de extra capaciteit kunnen garanderen?

65
In Duitsland wordt in een capaciteitsreserve gehanteerd die opereert buiten de markt om voldoende
capaciteit te garanderen.
2.8. Systeemregulering en controle
2.8.1. Netwerkcode: Denkt u dat het maken van een onderscheid tussen technologieën
in de netwerkcode zou kunnen bijdragen aan de participatie en hun bijdrage aan de
flexibiliteit in het systeem?
In enkele landen, bijvoorbeeld Denemarken en Ierland, zijn meerdere netcodes gedefinieerd voor
verschillende technologieën. Entso-E meent echter dat een enkele netwerkcode de gelijke behandeling van
technologieën bevordert en bijdraagt aan de eenvoud van regulering. Een ander perspectief is echter dat
gelijke behandeling voor verschillende technologieën niet leidt tot een gelijk speelveld.
2.8.2. FRAC-MOO: Denkt u dat naar het ISO-model eisen en verplichtingen gesteld
kunnen worden vanuit overheidsbeleid of regulering aan het generator portfolio van
energiebedrijven en aan het aanbieden van hun flexibele bronnen?
De Californische Independent System Operator (ISO), in tegenstelling tot netbeheerders in Europa,
vereisen een bepaalde flexibiliteit in het portfolio van de generatoren en lokale netbeheerders en deze ook
daadwerkelijk in de markt aan te bieden (FRAC-MOO: Flexible Resource Adequacy criteria en Must-Offer
Obligations). In tegenstelling tot het hier gebruikte model van het toedienen van prikkels in de markt,
worden onder dat systeem vaker verplichtingen opgesteld.
2.9. Systeem brede planning optimalisatie en diversificatie
2.9.1. Holistische planning: Denkt u dat het meenemen van de interactie tussen
verschillende technologieën in overheidsbeleid een belangrijke strategie zou kunnen
zijn in Nederland, waar nu vooral een voorkeur is voor een ‘technologie neutrale’
aanpak? Op welke manier zou dit te operationaliseren zijn?
In Californië wordt gestuurd richting een portfolio van energiebronnen die zo goed als mogelijk
overeenkomt met de vraag. Dit betekend dat de interactie tussen verschillende bronnen wordt
meegenomen in de regulering, zodat een zo efficiënt mogelijk portfolio wordt opgebouwd. Men kan
bijvoorbeeld in bestaande stimuleringsmaatregelen meenemen welke technologieën op dat moment
zorgen voor zo min mogelijk extra flexibiliteitsbehoefte en deze voordelen geven boven andere.
3. Afsluiting:
3.1. Inhoudelijk: Ziet u nog aanvullende problemen, concrete of generieke oplossingen die nog
niet zijn besproken?
3.2. Feedback: Heeft u nog op- of aanmerkingen over dit interview, zowel inhoudelijk als over
de vorm?
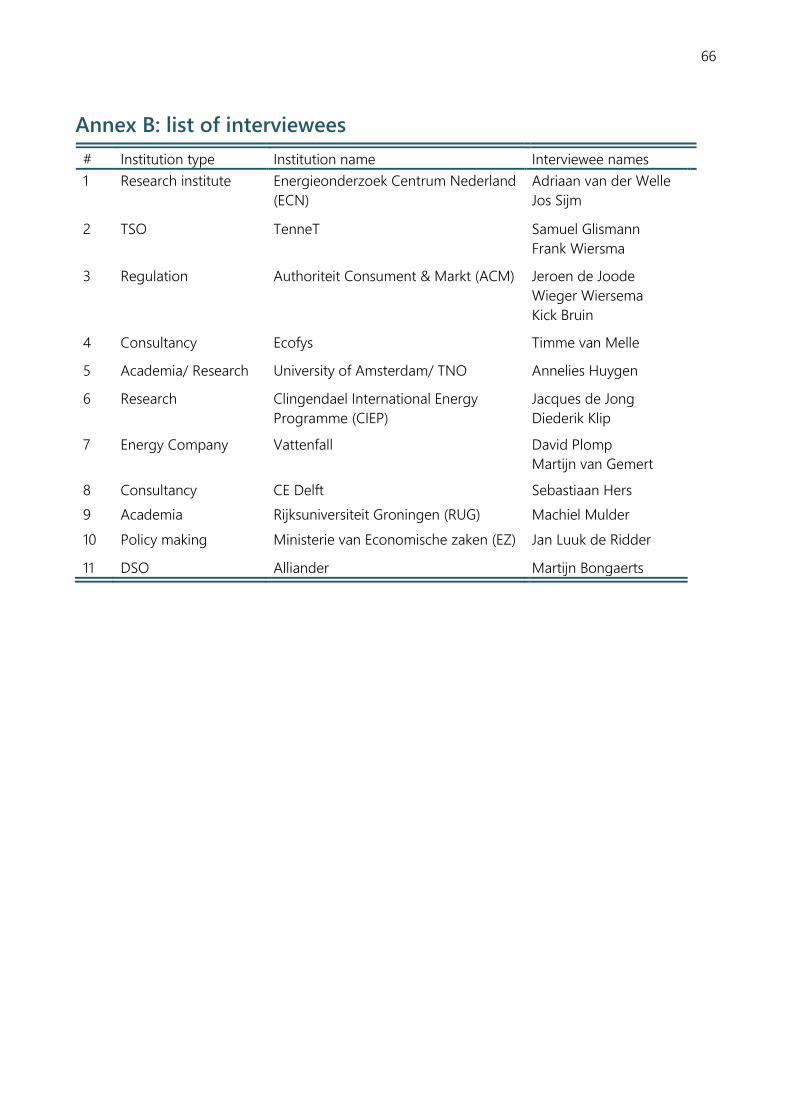
66
Annex B: list of interviewees
# Institution type Institution name Interviewee names
1 Research institute Energieonderzoek Centrum Nederland
(ECN)
Adriaan van der Welle
Jos Sijm
2 TSO TenneT Samuel Glismann
Frank Wiersma
3 Regulation Authoriteit Consument & Markt (ACM) Jeroen de Joode
Wieger Wiersema
Kick Bruin
4 Consultancy Ecofys Timme van Melle
5 Academia/ Research University of Amsterdam/ TNO Annelies Huygen
6 Research Clingendael International Energy
Programme (CIEP)
Jacques de Jong
Diederik Klip
7 Energy Company Vattenfall David Plomp
Martijn van Gemert
8 Consultancy CE Delft Sebastiaan Hers
9 Academia Rijksuniversiteit Groningen (RUG) Machiel Mulder
10 Policy making Ministerie van Economische zaken (EZ) Jan Luuk de Ridder
11 DSO Alliander Martijn Bongaerts