duncan dam project water use plan lower duncan …...2016/03/01 · march, 2016 lower duncan river...
TRANSCRIPT

Duncan Dam Project Water Use Plan
Lower Duncan RiverRiparian Cottonwood Monitoring
Reference: DDMMON#8-1
Year 6 Report
Study Period: April 2014 – January 2015
VAST Resource Solutions Inc. Cranbrook, B.C.
March 2016


BOX 538, CRANBROOK, BC V1C 4J1 PHONE: (250) 426-5300 • FAX: (250) 426-5311 • WWW.VASTRESOURCE.COM
DDMMON#8-1 Lower Duncan River Riparian Cottonwood Monitoring
Year 6 Annual Report (2015)
Final Report
Prepared for: BC Hydro
601-18th Street Castlegar, B.C., V1N 2N1
Prepared by:
Mary Louise Polzin1, Brenda Herbison3 and Stewart B. Rood2 1VAST Resource Solutions Inc.,
2University of Lethbridge, Alberta and
3North Kootenay Consulting Services Ltd.
March 2016
2009
2015

March, 2016 Lower Duncan River Riparian Cottonwood Monitoring File: 14.0037.00 DDMMON#8-1 VAST Resource Solutions Inc. BC Hydro
ii
Suggested Citation
Polzin, M.L.1, B. Herbison and S.B. Rood2. 2016. DDMMON #8-1 Lower Duncan River Riparian Cottonwood Monitoring Program. Year 6 Report – 2015. 1VAST Resource Solutions and 2University of Lethbridge, Alberta. Unpublished report by VAST Resource Solutions, Cranbrook, B.C., for BC Hydro Generations, Water License Requirements, Castlegar, BC. 56 pp. + Apps.
Cover photo Lower Duncan River, Segment 3, Transect line 15, July 23, 2009 and the same transect line August 8, 2015. Arrow is pointing at the same piezometer in each photo. Photos © Mary Louise Polzin, VAST Resource Solutions Inc.
© 2015 BC Hydro. No part of this publication may be reproduced, stored in a retrieval system, or transmitted, in any form or by any means, electronic, mechanical, photocopying, recording, or otherwise, without prior permission from BC Hydro, Burnaby, B.C.

March, 2016 Lower Duncan River Riparian Cottonwood Monitoring File: 14.0037.00 DDMMON#8-1 VAST Resource Solutions Inc. BC Hydro
iii
EXECUTIVE SUMMARY This study evaluated the impacts of operating Alternative S73 (Alt S73) on black cottonwoods (Populus trichocarpa) and other riparian vegetation along the lower Duncan River. A ten-year riparian vegetation monitoring program along the lower Duncan River was initiated in 2009 as part of the implementation of the Duncan Dam Project Water Use Plan (WUP). The alternative flow regime selected by the Consultative Committee was the following: peak flows of 400 m3/s from May 16 to July 31 with declining flows to 250 m3/s August through September, and then further declines to 73 m3/s for October, then the flows gradually increase to mid-May peak flow rate. The study provided site-specific data to guide the river flow regulation and to improve the understanding of the relationships between flow regimes, physical environmental conditions, and riparian vegetation. This report describes study Year 6 (2015) of the monitoring project, which includes the lower Duncan River and the adjacent free-flowing lower Lardeau River, as a comparative reference reach. The river floodplain zones, riparian vegetation, and black cottonwood recruitment are being assessed in order to address the integral management questions and their associated hypotheses:
1) Are there changes in black cottonwood recruitment or riparian habitat communities? 2) What are the drivers of black cottonwood success (following table, page iv) since Alt S73
was implemented? The performance assessment of Alt S73 on the lower Duncan River riparian community will combine all years of the study. The 2015 data adds to that existing data set. Riparian vegetation monitoring comparisons showed similar spatial patterns from study Year 1 (2009) to study Year 6 (2015). The lower Duncan reach species richness has displayed some variation across years, particularly for the herbaceous vegetation due to seasonal variations between years. Conversely, tree and shrub species have remained more consistent since 2009 which is characteristic of woody species. The field data, the prior years’ results, and the associated analyses support our expectation that the river flow regime is the primary driver affecting black cottonwood seedling establishment and recruitment along the Duncan River. However, there is an apparent confounding effect from weather, which was shown through the monitoring of the Lardeau River reach. It is anticipated that that the seasonal weather effects can be resolved from the hydrologic effects due to the change in the Duncan River flow regime. Building upon the results over multiple years, the 2015 results indicate that the river flow regime is the primary factor for sediment deposition and erosion. However, new recruitment sites from this process has not occurred since 2009. Within this study system, cottonwood colonization appears to be tied to elevational position with reference to stream stage pattern, geomorphic context, sediment deposition, influences of tributary inflows, and for the final segment, lake level. Cottonwood establishment and recruitment occurs at the higher elevation of the active channel zone, this has continued the channel narrowing process observed by Miles (2002). Full riparian vegetation monitoring and mapping will occur again in 2018 and that will provide the last data set for deliberate testing of the hypotheses and to address the key management questions. Keywords – Duncan River, black cottonwood (Populus trichocarpa), seedling recruitment, and
flow regime

March, 2016 Lower Duncan River Riparian Cottonwood Monitoring File: 14.0037.00 DDMMON#8-1 VAST Resource Solutions Inc. BC Hydro
iv
DDMMON#8-1 Status of Objectives, Management Questions and Hypotheses after Study Year 6. Hypotheses testing was not part of year 6 analyses.
Objectives Management Questions
Management Hypotheses Year 6 (2015) Status
1) To assess the performance of Alt S73 on the lower Duncan River riparian community and specifically black cottonwoods, through comparisons of field-based performance measures.
1) Will the implementation of Alt S73 result in neutral, positive, or negative changes for black cottonwoods and riparian habitat diversity along the lower Duncan River as compared to past-regulated regimes?
H01: There is no change in black cottonwood establishment or survival resulting from the implementation of Alt S73.
Summary of 2015 riparian vegetation results showed no adverse effect on the established riparian community. Seedling establishment, survival and recruitment continues to show variability. Since there are no pre-Alt S73 black cottonwood establishment and survival data, data, using tree core samples, will be used to establish pre-Alt S73 survival rates in 2016 so H01 can be completed in 2018.
2) To quantify the relationships between abiotic influences and biological responses based on analyses of field data.
2) What are the key drivers of black cottonwood recruitment success along the lower Duncan River floodplain? How are these drivers influenced by river regulation?
H02: Black cottonwood establishment and survival along the lower Duncan River are not affected by the river flow regime.
Cottonwood establishment and survival is linked to water inundation, river stage during the growing season, deposition and erosion, establishment elevation, and the growing season weather. All of these factors, but the weather, are influenced by river regulation. The past 6 years’ show a strong trend suggesting that river flow regime does affect establishment and survival along the lower Duncan River. Hypothesis testing will occur in 2018.
3) To utilize the derived relationships in conceptual models for predicting the long-term response of black cottonwood and other riparian plant communities to a variety of flow regimes
H03: The river flow regime is the primary driver of black cottonwood establishment and survival along the lower Duncan River.
The analyses from Year 6 along the lower Duncan River indicated that the river flow regime is a primary driver of black cottonwood establishment and survival along the lower Duncan River. However, hypothesis testing will occur in 2018.

March, 2016 Lower Duncan River Riparian Cottonwood Monitoring File: 14.0037.00 DDMMON#8-1 VAST Resource Solutions Inc. BC Hydro
v
ACKNOWLEDGEMENTS Sincere thanks go to the 2015 field data collection team: Ben Meunier, Henning Barth, Jodi Schmideder, and Brenda Herbison. The August field visits were not plagued by mosquito swarms which made field work very pleasant. The experience and knowledge of Ben Meunier enabled efficient and time-saving sampling this season. Special thanks are extended to Ben Meunier for his expertise in the navigation and operation of the canoe and raft that allowed sampling of transects not accessible by land, while keeping costs within the available budget. Additional thanks go to Brenda Herbison who in addition to field surveys also completed the phenology monitoring and reporting on it. Funding for the project was provided by BC Hydro Columbia Water License Requirements and in-kind contribution of time and resources from the University of Lethbridge.

March, 2016 Lower Duncan River Riparian Cottonwood Monitoring File: 14.0037.00 DDMMON#8-1 VAST Resource Solutions Inc. BC Hydro
vi
Table of Contents EXECUTIVE SUMMARY ............................................................................................................................. III ACKNOWLEDGEMENTS ............................................................................................................................. V 1 INTRODUCTION ................................................................................................................................ 10
1.1 Overview ........................................................................................................................................ 10 1.2 Objectives ...................................................................................................................................... 11
2 METHODS .......................................................................................................................................... 12 2.1 Study Area ..................................................................................................................................... 12 2.2 Sampling Design ............................................................................................................................ 16 2.3 Seasonal Weather .......................................................................................................................... 20 2.4 Hydrology ....................................................................................................................................... 20 2.5 Black cottonwood Phenology ......................................................................................................... 20 2.6 Substrate Texture Index ................................................................................................................. 21 2.7 Field Visits ...................................................................................................................................... 21 2.8 Seedling Establishment and Recruitment ...................................................................................... 21 2.9 Riparian Vegetation Sampling ....................................................................................................... 22 2.10 Transect-Specific Stage/Discharge Relationships ......................................................................... 24 2.11 Aerial Photography and Riparian Community Monitoring .............................................................. 24 2.12 GIS Data ........................................................................................................................................ 25 2.13 Data Analyses ................................................................................................................................ 25
3 RESULTS ........................................................................................................................................... 26 3.1 Weather .......................................................................................................................................... 26 3.2 Hydrology ....................................................................................................................................... 29
3.2.1 Duncan River ........................................................................................................................... 29 3.2.2 Lardeau River .......................................................................................................................... 30
3.3 Black cottonwood Phenology ......................................................................................................... 32 3.4 Substrate Texture Index (STI) ........................................................................................................ 33 3.5 Black cottonwood Establishment and Recruitment along the Lower Duncan and Lardeau
Rivers ............................................................................................................................................. 34 3.5.1 Seedling Abundance ............................................................................................................... 34 3.5.2 Seedling densities and survival ............................................................................................... 36 3.5.3 Seedlings, establishment to recruitment of 2013 seedlings .................................................... 39
3.6 Riparian Vegetation ........................................................................................................................ 40 3.6.1 Reach species richness .......................................................................................................... 43 3.6.2 Vegetation cover versus vegetation species diversity ............................................................ 43
3.7 Riparian Community Monitoring ..................................................................................................... 44 4 DISCUSSION ..................................................................................................................................... 49
4.1 Field monitoring of riparian vegetation and black cottonwood recruitment .................................... 49 4.2 Riparian Community Monitoring (Aerial Photography) .................................................................. 51
5 CONCLUSIONS ................................................................................................................................. 51 6 RECOMMENDATIONS ...................................................................................................................... 52
6.1 Pre-Alt S73 Cottonwood Establishment ......................................................................................... 52 7 CLOSURE .......................................................................................................................................... 53 8 REFERENCES ................................................................................................................................... 54

March, 2016 Lower Duncan River Riparian Cottonwood Monitoring File: 14.0037.00 DDMMON#8-1 VAST Resource Solutions Inc. BC Hydro
vii
List of Figures Figure 2-1: Study area for the lower Duncan River with stratification of the river study segments. ....... 14 Figure 2-2: Study area for the Lardeau River with stratification of the river study segments. ................ 15 Figure 2-3. Riparian plant occurrence along three spatial dimensions .................................................. 17 Figure 2-4: Lower Duncan River study transects in 2015 ...................................................................... 18 Figure 2-5: Lardeau River study transects in 2015.. ............................................................................... 19 Figure 3-1: Duncan Lake Dam weather station at Meadow Creek monthly mean temperature and
monthly total precipitation for 2013, 2014, and 2015. .......................................................... 27 Figure 3-2: Monthly precipitation (mm) for 2015 compared to the average precipitation recorded at
Duncan Lake Dam weather station ...................................................................................... 27 Figure 3-3: Snow water equivalent totals for the months February, to April at the station 2D07A Duncan
Lake No. 2 at Marble Head weather station for 2013 to 2015. ............................................ 28 Figure 3-4: Snow water equivalent (mm) data for East Creek station 2D08P, elevation 2004 m, for
2013, 2014, 2015, and the Normal levels (1981 – 2010) for the station. ............................. 28 Figure 3-5: Mean monthly hydrographs for the lower Duncan River for sampling years 2009 to 2015
(provisional) and pre-dam (3 years of data) discharges plotted with smoothed lines. ......... 29 Figure 3-6: Mean daily discharge (m3/s) for 2009 to 2015 (provisional) for the lower Duncan River at
Station 08NH118. ................................................................................................................. 30 Figure 3-7: Mean monthly discharge (m3/s) for the Lardeau River for 2015, and the averages for years
2009/2010, 2011/2012, and 2013/2014. .............................................................................. 31 Figure 3-8: Mean substrate texture index for each site in 2009, 2012, and 2015 .................................. 33 Figure 3-9: The 2013, 2014, and 2015 black cottonwood germinant densities. ..................................... 37 Figure 3-10: The 2013, 2014, and 2015 black cottonwood germinant densities, outliers removed ......... 37 Figure 3-11: Germinant densities for 2013, 2014, and 2015 for each segment along the Duncan River.38 Figure 3-12: The 2013 to 2015 black cottonwood germinant densities analysis. ..................................... 38 Figure 3-13: Seedling establishment densities for 2013 to 2015 for along the Lardeau River. ............... 39 Figure 3-14: Mean (± s.e.) survival percentages for 2013, 2014, and 2015,. ........................................... 40 Figure 3-15: Vegetation per cent cover for the Duncan River comparing 2012 versus 2015.. ................ 41 Figure 3-16: Species richness for the Duncan River by quadrat size for 2012 versus 2015. .................. 41 Figure 3-17: Vegetation per cent cover for the Lardeau Reach, comparing 2012 versus 2015. ............. 42 Figure 3-18: Species richness for the Lardeau Reach by quadrat size for 2012 versus 2015................. 42 Figure 3-19: Mean (± s.e.) vegetation cover versus mean species diversity for transects along the lower
Duncan and the Lardeau rivers. ........................................................................................... 44 Figure 3-20: Total vegetated and active channel areas (ha) for the Duncan and Lardeau reaches in
2009, 2012, and 2015. ......................................................................................................... 46 Figure 3-21: Vegetation type total areas (ha) for the Duncan River for 2009, 2012, and 2015. .............. 46 Figure 3-22: Community Type areas (ha) along the Duncan River for each segment for 2015. ............. 47 Figure 3-23: Community Type areas (ha) along the Duncan River for Segment 6 for 2009, 2012, and
2015...................................................................................................................................... 47 Figure 3-24: Air photos of Duncan Segment 4, Hamill Creek area in October 2012 (A) and in September
2015 (B).. .............................................................................................................................. 48 Figure 3-25: Community Type areas (ha) along the Lardeau River for each segment in 2015. .............. 49 Figure 3-26: Vegetation type total areas for the Lardeau River for 2009, 2012, and 2015. ..................... 49

March, 2016 Lower Duncan River Riparian Cottonwood Monitoring File: 14.0037.00 DDMMON#8-1 VAST Resource Solutions Inc. BC Hydro
viii
List of Tables
Table 2-1: The per cent cover, codes that were used for Herb, Shrub, and Tree quadrats. ............... 23 Table 2-2: Plant community types interpreted from the aerial photographs and mapped using GIS. .. 25 Table 3-1: Average precipitation and temperatures and total precipitation for the summer months
of June, July, and August from 2008 to 2015. ..................................................................... 26 Table 3-2: Peak spring freshet discharge for the Lardeau River from 2009 to 2015 with log
Pearson Type lll flood return periods and predicted discharge levels. ................................ 32 Table 3-3: Black cottonwood phenology for 2015 with 2014 phenology for comparison, along the
Duncan and Lardeau rivers (same times for both rivers. ..................................................... 32 Table 3-4: Black cottonwood seed dispersal event details for the lower Duncan and lower Lardeau
region of British Columbia. ................................................................................................... 33 Table 3-5: Comparisons of 2012, 2013, 2014 and 2015 numbers of quadrats with seedlings and
the total density per transect line of germinants for the corresponding year, along the Duncan River (Tran = Transect, Quad = Quadrats, # Germ = total density of Germinants per transect line). .............................................................................................. 35
Table 3-6: Comparisons of 2012, 2013, 2014 and 2015 numbers of quadrats with seedlings and the total density per transect line of germinants for the corresponding year, along the Lardeau River (Tran = Transect, Quad = Quadrats, # Germ = total density of Germinants per transect line). .............................................................................................. 36
Table 3-7: Comparison of the 2013 established seedling for the 1st, 2nd, and 3rd year survival and the average seedling survival for the Duncan and Lardeau rivers ....................................... 40
Table 3-8: Total number of species that occurred within the three quadrat sizes and the total number of species that occurred only along one reach ....................................................... 43
Table 3-9: Summary of area (ha) occupied by the 12 vegetation communities for the lower Duncan and Lardeau rivers and active channel area. Total areas for each Community Type for 2009 are supplied below the totals for 2012. Community Type codes are listed below table. ..................................................................................................................................... 45

March, 2016 Lower Duncan River Riparian Cottonwood Monitoring File: 14.0037.00 DDMMON#8-1 VAST Resource Solutions Inc. BC Hydro
ix
List of Appendices Appendix 1: Plant List .............................................................................................................................. 57 Appendix 2: Lower Duncan and Lardeau Rivers..................................................................................... 62 Appendix 3: Duncan and Lardeau rivers contact sheets ........................................................................ 74 Appendix 4: Statistical Analysis Details ................................................................................................ 113

March, 2016 Lower Duncan River Riparian Cottonwood Monitoring File: 14.0037.00 DDMMON#8-1 VAST Resource Solutions Inc. BC Hydro
10
1 INTRODUCTION
1.1 Overview Located in southeastern British Columbia, the Duncan River is the major river that flows into the north end of Kootenay Lake. The Duncan River was first dammed in 1967, as the first of four major damns built on rivers in the upper reaches of the Columbia River Basin. This damming followed the 1964 Columbia River Treaty between Canada and United States. These dams and reservoirs were built to provide flood control and hydroelectric power generation. The Duncan Dam installation resulted in extensive flooding of the full 25 km of Duncan Lake its adjacent wetlands, along with river segments. This flooding created a reservoir that reaches approximately 45 km in length. The Duncan Dam has no hydroelectric turbine, thereby increasing its operational flexibility. Water is released downstream from the dam to be stored in Kootenay Lake and subsequent reservoirs and passage through an extensive sequence of hydroelectric turbines of downstream dams along the Kootenay and Columbia Rivers. In 2001, the owner and operator of the Duncan Dam, BC Hydro, initiated a Water Use Planning (WUP) process to consider alternate river regulation regimes. Following hydrologic modeling and a multi-stakeholder consultative process, the flow scenario Alternative (Alt) S73 was selected for implementation. The aim of Alt S73 was to balance the flood control and hydropower objectives with environmental benefits for fish in the Duncan and Lardeau Rivers, and Kootenay Lake, and for reproduction of black cottonwood, Populus trichocarpa. The resulting flow regime of peak flows of 400 m3/s from May 16 to July 31 with declining flows to 250 m3/s August through September and then further declines to 73 m3/s for October, then the flows gradually increase to mid-May peak was the new Alt S73 targets. In 2009 it was projected that the Alt S73 was expected to result in a narrow seeding safe site zone and some successful recruitment in any given year when:
• The free-flowing spring freshet peak is higher than 300 m3/s; and • Winter dam release flows are significantly lower than this for several years
afterwards or, alternatively, of a duration less than three weeks and infrequent. Little or no successful recruitment was expected when the spring freshet peak was less than 250 m3/s, a late summer peak greater than the spring freshet peak occurs, and fall and winter high flows are above 250 m3/s for over four weeks. The actual flow regime each year was, and will be monitored during this ten year study and the resulting effect on cottonwood recruitment. The black cottonwood provides a foundation for floodplain forests and associated wildlife along the lower Duncan and Lardeau rivers as well as along Kootenay Lake. Past research has demonstrated strong links between black cottonwood recruitment, and river flows, especially below dams (Polzin 1998, Polzin and Rood 2000). Studies by Naiman et al. (2005) have also revealed the links between black cottonwoods, wildlife habitat and overall ecosystem function. Accordingly, black cottonwood was identified by the WUP as the indicator species for monitoring the effects of Alt S73 on riparian biological diversity along the lower Duncan River. The operation regime was implemented in 2008 and VAST Resource Solutions Inc. (VAST) have been investigating the environmental responses along the lower Duncan River and along the adjacent free-flowing Lardeau River (as a reference for comparison),

March, 2016 Lower Duncan River Riparian Cottonwood Monitoring File: 14.0037.00 DDMMON#8-1 VAST Resource Solutions Inc. BC Hydro
11
since 2009. A more detailed description of the background to this project is provided in the initial Year 1 report (Polzin et al. 2010). This riparian black cottonwood monitoring program was designated as DDMMON#8-1 (BC Hydro 2009). Two key management questions were developed by BC Hydro (2009) to help address uncertainty associated with black cottonwood hydrograph performance measures:
1) Will the implementation of Alt S73 result in neutral, positive, or negative changes for black cottonwood and riparian habitat diversity along the lower Duncan River, as compared to past-regulated regimes?
2) What are the key factors enabling successful black cottonwood recruitment along the lower Duncan River floodplain, and how are these influenced by river regulation?
Declines in black cottonwood populations downstream from dams along other river systems have been documented (see Rood and Mahoney 1990, Polzin and Rood 2000, Merritt and Cooper 2000). However, the lower Duncan River differs from most other studied dammed systems for two main reasons: First, 50 to 60 per cent of the flow below the Duncan Dam comes from the free-flowing Lardeau River, and second, two smaller tributaries, Hamill and Copper Creeks. The input from the Lardeau River and the creeks results in substantial sediment and woody debris inputs below the dam. In contrast, most other dammed systems experience a ‘silt shadow’, or zone of sediment depletion, and loss of large woody debris occurring downstream of the dam. This shadow results in a deficiency of sediment and woody debris along the downstream reach (Williams and Wolman 1984, Dunne 1988, Debano and Schmidt 1990, Rood and Mahoney 1995, Polzin 1998). The Duncan Dam has reduced spring peak flows since the completion of the Duncan Dam and Alt S73 did not change this. The reduced spring peak freshet cannot effectively transport the sediment and woody debris entering the system from the free-flowing tributaries as it did before the dam was installed. This has resulted in extensive large woody debris deposits along the lower Duncan River as well as aggradation, increased net sediment deposition. Second, the lower Duncan River is situated in a humid, mountainous region, which is characteristic of high groundwater recharge from the adjacent mountain uplands. Consequently the alluvial groundwater in the floodplain zone is recharged by upland groundwater, rather than being more dependent upon infiltration from river flow, as is the case in semi-arid ecoregions. The data collected during DDMMON#8-1 monitoring project will thus characterize the hydrogeomorphic conditions for the lower Duncan River and the affect it has on black cottonwood recruitment, and subsequently, the broader influence on the riparian woodlands.
1.2 Objectives The objectives of the DDMMON#8-1 monitoring program are designed for a 10-year study period (BC Hydro 2009). Listed below are the specific objectives of the DDMMON#8-1 monitoring program:
• To assess the performance of Alt S73 on the lower Duncan River riparian community and specifically black cottonwood through comparison of field-based performance measures;

March, 2016 Lower Duncan River Riparian Cottonwood Monitoring File: 14.0037.00 DDMMON#8-1 VAST Resource Solutions Inc. BC Hydro
12
• To quantify the relationships between abiotic influences (e.g., river hydrology or groundwater hydrology), and biological responses (i.e., black cottonwood recruitment), based on analyses of field data; and
• To utilize the above-derived relationships in conceptual models for predicting the long-term response of black cottonwoods and other riparian plant communities to a variety of flow regimes.
To meet the objectives and address the management questions, BC Hydro (2009) has identified three hypotheses:
Hypothesis 1 H01: There is no change in black cottonwood establishment or survival resulting from
the implementation of Alt S73; versus HA1: The implementation of Alt S73 results in either (a) a positive or (b) a negative
influence on black cottonwood survival. Hypothesis 2 H02: Black cottonwood establishment and survival along the lower Duncan River are
not affected by the river flow regime; versus HA2: Black cottonwood establishment and survival along the lower Duncan River are
affected by the river flow regime. Hypothesis 3 H03: The river flow regime is the primary driver of black cottonwood establishment
and survival along the lower Duncan River; versus HA3: The river flow regime is not the primary driver of black cottonwood establishment
and survival along the lower Duncan River. Guided by the above long-term objectives and hypotheses, three primary objectives in study Year 6 were developed:
• Collect data on the riparian vegetation community to add to the data since 2009; • Collect black cottonwood seedling data for 2013, 2014, and 2015; and • Map the lower Duncan and Lardeau rivers with aerial photos. Undertake change
detection analysis, by comparing 2012 with 2015 for channel migration, changes in vegetation communities, and changes in recruitment area between years.
The cottonwood seedling establishment and recruitment analyses, and riparian vegetation community analyses at the transect level for study Year 6 were interpreted relative to the key management questions. Study Year 6 is a summary reporting year with comparison mapping and analysis for changes that occurred over both reaches since the fall of 2012 through the use of aerial photography and comparison analysis for 2013, 2014, and 2015 seedling data. Data from study Year 6 will add to the body of knowledge for testing the three Hypotheses to assess the effect of Alt S73 in 2018.
2 METHODS
2.1 Study Area The lower Duncan River is located in the Columbia Mountains region in southeastern British Columbia. It flows south from the Duncan Reservoir. Approximately 300 m downstream of the Dam, the free-flowing Lardeau River joins the lower Duncan. The converged rivers continue south for approximately 11 km ending at Kootenay Lake where a broad delta is formed (Figure 2-1). Midway along in Segment 4, the lower Duncan River
March, 2016 Lower Duncan River Riparian Cottonwood Monitoring File: 14.0037.00 DDMMON#8-1 VAST Resource Solutions Inc. BC Hydro
13
channel is joined by three free-flowing tributaries: Meadow, Hamill and Cooper creeks. Meadow Creek is very low gradient stream, consequently contributing a very small amount of sediment and woody debris during spring high water. A back-up effect is created when the lower Duncan River stage is higher than the Meadow Creek stage, as meadow creek is a lower gradient creek. This back-water effect forces flow direction of lower Meadow Creek upstream instead of downstream. This backup of water into Meadow Creek channel has been documented to occur past the second meander point bar upstream of the confluence since 2009 and by Miles (2002). Hamill and Cooper Creeks are high gradient streams that contribute sediment and large woody debris to the lower Duncan River. The Lardeau River was selected as the reference reach because of its proximity to the lower Duncan River. It has comparable channel reaches, weather, and cottonwood seed release to the Duncan River. But the Lardeau River has a higher gradient and lower discharge. The Lardeau River reach starts 3 km upstream of its convergence with the lower Duncan River and extends upstream for approximately 11 km (Figure 2-2).

March, 2016 Lower Duncan River Riparian Cottonwood Monitoring File: 14.0037.00 DDMMON#8-1 VAST Resource Solutions Inc. BC Hydro
14
Figure 2-1: Study area for the lower Duncan River with stratification of the river study
segments.
Lardeau River
Duncan Reservoir

March, 2016 Lower Duncan River Riparian Cottonwood Monitoring File: 14.0037.00 DDMMON#8-1 VAST Resource Solutions Inc. BC Hydro
15
Figure 2-2: Study area for the Lardeau River with stratification of the river study
segments.

March, 2016 Lower Duncan River Riparian Cottonwood Monitoring File: 14.0037.00 DDMMON#8-1 VAST Resource Solutions Inc. BC Hydro
16
2.2 Sampling Design Study Year 6 (2015) of this project utilized the study design from Year 1 (see Polzin et al. 2010) with the modifications implemented in study Year 3 (2012), (Polzin and Rood 2013). In brief, the sampling design included the following tasks and collection of the following data for 2015:
• Collect riparian vegetation data within quadrats along transects (including cottonwoods over three years old);
• Collect seedling information from 2015 black cottonwood germinants and previously measured seedlings from 2013 and 2014;
• Document surface substrate texture characteristics along transects for the recruitment zone;
• Collect transect-specific stages at locations with gradually sloping point bars; • Download hydrometric records from Water Survey of Canada stations 08NH118,
and 08NH007 for hydrometric analyses; • Download precipitation and temperature records (Duncan Lake Dam station at
Meadow Creek station 1142574) for climate analyses; and • Describe black cottonwood phenology, timing of development.
The Duncan Reach was stratified into six segments and the Lardeau Reach into three based on channel morphology (Polzin et al. 2010). Each segment was sampled using randomly selected transect lines for the Duncan Reach (Figure 2-4) and Lardeau Reach (Figure 2-5; see Polzin et al. 2010 for details). All potential recruitment meander point bars and mid-channel bars in each segment had transect lines laid out perpendicular to the river, every 10 m (the length of a tree quadrat) and were numbered sequentially using GIS. Next, using a random number generator with the total number of transect, lines available for each segment were generated per segment. The number associated with each selected transect line had GPS coordinates and were used to locate the position in the field. The resulting transect lines had tag numbers attached to a tree for the point-of-commencement (POC) and the bearing for the line recorded. The established POCs and end-of-transect (EOTs) had their locations recorded based on a Trimble precision GPS. Rebar was installed to assist in the repeated re-establishment of transect lines for sampling. Duncan Reach segments had the following number of permanent transect lines established:
• Duncan Segment 1 (D1) has three transect lines, one transect line in the splash zone of dam and two transect lines on the meander lobe back channel (influenced by Duncan River similar to delta zone);
• Duncan Segment 2 (D2) is moderately entrenched straight channel pattern (Leopold and Wolman 1957, Schumm 1981) with very limited to no opportunities for black cottonwood recruitment. This segment is monitored through periodic float trips to assess if any recruitment sites develop during the study period. It was floated in 2009, 2013, and 2015 with no potential recruitment sites developing. It was also monitored with the orthophoto analysis which was completed 2009, 2012, and 2015.
• Duncan Segment 3 (D3) has ten transect lines occurring along a wide floodplain and meandering channel pattern (Leopold and Wolman 1957, Schumm 1981);

March, 2016 Lower Duncan River Riparian Cottonwood Monitoring File: 14.0037.00 DDMMON#8-1 VAST Resource Solutions Inc. BC Hydro
17
• Duncan Segment 4 (D4) has three transect lines occurring along an entrenched relatively straight channel pattern (influenced by Hamill and Cooper creeks);
• Duncan Segment 5 (D5) has six transect lines occurring along a meandering channel pattern (lower sinuosity and more constrained than D3) (Leopold and Wolman 1957, Schumm 1981); and
• Duncan Segment 6 (D6) has four transect lines occurring along a delta (influenced by Kootenay Lake and the Duncan River convergence with the lake).
The Lardeau Reach segments had the following number of permanent transect lines established:
• Lardeau Segment 1 (L1) has four transect lines occurring along the widest floodplain (for the study reach) with a meandering channel;
• Lardeau Segment 2 (L2) has three transect lines occurring along a constrained and slightly meandering channel; and
• Lardeau Segment 3 (L3) has three transect lines occurring along a constrained meandering channel (channel morphology in-between L1 and L2 for level of constraint and meandering).
The sampling designed (set up in 2009 by VAST) incorporated the basic concept of a hydrogeomorphic framework, where the relationships between riparian vegetation, elevation and substrate conditions, as well as river flow, stage patterns and groundwater patterns can be analyzed and modelled. VAST implemented a composite study design within this framework, which included both temporal and spatial comparisons, as employed by Braatne et al. (2008). The use of surveyed (elevational profile) belt transect lines allowed for the collection of riparian plant occurrence along three spatial dimensions (Cartesian coordinated x, y, z) (Figure 2-3). The x-axis represents the longitudinal axis, the position along the upstream-to-downstream corridor of a river. The y-axis represents the distance away from the river edge. The banks rise up from the river and this elevational rise provides the third spatial dimension, the z-axis. Long-term monitoring to analyze responses to human alterations, such as changes in river flow regime requires a study system that facilitates repetitive observations relative to the three spatial dimensions which adds the fourth dimension, temporal (time) comparisons.
Figure 2-3. Riparian plant occurrence along three spatial dimensions
Cartesian coordinate (x,y,z) = spatial position

March, 2016 Lower Duncan River Riparian Cottonwood Monitoring File: 14.0037.00 DDMMON#8-1 VAST Resource Solutions Inc. BC Hydro
18
Figure 2-4: Lower Duncan River study transects in 2015. Segments are indicated by the
number following D (Duncan), and transect numbers are indicated after the T (transect).

March, 2016 Lower Duncan River Riparian Cottonwood Monitoring File: 14.0037.00 DDMMON#8-1 VAST Resource Solutions Inc. BC Hydro
19
Figure 2-5: Lardeau River study transects in 2015. Segments are indicated by the
number following L (Lardeau), and transect numbers are indicated after the T (transect).
March, 2016 Lower Duncan River Riparian Cottonwood Monitoring File: 14.0037.00 DDMMON#8-1 VAST Resource Solutions Inc. BC Hydro
20
The 2015 black cottonwood germinants density, height, and position along transect line (for elevation) were recorded when they occurred along the transect line. Seedling data was recorded within 1 m2 quadrats along the downstream side of the transect lines. The previous seedlings from 2013-2015 were tracked for survival densities and heights resulting in three age classes recorded each year. Quadrats that had seedlings recorded in the previous two years (2013 and 2014) were revisited and any new locations where germinates occurred. All transect lines were surveyed in April/May of 2013 and new transect lines were established. Duncan River Segment 4 (D4) transect lines are located along the Duncan River, but are influenced by the Hamill Creek (two transect lines) and Cooper Creek (one transect line) convergences with the Duncan River. Both of these creeks experienced large flash flood events triggered by an extreme rain event resulting in considerable erosion and deposition. Therefore, the three transect lines were resurveyed in spring of 2014 to record the extent of change that occurred from the high water event (Polzin et al. 2015).
2.3 Seasonal Weather Daily precipitation and temperature data were downloaded from Environment Canada’s website for the Duncan Lake Dam station at Meadow Creek (climate ID: 1142574): http://climate.weather.gc.ca/climateData/dailydata_e.html?timeframe=2&Prov=&StationID=1115 Precipitation and temperature data were provided for years 2013, 2014 and 2015, (January to December), as tracking changes over a three year period that correspond to the seedling data collection. Historical averages for precipitation were also downloaded.
2.4 Hydrology The 2015 river discharge (Q) and stage data were downloaded from Environment Canada’s Water Survey website1 for the lower Duncan hydrometric station. The Lardeau River provisional discharge data were provided by special request from Environment Canada’s water office. Hydrometric data were from the following stations: 1) Station 08NH118: located on the lower Duncan River, below the dam and below the
confluence of Lardeau River (downstream (d/s) station), the 2015 data are provisional; and
2) Station 08NH007: located on the Lardeau River at Marblehead located approximately 700 m upstream of the confluence with the lower Duncan River, the 2015 data are provisional.
2.5 Black cottonwood Phenology Black cottonwood phenology was documented (the seasonal timing of developmental and reproductive events) through visual observations from fixed vantage points. These points provided a good overview of the lower Duncan floodplain and the lower Lardeau River. Observation sites and geographic coverage were similar to previous years. Dispersing black cottonwood seed release dates were recorded, as well as the apparent quantity of
1http://wateroffice.ec.gc.ca/report/report_e.html?mode=Graph&type=realTime&stn=08NH118&dataType=Real-Time&startDate=2015-01-01&endDate=2015-12-31&prm1=47&y1Max=&y1Min=&prm2=-1&y2Max=&y2Min=

March, 2016 Lower Duncan River Riparian Cottonwood Monitoring File: 14.0037.00 DDMMON#8-1 VAST Resource Solutions Inc. BC Hydro
21
the dispersal (i.e., low, medium, and high). During site visits to the Duncan and Lardeau reaches catkin and leaf emergences, abscission dates, and seed dispersal were recorded. No differences in timing and apparent quantity of seed release were noted between the two reaches, so only one data set is reported representing both reaches.
2.6 Substrate Texture Index Substrate Texture Index (STI) which will be used for substrate factor analysis in 2018, was calculated for the recruitment area. The substrate texture used ocular estimated per cent cover of silt, sand, pebble, cobble, and boulder along transects (referenced to metre distance from POC). Classification from Luttmerdig et al (1998) was used as follows:
• Silt = 0.002-0.062 mm STI = 1 for Silt with 100 per cent cover; • Sand = 0.062-2.000 mm STI = 2 for Sand with 100 per cent cover; • Pebbles = 2-64 mm STI = 3 for Pebble with 100 per cent cover; • Cobble = 64-256 mm STI = 4 for Cobble with 100 per cent cover; and • Boulders = > 256 STI = 5 for Boulder with 100 per cent cover.
These sediments were assigned scores of 1 to 5, respectively, and the STI was calculated as the sum of the proportion cover (decimal value) x score, for the five sediment classes. The STI value was rounded to 0.1 and was treated as a scale measure, with 41 possible values (1.0 to 5.0). This data will be used in the 2018 hypotheses testing and were used in 2009 analysis (Polzin et al. 2010). These methods are consistent with those used in 2009 (Polzin et al. 2010). Comparisons for 2009, 2012, and 2015 were used to summarize how the recruitment zone substrate texture may have changed between years of monitoring.
2.7 Field Visits Two field visits occurred in 2015: August 5 to August 8 and October 5 to October 7. The first field visit (August 5 to August 8) occurred after the last seed release and during river flow increase along the Duncan. The Lardeau River sampling during this time was very low discharge rated. The average discharge for the Lardeau River on August 7 2015 was 40.3 m3/s. On the same day (August 7) in 2014 the average daily discharge was 69.9 m3/s. The second and final field visit (October 5 – October 7) occurred during low flows to assess the establishment, survival and condition of the seedlings during the 2015 growing season. The discharge range on the Duncan River during this time was between 73.8 m3/s to 74.2 m3/s and the discharge range during this same time on the Lardeau River was 33.5 m3/s to 34.5 m3/s.
2.8 Seedling Establishment and Recruitment Belt transects were randomly located within pre-stratified river reach segments and pre-identified recruitment areas. These transects allowed for tracking of the 2013 and 2014 seedlings, and for the assessments anywhere along the transect line where new 2015 seedlings germinated (as described in the Study Design Section 2.2). Black cottonwood seedling densities, heights (averages from 10 seedling heights within a 1 m2 quadrat), and positions along the transect line were collected for 2013, 2014 and 2015 seedlings. Data for black cottonwood establishment for 2015 germinants and for continuing 2014 and 2013 seedling survival and recruitment (2013) were collected during the August and October field visits. The field data collected were tied to distances along the surveyed transect lines. This provided surveyed elevation points from 2013 for the Lardeau and

March, 2016 Lower Duncan River Riparian Cottonwood Monitoring File: 14.0037.00 DDMMON#8-1 VAST Resource Solutions Inc. BC Hydro
22
most of the Duncan reaches and from 2014 elevational data for transects in D4. The link to transect distances will facilitate comparisons over time, by enabling assessment of sediment deposition and erosion, as well as revealing changes in vegetation patterns, including black cottonwood colonization and survival. The 2015 seedling sampling methods followed the methods described in Polzin and Rood (2014). By following seedlings for a three-year period, we are able to assess establishment levels, survival through three growing seasons, and recruitment levels achieved for each year of establishment. We use the term ‘recruitment’ to represent the successful contribution to the floodplain forest population (Rood et al. 2007). Recruitment is the result of two sequential but somewhat independent processes of establishment (or colonization) and survival:
Recruitment = Establishment (colonization) + Survival The seedlings established in 2013 (that survived to the October 2015 field sampling) were considered successful recruits. Therefore, the 2013 seedlings will shift to be part of the vegetation monitoring design, utilizing cover by species to assess growth and cover expansion during 2018 riparian vegetation monitoring. Photos taken during the 2015 field season are documented in Appendix 2, and contact sheets of photos are located in Appendix 3. Original digital images are supplied on a video disc (DVD) with the final report.
2.9 Riparian Vegetation Sampling The riparian vegetation monitoring utilized belt transect lines with nested quadrats when woody vegetation occurred. Quadrat size was based on vegetation type occurring along the transect line. Three sizes were used:
• ‘Herb’ quadrats of 1 m x 1 m were used to sample herbaceous vegetation and woody vegetation under or equal to 0.5 m in height;
• ‘Shrub’ quadrats of 2 m x 4 m were used to sample woody vegetation >0.5 m and ≤ 2.0 m in height; and
• ‘Tree’ quadrats of 5 m x 10 m were used to sample woody vegetation >2.0 m in height.
The labels Herb, Shrub, and Tree do not refer to the species recorded within them (i.e. ‘shrub’ species greater than 2 m in height are sampled in a ‘Tree’ quadrat). When Shrub and Tree quadrats were used, the smaller size quadrats were nested within the top corner next to the transect line. This resulted in all Shrub quadrats having nested Herb quadrats and all ‘Tree’ quadrats having nested ‘Shrub’ and ‘Herb’ quadrats. Per cent cover for each species and average height were recorded for vegetation within a quadrat. A modified Daubenmire (1959) per cent cover sampling method was used with an additional code bracket added for trace cover as shown in Table 2-1. Heights were measured and the averages calculated.

March, 2016 Lower Duncan River Riparian Cottonwood Monitoring File: 14.0037.00 DDMMON#8-1 VAST Resource Solutions Inc. BC Hydro
23
Table 2-1: The per cent cover, codes that were used for Herb, Shrub, and Tree
quadrats. Vegetation % Cover Codes
Per cent Coverage Code Range Mid-point
1 < 1 0.1 2 >1 - 5 2.5 3 >5 - 25 15 4 >25 - 50 37.5 5 >50 - 75 62.5 6 >75 - 95 85 7 >95 - 100 97.5
Total species richness at each sampling point was collected. Species richness count ensured that the same species were not counted twice when multiple quadrat sizes were used. Plant species diversity takes into account species richness as well as abundance. Computation of the Shannon-Wiener (H’) or “Shannon” indices for the segments (individual transect lines that occur within each segment) was completed to provide an integrative measure of diversity. Midpoints of per cent cover classes were used as the measure of abundance. While some diversity measures require count data, the Shannon Index can be used with any form of data. For diversity, the Shannon-Wiener Diversity Index (H’) was calculated as follows:
∑=
−=s
1i log ' iei ppH
where: pi = proportion of the ith species s = the number of species in the community
The index increases with increasing species richness (number of species) and with increasing species evenness (abundance). If there is only one species occurring within the quadrat the diversity is zero. This results in a better represented species cover since a quadrate with four species but one species dominates and the other three species occur with very low cover for example 0.1 or 2.5 per cent cover the species diversity will be very close to zero (example H = 0.02 when 1 species has 97 per cent cover and the other 3 species have 0.1 per cent cover) while another quadrat with 4 species with equal abundance of each species will have a much higher ‘H’ value (example H = 1.39 when 4 species all have cover of 37.5 per cent). Extreme example, 63 species with equal abundance H = 4.14, with one dominate species H = 0.48. Belt-transects captured the elevational profiles and ensured comprehensive analyses of the riparian vegetation and the seedling recruitment zones. Belt-transect sampling was used along the Kootenay and Yakima rivers (Jamieson and Braatne 2001, Braatne et al. 2008), and is being continued along the Kootenay River, following recent changes in flow operations of Libby Dam (Burke et al. 2009). For additional information about belt transect line sampling used for this study see Polzin et al. (2010a and 2010b). Vegetation field sampling mirrored the collection procedures used in 2012 and this sampling design is supported by Stromberg et al. (2009). Changes from 2009 field sampling are reported in Polzin and Rood (2013).

March, 2016 Lower Duncan River Riparian Cottonwood Monitoring File: 14.0037.00 DDMMON#8-1 VAST Resource Solutions Inc. BC Hydro
24
2.10 Transect-Specific Stage/Discharge Relationships The location of the water’s edge along each transect was determined at each visit to permit site-specific stage-discharge rating curves. This information will be utilized in the advancement of the conceptual models as well as for determining stages at transect lines during a specific discharge of interest during analyses of years, as needed. Transect and quadrat positions are subsequently expressed relative to the transect elevation of the river at a base flow of 57.8 m3/s (1.52 m stage at Duncan station 08NH118) for the Duncan River as described in Polzin et al. (2010). The Lardeau River base flow of 11.1 m3/s (0.843 m at Lardeau station 08NH007) was used for transect elevation for the Lardeau River.
2.11 Aerial Photography and Riparian Community Monitoring The lower Duncan and Lardeau rivers were flown for photo analysis on September 29, 2015 to acquire 10 cm (pixel size) aerial photos. This component was subcontracted to Terrasaurus Aerial Photography Ltd., who also completed the subsequent orthorectification, colour balancing, image sharpening and mosaic compilation. Refer to Polzin et al. (2010a) for methodology used for the baseline mapping. In study Year 6 (2015) aerial photo interpretation was used to assess the changes occurring since 2012 within the study segments for both lower Duncan and the Lardeau rivers. Flights in 2015, occurred when the Duncan River stage was at 1.65 m similar to when flights occurred in 2012 with a stage of 1.62 m. The photos were interpreted for three key reasons:
1) To quantify changes in area of each riparian vegetative class, as per Table 2-2 within 100 m of the active channel edge;
2) To quantify changes in major recruitment sites (present and potential future); and 3) To quantify river channel migration rate.
The baseline photos were taken April 30, 2009 when the Duncan River level was at 1.63 m, prior to bud flushing of perennial deciduous plants and prior to the growth of annuals. Consequently, the images were not ideal for characterizing some aspects of vegetation, and especially not for delineation between some vegetation communities. Therefore, 2012 and 2015 flights were scheduled to occur before leaf fall and hopefully during early senescence, when the different deciduous shrubs and trees would be better discriminated. The 2012 air photos did not catch early senescence; the 2015 air photos captured the beginning stages of senescence at some locations. The resulting orthorectified photos allowed for a more accurate delineation of vegetation Community Types (1, 2, and 3) compared to 2009 air photos. The October imagery also allowed for identification of horsetail-dominated marsh areas and sedge-dominated areas that could not be identified in 2009 (because of April timing), but were identified in 2012. See Polzin and Rood (2013) for methods used for comparing 2009 to 2012 air photos.

March, 2016 Lower Duncan River Riparian Cottonwood Monitoring File: 14.0037.00 DDMMON#8-1 VAST Resource Solutions Inc. BC Hydro
25
Table 2-2: Plant community types interpreted from the aerial photographs and mapped using GIS.
Type Description
0 active river channel 1 <2 m tall cottonwood and willow 2 <5 m tall cottonwood, willow, deciduous and conifer 3 <5 m tall willows (occasional cottonwood, alder) 4 cottonwood and cottonwood mix* - early seral 5 cottonwood and cottonwood mix* - late seral 6 very old (>200 yr) cottonwood 7 mature conifer (cedar, hemlock, fir, larch, pine) 8 logged/regenerating 9 anthro (agriculture, buildings, roadways, industry, etc.)
10 marsh (horsetail dominated) 11 recruitment zones (present and potential) 12 sedges/grasses
* Mix includes deciduous and coniferous species.
The change detection analysis started with the 2012 community layer projected onto the 2015 ortho’s. Vegetation community polygons and the active channel edge that had changed since 2012 were modified to delineate the new boundaries on the 2015 community layer. The resulting areas for each vegetation community by segment were compared between years to quantify changes in area for each vegetation community and the river channel. Potential and existing recruitment areas were compared between years by segments for both the lower Duncan River and the Lardeau River reference reach.
2.12 GIS Data GIS submission requirements and file geodatabase are provided in digital form.
2.13 Data Analyses Data analyses focused on addressing the key management questions for three main objectives for 2015. To address the first objective, re-sampling of the broader riparian vegetation for vegetation cover and species richness/diversity occurred along transect lines for the lower Duncan and Lardeau rivers. To address the second objective, observation and sampling concentrated on cottonwood seedling establishment and recruitment. This involved comparisons between seedling establishment and recruitment for 2013, 2014 and 2015 data sets. Transect lines were replicates within each segment. Lastly, to address the third objective, sampling involved mapping any change by using comparison analysis between 2012 and 2015 for the complete Duncan and Lardeau reaches utilizing orthophotos and GIS for delineation of the different vegetation community types identified in 2009. Statistical analyses were conducted using SigmaPlot 12.5 (Systat Software. Inc. San Jose California USA) and all tests were interpreted with an alpha criterion of 0.05. At the aerial photography level all reach and segment data included area in hectares per vegetation community and channel types. At the field level, vegetation cover (abundance) was measured as per cent cover of the quadrat used for sampling. Seedling sampling was count data for 2013, 2014, and 2015 seedlings. Substrate texture in the seedling

March, 2016 Lower Duncan River Riparian Cottonwood Monitoring File: 14.0037.00 DDMMON#8-1 VAST Resource Solutions Inc. BC Hydro
26
recruitment zones was measured for the area of the meander lobe bisected by the associated transect line. Hypotheses testing will be completed in 2018 with full analyses of what has occurred over the nine years of monitoring. The tenth year (2019) will collect one more field season data point and re-run the model developed in the previous year to determine if any of the key results change in regards to the management questions. For the annual report, data analyses are limited to data summaries without any hypothesis testing. Descriptive statistics were used for general data distribution. Comparative analyses used ANOVAs, Paired-Samples T-Tests, or Wilcoxon Signed Rank Test if the normality test failed for the paired samples being tested and equal variance tests. Paired samples were between years or between segments for reaches. Pairwise multiple comparison procedures used Tukey Test as well as Mann-Whitney Rank Sum Test. Friedman repeated measures analysis of variance on ranks was utilized for the Duncan and Lardeau reaches seedling density analysis. Comparison analysis for change in plant community and channel areas (aerial photography) used Paired-Sampling T-Tests between 2009 (baseline), 2012, and 2015. The 2015 polygon areas derived from mapping utilizing GIS. Statistical analyses were conducted using SigmaPlot 12.5 (Systat Software. Inc. San Jose California USA) and all tests were interpreted with an alpha criterion of 0.05.Statistical outputs related to results are provided in Appendix 4.
3 RESULTS 3.1 Weather
The growing season of 2015 had comparable mean temperatures to years 2013 and 2014. More specifically, the mean daily temperature for the growing season in 2015 (May to September end) was 15.8 oC, which is comparable to years 2013 (15.9 oC) and 2014 (15.6 oC). Total precipitation for the growing season of 2015 was similar to 2014, but not to 2013 (2013 = 421.7 mm, 2014 = 200.5 mm, and 2015 = 236.7 mm). The temperature and precipitation in the winter months of 2015 were also similar to those of 2013 (Figure 3-1). The mean temperature in the summer months (June-August) were highest in year 2015 compared to all other sampling years, including 2008 (seedlings from the first sampling year that established in 2008 and survived through to 2009 were measured) (Table 3-1). The total precipitation for the 2015 summer months was similar to years 2009 and 2010. Table 3-1: Average precipitation and temperatures and total precipitation for the
summer months of June, July, and August from 2008 to 2015. Average 2008 2009 2010 2012 2013 2014 2015
Precipitation (mm) 65.9 45.0 41.6 74.4 68.1 33.1 42.1 Total Precipitation 197.8 134.9 124.7 223.1 204.4 99.3 126.3 Temperature (oC) 16.5 17.3 16.2 17.0 17.5 17.8 18.1

March, 2016 Lower Duncan River Riparian Cottonwood Monitoring File: 14.0037.00 DDMMON#8-1 VAST Resource Solutions Inc. BC Hydro
27
Figure 3-1: Duncan Lake Dam weather station at Meadow Creek monthly mean
temperature and monthly total precipitation for 2013, 2014, and 2015.
The total monthly precipitation for 2015 from April-August and October was below the average levels. As for the winter months, January had a comparable level to the average, and February and March were above the average for the area. September was approximately 10 mm above the average (Figure 3-2).
Figure 3-2: Monthly precipitation (mm) for 2015 compared to the average precipitation
recorded at Duncan Lake Dam weather station. November record is not complete.
Both the Duncan and Lardeau rivers are snow melt-dominated systems. As such, seasonal snow pack levels play a role in the extent of freshet flooding. However, variations

March, 2016 Lower Duncan River Riparian Cottonwood Monitoring File: 14.0037.00 DDMMON#8-1 VAST Resource Solutions Inc. BC Hydro
28
in weather determine snow melt rates and control flood probability. The Snow Water Equivalent (SWE) for 2013, 2014, and 2015 were obtained from the Duncan Lake watershed station 2D07A (archive manual snow survey data), which is at 662 m elevation at the Marble Head Weather station. When 2015 was compared to 2013, 2014, and the Normal (1981 to 2010 from 2D07A station), SWE was similar to the Normal average for February and March but similar to 2013 for April with no snow pack at this low elevation site in 2015 and 1 mm in 2013 (Figure 3-3).
Figure 3-3: Snow water equivalent totals for the months February, to April at the station
2D07A Duncan Lake No. 2 at Marble Head weather station for 2013 to 2015.
The snow pack at higher elevations influence the extent of freshet flooding more than the valley bottom snow pack. For the Duncan Lake drainage, East Creek is the established station and is actively monitored. East Creek station 2D08P is at 2,004 m elevation and had snow pack levels similar to the Normal levels for the area until June when it dropped to 42 mm by mid-June with the normal level of 464 mm (Figure 3-4).
Figure 3-4: Snow water equivalent (mm) data for East Creek station 2D08P, elevation
2004 m, for 2013, 2014, 2015, and the Normal levels (1981 – 2010) for the station.

March, 2016 Lower Duncan River Riparian Cottonwood Monitoring File: 14.0037.00 DDMMON#8-1 VAST Resource Solutions Inc. BC Hydro
29
3.2 Hydrology
3.2.1 Duncan River Mean monthly discharges from 2009 to 2015 (2009 and 2010 were combined and 2013 and 2014 were combined as these provided similar patterns as demonstrated in Polzin and Rood 2014), are shown in Figure 3-5. The sampling year of 2012 was an exception with the regular Alt S73 flow regime pre-empted by high snowmelt and rainfall in the Duncan Basin (see Polzin and Rood 2013). The past sampling year, 2015, had higher flows during the winter and early spring months (January through April). Flows fluctuated between 2009/2010 and 2013/2014 flows through most of the growing season with September flows similar to all flows since 2009. The daily mean flow data shows the variation that occurs during the year (Figure 3-6) which is smoothed out by monthly means. The 2015 flow data presented a similar pattern to sampling years 2009 and 2010. Although, flows shifted slightly to earlier in May when the first high water occurred during the growing season, and five days earlier for the second high water event in August. The August increase flow was very quick (Aug. 9 – 242.2 m3/s from 88.9 m3/s Aug. 3rd) and lasted through the month of September similar to previous study year flows. The 2009/2010 August high flows started August 8th with a more gradual and stepped increase to September peak of 219.5 m3/s. This peak lasted one day and then reach a more stable level until September 16th when it varied slightly until September 24 when it declined to low flow (75.7 m3/s) by October 1st. Flows continued to be similar to previous years until October 21st when the 2015 flow spiked to the October 22 level and stayed high through November. A similar spike has occurred in previous years but always starting a month later (December 22nd).
Figure 3-5: Mean monthly hydrographs for the lower Duncan River for sampling years
2009 and 2010 averaged, 2012, 2013 and 2014 averaged, 2015 (provisional) and pre-dam (3 years of data) discharges plotted with smoothed lines.

March, 2016 Lower Duncan River Riparian Cottonwood Monitoring File: 14.0037.00 DDMMON#8-1 VAST Resource Solutions Inc. BC Hydro
30
Figure 3-6: Mean daily discharge (m3/s) for 2009 and 2010 (averaged), 2012, 2013 and
2014 (averaged), and 2015 (provisional) for the lower Duncan River at Station 08NH118.
3.2.2 Lardeau River In 2015, the Lardeau River experienced an average spring freshet with a peak discharge of 245 m3/s that was below the 2-year recurrence peak (Qmax2 = 269.2 m3/s). The mean monthly discharges for 2015 were higher than all previous sampling years for January - May (Figure 3-7). The peak flow occurred June 9, earlier than 2014 when it occurred June 25. The 2014/2015 peak flows were similar in intensity (243 m3/s and 245 m3/s respectively), but 2015 flows receded quicker and dropped lower than 2009/2010 flows to 70.9 m3/s and all other years of sampling discharge for this project. The 2015 discharge remained lower than previous years of sampling for August when it increased slightly above all years of study for September. The 2015 discharge record is provisional and was missing some dates within the growing season months, so an estimated mean was calculated which could change slightly once the completed data set is reviewed. The 2014 data set was still in the provisional stage at the time of this report but it will be updated in the records once it is posted on the Government of Canada Water website. There were 70 years of flow records for the Lardeau River records starting in 1917, with a period of missing records from 1920 through 1945. Flow records from two hydrometric sites were coordinated by regression analysis for the period of overlap for the missing years of 1997 through 2002 (Qmax at 08NH007 = Qmax at 08NH118 x 0.37, R2 = 0.96, linear regression forced through origin). Recurrence analysis indicated that the 2015 spring freshet along the Lardeau River was below the 1-in-2 year flood event (Qmax2) see Polzin and Rood (2013) for detailed log Pearson Type III analysis.

March, 2016 Lower Duncan River Riparian Cottonwood Monitoring File: 14.0037.00 DDMMON#8-1 VAST Resource Solutions Inc. BC Hydro
31
Figure 3-7: Mean monthly discharge (m3/s) for the Lardeau River for 2015, and the
averages for years 2009/2010, 2011/2012, and 2013/2014 (very similar flows for the paired years see Appendix 4).
The 2015 peak flow occurred on June 9, which was typical timing for the Lardeau River. Historically, 71 per cent of annual peaks have occurred within June. During the research years of this project, spring freshet usually occurred mid to late June so 2015 was earlier for the study period (Table 3-2).

March, 2016 Lower Duncan River Riparian Cottonwood Monitoring File: 14.0037.00 DDMMON#8-1 VAST Resource Solutions Inc. BC Hydro
32
Table 3-2: Peak spring freshet discharge for the Lardeau River from 2009 to 2015 with log Pearson Type lll flood return periods and predicted discharge levels.
Log Pearson Type III
Year Month and Day
Peak Discharge
Return Period
Prediction (m3/s)
Std. Dev.
2009 June 17 201 m3/s 10 349 12 2010 June 29 183 m3/s 5 319 9 2011 June 23 297 m3/s Qmax3 3 294 8 2012 June 24 331 m3/s Qmax5 2 269 7 2013 June 20 269 m3/s Qmax2 2014 June 25 243 m3/s 2015 June 9 245 m3/s
3.3 Black cottonwood Phenology The records of catkin and flower emergence, leaf emergence, seed development, senescence, and seed release events in 2015 are provided in Table 3-3. These observations were recorded using methodology consistent with that of previous years (2009, 2010, 2012, 2013, and 2014). In 2015 most stages of development occurred earlier than in year 2014 (Table 3-3). The period of seed release was average, in length, beginning early but also ending earlier than normal. Table 3-3: Black cottonwood phenology for 2015 with 2014 phenology for
comparison, along the Duncan and Lardeau rivers (same times for both rivers.
Occurrence / Stage 2014 2015 Gradual emergence of male (1st) and female inflorescences. April 1 – April 30 Rapid growth April 1+
Flowers fully developed Pollination End of April, approximately Approx. April 12 - 19 Abscission of male catkins Early May April 20-30
Leaf emergence End of April (28th) to mid-May April 10- 30
Seed pods developing May to mid-June Full, green by May 25
Seed release begins June 19-20 first event - from late June through July
June 7 first event. July 16 last event
Leaf senescence Late Sep. through October Late Sep. through Oct.
Seed release events were rated from ‘Low to High’ relative to the observed airborne seed densities (Table 3-4). There was no ‘High’ seed release observed in 2015, all releases were rated as ‘Moderate’ or ‘Low’. The first release observed (Low) was June 7. The next release pulses were on June 9,11,15,19 and 20, three Low and two Moderate. The final observed seed release was on July 16 (Moderate) along both the Lardeau and Duncan Rivers. There were no seed releases observed after July 16, 2015 along either river.

March, 2016 Lower Duncan River Riparian Cottonwood Monitoring File: 14.0037.00 DDMMON#8-1 VAST Resource Solutions Inc. BC Hydro
33
Table 3-4: Black cottonwood seed dispersal event details for the lower Duncan and lower Lardeau region of British Columbia.
Event Date Seed Abundance
Tmax (oC)
Rain (mm)
Event Tmax Prior and Post Rain Events
1 Jun. 7 Low 30.5 0.0
31.2 Rained May 26 to June 4 total 54.8 mm. Jun. 9 Low 32.0 0.0 Jun. 11 Low 31.0 0.0
2 Jun. 15 Moderate 26.0 0.0 26.0 Rained 3.6 mm from June 16 to 18.
3 Jun. 19 Jun. 20
Moderate Low
24.0 23.0
0.2 6.5 23.5 Next rain events June 23, 1.4 mm and
June 29 and 30, total of 10.0 mm.
4 July 16 Moderate 22.5 0.4 22.5 Rained 19.0 mm from July 11 – 15, dry until July 24 – 30 it rained 20.8 mm.
3.4 Substrate Texture Index (STI) The substrate texture index showed an overall decrease in substrate texture in 2015 compared to 2012 (an increase of fine sediment deposition) (Figure 3-8). The standard errors were very small so they were not included on the graph. All segments had a decrease in particle size since 2009. Segment 4 showed the greatest decrease in particle size in 2015 compared to 2009 and 2012. This was attributed to the flash flood event along Hamill and Copper creeks in 2013 resulting in significant changes to the recruitment zones for D4. This change resulted in an increase of fine sediment deposition by 2015 at D4.
Figure 3-8: Mean substrate texture index (1 = silt (very fine) to 5 = bolder (very coarse))
for each site in 2009, 2012, and 2015

March, 2016 Lower Duncan River Riparian Cottonwood Monitoring File: 14.0037.00 DDMMON#8-1 VAST Resource Solutions Inc. BC Hydro
34
3.5 Black cottonwood Establishment and Recruitment along the Lower Duncan and Lardeau Rivers
3.5.1 Seedling Abundance During the August field visit the discharge rate was increasing. The increase in stage started just before the field visit on August 3 with a measured discharge of 79.3 m3/s in the morning and was recorded as 133.3 m3/s by the end of the day (midnight). Discharge on August 4th morning started at 133.3 m3/s and was recorded at 229.0 m3/s at end of day. Field work occurred when the discharges for the Duncan River were in the range of 227.9 m3/s to 243.9 m3/s (6:30 pm August 8). Discharge was quite low from July 17 to August 3, fluctuating in the mid-70 m3/s. The low flow resulted in some of the recruitment areas with germinates and seedlings to be under water from higher flows during sampling compared to establishment discharge flows. Following the 2015 field inventories, a total of 402 sampling quadrats along the lower Duncan River had black cottonwood seedlings, established in 2013 to 2015 but mainly in 2015. This was lower than 2014 and higher than in 2013 level (Table 3-5). The total number of germinates (28,027) were higher than previous sampling years (2010, 2012, 2013, 2014) except 2009. However, the distributions over transect lines and segments were different in 2015 compared to 2014. The average number of germinates is 20,540 excluding 2009 (unknown number of willow seedling counted on some lines) and 2012 (almost zero establishment from extreme high water levels during seed release) as they were years with anomalies and/or sampling errors.

March, 2016 Lower Duncan River Riparian Cottonwood Monitoring File: 14.0037.00 DDMMON#8-1 VAST Resource Solutions Inc. BC Hydro
35
Table 3-5: Comparisons of 2012, 2013, 2014 and 2015 numbers of quadrats with seedlings and the total density per transect line of germinants for the corresponding year, along the Duncan River (Tran = Transect, Quad = Quadrats, # Germ = total density of Germinants per transect line).
Duncan Segments
Tran #
2012 2013 2014 2015 # Quad # Germ # Quad # Germ # Quad # Germ # Quad # Germ
D1 T3 8 52 21 857 9 2,786 13 8,026 T4 0 0 0 0 T5 0 0 0 0
D3
T10 0 0 1 2 0 T11 0 54 2,084 67 4,604 9 2 T15 1 1 17 1,075 41 1,639 21 507 T17* 14 851 26 651 24 660 T29* 28 1,267 35 1,551 7 38 T35* 11 1,221 21 982 14 201 T20 0 13 609 12 400 12 160 T23 0 0 0 0 T40* 2 6 8 250 12 183 T45* 17 370 20 465 27 4,347
D4 T3 1 65 64 3,003 62 3,273 51 951
T10* 35 813 42 1,027 45 493 T5 0 0 0 0
D5
T2 0 11 90 9 88 7 59 T9 0 5 571 13 156 9 184
T11 0 22 787 21 740 18 5,893 T12 0 4 8 31 1,395 38 4,006 T16 0 13 260 18 574 4 170 T19 0 3 206 7 268 6 76
D6
T6 0 0 5 696 0 T20* 0 13 83 0 T29 0 0 19 231 20 1,092 T36 0 0 60 758 65 979
Totals 10 118 334 14,078 540 22,619 402 28,027 Note: * indicates new transect lines established 2013.

March, 2016 Lower Duncan River Riparian Cottonwood Monitoring File: 14.0037.00 DDMMON#8-1 VAST Resource Solutions Inc. BC Hydro
36
There was a decrease in the number of quadrats along the Lardeau River with seedlings in 2015 (87) as compared to 2010 (145), 2013 (102), and 2014 (130), but greater than in 2009 (73) and 2012 (42) (Table 3-6). The total germinant counts were lower in 2015 (1,100) compared to all previous sampling years. The average number of germinants (2009 to 2014) for the Lardeau Reach was 5,225. Number of germinates varied by transect line compared to previous years with nine of the ten transect lines having lower counts than in 2013 and 2014. The one transect line with a higher count in 2015 was L2T6 (Table 3-6). Table 3-6: Comparisons of 2012, 2013, 2014 and 2015 numbers of quadrats with
seedlings and the total density per transect line of germinants for the corresponding year, along the Lardeau River (Tran = Transect, Quad = Quadrats, # Germ = total density of Germinants per transect line).
Lardeau Segments
Tran #
2012 2013 2014 2015 # Quad # Germ # Quad # Germ # Quad # Germ # Quad # Germ
L1
T1 7 2,258 13 523 8 238 12 95 T10 18 1,145 20 3,895 20 575 21 292 T20 11 42 19 415 43 1,823 36 339 T36 2 13 17 687 14 670 10 61
L2 T6 1 4 15 31 11 312 7 313
T15 3 12 1 1 4 173 1 0 T18* 13 122 19 648 0 0
L3 T1 0 0 1 1 5 200 0 0 T9 0 0 3 7 6 179 0 0
T30* 0 0 0 0 0 Totals 42 3,474 102 5,682 130 4,818 87 1,100
Note: * indicates new transect lines established 2013.
3.5.2 Seedling densities and survival In 2015, black cottonwood seedling densities (‘densities’ will be used to refer to the germinant densities and does not include 2013 and/or 2014 seedling densities in 2015) along the lower Duncan River were significantly lower than in 2013 and 2014 (P = <0.001 see Appendix 4 for statistical results). The difference in the median value comparisons for 2015 to 2013 and 2014 densities indicated that seedling densities differences were greater than would be expected by chance. Box plot comparisons between densities for 2013, 2014, and 2015 illustrate the magnitude of differences for the Duncan Reach across years when data is paired (Figure 3-9) 2. When densities for each year were compared, the mean is above the box where 25 to 75 per cent of the data occurs. This result indicates the magnitude of the skew is from outliers (Figure 3-9). Figure 3-11 illustrates where the differences occurred per segment and compared to 2013 and 2014. Duncan Segment 1 (D1) had high-density counts in some quadrats, but the median value was 95 which was the same as in 2014. Duncan Segment 1 also had a mean of 675 seedlings per 1 m2 quadrat, while 2014 had a mean of 313 seedling per 1 m2. Duncan Segment 5 (D5) also had an increase seedling densities for total number of seedlings, but did not have as wide of a distribution as in 2014. Duncan Segment 6 (D6)
2 For box plots, the lower boundary of the box indicates the 25th percentile, the black line within the box marks the median, the red line marks the mean and the upper boundary indicates the 75th percentile. Whiskers above and below the box indicate the 90th and 10th percentiles. Outliers are indicated with an open circle.

March, 2016 Lower Duncan River Riparian Cottonwood Monitoring File: 14.0037.00 DDMMON#8-1 VAST Resource Solutions Inc. BC Hydro
37
was similar to 2014, and segments D3 and D4 had reduced seedling counts compared to 2013 and 2014.
Figure 3-9: The 2013, 2014, and 2015 black cottonwood germinant densities paired
between years (zeros when no germinants occurred where they were recorded in one of the other years) for statistical analysis.
Figure 3-10: The 2013, 2014, and 2015 black cottonwood germinant densities for the
Duncan and Lardeau study reaches. Extreme outliers removed (see Figure 3-9).
Ducan Reach by Sampling Year
2013 2014 2015
Seed
ling
Den
sitiy
(#/1
m2 )
0
200
400
600
800
1000
1200
1400
1600
River Reaches
2013 2014 2015 2013 2014 2015
Seed
ling
Den
sity
(#/1
m2 )
0
100
200
300
400
500
600
Duncan Lardeau
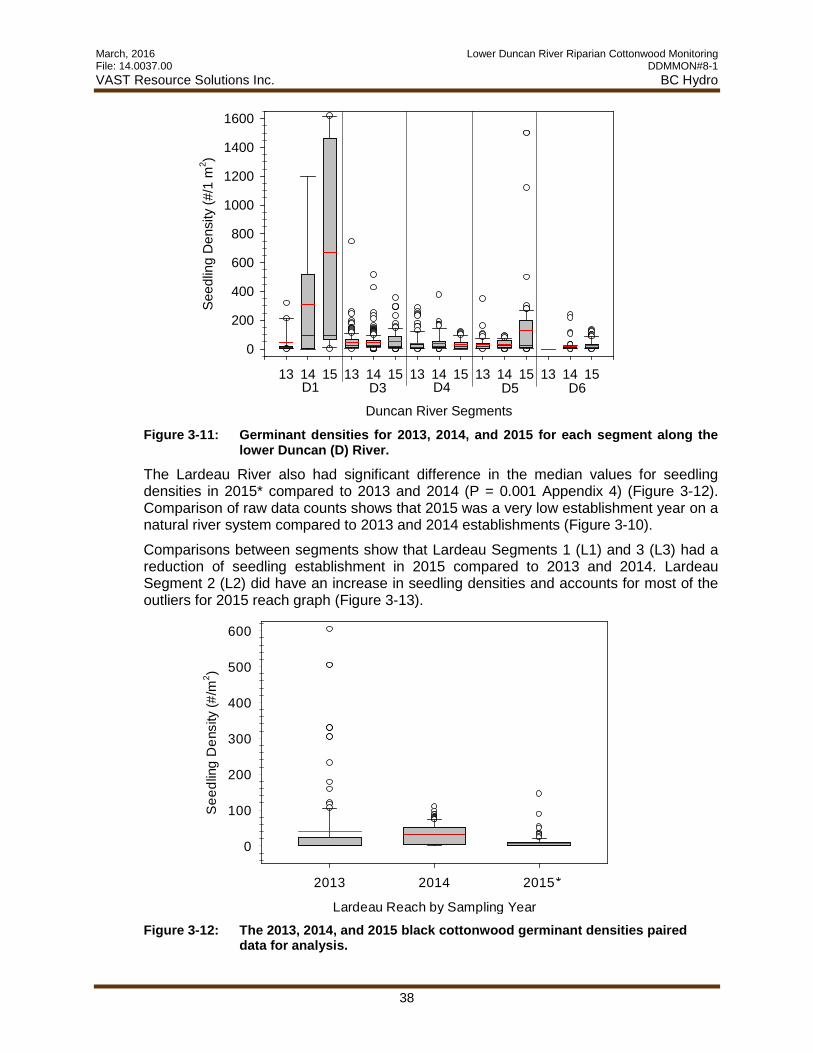
March, 2016 Lower Duncan River Riparian Cottonwood Monitoring File: 14.0037.00 DDMMON#8-1 VAST Resource Solutions Inc. BC Hydro
38
Figure 3-11: Germinant densities for 2013, 2014, and 2015 for each segment along the
lower Duncan (D) River.
The Lardeau River also had significant difference in the median values for seedling densities in 2015* compared to 2013 and 2014 (P = 0.001 Appendix 4) (Figure 3-12). Comparison of raw data counts shows that 2015 was a very low establishment year on a natural river system compared to 2013 and 2014 establishments (Figure 3-10). Comparisons between segments show that Lardeau Segments 1 (L1) and 3 (L3) had a reduction of seedling establishment in 2015 compared to 2013 and 2014. Lardeau Segment 2 (L2) did have an increase in seedling densities and accounts for most of the outliers for 2015 reach graph (Figure 3-13).
Figure 3-12: The 2013, 2014, and 2015 black cottonwood germinant densities paired
data for analysis.
13 14 15 13 14 15 13 14 15 13 14 15 13 14 15
Seed
ling
Den
sity
(#/1
m2 )
0
200
400
600
800
1000
1200
1400
1600
D3 D4 D5 D6D1
Duncan River Segments
Lardeau Reach by Sampling Year
2013 2014 2015
See
dlin
g D
ensi
ty (#
/m2 )
0
100
200
300
400
500
600
*

March, 2016 Lower Duncan River Riparian Cottonwood Monitoring File: 14.0037.00 DDMMON#8-1 VAST Resource Solutions Inc. BC Hydro
39
Figure 3-13: Seedling establishment densities (germinants) for 2013, 2014, and
2015 for each segment along the Lardeau (L) River.
3.5.3 Seedlings, establishment to recruitment of 2013 seedlings In 2015, seedlings were monitored that had established in 2013, 2014, and 2015. Substantial decreases in seedling density by the end of the first growing season are typical for cottonwood survival through the first season (Bradley and Smith 1986, Polzin 1998, Rood et al. 2007). The average survival rates for seedlings in their third growing season are usually the highest (Polzin and Rood 2013). The surviving seedlings established in 2013 are considered recruited by the fall of 2015. The survival rates for the 2015 seedlings (germinants) were similar for the Duncan and the Lardeau reaches with 24.7 per cent and 25.9 per cent respectively (Figure 3-14Figure 3-14, 2015 bars). The 2015 survival rate was slightly above the average since 2009 for the Duncan Reach and slightly below the average for the Lardeau Reach (Figure 3-14). The 2014 (year of establishment) seedlings had similar survival rates for both reaches. However, the Duncan 2013 survival rates were significantly lower compared to the Lardeau (P = 0.001 Appendix 4).
13 14 15 13 14 15 13 14 15
Seed
ling
Den
sity
(#/1
m2 )
0
100
200
300
400
500
600
L1 L2 L3Lardeau River Segments

March, 2016 Lower Duncan River Riparian Cottonwood Monitoring File: 14.0037.00 DDMMON#8-1 VAST Resource Solutions Inc. BC Hydro
40
Figure 3-14: Mean (± s.e.) survival percentages for 2013 (3rd year survival), 2014 (2nd year
survival), and 2015 (1st year survival), 2013, 2014, and 2015 seedlings monitored in the fall of 2015.
Seedlings established in 2013 along the Duncan reach had an increase in the survival rate during the first summer (germinants in 2013) compared to the average (all first year survival rate since the start of project in 2009) (Table 3-7). This trend continued with a slight increase compared to the average for the second year of survival of 2013 seedlings. But the third year of survival which is typically the highest survival rate was reduced by 64 per cent. These results contrasted with the free-flowing Lardeau reach which experienced a decrease in survival for the first, second, and third year. However, the decreases were at a smaller magnitude with a 12 per cent decrease from the first year average survival rate, 27 and 26.5 per cent decreases for the second and third year survival rates respectively compared to the average survival rates for these years. Table 3-7: Comparison of the 2013 established seedling for the 1st, 2nd, and 3rd year
survival and the average seedling survival for the Duncan and Lardeau rivers
3.6 Riparian Vegetation Vegetation cover (per cent) for the Duncan reach was similar between 2012 and 2015 for each sampling quadrat size (herb 1 m2, shrub 8 m2, and tree 50 m2) with no significant differences when comparing 2012 to 2015 (Figure 3-15). There was also no significant difference between years for species richness occurring within quadrats. Richness within each size of quadrat was very similar between 2012 and 2015 (Figure 3-16).
Survival Year
Duncan Reach for 2013 Established Seedlings
Lardeau Reach for 2013 Established Seedlings
Average Survival (%)
2013 Seedlings
Average Survival (%)
2013 Seedlings
1st Year Survival 22.2 40.3 31.0 27.3 2nd Year Survival 40.7 43.4 48.6 35.5 3rd Year Survival 61.8 22.3 59.7 43.9

March, 2016 Lower Duncan River Riparian Cottonwood Monitoring File: 14.0037.00 DDMMON#8-1 VAST Resource Solutions Inc. BC Hydro
41
Figure 3-15: Vegetation per cent cover for the Duncan River by quadrat size comparing
2012 versus 2015. Vegetation cover can be greater than 100 per cent when multiple layers of vegetation occur.
Figure 3-16: Species richness (number of species) for the Duncan River by quadrat size
for 2012 versus 2015.
The Lardeau reach results were similar between 2012 and 2015 for vegetation cover compared to the Duncan reach. There was an increase in the mean vegetation cover for the shrub size quadrats while the Duncan reach had a slight decrease. The Lardeau reach has always had more willow along transect lines compared to the Duncan since the study began. This increase in willow cover reflects the growth of willows during the study.
Duncan River Reach (Quadrats)
Herb Herb Shrub Shrub Tree Tree
Veg
etat
ion
Cov
er (%
)
0
50
100
150
200
250
2012 2015 2012 2015 2012 2015
Duncan River Reach (Quadrats)
Herb Herb Shrub Shrub Tree Tree
Spe
cies
Ric
hnes
s (#
)
0
2
4
6
8
10
2012 2015 2012 2015 2012 2015

March, 2016 Lower Duncan River Riparian Cottonwood Monitoring File: 14.0037.00 DDMMON#8-1 VAST Resource Solutions Inc. BC Hydro
42
Species richness data revealed a decrease between 2012 and 2015 monitoring years for species richness by quadrat. Species richness within the herb plots was significantly reduced in 2015 compared to 2012 (P < 0.001 Appendix 4). This was also true for the shrub quadrats, but not as large of a decrease (P = 0.002) (Appendix 4). The tree quadrat results were similar with no significant difference.
Figure 3-17: Vegetation per cent cover for the Lardeau Reach for each quadrat size,
comparing 2012 versus 2015.
Figure 3-18: Species richness (number of species) for the Lardeau Reach by quadrat size
for 2012 versus 2015.
Lardeau River Reach (Quadrats)
Herb Herb Shrub Shrub Tree Tree
Veg
etat
ion
Cov
er (%
)
0
20
40
60
80
100
120
140
160
180
2012 2015 2012 2015 2012 2015
Lardeau River Reach (Quadrats)
Herb Herb Shrub Shrub Tree Tree
Spe
cies
Ric
hnes
s (#
)
0
2
4
6
8
10
12
2012 2015 2012 2015 2012 2015
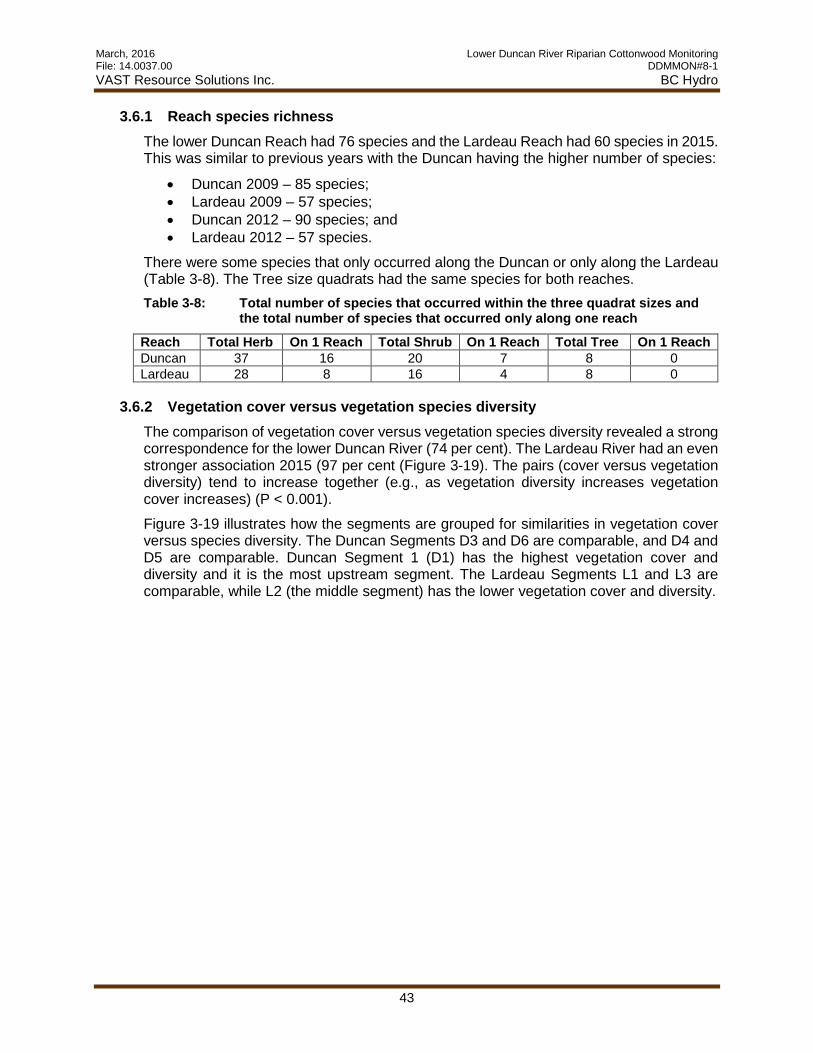
March, 2016 Lower Duncan River Riparian Cottonwood Monitoring File: 14.0037.00 DDMMON#8-1 VAST Resource Solutions Inc. BC Hydro
43
3.6.1 Reach species richness The lower Duncan Reach had 76 species and the Lardeau Reach had 60 species in 2015. This was similar to previous years with the Duncan having the higher number of species:
• Duncan 2009 – 85 species; • Lardeau 2009 – 57 species; • Duncan 2012 – 90 species; and • Lardeau 2012 – 57 species.
There were some species that only occurred along the Duncan or only along the Lardeau (Table 3-8). The Tree size quadrats had the same species for both reaches. Table 3-8: Total number of species that occurred within the three quadrat sizes and
the total number of species that occurred only along one reach Reach Total Herb On 1 Reach Total Shrub On 1 Reach Total Tree On 1 Reach Duncan 37 16 20 7 8 0 Lardeau 28 8 16 4 8 0
3.6.2 Vegetation cover versus vegetation species diversity The comparison of vegetation cover versus vegetation species diversity revealed a strong correspondence for the lower Duncan River (74 per cent). The Lardeau River had an even stronger association 2015 (97 per cent (Figure 3-19). The pairs (cover versus vegetation diversity) tend to increase together (e.g., as vegetation diversity increases vegetation cover increases) (P < 0.001). Figure 3-19 illustrates how the segments are grouped for similarities in vegetation cover versus species diversity. The Duncan Segments D3 and D6 are comparable, and D4 and D5 are comparable. Duncan Segment 1 (D1) has the highest vegetation cover and diversity and it is the most upstream segment. The Lardeau Segments L1 and L3 are comparable, while L2 (the middle segment) has the lower vegetation cover and diversity.

March, 2016 Lower Duncan River Riparian Cottonwood Monitoring File: 14.0037.00 DDMMON#8-1 VAST Resource Solutions Inc. BC Hydro
44
Figure 3-19: Mean (± s.e.) vegetation cover versus mean (± s.e.) species diversity for
transects along the lower Duncan (D, top) and the Lardeau (L, bottom) rivers. Linear regression displays the relationship between cover and diversity for each river.
3.7 Riparian Community Monitoring Twelve plant community types were delineated in 2015 (Table 2-2). Community change was recorded by area (ha) for each polygon and compared by segments for the Duncan and Lardeau reaches. The data summaries of the mapped vegetation communities using the orthorectified aerial photographs are listed in Table 3-9. The total area for each community type (1 to 12) and the active channel (0) for 2009 and 2012 are listed on the row below the totals for 2015 for comparison.
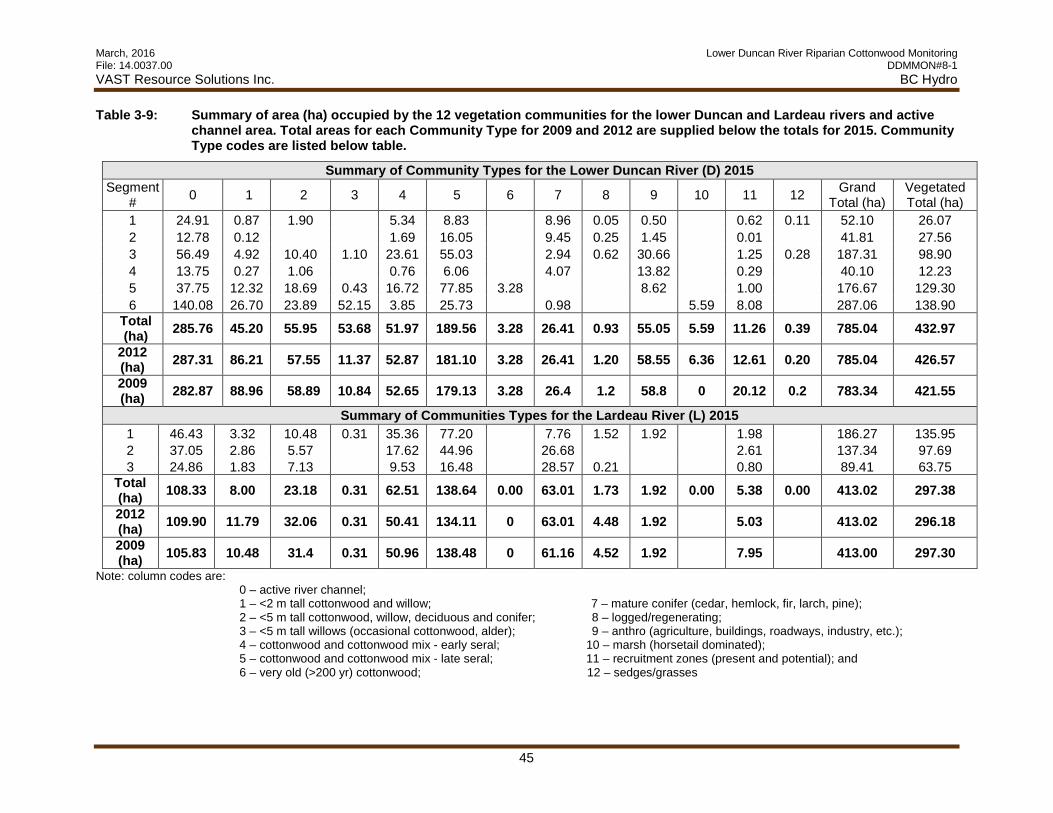
March, 2016 Lower Duncan River Riparian Cottonwood Monitoring File: 14.0037.00 DDMMON#8-1 VAST Resource Solutions Inc. BC Hydro
45
Table 3-9: Summary of area (ha) occupied by the 12 vegetation communities for the lower Duncan and Lardeau rivers and active channel area. Total areas for each Community Type for 2009 and 2012 are supplied below the totals for 2015. Community Type codes are listed below table.
Summary of Community Types for the Lower Duncan River (D) 2015 Segment
# 0 1 2 3 4 5 6 7 8 9 10 11 12 Grand Total (ha)
Vegetated Total (ha)
1 24.91 0.87 1.90 5.34 8.83 8.96 0.05 0.50 0.62 0.11 52.10 26.07 2 12.78 0.12 1.69 16.05 9.45 0.25 1.45 0.01 41.81 27.56 3 56.49 4.92 10.40 1.10 23.61 55.03 2.94 0.62 30.66 1.25 0.28 187.31 98.90 4 13.75 0.27 1.06 0.76 6.06 4.07 13.82 0.29 40.10 12.23 5 37.75 12.32 18.69 0.43 16.72 77.85 3.28 8.62 1.00 176.67 129.30 6 140.08 26.70 23.89 52.15 3.85 25.73 0.98 5.59 8.08 287.06 138.90
Total (ha) 285.76 45.20 55.95 53.68 51.97 189.56 3.28 26.41 0.93 55.05 5.59 11.26 0.39 785.04 432.97
2012 (ha) 287.31 86.21 57.55 11.37 52.87 181.10 3.28 26.41 1.20 58.55 6.36 12.61 0.20 785.04 426.57 2009 (ha) 282.87 88.96 58.89 10.84 52.65 179.13 3.28 26.4 1.2 58.8 0 20.12 0.2 783.34 421.55
Summary of Communities Types for the Lardeau River (L) 2015 1 46.43 3.32 10.48 0.31 35.36 77.20 7.76 1.52 1.92 1.98 186.27 135.95 2 37.05 2.86 5.57 17.62 44.96 26.68 2.61 137.34 97.69 3 24.86 1.83 7.13 9.53 16.48 28.57 0.21 0.80 89.41 63.75
Total (ha) 108.33 8.00 23.18 0.31 62.51 138.64 0.00 63.01 1.73 1.92 0.00 5.38 0.00 413.02 297.38 2012 (ha) 109.90 11.79 32.06 0.31 50.41 134.11 0 63.01 4.48 1.92 5.03 413.02 296.18 2009 (ha) 105.83 10.48 31.4 0.31 50.96 138.48 0 61.16 4.52 1.92 7.95 413.00 297.30
Note: column codes are: 0 – active river channel; 1 – <2 m tall cottonwood and willow; 7 – mature conifer (cedar, hemlock, fir, larch, pine); 2 – <5 m tall cottonwood, willow, deciduous and conifer; 8 – logged/regenerating; 3 – <5 m tall willows (occasional cottonwood, alder); 9 – anthro (agriculture, buildings, roadways, industry, etc.); 4 – cottonwood and cottonwood mix - early seral; 10 – marsh (horsetail dominated); 5 – cottonwood and cottonwood mix - late seral; 11 – recruitment zones (present and potential); and 6 – very old (>200 yr) cottonwood; 12 – sedges/grasses

March, 2016 Lower Duncan River Riparian Cottonwood Monitoring File: 14.0037.00 DDMMON#8-1 VAST Resource Solutions Inc. BC Hydro
46
There were no significant differences for the vegetated area and active channel area for the lower Duncan or the Lardeau rivers since 2009 (Figure 3-20). The Duncan reach has been experiencing a slight increase in vegetated area since 2009 (11.4 ha). The active channel area had a slight increase in area in 2012 compared to 2009 (4.4 ha) and a slight decrease in area for 2015 from 2012 level (1.6 ha). There were no significant changes in total area for each vegetation type in comparison to 2009 and 2012 (Figure 3-21). However, there was variation within segments (Figure 3-22) and across the years. Duncan Segment 6 apparently had the largest variations across years but these were modest and not significantly different.
Figure 3-20: Total vegetated and active channel areas (ha) for the Duncan and Lardeau
reaches in 2009, 2012, and 2015.
Figure 3-21: Vegetation type total areas (ha) for the Duncan River for 2009, 2012, and 2015.

March, 2016 Lower Duncan River Riparian Cottonwood Monitoring File: 14.0037.00 DDMMON#8-1 VAST Resource Solutions Inc. BC Hydro
47
Figure 3-22: Community Type areas (ha) along the Duncan River for each segment for
2015.
Figure 3-23: Community Type areas (ha) along the Duncan River for Segment 6 for 2009,
2012, and 2015. There was one notable erosion event along the Duncan reach since 2012. Hamill Creek experienced an extreme flash flood event in the spring of 2013. This resulted in Duncan Segment 4 point bar to experience extensive erosion and deposition which was captured in 2013 through re-surveying of the transect line profiles (Transects 3 and 10). The mapping analysis component in 2015 allowed the visualization of the extent of scour that can happen at a tributary confluence. Figure 3-24 has the 2012 active channel delineation on the 2015 map to help illustrate the extent of the scour that occurred. The bottom left hand side of the photo shows the property which is part of a closed saw mill. The area scoured away was an old garbage pile from when the mill was active. The resulting scour distributed garbage from the old pile downstream to Kootenay Lake with deposits at a

March, 2016 Lower Duncan River Riparian Cottonwood Monitoring File: 14.0037.00 DDMMON#8-1 VAST Resource Solutions Inc. BC Hydro
48
number of meander lobes especially in the Duncan Segment 6 area including along the north-shore end of Kootenay Lake near D6T6.
Figure 3-24: Air photos of Duncan Segment 4, Hamill Creek area in October 2012 (A) and
the same area in September 2015 (B). The active channel delineation is for 2012.
The Lardeau reach experienced a very slight decrease in vegetated area in 2012 (1 1 ha) which returned to the 2009 total area (297.30 ha) in 2015 (297.38 ha) (Figure 3-20). The active channel had slightly increased in 2012 (4.1 ha) and further decreased from the 2012 area in 2015 (decreased by 1.6 ha). This was similar to that of the Duncan reach. Vegetation community types varied between segments in 2015 (Figure 3-25) but there was no significant difference in the variation between segment since 2009. The total area for each community type showed modest change since 2009 along the Lardeau reach and not significantly different (Figure 3-26).
A
2012
B
2015

March, 2016 Lower Duncan River Riparian Cottonwood Monitoring File: 14.0037.00 DDMMON#8-1 VAST Resource Solutions Inc. BC Hydro
49
Figure 3-25: Community Type areas (ha) along the Lardeau River for each segment in
2015.
Figure 3-26: Vegetation type total areas for the Lardeau River for 2009, 2012, and 2015.
4 DISCUSSION This study is focussed on the long-term investigation of the riparian vegetation and black cottonwood recruitment trends in response to Alt S73. This report summarizes the 2015 results and compares these with previous years’ patterns.
4.1 Field monitoring of riparian vegetation and black cottonwood recruitment The cottonwood phenological developmental stages occurred earlier in 2015 than in the previous study years. Similarly earlier development was observed in herbaceous plants and for leaf emergence for other woody species in 2015. There was a pattern of seed release following rain events in 2015 in the Lardeau-Duncan cottonwoods, which has been

March, 2016 Lower Duncan River Riparian Cottonwood Monitoring File: 14.0037.00 DDMMON#8-1 VAST Resource Solutions Inc. BC Hydro
50
previously observed in several previous years (Polzin et al. 2015). Herbison et al. (2015) concluded that rain may promote seed release from black cottonwoods in this humid, temperate-climate mountain ecoregion. The main seed release period started June 7 and continued through June to mid-July. During this time, there was a rapid stage decline along the Duncan River and subsequent low stage during the seed release interval. However, along the Lardeau River the peak stage (June 9) was followed by a very gradual decline of the stage during seed release. The earlier than average seed release resulted in slightly above average establishment along the Duncan reach, but significantly lower establishment levels for the Lardeau reach. The Lardeau reach had decreased establishment levels compared to the average for the reach which may have been due to the discharge levels which were high during the first seed release event and the river stage may have been too high for some recruitment zones even by the second seed release event. There was thus a reduction in the available recruitment zones due to inundation thereby reducing establishment levels. Survival of seedlings was comparable for both reaches in both the first and second year of establishment. However, the third year survival was significantly lower for the Duncan as compared to the Lardeau reach. The summer of 2015 was not as dry as 2014, but did have below average precipitation during the growing season. The low precipitation level of 2014 was apparently offset by the artificially higher river stage during the summer along the Duncan reach (Polzin et al. 2015). This did not occur in 2015, with a low stage averaging about 2.0 m for middle to the end of June and 1.6 m for July. Along these rivers and through the seedling recruitment zones, groundwater levels are equivalent to the river stages along the point and mid-channel bars and even the high terraces adjacent to the river (Polzin et al. 2010 and 2011 and Polzin and Rood 2014). This means that the groundwater level was equal to the stage levels and the elongating seedling roots would need to track these changes, although the capillary fringe, especially in zones with extensive sands would provide some attenuation. After establishment, the 2013 seedlings had two growing seasons with high flow stages along the Duncan reach. In 2013, the total precipitation was double that of 2014 and 2015, and this probably resulted in the high survival rate for the 2013 establishment season. The high river stage and correspondingly high water table in 2014 and 2015 would not have encouraged roots to grow deeply downward. As a result, in 2015 when stage was reduced in June by 0.5 m in five days and by 1.0 m for July, the root zone would have dried and drought mortality would have been increased. The survival may have been even further limited due to the hot and relatively dry weather during the growing season of 2015. This was indicated by the reduced survival rate for the three year old seedlings along the Lardeau reach. However, the Lardeau had a 26 per cent decrease compared to the average third year survival rate, while the Duncan reach had a 64 per cent reduction in survival compared to the average third year survival rate. Riparian vegetation monitoring observations did not indicate substantial changes in composition or health of the overall riparian vegetation. As expected, there was growth of shrub species with shrub species seedlings growing from herb size into shrub size (>0.5 m tall). Many bands of shrub sized plants grew to over 2 m tall and had thus reached tree size. These patterns were similar for both the Lardeau and lower Duncan River reaches. No evidence of extensive drought stress occurred along the Duncan reach within the established riparian vegetation communities.

March, 2016 Lower Duncan River Riparian Cottonwood Monitoring File: 14.0037.00 DDMMON#8-1 VAST Resource Solutions Inc. BC Hydro
51
4.2 Riparian Community Monitoring (Aerial Photography) The lower Duncan and Lardeau rivers exhibited similar changes in land and channel areas from 2012 to 2015. There was a reduction in area for Community Type 1 (cottonwood, willow, etc. < 2 m tall). This was the result from growth (succession) of the established woody vegetation into Community Type 3 (woody vegetation < 5 m tall). The increase was also attributed to growth from vegetation in the early seral type (Type 5) into the late seral type (Type 6). There was some expansion of the sedge community (Type 12) from 0.2 ha to 0.4 ha. The decrease in marsh land was attributed to dry summers that occurred in 2014 and 2015. The areas may have been above average in 2012 because of the rainy summer and high Duncan River stage.
5 CONCLUSIONS The data collection for DDMMON#8-1 study Year 6 data extended from August to October 2015. The purpose of study Year 6 was to investigate the effects of the implementation of the Alt S73 flow regime on riparian vegetation with respect to the following attributes:
• Percent of vegetation cover; • Species richness (number of plant species); • The expansion or reduction in vegetated area; • The extent of cottonwood seedling establishment; • The level of cottonwood seedling survival and recruitment; and • The change in area covered by different vegetation communities along the Duncan
and Lardeau River reaches. The results in this report document changes to riparian vegetation and communities since 2012, and impacts on cottonwood establishment and recruitment since 2013 along the lower Duncan River and the reference reach, the Lardeau River. No major changes were detected for vegetation cover or the number of species for the riparian vegetation in 2015, when compared to 2012 for the Duncan reach. Both the lower Duncan and Lardeau River reaches experienced increases in heights of woody species. Some previously open areas had become more shrub-covered, and woody species less than 2 m tall in 2012 had grown to exceed 2 m in height in some study areas. The lower Duncan reach data demonstrate a decrease in the number of plant species since 2009 while the Lardeau reach experienced a slight increase, but overall, species richness has been relatively constant since 2009. Establishment densities for new 2015 cottonwood seedlings were above the prior year average along the Duncan River, but significantly lower along the Lardeau River. The lower Duncan River peak discharge during the growing season (peak discharge for the year occurs during the winter) occurred in August, with the lowest discharge during July. The Lardeau River experienced a flow peak approaching the Qmax2 (a 1-in-2 year peak) during the growing season (June 9) but below average discharges occurred during August. These two very different growing season flows resulted in low initial seedling establishment along the Lardeau River and reduced survival of third year seedlings along both reaches but the Duncan reach experienced the largest decrease in third year seedling survival.

March, 2016 Lower Duncan River Riparian Cottonwood Monitoring File: 14.0037.00 DDMMON#8-1 VAST Resource Solutions Inc. BC Hydro
52
Results from comparative analyses for 2013, 2014, and 2015 indicated that sediment deposition and erosion, inundation duration and timing, and establishment elevation are key factors for assessing the performance of Alt S73 on black cottonwoods along the lower Duncan River. The findings in 2015 support previous results of key factors and the drivers affecting cottonwood recruitment. Continued monitoring of annual cottonwood recruitment, riparian vegetation, and vegetation communities over the next few years will be important to complete the decade interval analyses in 2018. The results of those analyses will then be used to assess the three hypotheses, and subsequently to address the objectives and the two key management questions outlined in Section 1 (taken from the BC Hydro TOR 2009). In conclusion, the study Year 6 results largely extended and confirmed the patterns observed in previous years. The consistency of cottonwood seedling recruitment distributions supports a deterministic pattern, whereby establishment and survival follow from particular physical conditions and seasonal timing.
6 RECOMMENDATIONS
6.1 Pre-Alt S73 Cottonwood Establishment VAST recommends cottonwood tree core sampling be implemented at the meander lobes where established transect lines occur along the Duncan River. This additional sampling would supplement the 300 trees that were already sampled at the start of the study (2009, 2010, and 2013). The core sampling is recommended since the initial tree sampling was not structured to adequately address recruitment prior the implementation of Alt S73. The existing information (300 cores) can be added to the new sampling design, but not all previously sampled trees were located at meander lobes with study transect lines, and many of the trees sampled had been established before the installation of the Duncan Dam. The new tree core sampling design should reveal the years when successful recruitment occurred, after the dam installation but before the Alt S73 flow regime was initiated. The resulting data should reveal successful seedling recruitment years, discharge levels associated with successful recruitment, and the estimated densities of successful recruitment prior to Alt S73. Collection of this information will particularly allow for a more accurate analysis to address H01: There is no change in black cottonwood establishment or survival resulting from the implementation of Alt S73.

March, 2016 Lower Duncan River Riparian Cottonwood Monitoring File: 14.0037.00 DDMMON#8-1 VAST Resource Solutions Inc. BC Hydro
53
7 CLOSURE VAST Resource Solutions Inc., trusts that this report satisfied your present requirements. Should you have any comments, please contact us at your convenience. Vast Resource Solutions Inc., Prepared by: Mary Louise Polzin, PhD, RPBio Senior Biologist/Riparian Specialist,
Stewart Rood, PhD Professor and Board of Governors Research Chair in Environmental Science, Reviewed by:
Claire Crowley, M.Sc. Candidate Intermediate Resource Technician

March, 2016 Lower Duncan River Riparian Cottonwood Monitoring File: 14.0037.00 DDMMON#8-1 VAST Resource Solutions Inc. BC Hydro
54
8 REFERENCES British Columbia Hydro and Power Authority. (TOR) 2009. Contract Number Q9-9070,
Advertisement for Request for Proposals for projects DDMMON#8-1 and 8-2, Duncan Watershed Riparian Monitoring Program. pp. 94.
Braatne J.H., S.B. Rood, and P.E. Heilman. 1996. Life history, ecology and conservation of riparian cottonwoods in North America, Biology of Populus and its implications for management and conservation, R.F Stettler, H.D. Bradshaw, Jr., P.E. Heilman, and T.M. Hinckley (eds). NRC Research Press, National Research Council of Canada, Ottawa, On, Canada. Pp. 57-85.
Braatne, J.H., S.B. Rood, L.A. Goater, and C.L. Blair. 2008. Analyzing the impacts of dams on riparian ecosystems: a review of research strategies and their relevance to the Snake River through Hells Canyon. Environmental Management 41: 267-281.
Debano, L.F. and L.J. Schmidt. 1990. Potential for enhancing riparian habitat in the southwestern United States with watershed practices, Forest Ecology and Management, 33: 385-403.
Dunne, T. 1988. Geomorphological contributions to flood-control planning, Flood Geomorphology, V.R. Baler, R.C. Kochel, and P.C. Patton, (eds). John Wiley & Sons, New York. Pp. 421-437.
Government of Canada, Environment Canada, Pacific and Yukon Region, Environment Canada, Hydrometric Archive for British Columbia and Yukon, 2010. Vancouver, British Columbia, Canada Government of Canada, Environment Canada. Data set accessed 2012- multiple times during the year at http://www.wateroffice.ec.gc.ca/index_e.html.
Herbison, B., M.L. Polzin, and S.B. Rood. 2015. Hydration as a possible colonization cue: Rain may promote seed release from black cottonwood trees. Forest Ecology and Management 350: 22-29.
Karrenberg, S., P.J. Edwards, and J. Kollman. 2002. The life history of Salicaceae living in the active zone of floodplains. Freshwater Biology 47: 733-748.
Leopold L. B., and M. G. Wolman. 1957. River channel patterns: Braided, meandering, and straight. US Geological Survey Professional Paper 282-B: 39-85.
Mahoney, J.M. and S.B. Rood. 1998. Stream flow requirements for cottonwood seedling recruitment – an integrative model. Wetlands 18: 634-645.
Merritt, D.M. and D.J. Cooper. 2000. Riparian vegetation and channel change in response to river regulation: a comparative study of regulated and unregulated streams in the Green River Basin, USA. Regulated Rivers: Research and Management 16: 543-564.
Miles, M. and Associates. 2002. Channel stability assessment, Lower Duncan River. Report for project 0207 prepared for BC Hydro and Power Authority, Castlegar
Naiman R.J., H. Decamps, and M.E. McClain. 2005. Riparia: Ecology, Conservation and Management of Streamside Communities. Elsevier Academic Press: San Diego. pp. 430.
Polzin, M.L. 1998. River and Riparian Dynamics and Black Cottonwoods in the Kootenay River Basin, British Columbia and Montana. M.Sc. thesis, University of Lethbridge, Alberta, pp. 224.
Polzin M.L. and S.B. Rood. 2000. Effects of damming and flow stabilization on riparian processes and black cottonwoods along the Kootenay River. Rivers 7:221-232.

March, 2016 Lower Duncan River Riparian Cottonwood Monitoring File: 14.0037.00 DDMMON#8-1 VAST Resource Solutions Inc. BC Hydro
55
Polzin M.L. and S.B. Rood. 2006. Effective disturbance: seedling safe sites and patch recruitment of riparian cottonwoods after a major flood of a mountain river. Wetlands 26:4:965-980.
Polzin, M.L. 2006. Temporal and spatial patterns of Populus angustifolia along the upper Yellowstone River and clonal recruitment: Extent and requirements. Ph.D. thesis, University of Montana. pp. 125.
Polzin, M.L., B. Herbison, K.M, Gill2, and S.B. Rood2. 2010. DDMMON #8-1 Lower Duncan River Riparian Cottonwood Monitoring Program. Year 1 Annual Report – 2009, Interior Reforestation Co. Ltd., and 2University of Lethbridge, Alberta, Unpublished report by Interior Reforestation Co. Ltd., Cranbrook, B.C., for BC Hydro Generations, Water License Requirements, Castlegar, B.C. 110 pp + appendices.
Polzin, M.L., S.B. Rood2, and B. Herbison. 2011. DDMMON #8-1 Lower Duncan River Riparian Cottonwood Monitoring Program. Year 2 Annual Report – 2010, Interior Reforestation Co. Ltd., and 2University of Lethbridge, Alberta, Report by Interior Reforestation Co. Ltd., Cranbrook, B.C., for BC Hydro Generations, Water License Requirements, Castlegar, B.C. 74 pp + appendices.
Polzin, M.L., and S.B. Rood. 2013. DDMMON #8-1 Lower Duncan River Riparian Cottonwood Monitoring Program. Year 3 Annual Report – 2012. Vast Resource Solutions and University of Lethbridge, Alberta. Unpublished report by Vast Resource Solutions, Cranbrook, B.C., for BC Hydro Generations, Water License Requirements, Castlegar, B.C. 76 pp. + appendices.
Polzin, M.L., and S.B. Rood. 2014. DDMMON #8-1 Lower Duncan River Riparian Cottonwood Monitoring Program. Year 4 Annual Report – 2013. Vast Resource Solutions and University of Lethbridge, Alberta. Unpublished report by Vast Resource Solutions, Cranbrook, B.C., for BC Hydro Generations, Water License Requirements, Castlegar, B.C. 53 pp. + appendices.
Polzin, M.L., B. Herbison and S.B. Rood. 2015. DDMMON #8-1 Lower Duncan River Riparian Cottonwood Monitoring Program. Year 5 Report – 2014. VAST Resource Solutions and University of Lethbridge, Alberta. Unpublished report by VAST Resource Solutions, Cranbrook, B.C., for BC Hydro Generations, Water License Requirements, Castlegar, BC. 48 pp. + Apps.
Rood, S.B. and J.M. Mahoney. 1990. Collapse of riparian poplar forests downstream from dams in western prairies: probable causes and prospects for mitigation. Environmental Management 14: 451-464.
Rood, S.B., and J.M. Mahoney, 1995. Collapse of riparian poplar forests downstream from dams in western prairies: Probable causes and prospects for mitigation, Environmental Management, 14: 451-464.
Rood S.B., K.J. Berg, and D.W. Pearce. 2007. Localized temperature adaptation of cottonwoods from elevational ecoregions in the Rocky Mountains. Trees 21: 171-180.
Scott M.L., G.T. Auble, and J.M. Freidman. 1997. Flood dependency of cottonwood establishment along the Missouri River, Montana, USA. Ecological Applications 7: 677-690.
Schulmm, Stanley. 1981. Evolution and response of the fluvial system, sedimentologic implications. The Society of Economic Paleontologists and Mineralogists Special Publication 31: 19-29.

March, 2016 Lower Duncan River Riparian Cottonwood Monitoring File: 14.0037.00 DDMMON#8-1 VAST Resource Solutions Inc. BC Hydro
56
Williams G.P., and M.G. Wolman. 1984. Downstream effects of dams on alluvial rivers, Geological Survey Professional Paper 1286, United States Government Printing Office, Washington, PP-83

March, 2016 Lower Duncan River Riparian Cottonwood Monitoring File: 14.0037.00 DDMMON#8-1 Vast Resource Solutions Inc. BC Hydro
57
Appendix 1: Plant List

March, 2016 Lower Duncan River Riparian Cottonwood Monitoring File: 14.0037.00 DDMMON#8-1 Vast Resource Solutions Inc. BC Hydro
58
Plant Species List: Scientific Names, Common Names and Species Codes
Vegetation Classes: Vegetation Group: Status: AG Annual Grass UPL Obligate Upland N Native PG Perennial Grass OBL Obligate Riparian E Exotic AH Annual Herb FAC Facultative (NOX) Noxious PH Perennial Herb FACR Facultative Riparian (W) Weed F Fern FACU Facultative Upland WS Woody Shrub (R) Ruderal Location: WT Woody Tree D Duncan L Lardeau
Vegetation Group Descriptions NOL – Upland species that does not occur in wetlands/riparian in another region. It is not on the
national list (NOL). UPL – Obligate upland species that occurs in wetlands in another region (estimated probability
greater than 99%), but almost always occurs under natural conditions in non-riparian/wetlands in the region specified.
OBL – Obligate riparian species that almost always occurs under natural conditions in riparian zones (estimated probability greater than 99%).
FAC – Facultative species that is equally likely to occur in wetlands/riparian or uplands (estimated probability 34% - 66%).
FACR – Facultative riparian species that usually occurs in riparian/wetland habitat (estimated probability 67% - 99%), but is occasionally found in non-riparian/wetland habitat.
FACU – Facultative upland species that usually occurs in uplands (estimated probability 67% - 99%), but is occasionally found in wetland/riparian habitats (estimated probability 1% - 33%).
(R) – Ruderal species are first to colonize disturbed lands. Grasses
Species Name Common Name Species Code
Veg Class Status Veg
Group Location
Agrostis gigantea redtop Agro.gig PG E FAC (R) L, D Agrostis scabra hair bentgrass Agro.sca PG N FAC L Calamsgrotis canadensis blue-joint Cala.can PG N FACR L, D
Cinna latifolia nodding wood-reed Cinn.lat PG N FACR (R) L, D Elymus glaucus blue wildrye Elym.gla PG N FACU L, D Festuca campestris rough fescue Fest.cam PG N FAC L, D Festuca rubra red fescue Fest.rub PG N UPL D Hierochloe odorata common sweetgrass Hier.odo PG N OBL L, D Phalaris arundinacea reed-canary grass Phal.aru PG N (W) FACR D Phleum pratense timothy Phle.pra PG E FAC (R) D Poa pratensis Kentucky bluegrass Poa.pra PG E FAC D Poa spp. bluegrass spp. Poa.spp PG N FACU L, D

March, 2016 Lower Duncan River Riparian Cottonwood Monitoring File: 14.0037.00 DDMMON#8-1 Vast Resource Solutions Inc. BC Hydro
59
Herbaceous Species Name Common Name Species
Code Veg Class Status Veg
Group Location
Achillea millefolium yarrow Achi.mil PH N (W) FACU D Actaea rubra baneberry Acta.rub PH N FACR L Aralia nudicaulis wild sarsaparilla Aral.nud PH N FACU L, D Artemisia frigida tarragon Arte.fri PH N UPL D Aster ciliolatus Lindley’s aster Aste.cil PH N NOL L, D Aster conspicuus showy aster Aste.con PH N NOL L, D Carex aperta Columbian sedge Care.ape PH N FACR L, D Carex aquatilis water sedge Care.aqu PH N OBL D Carex crawfordii Crawford’s sedge Care.cra PH N FAC D Carex utriculata beaked sedge Care.utr PH N OBL L, D
Carex athrostachya slender-beaked sedge Care.ath PH N FAC D
Carex deweyana dewey's sedge Care.dew PH N FAC D Carex phaeocephala dunhead sedge Care.pha PH N FAC D
Castilleja miniata common red paintbrush Cast.min PH N FAC L
Centaurea maculosa spotted knapweed Cent.mac PH E (NOX) UPL (R) D
Chrysanthemum leucanthemum oxeye daisy Chry.leu PH E (W) NOL (R) L, D
Cirsium arvense Canada thistle Cirs.arv PH E (NOX) FAC D
Dryas drummondii yellow mountain avens Drya.dru PH N FACU D
Epilobium angustifolium fireweed Epil.ang PH N (W) FACU D
Equisetum arvense common horsetail Equi.arv PH N (W) FAC L, D Equistetum hyemale scouring-rush Equi.hye PH N FACR L, D Erigeron corymbosus long-leaved daisy Erig.cor D Galium boreale northern bedstraw Gali.bor PH N FACU L, D
Galium triflorum sweet-scented bedstraw Gali.tri PH N FACU L
Geum triflorum Old man's wiskers Geum.tri PH N NOL D Gymnocarpium dryopteris oak fern Gymn.dry F N FACR L
Juncus oxymeris pointed rush Junc.oxy PH N FACR D Juncus balticus baltic rush Junc.bal PH N FACR D Juncus covillei covilles rush Junc.cov PH N FACR D Melilotus alba white sweet-clover Meli.alb AH E (W) NOL L, D Moss (generic) Moss L, D Platanthera dilattata white bog orchid Plat.dil PH N FACR L Prunella vulgaris self-heal Prun.vul PH N FACU L, D Pyrola asarifolia pink wintergreen Pyro.asa PH N FACU L, D Ranunculus acris meadow buttercup Ranu.acr PH E (W) FACR D
Rorippa palustris marsh yellow-cress Rori.pal AH N OBL L

March, 2016 Lower Duncan River Riparian Cottonwood Monitoring File: 14.0037.00 DDMMON#8-1 Vast Resource Solutions Inc. BC Hydro
60
Herbaceous (continued)
Species Name Common Name Species Code
Veg Class Status Veg
Group Location
Scirpus microcarpus small-flowered bulrush Scir.mic PH N OBL L, D
Senecio streptanthifolius
rocky mountain butterweed Sene.str PH N FACU L
Solidago candensis Canada goldenrod Soli.can PH N FACU L, D
Sonchus arvensis perennial sow-thistle Sonc.arv PH E
NOX FACU L, D
Taraxacum officinale dandelion Tara.off PH E (W) UPL L, D Trifolium pratense red clover Trif.pra PH E (W) FAC L, D Vicia americana American vetch Vici.ame PH N FAC L, D Viola adunca early blue violet Viol.adu PH N FAC L Viola glabella stream violet Viola.gla PH N OBL L, D
Shrubs
Species Name Common Name Species Code
Veg Class Status Veg
Group Location
Acer glabrum Douglas maple Acer.gla WS N FACU L,D Alnus crispa Sitka alder Alnu.cri WS N FACR D Alnus incana ssp tenuifolia mountain alder Alnu.inc WS N FACR L,D
Amelanchier alnifolia Saskatoon Amel.aln WS N FACU L,D Cornus stolonifera red-osier dogwood Corn.sto WS N FACR L,D Corylus cornuta beaked hazelnut Cory.cor WS N FACU L Lonicera involucrata black twinberry Loni.inv WS N FAC L,D Oplopanax horridus devils club Oplo.hor PH N FAC L,D Rhamnus purshiana cascara Rham.pur WS N FAC L Rosa acicularis prickly rose Rosa.aci WS N FACU D Rosa gymnocarpa baldhip rose Rosa.gym WS N FACU L Rosa woodsii prairie rose Rosa.woo WS N FACU D Rubus idaeus red raspberry Rubu.ida WS N FACU D Rubus parviflorus thimbleberry Rubu.par WS N FAC L,D Salix spp. willow Sali x spp WS N FAC L Salix amygdaloides peachleaf willow Sali.amy WS N FACR L,D Salix bebbiana Bebb’s willow Sali.beb WS N FACR L,D Salix exigua sandbar willow Sali.exi WS N OBL D Salix lucida pacific willow Sali.luc WS N FACR L,D Salix scouleriana Scouler’s willow Sali.sco WS N FAC D Salix sitchensis sitka willow Sali.sit WS N FACR L,D Shepherdia canadensis buffalo berry Shep.can WS N UPL D
Spiraea betulifolia birch-leaved spirea Spir.bet WS N FACU D
Symphoricarpos albus common snowberry Symp.alb WS N FACU L,D

March, 2016 Lower Duncan River Riparian Cottonwood Monitoring File: 14.0037.00 DDMMON#8-1 Vast Resource Solutions Inc. BC Hydro
61
Trees
Species Name Common Name Species Code
Veg Class Status Veg
Group Location
Betula occidentalis water birch Betu.occ WT N FACR L, D Betula papyrifera paper birch Betu.pap WT N FAC L, D Picea glauca x engelmannii
hybrid white spruce Pice.gla x WT N FAC L, D
Pinus monticola western white pine Pinu.mon WT N FACU L, D
Populus trichocarpa black cottonwood Popu.tri WT N FACR L, D Pseudotsuga menziessii var. glauca
interior Douglas fir Pseu.men WT N FACU L, D
Thuja plicata western redcedar Thuj.pli WT N FAC L, D Tsuga heterophylla western hemlock Tsug.het WT N FACU L, D

March, 2016 Lower Duncan River Riparian Cottonwood Monitoring File: 14.0037.00 DDMMON#8-1 VAST Resource Solutions Inc. BC Hydro
62
Appendix 2:Lower Duncan and Lardeau Rivers
Photo Documentation

March, 2016 Lower Duncan River Riparian Cottonwood Monitoring File: 14.0037.00 DDMMON#8-1 VAST Resource Solutions Inc. BC Hydro
63
Date: August, 2015 Environmental Crew: Mary Louise, Ben, Henning, Brenda
Location: Duncan River Project Leader: Mary Louise Polzin
Date Image # Time Description
5-Aug IMG_0030 14:57 D1T3 At EOT looking upstream 5-Aug IMG_0031 14:57 At EOT looking downstream 5-Aug IMG_0032 14:57 At EOT looking up line 5-Aug IMG_0033 14:58 At EOT looking down line 5-Aug IMG_0034 15:57 At 19 m looking at seedlings 5-Aug IMG_0035 15:58 At 19 m looking at seedlings 5-Aug IMG_0036 16:11 At 20 m looking at seedlings 5-Aug IMG_0037 16:17 At 13 m looking up line 5-Aug IMG_0038 16:17 At 13 m looking down line 5-Aug IMG_0039 16:17 At POC looking down line
5-Aug IMG_0014 11:06 D1T4 At EOT looking upstream 5-Aug IMG_0015 11:06 At EOT looking downstream 5-Aug IMG_0016 11:06 At EOT looking up line 5-Aug IMG_0017 11:07 At EOT looking down line 5-Aug IMG_0018 11:14 At POC looking down line 5-Aug IMG_0019 11:15 At 17 m looking up line 5-Aug IMG_0020 11:16 At 17 m looking down line
No seedling plots
5-Aug IMG_0021 12:59 D1T5 At EOT looking upstream 5-Aug IMG_0022 12:59 At EOT looking downstream 5-Aug IMG_0023 12:59 At EOT looking up line 5-Aug IMG_0024 13:00 At EOT looking down line 5-Aug IMG_0025 13:03 At 8 m looking up line 5-Aug IMG_0026 13:03 At 8 m looking down line 5-Aug IMG_0027 13:04 At POC looking down line 5-Aug IMG_0028 13:34 Across at 13 m 5-Aug IMG_0029 13:35 Across at 3 m
8-Aug DSCN_4343 17:53 D3T10 At POC looking down line 8-Aug DSCN_4344 17:54 At 23 m looking down line 8-Aug DSCN_4345 17:54 At 23 m looking up line 8-Aug DSCN_4346 17:54 At EOT looking up line 8-Aug DSCN_4347 17:55 At EOT looking down line 8-Aug DSCN_4348 17:55 At EOT looking upstream 8-Aug DSCN_4349 17:55 At EOT looking downstream 8-Aug DSCN_4350 17:59 Looking at vegetation on firm bank at EOT 8-Aug DSCN_4351 17:59 Looking at vegetation on firm bank at EOT

March, 2016 Lower Duncan River Riparian Cottonwood Monitoring File: 14.0037.00 DDMMON#8-1 VAST Resource Solutions Inc. BC Hydro
64
Date Image # Time Description
5-Aug DSCN_4138 10:55 D3T11 At EOT looking down line 5-Aug DSCN_4139 10:55 At EOT looking up line 5-Aug DSCN_4140 10:55 At EOT looking upstream 5-Aug DSCN_4141 10:56 At EOT looking downstream 5-Aug DSCN_4142 10:58 At 27 m looking at seedling
5-Aug DSCN_4143 10:59 Seedling at 27 m, 8 m downstream of the line (older seedling)
5-Aug DSCN_4144 11:02 At 64 m looking up line 5-Aug DSCN_4145 11:02 At 64 m looking down line 8-Aug DSCN_4339 17:10 At POT looking down line 8-Aug DSCN_4340 17:10 At 17 m looking up line 8-Aug DSCN_4341 17:10 At 17 m looking down line 8-Aug DSCN_4342 17:11 Nice view
8-Aug DSCN_4312 14:19 D3T15 At 15 m looking at POC 8-Aug DSCN_4313 14:22 At 9 m looking down line 8-Aug DSCN_4314 14:25 At 52 m looking up line 8-Aug DSCN_4315 14:25 At 52 m looking down line 8-Aug DSCN_4316 14:27 At 56 m looking at seedling plot 8-Aug DSCN_4317 14:28 At EOT looking down line 8-Aug DSCN_4318 14:28 At EOT looking up line 8-Aug DSCN_4319 14:28 At EOT looking downstream 8-Aug DSCN_4320 14:28 At EOT looking upstream
8-Aug DSCN_4321 15:14 D3T17 At EOT looking down line 8-Aug DSCN_4322 15:15 At EOT looking up line 8-Aug DSCN_4323 15:15 At EOT looking downstream 8-Aug DSCN_4324 15:15 At EOT looking upstream 8-Aug DSCN_4325 15:17 At 21 m, ~3 m from line downstream - seedling plot 8-Aug DSCN_4326 15:19 At POC looking down line 8-Aug DSCN_4327 15:19 At 9 m looking up line 8-Aug DSCN_4328 15:20 At 9 m looking downstream 8-Aug DSCN_4329 15:20 At 9 m looking upstream
5-Aug DSCN_4155 14:16 D3T20 At 10 m looking at new POC down line 5-Aug DSCN_4156 15:00 At 30 m looking up line 5-Aug DSCN_4157 15:00 At 30 m looking down line 5-Aug DSCN_4158 15:02 At EOT looking down line and across 5-Aug DSCN_4159 15:02 At EOT looking up line 5-Aug DSCN_4160 15:02 At EOT looking upstream 5-Aug DSCN_4161 15:03 At EOT looking downstream
5-Aug DSCN_4162 15:05 At 37 m looking at seedling on line (old ones, none from 2015)
5-Aug DSCN_4163 15:06 At 37 m looking upstream of line - older cottonwoods

March, 2016 Lower Duncan River Riparian Cottonwood Monitoring File: 14.0037.00 DDMMON#8-1 VAST Resource Solutions Inc. BC Hydro
65
Date Image # Time Description 5-Aug DSCN_4164 16:16 D3T23 At EOT looking down line 5-Aug DSCN_4165 16:16 At EOT looking up line 5-Aug DSCN_4166 16:16 At EOT looking downstream 5-Aug DSCN_4167 16:16 At EOT looking upstream 5-Aug DSCN_4168 16:17 At 16 m looking down line 5-Aug DSCN_4169 16:17 At 16 m looking up line 5-Aug DSCN_4170 16:19 At POC looking down line 5-Aug DSCN_4171 16:20 Wasp nest near POC 5-Aug DSCN_4172 16:21 At 5 m looking down line
5-Aug DSCN_4146 13:01 D3T29 At EOT looking down line and across 5-Aug DSCN_4147 13:01 At EOT looking downstream 5-Aug DSCN_4148 13:01 At EOT looking upstream 5-Aug DSCN_4149 13:01 At EOT looking up line
5-Aug DSCN_4150 13:04 At 54 m looking at recruited cottonwoods with a few 2013 & 2014
5-Aug DSCN_4151 13:05 At 54 m looking at band 5-Aug DSCN_4152 13:07 At 41 m looking down line 5-Aug DSCN_4153 13:07 At 41 m looking up line 5-Aug DSCN_4154 13:09 At POC looking down line
8-Aug DSCN_4330 16:00 D3T35 At EOT looking down line 8-Aug DSCN_4331 16:00 At EOT looking up line 8-Aug DSCN_4332 16:00 At EOT looking downstream 8-Aug DSCN_4333 16:00 At EOT looking upstream 8-Aug DSCN_4334 16:02 At 10 m looking down line 8-Aug DSCN_4335 16:02 At 10 m looking up line 8-Aug DSCN_4336 16:04 At POC looking down line 8-Aug DSCN_4337 16:05 Looking at cottonwood in our tree plot (3 m tall) 8-Aug DSCN_4338 16:07 At 23 m looking at seedling plot
5-Aug DSCN_4182 18:11 D3T40 At 5 m looking down line at POC in tall willows 5-Aug DSCN_4183 18:38 At 9 m looking up line 5-Aug DSCN_4184 18:38 At 9 m looking down line 5-Aug DSCN_4185 18:39 At EOT looking down line (across river) 5-Aug DSCN_4186 18:39 At EOT looking up line 5-Aug DSCN_4187 18:39 At EOT looking upstream 5-Aug DSCN_4188 18:40 At EOT looking downstream 5-Aug DSCN_4189 18:41 At 9 m looking at band of colts upstream 5-Aug DSCN_4190 18:41 At 9 m looking at band of colts downstream

March, 2016 Lower Duncan River Riparian Cottonwood Monitoring File: 14.0037.00 DDMMON#8-1 VAST Resource Solutions Inc. BC Hydro
66
Date Image # Time Description 5-Aug DSCN_4173 17:11 D3T45 At POC looking down line 5-Aug DSCN_4174 18:05 At EOT looking up line 5-Aug DSCN_4175 18:05 At EOT looking down line 5-Aug DSCN_4176 18:05 At EOT looking downstream 5-Aug DSCN_4177 18:05 At EOT looking upstream 5-Aug DSCN_4178 18:07 At 30 m looking up line 5-Aug DSCN_4179 18:07 At 30 m looking down line 5-Aug DSCN_4180 18:10 At 10 m looking at seedlings 5-Aug DSCN_4181 18:11 At 32 m looking at seedlings
6-Aug IMG_0060 14:30 D4T3 At EOT looking upstream 6-Aug IMG_0061 14:30 At EOT looking downstream 6-Aug IMG_0062 14:30 At EOT looking up line 6-Aug IMG_0063 14:31 At EOT looking down line 6-Aug IMG_0064 14:38 At 46 m looking up line 6-Aug IMG_0065 14:38 At 46 m looking down line 6-Aug IMG_0066 14:50 At POC looking down line 6-Aug IMG_0067 15:09 At 77 m looking at seedlings 6-Aug IMG_0068 16:50 At 28 m looking at seedlings
6-Aug IMG_0040 9:25 D4T5 At EOT looking upstream 6-Aug IMG_0041 9:25 At EOT looking downstream 6-Aug IMG_0042 9:26 At EOT looking up line 6-Aug IMG_0043 9:26 At EOT looking down line 6-Aug IMG_0044 9:27 At EOT looking down line 6-Aug IMG_0046 9:31 At 4 m looking down line 6-Aug IMG_0048 9:35 At POC looking down line 6-Aug IMG_0049 9:40 At 4 m looking up line
6-Aug IMG_0069 17:24 D4T10 At EOT looking upstream 6-Aug IMG_0070 17:25 At EOT looking downstream 6-Aug IMG_0071 17:25 At EOT looking up line 6-Aug IMG_0072 17:25 At EOT looking down line 6-Aug IMG_0073 17:27 At 36 m looking up line 6-Aug IMG_0074 17:27 At 36 m looking down line 6-Aug IMG_0075 17:34 At POC looking down line 6-Aug IMG_0076 18:13 At 45 m looking at seedlings 6-Aug IMG_0077 18:40 At 29 m looking at seedlings 6-Aug IMG_0078 18:40 At 29 m looking at seedlings

March, 2016 Lower Duncan River Riparian Cottonwood Monitoring File: 14.0037.00 DDMMON#8-1 VAST Resource Solutions Inc. BC Hydro
67
Date Image # Time Description 7-Aug IMG_0107 18:36 D5T2 at EOT looking upstream 7-Aug IMG_0108 18:36 At EOT looking downstream 7-Aug IMG_0109 18:37 At EOT looking up line 7-Aug IMG_0110 18:37 At EOT looking down line 7-Aug IMG_0111 18:38 At 8.5 m looking up line 7-Aug IMG_0112 18:38 At 8.5 m looking down line 7-Aug IMG_0113 19:13 At 16 m looking at seedlings 7-Aug IMG_0114 19:13 At 17 m looking at clone 7-Aug IMG_0115 19:16 At POC looking down line 7-Aug IMG_0116 19:26 At 16 m looking at herb plot
6-Aug IMG_0050 12:34 D5T9 At 18 m looking at seedlings 6-Aug IMG_0051 12:35 At 18-19 m looking at seedlings 6-Aug IMG_0052 12:37 At 17 m looking at seedlings 6-Aug IMG_0053 12:39 At EOT looking upstream 6-Aug IMG_0054 12:39 At EOT looking downstream 6-Aug IMG_0055 12:40 At EOT looking up line 6-Aug IMG_0056 12:40 At EOT looking down line 6-Aug IMG_0057 12:40 At 12 m looking up line 6-Aug IMG_0058 12:41 At 12 m looking down line 6-Aug IMG_0059 12:42 At POC looking down line
6-Aug DSCN_4191 8:58 D5T11 At POC looking down line 6-Aug DSCN_4192 10:32 At 34 m looking up line (looking at side channel) 6-Aug DSCN_4193 10:34 At 45 m looking down line
6-Aug DSCN_4194 10:35 At 45 m looking at downstream side of line
6-Aug DSCN_4195 10:37 At 53 m looking downstream of line - looking at line and wall of willows
6-Aug DSCN_4196 10:39 At 65 m looking at upstream side; ~1m seedlings (cottonwood and willows)
6-Aug DSCN_4197 10:41 At 65 m looking down line at EOT 6-Aug DSCN_4198 10:41 At EOT looking up line 6-Aug DSCN_4199 10:42 At EOT looking downstream
6-Aug DSCN_4200 11:03 D5T12 At POC looking down line 6-Aug DSCN_4201 12:09 At 51 m looking up line across side channel 6-Aug DSCN_4202 12:12 At 51 m looking down line 6-Aug DSCN_4203 12:12 At 57.6 m looking at seedling in plot frame 6-Aug DSCN_4204 12:15 At 66 m ~2 m downstream of line - seedlings 6-Aug DSCN_4205 12:16 At EOT looking down line 6-Aug DSCN_4206 12:16 At EOT looking up line 6-Aug DSCN_4207 12:16 At EOT looking downstream 6-Aug DSCN_4208 12:17 At EOT looking upstream

March, 2016 Lower Duncan River Riparian Cottonwood Monitoring File: 14.0037.00 DDMMON#8-1 VAST Resource Solutions Inc. BC Hydro
68
Date Image # Time Description 6-Aug DSCN_4209 13:34 D5T16 At EOT looking down line 6-Aug DSCN_4210 13:34 At EOT looking up line 6-Aug DSCN_4211 13:34 At EOT looking upstream 6-Aug DSCN_4212 13:34 At EOT looking downstream 6-Aug DSCN_4213 13:37 At 21 m looking upstream ~5 m looking at line
6-Aug DSCN_4214 13:40 At ~13m - 12m downstream side looking at line on tree plot area
6-Aug DSCN_4215 13:41 Looking at POC from upstream side of line
6-Aug DSCN_4216 13:44 Looking at a patch of small-flower bulrush upstream of line - pink ribbons are on line
6-Aug DSCN_4217 13:46 At river's edge looking into mature cottonwoods (the large one is the tag tree)
6-Aug DSCN_4218 14:42 D5T19 At POC looking down line 6-Aug DSCN_4219 14:45 At EOT looking down line - across river 6-Aug DSCN_4220 14:45 At EOT looking upstream 6-Aug DSCN_4221 14:46 At EOT looking downstream 6-Aug DSCN_4222 14:46 At EOT looking up line 6-Aug DSCN_4223 14:49 Downstream of EOT from water looking at mature forest 6-Aug DSCN_4224 14:51 At 7.4 m herb plot 6-Aug DSCN_4225 14:51 At 6.4 m herb plot
8-Aug DSCN_4294 9:40 D6T6 At POC looking down line 8-Aug DSCN_4295 9:40 At 21 m looking down line 8-Aug DSCN_4296 9:41 At 21 m looking up line 8-Aug DSCN_4297 9:42 At EOT looking down line 8-Aug DSCN_4298 9:42 At EOT looking up line 8-Aug DSCN_4299 9:43 At EOT looking downstream 8-Aug DSCN_4300 9:43 At EOT looking downstream
8-Aug DSCN_4301 9:51 Looking at cottonwood recruitment on beach 30 m upstream of line
8-Aug DSCN_4302 9:51 Looking at cottonwood recruitment on beach 30 m upstream of line
8-Aug DSCN_4303 11:01 D6T20 At POC looking down line 8-Aug DSCN_4304 11:01 At 18 m looking down line 8-Aug DSCN_4305 11:02 At 18 m looking up line 8-Aug DSCN_4306 11:02 At EOT looking up line 8-Aug DSCN_4307 11:02 At EOT looking down line 8-Aug DSCN_4308 11:02 At EOT looking upstream 8-Aug DSCN_4309 11:02 At EOT looking downstream 8-Aug DSCN_4310 11:07 Looking at cottonwood recruitment 20 m upstream of line 8-Aug DSCN_4311 11:07 Looking at cottonwood recruitment 20 m upstream of line
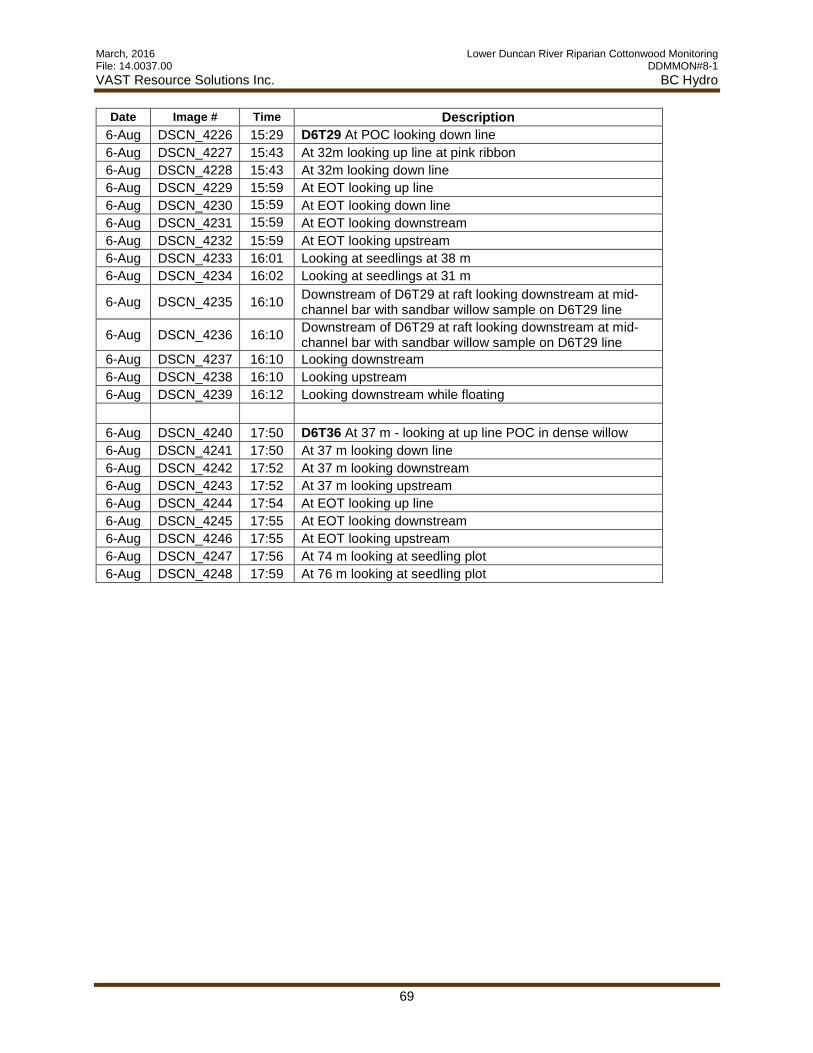
March, 2016 Lower Duncan River Riparian Cottonwood Monitoring File: 14.0037.00 DDMMON#8-1 VAST Resource Solutions Inc. BC Hydro
69
Date Image # Time Description 6-Aug DSCN_4226 15:29 D6T29 At POC looking down line 6-Aug DSCN_4227 15:43 At 32m looking up line at pink ribbon 6-Aug DSCN_4228 15:43 At 32m looking down line 6-Aug DSCN_4229 15:59 At EOT looking up line 6-Aug DSCN_4230 15:59 At EOT looking down line 6-Aug DSCN_4231 15:59 At EOT looking downstream 6-Aug DSCN_4232 15:59 At EOT looking upstream 6-Aug DSCN_4233 16:01 Looking at seedlings at 38 m 6-Aug DSCN_4234 16:02 Looking at seedlings at 31 m
6-Aug DSCN_4235 16:10 Downstream of D6T29 at raft looking downstream at mid-channel bar with sandbar willow sample on D6T29 line
6-Aug DSCN_4236 16:10 Downstream of D6T29 at raft looking downstream at mid-channel bar with sandbar willow sample on D6T29 line
6-Aug DSCN_4237 16:10 Looking downstream 6-Aug DSCN_4238 16:10 Looking upstream 6-Aug DSCN_4239 16:12 Looking downstream while floating
6-Aug DSCN_4240 17:50 D6T36 At 37 m - looking at up line POC in dense willow 6-Aug DSCN_4241 17:50 At 37 m looking down line 6-Aug DSCN_4242 17:52 At 37 m looking downstream 6-Aug DSCN_4243 17:52 At 37 m looking upstream 6-Aug DSCN_4244 17:54 At EOT looking up line 6-Aug DSCN_4245 17:55 At EOT looking downstream 6-Aug DSCN_4246 17:55 At EOT looking upstream 6-Aug DSCN_4247 17:56 At 74 m looking at seedling plot 6-Aug DSCN_4248 17:59 At 76 m looking at seedling plot

March, 2016 Lower Duncan River Riparian Cottonwood Monitoring File: 14.0037.00 DDMMON#8-1 VAST Resource Solutions Inc. BC Hydro
70
Date: Oct, 2015 Environmental Crew: Mary Louise, Ben, Jodi, Brenda
Location: Duncan River Project Leader: Mary Louise Polzin
Date Image # Time Description 5-Oct IMG_0138 14:44 D1T3 Animal disturbance in plot at the 21 m mark. 5-Oct IMG_0139 14:44 Animal disturbance in plot at the 21 m mark.
6-Oct DSCN4369 8:59 Near the start of D2 6-Oct DSCN4370 8:59 Debris on mid-channel bar. 6-Oct DSCN4371 9:05 Further downstream still on D2 6-Oct DSCN4372 9:06 Under cut large cottonwood tree.
6-Oct DSCN4373 9:15 D3T11 At 133 m looking up stream at the fall colours and deposition.
6-Oct DSCN4374 12:03 D3T15 At the 55 m mark looking at a seedling plot. 6-Oct DSCN4375 12:03 At the 55 m mark looking up line. 6-Oct DSCN4376 12:03 At the 55 m mark looking upstream 6-Oct DSCN4377 12:04 At the 55 m mark looking downstream. 6-Oct DSCN4378 12:05 At the 55 m mark looking down line.
6-Oct DSCN4383 14:01 D3T20 At The 50 m mark looking downstream.
6-Oct DSCN4384 14:01 At the 50 m mark looking upstream. The backchannel is flowing backwards in relation to the main channel.
8-Oct DSCN4379 13:14 D3T35 At EOT looking downstream. 8-Oct DSCN4380 13:14 At the 57 m mark looking down line. 8-Oct DSCN4381 13:15 At the 57 m mark looking up line. 8-Oct DSCN4382 13:15 At the 57 m mark looking upstream.
6-Oct DSCN4385 15:50 D3T45 At the 42 m mark standing upstream looking downstream at the EOT and what used to be the main channel.
6-Oct IMG_0140 10:58 D4T3 Silt deposition between the 20 and 29 m marks. 6-Oct IMG_0141 10:58 Silt deposition between the 20 and 29 m marks.
5-Oct DSCN4367 14:23 D5T9 Approximately 4 m off the 20 m mark along transect.
5-Oct DSCN4368 14:51 Upstream of transect D5T9 looking downstream at the fall colours over the gravel bar.
7-Oct DSCN4386 10:23 D5T12 Downstream of the 28 m mark looking upstream of a back channel.
7-Oct DSCN4387 10:23 Downstream of the 28 m mark looking down line.
7-Oct DSCN4388 12:19 D6T29 At approximately 39 m, upstream of line looking downstream at band of seedlings.

March, 2016 Lower Duncan River Riparian Cottonwood Monitoring File: 14.0037.00 DDMMON#8-1 VAST Resource Solutions Inc. BC Hydro
71
Date: August, 2015 Environmental Crew: Mary Louise, Ben, Henning, Brenda
Location: Lardeau River Project Leader: Mary Louise Polzin
Date Image # Time Description
7-Aug IMG_0098 15:49 L1T1 At EOT looking upstream 7-Aug IMG_0099 15:50 At EOT looking downstream 7-Aug IMG_0100 15:50 At EOT looking up line 7-Aug IMG_0101 15:51 At EOT looking down line 7-Aug IMG_0102 15:57 At 19 m looking up line 7-Aug IMG_0103 15:57 At 19 m looking down line 7-Aug IMG_0104 17:30 At 17 m looking at seedling 7-Aug IMG_0105 17:32 At 13 m looking at seedling 7-Aug IMG_0106 17:36 At POC looking down line
8-Aug IMG_0129 13:32 L1T10 At EOT looking upstream 8-Aug IMG_0130 13:32 At EOT looking downstream 8-Aug IMG_0131 13:32 At EOT looking up line 8-Aug IMG_0132 13:33 At EOT looking down line 8-Aug IMG_0133 13:44 At 47 m looking at seedling 8-Aug IMG_0134 17:13 At 25 m looking down line 8-Aug IMG_0135 17:14 At 25 m looking up line 8-Aug IMG_0136 17:20 At 27 m looking at seedling
8-Aug IMG_0117 9:15 L1T20 At EOT looking upstream 8-Aug IMG_0118 9:15 At EOT looking downstream 8-Aug IMG_0119 9:15 At EOT looking up line 8-Aug IMG_0121 9:16 At EOT looking down line 8-Aug IMG_0122 9:27 At 58 m looking at seedlings 8-Aug IMG_0123 10:40 At 36 m looking at seedlings 8-Aug IMG_0124 10:41 At 36 m looking at seedlings 8-Aug IMG_0125 10:42 At 31 m looking at tadpoles 8-Aug IMG_0126 10:42 At 31 m looking up line 8-Aug IMG_0127 10:54 At 28 m looking down line 8-Aug IMG_0128 12:14 At POC looking down line
7-Aug DSCN_4285 16:16 L1T36 At POC looking down line 7-Aug DSCN_4286 16:18 At 15 m looking up line 7-Aug DSCN_4287 16:18 At 15 m looking down line 7-Aug DSCN_4288 16:21 At EOT looking down line - across river 7-Aug DSCN_4289 16:21 At EOT looking up line 7-Aug DSCN_4290 16:21 At EOT looking upstream 7-Aug DSCN_4291 16:22 At EOT looking downstream 7-Aug DSCN_4292 16:27 At 9.8 m looking at seedlings in plot 7-Aug DSCN_4293 16:30 Downstream of 11 m - 15 m older recruited cottonwood

March, 2016 Lower Duncan River Riparian Cottonwood Monitoring File: 14.0037.00 DDMMON#8-1 VAST Resource Solutions Inc. BC Hydro
72
Date Image # Time Description 7-Aug IMG_0086 12:57 L2T6 At EOT looking upstream 7-Aug IMG_0087 12:57 At EOT looking downstream 7-Aug IMG_0088 12:58 At EOT looking up line 7-Aug IMG_0089 12:58 At EOT looking down line 7-Aug IMG_0090 13:22 At 29 m looking up line 7-Aug IMG_0091 13:23 At 29 m looking down line 7-Aug IMG_0092 14:05 At POC looking down line 7-Aug IMG_0094 14:28 At 46 m looking at seedlings 7-Aug IMG_0095 14:32 At 26 m looking at seedlings 7-Aug IMG_0096 14:35 At 26 m looking at seedlings 7-Aug IMG_0097 14:37 Looking at seedlings shaded by log off the line
7-Aug IMG_0079 10:05 L2T15 At EOT looking upstream 7-Aug IMG_0080 10:05 At EOT looking downstream 7-Aug IMG_0081 10:06 At EOT looking up line 7-Aug IMG_0082 10:06 At EOT looking down line 7-Aug IMG_0083 10:23 At 17.5 m looking down line 7-Aug IMG_0084 10:24 At 17.5 m looking up line 7-Aug IMG_0085 10:26 At POC looking down line
7-Aug DSCN_4276 14:00 L2T18 At POC looking down line 7-Aug DSCN_4277 14:00 At 10 m looking up line 7-Aug DSCN_4278 14:00 At 10 m looking down line 7-Aug DSCN_4279 14:02 At EOT looking up line 7-Aug DSCN_4280 14:02 At EOT looking down line 7-Aug DSCN_4281 14:02 At EOT looking upstream 7-Aug DSCN_4282 14:03 At EOT looking downstream 7-Aug DSCN_4283 14:07 Recruitment on gravel bar ~30 m upstream of line 7-Aug DSCN_4284 14:07 Recruitment on gravel bar ~30 m upstream of line
7-Aug DSCN_4267 12:48 L3T1 At POC looking down line 7-Aug DSCN_4268 12:48 At 14 m looking up line 7-Aug DSCN_4269 12:49 At 14 m looking down line 7-Aug DSCN_4270 12:49 At EOT looking up line 7-Aug DSCN_4271 12:49 At EOT looking down line 7-Aug DSCN_4272 12:49 At EOT looking upstream 7-Aug DSCN_4273 12:49 At EOT looking downstream 7-Aug DSCN_4274 12:53 Cottonwood recruitment on point bar ~50 m upstream of line 7-Aug DSCN_4275 12:53 Cottonwood recruitment on point bar ~50 m upstream of line
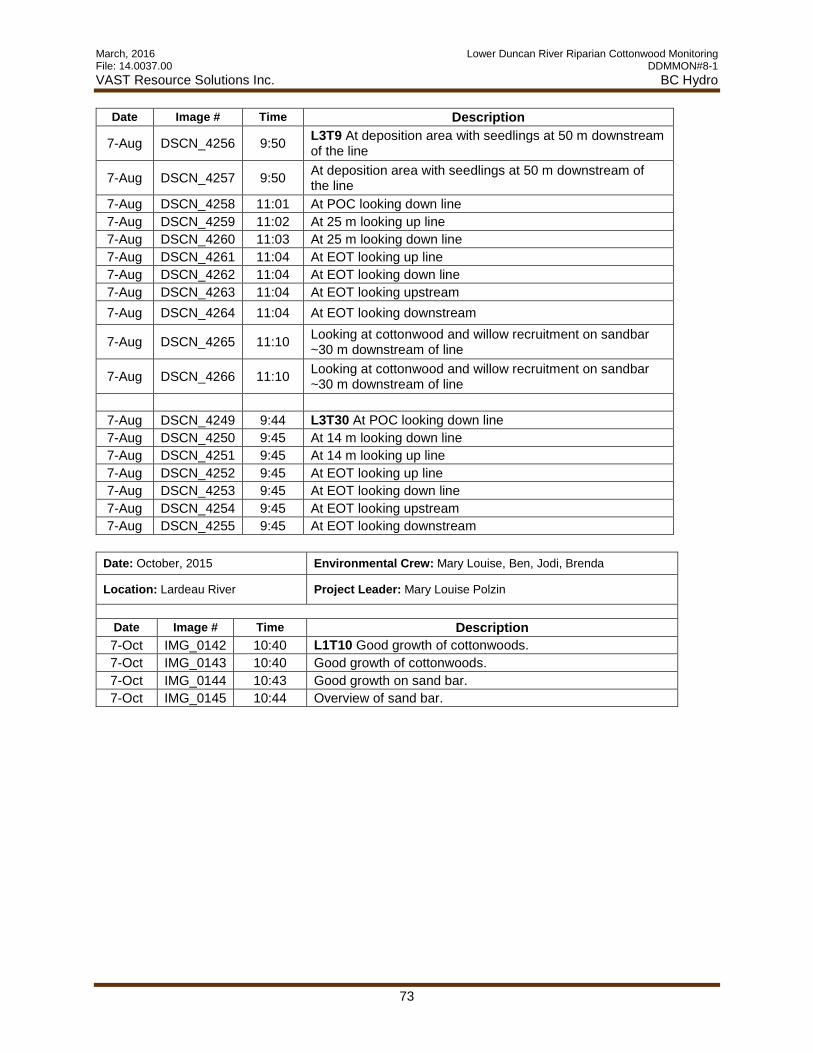
March, 2016 Lower Duncan River Riparian Cottonwood Monitoring File: 14.0037.00 DDMMON#8-1 VAST Resource Solutions Inc. BC Hydro
73
Date Image # Time Description
7-Aug DSCN_4256 9:50 L3T9 At deposition area with seedlings at 50 m downstream of the line
7-Aug DSCN_4257 9:50 At deposition area with seedlings at 50 m downstream of the line
7-Aug DSCN_4258 11:01 At POC looking down line 7-Aug DSCN_4259 11:02 At 25 m looking up line 7-Aug DSCN_4260 11:03 At 25 m looking down line 7-Aug DSCN_4261 11:04 At EOT looking up line 7-Aug DSCN_4262 11:04 At EOT looking down line 7-Aug DSCN_4263 11:04 At EOT looking upstream 7-Aug DSCN_4264 11:04 At EOT looking downstream
7-Aug DSCN_4265 11:10 Looking at cottonwood and willow recruitment on sandbar ~30 m downstream of line
7-Aug DSCN_4266 11:10 Looking at cottonwood and willow recruitment on sandbar ~30 m downstream of line
7-Aug DSCN_4249 9:44 L3T30 At POC looking down line 7-Aug DSCN_4250 9:45 At 14 m looking down line 7-Aug DSCN_4251 9:45 At 14 m looking up line 7-Aug DSCN_4252 9:45 At EOT looking up line 7-Aug DSCN_4253 9:45 At EOT looking down line 7-Aug DSCN_4254 9:45 At EOT looking upstream 7-Aug DSCN_4255 9:45 At EOT looking downstream
Date: October, 2015 Environmental Crew: Mary Louise, Ben, Jodi, Brenda
Location: Lardeau River Project Leader: Mary Louise Polzin
Date Image # Time Description 7-Oct IMG_0142 10:40 L1T10 Good growth of cottonwoods. 7-Oct IMG_0143 10:40 Good growth of cottonwoods. 7-Oct IMG_0144 10:43 Good growth on sand bar. 7-Oct IMG_0145 10:44 Overview of sand bar.

March, 2016 Lower Duncan River Riparian Cottonwood Monitoring File: 14.0037.00 DDMMON#8-1 VAST Resource Solutions Inc. BC Hydro
74
Appendix 3: Duncan and Lardeau rivers contact sheets

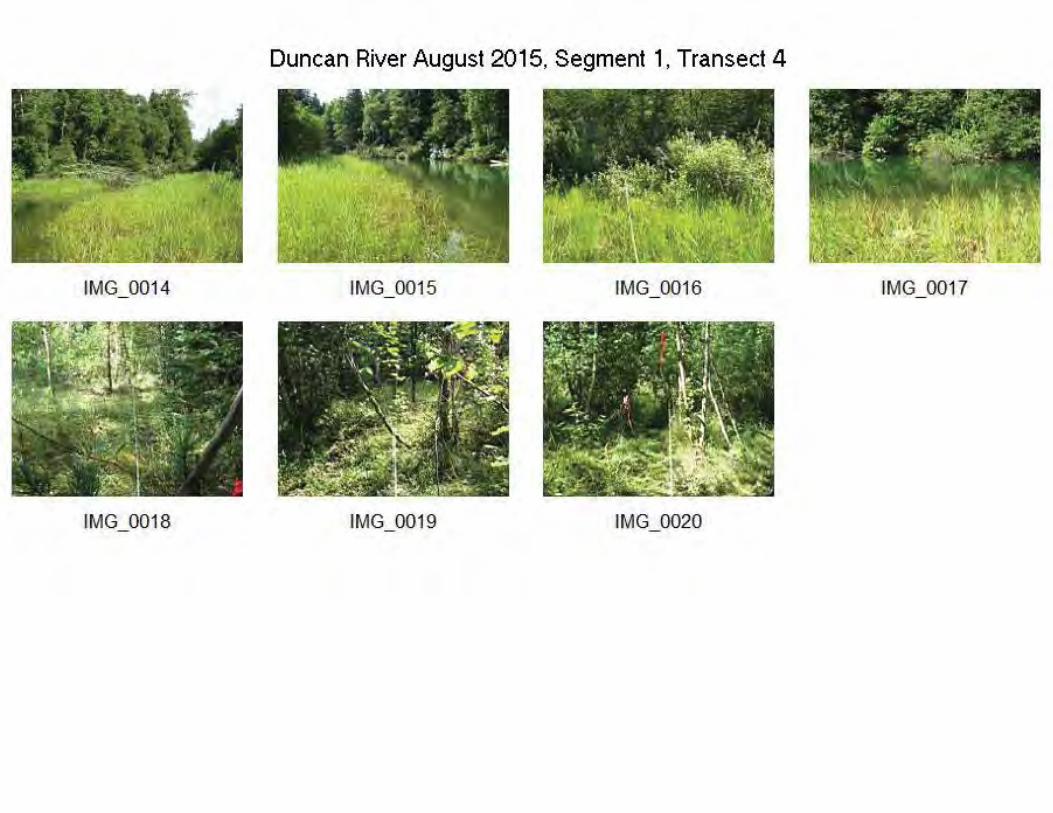


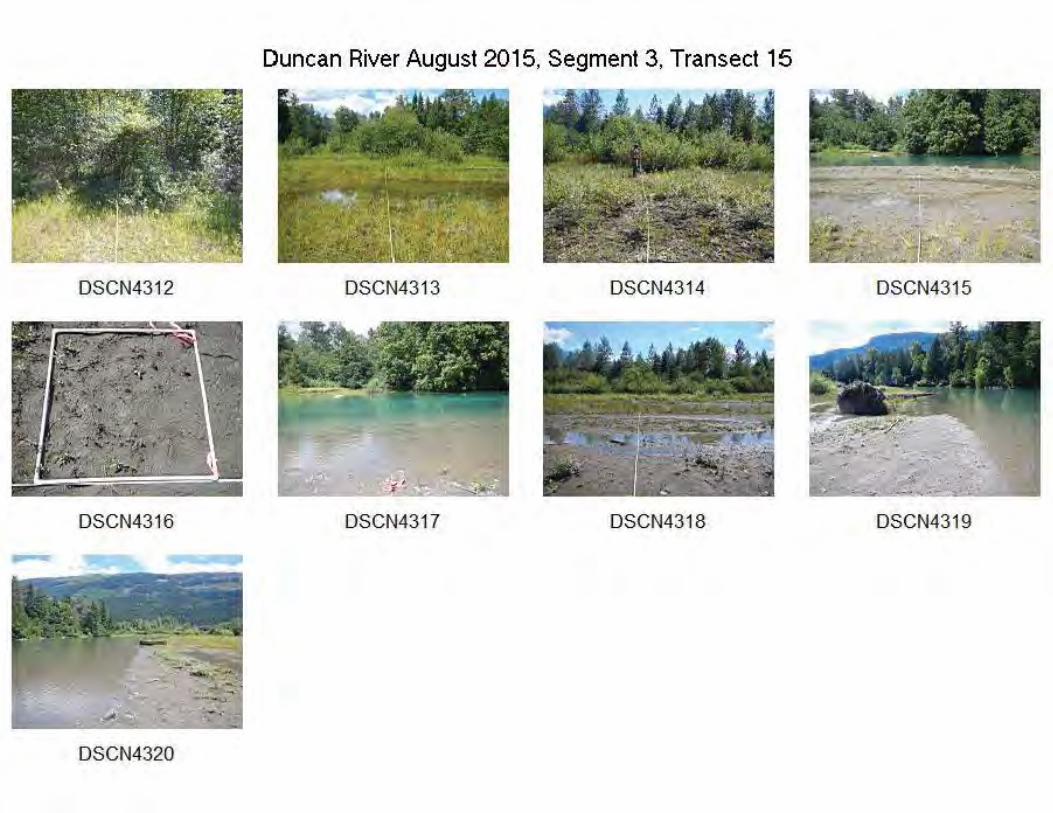


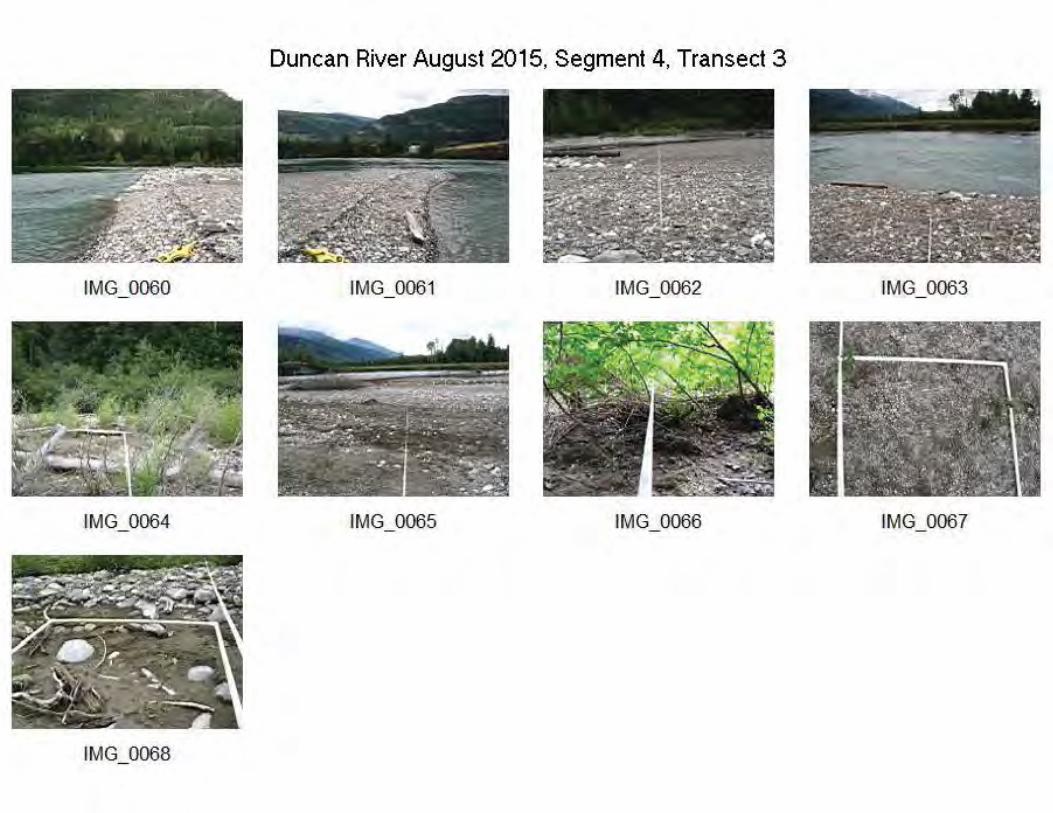


March, 2016 Lower Duncan River Riparian Cottonwood Monitoring File: 14.0037.00 DDMMON#8-1 VAST Resource Solutions Inc. BC Hydro
113
Appendix 4: Statistical Analysis Details

March, 2016 Lower Duncan River Riparian Cottonwood Monitoring File: 14.0037.00 DDMMON#8-1 VAST Resource Solutions Inc. BC Hydro
114
Lardeau River all flow years from 2009 to 2014 to show why 2009/10, 2011/12, and 2013/14 were averaged and shown as a single line for each set of combined years.
Duncan River seedling density Friedman Repeated Measures Analysis of Variance on Ranks Group N Missing Median 25% 75% D_Jul_13 632 0 0.000 0.000 21.750 D_Jul_14 632 0 16.000 7.000 40.000 D_Aug_2015 632 0 1.000 0.000 21.000 Chi-square= 194.217 with 2 degrees of freedom. (P = <0.001) The differences in the median values among the treatment groups are greater than would be expected by chance; there is a statistically significant difference (P = <0.001) To isolate the group or groups that differ from the others use a multiple comparison procedure. All Pairwise Multiple Comparison Procedures (Tukey Test): Comparison Diff of Ranks q P<0.05 D_Jul_14 vs D_Jul_13 441.500 17.562 Yes D_Jul_14 vs D_Aug_2015 368.500 14.658 Yes D_Aug_2015 vs D_Jul_13 73.000 2.904 No Note: The multiple comparisons on ranks do not include an adjustment for ties.
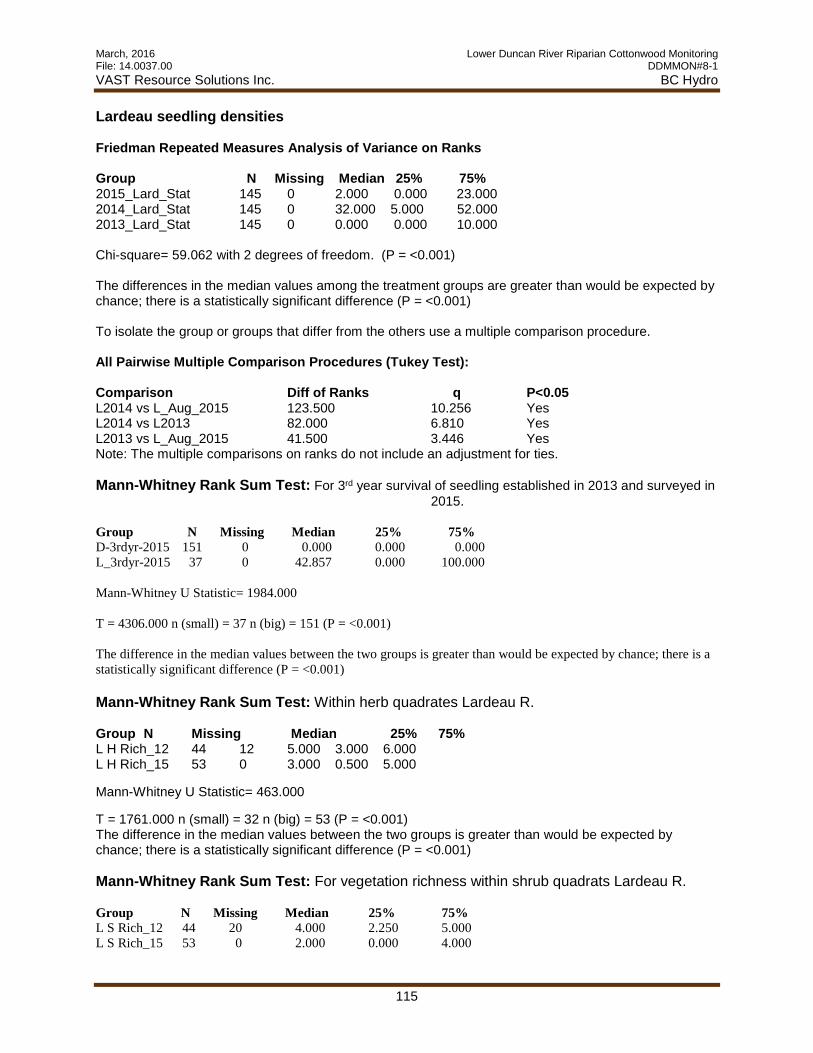
March, 2016 Lower Duncan River Riparian Cottonwood Monitoring File: 14.0037.00 DDMMON#8-1 VAST Resource Solutions Inc. BC Hydro
115
Lardeau seedling densities Friedman Repeated Measures Analysis of Variance on Ranks Group N Missing Median 25% 75% 2015_Lard_Stat 145 0 2.000 0.000 23.000 2014_Lard_Stat 145 0 32.000 5.000 52.000 2013_Lard_Stat 145 0 0.000 0.000 10.000 Chi-square= 59.062 with 2 degrees of freedom. (P = <0.001) The differences in the median values among the treatment groups are greater than would be expected by chance; there is a statistically significant difference (P = <0.001) To isolate the group or groups that differ from the others use a multiple comparison procedure. All Pairwise Multiple Comparison Procedures (Tukey Test): Comparison Diff of Ranks q P<0.05 L2014 vs L_Aug_2015 123.500 10.256 Yes L2014 vs L2013 82.000 6.810 Yes L2013 vs L_Aug_2015 41.500 3.446 Yes Note: The multiple comparisons on ranks do not include an adjustment for ties. Mann-Whitney Rank Sum Test: For 3rd year survival of seedling established in 2013 and surveyed in
2015. Group N Missing Median 25% 75% D-3rdyr-2015 151 0 0.000 0.000 0.000 L_3rdyr-2015 37 0 42.857 0.000 100.000 Mann-Whitney U Statistic= 1984.000 T = 4306.000 n (small) = 37 n (big) = 151 (P = <0.001) The difference in the median values between the two groups is greater than would be expected by chance; there is a statistically significant difference (P = <0.001) Mann-Whitney Rank Sum Test: Within herb quadrates Lardeau R. Group N Missing Median 25% 75% L H Rich_12 44 12 5.000 3.000 6.000 L H Rich_15 53 0 3.000 0.500 5.000 Mann-Whitney U Statistic= 463.000 T = 1761.000 n (small) = 32 n (big) = 53 (P = <0.001) The difference in the median values between the two groups is greater than would be expected by chance; there is a statistically significant difference (P = <0.001) Mann-Whitney Rank Sum Test: For vegetation richness within shrub quadrats Lardeau R. Group N Missing Median 25% 75% L S Rich_12 44 20 4.000 2.250 5.000 L S Rich_15 53 0 2.000 0.000 4.000

March, 2016 Lower Duncan River Riparian Cottonwood Monitoring File: 14.0037.00 DDMMON#8-1 VAST Resource Solutions Inc. BC Hydro
116
Mann-Whitney U Statistic= 361.500 T = 1210.500 n (small) = 24 n (big) = 53 (P = 0.002) The difference in the median values between the two groups is greater than would be expected by chance; there is a statistically significant difference (P = 0.002)