duck pond restoration: scarborough outdoor education school
TRANSCRIPT

Duck Pond Restoration: Scarborough Outdoor Education School
Kristy Michelle Wakeling
Environment and Resource Studies
Department of Environmental Studies Senior Honors Thesis ERS 491
University of Waterloo
Waterloo Ontario Canada
Kristy Michelle Wakeling Environment and Resource Studies Department of Environmental Studies Honors Bachelor of Environmental Studies Candidate University of Waterloo Undergraduate Waterloo Ontario Stephen D. Murphy PhD. Academic Undergraduate Thesis Advisor Faculty of Environmental Studies University of Waterloo Waterloo Ontario Canada April 4, 2008
Table of Contents Executive Summary Introduction Site Summary: Scarborough Outdoor Education School Methods
Aquatic Habitat Creation Table 1: Native Pond Species Planting Aquatic Species Abiotic Habitat Creation
Terrestrial Habitat Creation Planting Assembly Theory Figure One: Planting Design (** At end of Text)
Planting for the Purpose of Bank Retention Plug Planting Table 2: Plug Sizing Table Seeding Transplanting
Vegetation Lists / Charts Trees and Shrubs Table 3: Trees and Shrubs and Those Suggested for Planting Table 4: Grasses and Sedges and Those Suggested for Planting Table 5: Flowering and Low Lying Plants and Those Suggested for
Planting
Erosion and Bank Retention Bank Retention Structure Soil Compaction
Monitoring Quadrat Ground Cover Plot Monitoring Visual Estimation of Seeding Success Table 6: Percentage Cover of Seeding Success Tree Heath Monitoring Table 7: Tree Heath Data Sheet Monitoring of Herptile Species

Table 8: Abundance and Distribution of Herptile Species in Monitoring Plots Table 9: Distribution Abundance of Frog Species Table 10: Rare or Unusual Species Sightings Monitoring Guidelines for Teaching Purposes
Discussion Acknowledgements Figures Figure 1: Planting Design Figure 2: Estimated Budget

Executive Summary This project is based around the restoration of a small farm pond at the in
Kearney, Ontario, Canada. My project may be considered to be a form of ecological restoration known as “ecological rehabilitation”. This is because the site of my project is a created pond that is part of an environmental education facility; Scarborough Outdoor Education School. Therefore the original ecosystem and its communities were not in fact an aquatic system so to keep the pond means keeping the human created rather than natural system. The pond is being kept for educational purposes but is currently not functioning properly in terms of nutrient and hydrological dynamics nor does it have ecological structure, hence there are insufflicient species for educational and ecological purposes. The restoration process will focus on the more highly degraded areas, the banks and surrounding riparian areas of the pond. These areas will be planted and secured during the restoration process focusing on the regeneration of both planted and pre-existing native species. The shoreline will be secured at the north end of the pond using a bank retention system and will be planted to promote habitat for fauna. Aquatic planting and habitat creation will also take place as a component of this restoration. The Scarborough Outdoor Education School has generously assisted with funding this restoration and will assist in monitoring costs through the monitoring period. The Canada Tree Fund has supported this restoration with a grant of $2000.00 for native flora. This will be a community-based project with participation from staff members of SOES with assistance from student groups in the assembly and monitoring processes. The preliminary field research for this restoration was completed between January 1, 2006 and October 31, 2007. Work commenced on physical restoration in June 2007. Physical work should be completed by September 2008. A monitoring plan has been put in place to last approximately five years after the restoration work is completed, with monitoring taking place once annually. The pond has proved to be an educational asset and therefore will be rehabilitated to perform as an aquatic community.
Introduction Wetlands are productive nutrient sinks, areas of recharge discharge and
storage of water, filters which have the ability to reduce up to 99% of pathogenic organisms and pollutants (DUC 2004). They provide diverse habitat for millions of species of flora and fauna including amphibians and reptiles such as blue spotted salamanders (Ambystoma laterale), northern dusky salamander (Desmognathus monticola ssp.), red spotted newts (Notophthalmus viridescens viridescens), blandings turtles (Emydoidea blandingi) and others which will only bread in specific conditions that wetlands of this caliber can provide. Wetlands provide fish and wildlife habitats, natural water quality improvement, biogeochemical cycling, carbon sequestration, flood water storage, shoreline erosion protection, opportunities for recreation and aesthetic appreciation, and

natural products for our use, such as cranberries and rice (Bedford 2005). Such areas act as nurseries for multitudes of different species many of them beginning their lives in or around an aquatic ecosystem (Hawke 1994).
Wetlands are directly linked to many of the world’s major environmental issues including global warming and climate change (Patterson 1990). Wetlands including, peat lands and muskegs, are major climate controlling ecosystems; the loss of such systems can attribute to the greater warming trend of the climate. The ability to store, recharge and release water is unique functions to wetland ecosystems (Gosselink 2005). These three functions are essential for flood control, purification of water, maintaining crucial habitat among other functions. It is not only the individual wetland that is affected by change; it is the entire watershed and all of the components of it (Daigle 1996).
Wetlands around the world are being destroyed in favor of new development. The majority of affected wetlands are not restored or recreated in any capacity; rather the land is in-filled and left to settle; roadways, houses or industry are built it their place (Robertson 2002). Of the surface area that wetlands once covered North America, as late as 200 years ago, only a small portion of those remain (Gosselink 2005). Between 1950 and 1970 it has been estimated that an average of 550,000 hectares of wetlands were lost in the Canada each year (Allard 1997). Little value is placed upon the functions that wetlands perform. Protecting these ecosystems will in turn protect our health and safety by reducing flood damage and preserving water quality. The best management plan for wetlands is a sustainable model that ensures the ecological productivity and maintains the integrity of the system; this can be achieved through restoration of wetland systems.
Wetlands are a significant part of Canadian geography, economy, agricultural practices, recreation and education. Wetlands are fragile and are being lost on a regular basis to both natural and human activities (Kentula 1992). Private land is not considered to be as valuable for development purposes if it contains wetland area (Gosselink 2000). The federal government, as of 1990, manages 29% of all wetlands, with special attention placed on those areas in the northern provinces and territories (Patterson 1990). The private sector is currently taking initiative to protect wetlands on an individual scale, creating and basing business and development plans around environmental protection.
Restoratation and rehabilitation of wetland sites across Canada are becoming increasingly important. As wetlands are being filled in favor of development (Chow 2004), it is vital that the wetlands that still exist are restored to a functioning state for the benefit of the ecosystem and surrounding fauna. Although a fully intact ecosystem provides the greatest value for ecological functioning, restored and rehabilitated wetlands can provide equal functioning to the surrounding area allowing for nutrient cycling, recharge discharge and filtration functions and restoring hydrological functions of the ecosystem (Gosselink 2005). Restoration and rehabilitation of wetlands at a small scale is important, especially on privately owned properties; any rehabilitation of damaged lands is important whether it is small or large scale (Kipp 2003).

The restoration of the pond at the Scarborough Outdoor Education School will fulfill this by creating habitat for fauna where it does not currently exist and add to the currently limited and mimic the natural functioning that the area should possess. Through restoring some of the natural functions that the pond would provide it is hoped that students would gain the educational value of what it means to rehabilitate a natural ecosystem where one previously existed or could naturally exist to replace one that has been eliminated.
Site History: Scarborough Outdoor Education School Scarborough Outdoor Education School (SOES) property is deeply rooted in the cultural history of the town of Kearney and the township of Bethune (Bice). The property has changed hands three times before the ownership by the Toronto District School Board (Bice). The property originated as crown land and was sold for only dollars to a homesteader native to Burlington Ontario, John Phenix Sr., in 1887 (Bice). The small portions of the property were cleared and a homestead was built on the property, which, still exists today, six miles east of Kearney (Bice). The site was then sold to George Groome, who turned the vast property into a hunt and fishing camp (Bice). The property changed hands for the third time when G. Groome sold the property to the Scarborough Board of Education in 1978 (Bice). Today, the school is run under the authority of the Toronto District School Board as a part of their Outdoor Education School Program (TOES 2007). The town of Kearney lies at the intersections of highway 518 and highway 592, North East of Huntsville Ontario (Town of Kearney 2007). The Scarborough Outdoor Education School is located on the Eastern corner of the township of Kearney, at the end of Echo Ridge Road (SOES 2007). The Scarborough Outdoor Education School encompasses 400 hectares on the central western boarder of Algonquin Provincial Park, providing a large education and recreation facility for students of the Toronto District School Board (SOES 2007).
The Scarborough Outdoor Education School offers a variety of outdoor experiential programs to students which include canoeing, hiking, camping, ecosystems studies, skiing, snowshoeing, and a variety of other programs that explore school property (SOES 2007). The school hosts a summer adventure camp during the summer months; Camp Kearney (Camp Kearney 2007). The Scarborough Outdoor Education School is well used both during the school season and the summer facilitating thousands of students each year (SOES 2007). The Duck Pond was originally created as a watering hole for cattle in the early 1950’s and later expanded upon to create an asthetic feature for G.Groome’s hunt camp in1964 and then was expanded for a final time in 1982 (Wakeling 2007). The pond was dredged and the banks were built up at this time, (Wakeling 2006). The pond was allowed to mature naturally after its creation without the assistance of planting (Wakeling 2006). The site of this rehabilitation is a 275m by 50m pond located on the SOES property (SOES Map 1996). The Duck Pond is located in a linear north/south direction and runs longer than it is wide with one small distinctive island in the lower western side of the pond (SOES Map 1996).
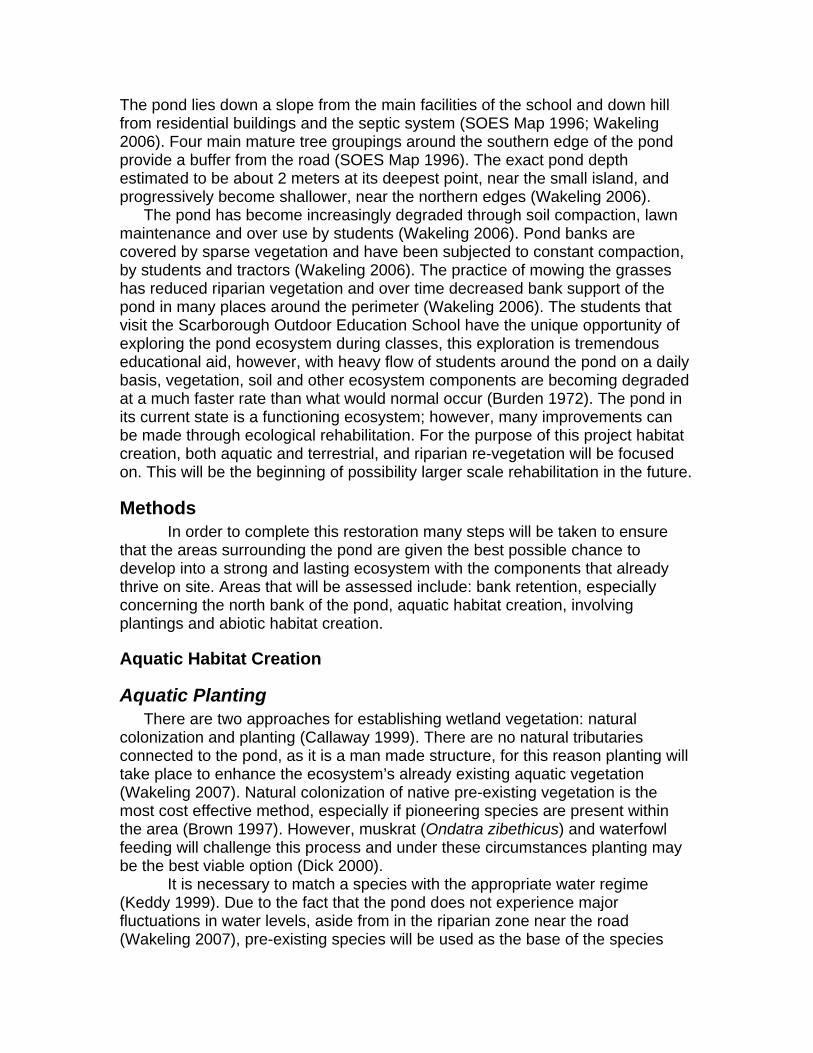
The pond lies down a slope from the main facilities of the school and down hill from residential buildings and the septic system (SOES Map 1996; Wakeling 2006). Four main mature tree groupings around the southern edge of the pond provide a buffer from the road (SOES Map 1996). The exact pond depth estimated to be about 2 meters at its deepest point, near the small island, and progressively become shallower, near the northern edges (Wakeling 2006). The pond has become increasingly degraded through soil compaction, lawn maintenance and over use by students (Wakeling 2006). Pond banks are covered by sparse vegetation and have been subjected to constant compaction, by students and tractors (Wakeling 2006). The practice of mowing the grasses has reduced riparian vegetation and over time decreased bank support of the pond in many places around the perimeter (Wakeling 2006). The students that visit the Scarborough Outdoor Education School have the unique opportunity of exploring the pond ecosystem during classes, this exploration is tremendous educational aid, however, with heavy flow of students around the pond on a daily basis, vegetation, soil and other ecosystem components are becoming degraded at a much faster rate than what would normal occur (Burden 1972). The pond in its current state is a functioning ecosystem; however, many improvements can be made through ecological rehabilitation. For the purpose of this project habitat creation, both aquatic and terrestrial, and riparian re-vegetation will be focused on. This will be the beginning of possibility larger scale rehabilitation in the future.
Methods In order to complete this restoration many steps will be taken to ensure that the areas surrounding the pond are given the best possible chance to develop into a strong and lasting ecosystem with the components that already thrive on site. Areas that will be assessed include: bank retention, especially concerning the north bank of the pond, aquatic habitat creation, involving plantings and abiotic habitat creation.
Aquatic Habitat Creation
Aquatic Planting There are two approaches for establishing wetland vegetation: natural colonization and planting (Callaway 1999). There are no natural tributaries connected to the pond, as it is a man made structure, for this reason planting will take place to enhance the ecosystem’s already existing aquatic vegetation (Wakeling 2007). Natural colonization of native pre-existing vegetation is the most cost effective method, especially if pioneering species are present within the area (Brown 1997). However, muskrat (Ondatra zibethicus) and waterfowl feeding will challenge this process and under these circumstances planting may be the best viable option (Dick 2000).
It is necessary to match a species with the appropriate water regime (Keddy 1999). Due to the fact that the pond does not experience major fluctuations in water levels, aside from in the riparian zone near the road (Wakeling 2007), pre-existing species will be used as the base of the species
planted. Flora should provide the adequate habitat necessary to sustain herptile and other fauna populations and provide the cover and protection from predators needed for these species (Dick 2000).
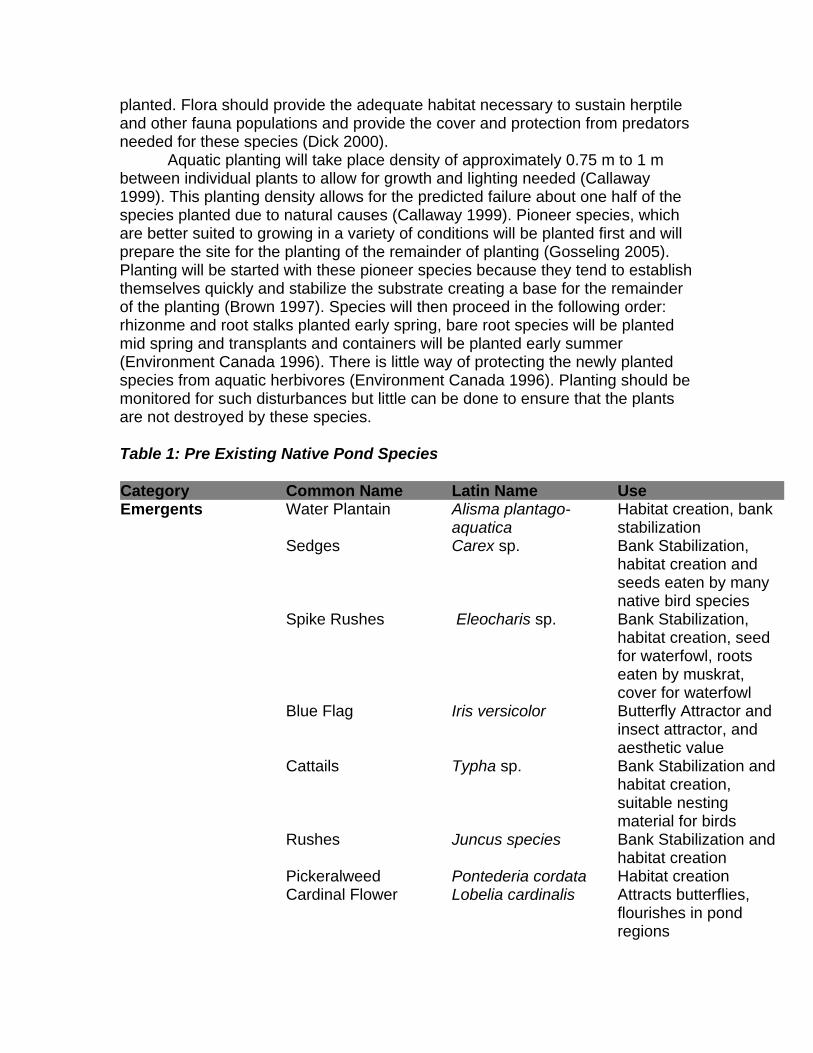
Aquatic planting will take place density of approximately 0.75 m to 1 m between individual plants to allow for growth and lighting needed (Callaway 1999). This planting density allows for the predicted failure about one half of the species planted due to natural causes (Callaway 1999). Pioneer species, which are better suited to growing in a variety of conditions will be planted first and will prepare the site for the planting of the remainder of planting (Gosseling 2005). Planting will be started with these pioneer species because they tend to establish themselves quickly and stabilize the substrate creating a base for the remainder of the planting (Brown 1997). Species will then proceed in the following order: rhizonme and root stalks planted early spring, bare root species will be planted mid spring and transplants and containers will be planted early summer (Environment Canada 1996). There is little way of protecting the newly planted species from aquatic herbivores (Environment Canada 1996). Planting should be monitored for such disturbances but little can be done to ensure that the plants are not destroyed by these species. Table 1: Pre Existing Native Pond Species
Category Common Name Latin Name Use Emergents Water Plantain Alisma plantago-
aquatica Habitat creation, bank stabilization
Sedges Carex sp. Bank Stabilization, habitat creation and seeds eaten by many native bird species
Spike Rushes Eleocharis sp. Bank Stabilization, habitat creation, seed for waterfowl, roots eaten by muskrat, cover for waterfowl
Blue Flag Iris versicolor Butterfly Attractor and insect attractor, and aesthetic value
Cattails Typha sp. Bank Stabilization and habitat creation, suitable nesting material for birds
Rushes Juncus species Bank Stabilization and habitat creation
Pickeralweed Pontederia cordata Habitat creation Cardinal Flower Lobelia cardinalis Attracts butterflies,
flourishes in pond regions

Giant Bur-reed Sparganium eurycarpum
Habitat creation for ducks, food for deer and muskrats
Jewelweed Impatiens capensis Attracts hummingbirds and grouse
Submergents Coontail Ceratophyllum demersum
Habitat creation and location for amphibian egg laying
Waterweed Elodea canadensis
Habitat creation and location for amphibian egg laying
Pondweed Potamogeton richardsonii
Habitat Creation, soil anchorage
Tape Grass Vallisneria americana Habitat creation and location for amphibian egg laying
Floating leaved Yellow Water Lily Nuphar variegata Habitat creation,
basking area and excellent location for amphibian egg laying (due to shading from lilypad)
Floating Pondweed Pontamogeton natans Habitat creation Deep Water
Arrowhead Sagittaria rigida Habitat creation
Free Floating Common Duck Weed Lemna minor Habitat creation Greater Duck Weed Spirodela polyrhiza Habitat creation Blatterwort Utricularia spp. Habitat creation
Acorus Restoration 2008
Planting Aquatic Species Planting of aquatic species will take place May 2008 through September 2008. The majority of species being planted will be in the form of container seeding pot. These pots are have been chosen because of their ease of planting and preparation as well as their low impact to the environment (Environment Canada 1996). Potted plants allow for advanced root structures, easy storage, easy transportation and implementation and better chances of success (Environment Canada 1996). Pots will be planted in accordance with the best planting time suggested by Environment Canada, late spring to early summer (Environment Canada 1996). Select species including, white water lily (Nymphaea odorata) and cattails (Typha sp.) will be transplanted from local donor sites and will be harvested in late spring and planted in late spring and early summer in accordance with their vitality and stage in their lifecycle (Environment Canada 1996). Some species will also be transplanted using a
bare root method of transfer and will be planted in mid summer, immediately after their transplantation to avoid early die off. Species will be relocated in burlap bags to ensure that the root structures stay intact and supported (Environment Canada 1996). These species will be transplanted into moist ground and monitored to ensure best opportunities for success (Environment Canada 1996). Transplanting, although more labor intensive, is a cost effective way to achieve a well-developed plant community through harvesting from another adjacent ecosystem (Environment Canada 1996).
Abiotic Habitat Creation Features will be added to the pond to create habitat and suitable cover for the species within the pond. Rock piles and collections of smaller rocks will be added along the shallow shores of the northern area of the pond, in order to provide necessary habitat, shelter, anchorage for aquatic plants and breeding areas for herptiles (Geo-Marine Inc 2000), that currently do not exist in this area of the pond. These rock piles will give diversity to the pre existing habitat as well as extra basking and above surface area for frogs.
Shelter will be provided for turtles and other herptile species though the addition of ‘floating logs and dead trees (Shields 2003), which are used by turtle species to bask on and use for shelter and habitat for other fauna (Daigle 1996). Logs should be accessible by water for the turtles and other semi aquatic fauna, but not be accessible by land bound predators. This will be made possible by submerging branches into the deeper waters of the pond. This will be done with the assistance of heavy machinery to ensure that the logs inaccessible by main land. One treetop as well as two logs will be added to the mid section of the pond in the deepest area. These logs will provide alternate aquatic habitat for amphibians, reptiles, mammals and invertebrates (Daigle 1996). Logs and branches will be harvested from cut poplars on the property and will be installed in the spring of 2008 before planting takes place. A log will be placed in the northwest quadrant of the pond partially on land and partially submerged close to a population of cattails. The log will be a 2 foot in diameter, white pine (Pinus strobus ) log salvaged from a downed tree on the SOES property. Installation of this log will take place on January 16, 2008 and will be installed by G. Groome (Wakeling 2007). Fish will not be stocked in the SOES pond, as fish stocking would be counterproductive to the habitat that is being created for herptiles. Fish predate herptiles in their egg and juvenile phases (Thurow 1999) however, the fish that are already present in the pond will remain apart of the ecosystem. The only known type of fish in the pond are golden shiners (Notemigonus crysoleucas) bait fish released into the pond many years ago, however, this population has proven to be very unstable in past years (Wakeling 2006).
Terrestrial Habitat Creation Terrestrial habitat creation will take place primarily through plantings and
addition of abiotic features. Planting will assist in bank stabilization, riparian

creation as well as creation of habitat for a variety of different species. Addition of aibotic features will enhance the naturally existing features in the pond. These features being added will enhance the already existing habitat components and strengthen those that are lacking.
Planting
Planting will be a necessary part of this restoration due to the amount of disturbed soil at the site especially where topsoil has been relocated. Planting will take place through natural re-seeding of native flora and will also be assisted with hand planting of additional native species. Planting will encourage species that are attractants for butterflies and humming birds, as well as, those species with shallow weaving root structures to anchor the bank and increase habitat.
The high costs of labor can make planting the most expensive part of restoration projects with 70% of the total planting costs going to labor expenses (Zentner 2003). To avoid the costs of labor planting will be carried out primarily by K. Wakeling, volunteer staff and volunteer high school students attending the school. K. Wakeling will train volunteers in planting techniques and all planting will be overseen by K. Wakeling to ensure consistency.
Planting at high densities is best to ensure that vegetation has the greatest possibility for success, however this is not always possible or necessary depending on the restoration (Zentner 2003). For this restoration seeding will take pace at high densities per square foot where as plugs will be done in small groupings as required by crown cover. Planting will be done for this reason in order to keep costs at a minimum well attempting to achieve a maximum effect. Fertilizers will not be used for the purpose of this restoration to ensure that the process takes place as naturally as possible. Furthermore, fertilizers typically do not have a barring on speed of growth or success when dealing with native wetland grasses of central Ontario (OSC 2007). Planted areas will be fenced off using heavy wire mesh to prevent grazing animals from predating seedling sprouts. Wire meshing will be installed prior to planting and remain until vegetation is well rooted and visibly stable. This method has been show to prevent the majority of damage caused by both small and large herbivores (Weiher 2003). Only the areas that require such precautions will be fenced off to provide maximum access for school based classes.
Assembly Theory The history of assembly theory looks at the root of patterns appearing in science and nature (McArthur 1972). Community assembly theory is an ecological method of looking a community’s dynamics as they are assembled and assessing how these dynamics will change over a period of time (Booth 2002). During the community assembly process many natural controls are at work promoting certain members of the community and preventing others from succeeding, this process of creating a community and the changes themselves within the community as a monitored process are called assembly theory (Booth 2002). Through studding interactions such as competition, mutualism and

physical responses to the environment (Wilson 1999) researchers have the ability to predict what species will thrive under which conditions. This allows for those performing the restoration to create a more productive ecosystem through plating (Booth 2002). Assembling plants with certain traits may be harmful to others; it is necessary to be aware of these traits when assembling a system from scratch (Booth 2002). By using the assembly theory researchers are able to achieve a higher productivity and maintain that productivity in an ecosystem compared to those where assembly theory has not been used (Silvertown 2001). Assembly theory can be a useful tool for restoration ecologists when strategizing a community layout, however, it is good to realize the downfalls of any theory (Booth 2002). For many researchers assembly theory is taken too literally and there is often disappointment when the restoration is not a success (Wilson 1999). Planning and knowledge of the ecosystem and its dynamic will lead to a successful restoration using assembly theory (Wilson 1999).
It is not possible in the case of the Scarborough Outdoor Education School pond to use assembly theory because of the lack of data on the site and the size of the overall system. The site being rehabilitated is less than 2 acers with little data collecected on the dynamics of the site in the pereperation time for this design. There is a great deal of seeding and development of vegetation around the pond that has happened naturally over the past thirty years. It is essential to plant and enhance the already existing ecosystem with vegetation varieties that naturally occur and will serve the purpose of bank retention and restoration of the riparian areas. Assembly will not take place as a garden would but will not be as random as may occur in nature. Assembly rules will be taken into account when selecting species and their placement. The design of the planting area has been laid out in this pattern to make the pond as easily accessible as possible while planting with the desired native species to re-vegetate the area.
The design is as shown in Figure One, located at the end of text.
Planting for the Purpose of Bank Retention Planting is often necessary in wetland restoration because dominant
native vegetation does not naturally or effectively spread into newly restored areas; assistance is necessary in these cases (Zentner 2003). Stream and water body banks are difficult to plant to create the look and functioning of natural spread of vegetation because of erosion (Zentner 2003). Planting of native grasses and other riparian species in this area will decrease the risk of erosion and increase faunal habitat. Planting of native species directly after a soil disturbance can reduce the amount of non-native invasion of vegetation directly after restoration (Zentner 2003); if native species are present there is a greater probability that these species will dominate these areas. The disturbance in the case of the pond would be the bank reconstruction at the north end of the pond. The seeds will be planted in early April 2008 after heavy rains; plugs and other vegetation will follow (Environment Canada 1996). After seeds have been planted the area will

be flagged off with stakes and flagging tape to ensure that there is not foot traffic through planted areas.
Plug Planting Plug planting is the most effective ways of planting to ensure that the vegetation you are planting will grow into maturity. Plugs are small pre-rooted and potted plants of any variety that are sold from many local distributors (Environment Canada 1996). Plugs are often the choice for restoration projects because of their ability to show instant results. Benefits of plug planting include: pre-rooting of vegetation, instant results are shown; less maintenance is required than other planting procedures (Environment Canada 1996). Disadvantages include: price of plugs, typically ten times as much as their counterparts in seed, loss of plugs means a loss of a great deal more money than their counterpart and plugs are typically vulnerable to herbivores (Zentner 2003).
Plug sizes vary greatly depending upon the species desired, the area in which they are being planted and the tolerance of the species (Zentner 2003). It is crucial to choose the proper size and variety of plug for the specific restoration (Zentner 2003), this will cut down on restoration cost as well as ensure maximum results of the species being planted. There are no definitive studies that show the proper size plug to uses for specific restoration needs (Zentner 2003). The choice is that of the ecologist running the restoration and their discretion. Planting with plugs alone can make for a costly restoration, however when mixed with other restoration techniques can be cost effective and show initial results (Zentner 2003). For this restoration plugs will be used as the primary re-vegetation source because of their quick turnover and ability to show instant results.
Table 2: Plug Sizing Table Available sized of plugs for restoration and landscaping purposes (Acorus Restoration 2008). Unit Measurements Description Plug 1.25 cm x 1.25 cm x 8.5
cm, pots • Small plug pots
Rose Pot 5.5 cm x 5.5 cm x 8.5 cm, pots
• Slightly larger and more robust than a plug
Tree Band 8.5 cm x 8.5 cm x 17 cm, pots
• Small shrub pail • Typically woody
shrubs or larger flora
4.55 L Pail 17 cm diameter x 20 cm deep large pails
• Smaller trees and larger shrubs

The plugs will be planted in the desired location according to the site plan about 16 cm apart, or to leave about 5-10 cm between full crown growth, so as to maximize root growth and decrease competition (Huddleston 2004). It was shown through studies on grass plugs by Huddleson et al. (2004), that when grasses are planted at densities of 16 cm apart, they perform at their most productive levels with the least amount of die off. High planting densities are often associated with failure of crop due to lack of space for root structures to expand, failure to re-seed as well as increased nutrient competition (Otsamo 2002). Manipulating plant density in natural populations also affects individual success and therefore affecting the entire populations success (Rao 2003). There have not been studies on the effects of proximity to native neighbors on planting success in a restoration setting, because of these results suggested planting density set out by Huddleston (2004) will be used as a reference for planting. Planting parameters will be adjusted for the individual crown diameter of each species planted to allow for proper planting densities for all species.
Seeding There are both benefits and limitations to using sees as main source of re-growth planting directly after restoration. Benefits to seeding include: cost effective, ease of planting, and the numerous seed varieties (Weiher 2003). Limitations to seeding include: site preparation, low growth within first year after seeding, the possibility of invasive species, and maintenance involved in initial planting and growth (Weiher 2003). Seeding is considered to be the most effective for producing diverse communities with rich species densities; this adds to the popularity of this method of planting (Weiher 2003). Site preparation for seeding is necessary in order to maximize success of results. Soil preparation must first occur through being roughed by plowing or heavy raking to ensure that the seeds set into a bed of soil. In this restoration heavy raking will be used. It is recommended that the ground be raked to expose 10 cm of soil in the planting areas (Weiher 2003). These guidelines will be followed for the purpose of this restoration. Seeds should be distributed at a rate of 1.76 g/m2 (Weiher 2003); this density will allow for a ratio of seed success to be greater that than of seed failure. Seeds should be planted during warm spring weather after a significant period of rain to ensure that there is proper moisture in the soil (Weiher 2003). Seed for this restoration will be hand planted and lightly raked. Seeds, seeds for the purpose of this restoration will be used as a secondary source of re-vegetation, relying on plugs as the primary source.
Transplanting Transplanting will be done to reduce cost; most plants can be transplanted rather than purchased for the purposes of this restoration. Planting pre-rooted vegetation or plugs give an advantage to these species as they are already developed and have a better chance of survival in newly disturbed areas (Zentner 2003). The majority of plants that will be transplanted will be the

emergent species. Emergent species are typically more costly than other types of plants and are virtually impossible to seed (Diagle 1996). Transplants will happen from local donor wetlands on the SOES property to ensure that the species are both native and local. Transplants from local wetlands will be removed in a ‘checker board’ pattern when more than one of the species is being transplanted from the same area. This, ‘checker board’ pattern, will allow for native vegetation to fill in gaps made by removal of species from the donor site in a natural seamless fashion (Mansell 1998). Vegetation will be selected carefully to ensure that rare or significant species are not being transplanted or disturbed in the process of transplanting others. Species will be pulled by lower stalk to remove them from substrate or soil if appropriate, or dug with a spade taking special attention with the root structure where necessary (Mansell 1998). Species being transplanted will remain out of water and soil no longer than absolutely necessary to reduce stress on specimens and will be planted at the same level of submergence as they were removed from in their donor wetland (Mansell 1998). The majority of riparian species will be transplanted to ease both establishment time and cost of planting.
Shrubs will also be transplanted including alders (Alnus glutinosa) and willow (Salix alba) species from an adjacent ecosystem stream banks. Transplanting will take place with the cuttings collected from donor species in early April 2008 to allow for the rooting to take place promptly afterward (Knighton 1981). Cuttings will be approximately twenty centimeters in length when removed from the donor plant. Donor species will be rooted in outdoor pots for the first month and then transplanted into soil for most successful results (Knighton, 1981). Transplants should be grown in average outdoor temperatures between 2o C and 4o C and kept out of frost conditions, when rooted plants reach approximately 50 cm tall they will be planted in moist conditions and monitored for the first two weeks after planting to ensure that growth continues (Knighton 1981). Planting of rooted species will take place between May 2008 and June 2008 depending on growth of the individual plants. Alders and willows are good candidates for this type of transplanting due to their intensive, fast growing and robust root crown (Knighton 1981). Features such as these make this type of rooting and transplanting a cost effective and hearty method of planting.
Vegetation Lists / Charts
Trees and Shrubs The Scarborough Outdoor Education School property falls under zone twenty-eight of the Tree Seed Zones of Southern Ontario, as referenced from the Ontario Ministry of Natural Resources (1996). The trees chosen will be in accordance with both the tree zone in which SOES sits as well as the Society for Ecological Restoration Ontario’s native plant guidelines (2006). All species identification and fieldwork completed by K. Wakeling (2006 -2008), charts were complied by A. Hood and K. Wakeling (2007) and later modified by K. Wakeling (2008).

Table 3: Existing Shrubs and Trees and Those Suggested for Planting Common Name Latin Name Use Black Spruce Picea mariana Anchors bank and provides a buffer between
pond and road on the western side, seeds eaten by squirrels and some birds
White Cedar Thuja occidentalis Attracts native bird species, anchors bank and provides a buffer between pond and road on the western side
White Birch Betula papyrifera
Anchors bank and provides a buffer between pond and road on the western side
Pussy Willow Salix discolor Anchors bank, provides mid height animal habitat
Eastern White Pine Pinus strobus (I know I misspell this too)
Habitat for native bird species, provides habitat for small and large mammals
Speckled Alder Alnus incana spp. rugosa Bank stabilization, provides habitat for birds, provides mid height riparian habitat
Silky Dogwood Cornus amomum Anchors bank, provides habitat for birds and mammals
Red Osier Dogwood
Cornus stolonifera Anchors bank, provides habitat for birds and mammals, berries excellent food source for birds
Ninebark Physocarpus opulifolius Provide habitat, flowers are insect and butterfly attractant, food source for deer
Common Elderberry
Sambucus canadensis Provide habitat for fauna, insect and butterfly attractant, berries food for birds
Acorus Restoration 2008
Table 4: Existing Grasses and Sedges and Those Suggested for Planting
Common Name Latin Name Use Canada Rush Juncus canadenisis Habitat creation, creates buffer between
terrestrial and aquatic boundaries Common Rush Juncus effuses Anchors bank and provides a buffer
between pond and road on the western side, provides dense habitat cover
Bottom Bush Celphalanthus occidentalis Anchors bank and provides a buffer between pond and foot traffic
Wool Grass Scirpus cyperinus Anchors bank, provides low height animal habitat
Soft Steam Bulrush Scirpus validus Habitat for native bird species, provides food and shelter for birds

Giant Bur Reed Sparganium eurycarpum Bank stabilization, provides habitat for birds, provides mid height riparian habitat
Bonset Eupatorium perfoliatum Anchors bank, provides habitat for birds and mammals
Canada Bluejoint Calamagrostis canadensis Anchors bank, seed feed for birds and small mammals, creates habitat
Canada Wild Rye Elymus canadensis Anchors bank, seed feed for birds and small mammals
Blue Lobelia Lobelia siphilitica Bank retention Switchgrass Panicum virgatum Seeds food for birds and low lying habitat
for small mammals, anchors bank Blue-eyed Grass Sisyrnchium montanum Habitat creation, bank retention
Acorus Restoration 2008
Table 5: Flowering and Low Lying Plants and Those Suggested for Planting Common Name Latin Name Use Canada Goldenrod Solidago canadensis Habitat for birds, astatically pleasing New England Aster Aster novae-angliae Attracts native bird and butterfly species,
anchors bank Frost Aster Aster pilosus Anchors bank and provides a buffer
between aquatic and terrestrial boundaries
Hairy Aster Aster pilosus Anchors bank, insect and butterfly attractant
Spotted Joe Pye Weed Euphatorium maculatum Anchors bank, provides low height animal habitat, aesthetically pleasing
Black Eyed Susan Rudbeckia hirta Bird and butterfly attractant, ascetically pleasing
Lance-Leaved Coreopsis
Coreopsis lanceolata Prolonged blooming period, butterfly attractant
Sleepy Catchfly Silene antirrhina Insect attractant, self- sowing Sneezeweed Helenium autumnale Insect attractant Water Plantain Alisma plantago-aquatica Aids in low level bank reconstruction Blue Vervain Verbena hastata Butterfly attractant Hoary Vervain Verbena stricta Butterfly and insect attractant, seeds
provide food for birds Yellow Giant Hyssop Agastache nepetoides Butterfly and insect attractant White Turtlehead Chelone glabra Butterfly attractant and food for butterfly
larva Cup Plant Silphium perfoliatum Food source for finches, attractant for
bees and butterflies Culver’s Root Veronicastrum virginicum Insect attractant and nectar source Cardinal Flower Lobelia cardinalis Butterfly and hummingbird attractant
Acorus Restoration 2008

Erosion and Bank Retention Shoreline retention is one of the major problems facing the pond. The
bank is quickly receding into a muddy slope with little stabilization from vegetation or protection; heavy erosion experienced by the adjacent driveway assists in this process. This area of the pond also receives heavy foot traffic from students. A bank retention plan, that both allows accessibility for students to the pond, as well as, creating a planting strategy to control further erosion in a more sustainable manner is necessary.
Bank Retention Structure A retention barrier of made of granite will be installed in order to support
the bank. In addition to the barrier woody shrubs and herbs will be planted to enhance filtration of future run off while preventing further erosion (Daigle 1996). Special attention will be taken during the creation of the retention structure as to not create a ‘hard’ bank, or one that would not meet the habitat needs of herptiles and other invertebrates in the pond ecosystem (Daigle 1996). A ‘soft’ bank will be created through aquatic and terrestrial planting as well as the addition of smaller rocks to create aquatic habitat (Daigle 1996). The Canadian Shield is the most prominent geological feature of the area making the choice of granite an appropriate local source for the creation of the retention structure (Daigle 1996). Granite will not change the hydrology of the pond as there is no drainage source at the north of the pond. The rock will compliment the surrounding landscape and provide a feature for students to explore the pond atop of avoiding the erosion of the bank that currently exists for those reasons. The granite will be chosen in pieces that are approximately 3 feet to 4 feet long and approximately 2 feet wide. The pieces of granite will be placed in a linear pattern with space left between each piece along the bank of the pond. The rock will extend around the entire north end of the pond and reach a distance of approximately one hundred feet. The rock should be no more than two pieces high, and should be placed to allow for natural growth between each unit. The rock will be installed June 2007 to allow for minimal disturbance to fauna and avoid breeding and hibernation periods (Daigle 1996). Silt barriers will be set to prevent mud from clouding and silt buildup in other areas of the pond.
The retention system will raise the bank an average of 0.7m (Wakeling 2007), initially creating a hard bank that will be softened through plantings and addition of smaller rocks scattered at the aquatic barrier of the retention system (Diagle 1996). It is necessary to build up sufficient organic materials through use of a retention system before seeds are laid to maximize seed growth potential (Zentner 2003). Aquatic vegetation such as pondweed (Potamogeton pectinatus), little duckweed (Lemna minor), and deep-water arrowhead (Sagittaria rigida) will be planted around the rocks to increase habitat and productivity in this area of the pond to soften the aquatic edge of the pond (Diagle 1996).

Soil Compaction Over the past years the areas surrounding and including the pond’s riparian zones have been highly degraded due to the effects of trampling. Due to increased use and increasing soil compaction of this restoration site measures need to be taken in order to mitigate these effects (Burden 1972). Trampling not only creates paths but can also lead to irreversible changes in soil function and vegetation growth (Leonard 1985). The large amount of traffic to the site makes it increasingly difficult to manage soil compaction on a regular basis. For this reason areas of the pond and its riparian boundaries will be sectioned into quarters and will be given a period of restricted traffic where students will be restricted from one area of the pond at a time cycling through the entire boundary of the pond. Signage will be posted to complement fenced off boundaries (Daigle 1996). This will allow for periods of regeneration and growth for the riparian plants and the soil to rebalance while the rest of the pond is used as classroom space (Daigle 1996). Teachers will be educated on the effects of trampling on wetland plants. Education about key issues, such as degradation due to the effects of trampling, has shown to be a positive contributor to change in actions (Daigle 1996). It is hoped that with this education a greater understanding will bring reduced foot traffic during high use seasons, such as the summer. The pond will be sectioned into four quadrants, northeast, northwest, southeast and southwest; these will be the quadrants in their rotation order. Quadrants will remain ‘out of bounds’ or restricted from foot traffic for two months at a time, during the peak seasons between March and October of each year, allowing for regeneration of vegetation. Quadrants will be fenced off with light mesh fencing to allow for animal transfer between fencing and pond. Signage will be posted to complement fencing.
Monitoring The majority of monitoring that will happen for this restoration will revolve around species monitoring of vegetation plantings and community monitoring of both animal and plant communities. Monitoring will consider both species richness and abundance, or number of individuals within the community boundaries. It is important to note, monitoring cannot always explain sudden population changes and should not be relied on to solve such occurrences as flux in these flora or fauna communities (Resetarits 1998).
Boundaries will be set individually to accommodate monitoring of individual species and species groupings. According to the Ecological Monitoring and Assessment Network (EMAN) it is important to ensure three things before monitoring: (1) identification of species groups that characterize the habitat within the monitoring area, (2) Avoid focusing on a single indicator species to determine the success or failure according to the monitoring practices (3) representative sub-habitats should also be quantitatively sampled (Finnamore 2001).

Quadrat Ground Cover Plot Monitoring Quadrat plot monitoring will take place to determine the success of planting, as well as, the plantings ability to maintain bank stabilization and adequate habitat. The quadrat method allows the user to define a fixed area, called a plot, within which plant characters can be measured (Haase 1997). Although the exact experimental design will determine where and how many samples are taken, the procedure always involves measuring plant characters of only those plants inside each quadrat (Haase 1997). The charters being measured for the purpose of this study will be vegetation community dynamics. Quadrat sampling usually attempts to define plant community characteristics for an area much larger than the actual area sampled (Vivian-Smith 1999). However, with good sampling strategies, multiple plots can give a good estimate of overall vegetative cover. Care must be taken to obtain samples that represent the entire habitat and that eliminate human bias (Huddleston 2004). This means employing an experimental design that ensures random placement of the frame or permanent quadrat, in this case determined randomly by the throwing of a stick. Power analysis was be used in order to determine sample size and number of quadrat plots that will be needed to accurately test the vegetation community (Statsoft 2003). Power analysis will ensure that the proper sample size is chose to avoid bias and over sampling (Statsoft 2003). A rectangular quadrat frame will be used to define the sampling area, although a quadrat may also be a permanently established area within a site and monitored over time (Hoag 2006). For the purpose of this study the quadrats will not be permanent. The species within the frame are used as the sampling population. From the sampling population the names of the species found are recorded and the frequency at which they are found, or the amount of one species that appears within the quadrat (Hoag 2006). The quadrats used at SOES will be 1 m2; this will add to both the ease and efficiency of monitoring. In accordance with power analysis preformed, 6 plots will be used in a randomized pattern around the pond’s aquatic and terrestrial boundaries (Murphy 2008). Plot boundaries will be surveyed and marked pre monitoring. Plots will be placed at random around the ponds perimeter ensuring that a variety of locations are chosen to encompass a large un-basis variety of vegetation. Plots will be randomly selected by tossing a stick from one location to the next along the boarder of the pond. When the stick lands the plot will be placed in this location. This process will continue until 6 plots have been established. Plots will be placed no more than 15 m from the ponds aquatic edge to ensure it is riparian vegetation that is being sampled rather than groomed lawn.
In order to determine how well the plants are establishing themselves, two procedures will be used. Since the sampling group is relatively small, firstly all species present within the quadrat will be identified and rate at which they occur within the quadrad will be recorded in a chart format. Species identification is paramount when monitoring vegetation plots; if vegetation is not accurately identified changes in data could produce skewed results (EMAN 2007). A biologist will be consulted with any unidentified or unknown species, with plant

samples as well as photographs for prompt proper identification. Digital photographs will be taken of each plot for reference purposes and will be attached to data collected at the end of each monitoring period. Then the relative health of the species will be recorded, with special notation as to whether or not the species are alive. This is important as then researchers have a record or overall species health; from this data alternate methods may be taken in the future which could include replanting of the species (Huddleston 2004). The relative cover of the quadrat will also be determined. This will be done approximately and in percentages to determine the density of each species plant cover, rocks and other abiotic components and should over time help to depict how the site is doing (EMAN 2007).
Quadrat plot monitoring can be done poorly if not complete under the leadership of a knowledgeable person (EMAN 2007), for this reason there will be a qualified person present at each monitoring period to ensure that all steps are followed correctly and diligently. For the purpose of this research the qualified person will be the researcher, kristy Wakeling , or an individual appointed by the researcher. Data logs for sampling will be uniform throughout the monitoring process to ensure that processes can be carried out and data can be recorded without confusion; every data log will be double checked for accuracy before data is logged (EMAN 2007).
Plot monitoring is only successful with accurate collection, storage and analyzing of data (EMAN 2007), without these vital steps, plot monitoring will not be a useful tool. For this restoration, a monitoring framework as been set in place, including a detailed monitoring handbook to ensure that monitoring and records are maintained. Management of data is equally as important as the actual collection of the data itself (EMAN 2007); therefore data will be stored securely in electronic files in the researchers care, as well as, electronically in the clients care. High school volunteers can easily carry out this type of monitoring and research as part of an environmental studies high school credit program, and SOES staff members will do the remainder of the monitoring. This will take place under the direction of the researcher as part of a community service and volunteer learning project in partnership with the high school.
Visual Estimation of Seeding Success Seed success will be visually estimated using a percentage of density in a
variety of randomized quadrats through the seeding areas. This is the most efficient way to estimate population densities in a relatively accurate manor (Weiher 2003). The goal of this type of monitoring is to determine how many of the desired seeded species have grown to maturity to effectively dominate the vegetation community of the system. This will also give a good estimate of how many less desirable and invasive species have established in this time frame. All species will be taken into account for monitoring purposes. Vegetation will be classified under three headings: desired, undesired and volunteer. Desired vegetation will be those species that were planted as a part of the seed mixes. Undesired will be invasive species or those that do not occur

naturally in central Ontario. Volunteer species will be those that were not planted as a direct result of a seed mix but are native to central Ontario (Weiher 2003).
Percentage density will be estimated using a model used by Weiher et al. (2003). The model ‘domain scale’ is as follows:
1 = Less than 10 percentage cover 2 = 10 – 25 percentage cover 3 = 25 – 50 percentage cover 5 = Greater than 75 percentage cover
The results of visually estimate cover will be recorded in chart form (see below table). The same chart format will be used on a yearly bases as an annual part of monitoring strategies. Results should be charted to be used as a visual aid.
Table 6: Percentage Cover of Seed Success This is a fictional example of the chart that will be used to monitor and record percentage of cover as a result of spring seeding. Type (Desired, Undesired, Volunteer)
Species Common Name Percentage Cover
Visual estimation monitoring will commence in September of 2008, 4 months after the initial seeding. This will allow for growth during the summer months and will give a more accurate depiction of community dynamics (Weiher, 2003).
Tree Monitoring When measuring tree status over a period of time, the two main features of the tree that will be considered are the crown and the steams for any defects that may have occurred (EMAN 2001). Monitoring the tree health of the tress planted as a direct result of this restoration as well as the trees existing before the restoration process will give a better overall view of the health of the system and the species of trees within it. Monitoring trees can also give an accurate overview of how global climate change has affected areas, as changes are seen over time in tree health and productivity (EMAN 2001). Trees will be chosen for monitoring, including all of those trees planted for restoration purposes as well as trees existing before restoration has occurred. These trees will remain the focus of monitoring practices in years to come.
Trees will be initially rated on their status. This will be the first determining factor in the tree health data sheet. The codes used for monitoring will be in accordance with the Environmental Monitoring and Assessment tree status outline as follows (EMAN 2001):

Tree Status
AS – alive standing AB – alive broken AL – alive leaning AF – alive fallen/prone AD – alive standing dead top DS – dead standing DB – dead broken DL – dead leaning DF – dead fallen/prone
Crown health will be determined using the NAMP and ARNEWS system of determining tree health as follows (EMAN 2001):
1. Healthy (0 -10% crown decline) 2. Light to Moderate Decline (20-50% dieback) 3. Sever Decline (More than 50% dieback) 4. Dead (100% crown dieback)
Results will be recoded on a tree health data sheet for future reference. Crown monitoring will take place in late July or early August, of each monitoring year, to ensure the crown is at peak to avoid inaccurate estimations (EMAN 2001). Photos will be taken of trees to compare with past and future data. Measurements will be taken of tree’s diameter at breast height (DbH = 1.3m) (EMAN 2001), on a yearly basis to determine the amount of growth assisting in determining the health of the tree population. Diameter at breast height of each tree will be recorded on to the tree health data sheet for each tree in question. Core samples will also be taken for those larger trees to determine their age if that data is not on record. Information will be recorded on the tree health data sheets and kept for future record. Core samples will be taken at breast height (1.3m) and taken once to determine initial age of the tree, diameter will be measured in monitoring to follow. Steams and defects will be monitored by a visual inspection of trees that have been selected for monitoring. Defects that will be assessed during monitoring include: browsing, snapping, disease or weather damage (EMAN 2001). Types of damage will be noted and recorded along with the degree of damaged caused to the tree because of the defect. Overall health of tree will also be visually inspected and commented on in the tree dada sheet. Steam defects will be monitored in accordance with the EMAN codes for monitoring (EMAN 2001) as follows:
Stem Defect Location Visually divide the stem in half horizontally and record the location using the

following codes: 1. lower stem 2. upper stem 3. stump or root collar 4. entire trunk (all of the above)
Stem Defect Type It is not necessary to identify the type of fungi on the stem, but when linked with location, it can indicate the type of decay. Enter the appropriate code: 1. Decay fungus, fruiting body 2. Seam or frost crack (dry) 3. Seam or frost crack (bleeding/wet) 4. Open wound 5. Closed wound 6. Canker 7. Insect damage (ants, wood borer) 8. Pruned (human activity) 9. Animal damage (wood pecker, beaver)
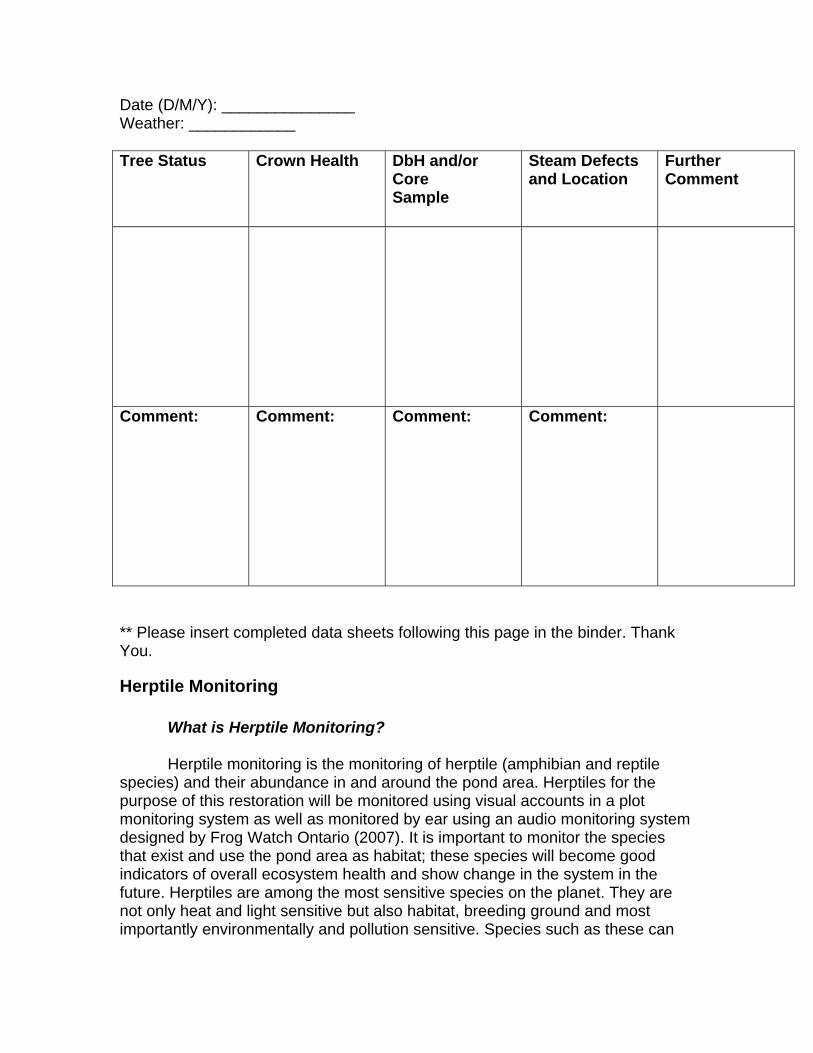
Table 7: Tree Monitoring Data Sheet Example of tree health data sheet that will be used for monitoring purposes.
Tree Monitoring Data Sheet Sample # _____________ Location ______________ Date (D/M/Y): _______________ Weather: ____________ Tree Status and Comment
Crown Health and Comment
DbH and/or Core and Comment
Steam Defects and Location
Further Comment
Monitoring of Herptile Species
Herptile species will be monitored as a way of determining if the pond’s aquatic habitat is sufficient for breeding and general sustainability of the herptile population. Frogs are an excellent indicator of environmental health in both the

immediate habitat and greater environment (Frogwatch 2007). Herptiles are an indicator of the quality of their ecosystem as they require freshwater and tolerate very few contaminants or pollutants (Frogwatch 2007). K. Wakeling will complete initial monitoring in the spring breeding season of 2008. Three, five-day sessions of monitoring will take place annually in the first week of April, May and June. Student groups assisted by a staff member from SOES, in the years to follow the completion of the restoration, will take over the roll of monitoring. A visual estimate of abundance of herptiles will be completed during pond studies and monitoring periods. Quadrats will be randomly selected around the edges of the pond stretching 1m2 with ½ meter at the ponds terrestrial edge and ½ meter into the ponds aquatic environment. A total of 6 quadrats will be monitored selected at random during the monitoring period in accordance with power analysis (Murphy, 2008). Five minutes will be spent examining each quadrat plot counting the number of species and their frequency within each plot. Results will be recorded in chart form and saved as electronic records. Table 8: Abundance and Distribution of Herptile Species in Monitoring Plots Plot # Date (Y/M/D) Time of Day Species Abundance
Reproductive success for monitoring plots should also be recorded. This will assist in determining the success of species in their larval stages for future records. Information such as larval success can also assist in determining if aquatic habitat is sufficient.
Frog monitoring will take place in accordance with the Ontario Frogwatch species identification and distribution and rating system. The Frogwatch Ontario abundance system is easy to use and effective in determining abundance and will be used for monitoring purposes for this reason. The abundance rating system according to Frogwatch Ontario, 2007 is as follows:
Abundance Ratings
1. No frogs or toads seen or heard � 2. Frog (s) or toads (s) seen but not heard � 3. Individuals can be counted, calls not overlapping � 4. Some individuals can be counted, other calls overlapping � 5. Full chorus, calls continuous and overlapping, individuals not distinguishable
Monitoring will take place at dusk; for best results on low wind nights
during the monitoring period for best results (Frogwatch 2007). One location will be established to monitor from on a consistent basis, this will allow for more accurate data (Frogwatch 2007). Once a monitoring location has been established a 5-minute time period will begin, where the data collector is required

to listen for individual species and their frequency according the abundance rating chart above. Frog and toad species are better monitored by call then by sight as it is more likely to hear a frog than it is to see one (Frogwatch 2007); this will ensure more accurate results of population dynamics. Results will be recorded and stored electronically and manually for future use in the following chart.
Table 9: Distribution Abundance of Frog Species Date (Y/M/D) Time of Day Frog Species Distribution
Rating Records of rare or unusual species will also be added to records when they are identified in or around the pond. Records will be kept of species that are unusual or appear to be new species around the pond and boundaries.
Table 10: Rare or Unusual Species Sightings Date (Y/M/D)
Time of Day
Species Location Special Features
Comments
Results of monitoring should be charted to show common trends among data. The results of collected data should be able to show population increase and decline throughout individual monitoring periods and also over a period of time (Seaburn 1998). These results can be usefully in determining the success of the restoration.
Monitoring Guidelines: For Teaching Purposes
The following section was designed as a monitoring guide for participants other than the researcher, K. Wakeling, to effectively carry out the responsibilities of monitoring this specific restoration. It is suggested that this document is viewed as a separate entity than the design itself. Some of the information in this section overlaps the previous monitoring section. These guidelines have been designed in order to make it easer for the chosen persons to monitor this project in the absence of the designer of the restoration. These guidelines have been set out to be a step-by-step program to successfully carry out the remainder of the monitoring work at the site; the Scarborough Outdoor Education School. Volunteers among the staff members at SOES have been elected to take on the job of monitoring the restoration. Full time staff members were chosen because of their accessibility to the pond and their previous history with the pond itself. High school groups will also be encouraged to volunteer in gathering and sorting data in the monitoring stage. This could also be used as a lesson in

ecological restoration for some of the students taking part; community service hours could also be given for those willing to participate in the gathering of information. It has been determined that it would be best to monitoring different elements of the restoration at different times and for that reason monitoring will be an annual assessment (EMAN 2001). Different elements will be monitored during different times of the year, for example, herptiles will be monitored April through June while trees will be monitored through July and August. This will happen to ensure that the best results possible are achieved when recording monitoring statistics. The required tools needed to carry out the remainder of the monitoring will be provided and stored at the Scarborough Outdoor Education School. Tools such as measuring equipment, the requirements for quadrat plots, data log sheets and binders as well as electronic copies of the work that has previously been complete for the purpose of the restoration. Monitoring will conclude after a five-year period at which time monitoring will be reviewed. At this time a different monitoring regime may be prescribed or at this time monitoring may end with ongoing maintenance taking place as required.
Tree Monitoring
What is Tree Monitoring?
Tree health monitoring is an essential monitoring process used to determine the over all health of the trees within an ecosystem. Monitoring the health of trees is crucial to the success of a restoration and the development of the surrounding system. Monitoring tree species can function as an early warning indicator of climate change, environmental health and the suitability of the system in which the trees are part of (EMAN 2001). Tree health monitoring involves taking yearly measurements of trees within a certain study area (area of the restoration) in order to gather information on their growth, canopy, girth, and performance since the date of their planting at the Scarborough Outdoor Education School. This information will then be logged for the future and made into graphs depicting the health of the trees planted for restoration purpose over a period of 5 or more years. These graphs in combination with information collected through monitoring other elements of the pond will give an overall picture of how the pond has progressed and determine the success of the restoration itself.
Monitoring for the purpose of this restoration will be done following the Environmental Monitoring and Assessment Network of Canada (EMAN) Guidelines for Monitoring Tree Health. The guidelines for this restoration will be set out in a simplified format from the original EMAN standards in order for the guidelines to be more appropriate for this restoration. Charts and instructions will be provided in order to make monitoring a simple process for beginners.

How to Monitor Trees Monitoring will take place between the first week in July and the last week in August on an annual basis. One set of data will be required for each tree in the monitoring area, with special attention focused on collecting and entire data set for each tree. It is important to be as thorough as possible to achieve the most accurate data. Data sheets provided would show what data needs to be collected. Monitoring should take place on a clear day void of precipitation; this will allow for the greatest possible accuracy in data collection.
**Please insert completed data collection sheets back into this binder directly after fieldwork. Data collection sheets should be placed under section 1.4 Collected Data Sheets.
Tree Identification It is important to first record the type of tree on which the data is being collected. Recording the type of tree is important, as different trees will mature differently and at much different rates. If the tree is not easily identified by eye, consult a tree identifications guide to be sure of the species before it is recorded.
Tree Status The data collector will be asked to record the tree status. The tree status refers to the state in which the tree is thriving at the date of each monitoring period; for this the EMAN Tree Health Status Chart will be used. The data collector will be asked to choose one of the following options that best describes the tree at the date of monitoring. The full description or code can be used for the purpose of the tree health data sheet. Tree Health Status EMAN, 2001:
Tree Status
AS – alive standing AB – alive broken AL – alive leaning AF – alive fallen/prone AD – alive standing dead top DS – dead standing DB – dead broken DL – dead leaning DF – dead fallen/prone
Crown Health

The Crown of the tree refers to the portion of the tree in which needles or leaves are present. The crown for monitoring purposes should also include those branches that do not have leaves or needles that should have needles or leaves (ie. living branches that are not producing leaves for an unknown reason). Lower branches on coniferous trees should not be counted as many evergreen species naturally prune lower branches to conserve energy for upper branches producing needles. Crown health will be measured according the EMAN (2001) standards for estimating crown health. The data collector should choose one of the following statements that best describes the crown of the tree at the date of data collection. EMAN Standards for Estimating Crown Health (2001)
1. Healthy (0 -10% crown decline) 2. Light to Moderate Decline (20-50% dieback) 3. Sever Decline (More than 50% dieback) 4. Dead (100% crown dieback)
Assessment of Steam Defect Steams and limbs of trees will also be monitored as a part of tree health monitoring. Data will only be collected on those trees in which damage has occurred. It is only necessary to do a ground visual inspection where the data collector remains at ground height to complete this stage of monitoring. The data collector will be asked to stand at a distance from the tree at which they can see the entire crown of the tree. The will then be asked to do a 360o inspection of all of the branches and steams that are visible. The data collector is looking for damage or irregularities in the growth of branches and steams. If an irregularity is spotted the data collector will then be asked to identify the irregularity and location of the irregularity using the EMAN Steam Defect Standards (2001) as follows:
Stem Defect Location Visually divide the stem in half horizontally and record the location using the following codes: 1. lower stem 2. upper stem 3. stump or root collar 4. entire trunk (all of the above)
Stem Defect Type

It is not necessary to identify the type of fungi on the stem, but when linked with location, it can indicate the type of decay. Enter the appropriate code: 1. Decay fungus, fruiting body 2. Seam or frost crack (dry) 3. Seam or frost crack (bleeding/wet) 4. Open wound 5. Closed wound 6. Canker 7. Insect damage (ants, wood borer) 8. Pruned (human activity) 9. Animal damage (wood pecker, beaver)
Diameter at Breast Height Diameter at breast height (Dbh) refers to the diameter of the tree at 1.3 meters from ground level. This measurement is important because it will show the rate of girth growth over a period of time, which can be a good indicator of overall health of the tree. The data collector should first measure the distance of 1.3 meters from the ground level up the trunk of the tree. The tree should then be marked either with flagging tape if working alone or with the help of another data collector. The diameter, or the distance around the tree, should then be measured from the distance of 1.3m, or the marked location, from the ground. Only the measurement of the diameter should be recorded on the data collection sheet.
Photographing the Tree
The data collector will be asked to take one photo of the tree showing the ground level to the top of the crown to be attached to each tree health data sheet at the completion of each annual monitoring period. This photo will be a visual record of the development of not only the tree itself but also the development of growth around the tree.
EQUIPMENT REQUIRED Tree Health Data Sheet and Pencil Tree Identification Materials (Books or By Eye) Measuring Tape Camera (Photos of the Tree) Flagging Tape
Tree Data Collection Sheet
Tree Data Sheet Sample # _____________ Location ______________
Date (D/M/Y): _______________ Weather: ____________ Tree Status Crown Health DbH and/or
Core Sample
Steam Defects and Location
Further Comment
Comment:
Comment: Comment: Comment:
** Please insert completed data sheets following this page in the binder. Thank You.
Herptile Monitoring
What is Herptile Monitoring?
Herptile monitoring is the monitoring of herptile (amphibian and reptile species) and their abundance in and around the pond area. Herptiles for the purpose of this restoration will be monitored using visual accounts in a plot monitoring system as well as monitored by ear using an audio monitoring system designed by Frog Watch Ontario (2007). It is important to monitor the species that exist and use the pond area as habitat; these species will become good indicators of overall ecosystem health and show change in the system in the future. Herptiles are among the most sensitive species on the planet. They are not only heat and light sensitive but also habitat, breeding ground and most importantly environmentally and pollution sensitive. Species such as these can

be good indicators of stress on an ecosystem over a short period of time or major change in environment over larger time frames. Monitoring herpitle species is especially important at the Scarborough Outdoor Education School because of the high use of the pond area. It will be important to this restoration to monitor the state of herptile populations before and during the restoration, as well as, after the restoration has been completed. This data will show whether improvements have been made to habitat to positively effect herptiles.
How to Monitor Herptiles Herptiles will be monitored using two types of monitoring strategies; visual plot monitoring and audio abundance monitoring. Because many herptiles are not sociable species it is rare to see a good estimate of the entire population by solely visually monitoring the area. For this reason audio monitoring will also be used to complement visual plot monitoring. Furthermore, it is even more difficult to monitor many turtle species as they are non-auditory and non-sociable, which makes turtle populations nearly impossible to accurately estimate. Turtles will be recorded by reputable sighting. The combination of these monitoring techniques will give a good data record of species sightings and abundance appropriate for this restoration.
Visual Plot Monitoring Visual plot monitoring is a monitoring system by which visual sighting of the species is required for data collection. Plots of 1m2 will be established in 6 locations spread out around the ponds boundary with ½ meter established on the ponds terrestrial boundary and ½ meter within the aquatic boundary of the pond.
These six plot locations should be evenly spread around the ponds boundary to the best of the data collectors ability. Once plots have been established they should be flagged off with flagging tape to ensure that the data collector(s) know the area in which they are observing. Once plots have been established and flagged the data collector will spend 5 minutes observing each plot. Monitoring should take place at dawn for best results. It is often preferred to set up and flag off plots the day before monitoring takes place as not to disturb species that are being viewed. The data collector will begin to approach the plot in a quiet manner as not to disturb species within the plot. The data collector must accurately identify the species within the boundaries of the plot and the frequency at which they occur (how many of each species). If a species cannot be positively be identified by a data collector the type of species should be noted (ie. 2 frogs unknown type). Identification guides are useful tools for data collectors to consult or carry while taking part in this type of monitoring. Once the data collector has completed 5 minutes of viewing for their designated plot, they should move on to the next and complete the same monitoring process for the reminder of the plots.

Plots should be monitored five days in a row in the months of April May and June of every year. It would be suggested that the first week of every month would be the optimal time for monitoring. Informal visual monitoring should continue through early spring into the fall months when herptiles begin to hibernate. Sightings of unusual species, rare occurrences and new patterns occurring in the pond should be noted and recorded and the date and time of sighting in the monitoring note book. Space will be provided after the data logs in this section to make comments and state sightings.
Auditory Monitoring Data collectors will use the Frogwatch Ontario auditory monitoring system for monitoring frogs in the pond area. The Frogwatch Ontario system is an auditory monitoring aid that allows data collectors to estimate population abundance based on the volume and frequency of frog calls heard at one time. Frog populations should be monitored at dusk on days with little or no wind if possible. This is because sound can be heavily muffled or indistinguishable with mid to high wind speeds. It is important to monitor in the at dusk because this is the time when many amphibian species are most active. At the most active times the data collector will be able to get the most accurate population estimation.
In order to monitor in this manner the Frogwatch System of abundance rating will be used based on the Frogwatch Ontario (2007) as follows:
Abundance Rating
1. No frogs or toads seen or heard � 2. Frog (s) or toads (s) seen but not heard � 3. Individuals can be counted, calls not overlapping � 4. Some individuals can be counted, other calls overlapping � 5. Full chorus, calls continuous and overlapping, individuals not distinguishable The data collector will establish a monitoring location near the pond area,
which will remain the same for the rest of the monitoring periods in order to establish data consistency. The data collector will spend a 5-minute time period listening for the sounds of both individual frog and toad species and also the frequency of abundance within the population. The data collected will be recorded onto a data sheet and stored for future use. Population estimates based on the Frogwatch Ontario system of auditory monitoring should be taken as only a guideline for how large a population could be. There is no way of telling for sure how many frogs are present at one time, however collecting this data can be helpful in creating a ruff estimate on population and population dynamics.

If data collectors do not feel confident identifying frog and toad species by ear a copy of the Frogwatch Ontario Auditory Field Guide (2004) will be attached to the monitoring package for reference.
Rare and Unusual Species Rare and unusual species or trends should be noted as a part of the monitoring process. This type of monitoring should continue as a year round process or any time that a species or unique population trend has been spotted. These species are particularly important to the monitoring process because they can be indicators of a healthy ecosystem or also indicators of stress on an ecosystem. These particular indicators should be watched carefully so that practices around the pond area can be adjusted to manage these factors. A photograph of the species or a photograph of the habitat that the species was observed in would also be a useful addition to the sighting. Documentation of where turtles are nesting is also important if possible. Species and occurrences that should be noted include:
- Turtles of any variety - Nesting Turtles - Nesting Birds - Unusual Birds or Birds that have not been seen before - Spikes in Amphibian Populations - Drastic drops in Amphibian Populations - Destroyed Habitat - Areas that need to be protected in order to protect a species - New species making use of the pond are - Treats to herptile species This is not an all-inclusive list and other sightings should also be recorded
in as much detail as possible. A chart will be provided at the end of this section for this purpose.
EQUIPMENT REQUIRED Frogwatch Ontario CD Amphibian and Reptile Field Guides for Ontario Camera
Future Work This restoration in the form of a pond rehabilitation is designed to be the
first step in restoring the Scarborough Outdoor Education School Duck Pond into a sustainable ecosystem with benefit of performing as an outdoor interactive classroom, is only the first step in a greater restoration goal. There are many other elements of this pond ecosystem that could be restored as an on going process of rehabilitating this site.
The project has been designed in such a way that additions could be made easily as well as improvements upon existing structure. This will be done at the discretion of the Scarborough Outdoor Education School. This project will

be monitored by K. Wakeling and logs will be kept to show work completed. As progress is made a journal will be recorded to show progression. At the completion of the first monitoring stage, September 2008, a companion paper will be written to chart monitoring progress and the successes of the project.
Acknowledgements This project could not have been made possible with out the generosity and encouragement of a number of sources. Thank you to my advisor and constant source of encouragement and guidance, Dr. Stephen Murphy. As an academic advisor his encouragement and guidance made this project possible, in the conceptual, design and implementation phases. The Scarborough Outdoor Education School has been a major support and contributor to this restoration project. Starting in 2007, Dave Boyce director of the Scarborough Outdoor Education School was instrumental in the initial stages of the design and implementation of the restoration; Len Elphick, the current director of SOES, has carried on this support. The Canadian Tree Fund provided financial support by means of a $2000.00 grant to go toward native plants and trees. Planting to the level in which the design called for would not be possible without the assistance of this grant. Figures Figure 1: Planting Design The following figure shows the estimated planting design for the restoration. Plants are subject to change based on plant availability.

Figure 2: Estimated Budget The following is an estimate of the budget for the design and rehabilitation work that will go into implementing this project.
This budget is a representation of the best estimation of cost for this restoration. Figures are prone to change and may be added upon as the restoration evolves. The stakeholder may also wish to drop costs by eliminating

certain features and has the ability to improve upon restoration by adding additional features to the restoration. The budget as stands is the best estimation of what this site-specific restoration will cost at this point. The costs indicated for this budget were calculated based on product and service prices as of January 2007. Table 4: Duck Pond Restoration Budget
Category Item Quantity Cost Use Salaries and Benefits
Kristy Wakeling n/a No salary (Volunteer)
Creation of plan, restoration work, planting and monitoring
SOES Staff n/a No salary (Volunteer)
Planting and monitoring
Students n/a No salary (Volunteer)
Planting and monitoring
Volunteers n/a No Salary (Volunteer)
Construction and Monitoring
Gary Groome Excavating
n/a Total Costs: $3400.00
Heavy Construction
Abiotic Features * Compost 2 tones n/a
-For plant growth - available on site
Large Rocks (Granite)
45 pieces
15 @ 1000.00 x 3 loads = $3000.00
- bank construction and support
Dead heads 4 4 @ total cost of $ 400.00
- creation of aquatic habitat - available on site -costs cover moving the logs into the pond
Top Soil 1 Load 1 Load = $ 350.00
- purchased through Gary Groome
Clean Fill n/a - salvaged from Site -Planting
Small Rocks 30 -50 n/a - available on site - aquatic habitat creation
Large White Pine Logs
2 n/a - available on site, salvaged from blow down tree

*Some Abiotic feature prices courtesy of Home Depot, Orillia, ON
Flora White Spruce 2 - 8 foot
trees 2 x 40.00= $80.00
-Sandill Nursery, Huntsville, Ontario
White Cedar 3 -1 gallon bundles
3 x 6.00= $18.00
-Acorus Restoration, Walsingham, Ontario
Red Cedar 3 – 1 gallon bundles
3 x 6.00= $18.00
-Acorus Restoration -also transplatable from onsite locatios
Ninebark 3 -1 gallon pots
3 x 6.00= $18.00
- Acorus Restoration, Walsingham, Ontario
Speckled Alder 7 – 1 gallon pail
7 x 6.00 = $42.00
- Acorus Restoration, Walsingham, Ontario
Elderberry Black 3 -1 gallon pots
3 x 6.00= $18.00
- Acorus Restoration, Walsingham, Ontario
Yellow Giant Hyssop
10 Units 10 x 3.50= $35.00
- Acorus Restoration, Walsingham, Ontario
Butterfly Milkweed 10 Units 10 x 3.50 = $35.00
- Acorus Restoration, Walsingham, Ontario
Blue Vervain
10 Units 10 x 3.50 =$35.00
- Acorus Restoration, Walsingham, Ontario
Red Osier Dog Wood
5 - 4 foot plants
5 x 6.00 = $30.00
- Acorus Restoration, Walsingham, Ontario
Joe Pye Weed
15 Units 15 x 2.50 =$37.50
- Acorus Restoration, Walsingham, Ontario
Hairy Aster 10 Units 10 x 2.50= $25.00
- Acorus Restoration, Walsingham, Ontario
New England Astor
1 Units 10 x 2.50 =$25.00
- Acorus Restoration, Walsingham, Ontario
Turtlehead 10 Units 10 x 2.50 = $25.00
- Acorus Restoration, Walsingham, Ontario
Canada Blue Joint
20 Units 20 x 2.50 =$50.00
- Acorus Restoration, Walsingham, Ontario
Bottle Bush Sedge
15 Units 15 x 2.50 = $ 37.50
- Acorus Restoration, Walsingham, Ontario
Coontail 20 Units 20 x 3.50 = - Acorus Restoration,

$70.00 Walsingham, Ontario Canada
Pondweed 15 Units 15 x 2.50 =
$ 37.50 - Acorus Restoration, Walsingham, Ontario
Canada Wild Rye 40 Units 40 x 1.25 =$ 50.00
- Acorus Restoration, Walsingham, Ontario
Canada Rush 15 Units 15 x 1.25 = $ 18.75
- Acorus Restoration, Walsingham, Ontario
Sneeze Weed
10 Units 10 x 2.50 =$25.00
- Acorus Restoration, Walsingham, Ontario
Water Plantain 18- Deep Plugs
n/a - transplanted from onsite locations *See Table 1 for Pond Species Uses
12 – deep plugs
n/a - already many on site
Hard-Stemmed Bulrush
12- Deep Plugs
n/a - transplanted from onsite locations
Pickeralweed 19-1 quart containers
n/a - transplanted from onsite locations
Floating Pondweed
5 -1 quart containers
n/a - transplanted from onsite locations
Cardinal Flower 5 - 1 quart containers
5 x 2.50 = $12.50
- Acorus Restoration, Walsingham, Ontario
White Water Lily 8 – 1 quart containers
n/a - transplanted from onsite locations
Common Duck Weed
1 – 1 quart jar
n/a - transplanted from onsite locations
Greater Duck Weed
1 - quart jar
n/a -transplanted from onsite locations
Woolgrass Bullrush
5 Units 5 x 2.50 = $12.50
- Acorus Restoration, Walsingham, Ontario
Linlees Aster 8- Deep Plugs
n/a - transplanted from onsite locations *See Table 2 for Butterfly Garden Species Uses
Black Eyed Susan 4 - 3”pots n/a - transplanted from on site locations
Dandelion 12 -Deep n/a - transplanted from onsite
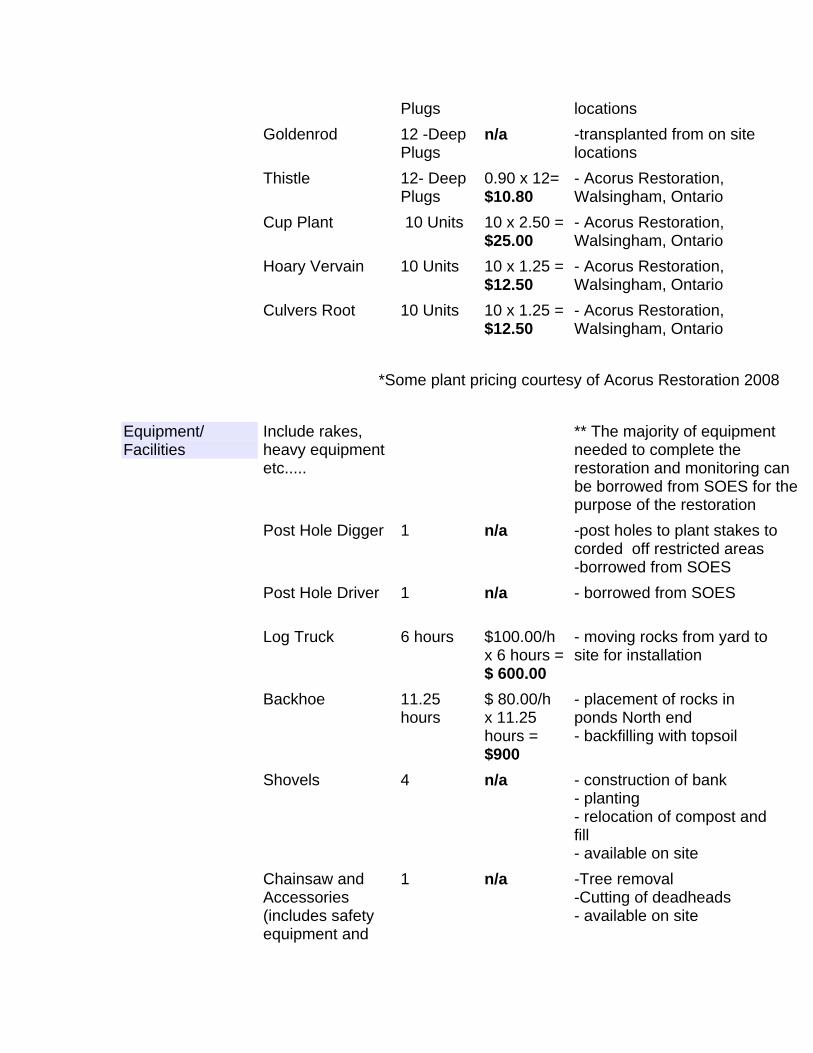
Plugs locations Goldenrod 12 -Deep
Plugs n/a -transplanted from on site
locations Thistle 12- Deep
Plugs 0.90 x 12= $10.80
- Acorus Restoration, Walsingham, Ontario
Cup Plant 10 Units 10 x 2.50 = $25.00
- Acorus Restoration, Walsingham, Ontario
Hoary Vervain 10 Units 10 x 1.25 = $12.50
- Acorus Restoration, Walsingham, Ontario
Culvers Root 10 Units 10 x 1.25 = $12.50
- Acorus Restoration, Walsingham, Ontario
*Some plant pricing courtesy of Acorus Restoration 2008
Equipment/ Facilities
Include rakes, heavy equipment etc.....
** The majority of equipment needed to complete the restoration and monitoring can be borrowed from SOES for the purpose of the restoration
Post Hole Digger
1 n/a -post holes to plant stakes to corded off restricted areas -borrowed from SOES
Post Hole Driver
1 n/a - borrowed from SOES
Log Truck 6 hours $100.00/h x 6 hours = $ 600.00
- moving rocks from yard to site for installation
Backhoe 11.25 hours
$ 80.00/h x 11.25 hours = $900
- placement of rocks in ponds North end - backfilling with topsoil
Shovels
4 n/a - construction of bank - planting - relocation of compost and fill - available on site
Chainsaw and Accessories (includes safety equipment and
1 n/a -Tree removal -Cutting of deadheads - available on site
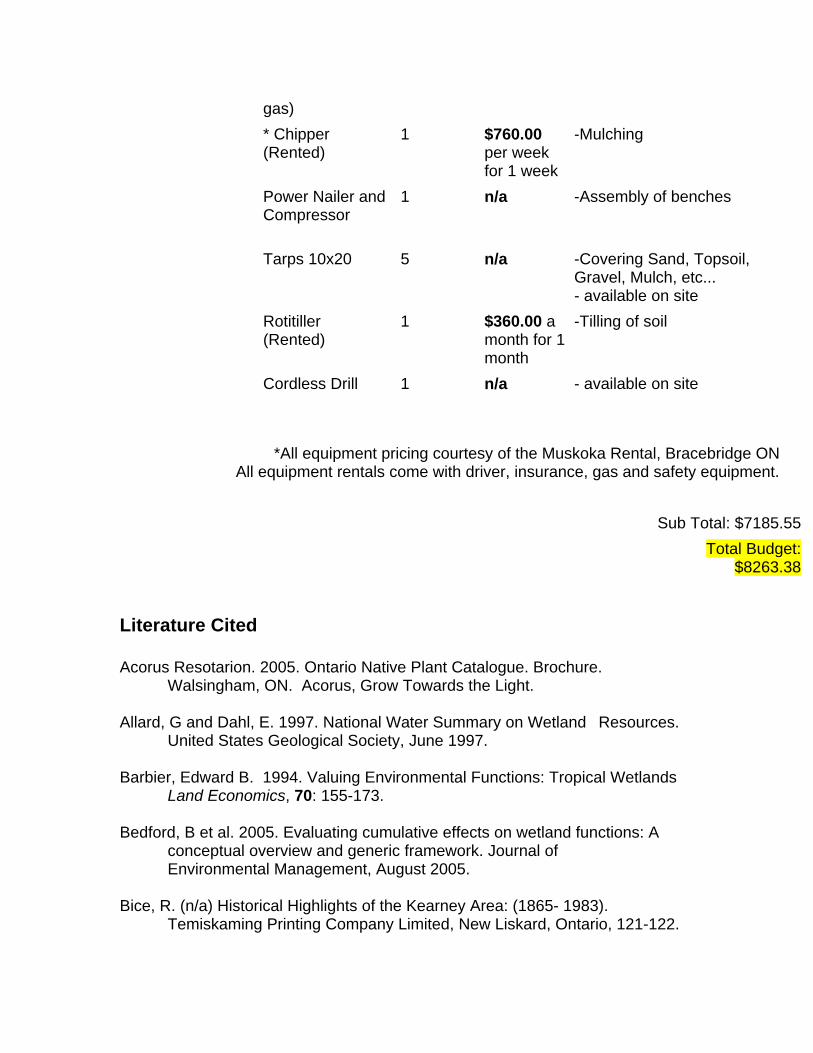
gas) * Chipper
(Rented) 1 $760.00
per week for 1 week
-Mulching
Power Nailer and Compressor
1 n/a -Assembly of benches
Tarps 10x20
5 n/a -Covering Sand, Topsoil, Gravel, Mulch, etc... - available on site
Rotitiller (Rented)
1 $360.00 a month for 1 month
-Tilling of soil
Cordless Drill
1 n/a - available on site
*All equipment pricing courtesy of the Muskoka Rental, Bracebridge ON
All equipment rentals come with driver, insurance, gas and safety equipment.
Sub Total: $7185.55 Total Budget:
$8263.38
Literature Cited Acorus Resotarion. 2005. Ontario Native Plant Catalogue. Brochure.
Walsingham, ON. Acorus, Grow Towards the Light. Allard, G and Dahl, E. 1997. National Water Summary on Wetland Resources. United States Geological Society, June 1997. Barbier, Edward B. 1994. Valuing Environmental Functions: Tropical Wetlands Land Economics, 70: 155-173. Bedford, B et al. 2005. Evaluating cumulative effects on wetland functions: A conceptual overview and generic framework. Journal of Environmental Management, August 2005. Bice, R. (n/a) Historical Highlights of the Kearney Area: (1865- 1983).
Temiskaming Printing Company Limited, New Liskard, Ontario, 121-122.

Bolen, A. 2003. A Survey of Amphibians and Reptiles on a 318-Acer Dry Grassland Property in La Crosse County, Wisconsin. UW-L Undergraduate Research VI.
Booth, B.D., and Swanton, C.J. 2002. Assembly Theory Applied to Weed
Communities. Weed Science 50: 2 -13. Burden, R.F., Randerson, P.F. 1972. Quantitative Studies of Human Trampling
on Vegetation as an aid to the Management of Semi-Natural Areas. Journal of Applied Ecology 9: 439-457.
Camp Kearney. 2007. Camp Kearney: Scarborough Outdoor Education School.
http://www.soes.vianet.ca/, Retrieved: March 8, 2007. Daigle, J. and Havinga, D. 1996. Restoring Nature’s Place: A Guide to
Naturalizing Ontario’s Parks and Greenspace. Canadian Catloguing. Shomberg, Ontario.
D’Eon, S.P. et al. 1994. Canada’s National Forest Health Monitoring Plot
Network Manual on Establishment and Monitoring (Revised). Petawawa National Forestry Institute. Informal Report P1-X117.
Ducks Unlimited Canada. 2007. Wetland and Waterfowl Conservation.
http://www.ducks.ca/conserve/wetland_values/index.html, Retrieved: September 29, 2007.
Ducks Unlimited Canada. 2004. Natural Values: The Importance of Wetland and
Upland Conservation Practices in Watershed Management. http://www.ducks.ca/conserve/wetland_values/pdf/nvalue.pdf, Retrieved: September 29, 2007.
Durner, E. F. 1999. Winter Greenhouse Strawberry Production using
Conditioned Plug Plants. Journal of Horticultural Science 34: 615-616. EMAN. 2001. Environmental Monitoring and Assessment Network: Tree Health
Monitoring Protocol. http://www.eman-rese.ca/eman/ecotools/protocols/terrestrial/tree_health/intro.html, Retrieved: November 12, 2007.
Enrenfeld, J. G., Toth, L. A. 1997. Restoration Ecology and the Ecosystems Perspective. Journal of Society for Ecological Restoration International, 5:
307. Finnamore, A.T. et al. 2001. EMAN: Sampling Protocol. Ecological Monitoring
and Assessment Network, Environment Canada. http://www.eman-rese.ca/eman/ecotools/protocols/terrestrial/arthropods/sampling.html, Retrieved: November 11, 2007.
Flank, D.A., Palmer, and M.E., Zedler, J.B. 2006. Foundations of Restoration
Ecology. Island Press; New York, 2006. Frogwatch Ontario. 2007. Ontario Frogwatch: Why Monitor Frogs.
http://www.naturewatch.ca/english/frogwatch/on/monitor.html, Retrieved: October 20, 2007.
Geo-Marine Inc. 2000. Additional Biological Survey Reports: El Paso –La
Cruses Regional Sustainable Water Project Environmental Impact Statement. http://www.nm-txwatercomm.org/library/EIS-Word%20and%20Excel%20files/BioTech%20Excel%20and%20Word%20files/BIOapp_11-a.doc, Retrieved: February 4, 2007.
Gosselink, J. G. and Mitcsh, W. J. 2005. The Value of Wetlands: Importance of Scale and Landscape Setting. Journal of Environmental Economics, School of Natural Resources, Ohio State University.
Haase, P. 1997. Spatial Pattern Analysis in Ecology Based on Ripley’s K-
Function: Introduction and Methods of Edge Correction. Journal of Vegetation Science 6: 575-589.
Hawke, D. 1994. Wetlands. Stoddart, Boston Press, Erin Ontario.
Higgs, E. 2005. The Two-Culture Problem: Ecological Restoration and the
Integration of Knowledge. Restoration Ecology; 13:159-164.
Hoag, C.J. 2000. Harvesting, Propagating and Planting Wetland Plants. Riparian/Wetland Project Information Series. No 14. Interagency Riparian/Wetland Plant Development Project, USDA, Plant Materials Center, Aberdeen, ID 83201.
Hobbs, R. and Harris, A. 2001. Restoration Ecology: Repairing the Earth’s
Ecosystems in the New Millennium. Restoration Ecology 9: 239-246. Hood, A. 2006. Field Notes: ERS 382 Environmental Field Monitoring on the
Niagra Peninsula. Action, Ontario, August 2006. Huddleston, Russel T. and Young, T. (2004.) Spacing and Competition
Between Planted Grass Plugs and Preexisting Perennial Grasses in a Restoration Site in Oregon. Journal of the Society for Ecological Restoration International12: 546.

Kentula, M. et al. 1992. WETLANDS: An Approach to Improving Decision
Making in Wetland Restoration and Creation. Island Press. Kipp, S., Callaway, C. 2003. On the Living Edge: Your Handbook to Waterfront
Living. Rouge Valley Conservation Authority, Toronto. Knighton, D. 1981. Growth Response of Speckled Alder and Willow to Depth
Flooding. USDA Forest Services, Minnesota. Leonard, R.E., et al. 1985. United States Department of Forestry and
Agriculture: Hiker Trampling Impacts on Eastern Forests. Research Paper NE-555.
North American Sugar Maple Decline Project: Organization and Field Methods.
Gen. Tech. Rep. NE-154. Radnor, P.A.: U.S. Department of Agriculture, Forest Service, Northeastern Forest Experimental Station.
Mansell, D., et al. 1998. Temperate Wetlands Restoration Guidelines. Ontario
Ministry of Natural Resources, Barrie, Ont. McArthur, R.H. 1972. Geographical Ecology: Patterns in Distribution of Species.
NY: Harper and Rowe. Murphy, S.D. 2008. Personal Communication: Power Analysis. University of
Waterloo, Waterloo, Ontario. Muskoka Timber Mills Ltd. 2007. Timber Products.
http://www.muskokatimber.com/location/contact.htm, Retrieved: March 13, 2007.
WILD CANADA. 2006. Native Plants: Catalogue and Seed Guide.
Brochure. Collingwood, ON. Wild Canada. Native Plants and Seeds: Wildflowers and Grasses; Landscape Design and
Installation. 2004. Brochure. Westfield, WI, USA. Prairie Nursery. Native Plants and Seed for Wetlands, Woodlands and Prairies. (2006). Brochure.
Breslau, ON. Native Plant Source Native Plant Guide. 2006. Brochure. Minto, Ontario. Wild Things Plant Farm. OSC. 2007. Ontario Seed Company LTD. A Natural Focus for Native Seeds
Catalogue. Waterloo, Ontario. Palmer, M.A. et al. 2005. Standards for Ecologically Successful River

Restoration. Journal of Applied Ecology 42: 208-217. Patterson, J.H. 1990. Sustaining Wetlands Forum International Challenge for the
1990’s. Ottawa Ontario. Restarits, W.J. et al. 1998. Experimental Ecology. Oxford University Press. Roberts-Pinchette, P. 1999. Terrestrial Vegetation Biodiversity Monitoring
Protocols. EMAN Occasional Paper Series. Report No. 9. Sajan R. 2000. Community Based Tree Health Monitoring. Draft Unpublished
Manuscript. Canada Forest Service, Sault St. Marie, Ontario. Seaburn, C. et al. 1998. Volunteer/School Monitoring of Amphibians Project
Frogweb. EMAN Article 1998. www.eman-rese.ca, Retrieved: October 20, 2007.
Silvertown, J.W., Antonovics, J. 2001. Integrating Ecology and Evolution in a Spatial Context: The 14th Special Context. Cambridge University Press.
Society for Ecological Restoration International. 2007. SER International Primer
on Ecological Restoration. http://www.ser.org/content/ecological_restoration_primer.asp#3 Retrieved: January 18, 2008.
Society for Ecological Restoration Ontario. 2006. 2007 -2008 Native Plant
Resource Guide Ontario. Printed Resource. SOES. 2007. Scarborough Outdoor Education School.
http://www.soes.vianet.ca/images/SOES%20road%20map.pdf, Retrieved: March 8, 2007.
SOES Map. 1996. Scarborough Outdoor Education School: Site Map. Scale
1:1500, updated, 1996, Chrismar Mapping Services Inc, Uxbridge Ont. Statsoft. 2003. Statsoft: Power Analysis.
http://www.statsoft.com/textbook/stpowan.html, Retrieved: January 23, 2008.
Town of Kearney. 2007. Ontario’s Biggest Little Town. From: http://www.townofkearney.com/, Retrieved: March 8, 2007. USDA Forest Service. 1997. Black Hills National Forest Plan of Land and
Resource Management. http://www.fs.fed.us/, Retrieved: January 18, 2008.
Vivian-Smith, G. and Handel, S. N. 1999. Freshwater wetland restoration of an

abandoned sand mine: Seed bank recruitment dynamics and plant colonization. Wetlands 16: 185-196.
Wakeling, K. 2006. Field Notes: Scarborough Outdoor Education School Pond.
Scarborough Outdoor Education School, Kearney, Ontario, October 12, 2006.
Weiher, E., et al. 2003. Experimental Restoration of Lake Shoreland in Western
Wisconsin. Ecological Restoration 22: 186- 190. Wilson, J.B. 1999. Ecological Assembly Rules: Perspectives, Advances,
Retreats. Cambridge Press. Zedler, J. 2007. Success: An Unclear Subjective Discripter of Restoration
Outcomes. Ecological Restoration 25: 162-168. Zentner, J, et al. 2003. Wetland and Riparian Woodland Costs. Ecological
Restoration 21: 166-174.