dublin city university video track experiments for · pdf filedublin city university video...
TRANSCRIPT
Dublin City University Video Track Experiments for TREC 2003
Paul Browne, Csaba Czirjek, Georgina Gaughan, Cathal Gurrin, Gareth J.F. Jones, Hyowon Lee, SeánMarlow, Kieran Mc Donald, Noel Murphy, Noel E. O’Connor, Neil O’Hare, Alan F. Smeaton, Jiamin Ye
Centre for Digital Video Processing, Dublin City University, Glasnevin, Dublin 9, [email protected]
AbstractIn this paper, we describe our experiments for both the News Story Segmentation task and Interactive Search task forTRECVID 2003. Our News Story Segmentation task involved the use of a Support Vector Machine (SVM) to combineevidence from audio-visual analysis tools in order to generate a listing of news stories from a given news programme. OurSearch task experiment compared a video retrieval system based on text, image and relevance feedback with a text-onlyvideo retrieval system in order to identify which was more effective. In order to do so we developed two variations of ourFíschlár video retrieval system and conducted user testing in a controlled lab environment. In this paper we outline ourwork on both of these two tasks.
1 IntroductionThe Centre for Digital Video Processing (CDVP) participated in the TRECVID 2003 Story Segmentation and Search tasks.For the Story Segmentation task (see Section 2) we trained a Support Vector Machine (SVM) using 10 hours of providedtraining data. The inputs to the SVM are the outputs from our own set of video analysis techniques (face detection, shotclustering, shot length heuristics, and visual activity measure). For the Search task (see Section 3) we developed twoversions of an interactive video retrieval system that allow users to search and browse the 60 hours of Search test collectioncontent using text-only queries and text/image queries incorporating a ‘more like this’ feedback feature.
2 News Story Segmentation TaskIn our work on News Story Segmentation, we exploit the structure of news broadcasts in order to detect story boundaries.We run a number of analysis tools to extract high-level features describing each shot in a video sequence, and then wecombine these features using an SVM. The resulting trained SVM classifier can be used to detect the anchorperson shotsthat signal the beginning of new stories within a broadcast.
2.1 Our Approach to News Story SegmentationA TV news broadcast has a structure that is generally adhered to by broadcasters. Each story within a broadcast will beginwith a leading shot of the anchorperson introducing the new story. This anchorperson shot is usually followed by a reportwith more details on the story. The anchorperson shots are typically filmed in a studio location, and within a singlebroadcast they will be shot from the same camera set-up, meaning that they will tend to look very similar to each other.Our approach is to detect these anchorperson shots by combining the results of a number of analysis tools. We thensegment the broadcast into news stories based in this analysis.
2.2 Audio-Visual AnalysisThe first stage of our news story segmentation approach is to segment each news broadcast into individual shots. For theTRECVID 2003 story segmentation task, we used the common shot boundaries provided for the search task by the CLIPS-IMAG group. The next stage is to analyse each shot in a broadcast to extract a number of features representing each shot.These analysis tools are now described.
2.2.1 Shot ClusteringThe CDVP in DCU has previously developed a shot clustering approach for detecting the anchorperson shots in a newsprogramme (O’Connor et al., 2001). This method works by automatically grouping together shots that are visually similarto each other. Since the anchorperson shots in a news broadcast are very similar to each other, they should be placed in thesame group by this process. We can then apply some heuristics to distinguish the anchorperson groups from the non-anchorperson groups.
2.2.1.1 The Shot Clustering ProcessThe clustering process groups shots together based on the similarity of their colour composition and the temporal distancebetween them. The keyframe for each shot is represented by a 192-bin colour histogram, and the cosine similarity measure

is used to calculate a distance between keyframes. This distance is then weighted by the temporal distance between theshots. A candidate cluster for each shot is then chosen as the cluster that its keyframe is closest to. The shot is notimmediately assigned to this cluster, however, but instead a thresholding process is applied. If a shot is close enough to itscandidate cluster, it is assigned to that cluster, otherwise a new cluster is formed for which the new shot is the onlymember. At the start of the clustering process this will happen frequently, but as the process proceeds more shots will beassigned to existing groups.
2.2.1.2 Anchorperson Shot Identification Using HeuristicsThis shot clustering process will create a number of shot groupings based on colour similarity and temporal distance. Theanchorperson shots should be grouped together by this process, so the next task is to identify which of the clusters containanchorperson shots. The following heuristic conditions must be met for a group to be considered an anchorperson group:• The temporal range of the shots must be higher than a pre-determined threshold. This value is calculated as the
number of shots between the first and the last shot in the group. Anchorperson shots tend to be spread throughout abroadcast, so shots that are very similar visually but occur only very close together in the broadcast should be rejected.
• The group similarity mean should be higher than a very high pre-determined threshold. This is because anchorpersonshots are extremely similar to each other, since they feature a relatively stationary anchorperson against what willmostly be a static background.
• The mean anchorperson shot length should be longer than a minimum threshold. This is because anchorperson shotsare generally quite long in comparison with other video content, rarely lasting less than five seconds.
2.2.2 Face DetectionThe CDVP has also developed an approach to automatically detect faces in digital video sequences (Czirjek et al., 2003).Since any anchorperson shots in a news programme will always contain shots of faces, the output from this algorithm willprovide valuable information for our news segmentation system. This section summarises this approach, which uses acoarse-to-fine approach to extract candidate areas within an image. These candidate areas are then classified usingprincipal component analysis (PCA).
2.2.2.1 Extraction of Candidate RegionsThe first step in the face detection process involves colour analysis of the images. Since the colour of skin falls within arelatively narrow band of the colour spectrum, it possible to detect skin-like pixels. Once identified, morphologicalfiltering is used to obtain smoothed homogeneous areas of connected pixels. Shape and size heuristics are then used toremove some of these candidate regions. Any candidate regions remaining after this pre-processing are extracted, rescaledto 64 x 64 pixels, and then undergo a principal component analysis process.
2.2.2.2 Principal Component AnalysisThe principal component analysis process examines any candidate regions and will decide if a candidate region is a humanface. This approach uses a number of training images, each of which is represented as a vector. A set of basis vectorsspanning an optimal subspace of the input space is determined such that the mean square error between the projection ofthe training images onto this subspace and the original training images is minimised. This means that these training imagescan be encoded in this subspace, or feature space, and then reconstructed with minimal error using these basis vectors,which are also sometimes referred to as eigenpictures or eigenfaces (Yang et al., 2002).
Candidate face regions can now be analysed using the knowledge encoded in the eigenfaces, using two distinct distancemeasures. Distance from Face Space (DFFS) measures the reconstruction error for a given test image: this is the distancebetween a test image and its reconstruction. The closer the reconstruction is to the original image the more likely it is to bea face. The distance between the projected input image and the average face image in the feature space is also calculated,and is referred to as Distance in Face Space (DIFS). Both of these distance measures can be combined to give a confidencevalue indicating whether an image is a face or not.
2.2.2.3 Application to Video ShotsThe analysis described above is carried out on every 12th frame in each shot (every I-frame from the MPEG-1 bitstream).A confidence measure for the presence or absence of a human face in a given shot is calculated as the average confidencevalue for each of the frames processed within that shot.
2.2.3 Activity MeasureOne of the salient features of anchorperson shots in news broadcasts is that they are filmed using a static camera and thereis little object motion within the frame in these shots (i.e. low in visual activity). With this in mind, a measure of theamount of visual activity in a shot should prove useful for the detection of anchorperson shots.
To measure visual activity in a shot, we analyse the motion vectors in the MPEG-1 bitstream. Our approach is similar tothat of Sun et al (Sun et al., 2002), but extends the approach to represent the motion over a shot rather than only in

individual P-frames. The number of motion vectors in the frame whose length is less than a pre-selected threshold arecounted. Only the motion vectors for the P-macroblocks are considered, since I-blocks will have zero length motionvectors but this does not represent zero motion. An activity measure is calculated as the ratio between the number of theseshort length P-blocks and the total number of macroblocks in a frame, so a higher value indicates less visual activity. Thisactivity measure is calculated over a frame, and we use two techniques to extend the approach to extract two differentactivity measures to represent a shot, as described in the sections below.
2.2.3.1 Representing a shot using the least active frameFor the first approach to extracting a motion activity measure to represent a shot, the motion activity value is calculated foreach P-frame within a shot. Since the shot boundary information is never 100% accurate, shots near the beginning or endof a shot are discarded. This will remove some of the noise caused by incorrect shot boundary information. Once theactivity measure is calculated for each P-frame within a shot, the frame with the highest activity measure (i.e. the framewith the least amount of activity) is used to represent the shot. Using the maximum value in this manner increases thelikelihood of shots being represented as having low activity. In the context of anchorperson detection this means that weare less likely to rule out candidate shots because noise in the data makes them seem more active than they really are.
2.2.3.2 Representing a shot using Cumulative Motion VectorsA second approach for representing the overall motion within a shot is to add the motion vectors in all P-frames within ashot to generate a single set of motion vectors representing the overall shot movement. A Cumulative Motion Vector foreach macroblock location is calculated as the sum of the motion vectors for all P-frames in the shot at that location. So, foreach macroblock location, the cumulative motion vector in that location will represent the overall movement for thatlocation over the entire shot. For example, if all of the motion in a shot is in the same direction (e.g. a camera pan) all themotion vectors will point in the same direction and will add to each other. In an anchorperson shot on the other hand, theonly motion tends to be the body movement of the anchorperson, which cancels itself as the anchorperson leans first in onedirection and then another. This cumulative motion should be well represented by cumulative motion vectors, with motionvectors pointing in opposite directions cancelling each other out over the duration of anchorperson shots. We thencalculate an activity measure for the entire shot using these cumulative motion vectors in the same way as for a normal P-frame: it is the ratio between the short length cumulative vectors and the total number of macroblocks in a frame.
2.3 Text-based News Story SegmentationThe text-based news story segmentation used in our TRECVID 2003 system was provided by StreamSage (Rennert, 2003).Their approach is to use three different algorithms for text based segmentation:• Noun-Link - The principle of this algorithm is to identify repeated nouns as topic words and link sentences containing
them. Segment boundaries are then marked in where there are no links between sentences.• Boc-Choi (blocks of content - Choi) - This approach looks at sentence-by-sentence total word similarity and identifies
minima as candidate topic boundaries.• Induced N-grams - This approach searches for n-grams near candidate boundaries identified by the other algorithm. It
identifies common boundary markers within a broadcast such as “For XXX news, this is…”• The results of these algorithms are then combined to give an overall performance that exceeds the performance of any
single algorithm.
2.4 Combination of Analysis tools using a Support Vector MachineOnce all of the analysis tools have been run on a broadcast, they then need to be combined in order to finally classify shotsas anchorperson shots or non-anchorperson shots. The outputs from the analysis tools described in Section 2.2 are used asinputs into the Support Vector Machine.
2.4.1.1 Inputs into the Support Vector MachineThe shot clustering algorithm, as described in Section 2.2.1, gives a binary output: either a shot belongs to an anchorpersongroup or it does not belong to an anchorperson group. This output is converted into a confidence value in the intervalbetween 0 and 1 as follows. After the shot clustering algorithm has run and the candidate anchorperson clusters have beenidentified, each keyframe is compared to each of the anchorperson groups using the cosine similarity measure, giving avisual similarity between the keyframe for each shot and all of the anchorperson groups. The maximum of these valuescan then be seen as a confidence that a given keyframe belongs to an anchorperson cluster, and this is the value that is inputinto the Support Vector Machine. Likewise the face detection algorithm outputs is a confidence value between 0 and 1, ahigher value indicating higher confidence that a given shot contains a face, and this value is input directly into the SupportVector Machine.
Section 2.2.3 described two methods by which an activity measure is extracted to represent the overall activity within ashot. Each of these is a value between 0 and 1, and both values are input into our Support Vector Machine. For the textanalysis we use a binary output. If the text segmentation algorithm detected a new story within a shot then the text analysisalgorithm output for that shot is 1, otherwise the output is zero. Finally, the length of each shot, measured in frames, is also
input into the Support Vector Machine, since longer shots are more likely to be anchorperson shots introducing a new storythan shorter ones. This value is normalised to be in the same dynamic range as the output from the other algorithms.
2.4.1.2 Selection of the Training SetFrom the TRECVID 2003 development set, a subset of 20 programmes was selected as the training set, representing 10hours of video footage. Each shot within these programmes is represented by a vector comprised of the features describedabove. The shots are labelled as positive if the shot contains a story boundary, and otherwise labelled as negative. Beforeactually training the Support Vector Machine, we also removed any inconsistent training examples, which are trainingpoints whose feature vector is not consistent with the feature vectors of other training points of the same class. Once theappropriate training set was selected, a separate Support Vector Machine was trained for each submitted run, and theresulting trained classifier was used to detect the anchorperson shots.
2.5 Submitted Runs2.5.1 Required Runs2.5.1.1 Audio-Visual Only Run (DCU03_REQ_AV)For the required audio-visual only run, we trained a single Support Vector Machine using both ABC and CNN material.The feature vector used for this run was made up of four inputs: the output from the shot clustering algorithm, two outputsfrom the activity measure algorithm, and the shot length.
2.5.1.2 Required Audio-Visual + Text Run (DCU03_REQ_AV_TEXT)For our required audio-visual plus text run, we trained a single Support Vector Machine using both ABC and CNNmaterial. The feature vector for this run had five inputs: output from the shot clustering algorithm, output from the textsegmentation algorithm, two outputs from the activity measure algorithm, and the shot length.
2.5.1.3 Required Text-Only Run (DCU03_REQ_TEXT_ONLY)The text-only run was based on the text segmentation algorithm described in Section 2.3, and was provided by StreamSage(Rennert, 2003).
2.5.2 Optional Runs2.5.2.1 Audio-Visual only run trained separately for ABC and CNN (DCU03_OPT_AV)For this run, we trained separate Support Vector Machine classifiers for ABC and CNN. For the ABC classifier the featurevector was made up of four inputs: output from shot clustering, two activity measures, and shot length. The CNN classifierused five inputs in the feature vector: output from shot clustering, output from face detection, two activity measures, andshot length.
2.5.2.2 Shot Clustering Only (DCU03_OPT_CLUSTER)An additional run was submitted which used the results of the shot clustering algorithm alone (see Section 2.2.1).
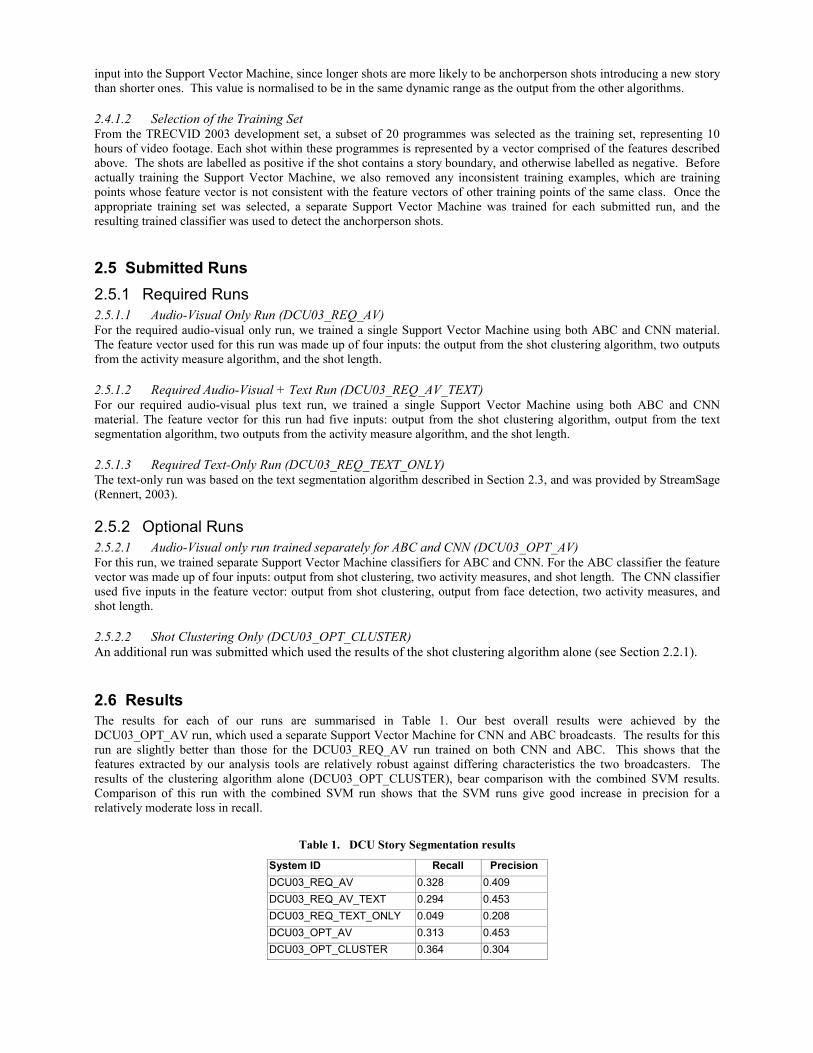
2.6 ResultsThe results for each of our runs are summarised in Table 1. Our best overall results were achieved by theDCU03_OPT_AV run, which used a separate Support Vector Machine for CNN and ABC broadcasts. The results for thisrun are slightly better than those for the DCU03_REQ_AV run trained on both CNN and ABC. This shows that thefeatures extracted by our analysis tools are relatively robust against differing characteristics the two broadcasters. Theresults of the clustering algorithm alone (DCU03_OPT_CLUSTER), bear comparison with the combined SVM results.Comparison of this run with the combined SVM run shows that the SVM runs give good increase in precision for arelatively moderate loss in recall.
Table 1. DCU Story Segmentation results
System ID Recall PrecisionDCU03_REQ_AV 0.328 0.409DCU03_REQ_AV_TEXT 0.294 0.453DCU03_REQ_TEXT_ONLY 0.049 0.208DCU03_OPT_AV 0.313 0.453DCU03_OPT_CLUSTER 0.364 0.304

3 Interactive Search TaskFor the Search task, we developed a variation of our interactive, web-based video retrieval system Físchlár, to providesearch and retrieval facilities over the 60 hours of the Search test collection. We employed the underlying architecture ofthe Físchlár Digital Video System (Smeaton, 2002) that has been operational within our University campus for 3 years. TheXML-based architecture employed has made other variations of the system and the design of tailored versions relativelyeasy to implement, for example the version used for our interactive video search task system in TRECVID 2002 (Gaughanet al., 2003).
The search test collection consists of 60 hours of CNN, ABC and CSPAN news data. This contains 32,318 shots from thecommon shot boundary reference provided by the CLIPS-IMAG group. Unlike the video data employed in TREC2002,this year the data was made up of news programmes from the mid 1990s, hence the content was modern and the videoquality was sufficient to be processed automatically using the current parameters of Físchlár. In addition, Closed Caption(CC) transcripts were provided along with Automatic Speech Recognition (ASR) transcripts from LIMSI-CNRS (Gauvainet al., 2002).
3.1 System DescriptionThe system developed for this year’s TRECVID has an XML-based architecture and uses MPEG-7 compliant videodescription internally. While having the same underlying architecture as the Físchlár system, the system we tailored forthis year’s Search task is quite different in its retrieval mechanism and user interface, as it supports a different interactionstrategy for users, namely shot-based relevance feedback for re-querying.
We developed two versions of the system, one that supported text-only querying of the video collection and one thatsupported text and image querying, but which also incorporated a feedback mechanism whereby a user could select shotsthat they felt were important and would want to retrieve more shots like this. The text-only system utilised the ASR andCC text to provide retrieval facilities while the second version of the system (the full-featured system) supported the textfacilities of the text-only system along with supporting image based retrieval and the ‘more like this’ feedback mechanism.
3.1.1 System ArchitectureFigure 1 shows the components of the system. When a user submits a query via the web-based interface, the webapplication processes it and sends the query detail to the logic element governing the search engine (see Section 3.1.2).The search engine sends back the retrieved results with relevance scores to the XML generator, which generates thenecessary XML descriptions dynamically, to be transformed by appropriate XSL stylesheets to render HTML and SVG.
IndexingTool
SearchServer
XMLGenerator
XSL definitionsfor presentation to the browser
QueryComposition
Request for specificXSL to
be used
Internal XMLData Generation
Query
Query
RankedResult
HTML & SVGto be displayed
Query ResultVisualation
Web Browser interface
WebApplication
Web-based User Interface
XML description, containing:
---
MPEG-7 description of the requested video Query-related information Scoring for each feature for each shot
- Reference to matched shots
Search TestCollection Metadata
(ASR & CC transcripts)
MPEG-7 XMLVideo
Descriptions
Sear
ch S
yste
mFí
schl
ár T
REC
Sys
tem
Ranking Functionfor Text
Com
bina
tion
Ranking Functionfor Images
Image SimilarityIndex
ASR TranscriptIndex
CC TranscriptIndex
Figure 1. Físchlár-TREC2003 Architecture
3.1.2 Retrieval and Weighting SchemeThere were two essential aspects of the retrieval and weighting scheme for the system: the text search aspect and the imagesearch aspect. We will discuss each in the following sections.
In order to process user queries and to combine image and text retrieval results, a search server was developed (see bottomof Figure 1) which processed user queries. Each query is parsed into its text and image components (where available), withthe text component being processed and then passed onto two search engines, while the image component is passed ontothe image search engine. The final ranking of shots is then based on a combination of the text and image results and isdescribed below. However, when presenting shots to users (whether using the text-only or full-featured system), a simpleranked listing of shots is not used. Rather, a grouping of adjacent shots is presented to the user in ranked order. This groupof shots (GOS) consisted of five shots, with the middle shot being the most influential and the neighbouring shots beingweighted at lesser importance, with the importance decreasing as the distance from the middle shot increases. Theregulation of influence of the neighbouring shots can be seen in the following formula, where GSti is the group score ofshot I, b is a parameter of value 3.
( )
+
++
+
= ++−−
bWt
bWtWt
bWt
bWtGSt ii
iii
i 222112
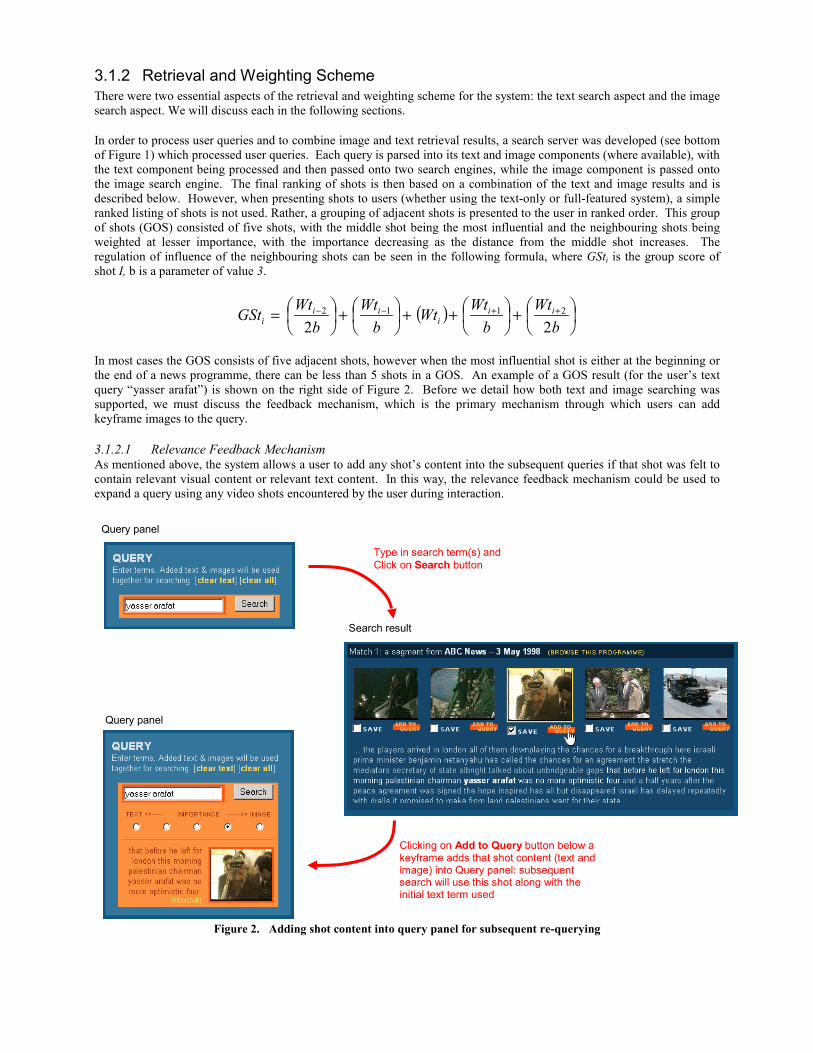
In most cases the GOS consists of five adjacent shots, however when the most influential shot is either at the beginning orthe end of a news programme, there can be less than 5 shots in a GOS. An example of a GOS result (for the user’s textquery “yasser arafat”) is shown on the right side of Figure 2. Before we detail how both text and image searching wassupported, we must discuss the feedback mechanism, which is the primary mechanism through which users can addkeyframe images to the query.
3.1.2.1 Relevance Feedback MechanismAs mentioned above, the system allows a user to add any shot’s content into the subsequent queries if that shot was felt tocontain relevant visual content or relevant text content. In this way, the relevance feedback mechanism could be used toexpand a query using any video shots encountered by the user during interaction.
Figure 2. Adding shot content into query panel for subsequent re-querying
Clicking on Add to Query button below akeyframe adds that shot content (text andimage) into Query panel: subsequentsearch will use this shot along with theinitial text term used
Search result
Query panel
Type in search term(s) andClick on Search button
Query panel

For any given shot, a user can add the shot into the query by selecting the Add to Query button beneath the keyframe of thatshot. This causes both the image (keyframe) and the text (both ASR and CC, though only the ASR is displayed on screen)from that shot to be added to the query panel, and these are then sent to the search engine when the user clicks on Searchbutton next time. This is illustrated in Figure 2. The users were allowed to add the images and video examples in the topicdescription (displayed at the beginning of each task given to the user) into the Query panel.
3.1.2.2 Text SearchText-based search functionality was based on using conventional text retrieval engines. Internally, each shot wasrepresented by the ASR transcript associated with that shot as well as the closed caption (CC) text, which we had alignedwith the ASR transcript. This necessitated the use of two conventional (text-only) search engines, one for the ASR text andanother for the CC text. At query time, the user’s text query is sent to both search engines and the results are merged toproduce one final score for each shot.
Prior to indexing, both the ASR and the CC transcript for each shot was processed to remove stopwords (words that occurtoo frequently to aid the search process, “the”, “of”, “and” etc.) and then stemmed using Porter’s algorithm. The rankingalgorithm we chose to employ for searching the transcripts was the popular BM25 algorithm, which has proved its value inTREC experiments over a number of years. Our BM25 ranking was based on the following parameter values, advl = 15and 13 for ASR and CC content respectively, b = 0.75, k1 = 1.2 and k3 = 1000. We note that additional experimentationwould be beneficial to tune these parameters to best-fit ASR and CC content.
3.1.2.3 Image SearchThe TREC2003 image search engine performed retrieval based on an index of all keyframes from shots in the collection aswell as the representative query images. Three colour-based features and one edge-based feature were used to representeach image:
� Four Region * 18 bin Hue Histogram� Nine Region Average RGB Colour� Nine Region Largest RGB Colour� Nine Region * 16 bin Edge Histogram
Image-to-Image dissimilarity comparison was computed using an absolute distance measure for each of the four visualfeatures. These four feature scores were normalised based on ratio averaging. This required that the average imagecomparison scores be calculated for each feature in the development collection. The four average feature scores werenormalised until they were approximately similar. Image comparison's feature scores were then combined into one scoreusing these normalisation values.
Each query to the image search engine consists of one or more keyframes from the complete indexed corpus. Results canthen be returned either from within a specific video or across all video content in the search collection. Scores for eachkeyframe were calculated by aggregating their score against each of the query images. Once the dissimilarity scores werecomputed they were ranked in ascending order and passed back to the search server for combination with evidence fromthe text search engines.
3.1.2.4 Combining Image and Content EvidenceFor any query consisting of both image and textual elements, the method of combining image and textual evidence togetheris an important aspect of system performance. We combined this evidence in a two-phase process. Firstly the systemautomatically estimates weights for the textual evidence and the image evidence based on the relative performance of eachelement. In this manner, the weighting of text and image influence was highly correlated with the feedback mechanism. Asa user indicated example shots using the ‘more like this’ feedback mechanism, this expanded the query, by adding ASR(and CC) text and keyframe image of that indicated shot. The weighting of text and image influence was based onidentifying the proportion of user indicated relevant shots (those chosen for feedback) that were returned by both the textsearch engine and the image search engine in the in the top 20 results of each. In this way, if either search engine was notperforming for a particular query, then the weighting of that source of evidence is automatically reduced.
The second phase of evidence combination relies on the user judgement of which element is more important for any givenquery. The weight of both elements could be controlled by the user with five radio buttons which allowed the user todetermine the weighting between text and image evidence on a five point scale, as shown in the Query panel in Figure 2.The influence was regulated in steps of 0.25 in size from 0.0 to 1.0, so when the user selected mostly text (second from leftin Figure 2) the text influence was 0.75 with image influence of 0.25. This weighting was applied after the automaticallyestimated weights described above had been applied, thus giving the user the ability to regulate text and image influence.By default, the radio buttons were set to weight both elements equally. Our preliminary findings show that users left thedefault weighting in place 51% of the time, with image-only weighting the second most popular setting at 25%.

3.1.3 Web Interface with XSLSome of the user-interface elements have been introduced in previous sections, but here the overall interface of the systemand the user interaction concerns are described. From our participation in previous TRECVID Search tasks involvingdevelopment of interactive video retrieval systems, we are aware of the importance of a well thought-out user interface forsuch a system and the problems faced in designing such a system. The biggest challenge has been the fact that while theinterface should be designed for efficient interaction sequences as our users are were imposed with time limits for eachsearch task, we still have to consider the learnability of the interface: all our test users were first-time users of thisparticular variation of Físchlár, thus necessitating more considerate labelling, messages and visibility of available featuresin the system interface. While trying to accommodate both aims at the same time, we included more extensive trainingsessions at the beginning of the experiment to reduce some of these problems. Figure 3 shows the main screen of thesystem.
On the top-left of the screen, the necessary administrative information for the test users’ session is displayed, including thetask number (each task corresponding to a TRECVID topic given to the user), the timer showing how much time is left forthis task, a button to review the answer shots found by the user so far, and a button to review the topic description at anytime during the task. Below that, there is Query panel into which the user types query terms or adds example shots fromany video encountered during the course of searching. When the user clicks on the Search button, the system searches thevideo collection based on the retrieval mechanism described in the previous section and presents the retrieval result on theright side of the screen.
The result is presented as a list of rows of relevant video programmes ranked in order of relevance to the user’s query.When there are more than 20 matched GOS’s found, the list becomes paginated into Page 1, Page 2, Page 3, etc. Each rowdisplays a GOS, the most relevant shot in the middle of the GOS and surrounded by two shots directly preceding it and twoshots following it in that particular video programme. This allows the user to see the context in which the matched shotappeared. Below these five shots, the portion of the ASR transcript text occurring within them is presented, with thematched text query terms highlighted.
Each shot in the search result is represented by the following elements:
• A keyframe - as provided by the CLIPS-IMAG group. The keyframe represents the shot’s visual content.Clicking on the keyframe will start playback from that point in the video on the playback panel at the bottom-leftof the screen. Unlike our previous years’ experiments and other variations of the Físchlár system in which videostreaming causes a lag of a few seconds before playback commences, this year we ensured that an immediate startof playback occurs when the user clicks a keyframe. Thus browsing and playback becomes a far more seamlessand continuous interaction. Previous experiments suggested to us that the user was often inclined to guesswhether shots are relevant or not without playing back video when the streaming lag was in the order of a fewseconds;
• ASR transcript text - The portion of the ASR text associated with each shot together with the adjacent shots’ text(from the GOS) is displayed. The ASR associated with any one keyframe is highlighted when the user brings themouse cursor over a keyframe. Although ASR and Closed Caption transcripts were both used for retrieval, onlyASR was displayed on the interface. Any query terms in the ASR text was also highlighted;
• SAVE checkbox - for the user to indicate that this is the shot s/he considers answers the topic. At the end of thesession, all the shots checked in this way are collected to be sent to NIST as the Search task result;
• Add to Query button ( ) - this button below each keyframe is used for the user to add the shot’s content(keyframe and text) as part of his/her subsequent query. When the user encounters a shot or shots within the taskthat she thinks would help the retrieval, she can click this button to add the shot into the Query panel and thenclick on Search button to submit a new query. When the user adds a shot to the query, the Query panel on the leftis updated. Figure 3 shows a snapshot of the system after a user has added some shots to the query. The user issearching with 2 added images and text (see the Query panel on the left). In this case, the user has weighted thequery slightly in favour of image compared with text.

Figure 3. Físchlár-TREC2003 web interface
The user can undo the addition of the shot by clicking the REMOVE text below the added ASR text. The user can continueto add shots to the query as she browses through the search results display. Once the user has completed the queryreformulation s/he clicks on the Search button to re-query the collection.
Within-video programme browsing (see figure 4) is also supported after the retrieval result screen, by clicking on BROWSETHIS PROGRAMME button at the top of each retrieved GOS. When browsing an entire programme, all keyframes aredisplayed with five per line along with the associated ASR transcript. An SVG timeline permanently at the top of the pagehighlights the segments within the programme which match the query (highest peaks as seen in Figure 4), and clicking onany part of the timeline will cause the programme keyframe listing to immediately scroll the appropriate segment of thatprogramme. With the programme browsing view a user may save a shot as being relevant or add shots to the query in thenormal manner.
Figure 4. Browsing a news programme using the SVG timeline
3.2 The User ExperimentFor the Search task, we used two variations of the above-described system. The first system is a text-only system: theability to add the images and text from a shot to the query is removed, thus disabling the image and relevance feedback

features (this system is referred to as DCUTrec12a). The second system has all of the features as described above (to bereferred to as DCUTrec12b). The hypothesis we were testing was that DCUTrec12b system with its image search andfeedback mechanism outperforms the baseline text-only DCUTrec12a system in our controlled environment.
We recruited sixteen test users in our experiments and limited the amount of time for each task (topic) to 7 minutes. The 7minutes included the time taken to read the TREC topic. Each user was given a 10-minute tutorial on using both the text-only and the fully featured system. They were then given two sample queries, with a full 7 minutes allotted for thecompletion of each sample search. Compared to previous years’ experiments we have placed more emphasis on theprovision of comprehensive user training before the main topic search started. By doing this, we reduce the problemscaused by the fact that the performance of the system is determined by the first time users (inevitably all our test users arefirst time users). The training topics we used were “find shots that show flooding” and “find shots of Bill Clinton”. Aswith the official topics, suitable example images from the collection were provided.
3.2.1 Experimental Design MethodologyUnlike previous years, this year’s interactive Search task guidelines included guidelines for the design of user experiments(TRECVID guidelines, 2003). These guidelines were developed in order to minimise the effect of user variability andpossible noise in the experimental procedure. The guidelines outlined the experimental process to be followed whenmeasuring and comparing the effectiveness of two system variants (DCUTrec12a, DCUTrec12b) using 24 topics and either8, 16 or 24 searchers, each of whom searches 12 topics. A searcher does not see the same topic more than once and asearcher completes all work on one system variant before beginning any work on the other variant. We followed theprovided TRECVID guidelines for evaluating 16 users searching 12 topics using 2 system variants. Searchers wereassigned randomly and the order of topic presentation for a given system and searcher was also randomised. This designallows the estimation of the difference in performance between two system variants run at one site, free and clear of themain (additive) effects of searcher and topic and the gathering of some information about interactions.
3.2.2 Experimental ProcedureAll sixteen people who participated as test users were postgraduate students or research staff in the School of Computing,DCU. All had high levels of computer experience and familiarity with web-based searching, each conducting some formof online searching on a daily basis. Each of the 16 test users conducted 12 of the 24 Search topics provided by NIST.Each test user was seated in front of a desktop PC in a computer lab and was provided with headphones for the experiment.Before beginning the experiments, each user completed the first part of a questionnaire we prepared for evaluation of oursystem. We used the questionnaire developed over several years by the TREC Interactive track (TREC Interactive Track,2003). The questionnaire included pre-test questions, short post-topic questions, and post-test questions, which each of theusers filled in at each stage of the testing. After a brief introduction and conducting test runs on the two sample topics, theusers began the topic search. Each user was presented with the topic on a web page with the audio/image/video exampleswhich form part of the topic descriptions. Users read, viewed, and were free to play the examples that accompanied thetopic and then conducted their search.
As stated, users were given 7 minutes for each topic and when a shot was located that the users thought answered the topic,they indicated this by checking the SAVE checkbox underneath the shot’s keyframe (see Figure 2). At the end of the 7minutes, the users filled in a short paper-based post-task questionnaire, and started the next topic. At the end of 6th task,the users took a 10-15 minute break with light refreshments. After the break the remaining 6 task searches continued,finishing with the post-test questionnaire. All individual users’ interactions were logged by the system, and the results ofusers’ searching (checked shots) were collected and from these results eight runs were submitted to NIST for evaluation.
3.3 Submitted RunsWe submitted eight official runs for evaluation. These runs were based on the results of our 16 users, where each userprocessed 12 of the 24 topics. Therefore our runs used the output of 4 different users (6 topics each). Our runs werelabelled DCUTREC12a_{1,3,5,7} for the text-only system and DCUTREC12b_{2,4,6,8} for the second system.
3.4 Results of the ExperimentsRecall that we were testing whether a text with image and feedback system (DCUTrec12b) outperformed a text-onlyretrieval system (DCUTrec12a) in our controlled environment. If we examine the precision-recall graph for the combinedruns of all users of both systems (Figure 5) we can see that the performance of both systems is roughly comparable, withDCUTrec12a (text-only) obtaining slightly higher precision at all points on the graph.

Precision and Recall
00.10.20.30.40.50.60.70.80.9
1
0.0 0.1 0.2 0.3 0.4 0.5 0.6 0.7 0.8 0.9 1.0
Recall
Prec
isio
n
DCUTrec12aDCUTrec12b
Recall over Time
0
0.05
0.1
0.15
0.2
0.25
0.3
0.0 1.0 2.0 3.0 4.0 5.0 6.0 7.0
Time (minutes)
Rec
all
DCUTrec12aDCUTrec12b
Figure 5. Precision-Recall graph of both systems Figure 6. Recall over time
Examining how easy users of our systems located relevant content over time, we generated and evaluated unofficial runsby truncating the submission file for users' results on or before 30 seconds and at 30 second intervals until 7minutes (seeFigure 6). This addresses the question of what would happen if we gave less than 7 minutes to users to perform the search.In order to obtain these values, our system logged the time elapsed when a user marked a shot as relevant. Once again wecan see that both systems perform comparably, however DCUTrec12a does produce higher recall figures. Recall increaseswith time, although the rate of improvement does seem to be tailing off as the time allocated increases.
In order to examine the effects of different topics on both systems we plotted the recall of each system for each of the 24topics, as shown in Figure 7.
Recall
00.10.20.30.40.50.60.70.80.9
1
100
102
104
106
108
110
112
114
116
118
121
123
Topic Number
Rec
all
DCUTrec12aDCUTrec12b
4%
51%
8%
25% 12% Text-onlyMostly Text50-50Mostly ImageImage-only
Figure 7. Recall for both systems for each topic Figure 8. Examining User Preferences
DCUTrec12b was notably better for the baseball (topic 102) and rocket or missile taking off (topic 107) queries, whichwould be expected, as these would be very visually identifiable shots and lend themselves to image matching. On the otherhand the text-only system, DCUTrec12a, was notably better on five queries, these being; Shots of Locomotivesapproaching (topic 111), Congressman Mark Souder (topic 118), Morgan Freeman (topic 119), Front of White House(topic 124), Pope John Paul II (topic 123). Many of these queries would be considered less identifiable visually, but wouldlend themselves more to textual analysis of the ASR and CC text. Performance on all other topics was almost identical.
Examining user behaviour towards both systems we find that when using DCUTrec12a that users generated 564 queries intotal while they generated 581 queries (both averaging at six queries per topic) when using DCUTrec12b. Of these 581DCUTrec12b queries, 81% contained an image (or feedback) element, but over 99% (580 queries in total) contained a textelement. This is as expected because the addition of a keyframe to a query using feedback does bring with it anyassociated ASR or CC text, thus even if the user did not explicitly state a textual query, in most cases these queries wouldcontain ASR or CC text. But it is notable that 19% of the time, users chose to use text-only weighting even though themore advanced image and feedback features were available. While 19% may seem large, it is encouraging that users didopt to make full use of the image and feedback features where available 81% of the time.

Examining these 81% of queries for the text & image system we find that users requested 50-50 weighting (the centre ofthe five radio buttons in Figure 4) for their queries 51% of the time (see Figure 8). It should be remembered that this wasthe default option. When users changed from the default, image only was the next most popular user choice at 25% withother options as in Figure 8. This suggests that when users changed from the default option that they wanted purely imageresults over 50% of the time.
These results are based on a preliminary examination of our submission results and logs generated by the system during theuser experiments. We plan to undertake a more thorough examination of our findings at a later date.
4 ConclusionsFor the News Story Segmentation task, our results indicated that our generic system, developed for both CNN and ABCbroadcasts, performed only marginally worse than specialised systems for each broadcaster. This shows that the featureswe extract for story boundary detection are quite robust against the variations between content produced by differentbroadcasters.
For the Interactive Search task, our results suggest that users found more relevant shots when using the text-only system inour experimental setting under the time constraint of 7 minutes per topic, but that the higher performance level was notsignificant. We present a number of preliminary reasons why the text-only system seems to outperform the text and imagesystem:
� Text only searching supports better retrieval performance, possible because the text retrieval algorithms weemploy are more mature than the newer image retrieval algorithms.
� The text-only query/interaction methodology was more familiar to users and consequently they performed betterusing the text-only system in our experimental setting.
� The query response time of the text, image and feedback system was longer than the text-only system. This wasdue to the fact that the text query contained more terms and the image engine had to be queried as well. Hencethe user spent more of the seven minutes composing a query and awaiting system responses. However, the effectof this would be in the order of seconds in total over the seven minutes allocated, but even so, we cannot discountit as an influencing factor.
We will undertake a more thorough examination of our findings at a later date.
5 AcknowledgementsThis material is based upon work supported by the IST programme of the EU in the project IST-2000-32795 SCHEMA.The support of the Informatics Directorate of Enterprise Ireland is gratefully acknowledged.
6 ReferencesCzirjek, C., O'Connor, N., Marlow, S., Murphy, N. (2003) Face Detection and Clustering for Video Indexing Applications. Acivs
2003 - Advanced Concepts for Intelligent Vision Systems, Ghent, Belgium , 2-5 September 2003.Gaughan, G., Smeaton, A.F., Gurrin, C., Lee, H. and Mc Donald, K. (2003) Design, Implementation and Testing of an Interactive
Video Retrieval System. Proceedings of the 5th ACM SIGMM International Workshop on Multimedia InformationRetrieval (MIR 2003), Berkeley, CA, 7 November 2003.
Gauvain, J.L., Lamel, L. and Adda, G. (2002) The LIMSI Broadcast News Transcription System. Speech Communication, vol.37, no 1-2, pp. 89-108.
O'Connor, N., Czirjek C., Deasy, S., Marlow, S., Murphy, N., Smeaton, A.F. (2001) News Story Segmentation in the FíschlárVideo Indexing System. Proceedings of the International Conference on Image Processings (ICIP 2001), Thessaloniki,Greece , 10-12 October 2001.
Rennert, P. (2003) StreamSage Unsupervised ASR-Based Topic Segmentation. TRECVID 2003 - Text REtrieval ConferenceVideo Track, Gaithersburg, Maryland , 17-18 November 2003.
Smeaton, A.F. (2002) Challenges for Content-Based Navigation of Digital Video in the Físchlár Digital Library. Proceedings ofthe International Conference on Image and Video Retrieval (CIVR2002), London, U.K., July 18-19. Lecture Notes inComputer Science, Vol. 2383, Springer-Verlag Heidelberg.
Sun, X., Manjunath, B.S., Divakaran, A. (2002) Representation of motion activity in hierarchical levels for video indexing andfiltering. Proceedings of IEEE International Conference on Image Processing (ICIP), Rochester, NY, USA, September 2002.
TREC Interactive Track. (2003) TREC Interactive Track. Available online at URL: http://www.ted.cmis.csiro.au/TRECInt/(visited February 2004)
TRECVID guidelines. (2003) Two designs for interactive video search experiments. Available online at URL:http://www-nlpir.nist.gov/projects/tv2003/TRECVID_Interactive_Experimental_Design.html (visited February 2004)
Yang, M., Kriegman,D. and Ahuja, N. (2002) Detecting Faces in Images: A Survey. IEEE Transactions on Pattern Analysis andMachine Intelligence (PAMI), vol. 24, no. 1, pp. 34-58.