dublin city university video track experiments for trec 2001
TRANSCRIPT

Dublin City University Video Track Experiments for TREC 2001
P. Browne, C. Gurrin, H. Lee, K. Mc Donald, S. Sav, A. F. Smeaton and J. Ye
Centre for Digital Video ProcessingDublin City University
AbstractDublin City University participated in the interactive search task and Shot Boundary Detection task* of the TREC VideoTrack. In the interactive search task experiment thirty people used three different digital video browsers to find videosegments matching the given topics. Each user was under a time constraint of six minutes for each topic assigned tothem. The purpose of this experiment was to compare video browsers and so a method was developed for combiningindependent users’ results for a topic into one set of results. Collated results based on thirty users are available hereinthough individual users’ and browsers’ results are currently unavailable for comparison. Our purpose in participatingin this TREC track was to create the ground truth within the TREC framework, which will allow us to do direct browserperformance comparisons.
1. IntroductionThis year Dublin City University took part in the video track where we submitted runs for both the interactive searchtask and the automatic shot boundary task. Firstly we will present our experiments and results for the interactive task insection 2. In section 3 we will briefly discuss our Shot Boundary Detection experiments. Although we have an interestin the Shot Boundary Detection task our primary focus was on participating in the interactive task. We have submittedsome Shot Boundary Detection results and are continuing our research into the area and look forward to being in aposition to participate more fully in the Shot Boundary Detection task next year, should it run.
2. Interactive Search TaskFor the interactive search task we undertook to evaluate 3 different interfaces for browsing digital video. In thefollowing sections we will give an overview of the system that was created in order to evaluate the browsers, then theevaluation procedure for experiments, followed by how experimental data was collated from the different users andfinally we will present our initial analysis of the results.
2.1 System DescriptionFor the interactive search task, we used 3 of the 8 video keyframe browsers available in the Físchlár system. TheFíschlár system is web-based and allows users to record, browse, and watch television programmes online [O'Connor etal. 01]. For this experiment we created a separate interface (Section 2.1.2) from Físchlár. The 3 browsers were chosenfor the large differences among them in the way they presented the keyframes (representative frame from each videoshot), while at the same time all of them had the same dynamic and immediate response style of interaction. The testusers used all these browsers to locate the video clip results for interactive queries.
* Work on the Shot Boundary Detection task was done in collaboration with the Multimedia & Vision Research Lab inQueen Mary, University of London, U.K.

2.1.1 The Three Browser InterfacesThe underlying Físchlár system processed the TREC video set to automatically extract keyframes for each video andthe 3 browsers present these sets of keyframes in 3 different ways. The 3 browsers are the Timeline browser, SlideShow browser, and Hierarchical browser. These are described here briefly.
The Timeline browser (see Figure 1) presents keyframes ina linear fashion. When a user selects one of the videos, the first 24keyframes are displayed on the screen, with that part of the videoindicated on the timeline at the top. Keyframes are miniaturised sothat many of them can fit on the screen while still the content ofeach is recognisable. The timeline is broken into segments, eachrepresenting the appropriate time when the 24 keyframes belowappear in the video. The timeline is mouse-over activated so whenthe user moves the mouse cursor over any of the timeline segments,the keyframes immediately change to display that part of the videoon the screen. This way, one sweep of the mouse through thetimeline bar from left to right can quickly present the wholekeyframe set of a video. When a mouse cursor is on the timeline, asmall ToolTip pops up to indicate the time of that segment.
The Slide Show browser (see Figure 2) presents keyframesone by one, in a temporal fashion. When a user selects one of thevideos, keyframes from the video will be displayed one by one,automatically flipping from one keyframe to the next as in a slideshow. The size of the keyframes is larger than in the Timelinebrowser, as it shows only one keyframe on the screen at a time.The user has control over the keyframe flipping – she* may pausethe slide show, flip through manually by clicking the forward andbackward buttons, or leave it to do the slide show by itself. Alsothe user can put the mouse cursor over the small timeline below thekeyframe, and drag the current point quickly back and forth, similarto the Timeline bar. When the mouse cursor is on the timeline, abox pops up displaying a small keyframe (smaller than theminiaturised keyframes in the Timeline browser) representing thecursor's point in the timeline along with the time of that point.
The Hierarchical browser (see Figure 3) presentskeyframes in a 4-level, hierarchical fashion. When a user selectsone of the videos, 6 keyframes that are representative of the videoare displayed on the screen (the top 6 keyframes in Figure 3).These 6 keyframes are selected throughout the chosen video’scontent, representing a rough overview of the video. When the usermoves the mouse cursor over any of these 6 keyframes, another 6keyframes within the segment represented by that keyframe aredisplayed just below the top 6 keyframes, showing more details ofthat segment. The user can again move the mouse to this secondlevel of keyframes to show 6 more detailed keyframes below it.
This way, the user can quickly move the mouse cursor over anykeyframe displayed on the screen, hierarchically drilling up anddown the keyframe set. This particular style of keyframe browsinghas earlier been mentioned elsewhere [Mills et al. 92] [Zhang et al. 95].
* There are, of course, male users as well.
Figure 2: Slide Show browser
Figure 3: Hierarchical browser
Figure 1: Timeline browser

2.1.2 The Evaluation SuiteWe used a specially designed, automatedweb-based evaluation suite for the interactivetesting, which integrated all the test users'tasks to be conducted. Test users werepresented with a user-interface that presentseach of the queries, one of the 3 browsers todo the search task, and an input panel toindicate the findings. Figure 4 shows a screenshot from the user-interface of the evaluationsuite. When the user clicks the start button(not shown in Figure 4), the first querywindow pops up with its description andexample images and videos (if examples areprovided by the query). The user can closethe query description window to do the searchtask, but the description part remains on thetop left of the screen (in Figure 4) so that shecan refer to it while doing the task. Thebottom left side of the screen shows the list ofvideo clips. The user can click on a video titlein this list to see the keyframes of that videoon the right side, with one of the pre-determined browsers. For any of the 3 browsers that are used for a task, clickingon any of the displayed keyframes will pop up a small player window that starts playing the video from the clickedkeyframe onwards. When the user browses and finds a part ofthe video which she thinks satisfies the query, she clicks the'Add Result' button either on the browser screen or on the playerwindow, which pops up an input panel window where the userindicates start and end time of the video result. The indicatedfinding will be added on the list at the top right side of thescreen for the user to see, and as she finds and adds moreresults, this list will grow. Once a result is added it cannot beedited or deleted. The user will continue the search task untilthe experimenter asks her to stop (in 6 minutes - see Proceduresection below).
Table 1: Test user demographics
by gender by status
Male 18Female 12
Undergraduates 10 Postgraduates 19 Staff 1
Total 30 Total 30
2.2 Evaluation Procedure for ExperimentsThe test users volunteered within the School of ComputerApplications and the School of Electronic Engineering, andwere asked to come to a computer lab where the testing was tobe held.
Figure 4: Evaluation suite
Introduction
Software and 3browser demo
Task 9 &questionnaire
Task 2 &questionnaire
Task 3 &questionnaire
Task 4 &questionnaire
Task 5 &questionnaire
Task 6 &questionnaire
Task 7 &questionnaire
Task 8 &questionnaire
Task 1 &questionnaire
Task 10 &questionnaire
Task 11 &questionnaire
Task 12 &questionnaire
Coffee / Teabreak
Finalquestionnaire
Debriefing
Figure 5: Session procedure
2.2.1 Evaluation EnvironmentIn each session 5-7 test users participated, depending on their time availability, and a total of 6 sessions were conductedon different days. The total number of participants was 36 people, from which 6 people's results were discarded due toa network congestion problem that disrupted the tasks of those people. The demographics of the test users are in Table1. They were all experienced users of the Microsoft Windows operating environment.
Each session took about 3 hours, but the exact time varied due to test users who came late, their questionsduring the introduction and debriefing stage. Test users sat in front of their assigned PC with the web browserdisplaying the first screen of the speciallydesigned web-based suite for this evaluation.Test users filled in a very short demographicquestionnaire asking gender, course/year, andfamiliarity with Físchlár browsers. Thequestion of familiarity with the browsers wasasked because the system had a wideavailability within the campus and manystudents have been using its browsers on adaily basis, which would make differences intheir task performance. Then theexperimenter briefly gave an introduction,thanking them for their participation, tellingthem what the purpose of the testing was, howlong it would take, and how stressful it wouldbe. They were informed that they could leaveat any point if they felt unhappy, frustrated ortoo stressed, and that the information theyprovided would be confidential and only usedfor research purposes.
After the introduction, the experimenter and 2 - 3 more assistants (who stayed and helped during the sessions)gave a 10 - 15 minute demonstration by gathering 3 - 4 test users in a group. They showed them how to interact withthe evaluation software (i.e., how to start, how to use 3 different browsers, how to add the findings into the result list,how to proceed, etc.), and replied to the questions the individual test users had.
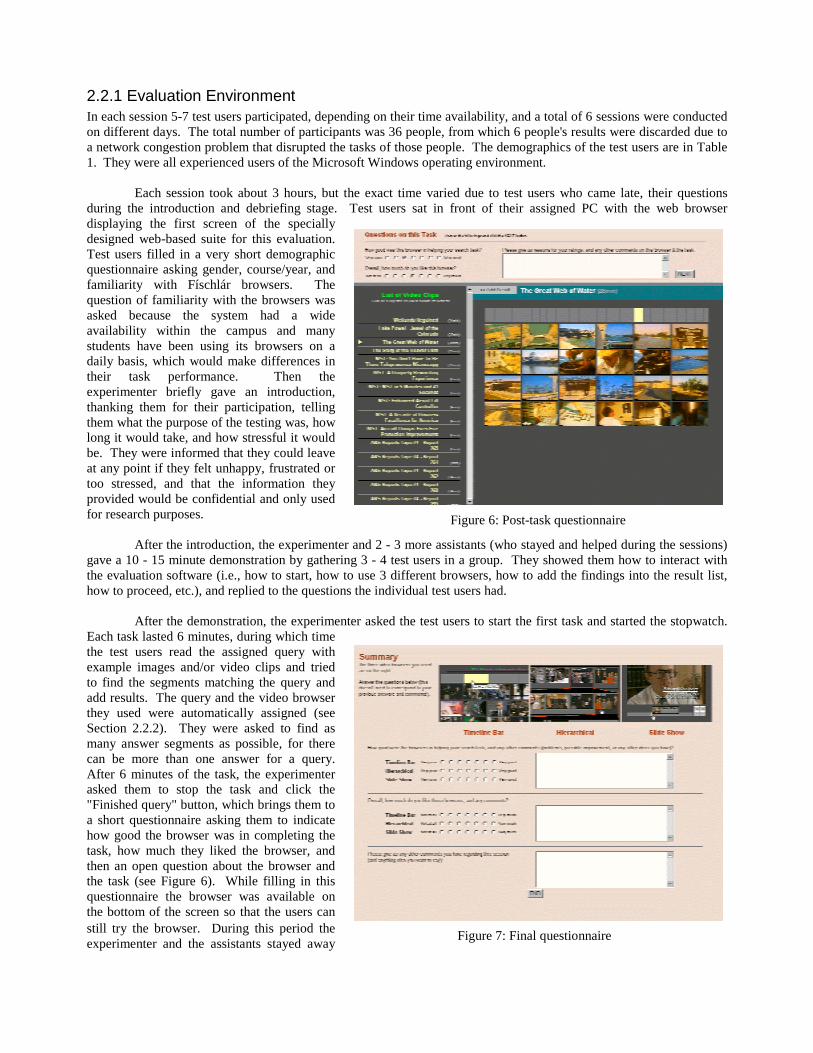
After the demonstration, the experimenter asked the test users to start the first task and started the stopwatch.Each task lasted 6 minutes, during which timethe test users read the assigned query withexample images and/or video clips and triedto find the segments matching the query andadd results. The query and the video browserthey used were automatically assigned (seeSection 2.2.2). They were asked to find asmany answer segments as possible, for therecan be more than one answer for a query.After 6 minutes of the task, the experimenterasked them to stop the task and click the"Finished query" button, which brings them toa short questionnaire asking them to indicatehow good the browser was in completing thetask, how much they liked the browser, andthen an open question about the browser andthe task (see Figure 6). While filling in thisquestionnaire the browser was available onthe bottom of the screen so that the users canstill try the browser. During this period theexperimenter and the assistants stayed away
Figure 6: Post-task questionnaire
Figure 7: Final questionnaire

from the test users so that they could feel free to give ratings and comments without being conscious of others. Afterfinishing the questionnaire, the users were asked to click the "NEXT" button to continue to the second task, whichwould again take 6 minutes.
Test users did a total of 12 tasks (i.e. 12 different queries) in this fashion, and at the end of 6th task there was a10 - 15 minute break to provide them with rest so that their performance would not be influenced by their tiredness toomuch in later tasks. During the break they were provided with refreshments (coffee/tea with biscuits), and asked to feelfree to go out of the lab or chat with other test users or with the experimenter and assistants while having refreshment.
At the end of 12th task (last task), the screen displayed a summary of 3 browsers with the final questionnaire(see Figure 7 above). This asks them to rate the browsers by their task completion efficiency and their subjectivepreference, with plenty of space for any comments and suggestions on any aspect of the browsers and the testing on thewhole.
Finally, the test users clicked the "END" button at the bottom, which displayed a simple thanking messageindicating the end of the session. Test users were asked to plug off the headphones or earphones they used and bring itwith them.
Considering the long duration of each session of 3 hours or so, the middle break and the highly interactive andnovel video browsers seemed to keep the users active and engaged throughout. There was no monetary payment fortheir participation, but the interaction with interesting video browsers, free refreshment and free headphones orearphones seemed to be relatively effective.
2.2.2 Avoiding Bias in the ExperimentsThere was concern that without careful planning the integrity of our experiments could be compromised by the problemof user bias. There are a number of reasons why this could be the case:
• A user may become too familiar with the browser interfaces as more topics were processed. Since the userswere operating under time constraints it is feasible that a user may be quicker at finding relevant clips afterusing a particular browser on a number of previous occasions.
• A user may become too familiar with the dataset and remember where some video clips had been seen before.We had to avoid the possibility of all users processing topics in some standard order, which would aid theexpected user performance on latter topics.
To avoid this problem we had to avoid presenting the users with a number of topics in a uniform order. We didnot wish to limit the number of topics that a user processed and therefore we designed the experiment to facilitate eachtopic being processed (in random order) by twelve different users from among the total of 30 users. Each user processedtwelve topics resulting in a total of 360 user results. Before running the experiments, we drew up the followingconstraints:
• That no user processes the same topic twice, regardless of the interface used.• That each user processes twelve topics using the three browsers, where each browser was used four times, and
the browsers were presented in random order. In this way, the results provided to the system will not beskewed by one user gaining more experience with one browser over the others.
• That each topic must be processed by the same number of users (12) and each interface used for a topic mustalso be processed by the same number of users (4).
• That, like the browsers, the order in which the topics are processed by each user must be random. In this waywe hoped to avoid any issues arising out of the fact that many users could process a particular topic later on inthe experiment when these users would be more familiar with the interfaces and dataset.
The following table shows a summary of the experiment variables.
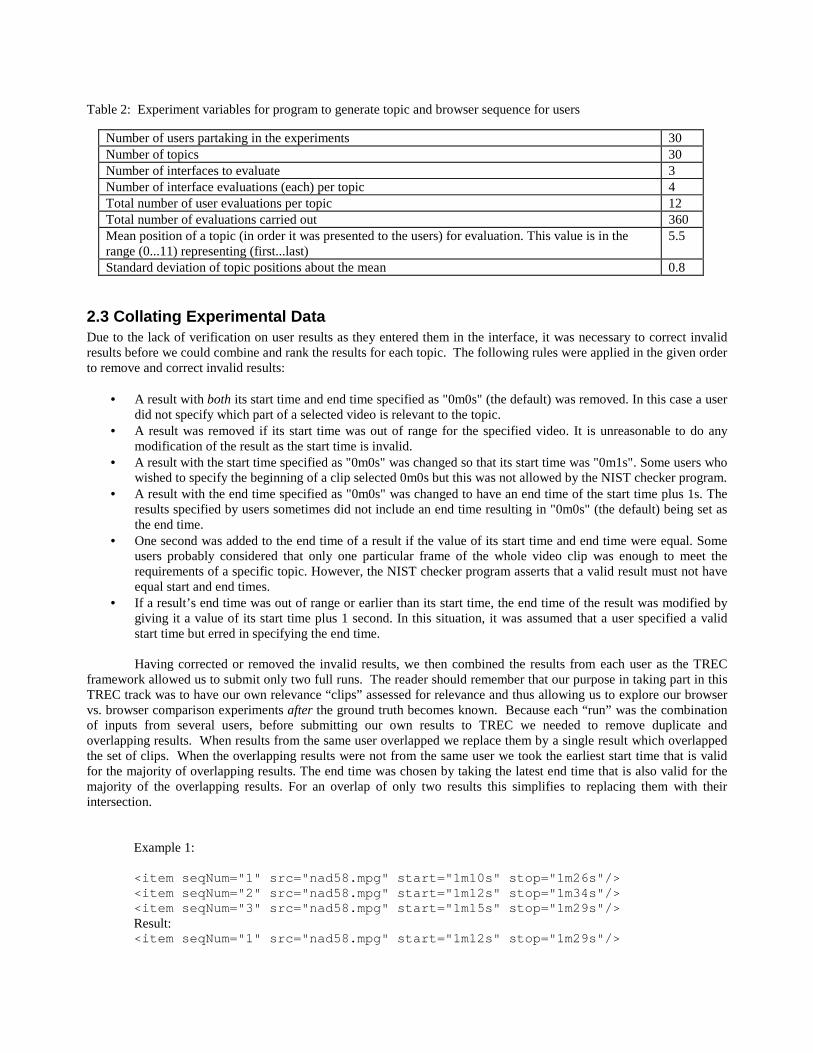
Table 2: Experiment variables for program to generate topic and browser sequence for users
Number of users partaking in the experiments 30Number of topics 30Number of interfaces to evaluate 3Number of interface evaluations (each) per topic 4Total number of user evaluations per topic 12Total number of evaluations carried out 360Mean position of a topic (in order it was presented to the users) for evaluation. This value is in therange (0...11) representing (first...last)
5.5
Standard deviation of topic positions about the mean 0.8
2.3 Collating Experimental DataDue to the lack of verification on user results as they entered them in the interface, it was necessary to correct invalidresults before we could combine and rank the results for each topic. The following rules were applied in the given orderto remove and correct invalid results:
• A result with both its start time and end time specified as "0m0s" (the default) was removed. In this case a userdid not specify which part of a selected video is relevant to the topic.
• A result was removed if its start time was out of range for the specified video. It is unreasonable to do anymodification of the result as the start time is invalid.
• A result with the start time specified as "0m0s" was changed so that its start time was "0m1s". Some users whowished to specify the beginning of a clip selected 0m0s but this was not allowed by the NIST checker program.
• A result with the end time specified as "0m0s" was changed to have an end time of the start time plus 1s. Theresults specified by users sometimes did not include an end time resulting in "0m0s" (the default) being set asthe end time.
• One second was added to the end time of a result if the value of its start time and end time were equal. Someusers probably considered that only one particular frame of the whole video clip was enough to meet therequirements of a specific topic. However, the NIST checker program asserts that a valid result must not haveequal start and end times.
• If a result’s end time was out of range or earlier than its start time, the end time of the result was modified bygiving it a value of its start time plus 1 second. In this situation, it was assumed that a user specified a validstart time but erred in specifying the end time.
Having corrected or removed the invalid results, we then combined the results from each user as the TRECframework allowed us to submit only two full runs. The reader should remember that our purpose in taking part in thisTREC track was to have our own relevance “clips” assessed for relevance and thus allowing us to explore our browservs. browser comparison experiments after the ground truth becomes known. Because each “run” was the combinationof inputs from several users, before submitting our own results to TREC we needed to remove duplicate andoverlapping results. When results from the same user overlapped we replace them by a single result which overlappedthe set of clips. When the overlapping results were not from the same user we took the earliest start time that is validfor the majority of overlapping results. The end time was chosen by taking the latest end time that is also valid for themajority of the overlapping results. For an overlap of only two results this simplifies to replacing them with theirintersection.
Example 1:
<item seqNum="1" src="nad58.mpg" start="1m10s" stop="1m26s"/><item seqNum="2" src="nad58.mpg" start="1m12s" stop="1m34s"/><item seqNum="3" src="nad58.mpg" start="1m15s" stop="1m29s"/>Result:<item seqNum="1" src="nad58.mpg" start="1m12s" stop="1m29s"/>

Example 2:
<item seqNum="4" src="anni010.mpg" start="1m4s" stop="1m25s"/><item seqNum="5" src="anni010.mpg" start="1m20s" stop="3m52s"/>Result:<item seqNum="4" src="anni010.mpg" start="1m20s" stop="1m25s"/>
Finally the query results for each topic were ranked based on the number of duplicates that produced eachresult. The greater the number of duplicates the higher the ranking assigned to a result. For example: a result A wasderived from three duplicate results and a result B from four duplicates, then result B will be allocated a higherprecedence. The result items within these precedence levels were further ranked by the number of results for the videoin the source results of the topic: the more results from a source video, the higher its ranking.
2.4 Interactive Search Task Results and AnalysisThe precision and recall figures for our interactive search results are available in Table 3. The results for the searchtopics are separated into two groups, general topics and known item topics. Topics from these two groups wereevaluated differently. The general topics are general statements of information need. The known item topics on theother hand are a more specific information need and their correct results, the known items, were specified during topiccreation. The general topics have higher evaluation cost and these are evaluated using human assessors who look ateach result and give a judgement of whether it is relevant or non-relevant. Currently, precision is available for thesetopics but recall figures for this type of search are unavailable. For the known item topics it is possible to evaluate themusing an automatic method. So far, an overlap measure is used to automatically classify the results for these knownitem topics as relevant or non-relevant. The overlap measure has two control parameters, minimum known itemcoverage and minimum result item coverage that determine whether a result item is considered to match a known item.A result item is considered to match a known item if and only if the following two conditions hold:
1. The ratio of the length of the intersection of the result item and the known item to the length of the knownitem is at least as large as the minimum known item coverage.
2. The ratio of the length of the intersection of the result item and the known item to the length of the resultitem is at least as large as the minimum result item coverage.
Table 3: General Search and Known Item Precision and Recall
Search Type MinimumKnown ItemCoverage
MinimumResult ItemCoverage
Precision Recall
General Search N/A N/A 0.84 N/AKnown Item ('low' recall, 'low' precision) 0.333 0.333 0.298 0.419Known Item ('low' recall, 'high' precision) 0.333 0.666 0.236 0.356Known Item ('high' recall, 'low' precision) 0.666 0.333 0.226 0.300Known Item ('high' recall, 'high' precision) 0.666 0.666 0.164 0.237
The known item recall and precision has been calculated at four different combinations of the controlparameters (Table 3). The performance of our general topic results (P=0.84) is far higher than for our known item topicresults (P=0.298) even at the most generous of control parameters 0.333, 0.333. We believe that this is a result of thedifferent evaluation methods used for the topic types instead of some fundamental difference between the topics in thetwo types. A lower control parameter level of say 0.2 or 0.1 may result in the overlap measure giving results that arecloser to those the human assessors were giving for the topics. Further exploration of the result of the overlap measureat different control parameter values is required and this will be done by us, post-TREC.
The search types known item search and general search are not as distinctive as their labels and differentevaluation methods may suggest. In some cases a topic could be either a known item or a general search depending onwhether the submitting group indicated the results when submitting the topic. For example Topic 24: “Find all pictures

of R. Lynn Bondurant” is classified as a general search. But Topic 22: “Find pictures of Harry Hertz…” and Topic 23:“Find images of Lou Gossett Jr.” are classified as known item searches not general searches. Also some of thecurrently classified known item searches could also be classified as general. For example, Topic 30: “Scenes withbuildings similar to dome-shaped House of Congress” could be a general search not a known item search. The topicsthat are classified into search types general and not general (known item) is more a result of whether we specifiedqueries with known results or not, rather than of some fundamental difference.
Some of the loss of precision by our users can be put down to the lack of fine-grained frame-level editingfacilities for their search results. Once a user added a search result it was set in stone and could not be refined orremoved. Furthermore, a user specified the start and stop boundaries on a video clip to the nearest second, whereas theTREC evaluation is much more fine-grained than that and this obviously resulted in some irrelevant videos beingincluded in our submissions. The precision loss for our results may also be attributed to the different interpretation ofrelevance by the assessors or topic creators and by our test users as our users sometimes were more willing to accept aclip as relevant. This may just be the nature of the experiment in that we did not stress enough to the users that theyshould be completely sure of relevance to the topic before adding it as a result. It is also probable that our users thoughtthat having some result was better than none so, they may have knowingly added results that were nearly correct.
Interface errors and interpretation errors may account for the loss of precision in the general search results butit cannot account for the far lower results in the known item search results. In fact, for 5 of the known item queries nocorrect results were found using the overlap measure at the parameter level 0.333, 0.333 – that is the precision andrecall value was 0 (Topic 1, 27, 28, 29, 33). On inspection of our results it is clear that our users found correct resultsbut they did not enter the start time and end time strictly enough and did not segment adjacent results into separateresults. For example, for topic 1 our system 1st result (10 seconds long) overlaps 3 of the known item results but underthe overlap measure even at parameter values 0.333, 0.333 none of the 3 known-items are attributed as matched (.5, 3, 2seconds intersections respectively). Since the current overlap measure does not take into account other known itemsoverlapping the results item when calculating result item coverage ratio it is unforgiving when a user has specified asingle result that contains temporally close known-items. Some of the known items are less than a second apart (0.5s inTopic 1). The test users without prior explicit direction may interpret known-items in adjacent shots as one result.
Even without the multiple known items in a result issue the precision at which our users specified the resultswas to seconds. Often users specified results with more than a couple of seconds padding before and after the knownitem. For a known item of small duration the results item coverage would be very small and therefore it may not befound relevant at result item overlap coverage of 0.333 or greater. In Topic 1 alone two known items are 0.5s long andanother is 0.6s long. If our test users had the facilities to segment and refine their results to more exact timing than toseconds the results would be considerably improved. Of course, we should also have stressed to the users during theexperiment that they should only add the maximum relevant continuous camera shot segment that matches the topic.
Our results show that our known item results are slightly more sensitive to known item coverage than to resultitem coverage, but the difference is not great. The majority overlap measure degrades into intersection for situationswhere there are only two overlapping results (Section 2.3). If the overlapping results are both covering two differentbut temporally close known items, then the intersection will be covering neither. This may account for why ourexperiment is more sensitive to known item coverage. Perhaps, the overlapping measure should be changed to startpoint calculated as the mid point of start points and end point calculated as the mid point of end points of the twooverlapping results in this special case of only two overlapping results. But even still this would result in a single resultthat probably only partially covers the two known items. And with the current metric even at the 0.333, 0.333parameter level no known item may be matched. It may be even better to replace the majority voting method foroverlap to one of average start time and average end time. These are all issues which we need to address in the nearfuture.
3. Shot Boundary DetectionThe Shot Boundary Detection system we evaluated in the video track makes use of the compression features of MPEGencoded video. This was done in order to achieve performance with a minimum of processing requirements as thedecoding of MPEG video sequences is relatively time consuming and in areas where speed is an issue, compresseddomain processing can offer high accuracy in a fraction of real time.

The MPEG video standard [LeGall et al. 96] achieves compression by exploiting the data redundancy present invideo sequences. As Shot Boundary Detection is a temporal segmentation of a video sequence, the temporalcompression features of the MPEG video standard can be used to help the Shot Boundary Detection task. Themacroblock is a primary element in the MPEG standard and has a determinant role in the temporal compression of thevideo. The following considerations have been used for our Shot Boundary Detection:
• In general for most B frames a video encoder will trend to favour bi-directional predicted macroblocks in orderto achieve better compression.
• B frames tend to use preponderant prediction from the nearest reference frame. Thus in a group of pictureswith RBBR encoding pattern (where R denotes a reference frame and B a B frame), first B frame would havedominant prediction from first R frame and second B frame from second R frame. That led to a bigger numberof forward predicted macroblocks than backward predicted macroblocks in first B frame and opposite forsecond B frame.
If a macroblock distribution in the currently evaluated frame sequence does not comply with the considerationsabove it is highly probable that a shot boundary has occurred and the changing of the dominant reference frame woulddesignate the exact position of a shot boundary. An increase of the intra-coded macroblocks in the P frames mayindicate a possible gradual transition.
It is evident that the files from Shot Boundary Detection test collection for the video track come from a fewdistinct encoding sources and it likely that we will have similar content and video coding effects within files providedfrom the same source. Therefore, because of resources available to us at the time, it was not considered possible to carryout an evaluation over the entire collection. For evaluation we selected a set of five representative files, one from eachsource, regarding as representative the file with the longest playing time within each source or the file which apparentlycontains more or more complex, shot transitions. Furthermore, as our Shot Boundary Detection system is based onvideo compressed domain features, characteristics of the video encoders such as image size, frame encoding pattern andthe encoded macroblock types, were considered in order to select various encoding parameters. Our official results arepresented below in Table 4 for all transition types.
Table 4: Shot Boundary Detection performance figures for 5 files from the dataset
Files \ Metrics Referencetransitions
Deletion rateDR
Insertion rateIR
PrecisionPr
RecallRe
ahf1.mpg 107 0.158 0.074 0.919 0.850anni009.mpg 103 0.708 0.009 0.967 0.291bor03.mpg 237 0.573 0.050 0.893 0.426ldoi874a_s1_02_004.mpg 7 0.00 0.142 0.875 1.00nad28.mpg 298 0.221 0.050 0.939 0.778
Weighted column mean 0.386 0.049 0.925 0.613
Our Shot Boundary Detection work will be evaluated on the full dataset at a later time and our results aboveare not directly comparable to the results of other TREC track participants. However, the most interesting part of thework we report above is the computation time taken; running on a 733 MHz Pentium III PC with 256 MB RAMrunning Red Hat 7.0 Linux, the 76 min 39s of video took 4 minutes and 2 seconds of computation time, about 5% ofreal time.
4. ConclusionsOur results for general search topics and known item topics show two very different results for precision and recall eventhough both sets of topics were performed under the same environmental conditions. Indeed, our users were unaware ofthe query types when performing the search tasks for each topic. Adjusting the metric used in the known-item search to

account for our particular “flexibility” in determining the start and end of clips identified by users, will be necessary andwill be done post-TREC. We will also experiment more with different ways of collating independently gathered resultsinto one non-overlapping ranked results list. The current method may not be one of the best but without furtherexperimentation this is but guesswork. Further study of our results for individual users and of the browsers will beconducted.
References
[LeGall et al. 96] LeGall, D., Mitchell, J.L., Pennbaker, W.B. and Fogg, C.E. MPEG video compression standard.Chapman & Hall, New York, USA, 1996.
[Mills et al. 92] Mills, M., Cohen, J. and Wong, Y-Y. A magnifier tool for video data. Proceedings of the ACMConference on Human Factors in Computing Systems (CHI '92), Monterey, CA, 3-7 May, 1992, 93-98.
[O'Connor et al. 01] O'Connor, N., Marlow, S., Murphy, N., Smeaton, A.F., Browne, P., Deasy, S., Lee, H. and McDonald, K. Físchlár: an on-line system for indexing and browsing of broadcast television content. Proceedings of the26th International Conference on Acoustics, Speech, and Signal Processing (ICASSP 2001), Salt Lake City, UT, 7-11May, 2001.
[Zhang et al. 95] Zhang, H., Low, C., Smoliar, S. and Wu, J. Video parsing, retrieval and browsing: an integrated andcontent-based solution. Proceedings of 3rd ACM International Conference on Multimedia (MM ’95), San Francisco,CA, 5-9 November, 1995, 503-512.