dtz property times paris cbd q2 2011 -...
TRANSCRIPT
www.dtz.com 1
Property Times Paris CBD Q2 2011
CBD confirms its recovery
25 July 2011
Contents Executive summary 1 Economic climate 2 Paris Central Business District 3-4 Key figures 5 Definitions 6 Contacts 7
Author Massinissa Fedala Analyst +33 (0)1 49 64 46 29 [email protected]
Contacts Delphine Mahé Head of France Research +33 (0)1 49 64 47 91 [email protected] Magali Marton Head of CEMEA Research +33 (0)1 49 64 49 54 [email protected] Tony McGough Global Head of Forecasting & Strategy Research +44 (0)20 3296 2314 [email protected] Hans Vrensen Global Head of Research +44 (0)20 3296 2159 [email protected]
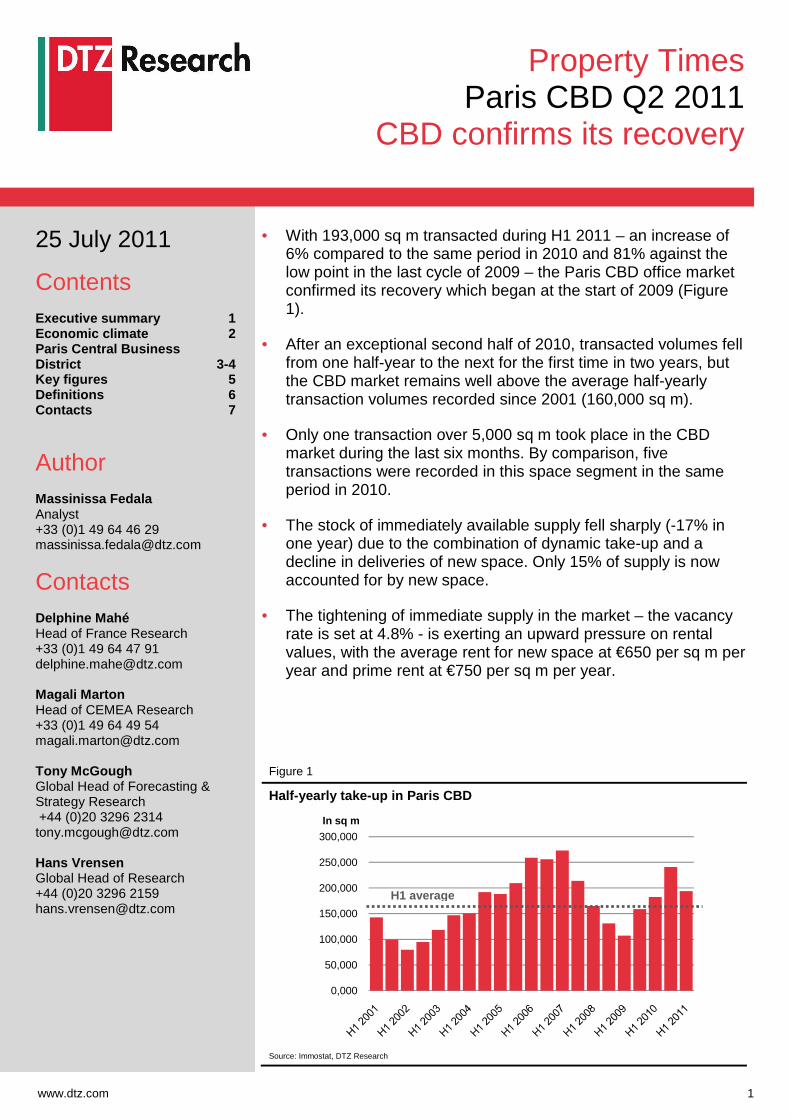
• With 193,000 sq m transacted during H1 2011 – an increase of 6% compared to the same period in 2010 and 81% against the low point in the last cycle of 2009 – the Paris CBD office market confirmed its recovery which began at the start of 2009 (Figure 1).
• After an exceptional second half of 2010, transacted volumes fell from one half-year to the next for the first time in two years, but the CBD market remains well above the average half-yearly transaction volumes recorded since 2001 (160,000 sq m).
• Only one transaction over 5,000 sq m took place in the CBD market during the last six months. By comparison, five transactions were recorded in this space segment in the same period in 2010.
• The stock of immediately available supply fell sharply (-17% in one year) due to the combination of dynamic take-up and a decline in deliveries of new space. Only 15% of supply is now accounted for by new space.
• The tightening of immediate supply in the market – the vacancy rate is set at 4.8% - is exerting an upward pressure on rental values, with the average rent for new space at €650 per sq m per year and prime rent at €750 per sq m per year.
Figure 1
Half-yearly take-up in Paris CBD
Source: Immostat, DTZ Research
0,000
50,000
100,000
150,000
200,000
250,000
300,000
In sq m
H1 average
Offices – Paris CBD
www.dtz.com 2
• The European economic climate remains marked by the increasingly significant difficulties of a Greek economy crippled by debt and on the verge of bankruptcy. At the end of June, a new episode was added to the soap opera of peripheral sovereign debts whose ratings have once again been downgraded several notches by the ratings agencies. In order to minimise the risk of contagion, the twenty-seven member states have given the green light to a new bailout of €12 billion, and are already working on a second support plan of €120 billion which would take over the current €110 billion plan adopted in May 2010.
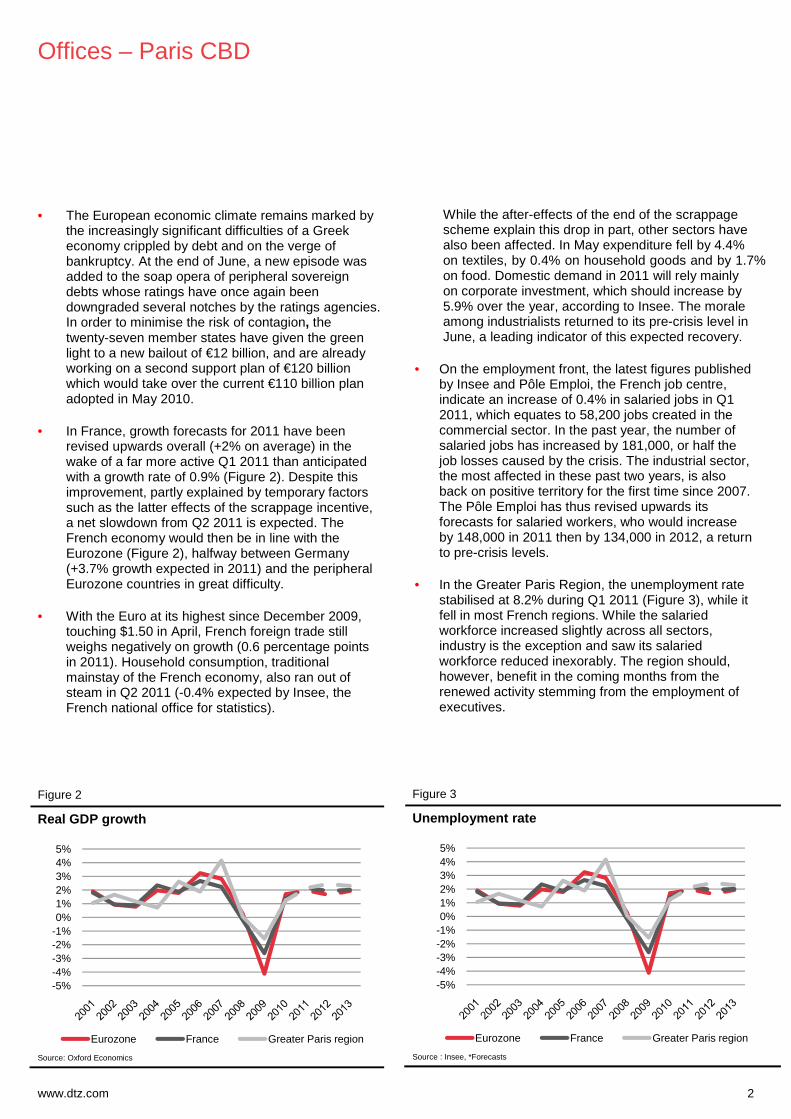
• In France, growth forecasts for 2011 have been revised upwards overall (+2% on average) in the wake of a far more active Q1 2011 than anticipated with a growth rate of 0.9% (Figure 2). Despite this improvement, partly explained by temporary factors such as the latter effects of the scrappage incentive, a net slowdown from Q2 2011 is expected. The French economy would then be in line with the Eurozone (Figure 2), halfway between Germany (+3.7% growth expected in 2011) and the peripheral Eurozone countries in great difficulty.
• With the Euro at its highest since December 2009, touching $1.50 in April, French foreign trade still weighs negatively on growth (0.6 percentage points in 2011). Household consumption, traditional mainstay of the French economy, also ran out of steam in Q2 2011 (-0.4% expected by Insee, the French national office for statistics).
Figure 2
Real GDP growth
Source: Oxford Economics
While the after-effects of the end of the scrappage scheme explain this drop in part, other sectors have also been affected. In May expenditure fell by 4.4% on textiles, by 0.4% on household goods and by 1.7% on food. Domestic demand in 2011 will rely mainly on corporate investment, which should increase by 5.9% over the year, according to Insee. The morale among industrialists returned to its pre-crisis level in June, a leading indicator of this expected recovery.
• On the employment front, the latest figures published by Insee and Pôle Emploi, the French job centre, indicate an increase of 0.4% in salaried jobs in Q1 2011, which equates to 58,200 jobs created in the commercial sector. In the past year, the number of salaried jobs has increased by 181,000, or half the job losses caused by the crisis. The industrial sector, the most affected in these past two years, is also back on positive territory for the first time since 2007. The Pôle Emploi has thus revised upwards its forecasts for salaried workers, who would increase by 148,000 in 2011 then by 134,000 in 2012, a return to pre-crisis levels.
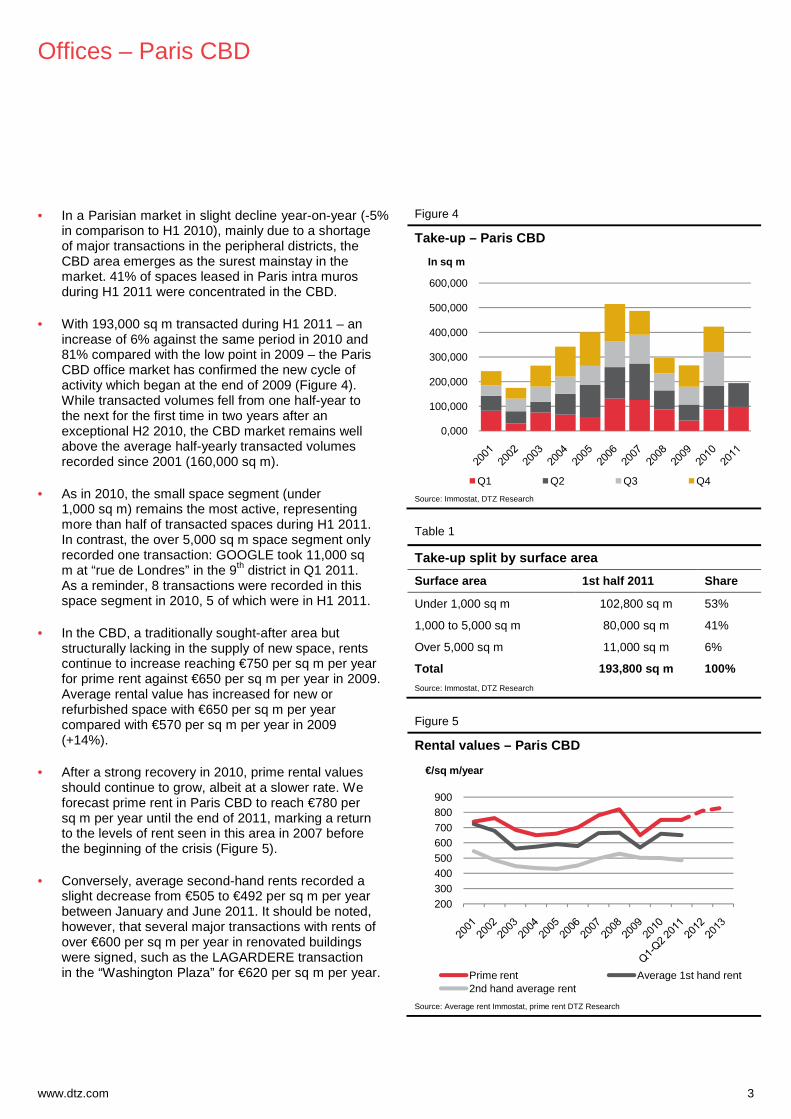
• In the Greater Paris Region, the unemployment rate stabilised at 8.2% during Q1 2011 (Figure 3), while it fell in most French regions. While the salaried workforce increased slightly across all sectors, industry is the exception and saw its salaried workforce reduced inexorably. The region should, however, benefit in the coming months from the renewed activity stemming from the employment of executives.
Figure 3
Unemployment rate
Source : Insee, *Forecasts
-5%-4%-3%-2%-1%0%1%2%3%4%5%
Eurozone France Greater Paris region
-5%-4%-3%-2%-1%0%1%2%3%4%5%
Eurozone France Greater Paris region
Offices – Paris CBD
www.dtz.com 3
• In a Parisian market in slight decline year-on-year (-5% in comparison to H1 2010), mainly due to a shortage of major transactions in the peripheral districts, the CBD area emerges as the surest mainstay in the market. 41% of spaces leased in Paris intra muros during H1 2011 were concentrated in the CBD.
• With 193,000 sq m transacted during H1 2011 – an increase of 6% against the same period in 2010 and 81% compared with the low point in 2009 – the Paris CBD office market has confirmed the new cycle of activity which began at the end of 2009 (Figure 4). While transacted volumes fell from one half-year to the next for the first time in two years after an exceptional H2 2010, the CBD market remains well above the average half-yearly transacted volumes recorded since 2001 (160,000 sq m).
• As in 2010, the small space segment (under 1,000 sq m) remains the most active, representing more than half of transacted spaces during H1 2011. In contrast, the over 5,000 sq m space segment only recorded one transaction: GOOGLE took 11,000 sq m at “rue de Londres” in the 9th district in Q1 2011. As a reminder, 8 transactions were recorded in this space segment in 2010, 5 of which were in H1 2011.
• In the CBD, a traditionally sought-after area but structurally lacking in the supply of new space, rents continue to increase reaching €750 per sq m per year for prime rent against €650 per sq m per year in 2009. Average rental value has increased for new or refurbished space with €650 per sq m per year compared with €570 per sq m per year in 2009 (+14%).
• After a strong recovery in 2010, prime rental values should continue to grow, albeit at a slower rate. We forecast prime rent in Paris CBD to reach €780 per sq m per year until the end of 2011, marking a return to the levels of rent seen in this area in 2007 before the beginning of the crisis (Figure 5).
• Conversely, average second-hand rents recorded a slight decrease from €505 to €492 per sq m per year between January and June 2011. It should be noted, however, that several major transactions with rents of over €600 per sq m per year in renovated buildings were signed, such as the LAGARDERE transaction in the “Washington Plaza” for €620 per sq m per year.
Figure 4
Take-up – Paris CBD
Source: Immostat, DTZ Research
Table 1
Take-up split by surface area
Surface area 1st half 2011 Share
Under 1,000 sq m 102,800 sq m 53%
1,000 to 5,000 sq m 80,000 sq m 41%
Over 5,000 sq m 11,000 sq m 6%
Total 193,800 sq m 100%
Source: Immostat, DTZ Research
Figure 5
Rental values – Paris CBD
Source: Average rent Immostat, prime rent DTZ Research
0,000
100,000
200,000
300,000
400,000
500,000
600,000
In sq m
Q1 Q2 Q3 Q4
200300400500600700800900
€/sq m/year
Prime rent Average 1st hand rent2nd hand average rent
Offices – Paris CBD
www.dtz.com 4
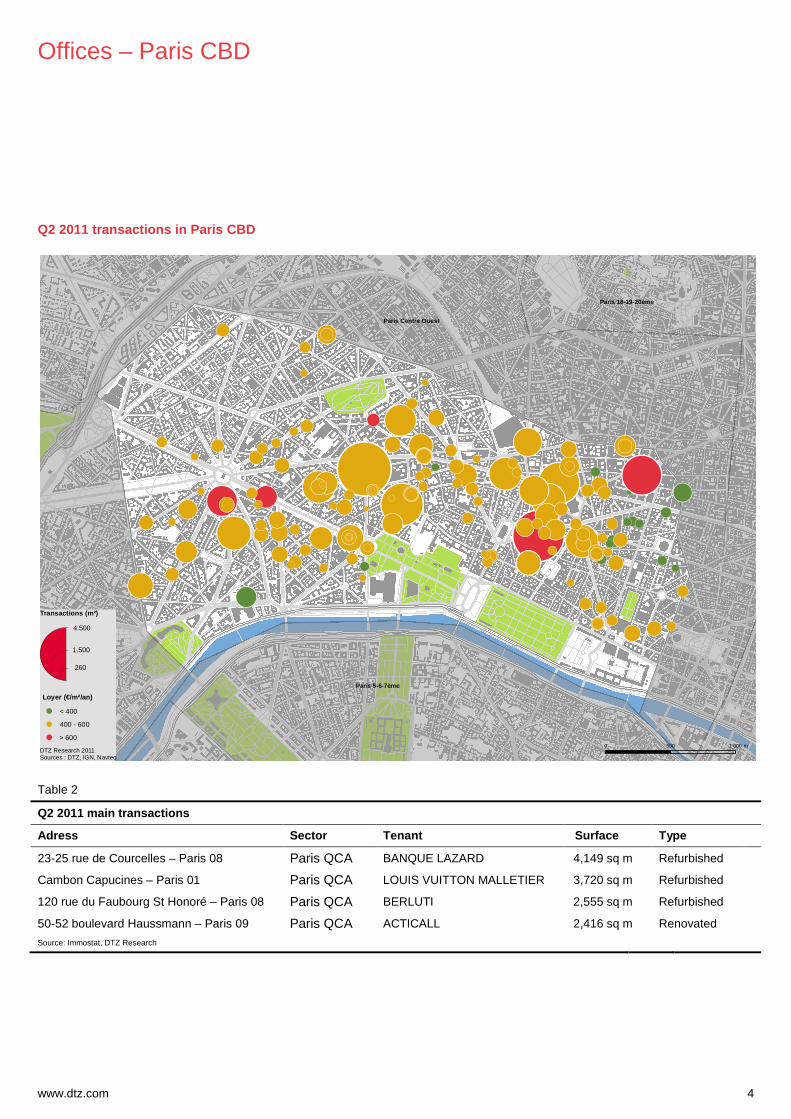
Q2 2011 transactions in Paris CBD
Table 2
Q2 2011 main transactions
Adress Sector Tenant Surface Type
23-25 rue de Courcelles – Paris 08 Paris QCA BANQUE LAZARD 4,149 sq m Refurbished
Cambon Capucines – Paris 01 Paris QCA LOUIS VUITTON MALLETIER 3,720 sq m Refurbished
120 rue du Faubourg St Honoré – Paris 08 Paris QCA BERLUTI 2,555 sq m Refurbished
50-52 boulevard Haussmann – Paris 09 Paris QCA ACTICALL 2,416 sq m Renovated
Source: Immostat, DTZ Research
!(
!(!(
!(
!(
!(
!(!(
!(
!(
!(
!( !(
!(!(
!(
!(
!(
!(
!(
!(
!(
!(
!(
!(
!(
!(!(
!(!(
!(!(
!(
!(
!(!(!(
!(!(
!(!(
!(
!(
!(
!(
!(
!(
!(!(
!(
!(!(
!( !(
!(
!(
!( !(
!(
!(
!(
!(!(!(
!( !(
!(
!(
!(
!(!(
!(
!(
!(
!(
!(
!(
!(
!(
!(
!(!(!(
!(
!(
!(
!(!(
!(
!(!(
!(
!(
!(
!(
!(!(!(
!(
!(
!(
!(
!(
!( !(!(
!(
!(!(
!(
!(
!(
!(
!(
!(
!(
!(!(
!(
!(
!(
!(
!(
!(
!(
!(
!(
!(
!(
!(
!(
!(
!(
!(
!(
!(
!(
!(
!(
!(!(!(
!(
!(
!(
!(
!(
!(
!(!(
!(
!(
!(
!(
!(
!(
!(
!(!(
!(
!(
!(
!(
!(
!(
!(
!(!(
!(
!(
!(
!(
!(
!(
Paris Centre Ouest
Paris 5-6-7ème
Paris 18-19-20ème
0 500 1 000 mDTZ Research 2011Sources : DTZ, IGN, Navteq
!(
!(
!( < 400
> 600
400 - 600
Loyer (€/m²/an)
Transactions (m²)
4.500
1.500
260
Offices – Paris CBD
www.dtz.com 5
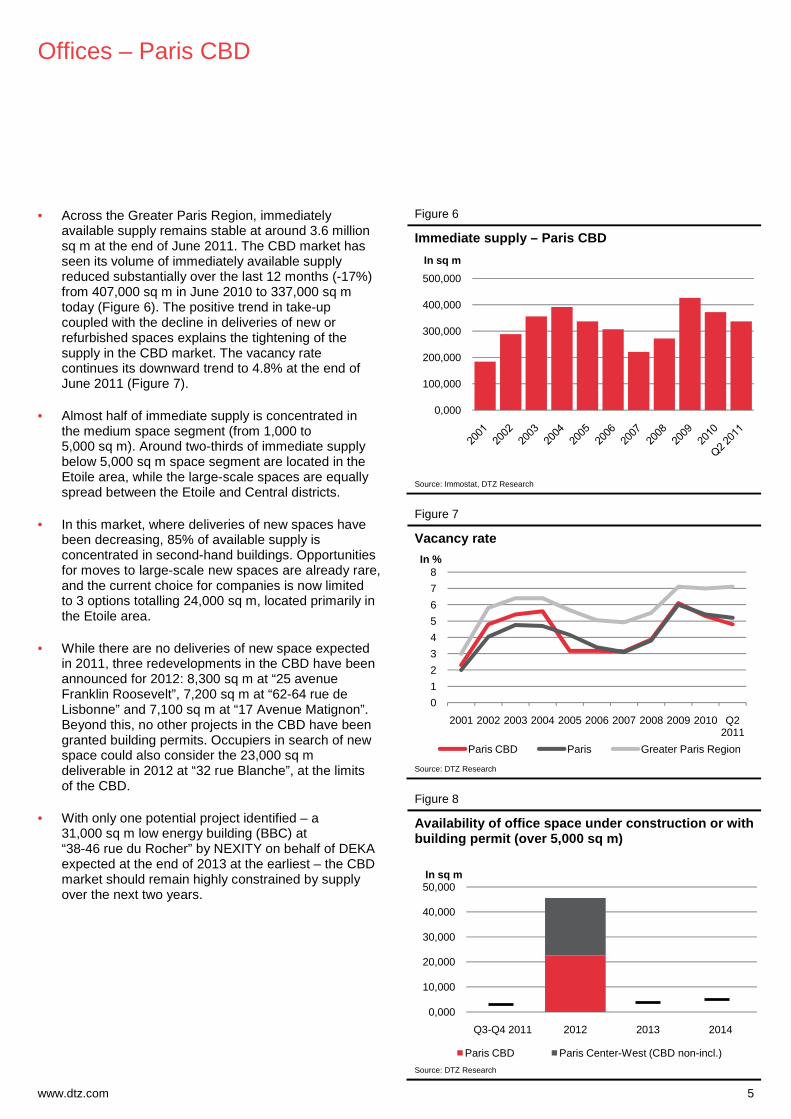
• Across the Greater Paris Region, immediately available supply remains stable at around 3.6 million sq m at the end of June 2011. The CBD market has seen its volume of immediately available supply reduced substantially over the last 12 months (-17%) from 407,000 sq m in June 2010 to 337,000 sq m today (Figure 6). The positive trend in take-up coupled with the decline in deliveries of new or refurbished spaces explains the tightening of the supply in the CBD market. The vacancy rate continues its downward trend to 4.8% at the end of June 2011 (Figure 7).
• Almost half of immediate supply is concentrated in the medium space segment (from 1,000 to 5,000 sq m). Around two-thirds of immediate supply below 5,000 sq m space segment are located in the Etoile area, while the large-scale spaces are equally spread between the Etoile and Central districts.
• In this market, where deliveries of new spaces have been decreasing, 85% of available supply is concentrated in second-hand buildings. Opportunities for moves to large-scale new spaces are already rare, and the current choice for companies is now limited to 3 options totalling 24,000 sq m, located primarily in the Etoile area.
• While there are no deliveries of new space expected in 2011, three redevelopments in the CBD have been announced for 2012: 8,300 sq m at “25 avenue Franklin Roosevelt”, 7,200 sq m at “62-64 rue de Lisbonne” and 7,100 sq m at “17 Avenue Matignon”. Beyond this, no other projects in the CBD have been granted building permits. Occupiers in search of new space could also consider the 23,000 sq m deliverable in 2012 at “32 rue Blanche”, at the limits of the CBD.
• With only one potential project identified – a 31,000 sq m low energy building (BBC) at “38-46 rue du Rocher” by NEXITY on behalf of DEKA expected at the end of 2013 at the earliest – the CBD market should remain highly constrained by supply over the next two years.
Figure 6
Immediate supply – Paris CBD
Source: Immostat, DTZ Research
Figure 7
Vacancy rate
Source: DTZ Research
Figure 8
Availability of office space under construction or with building permit (over 5,000 sq m)
Source: DTZ Research
0,000
100,000
200,000
300,000
400,000
500,000
In sq m
0
1
2
3
4
5
6
7
8
2001 2002 2003 2004 2005 2006 2007 2008 2009 2010 Q2 2011
In %
Paris CBD Paris Greater Paris Region
0,000
10,000
20,000
30,000
40,000
50,000
Q3-Q4 2011 2012 2013 2014
In sq m
Paris CBD Paris Center-West (CBD non-incl.)
Key figures
www.dtz.com 6
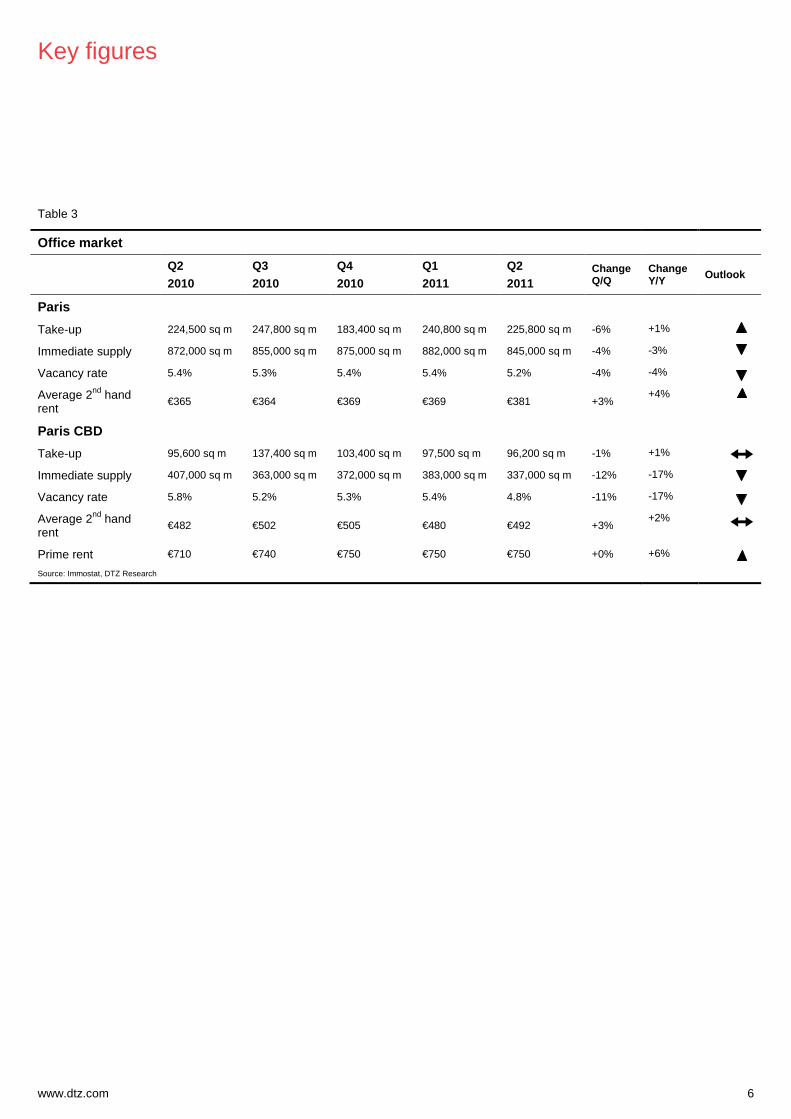
Table 3
Office market
Q2 2010
Q3 2010
Q4 2010
Q1 2011
Q2 2011
Change Q/Q
Change Y/Y Outlook
Paris
Take-up 224,500 sq m 247,800 sq m 183,400 sq m 240,800 sq m 225,800 sq m -6% +1%
Immediate supply 872,000 sq m 855,000 sq m 875,000 sq m 882,000 sq m 845,000 sq m -4% -3%
Vacancy rate 5.4% 5.3% 5.4% 5.4% 5.2% -4% -4%
Average 2nd hand rent
€365 €364 €369 €369 €381 +3% +4%
Paris CBD
Take-up 95,600 sq m 137,400 sq m 103,400 sq m 97,500 sq m 96,200 sq m -1% +1%
Immediate supply 407,000 sq m 363,000 sq m 372,000 sq m 383,000 sq m 337,000 sq m -12% -17%
Vacancy rate 5.8% 5.2% 5.3% 5.4% 4.8% -11% -17%
Average 2nd hand rent
€482 €502 €505 €480 €492 +3% +2%
Prime rent €710 €740 €750 €750 €750 +0% +6%
Source: Immostat, DTZ Research
Definitions
www.dtz.com 7
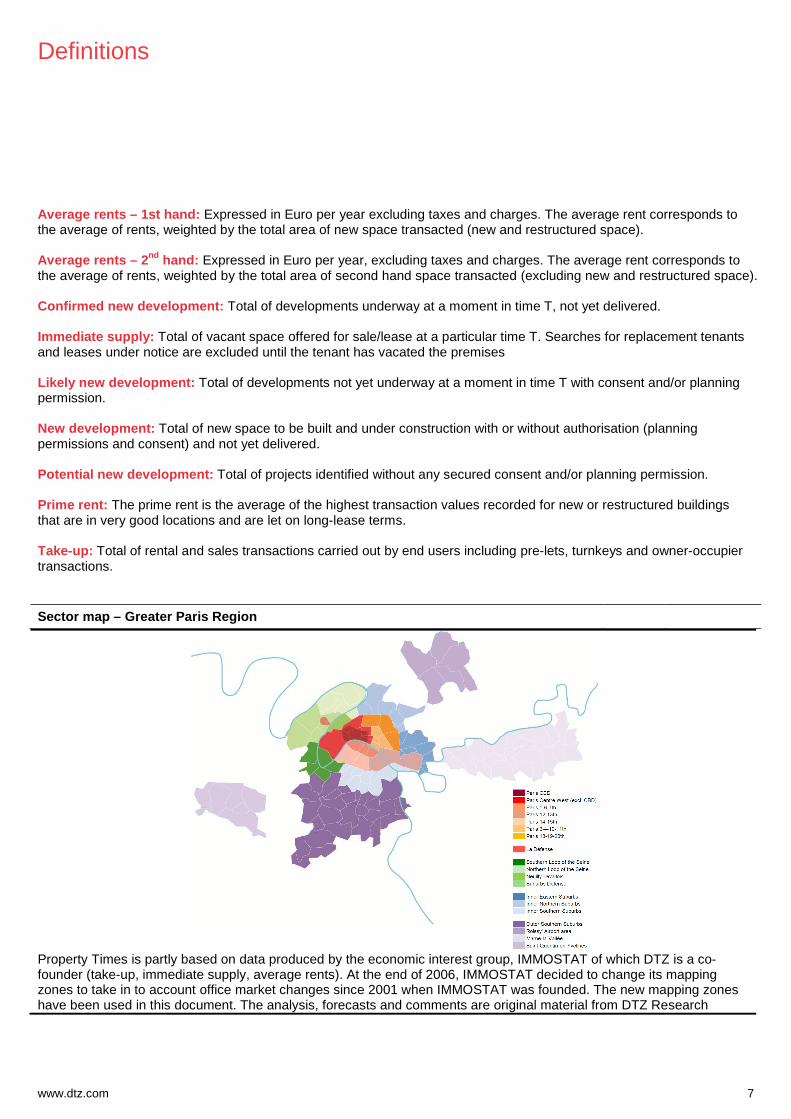
Average rents – 1st hand: Expressed in Euro per year excluding taxes and charges. The average rent corresponds to the average of rents, weighted by the total area of new space transacted (new and restructured space). Average rents – 2 nd hand: Expressed in Euro per year, excluding taxes and charges. The average rent corresponds to the average of rents, weighted by the total area of second hand space transacted (excluding new and restructured space). Confirmed new development: Total of developments underway at a moment in time T, not yet delivered. Immediate supply: Total of vacant space offered for sale/lease at a particular time T. Searches for replacement tenants and leases under notice are excluded until the tenant has vacated the premises Likely new development: Total of developments not yet underway at a moment in time T with consent and/or planning permission. New development: Total of new space to be built and under construction with or without authorisation (planning permissions and consent) and not yet delivered. Potential new development: Total of projects identified without any secured consent and/or planning permission. Prime rent: The prime rent is the average of the highest transaction values recorded for new or restructured buildings that are in very good locations and are let on long-lease terms. Take-up: Total of rental and sales transactions carried out by end users including pre-lets, turnkeys and owner-occupier transactions.
Sector map – Greater Paris Region
Property Times is partly based on data produced by the economic interest group, IMMOSTAT of which DTZ is a co-founder (take-up, immediate supply, average rents). At the end of 2006, IMMOSTAT decided to change its mapping zones to take in to account office market changes since 2001 when IMMOSTAT was founded. The new mapping zones have been used in this document. The analysis, forecasts and comments are original material from DTZ Research

Contacts
www.dtz.com 8
Gérard Margiocchi +33(0)1 47 48 77 32 [email protected]
Advisory
Jean-Philippe Carmarans +33(0)1 47 48 77 24 [email protected]
Philippe Méjean +33(0)1 49 64 49 21 [email protected]
Claudia Mansard +33(0)1 49 64 46 43 [email protected]
Investment
Gérard Margiocchi +33(0)1 47 48 77 32 [email protected]
Transaction
Guillaume Raquillet +33(0)1 49 64 49 45 [email protected]
Laurence Escleine-Dumas +33(0)1 49 64 49 04 [email protected]
DTZ Entreprises
Thierry Laborderie +33(0)1 49 64 64 45 [email protected]
Asset Management
François Brisset +33(0)1 49 64 49 13 [email protected]
Patrice Genre +33(0)1 49 64 49 80 [email protected]
www.dtz.com
Disclaimer
This report should not be relied upon as a basis for entering into transactions without seeking specific, qualified, professional advice. Whilst facts have been rigorously checked, DTZ can take no responsibility for any damage or loss suffered as a result of any inadvertent inaccuracy within this report. Information contained herein should not, in whole or part, be published, reproduced or referred to without prior approval. Any such reproduction should be credited to DTZ. © DTZ July 2011