drug financing in ethiopia tble of content page acknowledgment .. iii acronyms . iv list of figures
TRANSCRIPT
DRUG FINANCING IN ETHIOPIA
September 2007 Addis Ababa, Ethiopia
Federal Democratic Republic of Ethiopia
Ministry of Health World Health Organization
i
TBLE OF CONTENT Page Acknowledgment ……………………………………………………………………….. iii Acronyms ………………………………………………………………………………. iv List of figures …………………………………………………………………………… vi List of tables ……………………………………………………………………………. vii Executive Summary ……………………………………………………………………. 1 1 Introduction ……………………………………………………………………… 5
1.1 Geographic, socio-demographic and economic data …………………………... 5 1.2 The health sector ………………………………………………………………. 5
1.2.1 Health status …………………………………………………………... 5 1.2.2 The health delivery system …………………………………………… 5
1.3 The pharmaceutical sector …………………………………………………….. 6 1.3.1 Policy and regulation …………………………………………………. 6 1.3.2 Procurement and distribution …………………………………………. 6
1.4 Definition of drug and drug financing …………………………………………. 7 1.4.1 Definition of drug …………………………………………………….. 7 1.4.2 What is drug financing ……………………………………………….. 8
1.5 Rationale of the study ………………………………………………………….. 9 1.6 Objectives of the study ………………………………………………………… 9 1.7 Organization of the study report ……………………………………………….. 9
2 Methodology ……………………………………………………………………… 10 2.1 Data sources and data collection instruments ………………………………… 10
2.1.1 Government sources …………………………………………………. 10 2.1.2 Public enterprises ……………………………………………………... 11 2.1.3 Donor sources ………………………………………………………… 11 2.1.4 NGO sources …………………………………………………………. 12 2.1.5 Private sources………………………………………………………… 12 2.1.6 Drug supply and import ………………………………………………. 12
2.2 Data collection process ………………………………………………………… 13 2.3 Challenges in the data collection ……………………………………………… 14 2.4 Limitations of the study ………………………………………………………... 15
3 Findings of the study ……………………………………………………………… 16 3.1 Government budget and expenditure on drugs ………………………………… 16
3.1.1 Budget allocation and expenditure by federal Government Organizations…………………………………………………………..
17
3.1.2 Drug budget allocation and expenditure at the regional level ………… 20 3.1.3 Donors’ expenditure on drugs at regional level (BOH) ………………. 21 3.1.4 Summary of drug financing at regional level ………………………… 22 3.1.5 Summary of drug budget expenditure at federal and Regional
Governments levels……………………………………………………. 26
3.2 Major donors …………………………………………………………………... 28 3.2.1 UNICEF ………………………………………………………………. 28

ii
3.2.2 Global Fund …………………………………………………………... 28 3.2.3 UNFPA ………………………………………………………………. 29 3.2.4 WHO ………………………………………………………………….. 30 3.2.5 USAID ………………………………………………………………... 30
3.3 Expenditure by parastatals ……………………………………………………... 31 3.4 NGO expenditure ……………………………………………………………… 31
3.4.1 The role of NGOs ……………………………………………………. 31 3.4.2 Major players in the NGO sector …………………………………….. 33
3.4.2.1 Regional based NGOs ……………………………………………. 33 3.4.2.2 DKT ……………………………………………………………… 34
3.5 Private expenditure on drugs …………………………………………………... 34 3.5.1 Out-Of-Pocket expenditure on drugs by house holds …………………. 34 3.5.2 Expenditure by private enterprises ……………………………………. 35
3.5.2.1 Coverage by insurance companies ……………………………….. 35 3.5.2.2 Coverage by private employers ………………………………….. 36
4 Summary and conclusion ………………………………………………………… 38 4.1 Sources of drug finance ……………………………………………………….. 38 4.2 Per capita expenditure…………………………………………………………. 39 4.3 Conclusion…………………………………………………………………….. 40 4.4 Policy implications of the drug financing study ……………………………….. 42
4.4.1 Government expenditure on drugs ………………………………….. 42 4.4.2 The role of donors in drug financing ………………………………… 43 4.4.3 House hold expenditure on drugs …………………………………….. 43 4.4.4 Equity …………………………………………………………………. 43 4.4.5 The role of insurance intermediaries in managing drug financing ……. 43 4.4.6 Amount of finance ear marked for drugs ……………………………... 43 4.4.7 The role of social insurance …………………………………………... 44
4.5 Recommendations ……………………………………………………………... 44 Annexes
Annex I Drug supply and distribution in Ethiopia ……………………………... 45 Annex II List of donors to which queries were sent …………………………… 52
References …………………………………………………………………………… 53

iii
ACKNOWLEDGEMENT
This study on drug financing was commissioned by the Pharmaceutical Supplies and Logistics Department (PSLD) of the Federal Ministry of Health (FMOH) and conducted by ABD Consult with the financial support of the World Health Organization and European Community.
We would like to thank the different government organizations, NGOs, donors and the private sector organizations that collaborated with consultancy firm in providing the necessary information and data. Our special thanks go to MOFED, Regional Health Bureaus and the staff of PSLD/FMOH for their effort and time in providing the necessary data.
We also acknowledge with gratitude the contribution of all the people who participated in the stakeholders’ workshop in different capacities and those who gave comment on the draft report, particularly Mr Jeffery Sanderson (Lead technical advisor to PLMP/IST). Our special thanks go to Mr Tesfaye Seifu form PSLD/FMOH and Mr Bruck Messele from the School of Pharmacy, Addis Ababa University, for their participation as members of the technical committee for overseeing the work of the consultancy firm as well as for their invaluable assistance in the organization of the stake holders’ workshop.
We would like also to extend our sincere thanks to Mr Birhanu Feissa, who is the head of PSLD/FMOH, for his committed support to the study as well as organization of the stake holders’ workshop.
Lastly, we would like to acknowledge the contribution of Mr Bekele Tefera, who is the NPO/EDM of the WHO country office, for his support to the data collection process, for reviewing and editing this report and also for organizing the stake holders’ workshop successfully.
The drug financing study was conducted and this document produced with the financial assistance of the European Community. The views expressed herein are those of the authors and can therefore in no way be taken to reflect the official opinion of the European Community.
iv
ACRONYMS APA Amhara Development Association ARV Anti-Retroviral Drugs BOFED Bureau of Finance and Economic Development CCM Country Coordinating Mechanism (Office for Global Funds) CIF Cost of Insurance and Freight CMH Commission on Macro Economics and Health CRDA Christian Relief and Development Association CSA Central Statistics Authority DACA Drug Administration and Control Authority DH District Hospitals DKT Dehandra K.T. Yaji EC Ethiopian Calendar EDL Essential Drug List EDM Essential Drugs and Medicines EPI Expanded Program of Immunization ERCS Ethiopian Red Cross Society ETB Ethiopian Birr FMOH Federal Ministry of Health GDP Gross Domestic Product HC Health Center HCF Health Care Financing HIV Human Immuno-deficiency Virus HP Health Post HSDP Health Sector Development Plan ICT Information, Communication and Technology MDG Millennium Development Goals MOE Ministry of Education MOFED Ministry of Finance and Economic Development NGO Non-Government Organization NHA National Health Account NPO National Professional Officer ORDA Organization for Rehabilitation and Development of Amhara PASDEP Plan for Accelerated and Sustained Development to End Poverty
v
PHCU Primary Health Care Unit PLMP Pharmaceuticals Logistics Master Plan PLMP/IST Pharmaceuticals Logistics Master Plan Implementation Support Team PSLD Pharmaceutical Supplies and Logistics Department REST Relief Society of Tigray RH Referral Hospitals RHB Regional Health Bureau SDPRP Sustained Development for Poverty Reduction Program SNNPR Southern Nations, Nationalities and Peoples Region TB Tuberculosis TDA Tigray Development Association UN United Nations UNFPA United Nations Population Fund UNICEF United Nations Children Fund WHO World Health Organization WoHO Woreda Health Office ZH Zonal Hospitals ZHD Zonal Health Desk

vi
LIST OF FIGURES
Figure 1.1 Flow of procurement and distribution
Figure 1.2 Relationship in drug financing
Figure 3.1 Break down of drug budget expenditure at federal level, 2004/05.
Figure 3.2 Break down of drug budget expenditure at federal level, 2005/06
Figure 3.3 Regional drug budget allocation and expenditure, 2003/04 - 2005/06
Figure 3.4 Total regional drug budget allocation and expenditure, 2003/04 – 2005/06
Figure 3.5 Expenditure on drugs by sources, 2003/04 – 2005/06

vii
LIST OF TABLES Table 3.1 Drug budget allocation and expenditure at federal level, 2003/04 – 2005/06
Table 3.2 Break down of expenditure of federal Government drug budget
Table 3.3 Regional drug budget allocation and expenditure
Table 3.4 Regional drug budget expenditure by sources of finance (BOFED)
Table 3.5 Donors’ assistance to Regional Health Bureaus for drugs (All values in
Birr)
Table 3.6 Summary of drug financing at Regional level
Table 3.7 Drug budget expenditure by source in the Regions (Amount in Birr)
Table 3.8 Summary of drug budget expenditure by source (Federal and Regional
Governments)
Table 3.9 Import of drugs by UNIDEF for MOH (All values in Birr)
Table 3.10 Portfolio of grants to Ethiopia from Global Fund
Table 3.11 Contributions of fund for drugs from Global Fund
Table 3.12 Assistance of UNFPA on drugs
Table 3.13 Assistance of WHO on drugs
Table 3.14 Assistance of USAID on drugs (All values in Birr)
Table 3.15 Drug financing by parastatals
Table 3.16 Summary of financing of drugs by NGOs
Table 3.17 Financing of drugs by REST
Table 3.18 Value drugs covered by Out-Of-Pocket Payment
Table 3.19 Estimates for drugs made available by insurance companies
Table 3.20 Coverage of drug costs by private employers
Table A1.1 Total import of drugs (Birr)
Table A1.2 Import of drugs, medical supplies and equipment by PHARMID (Birr)
Table A1.3 Import of drugs, medical supplies and equipment by the private sector (Birr)
Table A1.4 Value of drugs received and distributed by PSLD/FMOH to the regions
Table A1.5 Distribution of drugs for HIV/AIDS and TB to the regions by PSLD/FMOH
Table A1.6 Distribution of drugs for malaria and emergency to the regions by
PSLD/FMOH
Table A1.7 Distribution of drugs for HIV/AIDS and TB to individual organizations by
PSLD/FMOH
1
EXECUTIVE SUMMARY
Access to health care, which includes access to essential drugs, is part of the fulfillment of the fundamental human right to health. Essential medicines save lives and improve health when they are available, affordable, of assured quality and properly used. Providing access to affordable essential medicines is also one of the targets (Target 17) set for achieving the health-related Millennium Development Goals (MDGs) to which the international community is committed. Availability of adequate and sustainable drug financing mechanisms is one of the ways of ensuring access to drugs. In order to develop appropriate policy and sound drug financing mechanism, policy makers and other stake holders need up-to-date and reliable information on the drug financing situation of the country. However, available data and information regarding the drug financing in Ethiopia are not adequate. Although three previous National Health Accounts study have been undertaken, their coverage of the pharmaceutical sector is only superficial. Hence, there is a need to generate detailed information and establish data base for the drug financing situation in the country. The general objective of the study is to provide current information for policy makers, planners, researchers and program managers on the different sources of drug finance and the contribution of each source to the national drug fund pool as well as the trend in drug fund allocation and expenditure in the country. A countrywide survey was undertaken from beginning of June to end of August 2007 to identify the major sources of drug finance and to assess budgetary allocation and expenditure from these sources over a period of three years (2003/04 – 2005/06). Appropriate data collection instruments were developed and sent to government, donors, households, NGOs and the private sector respondents. Initial results of the study were discussed at a workshop of stakeholders conducted in Adama city on September 17, 2007. The major findings, policy implications and recommendations of the study are summarized as follows. Major Findings of the Study Total Expenditure on Drugs: Ethiopia spent a total of Birr 2,439,186,538 on drugs in 2005/06 from all sources. The total drug expenditure grew over the three years covered by the study from Birr 1,499,989,690 in 2003/04 to Birr 2,439,186,538 in 2005/06. This growth on the average was about 28% annually. However, this level of drug expenditure is very low compared to global and regional levels. Per Capita Expenditure on Drugs: The amount of money expended on drugs on per capita basis was only 32 Birr or 3.80 USD in 2006/06. This figure is only 45% of the average per
2
capita for low income countries. The situation would be worse if we consider only the public drug budget. The per capita share of the government expenditure on drugs was Birr 2.94, Br 2.66 and Birr 3.80 in 2003/04, 2004/05 and 2005/06, respectively. A study quoted in a WHO document published in 1997 suggested that USD10 to USD 50 should be enough to satisfy the entire need of the population in a country. Sources of Drug Expenditure: The main sources of drug expenditure in Ethiopia in order of importance are: households’ out-of-pocket account for 47% of the total drug expenditures. Donor’s sources cover 27% and NGOs 16%. Federal and Regional Government sources from taxes and revenue cover about 10% of total drug expenditures and private employers only 0.2 %. The Government share in drug finance is small whereas the share of donors and NGOs is high reflecting the recent increases in funding from global sources. Government Expenditure on Drugs: The Federal and Regional Government share in expenditure on drugs has been falling from 2003/04 – 2005/06. In particular regional governments have been allocating fewer funds for drugs. This is in spite of the fact that during the period under consideration the costs of drugs have been increasing. Donors Expenditure on Drugs: The contribution of donors on drug financing has been increasing over the three years covered by the study. The increase in donor financing came from major global initiatives instituted recently to support the health sector. This has been very useful in making drugs available in the health facilities. House Hold Expenditure on Drugs: The private out-of-pocket payment is the largest single source of drug financing. The amount in absolute terms grew from Br 934.8 million in 2003/04 to a level of Br 1.146 billion in 2005/06. Its relative share, however, continues to decline from 62.3% in 2003/04 and 52.2% in 2004/05 to 47% in 2005/06. NGO Expenditure on Drugs: NGOs are important providers of drugs and drug fund for many programs in Ethiopia. Many NGOs are involved in development activities, but only a few are in the health services and a limited number of them are helping communities to have access to drugs. During epidemics and in connection with serious health threats like HIV/AIDS, NGOs provide drugs through different programs in Ethiopia. In 2005/06, the share of NGOs was 16.2%, which is a big jump from 4.4% in 2004/05. Parastatals Expenditure on Drugs: These are state owned commercial organizations managed differently from civil service organizations. They provide health services like free medication based on specific collective agreements with their labor unions. They have very little contribution to the national drug fund. It was only 0.4% in 2005/06. Private Employers Expenditure on Drugs: Private employers arrange insurance schemes for the health of their employees. Drug costs are covered by these schemes. The scheme is at its rudimentary level and the contribution to the national drug fund is only about 0.2%. Private employers sometimes cover medical expenses of their employees by providing the
3
services at their own health service providers or they refund expenses met by their employees. Policy Implications of the Findings Overall Expenditure on Drugs: Both the overall level of expenditure and per capita expenditures in Ethiopia are low when compared with global and regional standards. This is because finance available for drugs from all sources is quite limited. This low level of expenditure becomes even more glaring if further examined form the point of view of the high disease burden in the country. Therefore, a review of budget allocation for drugs is timely; seeking ways and means of increasing drug funds from sources that help ensure equity and sustainable financing should be the prime issue in drug policy review. Government Expenditure on Drugs: The decline in drug budget allocation and expenditure by the government is worrying. It means that less and less drugs would be available for the health facilities. This is not a healthy development. Particular attention should be given to this fact and measures to correct the decline should be considered. Donors Expenditure on Drugs: While it is necessary for scaling up health interventions and improving health services delivery, NGO assistance or donation should be complementary to government effort. Excessive dependence on aid should be avoided since it not sustainable. It is very important to consider appropriate drug financing mechanisms to ensure an uninterrupted supply of drugs in the event of suspension of drug funding from donors. A policy has to be forged out to prepare the nation for such eventuality. House Hold Expenditure on Drugs: The share of out-of-pocket expenditure on drugs is very high. This implies that a large segment of the population purchase their drugs from private drug retail outlets where prices of drugs are quite high compared to their prices in the public sector. This results in low economic access to drugs, particularly by the poor, and creates equity problem. It is believed that out-of-pocket spending is a result of failure by the government to allocate sufficient resources and absence or inadequacy of other drug financing mechanisms which ensure sustainable and equitable access to drugs (e.g. insurance). 47% out-of-pocket spending in a country where nearly half of the population lies below poverty line introduces a lot of inequalities in the system. Therefore, there is a need for diversifying the health-financing portfolio in the country. The new initiative to develop social insurance by the MOH is a good start but this scheme needs to be further expanded and look for ways to capture the majority of the poor. It is also necessary to expedite the implementation of the revised waiver and exemption system by the MOH.

4
The Role of Insurance Intermediaries in Managing Drug Financing: In developing countries, insurance companies are useful in managing funds from policyholders. In Ethiopia, the role of the insurance companies is very much underdeveloped. Policies may have to be devised in order to help insurance companies play a more dominant role in managing funds. Although parastatals and private employers have used these, the schemes are at rudimentary level and the contribution to the national drug fund is small. This could be a growing sector provided that there is a well thought-out and well planned policy framework. The Role of Social Insurance: Social insurance includes schemes like employers drug insurance (along with health insurance), mutual fund for drugs, community drug schemes and other policies, which ensure that premium payments are according to ability to pay and drug provision is according to needs. This way, the burden is shared among a larger group and drugs are made available for a wider portion of the public. Such schemes must be considered as part of drug access policy framework. FMOH is currently developing such schemes and this is a commendable beginning. Policy Recommendations It is recommended that sustainable and workable drug financing mechanisms should be introduced in the country to ensure adequate and regular drug supply as well equitable access to them by taking the following measures: Increase government drug budget allocation to ensure sustainable and equitable access to drugs, particularly by the poor.
Develop policy framework for the creation of diversified drug financing portfolio by involving stake holders such as government, the private sector, multilateral and bilateral donors, NGOs, health professionals’ and the public representatives
Expand comprehensive social insurance to address the issue of equity by risk –sharing mechanism.
Expand further the new initiative of the Ministry of Health to develop social insurance and look for ways to capture the majority of the poor.
Expedite implementation of the revised waiver or exemption system of the Ministry of Health.
Give due attention to the establishment of data recording and reporting system at different levels of the drug supply chain such as health facilities, regional health bureaus, woreda health offices and other procurement and distribution organizations.
Undertake similar studies at appropriate time intervals to track trends in drug fund allocation and expenditure as well as monitor progress towards establishment of adequate and sustainable drug financing mechanism in the country.

5
1. INTRODUCTION
1.1 Geography, socio-demographic and economic data Ethiopia has a total land surface area of about 1.1 million square kilometer and an estimated population of 75 million in 2005/06 of which 84% live in rural areas. The country is a Federal Democratic Republic divided in to 9 National Regional States, namely, Tigray, Afar, Amhara, Oromiya, Somali, Benishangu-Gumuz, Southern Nations and Nationalities and Peoples Region (SNNPR), Gambell, Harari and two Administrative States (Addis Ababa City Administration and Dire Dawa City Council).
Enrollment at the primary level has increased substantially in the last decade. However, it is still 64% (54% for females). Literacy rate is only 29%. Life expectancy at birth is 54.4 for females and 53.4 years for males (1).
The economy is mainly agrarian and agriculture accounts for 54% of the Gross Domestic Product (GDP), employs 80% of the population and contributes to 90% of the export. The annual per capita income in 2004 was US$ 110 and the GDP at current market price in 2005/06 was 112.6 Billion Birr. (2). About 47% of the populations live below poverty line (3).
1.2 The health sector
1.2.1 Health status Ethiopia has poor health status largely attributable to preventable infectious diseases, nutritional deficiencies.
The major health indicators include: Infant mortality rate 77 per 1000 live births, maternal mortality rate 673 per 100, 000 live births and Under 5 mortality rate 123 per 1000 live births. Potential health service coverage and EPI coverage were 76.9% and 75.6%, respectively. However, the health service utilization was 0.33. Adult prevalence of HIV.AIDS is 3.6% (Urban 10.5%, Rural 1.9%) (1). Access to safe drinking water and excreta disposal system were 37% and 29%, respectively (4).
1.2.2 The health delivery system The health system is guided by the National Health Policy issued in 1993 (5) and the Health Sector Development Program (HSDP), which is currently in its third phase of implementation, provides a long term plan framework.
The health service delivery system has a three-tier pyramidal structure with Primary Health Care Units (PHCUs) at the base followed by district hospitals, zonal hospitals and specialized hospitals up the hierarchy in that order. A PHCU consists of a health Center with 5 satellite health posts which serve as first contact points of the health service.
The Federal Ministry of Health (FMOH) and Regional Health Bureaus (RHBs) are responsible for the issuance of policy and guidelines for implementation of health care programs. These levels oversee the strategic direction of the health sector as policy makers, manage overall resource allocation and monitor policy targets and outcomes. They ensure
6
that adequate and regular supply of effective, safe and good quality drugs, medical supplies and equipment at affordable price to reach the regions. Below each RHB, there are Zonal Health Departments (ZHDs) and Woreda (District) Health Offices. A Zonal Health Desk currently functions as sort of a branch to a Regional Health Bureau. Its major role is coordination and serving as a bridge between the regions and Woreda Health Offices (WoHOs), which are structurally positioned below Zonal Health Departments. The ZHD also provides technical support to woredas. Woreda health Offices ensure that health facilities deliver required services, provide funding and give guidance and support in planning and setting of appropriate targets. They make sure that each facility gets appropriate resources to reach agreed upon targets. They are responsible for coordinating and organizing supportive supervision, for timely supply of sufficient drugs and medical supplies to each health facilities and for efficient utilization of these resources. They are also responsible for ensuring the availability of staff for delivery of health services in the Woredas. The Woredas manage the PHCUs. 1.3 The pharmaceutical sector 1.3.1 Policy and regulation The pharmaceutical sector is guided by the National Drug Policy (6). The HSDPIII has eight components one of which is “Pharmaceutical service”. Proclamation No. 176/99 provides the legal basis for the regulation of the sector and the Drug Administration and Control Agency (DACA) was established by this proclamation. The Regional Health Bureaus and Woreda Health Offices also participate in the regulation of the pharmaceutical sector. 1.3.2 Procurement and distribution The goal of the pharmaceutical sector is to ensure the regular and adequate availability of safe, effective and of good quality drugs and medical supplies at affordable price and their rational use. The national demand for drugs and medical supplies is met through, import (purchase and donation) and local production. Governmental organizations, private importers, NGOs and International Agencies such as UNICEF, WHO, etc. participate in the import and distribution task. The local production is done by governmental and private companies. Currently, there are 8 private factories and one government owned factory engaged in the local production of drugs and medical supplies. Local and International procurement for the public health facilities is mainly done by two governmental agencies called PHARMID and Pharmaceutical Supply and Logistics Department (PSLD) of the FMOH. PHARMID distributes drugs and medical supplies to all regions through its eight wholesale distribution branch offices located in different regions. The RHBs and Woreda Health Offices also procure drugs from PHARMID,
7
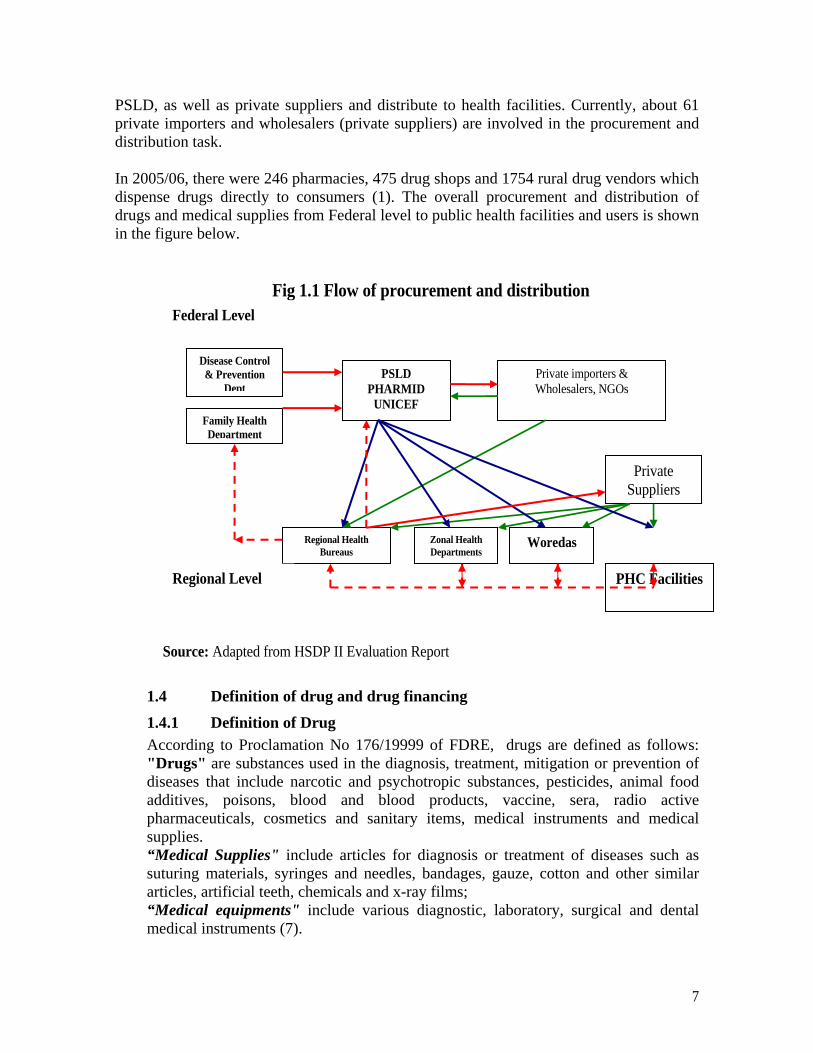
PSLD, as well as private suppliers and distribute to health facilities. Currently, about 61 private importers and wholesalers (private suppliers) are involved in the procurement and distribution task. In 2005/06, there were 246 pharmacies, 475 drug shops and 1754 rural drug vendors which dispense drugs directly to consumers (1). The overall procurement and distribution of drugs and medical supplies from Federal level to public health facilities and users is shown in the figure below.
Fig 1.1 Flow of procurement and distribution
Source: Adapted from HSDP II Evaluation Report
1.4 Definition of drug and drug financing
1.4.1 Definition of Drug According to Proclamation No 176/19999 of FDRE, drugs are defined as follows: "Drugs" are substances used in the diagnosis, treatment, mitigation or prevention of diseases that include narcotic and psychotropic substances, pesticides, animal food additives, poisons, blood and blood products, vaccine, sera, radio active pharmaceuticals, cosmetics and sanitary items, medical instruments and medical supplies. “Medical Supplies" include articles for diagnosis or treatment of diseases such as suturing materials, syringes and needles, bandages, gauze, cotton and other similar articles, artificial teeth, chemicals and x-ray films; “Medical equipments" include various diagnostic, laboratory, surgical and dental medical instruments (7).
Zonal Health Departments
Disease Control & Prevention
Dept
Family Health Department
Regional HealthBureaus
Woredas
PHC Facilities
PSLD PHARMID
UNICEF
Private importers & Wholesalers, NGOs
Private Suppliers
Federal Level
Regional Level
8
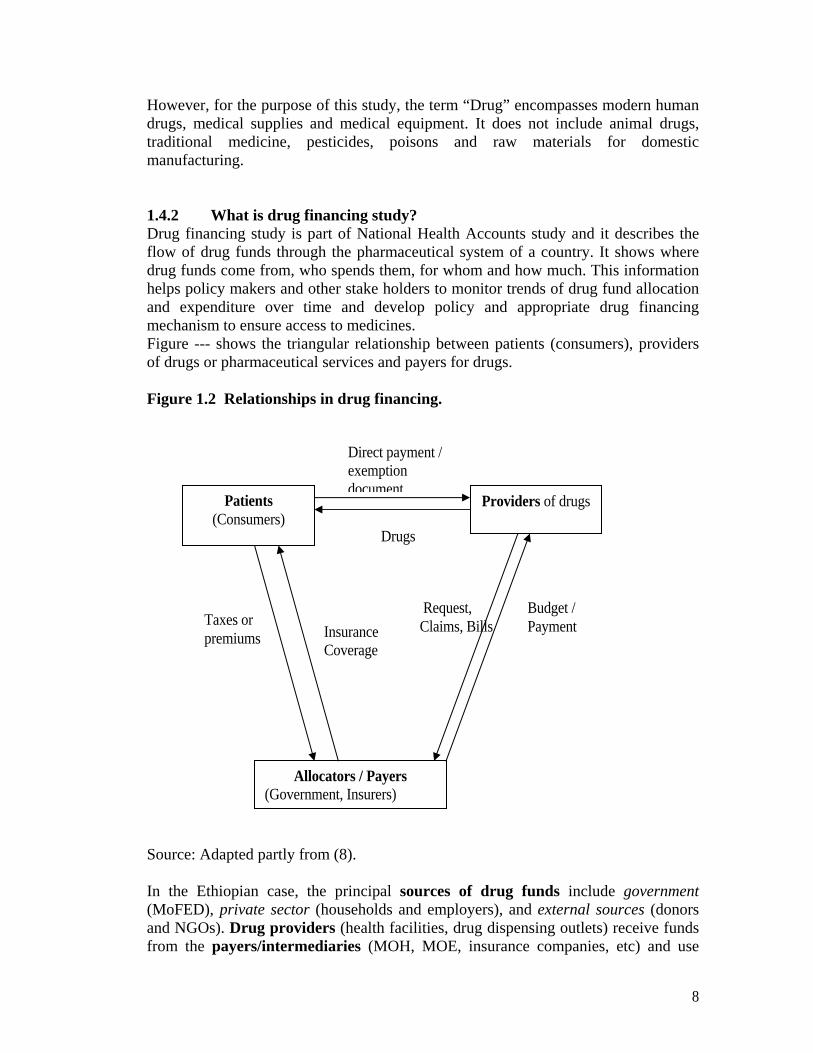
However, for the purpose of this study, the term “Drug” encompasses modern human drugs, medical supplies and medical equipment. It does not include animal drugs, traditional medicine, pesticides, poisons and raw materials for domestic manufacturing. 1.4.2 What is drug financing study? Drug financing study is part of National Health Accounts study and it describes the flow of drug funds through the pharmaceutical system of a country. It shows where drug funds come from, who spends them, for whom and how much. This information helps policy makers and other stake holders to monitor trends of drug fund allocation and expenditure over time and develop policy and appropriate drug financing mechanism to ensure access to medicines. Figure --- shows the triangular relationship between patients (consumers), providers of drugs or pharmaceutical services and payers for drugs. Figure 1.2 Relationships in drug financing.
Source: Adapted partly from (8). In the Ethiopian case, the principal sources of drug funds include government (MoFED), private sector (households and employers), and external sources (donors and NGOs). Drug providers (health facilities, drug dispensing outlets) receive funds from the payers/intermediaries (MOH, MOE, insurance companies, etc) and use
Patients (Consumers)
Providers of drugs
Allocators / Payers (Government, Insurers)
Direct payment / exemption document
Drugs
Insurance Coverage
Taxes or premiums
Request, Claims, Bills
Budget / Payment
9
them to pay for drugs. Patients (Consumers) receive drugs from the providers upon direct payment (out-of-pocket) or through insurance coverage or free of charge depending on the predetermined modalities of payment. 1.5 Rationale for the Study Health is a fundamental human right. Access to health care, which includes access to essential drugs, is a prerequisite for realizing that right. Essential medicines save lives and improve health when they are available, affordable, of assured quality and properly used (9). Providing access to affordable essential medicines is also one of the targets (Target 17) set for achieving the health-related Millennium Development Goals (MDGs) to which the international community is committed. Availability of adequate and sustainable drug financing mechanisms is one of the ways of ensuring access to drugs. In order to develop appropriate policy and sound drug financing mechanism, policy makers and other stake holders need up-to-date and reliable information on the drug financing situation of the country. However, available data and information regarding the drug financing in Ethiopia are not adequate. Although three previous National Health Accounts study have been undertaken, their coverage of the pharmaceutical sector is only superficial. Hence, there is a need to generate detailed information and establish data base for the drug financing situation in the country. 1.6 Objective of the study
The general objective of the study is to provide current information for policy makers, planners, researchers and program managers on the different sources of drug finance and the contribution of each source to the national drug fund pool as well as the trend in drug fund allocation and expenditure in the country. 1.7 Organization of the report The report is organized in four sections. Section 1 has already given us an introduction. Section 2 discusses the methodology including the data sources, data collection and its challenges, as well as limitations of the study. Section 3 presents the findings of the study in detail. Section 4 summarizes the salient points of the findings and their policy implications; draws conclusion and forwards recommendations for improvement. Annex I shows overview of the drug supply and distribution situation in the country only as supplementary information about the supply side.

10
2. METHODOLOGY
This drug financing study was commissioned by the Federal Ministry of Health and conducted by ABD Consult with the financial assistance of the World Health Organization obtained from European Commission. The study was carried out from beginning of June to end of August 2007.A stake holders workshop was then conducted on 17 September 2007 to discuss on the results of the study. This report was prepared by incorporating the comments given during the workshop in to the first draft report and after it is extensively reviewed and edited by the Essential Drugs and Medicines (EDM) program of the WHO country office in Ethiopia.
The methodology was developed, in line with the objective of the study to capture drug budget allocation and expenditure data from all the major financing sources. Accordingly, the drug expenditure from these sources, namely the government, donors, households, NGOs and the private sector has been captured. In addition, to assess the role played by the insurance sector in managing funds, all insurance companies have been surveyed as part of this study. Following are the methods and formats applied for collecting data from the various sources.
2.1 Data sources and data collection instruments
2.1.1 Government sources The Government is one of the major sources of drug finance. Thus data for the three years 2003/04, 2004/05 and 2005/06 were collected from various federal and regional government sources using questionnaires. (Data on the 2006/07 budget allocation was also requested and collected where available)
At the Federal level, the main source of data for drug budget is the Ministry of Finance and Economic Development (MOFED). The budget allocations and actual expenditures for drugs, medical supplies and equipments are recorded by MOFED under two budget heads, namely, recurrent and capital budget with account codes 6214 and 6313, respectively. These data were collected using Form F. The data include the government own funds from its own sources and the direct budget support it receives from donors- otherwise known as Channel One. The allocations are transferred to regions in block grants as subsidy.
The data is adjusted for cost recovery from drugs. The cost recovery amount reported under a separate Account Code No. 1512 from the budget together with the estimate for cost recovery by the National Health Account study have been used to make the adjustments. This has been applied for all the three years (2003/04 to 2005/06) for which the national drug financing study was conducted.
11
At the Regional level, the drug budget is augmented by donations from different donor sources including bilateral and multilateral sources, which make funding available directly to the FMOH and the Regional Health Bureaus. The FMOH allocates funds it receives in this way to the regions. Such sources (the transfers through the FMOH and those donated directly to the RHBs) are referred to as Channel Two and are very crucial in financing drugs. The regions thus finance their drug budget from the funds they receive from MOFED (the subsidy) and donor funds transferred through FMOH and directly by the donors themselves. These have been collected on the basis of Form A which is used for registering data from Regional Bureaus. In addition to allocations under budget account codes 6214 and 6313 under the recurrent and capital budget heads, the questionnaire specifically requests data on the amount of fund allocated for drugs, supplies and medical equipment from channel two sources. (Questionnaires can be made available on request).
2.1.2 Public enterprises Expenditure of public enterprises (Parastatals) is another financing source. To estimate the expenditure from this source, two main methods have been applied. On the one hand an attempt has been made to estimate its contribution using the data acquired from questionnaire returns from insurance companies. And on the other hand the NHA III study findings have been referred to for more comprehensive information.
Form C was used for collecting data from insurance companies. The insurance companies in many cases provide life insurance as well as other forms of health related coverage. From this information was sought on the amount of fund expended on drugs in the past years. All insurance companies have been approached and data from most of them have been obtained.
2.1.3 Donor sources Donors are a major source of finance for drug acquisition. They also make drugs available in kind. The donor drug funds are directed to Ethiopia through three major channels.
Channel One is direct budget support and it flows through the general budget of the Ministry of Finance and Economic Development (MOFED). This data is obtained from the Ministry and data for three years has been collected.
Channel Two flows through the Federal Ministry of Health (FMOH) and /or the Regional Health Bureaus (RHBs) of the relevant regions. This has been obtained from the regions and the FMOH. Clearly the data may not be fully available and be consistent with the expenditure data obtained from MOFED.

12
Channel Three - is direct support to projects where the donor administers the funds. This fund may not be traced accurately by RHBs or FMOH, unless the donors or the implementing NGOs dutifully report regularly. This regular reporting is not practiced. So it was necessary for this study to identify the fund through direct questionnaire filled by the donors.
Data were collected from identified donor sources using Form E. The questionnaire was distributed to a list of 16 donors most of them members of the HPN donor group supporting the health sector. Among them are to be found UNICEF, Global Fund, Italian Cooperation, World Bank, USAID, etc. Some of these donors that are active in drug finance responded to the questionnaire (for the complete list see Annex II). On the basis of Form E data were collected on resources, which are earmarked for drug, medical supplies and medical equipment. Also data on drug supply in kind were collected. The data from all the channels have been collected and tabulated in the report. 2.1.4 NGO sources NGOs are important sources of drug financing. NGOs support drug supply to the country in many ways. Some run their own programs and import drugs, supplies and medical equipment. Many others import and distribute them to various health institutions in the country.
Some 29 NGOs presumed to be involved in participating in the health sector were identified and data collection Form D was distributed for each of them. Out of these, only about 12 were found to be involved in health and 8 responded to the specific formats as active in drugs finance.
Form D used to obtain data from NGOs was also used to obtain from region-based Development Associations. The data from Form D were used to identify drug expenditure from Channels Two and Three. These also indicated the extent of cost recovery.
Another source of data on NGOs involvement in the financing of drugs for the country is DACA. Import figures from DACA have been extensively used to supplement data from the questionnaires.
2.1.5 Private sources The out-of-pocket payment of households is another major source of drug financing. Drug related expenditure of private enterprises for their employees also falls under the private financing category.
The household out of pocket expenditure level has been obtained from the Third National Health Account Study (NHA III). This has been projected to reflect the situation in the current study period. Two important methods are used for the projection.
Projecting the population from the survey period to the study period
13
Applying the GDP growth over the years to reflect over the level of expenditure for drugs and medical supplies.
Regarding the amount of expenditure by private enterprises, two main sources have been used similar to Parastatals. Firstly an attempt has been made to estimate their contribution using the data acquired from insurance companies. And secondly, the NHA III finding has been used.
Form C has been used for collecting information on private employers’ expenditure on drugs.
2.1.6 Drug supply and import To supplement data from the above sources and to highlight the drug supply and import situation, data and information have been collected from:
♦ The Ethiopian Customs Authority
♦ The Ethiopia Drug Administration and Control Authority. The data from the Customs office is comprehensive and provided CIF value of the imports. Drugs and supplies as well as medical equipment are categorized under different Codes. These have been carefully segregated and summed for each year. A portion of the imports is used as input to the drug and supplies manufacturing sector.
The DACA source identifies imports by origin also. It provides information on the amount of drugs and medical supplies imported by:
Ministry of Health
Government Organizations
NGOs
The private sector
This has been used to identify the sources of the drug and the amount of money involved in the supply. This is a very useful data and the calculation is based on actual imports.
The results of the analysis on Drug Supply and Distribution have been attached as Annex I.
2.2 Data collection process Data collection was undertaken over a period of four weeks with three to four days in each region. The data collection was administered through the forms developed by the consultant and described above. Before application these were tested in Addis Ababa and Oromia regions and outlying Woredas.
14
The data collection was conducted by the consultant’s experts and three other health officers with experiences in health data collection. The data collectors were briefed on the data collection forms. The consultant dispatched the experts to discuss issues and collect the information required for the study. Each region has been visited and data from Health Bureaus and the Bureaus of Finance and Economic Development have been collected***.
The data from the regions was collected both from the RHBs and BoFEDs. Whenever differences of records between the two bureaus were detected, further follow-up took place to firmly establish the volume of direct assistance to the RHBs through Channel Two.
Medical equipment categorized under 6313 was unfortunately found to include large amounts of construction equipment, generators, office equipment and furniture together with medical equipment. In fact the medical equipment component was usually small. To circumvent this problem, Form A requested the Bureau officials to specifically identify expenditure on listed equipment from Budget Account Code No. 6313 from which the proportion on medical equipment could be worked out. The consultant also approached two to three Woredas (depending on accessibility) in all visited Regions to appreciate the situation with respect to drug supply and funding. The finance and health offices of these Woredas have been requested to furnish relevant data on the basis of Form B, which seeks to identify the sources of drug and drug fund and how the Health Centers and Health Posts obtain their supply of drugs.
The data from the insurance companies, the various ministries, the different offices of the government, the private sector, the NGOs and the donors were collected by the experts themselves.
2.3 Challenges in data collection There is considerable difference in the keeping of accounts at regions. Some regions could produce the required accounts within short periods. Detailed figures are kept by the Bureaus of Finance and Economic Development of Amhara, Tigray, and SNNPR. The figures appear to be reliable. The Oromia Bureau of Finance could provide the pertinent figures for the required three years but details are lacking. Accounts are provided from the other regions as well. However, the system of accounts processing at these regions will need sometime to bring it to the level of the three larger states.
*** The data from Beni Shangul Region was collected from other sources and confirmed with close contacts with the relevant authorities
15
All regions have reported their expenses on drugs for the year 2003/04 to the Central Accounts of the MoFED. The consultant has used the figures from the two sources to counter check the accuracies. If there are differences, then explanations are sought. In the cases of the Regions of SNNPR, Amhara, Tigray and Oromia, the figures match. In other regions the figures have called for counter checking and adjustments are made through discussions with relevant regional offices.
Accounts at Woreda level are also available at the MoFED for 2003/04 and 2004/05. These are also used to check the figures at the regional level. Moreover, the figures obtained from sample Woredas in various parts of the country are checked with the MoFED figures and these were found to be well in agreement.
2.4 Limitations of the study The study bases its analysis and reporting on various data from different organizations. Inaccuracies from these sources directly reflect on the conclusions of the study. The recording systems of the regions, which are the main sources of the data, differ from region to region. Some regions make use of modern office automation system to an appreciable degree. Other still use manual recording. Some are quite detailed while others are not. All these defects and omissions may be reflected on the report.
Some Donors and NGOs have recording systems, which could not directly avail data for this study using the records of Ethiopia Customs Authority. Many NGOs may be working on health supporting projects and the data on expenses includes training, constructions, studies, transport, travel, and maintenance as well as drug purchases. Separating the drug expenses could be difficult and there may be a degree of error in their reporting. Some NGOs have found it too difficult to segregate costs for drugs and they may have responded by saying that they have no involvement in drug financing. In addition, the low level of response from these organizations would underestimate the amount of expenditure from the sectors. Especially the low level of response from donors and NGOs is a major challenge.
Major suppliers of fund for drugs, like Global Fund, do not work and avail reports on financial years used in Ethiopia. They actually operate in tranches and the periods do not coincide with the reporting periods of this study. So the accuracy of the period is compromised to that extent.
16
3. FINDINGS OF THE STUDY
3.1. Government budget and expenditure on drugs Government budget appropriations and expenditure on drugs, medical supplies and equipment are made at three levels:
♦ The federal government,
♦ The regional governments, and
♦ Parastatals. At both the federal and regional government levels, budgets for drugs are kept under two headings, namely: recurrent budgets and capital budgets. The sources of Federal government expenditure on drugs and medical supplies are the treasury and direct budgetary support from donors. The Federal government makes allocations to the regions as well as to various organizations from its own sources i.e. treasury and from donor support, which for the regions is in the form of subsidy.
The regions use this together with their own sources and other direct donor support they get to purchase the drugs and supplies. There are thus at least three sources for the regional budgets for drugs. These are:
♦ The Federal subsidy,
♦ Own sources, (taxes and retained revenue)
♦ Donor support (Special Assistance and Loan).**** The above funds are, in general, made available through the Regional Bureaus of Finance and Economic Development (BOFED). However, additional funds and drugs are also made available through the Regional Health Bureaus, (RHBs). The Regional Health Bureaus obtain these funds and drugs directly from donors and NGOs and from the Federal Ministry of Health, which receives the funds and drugs from donors and sends the same to the regions. Such assistances, categorized as Channel Two, mainly come from donors such as UNICEF, WHO, Global Fund, etc.
**** For the purpose of following already accepted government budget source classification, donor financed assistance (channel one) is treated under government financing section. However, when one strictly tracks source of finance, this component will be summed up with donor financing. Hence, when share of each financing source is summed up in the last section of this chapter, assistance component will be deducted from government and added to donors.
17
3.1.1 Budget allocation and expenditure by Federal Government Organizations Some Government organizations operating at the Federal level receive their drug budget directly from MOFED. The Federal Government Departments and Organizations with relatively high budget for drugs include:
The Federal Ministry of Health
The Ministry of Defense
The Federal Police
The Prison Commission
Ministry of Agriculture and Rural Development Ministry of Education (the Universities of Addis Ababa, Jimma,
Hawasa, Mekele and Gondar).
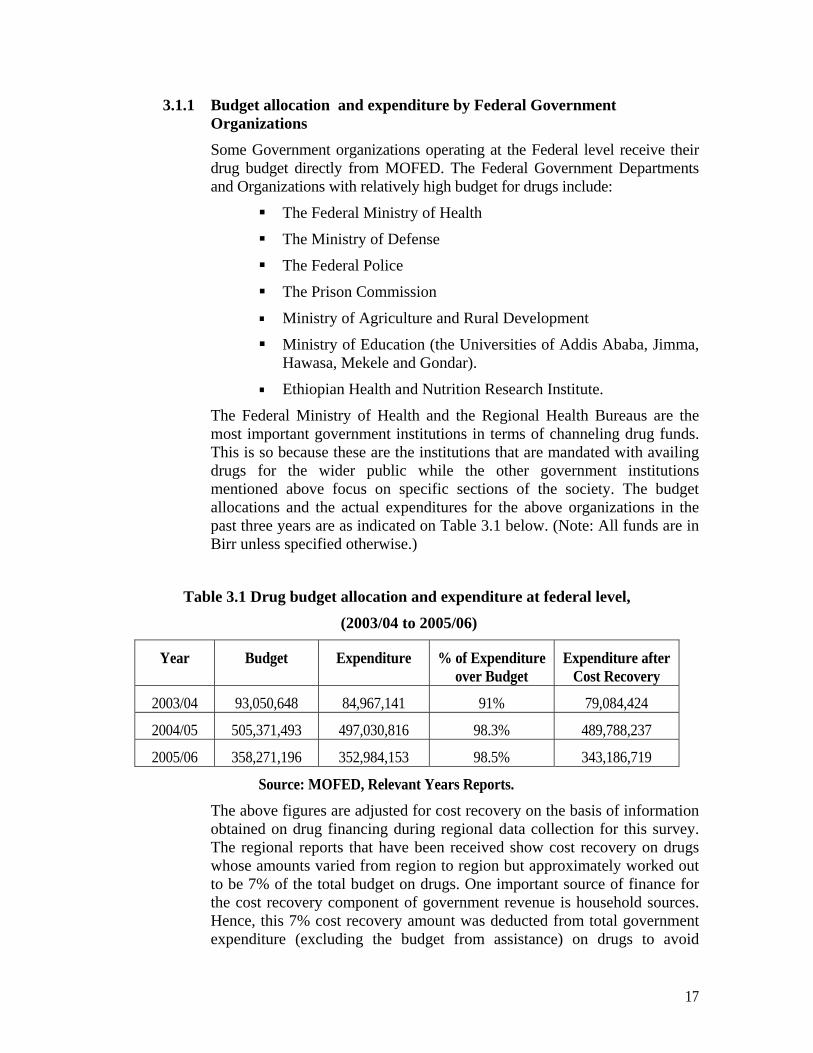
Ethiopian Health and Nutrition Research Institute. The Federal Ministry of Health and the Regional Health Bureaus are the most important government institutions in terms of channeling drug funds. This is so because these are the institutions that are mandated with availing drugs for the wider public while the other government institutions mentioned above focus on specific sections of the society. The budget allocations and the actual expenditures for the above organizations in the past three years are as indicated on Table 3.1 below. (Note: All funds are in Birr unless specified otherwise.)
Table 3.1 Drug budget allocation and expenditure at federal level,
(2003/04 to 2005/06)
Year Budget Expenditure % of Expenditure over Budget
Expenditure after Cost Recovery
2003/04 93,050,648 84,967,141 91% 79,084,424
2004/05 505,371,493 497,030,816 98.3% 489,788,237
2005/06 358,271,196 352,984,153 98.5% 343,186,719
Source: MOFED, Relevant Years Reports.
The above figures are adjusted for cost recovery on the basis of information obtained on drug financing during regional data collection for this survey. The regional reports that have been received show cost recovery on drugs whose amounts varied from region to region but approximately worked out to be 7% of the total budget on drugs. One important source of finance for the cost recovery component of government revenue is household sources. Hence, this 7% cost recovery amount was deducted from total government expenditure (excluding the budget from assistance) on drugs to avoid
18
double counting. The total expenditure shown on the table is, therefore, modified by the 7% cost recovery and shown in the last column.
It can be observed from the table that the budget/expenditure levels in the last two years have risen much higher than the much smaller levels for 2003/04. The rapid rise in the subsequent years can be explained more clearly by looking at the breakdown of the annual budgetary expenditures by sources.
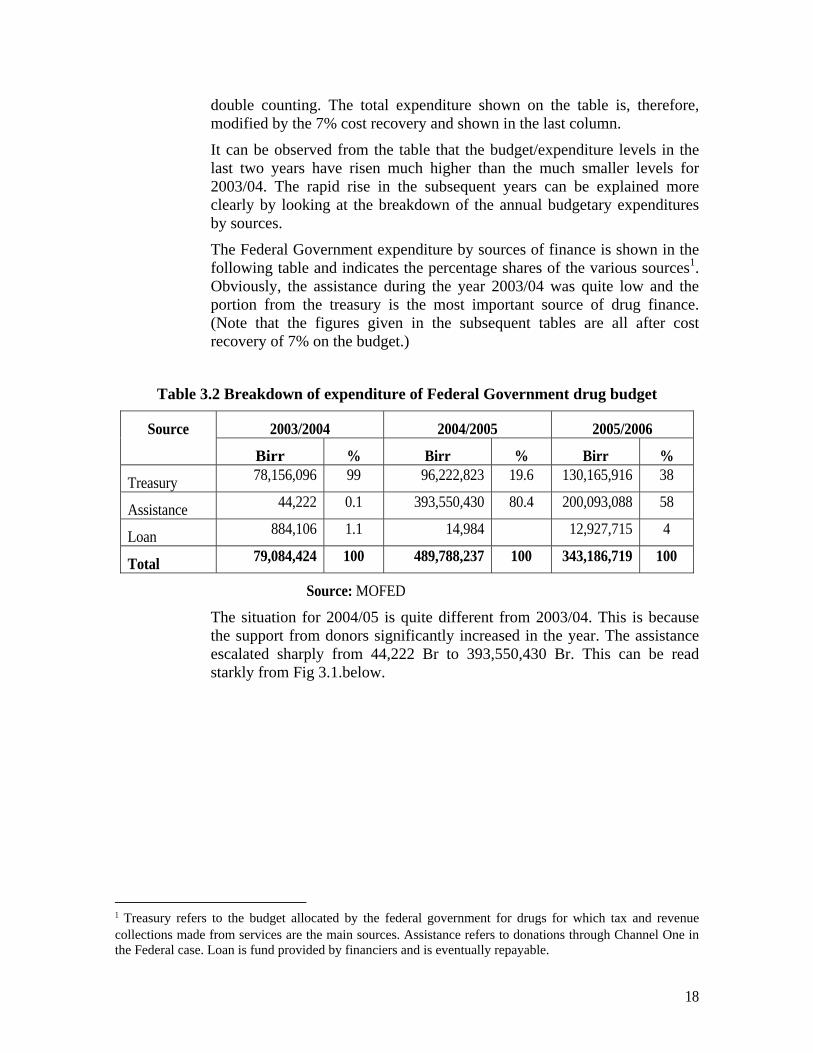
The Federal Government expenditure by sources of finance is shown in the following table and indicates the percentage shares of the various sources1. Obviously, the assistance during the year 2003/04 was quite low and the portion from the treasury is the most important source of drug finance. (Note that the figures given in the subsequent tables are all after cost recovery of 7% on the budget.)
Table 3.2 Breakdown of expenditure of Federal Government drug budget
Source 2003/2004 2004/2005 2005/2006
Birr % Birr % Birr %
Treasury 78,156,096 99 96,222,823 19.6 130,165,916 38
Assistance 44,222 0.1 393,550,430 80.4 200,093,088 58
Loan 884,106 1.1 14,984 12,927,715 4
Total 79,084,424 100 489,788,237 100 343,186,719 100
Source: MOFED
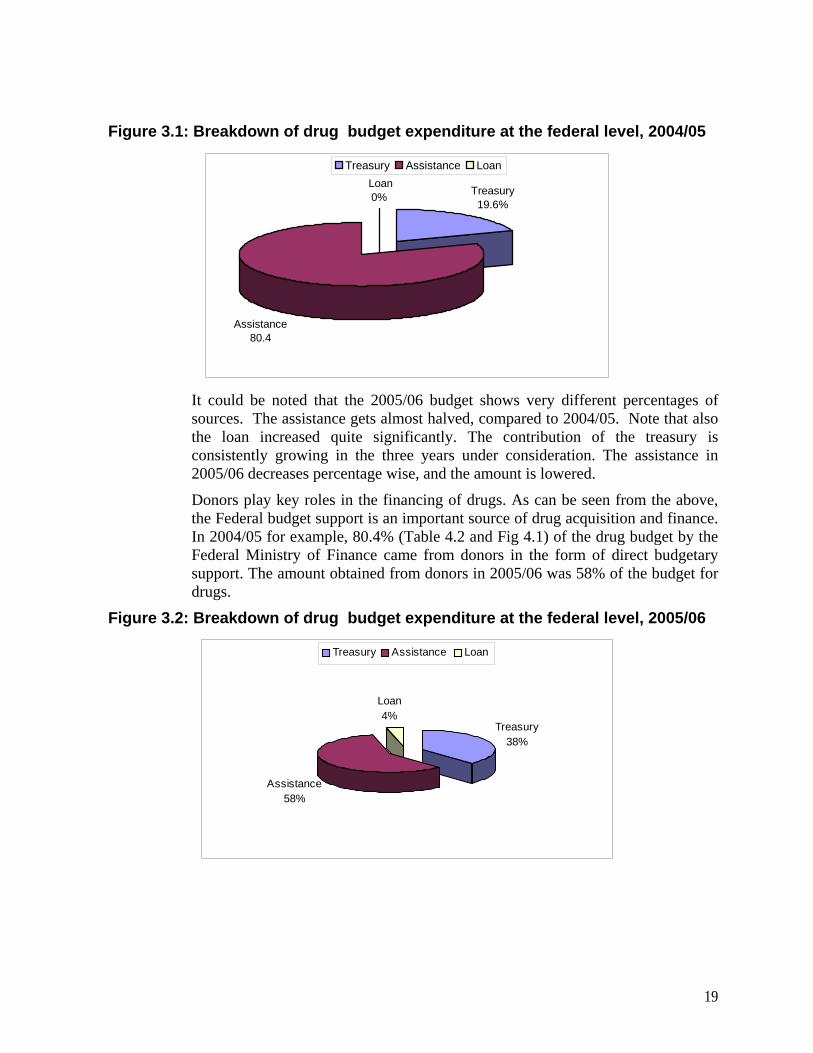
The situation for 2004/05 is quite different from 2003/04. This is because the support from donors significantly increased in the year. The assistance escalated sharply from 44,222 Br to 393,550,430 Br. This can be read starkly from Fig 3.1.below.
1 Treasury refers to the budget allocated by the federal government for drugs for which tax and revenue collections made from services are the main sources. Assistance refers to donations through Channel One in the Federal case. Loan is fund provided by financiers and is eventually repayable.
19
Figure 3.1: Breakdown of drug budget expenditure at the federal level, 2004/05
Loan0% Treasury
19.6%
Assistance80.4
Treasury Assistance Loan
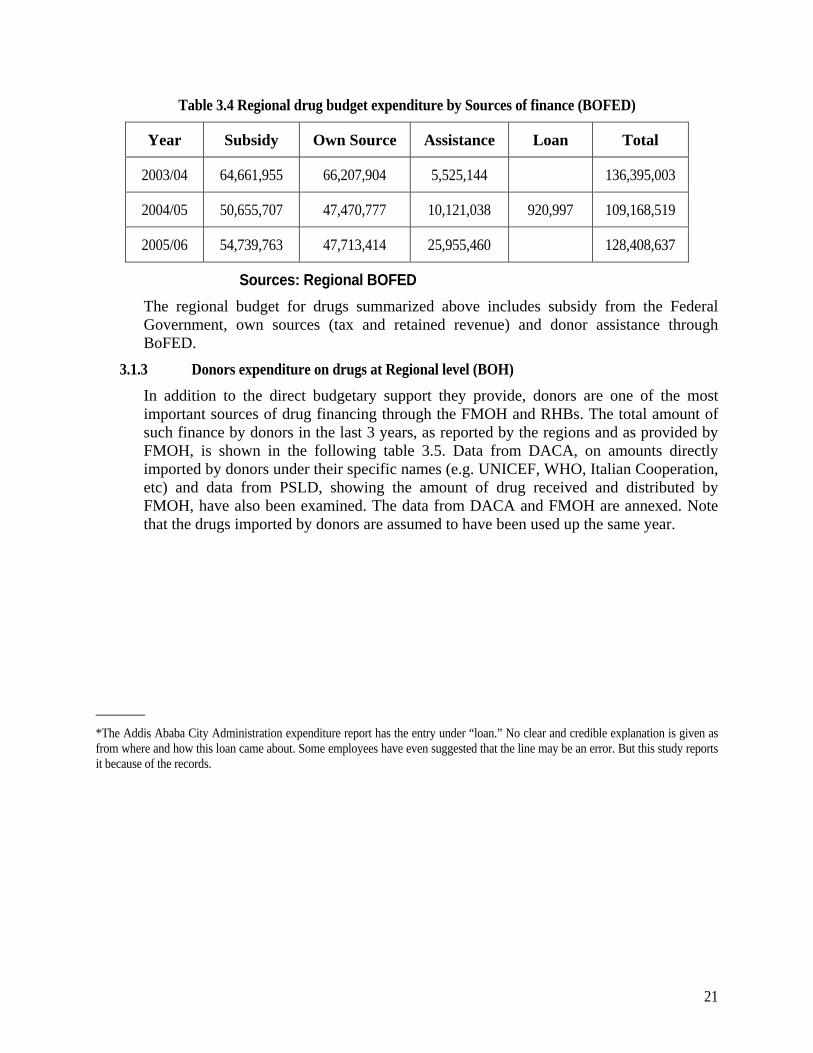
It could be noted that the 2005/06 budget shows very different percentages of sources. The assistance gets almost halved, compared to 2004/05. Note that also the loan increased quite significantly. The contribution of the treasury is consistently growing in the three years under consideration. The assistance in 2005/06 decreases percentage wise, and the amount is lowered. Donors play key roles in the financing of drugs. As can be seen from the above, the Federal budget support is an important source of drug acquisition and finance. In 2004/05 for example, 80.4% (Table 4.2 and Fig 4.1) of the drug budget by the Federal Ministry of Finance came from donors in the form of direct budgetary support. The amount obtained from donors in 2005/06 was 58% of the budget for drugs.
Figure 3.2: Breakdown of drug budget expenditure at the federal level, 2005/06
Assistance 58%
Loan4%
Treasury38%
Treasury Assistance Loan

20
3.1.2 Drug budget allocation and expenditure at the Regional level The drug budget of Regions is financed by the subsidy from the Federal Government, Regions’ own sources and assistance. Assistance to finance drugs can be made to BOFEDs and directly through the BOHs. The information obtained from the BOFEDs does not include the amounts received by the BOHs which have been collected separately and treated in section 4.1.3 below. Some loan is indicated in the case of Addis Ababa, but this is not seen in other regions*.
The regional health budget and expenditure from BOFEDs is as indicated on Table 3.3.below. These figures are collected by the consultant’s staff that traveled to the regions.
Table 3.3 Regional drug Budget allocation and expenditure (BOFED)
Year Budget Expenditure % of Expenditure/budget
2003/04 155,482,687 136,395,003 88%
2004/05 137,750,017 109,168,519 79%
2005/06 172,413,134 128,408,637 74%
Source: Regional Bureaus of Finance and Economic Development The graphical expression of the regional expenditure on drugs is depicted on Fig 3.3 below. The budget and expenditure difference continue to increase over the years.
Figure 3.3: Regional drug budget allocation and expenditure, 2003/04-2005/06
0
20,000,000
40,000,000
60,000,000
80,000,000
100,000,000
120,000,000
140,000,000
160,000,000
180,000,000
200,000,000
2003/04 2004/05 2005/06
Years
Valu
e of
Dru
gs
BudgetExpenditure
The breakdown of the regional drug expenditure by the sources of finance is as indicated on the Table 3.4 below.
21
Table 3.4 Regional drug budget expenditure by Sources of finance (BOFED)
Year Subsidy Own Source Assistance Loan Total
2003/04 64,661,955 66,207,904 5,525,144 136,395,003
2004/05 50,655,707 47,470,777 10,121,038 920,997 109,168,519
2005/06 54,739,763 47,713,414 25,955,460 128,408,637
Sources: Regional BOFED The regional budget for drugs summarized above includes subsidy from the Federal Government, own sources (tax and retained revenue) and donor assistance through BoFED.
3.1.3 Donors expenditure on drugs at Regional level (BOH) In addition to the direct budgetary support they provide, donors are one of the most important sources of drug financing through the FMOH and RHBs. The total amount of such finance by donors in the last 3 years, as reported by the regions and as provided by FMOH, is shown in the following table 3.5. Data from DACA, on amounts directly imported by donors under their specific names (e.g. UNICEF, WHO, Italian Cooperation, etc) and data from PSLD, showing the amount of drug received and distributed by FMOH, have also been examined. The data from DACA and FMOH are annexed. Note that the drugs imported by donors are assumed to have been used up the same year.
_______ *The Addis Ababa City Administration expenditure report has the entry under “loan.” No clear and credible explanation is given as from where and how this loan came about. Some employees have even suggested that the line may be an error. But this study reports it because of the records.

22
Table 3.5 Donors’ assistance to Regional Health Bureaus for drugs
(All values in Birr)
Source: Regional Health Bureaus It can be seen from Table 3.5 that the assistance to regions is quite significant and is growing. The Table shows the total amount received by the regions from various donors including donations through FMOH. In limited number of cases, it also includes Channel Three provided to the regions.
The figures in Table 3.5 are obtained directly from the regions as well as from donors, which reported to have been working directly with programs involving clinics and health centers in various parts of the regions.
3.1.4 Summary of drug financing at the Regional Level Total drug financing at the regional level comprising subsidy from the Federal Government, own sources, (taxes and service retentions), and assistance, both through BOFEDs and the RHBs is shown in Table 3.6 below.
Region 2003/04 2004/05 2005/06 Addis Ababa 10,743,986 14,781,912 30,005,698.80
Afar 533,813 2,694,978 6,021,609
Amhara 22,527,393 38,578,041
55,069,036
Benshangul 4,048,223 3,366,613 8,819,553
Dire Dawa 1,426,931 6,370,928 9,982,127.12
Gambella 576,440 4,218,962 4,629,834
Harari 1,190,375 4,378,801 3,447,277
Oromia 68,765,782 103,671,092
147,166,243
SNNPR 66,589,089 30,108,593
60,018,122
Somali 3,199,641 3,103,050
25,613,567
Tigray 12,758,457 47,481,460 62,441,767
Total 192,360,130 258,754,430 413,214,833

23
Table 3.6 Summary of drug financing at Regional level
Year Subsidy Own Source Assistance Loan Total
2003/04 64,661,955 66,207,904 197,885,274 328,755,133
2004/05 50,655,707 47,470,777 268,875,468 920,997 367,922,949
2005/06 54,739,763 47,713,414 439,170,294 541,623,471
It is to be noted that the level of subsidy and own source financing are lower in the latter years than the earlier years. This shows that the regional allocation for drugs from own sources is declining. On the other hand the share of assistance in drug financing grows nearly 3 times in the three years. It looks that the regions rely more on assistance than from own resources for drug funding♣. This is further illustrated by the fact that assistance to regional health bureaus increases significantly in the years 2003/04 to 2005/06. (Refer to Table 3.5)
The trend in drug financing of the regions over the period of the study is as illustrated in Fig 3.4 below:
Figure 3.4: Total Regional drug budget allocation and expenditure, 2003/04-2005/06 (BOFED)
0
100,000,000
200,000,000
300,000,000
400,000,000
500,000,000
600,000,000
2003/04 2004/05 2005/06
Subsidy Own Source Assistance Total
The graph illustrates clearly the decline in the budget from subsidy and from own sources. At the same time assistance continues to rise over the years. Given the rising
♣ The reasons for the decline are varied. From the discussions with officials, it was possible to see that in some cases the reasons are : issues of priority, trying to fill the gap from assistance, limitations of revenue, etc.
24
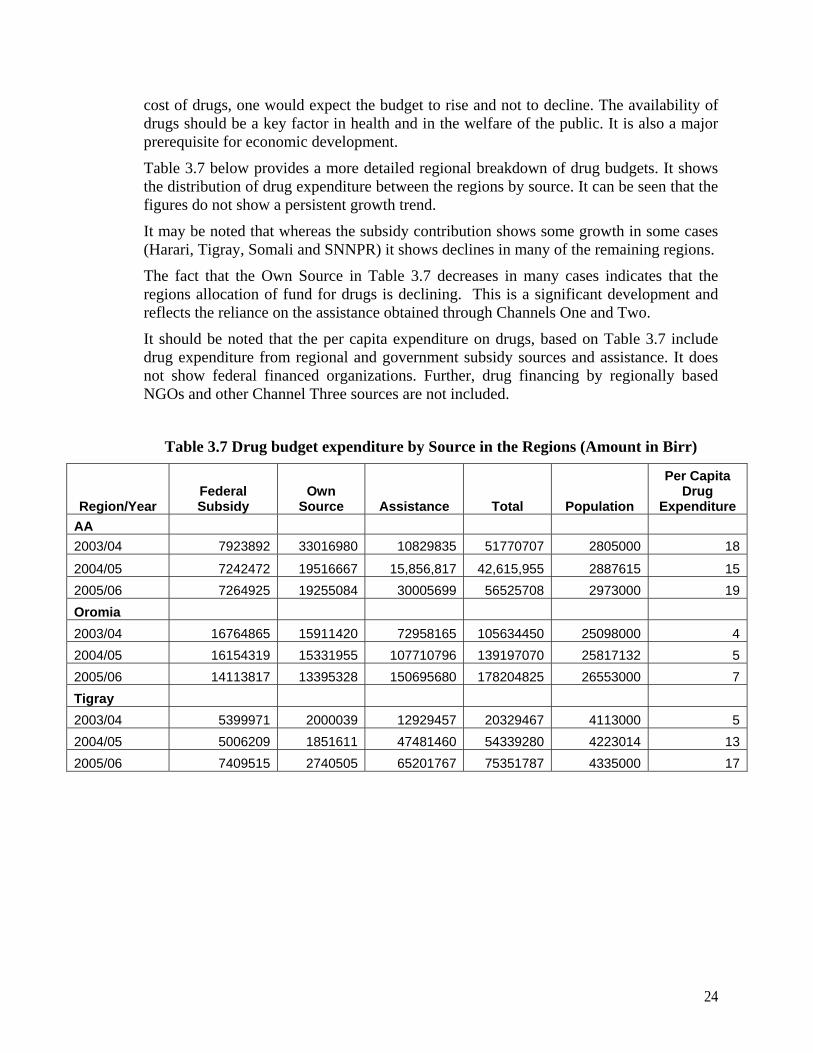
cost of drugs, one would expect the budget to rise and not to decline. The availability of drugs should be a key factor in health and in the welfare of the public. It is also a major prerequisite for economic development.
Table 3.7 below provides a more detailed regional breakdown of drug budgets. It shows the distribution of drug expenditure between the regions by source. It can be seen that the figures do not show a persistent growth trend.
It may be noted that whereas the subsidy contribution shows some growth in some cases (Harari, Tigray, Somali and SNNPR) it shows declines in many of the remaining regions.
The fact that the Own Source in Table 3.7 decreases in many cases indicates that the regions allocation of fund for drugs is declining. This is a significant development and reflects the reliance on the assistance obtained through Channels One and Two.
It should be noted that the per capita expenditure on drugs, based on Table 3.7 include drug expenditure from regional and government subsidy sources and assistance. It does not show federal financed organizations. Further, drug financing by regionally based NGOs and other Channel Three sources are not included.
Table 3.7 Drug budget expenditure by Source in the Regions (Amount in Birr)
Region/Year Federal Subsidy
Own Source Assistance Total Population
Per Capita Drug
Expenditure AA 2003/04 7923892 33016980 10829835 51770707 2805000 18
2004/05 7242472 19516667 15,856,817 42,615,955 2887615 152005/06 7264925 19255084 30005699 56525708 2973000 19Oromia 2003/04 16764865 15911420 72958165 105634450 25098000 42004/05 16154319 15331955 107710796 139197070 25817132 52005/06 14113817 13395328 150695680 178204825 26553000 7Tigray 2003/04 5399971 2000039 12929457 20329467 4113000 52004/05 5006209 1851611 47481460 54339280 4223014 132005/06 7409515 2740505 65201767 75351787 4335000 17

25
Region/Year Federal Subsidy
Own Source Assistance Total Population
Per Capita Drug Expenditure
Gambella 2003/04 773252 733888 769807 2276947 234000 10 2004/05 381909 362467 4314466 5058842 240394 21 2005/06 445688 422999 4741287 5609974 247000 23 Amhara 2003/04 20989537 7763253 22527393 51280184 18143000 3 2004/05 11428732 4227065 38583840 54239637 18626047 3 2005/06 10991901 4065497 55069036 70126434 19120000 4 SNNPR 2003/04 9281242 3432788 66589089 79303119 14085000 6 2004/05 6438688 2381432 34933593 43753713 14489705 3 2005/06 10256821 3793619 78508122 92558562 14902000 6 Afar 2003/04 1169703 1110157 826320 3106180 1330000 2 2004/05 1404592 1333088 3046224 5783904 1358718 4 2005/06 417313 396068 6125966 6939347 1389000 5 Harari 2003/04 586222 556379 1336971 2479573 185000 13 2004/05 886921 841771 4600593 6329284 189550 33 2005/06 901713 855810 3672768 5430290 196000 28 Dire Dawa 2003/04 672045 637834 1594989 2904868 370000 8 2004/05 771206 731946 6563783 8066935 383529 21 2005/06 379394 360080 10077002 10816476 398000 27 Somali 2003/04 298397 283207 3274261 3855864 4109000 0.94 2004/05 298397 283207 3177670 3759273 4218000 0.89 2005/06 1809157 1717058 26065982 29592197 4329000 7 Benishangul 2003/04 802828 761959 4248986 5813773 594000 10 2004/05 642263 609567 3527223 4779053 609509 8 2005/06 749520 711365 9006985 10467870 625000 17
Source: BOFED, BOHs and FMOH *With Addis Ababa, there is a loan of 920,997 Br. This looks anomalous and this is added to the total summation.

26
The table shows considerable variations between the regions. Most regions (Addis Ababa, Oromia, Gambella, Amhara, Afar, Harari, and Beni Shangul) show declines in expenditure on drugs from subsidy and own sources during the report periods. For the other regions, expenditure on drugs has shown modest increases mainly because of increase in external assistance.
3.1.5 Summary of drug budget expenditure at Federal and Regional
Government Levels A summary of total drug expenditure by sources for the Federal and Regional Governments is given on Table 3.8 below.
Table 3.8 Summary of drug budget expenditure by source (Federal and Regional Governments)
Year Federal Government
Regional Governments
Assistance and Loan
Total
2003/04 78,156,096 130,869,858 198,813,602 407,839,556
2004/05 96,222,824 98,126,483 663,361,880 857,711,187
2005/06 130,165,916 102,453,178 652,191,097 884,810,191
Source: Summary of relevant years reports from the Regions The total expenditure on drugs may be described as increasing. But this increase is mainly a result of growing fund injection from donors. Such infusion of drug fund, while welcome, should be complementary and be based on long term sustainability considerations. The nation is indeed exposed to drug supply situations, which are far outside of its control, and a crisis could precipitate in the event of this source drying up any time. It should be noted that in 2004/05, nearly two-thirds of the drug expenditure was from assistance. The expenditure from 2003/04 to 2004/05 has more than doubled.
Fig 3.5 below shows the relative sizes of the different budget sources for drugs over the study period.

27
Figure 3.5: Expenditure on drugs by Sources, 2003/04-2005/06
0100,000,000200,000,000300,000,000400,000,000500,000,000600,000,000700,000,000800,000,000900,000,000
1,000,000,000
2003/04 2004/05 2005/06
Years
Birr
Federal Government Regional (Subsidy and Own) Assistance Total
It can be noted from the graph that.
♦ The overall total expenditure over the three years has increased,
♦ Assistance has been growing consistently,
♦ Regional expenditure has been declining
♦ Federal expenditure has been growing at a slow pace
This outcome is in the face of the general rise in the costs of drugs. This calls for review by the concerned authorities and the public.
The observed decline in domestic sources and growing dependence on external resources calls for a revised approach to drug financing and critical review of policies related to sustained drug supply. Increased financing of drugs expenditure from domestic sources with the ultimate objective of self-sufficiency but with the immediate aim of raising domestic and additional external resources on a sustainable basis to meet planned targets should be the main considerations.

28
3.2 Major donors Some donor organizations play important roles in the supply of drugs and equipment to Ethiopia. The information is not additional to the values already provided. They are treated here separately from the rest because of their importance in the funding of drugs in Ethiopia. The donations for drugs for each year have been shown. It is important to note that the information, which is provided by the donors themselves, may not tally with those reported by the disbursing authorities. This is because the donors report what they have approved in the year as donation while this may not be received for disbursement in the same year by the recipients. The drugs may have been available in the subsequent budget years. The actual expenditures for the years are those indicated as expenditure by the federal and regional governments. This section then shows the importance of a few major donors in the financing of drugs and medical equipment.
3.2.1 UNICEF In the list of donors for drugs, one of the most important ones is UNICEF. UNICEF supplies a significant quantity of vaccines and related drugs and supplies. It also provides procurement services to FMoH using UNICEF office at Copenhagen, Denmark. So, in some cases, the name UNICEF may appear on the import list and that may not mean that the fund comes directly from the UNICEF itself. The total value of drugs, supplies and medical equipment imported by UNICEF for the indicated years are given below.
Table 3.9 Import of drugs by UNICEF for MOH (All in Birr)
Year Donors Share
2003/04 70,173,579
2004/05 172,613,519
2005/06 203,266,337
2006/07 154,479,123
SOURCE: PSLD/ MOH
3.2.2. Global Fund The Global Fund is a special grouping of international donors operating worldwide. The Global Fund in Ethiopia focuses on three major health problems. These are: HIV/AIDS, Tuberculosis and Malaria.
The total contribution of Global Fund for drug is very high. The information obtained from the CCM Secretariat in Addis Ababa is indicated below.
A government office known as HIV/AIDS Prevention and Control Office (HPCO) administers the funds. Global Fund provides its support in phases and rounds. There have been two rounds in Phase I and four rounds in Phase II. The total request approval in disbursement is given below:

29
Table 3.10 Portfolio of grants to Ethiopia from Global Fund
(All Currencies are in USD) No. Component Round Grant
Start Date
Total Fund Requested
Approved Funding
Total Fund Disbursed
(May 2007) 1 HIV/AIDS 02 & 04 01/01/04 541,290,971 181,280,972
(34%) 179,416,557
(99%) 2 Tuberculosis 01 & 06 01/08/03 71,414,782 26,980,649
(37.8%) 15,327,331
(56.8%) 3 Malaria 02 & 05 01/10/03 214,562,624 132,989,040
(62%) 107,989,811 (81.2% )
Source: CCM, reply to queries for this study The amount of fund available for the fight against HIV/AIDS, Tuberculosis and Malaria is not entirely for drugs. A significant portion also goes into the procurement of medial equipment and other supplies. The specific fund that goes into the purchase of drugs is mainly channeled to the MOH. The following table indicates the amount of fund expended on drugs.
Table 3.11 Contributions of fund for drugs from the Global Fund
No. Year Medicines, medical supplies and Medical Equipment for
Total yearly fund released to MOH for
purchase of drugs TB Malaria HIV/AIDS
1 2004/05 35,556,504.00 225,105,897.00 104,414,546.00 365,076,947.00
2 2005/06 36,823,195.00 25,560,455.00 122,349,060.00 184,732,710.00
3 2006/07 43,204,377.08 301,371,884.88 99,278,064.15 443,854,326.11
Source: CCM, HAPCO and FMOH, reply to queries for this study
Note that the table above shows the amount passed to FMOH for drug purchase. This may not have entered the country at the years shown, but rather in the subsequent three years.
3.2.3. UNFPA United Nations Population Fund (UNFPA) has been providing assistance in the drug financing. The organization is also directly financing the Federal Ministry of Health. The amount has varied over the years.
30
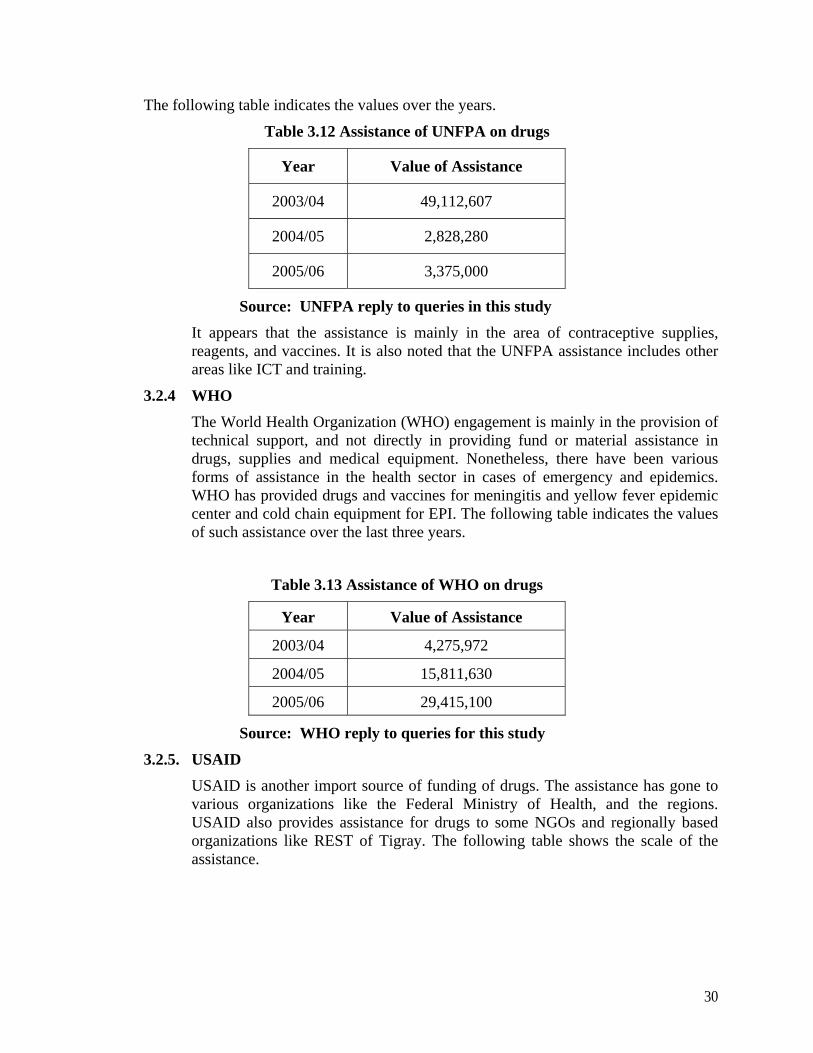
The following table indicates the values over the years.
Table 3.12 Assistance of UNFPA on drugs
Year Value of Assistance
2003/04 49,112,607
2004/05 2,828,280
2005/06 3,375,000
Source: UNFPA reply to queries in this study It appears that the assistance is mainly in the area of contraceptive supplies, reagents, and vaccines. It is also noted that the UNFPA assistance includes other areas like ICT and training.
3.2.4 WHO The World Health Organization (WHO) engagement is mainly in the provision of technical support, and not directly in providing fund or material assistance in drugs, supplies and medical equipment. Nonetheless, there have been various forms of assistance in the health sector in cases of emergency and epidemics. WHO has provided drugs and vaccines for meningitis and yellow fever epidemic center and cold chain equipment for EPI. The following table indicates the values of such assistance over the last three years.
Table 3.13 Assistance of WHO on drugs
Year Value of Assistance
2003/04 4,275,972
2004/05 15,811,630
2005/06 29,415,100
Source: WHO reply to queries for this study
3.2.5. USAID USAID is another import source of funding of drugs. The assistance has gone to various organizations like the Federal Ministry of Health, and the regions. USAID also provides assistance for drugs to some NGOs and regionally based organizations like REST of Tigray. The following table shows the scale of the assistance.

31
Table 3.14 Assistance of USAID on drugs (All values in Birr)
Year Value of assistance
2003/04 30,447,385 2004/05 55,663,173 2005/06 66,113,987
SOURCE: USAID reply to queries in this study USAID has indicated that the assistance on drug mainly related to ARV drugs, contraceptive, and others. Laboratory equipment and facilities like refrigerator are also included.
3.3 Expenditure by Parastatals
Public enterprises are one of the financing sources for health expenditure. Government owned commercially operating organizations cover medical expenses of their employees depending on the collective agreement they enter with their employees. This is done through three main mechanisms i.e. direct reimbursement of the cost of drugs incurred by employees, service provision through own clinics and dispensary, and/or purchase of insurance health policy for employees.
The figures for such financing have been obtained from secondary sources. This is particularly treated by the NHA III study report and the following table indicating drug financing by parastatals is drawn from it.
Table 3.15 Drug financing by Parastatals
Year Value of Drugs in Birr
2003/04 7,542,588
2004/05 8,440,156
2005/06 9,250,411
Source: NHA III Table 3.15 above shows that the role of parastatals in drug financing is quite limited in extent and covers a segment of the population, which is very small. But it is of significance in that the per capita drug expenditure is comparatively higher than the national average considering the number of people served by the drug financing scheme of the Parastatals.
3.4 NGO expenditure on drugs
3.4.1 The role of NGOs Non-Government organizations (NGOs) have various definitions. The definitions are given in an attempt to capture the services and the missions of the organizations. The Christian Relief and Development Association (CRDA) has defined NGOs in 1999 as follows. “NGO is a voluntary not-for-profit, non-self-servicing, non-governmental, non-partisan and independent organization or
32
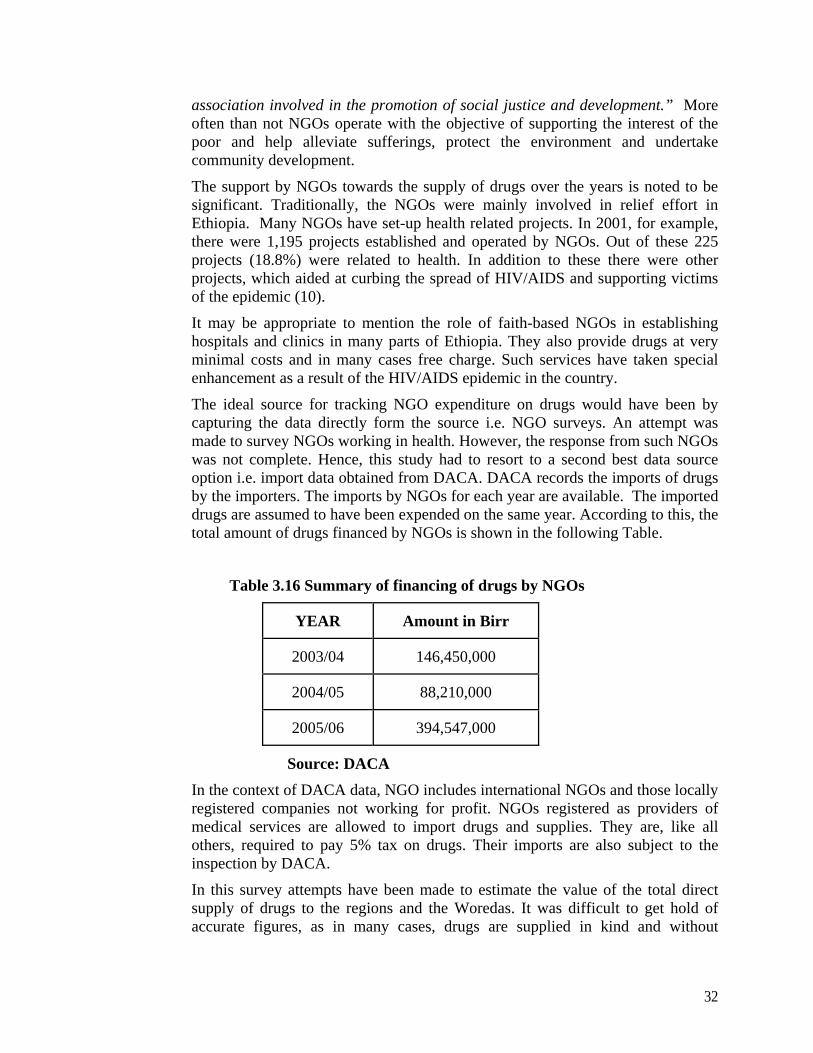
association involved in the promotion of social justice and development.” More often than not NGOs operate with the objective of supporting the interest of the poor and help alleviate sufferings, protect the environment and undertake community development. The support by NGOs towards the supply of drugs over the years is noted to be significant. Traditionally, the NGOs were mainly involved in relief effort in Ethiopia. Many NGOs have set-up health related projects. In 2001, for example, there were 1,195 projects established and operated by NGOs. Out of these 225 projects (18.8%) were related to health. In addition to these there were other projects, which aided at curbing the spread of HIV/AIDS and supporting victims of the epidemic (10).
It may be appropriate to mention the role of faith-based NGOs in establishing hospitals and clinics in many parts of Ethiopia. They also provide drugs at very minimal costs and in many cases free charge. Such services have taken special enhancement as a result of the HIV/AIDS epidemic in the country. The ideal source for tracking NGO expenditure on drugs would have been by capturing the data directly form the source i.e. NGO surveys. An attempt was made to survey NGOs working in health. However, the response from such NGOs was not complete. Hence, this study had to resort to a second best data source option i.e. import data obtained from DACA. DACA records the imports of drugs by the importers. The imports by NGOs for each year are available. The imported drugs are assumed to have been expended on the same year. According to this, the total amount of drugs financed by NGOs is shown in the following Table.
Table 3.16 Summary of financing of drugs by NGOs
YEAR Amount in Birr
2003/04 146,450,000
2004/05 88,210,000
2005/06 394,547,000
Source: DACA
In the context of DACA data, NGO includes international NGOs and those locally registered companies not working for profit. NGOs registered as providers of medical services are allowed to import drugs and supplies. They are, like all others, required to pay 5% tax on drugs. Their imports are also subject to the inspection by DACA.
In this survey attempts have been made to estimate the value of the total direct supply of drugs to the regions and the Woredas. It was difficult to get hold of accurate figures, as in many cases, drugs are supplied in kind and without

33
monetary values. And so the drug amount could not be comprehensively collected from the regions. In many instances, NGOs run their own clinics, health centers, and hospitals. According to 1998 EFY statistics from the FMOH, currently there are 12 hospitals and 480 clinics run by NGOs. These health facilities are also located in areas outside main cities. The service is, therefore, mainly available in the rural communities and, in some cases, also to urban poor. In general there is virtually no cost recovery system on drugs provided by NGOs. In limited cases, there may be revolving funds, which apply cost recovery systems. However, it has proven difficult to trace and to report these because of the low rate of NGO response to the survey. Drugs are given free to those who may not afford to buy them. In this report, no cost recovery from drug supplied by NGOs is assumed, except in cases of the Ethiopia Red Cross Society, which has a special permit to import and vend drugs and this is done with the intent of providing drugs to the population at much reasonable rates than elsewhere.
The involvement of NGOs in the supply of drugs is enhanced when disaster and epidemic situations arise. In such cases, the distribution of drugs is absolutely free.
3.4.2. Major players in the NGO Sector
3.4.2.1 Regional based NGOs
There are many regionally based NGOs and they vary in strength and their contribution to drug financing. To illustration the role of the sector in drug financing, the contribution of only three major such NGOs will be discussed.
The Relief Society of Tigray (REST) is perhaps the most dynamic regionally based NGO in Ethiopia. It raises funds from various sources including domestic donors and international supporters. It campaigns among the Diaspora and provides rural and urban services in the Tigray Region of Ethiopia.
REST runs its own programs in health services in various parts of Tigray. It acquires drugs from domestic and international sources and avails them free of charge to the community. Of the total supply of drugs, 22.5% is reported to come from external sources. The rest comes from domestic sources, which may include international organizations operating in Ethiopia. The following table provides the financing of drugs in rural Tigray by REST.
Table 3.17 Financing of drugs by REST
Year Amount (in Birr)
2003/04 740,681.00
2004/05 1,973,773.00
2005/06 955,628.00
Source: REST reply to queries for this study

34
A sister organization of REST is Tigray Development Association (TDA). It supports various health related projects, among others, in Tigray. TDA mainly works in development fields and its involvement in financing of drugs is limited. Nonetheless, it plays active role in the supply of drugs particularly when seasonal epidemics like malaria occur.
Two major regionally based NGOs operate in the Amhara region. One of them is “Organization for Rehabilitation and Development of Amhara (ORDA)”. This NGO provides drugs for its own health support programs in the region. The amount involved was Br. 533,382 in 2005/06.
The second NGO involved in the development of the Amhara region is the “Amhara Development Association”. However, drug financing is not its major involvement. In 2003/04, a total of Br 108,000 was expended in the acquisition of drugs. In 2005/06, the amount was Br 92,000.
3.4.2.2 DKT DKT is an international NGO, which is very active in the supply of items to fight the spread of HIV/AIDS. DKT is very much known as the supplier of condoms all over Ethiopia. It has a four-year program of supply 108,000,000 Birr worth of contraceptives through social marketing. This value is given in reply to the queries posed by this study. This is a relatively new concept in Ethiopia marketing strategy and it is having positive effect in combating HIV/AIDS epidemic. This makes DKT one of the major NGOs involved in the supply of these items. The four year program (2005-2008) of 108,000,000 Birr is indeed a note worthy project.
3.5 Private Expenditure on Drugs
3.5.1 Out of Pocket Expenditure on Drugs by Households Private expenditure on drugs comprises the out-of-pocket payment of households and drug related expenditure of private enterprise employers. The out-of-pocket payment of households is the major source of drug financing. The private sector out-of-pocket expenditure is responsible for the largest portion of health sector expenses. The portion was 53% in 2001 (10). The household out-of-pocket expenditure level has been obtained from the NHA III study which has identified the amount the households in Ethiopia expend on drugs. The Third National Health Account for Ethiopia has estimated the household expenditure on drugs for 2004/05. The estimated amounted is Br 1,046,048,267. The value is 76% of the total household health expenditure. This has been projected to reflect the situation in the study period. Two important methods are used for the projection.
Projecting the population from the survey period to the study period
Applying the GDP growth over the years to reflect over the level of expenditure for drugs and medical supplies.
Based on the combined methods the estimated household expenditure on drugs is as shown in the table below.

35
Table 3.18 Value of drugs covered by Out-of-Pocket Payment
Year Amount in Birr
2003/04 934,806,315
2004/05 1,046,048,267
2005/06 1,146,468,901
Source: Calculation based on NHA III
3.5.2 Expenditure by private enterprises The amount of expenditure by private enterprises is indicated from two sources:
♦ Data acquired from insurance companies and
♦ The NHA III findings.
3.5.2.1 Coverage by Insurance Companies The employer coverage could come under three channels:
♦ purchase of insurance policies,
♦ provision of health service in-house within own clinics
♦ direct reimbursement of expenses on drugs to employees.
Employers acquire polices for their employees enabling them obtain medical services and receive pharmaceuticals based on the prescription of physician. The drug purchase is normally covered fully by the insurance companies. In some cases, only a percentage of expense is covered by the insurance companies. The government employer also covers medical expenses including drug costs. This coverage is normally about 50% and may only be covered if the service is obtained from government owned facilities.
Strictly speaking insurance companies are not the source of financing. The actual source is the employer or the one who acquires the policy for covering such expenses. It is noted that in the developed world the insurance company’s role in covering medical expenses including drugs is quite significant. In Ethiopia, however, the penetration of insurance services is very limited.
Many Insurance companies in Ethiopia provide three types of health related services. These are:
♦ Group personnel accident,
♦ Workmen compensation, and
♦ Life insurance. Not all insurance companies provide all these policies.
With these policies, expenses on drugs are usually covered. But the coverage may depend on the type of policy acquired.

36
In this survey, insurance companies were approached to provide data on expenses related to drug. In many instances, the segregation of drug expenses from other medical expenses has not been easy. This is because the policies are general and the available data is on all medical services including hospitalization, laboratories, drugs, compensations, etc. But insurance companies were urged to provide estimates as percentages of the total expense. These values have been obtained from the insurance companies and tabulated below.
Table 3.19 Estimates for drugs made available by Insurance Companies
Year Total claims on drugs
2003/04 12,730,792
2004/05 14,076,147
2005/06 19,826,336
Source: Reply to queries for this study by eight insurance companies. Data from the insurance companies is averaged and the calculation is made for the number of insurance companies operating and providing the specific policy. It can be seen that the amount is not high.
The sources of funding for these drug expenses passing through the insurance sector are three i.e. private companies, parastatals, and households. However, the expenditure between the three sources couldn’t be disaggregated by the insurance companies. The second best alternative for disaggregating insurance data was referring to the NHA III report. Based on the details provided, one can infer that, of the total claims on drugs stated above, 65% is financed by parastatals, 29% by private employers, and remaining 6% by households.
3.5.2.2 Coverage by private employers According to the findings of NHA III, the total private employer’s expenditure on health in 2004/05 is Br. 52,715,900 (10). It can be seen that this amount is for all medical expenses including hospitalization, physicians’ fee and laboratory costs. The amount is also about 1% of total health expenditure. This is a very small share, which is even smaller when considering expenditure on drugs. The same report indicates expenditure on pharmacies of only Birr 3,750,063 in the same year.
Based on the findings of NHA III, the expenditures on drugs by the private employers is worked out. The following the result of the projects for 2003/04 and 2005/06.
The private employers cover costs of drugs by means of insurance, normally. But some others provide their own clinical service. This may include companies involved in construction and manufacturing. Such companies may find it expedient to provide drugs directly from their own clinics or cover costs of medication. These types of companies are treated in this section. The amount is also quite small but the indications are it may increase in the future.

37
Table 3.20 Coverage of drug costs private employers
Source: NHA III
Figure 3.8 Amount in Birr expended on drugs by private employers
0
500,000
1,000,000
1,500,000
2,000,000
2,500,000
3,000,000
3,500,000
4,000,000
4,500,000
2003/04 2004/05 2005/06 Years
Amount in Birr
No Year Amount expended on drugs (Birr)
1 2003/04 3,351, 000
2 2004/05 3,750,000
3 2005/06 4,110,000

38
4. SUMMARY AND CONCLUSIONS
4.1 Sources of drug finance Sources of drug funding vary depending on the situation of each country. The different sources of drug fund identified in Ethiopia are summarized in Table 4.1 and discussed in detail below.
a. Public funding. This refers to the fund from the governments where the ultimate source is public money collected as tax and other non-tax revenues. In the case of Ethiopia, the public sources are Federal and Regional Governments. It is reported that in developed countries, over 70% of the drugs are financed by the public fund (11). In Ethiopia the public fund is about 11%, taking the average of the years 2003/04 to 2005/06. (See Table 4.1 below)
b. Donor. These include sources are bilateral and multi-lateral organizations, development financiers, international associations or even companies and philanthropists. In Ethiopia, all these bodies are involved. The fund usually comes for specific programs or as direct support to government budget where expenditure decisions are left to the government. In many cases, such funds are provided freely to make it possible for the health institutions to avail the drugs at affordable prices. This source helps to address the issue of equity and improve access but it is not sustainable source of finance. There are instances where donors provide drugs in kind. There are also occasions where the fund is given for drug purchases. The hard currency availability is very much appreciated by governments in developing countries. Donations have made it possible that essential drugs are available in the country. However, they lead into overdependence on donations. Over reliance on donors is perhaps one aspect which drug policies should consider. Essential drugs supply should be a strategic issue and any country ought to forge a policy framework for its financing. In Ethiopia, the share of total drug financing by donors was the highest (33.1%) in 2004/05 which then decreased to 26.7% in 2005/06. Even then, it was higher than the share of the government budget (9.5%).
c. NGO. NGOs are important providers of drugs and drug fund for many programs in Ethiopia. Many NGOs are involved in development activities, but only a few are in the health services helping communities to have access to drugs. The occurrence of epidemics and serious health threats like HIV/AIDS have attracted NGOs to take part in availing drugs for different programs in Ethiopia. In 2005/06, the share of NGOs has been 16.2%, which is a jump from 2004/05 where the share was only 4.4%.
d. Parastatals Theses are state owned commercial organizations managed differently from public service organizations. They provide health services including free medication based on specific collective agreements with their labor force. These have very little contribution to the national drug finance. It was only 0.4% in 2005/06.
e. Private employers. Private employers provide social insurance for health for their employees. Drug costs are covered by the scheme. It is important to note that such insurance policies are directly paid for by the employers. The scheme is at its rudimentary level and its contribution to the national drug finance is only about 0.2%.
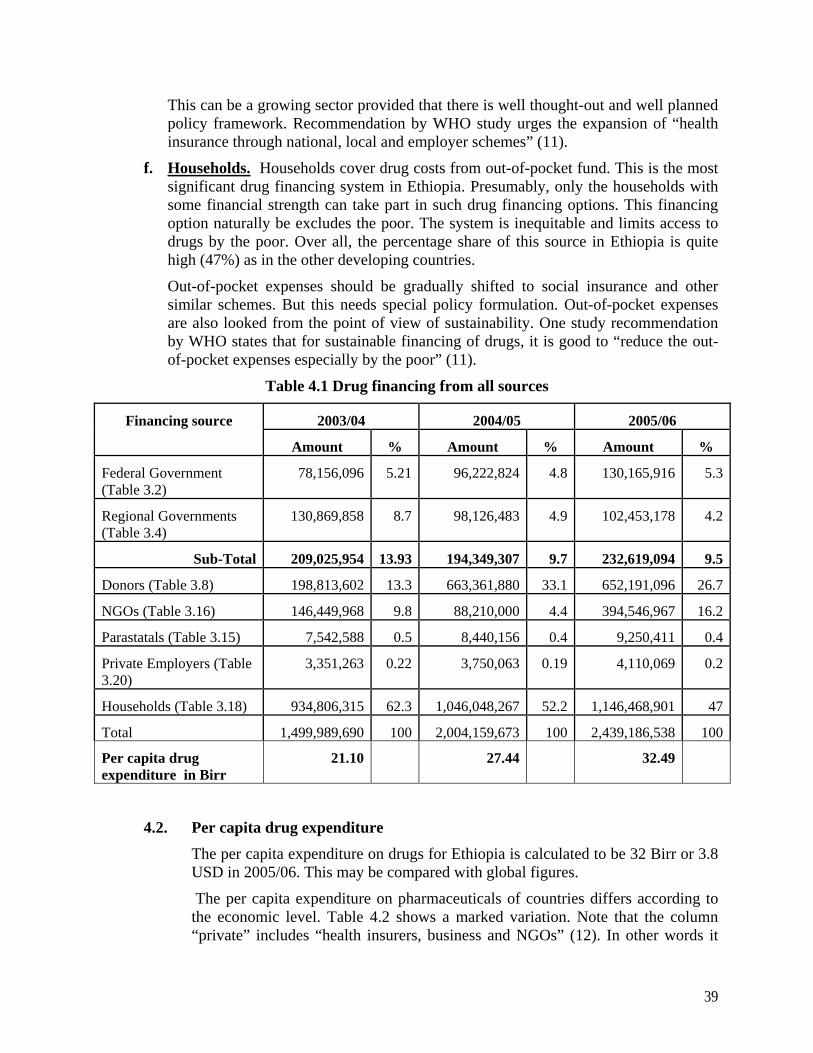
39
This can be a growing sector provided that there is well thought-out and well planned policy framework. Recommendation by WHO study urges the expansion of “health insurance through national, local and employer schemes” (11).
f. Households. Households cover drug costs from out-of-pocket fund. This is the most significant drug financing system in Ethiopia. Presumably, only the households with some financial strength can take part in such drug financing options. This financing option naturally be excludes the poor. The system is inequitable and limits access to drugs by the poor. Over all, the percentage share of this source in Ethiopia is quite high (47%) as in the other developing countries.
Out-of-pocket expenses should be gradually shifted to social insurance and other similar schemes. But this needs special policy formulation. Out-of-pocket expenses are also looked from the point of view of sustainability. One study recommendation by WHO states that for sustainable financing of drugs, it is good to “reduce the out-of-pocket expenses especially by the poor” (11).
Table 4.1 Drug financing from all sources
Financing source 2003/04 2004/05 2005/06
Amount % Amount % Amount %
Federal Government (Table 3.2)
78,156,096 5.21 96,222,824 4.8 130,165,916 5.3
Regional Governments (Table 3.4)
130,869,858 8.7 98,126,483 4.9 102,453,178 4.2
Sub-Total 209,025,954 13.93 194,349,307 9.7 232,619,094 9.5
Donors (Table 3.8) 198,813,602 13.3 663,361,880 33.1 652,191,096 26.7
NGOs (Table 3.16) 146,449,968 9.8 88,210,000 4.4 394,546,967 16.2
Parastatals (Table 3.15) 7,542,588 0.5 8,440,156 0.4 9,250,411 0.4
Private Employers (Table 3.20)
3,351,263 0.22 3,750,063 0.19 4,110,069 0.2
Households (Table 3.18) 934,806,315 62.3 1,046,048,267 52.2 1,146,468,901 47
Total 1,499,989,690 100 2,004,159,673 100 2,439,186,538 100
Per capita drug expenditure in Birr
21.10 27.44 32.49
4.2. Per capita drug expenditure
The per capita expenditure on drugs for Ethiopia is calculated to be 32 Birr or 3.8 USD in 2005/06. This may be compared with global figures.
The per capita expenditure on pharmaceuticals of countries differs according to the economic level. Table 4.2 shows a marked variation. Note that the column “private” includes “health insurers, business and NGOs” (12). In other words it
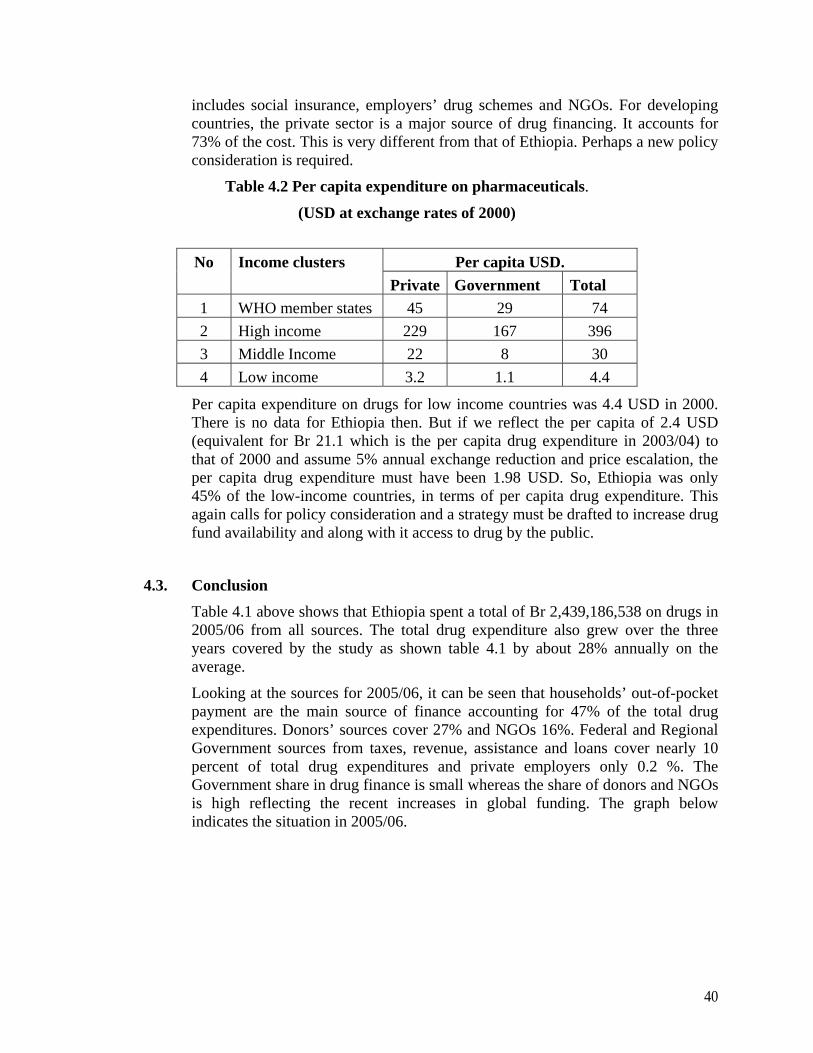
40
includes social insurance, employers’ drug schemes and NGOs. For developing countries, the private sector is a major source of drug financing. It accounts for 73% of the cost. This is very different from that of Ethiopia. Perhaps a new policy consideration is required.
Table 4.2 Per capita expenditure on pharmaceuticals.
(USD at exchange rates of 2000)
No Income clusters Per capita USD.
Private Government Total 1 WHO member states 45 29 74 2 High income 229 167 396 3 Middle Income 22 8 30 4 Low income 3.2 1.1 4.4
Per capita expenditure on drugs for low income countries was 4.4 USD in 2000. There is no data for Ethiopia then. But if we reflect the per capita of 2.4 USD (equivalent for Br 21.1 which is the per capita drug expenditure in 2003/04) to that of 2000 and assume 5% annual exchange reduction and price escalation, the per capita drug expenditure must have been 1.98 USD. So, Ethiopia was only 45% of the low-income countries, in terms of per capita drug expenditure. This again calls for policy consideration and a strategy must be drafted to increase drug fund availability and along with it access to drug by the public.
4.3. Conclusion Table 4.1 above shows that Ethiopia spent a total of Br 2,439,186,538 on drugs in 2005/06 from all sources. The total drug expenditure also grew over the three years covered by the study as shown table 4.1 by about 28% annually on the average.
Looking at the sources for 2005/06, it can be seen that households’ out-of-pocket payment are the main source of finance accounting for 47% of the total drug expenditures. Donors’ sources cover 27% and NGOs 16%. Federal and Regional Government sources from taxes, revenue, assistance and loans cover nearly 10 percent of total drug expenditures and private employers only 0.2 %. The Government share in drug finance is small whereas the share of donors and NGOs is high reflecting the recent increases in global funding. The graph below indicates the situation in 2005/06.
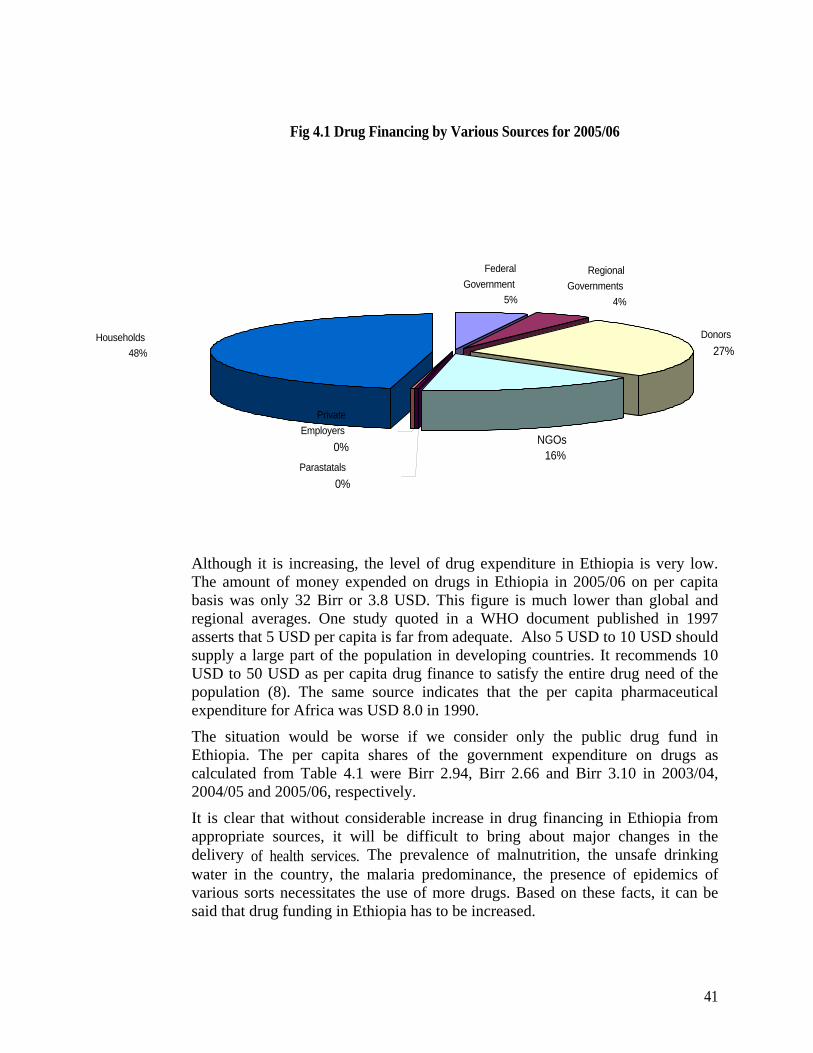
41
Fig 4.1 Drug Financing by Various Sources for 2005/06
Although it is increasing, the level of drug expenditure in Ethiopia is very low. The amount of money expended on drugs in Ethiopia in 2005/06 on per capita basis was only 32 Birr or 3.8 USD. This figure is much lower than global and regional averages. One study quoted in a WHO document published in 1997 asserts that 5 USD per capita is far from adequate. Also 5 USD to 10 USD should supply a large part of the population in developing countries. It recommends 10 USD to 50 USD as per capita drug finance to satisfy the entire drug need of the population (8). The same source indicates that the per capita pharmaceutical expenditure for Africa was USD 8.0 in 1990.
The situation would be worse if we consider only the public drug fund in Ethiopia. The per capita shares of the government expenditure on drugs as calculated from Table 4.1 were Birr 2.94, Birr 2.66 and Birr 3.10 in 2003/04, 2004/05 and 2005/06, respectively.
It is clear that without considerable increase in drug financing in Ethiopia from appropriate sources, it will be difficult to bring about major changes in the delivery of health services. The prevalence of malnutrition, the unsafe drinking water in the country, the malaria predominance, the presence of epidemics of various sorts necessitates the use of more drugs. Based on these facts, it can be said that drug funding in Ethiopia has to be increased.
FederalGovernment
5%
Regional Governments
4%
Donors27%
NGOs16%
Parastatals 0%
PrivateEmployers
0%
Households 48%
42
The extract from this finding is that a special effort has to be exerted to increase drug fund availability. Form table 4.1, it can be seen that the out-of-pocket payments are the largest single components of drug financing. The out-of-pocket expenses continue to grow, in absolute terms, in the periods under consideration. It was Birr 934.8 million in 2003/04 and attained the level of Birr 1.146 billion in 2005/06. These however continue to decline in relative terms.
Donors are the second most important sources of drug funding. In 2005/06, nearly 26.7% of the drugs are financed by donors. The sustainability of drug supply from donors should be examined form the drug availability point of view in the future. Overdependence on donors for drugs financing may have to be avoided. But this needs to be looked at from the point of capacity of the nation to address the issue. A policy framework to address the issue may have to be devised soon.
The role of NGOs in drug financing is noticeable. It was 16% in 2005/06. The contribution of NGOs to drug financing in 2004/05 showed a decrease by 40% over that of the previous year. But it took a huge jump of more than 347% in 2005/06.
The Federal and Regional financing of drugs show some growth over the years under consideration. The percentage shares, however, continue to decline over the years. It was 13.9% in 2003/04 and went down to 9.7% and 9.5% in 2004/05 and 2005/06, respectively. The overall contribution is small and it is declining.
The other main issue is the role of the insurance schemes to help in the covering of drug costs. In the developed world, insurance companies collect premiums from the healthy and use it to subsidize the need of the sick. The general result of the insurance systems is distribution of the burden of cost coverage or risk sharing. The low level of the insurance system in Ethiopia does not provide hope in that direction. Special strategies have to be devised to increase the role of insurance companies. In fact there is an ongoing initiative to introduce such a scheme by the FMOH. Attempts have also been made to gain experiences from African countries who have adopted these earlier.
4.4. Policy implications of the findings of the drug financing study
4.4.1. Government expenditure on drugs The Federal and Regional Government share in expenditure on drugs has been falling from 2003/04 – 2005/06. In particular, regional governments have been allocating smaller funds for drugs. Their expenditure showed marked decline. It is true that during the period under consideration costs of drugs have been increasing.
Decline in drug expenditure, therefore, means that less and less drugs would be available for the health institutions. This is not a healthy
43
development. Particular attention should be given to this fact and measures to correct the decline should be considered.
4.4.2 The role of donors in drug financing The contribution of donors to drug financing has been increasing over the three years under consideration. Whereas, this has been very useful in availing drugs for the health facilities, it is not sustainable. The increase in donor financing also came about from major and non-permanent funding organizations. It is very important to consider schemes for uninterrupted supply of drugs in the event that donors cease supplying the funds. A policy has to be forged out to prepare the nation for the eventuality.
4.4.3 Household expenditure on drugs The household expenditure on drugs is visibly high. This fact has surprised many, as there is a general belief that government health facilities provide drugs free of charge as most patients obtain waivers. But the reality is quite different. This has negative welfare implications for the poorest. The government needs to further strengthen its reforms and work towards improving access to drugs for the wider community like expanding the special pharmacies or implementation of the Pharmaceuticals Logistics Master Plan (PLMP).
4.4.4. Equity The average out-of-pocket payment during the study period was nearly 50%.This big share of out-of-pocket payment, in a country where nearly half of the population lives below poverty line, raises a big equity concern. In order to address this issue, it would be necessary to diversify the drug financing portfolio in the country. The new initiative to develop social insurance by the MOH is a good start. But such scheme needs to be further expanded and look for ways to capture the majority of informal sector and the poor. Also there is a need to expedite the implementation of the revised waiver and exemption system.
4.4.5 The role of insurance intermediaries in managing drug financing.
Insurance companies are useful in managing funds from policyholders. In Ethiopia, the role of the insurance companies is very much underdeveloped. Policies may have to be devised in order to help insurance companies play a more dominant role in managing drug funds.
4.4.6 Amount of finance earmarked for drugs
The per capita expenditure on drugs for Ethiopia is quite small as compared with recommended bench marks. The finance available for drugs from government and other sources is quite limited. There is a need for reviewing the drug budget allocation with the objective of increasing drug availability. The decision making process should involve all relevant sectors.

44
4.4.7 The role of social insurance Social insurance includes schemes like employers’ drug insurance (along with health insurance), mutual fund for drugs, community drug schemes and other policies, which ensure that payments are according to ability and drug availability is according to needs. In this way, the burden is shared among the large groups and drugs are made available for wider portion of the public. Such schemes might be considered as part of drug access policy framework.
4.5 Recommendations Increase government drug budget allocation to ensure sustainable and equitable access to drugs, particularly by the poor.
Develop policy framework for the creation of diversified drug financing portfolio by involving stake holders such as government, the private sector, multilateral and bilateral donors, NGOs, health professionals’ and the public representatives
Expand comprehensive social insurance to address the issue of equity by risk –sharing mechanism.
Expand further the new initiative of the Ministry of Health to develop social insurance and look for ways to capture the majority of the poor.
Expedite implementation of the revised waiver or exemption system of the Ministry of Health.
Give due attention to the establishment of data recording and reporting system at different levels of the drug supply chain such as health facilities, regional health bureaus, woreda health offices and other procurement and distribution organizations.
Undertake similar studies at appropriate time intervals to track trends in drug fund allocation and expenditure as well as monitor progress towards establishment of adequate and sustainable drug financing mechanism in the country.
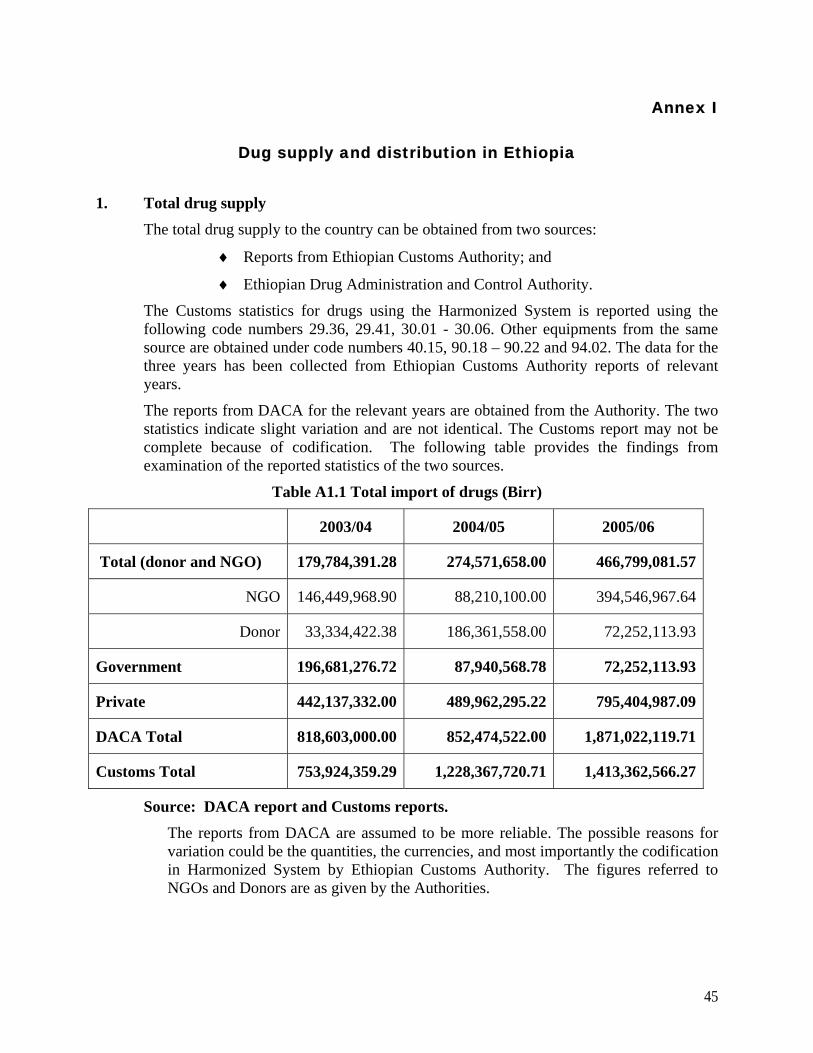
45
Annex I
Dug supply and distribution in Ethiopia
1. Total drug supply The total drug supply to the country can be obtained from two sources:
♦ Reports from Ethiopian Customs Authority; and
♦ Ethiopian Drug Administration and Control Authority.
The Customs statistics for drugs using the Harmonized System is reported using the following code numbers 29.36, 29.41, 30.01 - 30.06. Other equipments from the same source are obtained under code numbers 40.15, 90.18 – 90.22 and 94.02. The data for the three years has been collected from Ethiopian Customs Authority reports of relevant years.
The reports from DACA for the relevant years are obtained from the Authority. The two statistics indicate slight variation and are not identical. The Customs report may not be complete because of codification. The following table provides the findings from examination of the reported statistics of the two sources.
Table A1.1 Total import of drugs (Birr)
2003/04 2004/05 2005/06
Total (donor and NGO) 179,784,391.28 274,571,658.00 466,799,081.57
NGO 146,449,968.90 88,210,100.00 394,546,967.64
Donor 33,334,422.38 186,361,558.00 72,252,113.93
Government 196,681,276.72 87,940,568.78 72,252,113.93
Private 442,137,332.00 489,962,295.22 795,404,987.09
DACA Total 818,603,000.00 852,474,522.00 1,871,022,119.71
Customs Total 753,924,359.29 1,228,367,720.71 1,413,362,566.27
Source: DACA report and Customs reports.
The reports from DACA are assumed to be more reliable. The possible reasons for variation could be the quantities, the currencies, and most importantly the codification in Harmonized System by Ethiopian Customs Authority. The figures referred to NGOs and Donors are as given by the Authorities.

46
1.2. The role of the private sector and PHARMID in the supply of drugs The private sector is an important source of drug supply. Households constitute the final consumption centers of drugs. Households are sources of fund for drug purchase. The private hospitals, clinics, pharmacies and drug shops are increasing in Ethiopia. Their role in the health sector is growing. However, most of the private for profit health facilities and drug retail outlets are operating in Addis and other major urban locations. There are strict regulations governing the vending of drugs in pharmacies, drug shops and rural drug vendors. It is reported that there are over 3228 Retail outlets. DACA has around 4000 registered products to acquire and distribute in Ethiopia. There are also strict regulations regarding drug storage and displays. One of the major importers of drugs is PHARMID. Because it imports a significant amount of drugs, special mention is required. The organization is a parastatal established to avail drugs for the government hospitals and health institutions and in the process cover its cost from its profit. It also avails its services to all the private hospitals and private pharmacies. Its imports include:
Drugs and supplies,
Medical equipment and laboratory apparatus PHARMID is governed by a management board and reports to the Privatization and Public Enterprise Supervising Authority. Its imports of the past years are indicated below.
Table A1.2 Import of drugs, medical supplies and equipment by PHARMID (Birr)
Item 2003/04 2004/05 2005/06 2006/07
Pharmaceutical 200,730,288 134,454,770 168,870,273 187,913,731
Chemicals 4,340,762 4,871,624 2,424,197 2,306,631
Supplies 19,484,390 21,949,587 35,482,041 39,792,512
Medical equipment
15,706,249 11,431,421 16,616,011 16,708,672
Total 240,261,689 172,707,402 223,392,522 246,721,546
Source: PHARMID
The total quantity of drugs imported into the country by the private sector is given below. These include imports by all licensed companies in the country and the bulk of the quantity is believed to find its way to the pharmacies and drug shops.

47
Table A1.3 Import of drugs, medical supplies and equipment by the private sector (Birr)
Source: Records of DACA Note that the medical equipment mentioned in the tables above includes the import of various medical equipment like X-rays, ultra-sound equipment, blood chemistry analysis facilities including associated computers and printers. Medical supplies include items like reagents, chemicals, gloves, injection needles, X-ray films, and various laboratory and hospital supplies.
1.3 PSLD/FMOH receipt and distribution of drugs
Table A1.4 Value of drugs received and distributed by PSLD/FMOH to the regions
Year Total value of drugs, medical
supplies and medical equipment
2003/2004 201,875,311
2004/2005 317,254,598
2005/2006 572,012,465
Source: PSLD/FMOH for the relevant years
* In some years, the value of drugs distributed is higher than the value of drugs
received possibly because of distribution of drugs from closing stock of previous year. In other years it may be lower because amounts reported to have been donated to the FMOH by donors may not be received and distributed in the same year.
Year Value of drugs received
by FMOH (Birr) Value of drugs distributed to the
Regions by FMOH (Birr)
2003/04 167,614,701 172,989,665*
2004/05 396,995,535 183,899,602
2005/06 496,577,097 264,305,691
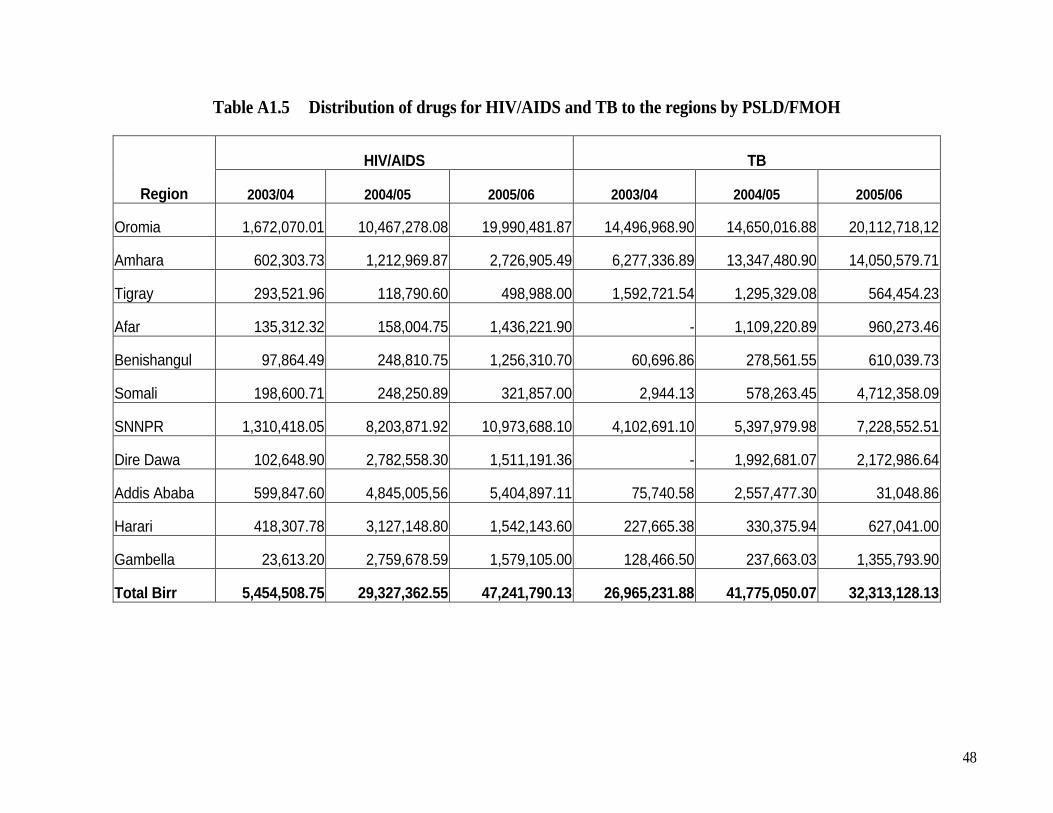
48
Table A1.5 Distribution of drugs for HIV/AIDS and TB to the regions by PSLD/FMOH
Region
HIV/AIDS TB
2003/04 2004/05 2005/06 2003/04 2004/05 2005/06
Oromia 1,672,070.01 10,467,278.08 19,990,481.87 14,496,968.90 14,650,016.88 20,112,718,12
Amhara 602,303.73 1,212,969.87 2,726,905.49 6,277,336.89 13,347,480.90 14,050,579.71
Tigray 293,521.96 118,790.60 498,988.00 1,592,721.54 1,295,329.08 564,454.23
Afar 135,312.32 158,004.75 1,436,221.90 - 1,109,220.89 960,273.46
Benishangul 97,864.49 248,810.75 1,256,310.70 60,696.86 278,561.55 610,039.73
Somali 198,600.71 248,250.89 321,857.00 2,944.13 578,263.45 4,712,358.09
SNNPR 1,310,418.05 8,203,871.92 10,973,688.10 4,102,691.10 5,397,979.98 7,228,552.51
Dire Dawa 102,648.90 2,782,558.30 1,511,191.36 - 1,992,681.07 2,172,986.64
Addis Ababa 599,847.60 4,845,005,56 5,404,897.11 75,740.58 2,557,477.30 31,048.86
Harari 418,307.78 3,127,148.80 1,542,143.60 227,665.38 330,375.94 627,041.00
Gambella 23,613.20 2,759,678.59 1,579,105.00 128,466.50 237,663.03 1,355,793.90
Total Birr 5,454,508.75 29,327,362.55 47,241,790.13 26,965,231.88 41,775,050.07 32,313,128.13

49
Table A1.6 Distribution of drugs for Malaria and emergency to the regions by PSLD/FMOH
Region
Malaria Emergency
2003/04 2004/05 2005/06 2003/04 2004/05 2005/06
Oromia 28,584,994.25 60,435,043.49 74,996,407.21 1,262,837.77 2,337,937.46 19,422.95
Amhara 842,130.78 9,147,662.45 16,033,096.45 542,021.44 386,287.00 412,228.00
Tigray 274,117.62 1,319,150.49 8,669,732.00 813,736.52 154,548.00 218,989.00
Afar 190,461.87 714,622.81 987,546.20 128,404.00 225,084.00 355,572.00
Benishangul 188,000.00 1,539,903.62 5,225,170.50 2,943,855.46 539,903.62 214,406.00
Somali 130,422.72 1,074,120.27 8,241,960.78 755,895.14 846,426.72 1,638,975.77
SNNPR 743,898.24 4,013,284.72 2,653,651.03 47,726,247.40 - 148,400.00
Dire Dawa 242,989.22 798,658.49 1,547,711.84 65,612.68 120,497.18 2,476.44
Addis Ababa 398,615.22 414,898.10 914,376.00 298,883.35 23,014.10 -
Harari 127,338.30 317,286.10 624,541.06
Gambella 171,124.00 679,229.76 814,596.23
Total Birr 31,894,092.22 80,453,860.30 120,708,789.30 54,537,493.76 4,633,698.08 3,010,470.16

50
Table A1.7 Distribution of drugs for HIV/AIDS and TB to individual organization by PSLD/FMOH
Organizations
HIV/AIDS TB 2003/04 2004/05 2005/06 2003/04 2004/05 2005/06
Federal Prisons 11,667.50 58,290.90 154,899.75
Ministry of Defense - 1,933,380.06 5,328,574.87 138,905.90 97,466.96 262,293.69
Gondar Hospital - 558,545.55 113,771.65 - 1,624.32 -
Alert Hospital - 60,075.22 273,643.00 - 343,335.40 32,695.18
Felege Hiwot Hospital - 436,421.95 -
Zewditu Hospital - 447,160.05 416,164.90 - 1,624.32 -
Black Lion Hospital - 69,462.00 314,611.26 22,819.58
Police Hospital - 1,055,818.05 3,167,544.04 946,690.40 55,601.31 -
Different Universities 120,366.70 60,390.28 24,401.70
St. Paulos Hospital - - 150,928.41 101,183.44
Yekatit 12 Hospital - - 10,969.25
Adama Hospital - 393,800.55 47,486.51
Red Cross (Blood Bank) - - 10,200.00
Louis Pasteur Institute - 37,283.00 62,664.38
DACA - 866,852.75 2,489,654.25
Magt Science for Health - 57,590.00 8,871,658.70
Pharmid - - 51,131,102.45
Kenema Pharmacy - 979,050.00 419,044.00
Tensae International - - 24,682.80
Meta Abo Brewery - - 2,184.00
Ras Desta Hospital - 799,250.00
Mekdim Ethiopia - 61,748.40
Ethio Leather S.C. 4,368.00
Bete Zatha H.C - 11,632.50
Eth. Orthodox Church - 6,282.45
UNICEF 207,392.30
RPM PLUS 337,140.00
PLC U - 28,701,977.04
Nekempt Hospital - 281,600.00
Negelle Hospital - 281,600.00
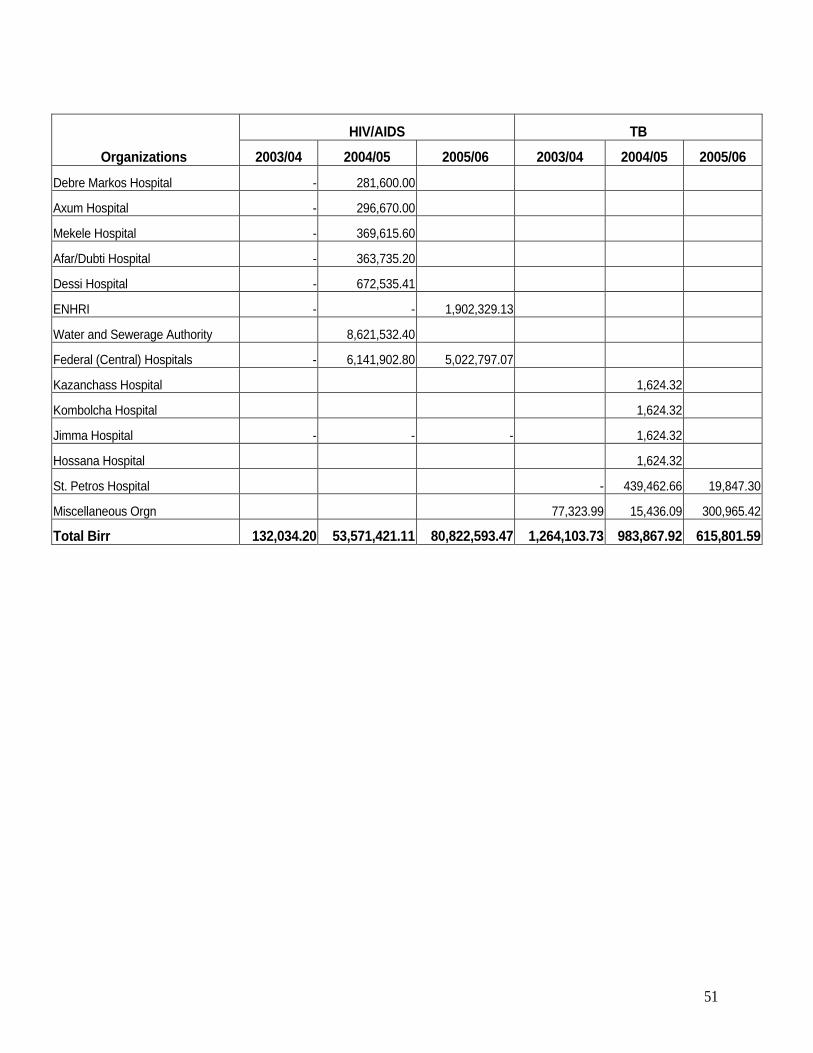
51
Organizations HIV/AIDS TB
2003/04 2004/05 2005/06 2003/04 2004/05 2005/06
Debre Markos Hospital - 281,600.00
Axum Hospital - 296,670.00
Mekele Hospital - 369,615.60
Afar/Dubti Hospital - 363,735.20
Dessi Hospital - 672,535.41
ENHRI - - 1,902,329.13
Water and Sewerage Authority 8,621,532.40
Federal (Central) Hospitals - 6,141,902.80 5,022,797.07
Kazanchass Hospital 1,624.32
Kombolcha Hospital 1,624.32
Jimma Hospital - - - 1,624.32
Hossana Hospital 1,624.32
St. Petros Hospital - 439,462.66 19,847.30
Miscellaneous Orgn 77,323.99 15,436.09 300,965.42
Total Birr 132,034.20 53,571,421.11 80,822,593.47 1,264,103.73 983,867.92 615,801.59
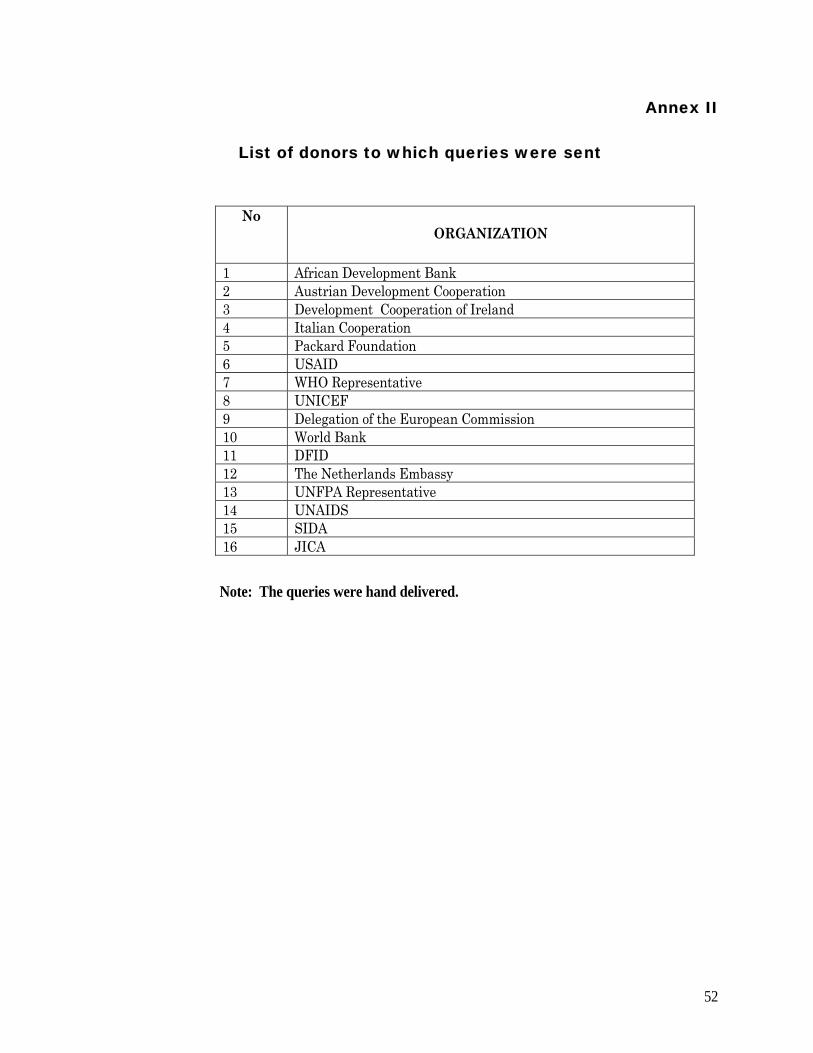
52
Annex II
List of donors to which queries were sent
No ORGANIZATION
1 African Development Bank 2 Austrian Development Cooperation 3 Development Cooperation of Ireland 4 Italian Cooperation 5 Packard Foundation 6 USAID 7 WHO Representative 8 UNICEF 9 Delegation of the European Commission 10 World Bank 11 DFID 12 The Netherlands Embassy 13 UNFPA Representative 14 UNAIDS 15 SIDA 16 JICA
Note: The queries were hand delivered.

53
REFERENCES
1. FDRE (2005/06). Health and Health Related Indicators. Addis Ababa: Planning and Programming Department, Ministry of Health, 1998 E.C. (2005/06).
2. CSA (2006). Ethiopia Demographic and Health Survey (EDHS). Addis Ababa:
Central Statistical Agency, September 2006.
3. FDRE (2004/05). Health Sector Development Program III (HSDP III) final draft report. Addis Ababa: Federal Ministry of Health, 2004/05.
4. FDRE (2006).Ethiopia’s Third National Health Accounts. Addis Ababa: Federal
Ministry of Health, September 2006.
5. TGE (1993). National Health Policy of the Transitional Government of Ethiopia. Addis Ababa: TGE, 1993.
6. TGE (1993). National Drug Policy of the Transitional Government of Ethiopia.
Addis Ababa: TGE, 1993.
7. FDRE (1999). Drug Administration and Control Proclamation. Addis Ababa: The House of Representatives, Federal Democratic Republic of Ethiopia, 29 June 1999.
8. WHO/MSH (1997). Managing Drug Supply, 2nd edition. World Health Organization
and Management Science for Health, 1997.
9. WHO (1988). How to develop and implement National Drug Policies, 2nd edition. Geneva: The World Health Organization, 1988.
10. FMOH (2003). NGO involvement in the Ethiopian health sector: Facts, challenges
and suggestions for enabling environment. Addis Ababa: Health Care Financing (HCF) Secretariat of the Federal ministry of Health, 2003.
11. WHO (2004). Equitable access to medicines: A framework for collective action. In:
WHO perspectives on medicines. Geneva: World Health Organization, March 2004.
12. WHO (2004). World Medicines Situation. Geneva: World Health Organization, 2004.

54