drought resilience of the california central …
TRANSCRIPT

Miller et al. 20 March 2008
DROUGHT RESILIENCE OF THE CALIFORNIA CENTRAL VALLEY SURFACE-
GROUNDWATER-CONVEYANCE SYSTEM
Norman L. Miller, Larry L. Dale, Charles F. Brush, Sebastian D. Vicuna,
Tariq N. Kadir, Emin C. Dogrul, and Francis I. Chung

2
ABSTRACT
A series of drought simulations were performed for the California Central Valley using computer
applications developed by the California Department of Water Resources and historical datasets
representing a range of droughts from mild to severe for time periods lasting up to 60 years.
Land use, agricultural cropping patterns, and water demand were held fixed at the 2003 level and
water supply was decreased by amounts ranging between 25 and 50 percent, representing light to
severe drought types. Impacts were examined for four hydrologic sub-basins, the Sacramento
Basin, the San Joaquin Basin, the Tulare Basin, and the Eastside Drainage. Results suggest the
greatest impacts are in the San Joaquin and Tulare Basins, regions that are heavily irrigated and
are presently overdrafted in most years. Regional surface water diversions decrease by as much
as 70 percent. Stream-to-aquifer flows and aquifer storage declines were proportional to drought
severity. Most significant was the decline in groundwater head for the severe drought cases,
where results suggest that under these scenarios the water table is unlikely to recover within the
30-year model-simulated future. However, the overall response to such droughts is not as severe
as anticipated and the Sacramento Basin may act as groundwater insurance to sustain California
during extended dry periods.
Key Terms: Drought simulation, surface-groundwater response, pumping.
Respectively, Staff Scientist and Adjunct Professor, Climate Science Department, Berkeley National Laboratory and Geography Department, University of California, Berkeley, 90-1116 One Cyclotron Road, Berkeley, California, 94720; Staff Scientist, Energy Analysis Department, Berkeley National Laboratory, Berkeley, 90-4000 One Cyclotron Road, Berkeley; Water Resources Engineer, Modeling Support Branch, Bay-Delta Office, Department of Water Resources, 1416 9th Street, P.O. Box 942836, Sacramento, CA 94236; Graduate Student, Civil and Environmental Engineering Department, University of California, Berkeley, Davis Hall, Berkeley, CA, 94720; Senior Engineer, Modeling Support Branch, Bay-Delta Office, Department of Water Resources, 1416 9th Street, P.O. Box 942836, Sacramento, CA 94236; Water Resources Engineer, Modeling Support Branch, Bay-Delta Office, Department of Water Resources, 1416 9th Street, P.O. Box 942836, Sacramento, CA 94236; Principal Engineer, Bay-Delta Office, Department of Water Resources, 1416 9th Street, P.O. Box 942836, Sacramento, CA 94236.

3
INTRODUCTION
The western United States has experienced periods of long drought conditions since the last
glacial epoch 11,000 years ago. The period between 900 and 1400 A.D. was a time when severe
long-duration droughts occurred in the western U.S. (Cook et al. 2004). This Medieval mega-
drought period was followed by a less severe drought period that was coincident with the Little
Ice Age cooling period. Samples from sediments, tree rings, and tree stumps, combined with
isotope dating analysis have been used to reconstruct these naturally occurring droughts that
lasted 50 to more than 100 years (Stine 1994; Herweijer et al. 2006; Cook et al. 2007). Indeed,
two epic drought periods, one lasting from approximately 900 to 1100, and the second lasting
from about 1200 to 1350, contributed to the decline and disappearance of the Anasazi people, a
culture that relied on irrigated agriculture to support its population. Drought is also seen as a
contributing factor in the failure of European colonies in South Carolina and North Carolina in
the 1500s. More recently, four droughts in the western U.S. centered on AD 1710, 1770, 1850
and 1930 have been associated with the Pacific Decadal Oscillation (PDO), and indicate drought
recurrence intervals of 60 to 80 years (Benson et al. 2003) and a linkage to large-scale climatic
phenomena.
During the last 150 years, California has been in a slightly above average wet regime, with an
annual average precipitation of 58 cm (23 inches), and at least 11 significant drought periods
(Ingram et al. 1996; Cook et al. 2004). At the same time, California Central Valley agriculture
has expanded over most of the Valley floor, and includes a system of managed irrigation and
water conveyance that has assumed climatically stationary conditions for conveyance system
development and planning. The 1929-1934 drought has traditionally been the benchmark event
used for designing storage capacity and yield of large California reservoirs. The stationarity
principle may no longer be valid, as substantial anthropogenic changes in Earth’s climate are
altering the means and extremes of precipitation, evapotranspiration, and rates of discharge to
rivers (Milly et al. 2008). Changes in the temperature regime in California associated with
projected future climate are expected to result in reduced winter snowpack and increased winter
runoff (Miller et al. 1999; Hayhoe et al. 2004; Maurer and Duffy 2005). In addition, the
population of California’s Central Valley has increased from less then 3 million people in 1970

4
to more than 6 million in 2002, and is projected to increase to 15 million people by 2050 (U.S.
Bureau of the Census 1982; California Department of Finance 2007). Since the 1970’s, as the
urban area of the Central Valley has increased, agricultural acreage has remained relatively
constant by expanding into previously uncultivated land. The increase in population coupled
with constant agricultural acreage has resulted in steadily increasing water demands.
Approximately 35% of the water demands in the Central Valley are currently met with
groundwater (California Department of Water Resources 2003), with pumping rates increasing in
years of reduced surface water availability. Flow deficits associated with future climate
scenarios, coupled with present and future levels of water demand, may inflict significant stress
on Central Valley aquifers. In light of these challenges, the California Department of Water
Resources (CDWR) and other water agencies have begun to evaluate new approaches for
incorporating the changing climate into water resources planning and management (CDWR
2006; Anderson et al. 2008).
The goals of this study are to quantify the impacts of long-term hydrologic droughts – a first-
order approximation of an analogue for climate change related snowpack reduction – on water
storage, and to illustrate the potential for surface and subsurface storage to limit the adverse
impacts of drought and snowpack reduction on water supply and hydropower generation. This
includes how groundwater pumping compensates for reductions in surface water inflow, the
extent to which the water table is reduced, and how, when, and if this system recovers or reaches
a new equilibrium. In the next section, we provide details on our approach for simulating
persistent droughts in the California Central Valley. This is followed by the results and
discussion section, then our summary and conclusions.
APPROACH
This analysis of the impacts of sustained droughts in the California Central Valley is based on a
series of specified reductions in net surface water inflows observed during the 1923-1972 period.
The reductions considered in the study represent a 30% (below average), 50% (dry), and 70%
(critically dry) effective reduction for periods ranging from 10 to 60 years, and were applied to

5
the CDWR’s California Central Valley Groundwater-Surface Water Simulation Model
(C2VSIM). The methodology used here is part of a series of analyses that allow for the
decomposition and response term by term, allowing for a reductionist evaluation of the impacts
of decreases in net surface flow from reservoirs and Central Valley precipitation. Previous
studies of California’s future water supply were based on downscaled climate model projections
with hydrologic model simulations and permutations of the 1922-1993 unimpaired streamflows
(Miller et al. 2003) with an operating criterion of maximizing statewide water supply net benefits
(e.g. Lund et al. 2003; Zhu et al. 2005; Tanaka et al. 2006; Medellin-Azuara et al. 2008).
However, these studies are unable to pin down the term-by-term isolated response to droughts,
present day or future. With that in mind, it was deemed essential to keep land use unchanged in
this phase of analysis in order to understand only the response to reduced flows under current
conditions.
The CDWR is addressing global climate change in the California Water Plan, Bulletin 160
(CDWR 2005a). Specified drought scenarios act as an analogue to projected reductions in
snowpack-derived surface water flows. Rather than focus on causes of global climate change,
which are being addressed by other agencies and research institutions, the CDWR Water Plan
looks at potential impacts of climate change on water resources in California and strategies for
adapting to these changes.
Model Descriptions
Two computer applications developed by CDWR, the surface water allocation model California
Simulation Model (CALSIM II) and the integrated hydrologic model California Central Valley
Groundwater-Surface Water Simulation Model (C2VSIM), were used for this study.
California Simulation Model version II (CALSIM II)
The CALSIM model (Draper et al. 2004) is a general-purpose, network flow, reservoir and river
basin water resources allocation model developed jointly by CDWR and the U.S. Bureau of
Reclamation. It is used for evaluating operational alternatives of large, complex river basins.
CALSIM integrates a simulation language for flexible operational criteria specification, a mixed

6
integer linear programming solver for efficient water allocation decisions, and graphics
capabilities for ease of use. A linear objective function describes the priority in which water is
routed through the system and the constraints set the physical and operational limitations toward
meeting the objective. CALSIM maximizes the objective function in each time period to obtain
an optimal solution that satisfies all constraints.
CALSIM was originally designed, and has been successfully implemented as a planning model of
the State Water Project (SWP) and Central Valley Project (CVP) system to examine the range of
options to improve supply reliability. The second-generation version used here (CALSIM II)
calculates the reservoir operations and time dependent rim-flow into the Central Valley on
monthly time steps, providing the needed boundary conditions to C2VSIM.
California Central Valley Groundwater-Surface Water Simulation Model (C2VSIM)
The C2VSIM model (Brush et al. 2008) was developed as an application of the CDWR’s
Integrated Water Flow Model (IWFM; CDWR 2005b, 2005c, 2006). IWFM simulates land-
surface processes, surface water flow and groundwater flow. The land-surface module computes
infiltration and runoff from net precipitation; consumptive use by native vegetation, irrigated
crops and urban areas; surface water diversion and application; groundwater pumping and
application; infiltration and return flow from irrigation; and recharge. Surface water flow is
simulated as a function of flow from upstream reaches, tributaries and lakes; surface runoff;
agricultural and urban return flows; diversions and bypasses; and exchanges with the
groundwater flow system. Horizontal and vertical groundwater flow are simulated using the
Galerkin finite element method and a quasi-three-dimensional approach utilizing the depth-
integrated groundwater flow equation for horizontal flows in each aquifer layer and leakage
terms for vertical flow between aquifer layers. To the extent that is practical, IWFM directly
incorporates readily available historical and spatial data sets, including precipitation, the Natural
Resource Conservation Service (NRCS) runoff curve number, surface water inflows and
diversions, land use and crop acreages.
The C2VSIM model simulates land surface processes, groundwater flow and surface water flow
in the alluvial portion of the Central Valley (Fig. 1) using a monthly time step. C2VSIM covers

7
an area of 51,394 km2 (19,834 mi2), and incorporates 1392 nodes forming 1393 elements and 3
layers, 431 stream nodes delineating 74 stream reaches with 97 surface water diversion points, 2
lakes, and 8 bypass canals (Fig. 1a). Surface water inflows are specified for 35 gaged streams
and simulated for ungaged small watersheds. The model area is divided into 21 subregions (Fig.
1b), and groundwater and surface water are allocated to meet monthly water demands in the
land-surface process within each subregion.
Figure 1. C2VSIM domain: (A) finite element grid and (B) water budget subregions.
Regional-scale parameter values were calibrated using the PEST parameter estimation program
(Doherty 2005) for the 25-year period 1975-1999, using groundwater head observations at 221
wells, paired groundwater head observations for calculating vertical head gradients at 9
locations, monthly river flow observations at 7 locations, and stream-aquifer interaction values at
65 locations along 33 river reaches. The preliminary calibration produced hydraulic parameter
values that reflect the geologic composition of subregions within the Central Valley. The average
difference between simulated and observed groundwater heads for water years 1975-1999 was
4.43 m (13.5 ft), the RSME was 24.1 m (73.4 ft), and the RMSE/range was 11%. The
groundwater heads produced by the model are considered reasonably accurate given the
discretization of the finite element grid, in which the average spacing between model nodes is on
the order of 8 km (5 miles), and the areal extent of the water budget subregions. Simulated and
observed stream-groundwater flows are of the same order of magnitude and in the same direction
for a majority of the simulated river reaches. The average difference between simulated and
observed surface water flows for the Sacramento Valley and the San Joaquin Basin for 1975-
1999 was 0.044 km3/mn (35.7 thousand acre-feet per month [taf/mn]), the RMSE was 0.17
km3/mn (139 taf/mn), and the RMSE/range was 2%. Given that an average of 2.6 km3/mn (2.1
million acre-feet per month [maf/mn]) flows through these basins, the surface water flow system
representation in the calibrated model is considered to be very accurate.
Drought Scenarios
Drought scenarios used here are constructed surface water flow reductions representing scenarios
with mean reductions in precipitation ranging from 30% to 70% for periods ranging from 10

8
years to 60 years, with a 10-year spin up and a 30-year recovery. The C2VSIM boundary forcing
was generated using the CALSIM II model and historical flow observations of Central Valley rim
flows based on the specified reductions corresponding to each scenario. The notation for the set
of twelve scenarios is given in Table 1.
Table 1. Drought scenario notation.
The methodology used to create hypothetical drought scenarios consisted in selecting randomly
hydrologic dry years (in terms of reservoir inflow) from the historic record and appending them
together to create the specified droughts. For each one of these timeseries of appended years we
extracted timeseries of reservoir releases and surface water deliveries resulting from an historic
simulation done with the CALSIM II model. These timeseries were matched to the required
C2VSIM input needs. It wasn’t assured through this method that the exact specified amount in
reduction in deliveries would occur, because there is not a perfect correlation between inflows to
reservoirs and deliveries, and also because the reductions were assumed to be homogeneous
throughout the different regions included in the model. An analysis of the input data that went
into the model shows that the derived scenarios were underestimations of the expected
reductions and the distribution of reductions were not homogeneous.
The remainder of this study refers to the three drought intensity levels as light (30%), moderate
(50%), and severe (70%), noting that the reductions in deliveries are lower than the reductions in
reservoir inflows. The specified drought scenarios and reductions in precipitation, reservoir
releases and surface water deliveries are presented in Table 2.
Table 2. Drought scenario reductions in precipitation, reservoir releases and surface
water deliveries.
RESULTS AND DISCUSSION
The Central Valley region covers 51,394 km2 (5.08 Mha, 12.7 million acres [Mac]), with a
cropped area of 27,518 km2 (2.72 Mha, 6.8 Mac) in 2003. The Central Valley can be divided into

9
five hydrologic regions: the Sacramento Valley covers the northern part of the Central Valley
(model subregions 1-7; 14,927 km2), the San Joaquin Basin is in the center of the Central Valley
(model subregions 10-13; 9,950 km2), the Tulare Basin in the southern end of the Central Valley
(subregions 14-21; 19,958 km2), the Sacramento-San Joaquin Delta (subregion 9; 2,936 km2),
and the Eastside Streams to the east of the Sacramento-San Joaquin Delta (subregion 8; 3,624
km2). The impacts of the simulated droughts are discussed for the Central Valley, and for the
Sacramento Basin, Eastside Drainage, San Joaquin Basin, and Tulare Basin, with a detailed
focus on three drought scenarios, the 30-year moderate drought, the 60-year light drought, and
the 60-year severe drought. Simulated river flows in the Sacramento-San Joaquin Delta region
are dominated by surface water transfers, and drought impacts on this region were therefore
omitted from this study. To compare impacts across the four hydrologic regions, all flow rates
were normalized against the region area, transforming volume per area to depth; normalizing
flow rates against crop area would yield similar results as normalizing against regional area, as
the regional water budgets are dominated by agricultural water use.
In response to drought-induced reductions in surface water availability, combined with static
demands based on a fixed land use and population, the IWFM application automatically
increases groundwater pumping to exactly meet the specified agricultural and urban water
demands. The reduced surface water flows and precipitation and increased groundwater pumping
induce changes in water table altitude, groundwater volumetric storage, and stream-groundwater
flow. Groundwater recharge is also reduced owing to both reduced precipitation at the land
surface and reduced recoverable losses (i.e. canal leakage) from surface water diversions. The
30-year recovery period and fixed land use and demands were required to isolate the impacts
associated with surface water flow reductions alone. Future studies planned as part of this work
include sequential and combined changes in both the land use types and demands.
Surface Water Diversions
The twelve simulated droughts all begin with the same initial conditions, and spin up for ten
years, during which surface diversions across the Central Valley average 13.4 km3/y (10.9
maf/y). Reservoir releases and surface water diversions were simulated by CALSIM II in
response to specified reservoir inflows and constant 2003-level demands for each of the three

10
levels of drought. Surface water diversions were lower than base period diversions in all months
(Table 3), except for December diversions under the slight drought scenario, which were
elevated due to the shift of the runoff hydrograph to increased winter runoff. After the 10-year
spin-up period, surface water diversions in the Central Valley fall 39% during the severe drought
scenario, 22% during the moderate drought scenario, and 13% during the light drought scenario
(Table 4). Each scenario concludes with a 30-year recovery period
Table 3. Monthly change in surface water diversions compared to base period diversions.
Table 4. Impact of simulated droughts on surface water diversions.
It is apparent from the simulation results that drought scenario impacts are concentrated in the
San Joaquin and Tulare Basins. In the severe 60-year drought scenario, these basins experience
average annual declines of 0.15 m and 0.13 m (0.46 ft and 0.41 ft), respectively, in surface
deliveries compared to the base period (Table 5), representing a 43% decline in the San Joaquin
Basin and a 70% decline in the Tulare Basin. The Sacramento Basin and Eastside Drainage
experience declines of 27% and 60%, respectively. In the moderate 30-year drought, the
Sacramento Basin, Eastside Drainage, San Joaquin Basin and Tulare Basin experience declines
of 5%, 40%, 19% and 62% respectively. In the light 60-year drought scenario, average annual
surface water deliveries increase by 7% in the Sacramento Basin (due to higher winter flows),
and decline by 43%, 17% and 46% for the Eastside Drainage, San Joaquin Basin and Tulare
Basin, respectively.
Table 5. Surface water diversions in base and drought periods.
Groundwater Pumping
Farmers in the Central Valley have historically increased groundwater pumping during drought
periods to make up for declines in surface water deliveries. To maintain constant irrigation levels
in the entire Central Valley during the simulated droughts, groundwater pumping increased by
71% in the severe drought, 49% in the moderate drought, and 27% in the light drought scenario
(Table 6). Interestingly, drought period groundwater pumping is greater than the reduction in
surface water diversions. For example, Central Valley groundwater pumping increases 0.12 m/y

11
(0.36 ft/y) in the severe drought, when surface water diversions declined only 0.11 m/y (0.33
ft/y). Increases in groundwater pumping in the San Joaquin Basin and Tulare Basin range from
0.01 to 0.04 m/y (0.04 to 0.12 ft/y) greater than the reduction in surface water diversions. This
increase in groundwater pumping is required to compensate for the reduced precipitation
experienced during drought years (Table 2). Indeed, changes in groundwater pumping may be a
better indicator of drought severity than changes in surface water diversions in most regions. For
example, groundwater pumping in the Eastside Drainage increases by 0.05 m/y (0.16 ft/y) in the
severe drought scenario, 0.04 m/y (0.13 ft /y) in the moderate drought scenario, and 0.02 m/y
(0.07 ft/y) in the light drought scenario, while surface water diversions in this region remain
close to base period levels (Table 6).
Table 6. Impact of drought on groundwater pumping.
Aquifer Recharge
In a normal year, the Central Valley aquifers are recharged with excess from surface irrigation
deliveries and rainwater percolation. For the Central Valley as a whole, this aquifer recharge
generally exceeds groundwater withdrawals, although withdrawals exceed recharge in local areas
of persistent groundwater overdraft (CDWR 2003). In the base period, for example, the Central
Valley groundwater recharge is 0.21 m/y (0.63 ft/y) (Table 7) compared to groundwater pumping
of 0.16 m/y (0.50 ft/y) (Table 6). Excess groundwater storage derived from recharge in normal
years helps to maintain groundwater storage levels during short-duration droughts when there is
a dramatic decline in recharge. Average recharge across the Central Valley drops 14%, during
the light drought scenario, to as much as 42%, during the severe drought scenario (Table 7).
Annual rainfall rates are highest in the northern Sacramento Basin and lowest in the southern
Tulare Basin. Under the simulated drought scenarios, recharge varies across regions in
proportion to changes in both surface water deliveries and rainfall. In the severe drought
scenario for example, the Sacramento, San Joaquin and Tulare Basins experience large declines
in both precipitation and surface water deliveries and register large declines in aquifer recharge.
The regional variation in rainfall helps to explain the regional variation in recharge not explained
by regional differences in surface water deliveries.

12
Table 7. Impact of drought on aquifer recharge.
Stream-Aquifer Flows
In normal years the rivers in the Sacramento and San Joaquin Basins are net “gaining rivers”,
meaning that their flow is increased by a net movement of water from aquifers that are adjacent
to rivers (Table 8). Alternatively, in normal years the rivers in the Eastside Drainage and Tulare
Basin are “losing rivers”, with a net movement of water out of rivers and into adjacent aquifers.
Stream-aquifer flows in the Sacramento and San Joaquin Basins are larger than those in the
Eastside Drainage and Tulare Basin, and tend to dominate the average stream-aquifer flow in the
Central Valley, which experiences a net flow of water from aquifers to rivers in normal years.
The net flow of water from groundwater to rivers decreases during droughts as regional
groundwater levels decline in response to reduced recharge and increased withdrawals. In
addition, flows from rivers to aquifers decrease because there is less water available in the rivers.
Net groundwater discharges to rivers decline 23% in a slight drought, 32% in a moderate
drought, and 68% in a severe drought (Table 8). The reduction in groundwater discharge to
rivers limits the decline of groundwater levels during droughts, and also contributes to
streamflow reduction beyond the reduction in valley-rim inflow.
Table 8. Impact of drought on stream-aquifer flows. [Positive values are from the stream
to the aquifer, and negative values are from the aquifer to the stream.]
Changes in Aquifer Storage
The change in aquifer storage over time is the sum of aquifer withdrawals, including
groundwater pumping and discharges to streams, minus the aquifer inflows, including stream
inflows and irrigation recharge. Changes in boundary flows have an additional, but very minor,
impact on storage levels. During the base period (a mix of normal and above normal rainfall
years), Central Valley storage increases by 0.03 m/y (0.10 ft/y). During the drought scenarios,
Central Valley aquifer storage declines by 0.08 m/y (0.26 ft/y) in the light drought scenario to
0.19 m/y (0.57 ft/y) in the severe drought scenario (Table 9).

13
Table 9. Impact of drought on aquifer storage.
Groundwater Levels
Central Valley groundwater levels adjust to changes in storage, rising during the base period and
falling during the drought scenarios. During the base period, average Central Valley groundwater
levels rise 0.09 m/y (0.29 ft/y), with average levels in the Sacramento and San Joaquin Basins
increasing by 0.08 m/y (0.24 ft/y) and 0.22 m/y (0.66 ft/y), respectively, and the Tulare Basin
increasing by only 0.02 m/y (0.07 ft/y). Average Central Valley groundwater levels decline 0.29
m/y (0.88 ft/y) under the slight drought scenario and 0.77 m/y (2.33 ft/y), respectively, during the
light and severe drought scenarios, with substantial variation shown by region (Table 10).
Table 10. Impact of drought on groundwater levels.
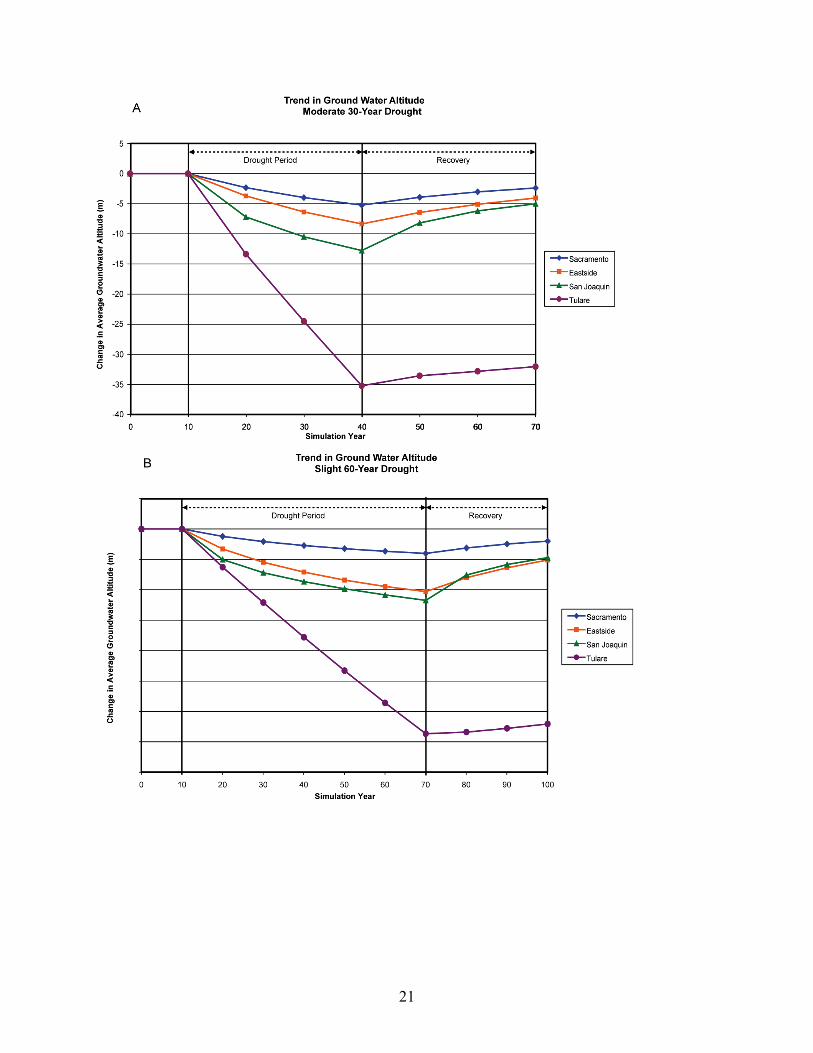
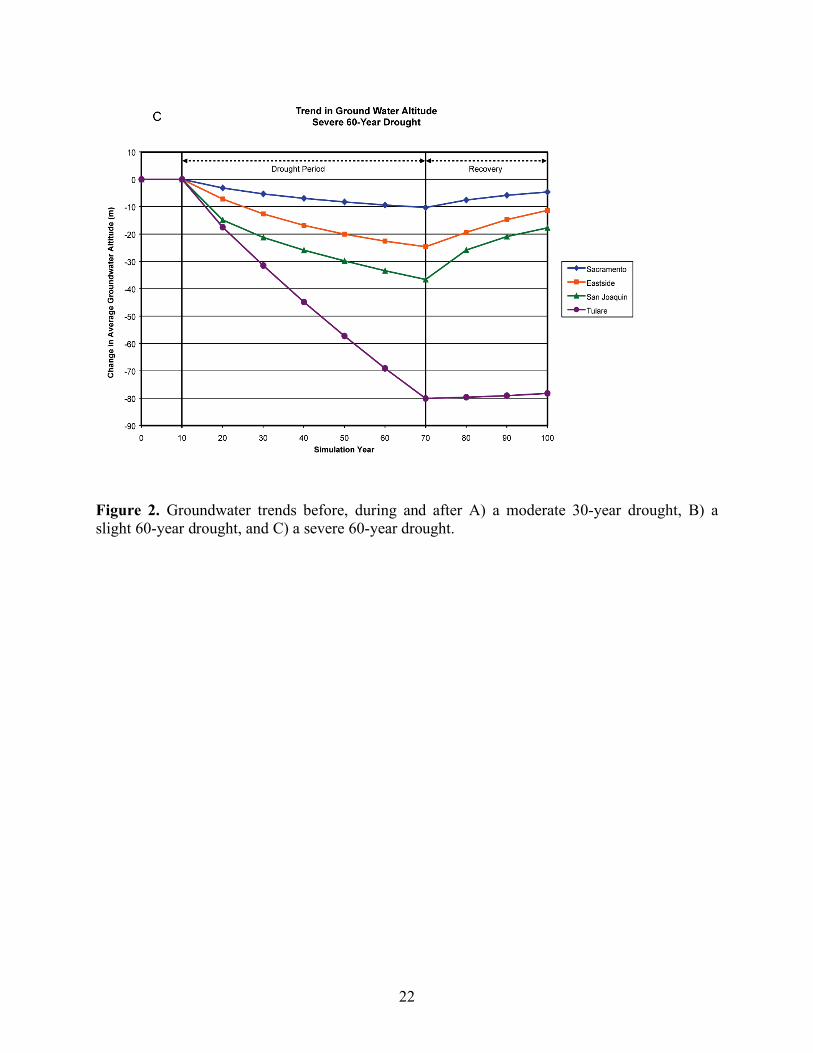
Groundwater Decline and Recovery
The average groundwater level of the Central Valley falls 46 m (140 ft) by the end of the severe
60-year drought scenario, 33 m (101 ft) by the end of the moderate drought scenario, and 17 m
(53 ft) by the end of the light drought scenario (Table 11). Groundwater levels drop more in the
San Joaquin and Tulare Basins than the other regions due primarily to the larger increase in
pumping for these regions. The Tulare Basin experiences the largest decline, ranging from 35 m
(105 ft) in the light drought scenario to 84 m (258 ft) in the severe drought scenario. The
simulations included a 30-year "recovery period" to explore how Central Valley aquifers respond
to a return to normal rainfall and irrigation conditions. After the severe 60-year drought, the
average groundwater level in the Central Valley rises 8 m (26 ft) over the 10-year recovery
period (Table 11), a recovery of only 18%. The average Central Valley groundwater level
recovers 15% after a moderate 60-year drought and 21% after a light 60-year drought. In general,
groundwater levels recover fairly rapidly in the Sacramento Basin, Eastside Drainage and San
Joaquin Basin, and very slowly in the Tulare Basin. A large portion of the Tulare Basin has
experienced chronic overdraft as groundwater withdrawals have often exceeded recharge
(CDWR 2003). The simulated recovery rates suggest that the Tulare Basin would not achieve
pre-drought groundwater levels for at least 30 years, if ever. The other regions experience more

14
rapid rates of groundwater recovery, and simulation results suggest these regions would likely
achieve pre-drought groundwater levels relatively rapidly after a drought.
Table 11. Change in average groundwater level during a 60-year drought and after a 30-
year recovery period.
Figure 2. Groundwater trends before, during and after A) a moderate 30-year drought,
B) a slight 60-year drought, and C) a severe 60-year drought.
CONCLUSIONS
Drought simulations for a set of specified scenarios were performed by constructing reservoir
releases and surface water diversions with CDWR’s CALSIM model, and simulating the land
surface, stream and aquifer response with CDWR’s California Central Valley Groundwater-
Surface Water Simulation (C2VSIM) model. Three types of drought intensities were considered,
30% (light), 50% (moderate), and 70% (severe) reductions in inflows to reservoirs, with reduced
flow durations ranging from 10 to 60 years. Central Valley surface flow diversions decreased by
12% under the light drought scenario, and 38% under the severe drought scenario. In response to
reduced surface water diversions and reduced rainfall, groundwater pumping increased by 27%
under the light drought and by 71% under the severe drought. Net discharge from aquifers to
rivers decreased by 23% for light drought to 68% for severe droughts, and aquifer recharge
decreased by 4% for light droughts to 48% for severe droughts. The impacts on groundwater
levels correlate with changes in groundwater storage, but are complicated by the compensating
increase in pumping for highly irrigated regions (e.g. the San Joaquin Basin and Tulare Basin)
with average Central Valley groundwater levels falling 17 m (53 ft) under the light drought and
46 m (140 ft) under the severe drought. Simulated groundwater levels do not fully recover
within 30 years after the end of the severe drought, and for the moderate and light droughts a
new equilibrium appears to be established.

15
This study employed stationary 2003-level agricultural and urban water demands to investigate
the response of the groundwater flow system to long-term droughts. Future climate changes are
expected to include many complex impacts on California’s Central Valley that were not
addressed in this study, including changes in the amount and timing of crop water demands as a
result of increased mean temperature and evapotranspiration and increased atmospheric carbon
(Kay and Davies 2008; Brumbelow and Georgakakos 2007), and changes in the timing and
amounts of streamflow to reservoirs (Miller et al. 2003; Hayhoe et al. 2004; CDWR 2006; Milly
et al. 2008). The impacts of these changes are difficult to assess owing to the numerous and
dynamic aspects of the groundwater flow system, including the spatial and temporal variability
of recharge and interactions with surface water bodies and the land surface (Alley et al. 2002).
This is further complicated because local changes in groundwater pumping, recharge and other
aspects of the hydrologic system may be significantly affected by changes in policies, societal
values, and economic and technological factors (Loaiciga 2003; Holman 2006; King et al. 2008).
This reduced form study gives a quantitative response to specified droughts that act as analogues
to snowpack reduced inflows to reservoirs, and illustrates the general impacts of climatic events
on water storage under present day land use and population demands. Further study is required to
determine the degree to which changes in agricultural demands in response to economic
pressures would reduce groundwater depletion and promote more rapid recovery to pre-drought
groundwater levels.
ACKNOWLEDGEMENTS
This project was supported through by grant provided by the California Energy Commission,
500-02-004, and by the California Department of Water Resources. Work for the Department of
Energy is under contract DE-AC02-05CH11231.
LITERATURE CITED
Alley, W.M., R.W. Healy, J.W. LaBaugh, and T.E. Reilly, 2002: Flow and storage in
groundwater systems. Science, 296, 1985-1990.

16
Anderson, J., F. Chung, M. Anderson, L. Brekke, D. Easton, M. Ejeta, R. Peterson and R.
Snyder, 2008: Progress on incorporating climate change into management of California’s
water resources. Climatic Change, 87, S91-S108, doi 10.1007/s10584-007-9353-1.
Benson, L., L. Braddock, J. Smoot, S. Mensing, S. Lund, S. Stine, and A Sarna-Wojcicki, 2003:
Influence of the Pacific Decadal Oscillation on the climate of the Sierra Nevasa, California
and Nevada. Quaternary Research, 59, 151-159.
Brumbelow, K., and A. Georgakakos, 2007: Consideration of climate variability and change in
agricultural water resources planning. J. Water Res. Plan. Manag., 133, 275-285.
Brush, C.F., E.C. Dogrul, M.R. Moncrief, J. Galef, S. Shultz, M. Tonkin, D. Wendell, T.N.
Kadir, and F.I. Chung, 2008: Simulating the historical evolution of the Central Valley
hydrologic flow system with the California Central Valley Groundwater-Surface Water
Model. In C.F. Brush and N.L. Miller, eds. Proceedings of the California Central Valley
Groundwater Modeling Workshop, July 10-11, 2008, Lawrence Berkeley National
Laboratory, Berkeley, California. Sacramento, CA: California Water and Environmental
Modeling Forum.
California Department of Finance, 2007: Population projections for California and its counties,
2000-2050, by age, gender and race/ethnicity. Sacramento, CA.
California Department of Water Resources, 2006: Progress in Incorporating Climate Change into
Management of California’s Water Resources, Technical Memorandum Report, 338 pp.
California Department of Water Resources, 2005a: California Water Plan, Update 2005.
California Department of Water Resources,
California Department of Water Resources, 2005b: Integrated Water Flow Model (IWFM 2.4)
Theoretical Documentation. Sacramento, CA: Hydrology Development Unit, Modeling
Support Branch, California Department of Water Resources. Technical Memorandum.
California Department of Water Resources, 2005c: Integrated Water Flow Model (IWFM 2.4)
User’s Manual. Sacramento, CA: Hydrology Development Unit, Modeling Support Branch,
California Department of Water Resources. Technical Memorandum.
California Department of Water Resources, 2003: California’s Groundwater. Sacramento, CA:
California Department of Water Resources. Bulletin 118, Update 2003.
Cook, E.R., C.A. Woodhouse, C.M. Eakin, D.M. Meko and D.W. Stahle, 2004: Long-term
aridity changes in the western United States. Science, 306, 1015-1018.

17
Cook, E.R., R. Seager, M.A. Cane and D.W. Stahle, 2007: North American Drought:
Reconstructions, Causes, and Consequences. Earth Science Reviews, in press.
Draper, A.J., A. Munevar, S.K. Arora, E. Reyes, N.L. Parker, F.I. Chung, and L.E. Peterson,
2004: CalSim: Generalized model for reservoir system analysis. J. Water Resources
Planning and Management, November/December, 480-489.
Doherty, J., 2005: PEST: Model independent parameter estimation. Brisbane, Australia:
Watermark Numerical Computing.
Hayhoe, K., D. Cayan, C.B. Field, P.C. Frumhoff, E.P. Maurer, N.L. Miller, S.C. Moser, S.H.
Schneider, K.N. Cahill, E.E. Cleland, L. Dale, R. Drapek, R.M. Hanemann, L.S. Kalkstein,
J. Lenihan, C.K. Lunch, R.P. Neilson, S.C. Sheridan, and J.H. Vervillee, 2004: Emissions
pathways, climate change, and impacts on California. Proc. Nat. Acad. Sci., 101, 12422-
12427.
Herweijer, C., R. Seager and E.R. Cook, 2006: North American Droughts of the mid-to-late
Nineteenth Century: a history, simulation and implication for Mediaeval drought. The
Holocene, 16, 159-171.
Holman, I.P., 2006: Climate change impacts on groundwater recharge – uncertainty,
shortcomings, the way forward? Hydrogeol. J., 14, 637-647.
Ingram, B. L., J.C. Ingle, and M.E. Conrad, 1996: A 2,000-yr record of San Joaquin and
Sacramento river inflow to San Francisco Bay, California., Geology, 24, 331-334.
Kay, A.L., and H.N. Davies, 2008: Calculating potential evaporation from climate model data: A
source of uncertainty for hydrological climate change impacts. J. Hydrol., 358, 221-239.
King, C.W., A.S. Holman, and M.E. Webber, 2008: Thirst for energy. Nature Geoscience, 1,
283-286.
Loaiciga, H.A. 2003. Climate change and ground water. Annals of American Geographers, 93,
30-41.
Lund, J.R., R.E. Howitt, M.W. Jenkins, T. Zhu, S.K. Tanaka, M. Pulido, M. Tauber, R.S.
Ritzema, G.F. Marques, 2003: Climate warming and California’s water future. Report No.
03-1, University of California – Davis.
Maurer, E.P. and P.B. Duffy, 2005: Uncertainty in projections fo streamflow changes due to
climate change in California. Geophys. Res. Let. 32, L03704, doi:10.1029/2004GL021462.

18
Medellin-Azuara, J., J.J. Harou, M.A. Olivares, K. Madani, J.R. Lund, R.E. Howitt, S.K. Tanaka,
M. W. Jenkins, and T. Zhu, 2008: Adaptability and adaptations of California’s water supply
system to dry climate warming, Climatic Change, 87, S75-S90, doi 10.1007/s10584-007-
9355-z.
Miller, N.L., K.E. Bashford, and E. Strem, 2003: Potential impacts of climate change on
California hydrology. J. Amer Water Resourc Ass, 39, 771-784.
Miller, N.L., J. Kim, R.K. Hartman, and J. Farrara, 1999: Downscaled climate and streamflow of
the Southwestern United States. J. Amer Water Resourc Ass, 35, 1525 – 1537.
Milly, P.C.D., J. Betancourt, M. Falkenmark, R.M. Hirsch, Z.W. Kundzewicz, D.P. Lettenmaier,
and R.J. Stouffler, 2008: Stationarity is dead: Whither water management? Science, 319,
573-574.
Page, R. W., 1986: Geology of the fresh ground-water basin of the Central Valley, California,
with texture maps and sections. Washington, DC: U.S. Geological Survey Professional
Paper 1401-C.
Reisner, M., 1986: Cadillac Desert: The American west and its disappearing water. Pimlico Ed.,
592 pp.
Stine, S., 1994: Extreme and persistent drought in California and Patagonia during medieval
time. Nature, 369, 546-549.
Tanaka, S.K., T. Zhu, J.R. Lund, R.E. Howitt, M.W. Jenkins, M. Pulido-Velazquez, M. Tauber,
R.S. Ritzema, I.C. Ferreira, 2006: Climate warming and water management adaptation for
California. Clim. Change, 76, 361-387.
U.S. Bureau of the Census, 1982: Estimates of the intercensal population of counties 1970-79.
Washington, DC.
Zhu, T.J., M.W. Jenkins, J.R. Lund, 2005: Estimated impacts of climate warming on California
water availability under twelve future climate scenarios. J. Am Water Resour Assoc, 41,
1027-1038.

19
Tables and Figures:
Table 1. Drought scenario notation.
Table 2. Drought scenario reductions in precipitation, releases and deliveries.
Table 3. Monthly change in surface water diversions compared to base period diversions.
Table 4. Impact of simulated droughts on surface water diversions.
Table 5. Surface water diversions in base and drought periods.
Table 6. Impact of drought on groundwater pumping.
Table 7. Impact of drought on aquifer recharge.
Table 8. Impact of drought on stream-aquifer flows. [Positive value are from the stream to the
aquifer and negative values are from the aquifer to the stream.]
Table 9. Impact of drought on aquifer storage.
Table 10. Impact of drought on groundwater levels.
Table 11. Change in average groundwater level during a 60-year drought and after a 30-year
recovery period.
Figure 1. C2VSIM domain: (A) finite element grid and (B) water budget subregions.
Figure 2. Groundwater trends before, during and after A) a moderate 30-year drought, B) a
slight 60-year drought, and C) a severe 60-year drought.

20
Figure 1. C2VSIM domain: (A) finite element grid and (B) water budget subregions.
A B
21
22
Figure 2. Groundwater trends before, during and after A) a moderate 30-year drought, B) a slight 60-year drought, and C) a severe 60-year drought.

23
Specified Scenarios 10 years 20 years 30 years 60 years
30% reduction 30_10 30_20 30_30 30_60 50% reduction 50_10 50_20 50_30 50_60 70% reduction 70_10 70_20 70_30 70_60
Table 1. Drought scenario notation.
Percentage reduction in: Scenario Precipitation Releases Deliveries
30_10 26% 40% 26% 30_60 25% 41% 27% 50_10 34% 50% 41% 50_60 27% 54% 46% 70_10 39% 61% 53% 70_60 39% 59% 51%
Table 2. Drought scenario reductions in precipitation, releases and deliveries.
Month Severe drought
(m/y)
Moderate drought
(m/y)
Slight drought
(m/y) Oct 65% 68% 88% Nov 73% 73% 99% Dec 93% 86% 118% Jan 32% 46% 65% Feb 15% 19% 23% Mar 18% 25% 30% Apr 65% 75% 89% May 49% 70% 81% Jun 61% 76% 90% Jul 63% 81% 94% Aug 59% 74% 86% Sep 50% 67% 79%
Annual 49% 61% 74%
Table 3. Monthly change in surface water diversions compared to base period diversions.

24
Hydrologic Region
Base Period (km3/y)
Severe drought (km3/y)
Moderate drought (km3/y)
Slight drought (km3/y)
Sacramento 4.73 3.44 4.48 5.06 Eastside 0.02 0.01 0.01 0.01 San Joaquin 3.24 1.79 2.62 2.69 Tulare 3.57 1.07 1.37 1.93 Central Valley 13.44 8.20 10.46 11.75 Change (%) 39% 22% 13%
Table 4. Impact of simulated droughts on surface water diversions.
Change from Base Period Hydrologic
Region
Base Period (m/y)
Severe drought
(m/y)
Moderate drought
(m/y)
Slight drought
(m/y) Sacramento 0.34 -0.09 -0.02 0.02 Eastside 0.005 -0.003 -0.002 -0.002 San Joaquin 0.35 -0.15 -0.07 -0.06 Tulare 0.19 -0.13 -0.12 -0.09 Central Valley 0.28 -0.11 -0.06 -0.03 Change (%) -38% -22% -12%
Table 5. Surface water diversions in base and drought periods.
Change from Base Period Hydrologic
Region
Base Period (m/y)
Severe drought
(m/y)
Moderate drought
(m/y)
Slight drought
(m/y) Sacramento 0.06 0.04 0.02 0.00 Eastside 0.15 0.05 0.04 0.02 San Joaquin 0.13 0.17 0.10 0.07 Tulare 0.29 0.17 0.14 0.07 Central Valley 0.16 0.12 0.08 0.04 Change (%) 71% 49% 27%
Table 6. Impact of drought on groundwater pumping.

25
Change from Base Period Hydrologic
Region
Base Period (m/y)
Severe drought
(m/y)
Moderate drought
(m/y)
Slight drought
(m/y) Sacramento 0.21 -0.13 -0.08 -0.05 Eastside 0.05 -0.03 -0.03 -0.01 San Joaquin 0.24 -0.11 -0.06 -0.03 Tulare 0.21 -0.07 -0.06 -0.02 Central Valley 0.21 -0.09 -0.06 -0.03 Change (%) -42% -28% -4%
Table 7. Impact of drought on aquifer recharge.
Hydrologic Region
Base Period (m/y)
Severe drought
(m/y)
Moderate drought
(m/y)
Slight drought
(m/y) Sacramento -0.131 -0.036 -0.084 -0.104 Eastside 0.037 0.018 0.018 0.023 San Joaquin -0.076 0.006 -0.036 -0.040 Tulare 0.015 0.011 0.013 0.016 Central Valley -0.078 -0.036 -0.058 -0.064 Change (%) -68% -32% -23%
Table 8. Impact of drought on stream-aquifer flows. [Positive values are from the stream to the
aquifer, and negative values are from the aquifer to the stream].
Change from Base Period Hydrologic
Region
Base Period (m/y)
Severe drought
(m/y)
Moderate drought
(m/y)
Slight drought
(m/y) Sacramento 0.069 -0.12 -0.10 -0.073 Eastside 0.027 -0.12 -0.10 -0.078 San Joaquin 0.057 -0.23 -0.15 -0.096 Tulare -0.007 -0.25 -0.20 -0.095 Central Valley 0.034 -0.19 -0.14 -0.084
Table 9. Impact of drought on aquifer storage.

26
Change from Base Period Hydrologic
Region
Base Period (m/y)
Severe drought
(m/y)
Moderate drought
(m/y)
Slight drought
(m/y) Sacramento 0.079 -0.17 -0.12 -0.055 Eastside 0.295 -0.33 -0.11 -0.078 Delta -0.003 -0.43 -0.34 -0.258 San Joaquin 0.216 -0.58 -0.25 -0.134 Tulare 0.023 -1.41 -1.12 -0.575 Central Valley 0.094 -0.77 -0.55 -0.288
Table 10. Impact of drought on groundwater levels.
Severe 60-year drought Moderate 60-year drought Slight 60-year drought End Recovery End Recovery End Recovery Hydrologic
Region (m) (m) (%) (m) (m) (%) (m) (m) (%)
Sacramento -10 5.9 59% -7.4 3.9 53% -3.3 2.0 60% Eastside -20 15 72% -6.9 6.6 96% -4.7 5.9 >100% San Joaquin -35 21 59% -15 8.8 59% -8.0 7.9 1% Tulare -84 2.6 3% -67 3.3 5% -35 2.3 7% Central Valley -46 8.4 18% -33 4.9 15% -17 3.6 21%
Table 11. Change in average groundwater level during a 60-year drought and after a 30-year
recovery period.