driving future leadership - talbros automotive … · driving future leadership ... new orders from...
TRANSCRIPT

Investor Presentation Q3FY17
February 2017DRIVING FUTURE LEADERSHIP
INVESTOR PRESENTATIONFebruary 2018
Driving Future Leadership

Safe Harbour
2
This presentation and the accompanying slides (the “Presentation”), which have been prepared by Talbros Automotive Components Limited (the“Company”), have been prepared solely for information purposes and do not constitute any offer, recommendation or invitation to purchase orsubscribe for any securities, and shall not form the basis or be relied on in connection with any contract or binding commitment whatsoever. Nooffering of securities of the Company will be made except by means of a statutory offering document containing detailed information about theCompany.
This Presentation has been prepared by the Company based on information and data which the Company considers reliable, but the Company makesno representation or warranty, express or implied, whatsoever, and no reliance shall be placed on, the truth, accuracy, completeness, fairness andreasonableness of the contents of this Presentation. This Presentation may not be all inclusive and may not contain all of the information that youmay consider material. Any liability in respect of the contents of, or any omission from, this Presentation is expressly excluded.
This presentation contains certain forward looking statements concerning the Company’s future business prospects and business profitability, whichare subject to a number of risks and uncertainties and the actual results could materially differ from those in such forward looking statements. Therisks and uncertainties relating to these statements include, but are not limited to, risks and uncertainties regarding fluctuations in earnings, ourability to manage growth, competition (both domestic and international), economic growth in India and abroad, ability to attract and retain highlyskilled professionals, time and cost over runs on contracts, our ability to manage our international operations, government policies and actionsregulations, interest and other fiscal costs generally prevailing in the economy. The company does not undertake to make any announcement in caseany of these forward looking statements become materially incorrect in future or update any forward looking statements made from time to time byor on behalf of the company.

Business Confirmations &Strategy
3
New Orders:• Cummins – USA & UK• Zetor Tractors – Czech Republic• A Non- Automotive conglomerate in Austria
• Order from Maruti Suzuki to supply Control Arm Assemblies for Front Suspension, with an Estimated Revenues of Rs. 24 crores p.a.
• Started Supplies for the order received from large European Car Manufacturer
Talbros Marugo Rubber Pvt Ltd (TMR)
Magnetti Marelli Talbros Chassis Systems Pvt Ltd (MMT)
Forgings Segment
Gaskets Standalone
• Hoses division has witnessed improved volumes during the year from Maruti Suzuki
• To start supplying Hoses to Marugo Rubber, Japan
• Started supplies for the order received from German Luxury car manufacturer
Strategic Initiatives
• Installation of Post Coating Line, to rationalize raw material costs
• Strategic Raw material sourcing agreement with Interface Performance materials, USA to bring savings in operational costs, reduction in raw material inventory and working capital investments

Q3 FY18 Performance Highlights
4
As
pe
r In
dA
S
80.30
103.98
Q3FY17 Q3FY18
+29%
Total Income from Operations (Rs Crs)
9.38
13.09
Q3FY17 Q3FY18
+40%
5.67
3.94
+44%
Q3FY18Q3FY17
Q3FY18
135.22
Q3FY17
104.60
+29%
12.39
+38%
Q3FY18
17.10
Q3FY17
6.41
4.49
Q3FY18Q3FY17
+43%
EBIDTA (Rs Crs) Adjusted PAT (Rs Crs)
As
pe
r In
dia
n G
AA
P

9M FY18 Performance Highlights
5
As
pe
r In
dA
S
9MFY18
+17%
287.02
9MFY17
245.66
Total Income from Operations (Rs Crs)
9MFY18
28.1632.21
9MFY17
+14%
9.43
9MFY18
13.19
9MFY17
+40%
9MFY17
+18%
377.78
9MFY18
321.4245.58
38.36
9MFY17 9MFY18
+19%
9MFY18
11.66
15.60
+34%
9MFY17
EBIDTA (Rs Crs) Adjusted PAT* (Rs Crs)
As
pe
r In
dia
n G
AA
P
*PAT adjusted for Exceptional Gain in Q2FY18

Vision 2020
6
Revenues*Rs. 675 - 725
Crores
EBITDA Margin*
13% - 14%
PAT*Rs. 35 - 38
Crores
ROCE20%+
➢ Favourable macro economic conditions likely to lead to sustainable uptick in demand
➢ Gaskets will continue to lead growth – Successful BS IV implementation
➢ Commencement of Shipment from recent order wins to European car manufacturers and other global OEM’s
➢ Substantial increase in After Markets segment with implementation of GST
➢ Healthy order book of global and domestic auto majors in forgings division to lead growth with improved profitability
➢ Turnaround in hoses business
➢ Magneti Marelli Talbros JV, to increase scale and profitability
➢ Incremental growth to be supported without any major addition of Debt
* As per Indian GAAP including TACL’s proportionate share of Revenue and PAT in our JVS
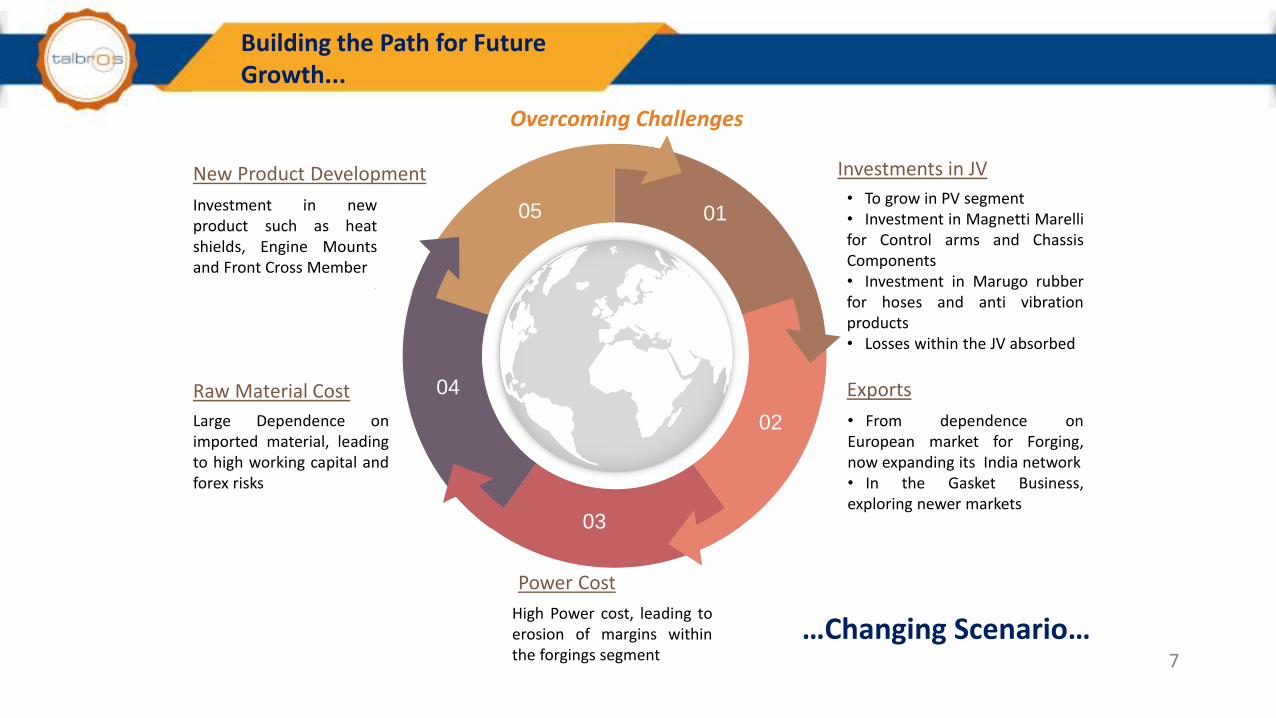
Building the Path for Future Growth...
7
New Product Development
Investment in newproduct such as heatshields, Engine Mountsand Front Cross Member
.
Raw Material Cost
Large Dependence onimported material, leadingto high working capital andforex risks
Power Cost
High Power cost, leading toerosion of margins withinthe forgings segment
Exports
• From dependence onEuropean market for Forging,now expanding its India network• In the Gasket Business,exploring newer markets
Investments in JV
• To grow in PV segment• Investment in Magnetti Marellifor Control arms and ChassisComponents• Investment in Marugo rubberfor hoses and anti vibrationproducts• Losses within the JV absorbed
01
02
03
04
05
…Changing Scenario…
Overcoming Challenges

…Turnaround in New Joint Ventures & Forgings Business
➢ Secured new orders from Maruti, Tata and reputed European Car Manufacturer
➢ Enjoying dominance with Maruti Suzuki for control arms assembly
➢ Targeting new OEMs in India and abroad
8
13.613.011.4
13.4
10.6
+28.0%
Q3FY18Q4FY17 Q1FY18 Q2FY18Q3FY17
Talbros Marugo Rubber Pvt Ltd (TMR)
Magnetti Marelli Talbros Chassis Systems Pvt Ltd (MMT)
5.25.04.54.23.7
Q3FY17
+42.1%
Q4FY17 Q1FY18 Q2FY18 Q3FY18
* Talbros Share of JV Revenue
29.527.3
20.118.418.9
Q2FY18Q1FY18Q3FY17 Q4FY17
+56.1%
Q3FY18
➢ Expansion of business with Tata Motors and SML Isuzu➢ Increase in buyback of product by the JV partner – Marugo
Rubber➢ Profitability improved in Antivibration Business➢ Hoses in the period of stabilisation
Forgings Segment
Rev
enu
e (
in R
s. C
rore
s)
➢ Increasing share of Domestic Customers ➢ New orders from Amul Industries, Volvo Eicher, GKN and a
German luxury car manufacturer ➢ Power cost now favorable for competitive bidding➢ Value addition / heavy products
* As per Indian GAAP

…Value Unlocking
9
Higher per vehicle realization within the OEM space
JV’s have added new products to the offerings for the OEM’s
Heat Shield’s contribution to raise with the upcoming BSVI norms
Fully Asbestos free manufacturing facilities – to provide opportunity for exports to the global OEM’s
Cost Optimization Export Opportunities
Emphasis on localization of raw material through use of post coated technology with cost benefits
Reduced power cost within the forgings segment have significantly added to profitability
Leading to Performance• Improvement higher sales
growth
• Margin expansion
• Gain in market share
Focus Area:

About Us
10
Over 6 Decades of experience in Auto Component manufacturing
Diversified Auto Component player with presence across Two Wheelers, Passenger, Commercial Vehicles and Farm Equipment's
Wide client base, ~40% revenue from top 5 clients
Businesses across OEMs, Exports and After Market
Four International Technology Tie-ups including 3 JVs for Best in Class Products
Diversified Portfolio - Gaskets, Forgings, Suspension Systems, Anti-vibration Products & Hoses
Consistent Dividend Pay-out over 50 years
One of the Most Hedged Auto Component Players

Diversified Portfolio
11
Product Portfolio
Gaskets, Heat Shields, Forgings, Chassis Systems, Anti vibration and Hoses
Segments
2 Wheelers, 3Wheelers, Passenger Vehicles, Commercial Vehicles, Agri /
Off-Loaders and Industrial
Market Exposure
OEMs, After Market, Exports, Others
Gaskets 57%
JV's
* Talbros share in JV
9MFY18 Revenue
12
Growth Strategy
Growth Strategy

Strong Global Partnerships -Joint Ventures
13
• Nippon Leakless Corporation (Japan)
✓ One of the largest global manufacturers of gaskets and a major Supplier for Honda
• Established in 2005 with 40% Talbros Share
• 100% Sales to OEMs to Honda and Hero
• Magneti Marelli S.p.a (Milano)
✓ A Fiat group company with annual revenue of over € 6 Billion
• 50:50 partnership commenced production in April 2012
• 100% Sales to OEMs
• Significant share of Control Arms business from Maruti Suzuki and Tata
• Marugo Rubber Industries Ltd (Japan)
✓ Global leader in supply of Anti-Vibration Product and Hoses
• 50:50 partnership commenced production in February 2013
• 100% Sales to OEMs predominantly MarutiSuzuki
Nippon Leakless Talbros Pvt Ltd (NLK) Magnetti Marelli Talbros Chassis Systems Pvt Ltd (MMT)
Talbros Marugo Rubber Pvt Ltd (TMR)

Strong Tailwinds…
14
Stricter environmental Norms
• BS-VI expected implementation by 2020
• Developing new products such as Heat Shields under Technical Licensing Agreement with SANWA Packaging
Jump towards BS VI
Huge Potential of Indian Passenger Vehicles Segment
• India’s low vehicle penetration (32 vehicles per 1000 people in 2015) making it one of the world’s most attractive auto markets
• India’s PV segment is expected to grow to > 48 mn vehicles by 2020
Tie-ups with leading component suppliers of the Globe
• India becoming a hub for Global OEMs for sourcing and manufacturing
Increasing Government Thrust
• India’s projected production is ~8.7mn PVs per year by 2020
• MNC’s including (Ford, Hyundai, Toyota, GM, and Honda) are in the process of building facilities in India
Increasing Investments by Global Manufacturers
• Global car manufacturers plan to leverage India’s competitive advantage to set up export-oriented production hubs
Joint Ventures increasing exposure in PV Segment
Access to Global Technology
Make In India
Exports

The Automotive Opportunities
15
2 & 3 Wheelers,
29%
Passenger Vehicle, 12%
HCV & LCV, 39%
Agri & Off Loaders, 17%
Others, 4%
29%
2 &3 Wheelers Segment stable
39%
Strong signs of recovery in CV sales
10.0
3.8
FY21FFY17
+27.4%2.4
0.8
+30.5%
FY17 FY21F
30.2
20.7
FY21FFY17
+9.9%
Passenger Vehicles Commercial Vehicles 2W & 3W Vehicles
TACL: Domestic Sales Break up 9MFY18
Million Units
Source: IBEF
12%
Consistent improvement in JV performance to push PV sales

Leadership Team to drive Growth
16
Is a Bachelor in Business Administration from college of William & Mary, Virgina, USAand Master of Business Administration from Boston University Graduate School ofManagement. He has been associated with the Company since 2008. He has over 10years of rich experience in the Corporate Finance, Credit analysis ,Auto Industry andM&A.
Anuj Talwar
Joint Managing Director
Is a B.Sc. (Mathematics) and Chartered Accountant (FCA). He is working as Finance Headof Talbros Group as its Group CFO. He also advises various companies on financialmanagement and corporate planning. He has more than 30 years of rich experience inFinance, Accounting and Strategic Planning.
Navin Juneja
Director & Group CFO

17
Business Overview
Business Overview

Key Milestones
18
1956 1979-85 1997 2005 2008-09 2011 2012
Payen Talbros incorporated in
collaboration with Coopers Payen UK
Technical Agreementwith Nippon Leakless, Japan to manufacture Non-Asbestos Gaskets
JV with MagnetiMarelli, Italy for Suspension components
•1979 - Renamed as Talbros Automotive Components Ltd
• 1980 – Maiden IPO
• 1985 – Transfer of technology from Payen International UK
• JV with Nippon LeaklessCorporation, Japan for Automotive Gaskets
• Diversification into Forgingbusiness commenced
JV with MarugoRubber, Japan for Anti-Vibration and Hoses
• 2008 - Technical Agreement with SANWA, Japan• 2009 – Technical Agreement with Interface, Germany

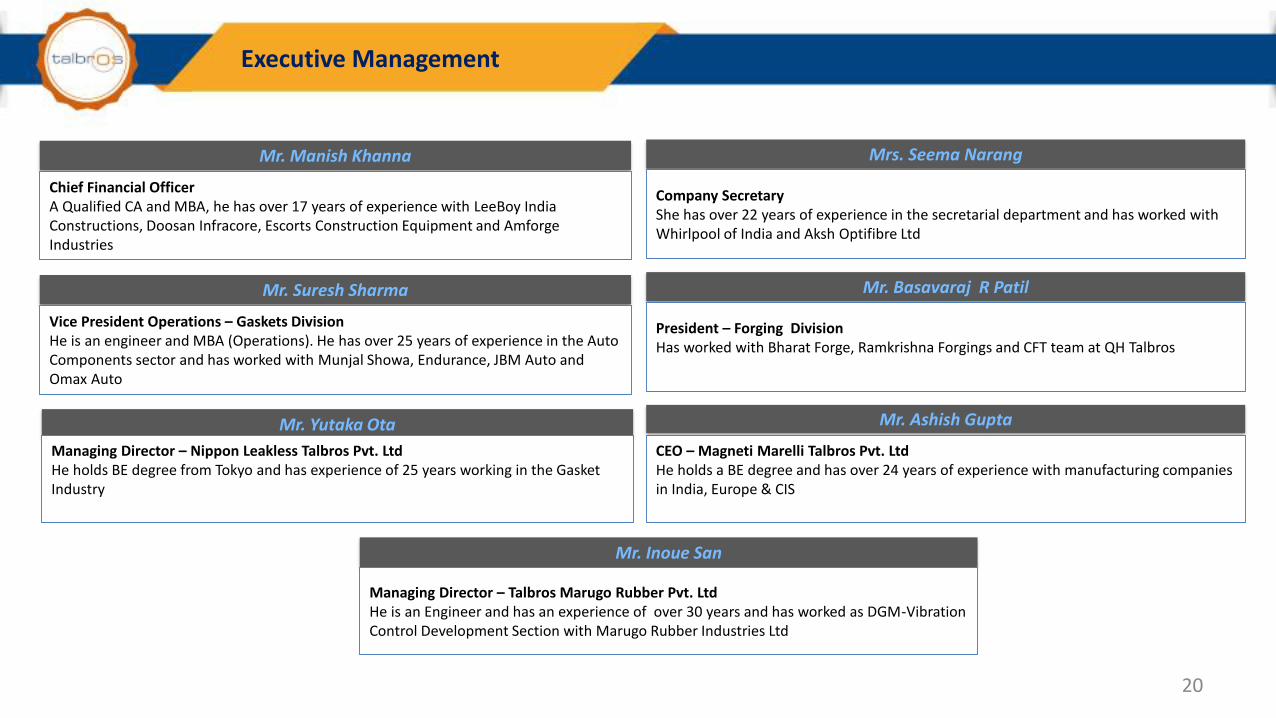
Executive Management
20
Mrs. Seema Narang
Company SecretaryShe has over 22 years of experience in the secretarial department and has worked with Whirlpool of India and Aksh Optifibre Ltd
Mr. Basavaraj R Patil
President – Forging DivisionHas worked with Bharat Forge, Ramkrishna Forgings and CFT team at QH Talbros
Mr. Ashish Gupta
CEO – Magneti Marelli Talbros Pvt. LtdHe holds a BE degree and has over 24 years of experience with manufacturing companies in India, Europe & CIS
Mr. Suresh Sharma
Vice President Operations – Gaskets DivisionHe is an engineer and MBA (Operations). He has over 25 years of experience in the Auto Components sector and has worked with Munjal Showa, Endurance, JBM Auto and Omax Auto
Mr. Inoue San
Managing Director – Talbros Marugo Rubber Pvt. LtdHe is an Engineer and has an experience of over 30 years and has worked as DGM-Vibration Control Development Section with Marugo Rubber Industries Ltd
Mr. Yutaka Ota
Managing Director – Nippon Leakless Talbros Pvt. LtdHe holds BE degree from Tokyo and has experience of 25 years working in the Gasket Industry
Mr. Manish Khanna
Chief Financial OfficerA Qualified CA and MBA, he has over 17 years of experience with LeeBoy India Constructions, Doosan Infracore, Escorts Construction Equipment and AmforgeIndustries

Standalone
21
➢ In – House tool design and manufacturing
➢ 38% Market share in Gaskets 3x the nearest competitor
➢ Market Leader in – Two Wheeler, Agri & Off Loaders, HCV & LCV segment
➢ Tier I OE supplier for 12 of our customers
➢ Single Source Supplier for 5 of our customers
➢ 100% Asbestos Free player
➢ Export orders from Cummins, Daimler, Volvo and Harley Davidson
➢ Introduced dedicated Heat Shield line: critical for heat, sound and vibration insulation
➢ Revenue for 9MFY18 stood at Rs 210 Cr
➢ One stop solution for Hot Forging (750 to 1,600 Ton Press)
➢ In-House tool design and manufacturing
➢ Strong presence in Overseas Market & Supplier to top Tier I companies
➢ One Stop Solution for Die Design, Machine parts and Heat treatment (Normalizing and Carbohydrizing)
➢ Introduced Crown Wheels
➢ Added new customers Ognibene and American Axle to diversify its geographic risk
➢ Revenue for 9MFY18 stood at Rs 75 Cr
Gaskets Forging
Export11%
After Market
15%
OEM71%
Others3%
9MFY18 Revenue Rs 210 Crores
38%
2%
42%
12%6%
2 & 3 Wheelers
Passenger Vehicle
MHCV & LCV
Agri & Off Loaders
Others
9MFY18 OEM Breakup
OEM49%
Exports46%
Others5%
9MFY18 Revenue Rs 75 Crores

Products - Various Types and Shapes
22
Multi Layer Steel Rubber Molded
Cylinder Head Heat Shield
Exhaust Manifold Edge Molded
King Pins
Gear Blanks
Housing and Yoke Shafts
Gaskets Forgings

Joint Ventures
23
3843
313229
16
FY16 9MFY18FY17FY13
+28%
FY14 FY15
14.715.4
10.5
6.45.1
0.4
FY16
+45%
FY17FY14 FY15Feb-Mar 2013
9MFY18
* Talbros Share of JV Revenue in Rs Crores
Nippon Leakless Talbros Pvt Ltd
Magnetti Marelli TalbrosChassis Systems Pvt Ltd
Talbros Marugo Rubber Pvt Ltd
GasketsControl Arms, Front Axle and Rear Axle
Engine Mounts, Strut Mounts, Mufflers & Hangers, Suspension Bushes, Rubber Bushes, Hoses
Hero Motor Corp, HMSI, India Yamaha, Honda Car India, Maruti Suzuki, Honda Siel Power Products
Bajaj Auto, Mahindra & Mahindra, MarutiSuzuki India, Tata MotorsSignificant share of Control Arms business from Maruti
Maruti Suzuki, QH Talbros, Endurance Technologies, Rane (Madras) Ltd, Escort India, TATA
35
43424137
33
+7%
FY16 FY17FY15FY14FY13 9MFY18
Customers
Products
* As per Indian GAAP

Scope of Joint Ventures
24
Front Cross Members
Control Arms
Rear Twist Beam Axle
Wheel Group + Corner Module
Knuckles
Strut Mount
Suspension Arms Bush
Fuel Hose
Steering Bush
Engine Mount
Exhaust HangerAir Hose
TMRExisting Business
TMRPlanned for Future
MMTExisting Business
MMTPlanned for Future

Gasket Gasket Gasket Gasket Gasket Gasket Gasket
Non Asbestos Gaskets
Non Asbestos Gaskets
Non Asbestos Gaskets
Non Asbestos Gaskets
Non Asbestos Gaskets
Non Asbestos Gaskets
Forgings Forgings Forgings Forgings Forgings Forgings
Sheet Metal Sheet Metal Sheet Metal Sheet Metal Sheet Metal
Heat Shields Heat Shields Heat Shields Heat Shields
Chassis Systems Chassis Systems Chassis Systems
Anti Vibration Products
Anti Vibration Products
Hoses Hoses
1956 2005 2007 2009 2011 2013 2014
Market Leader in Gaskets
Acquired Sheet Metal, Entry into Forgings, JV
with NLK - Gaskets
JV with MagnetiMarelli
TA with SANWA
JV with MarugoRubber
TAA with Nippon Leakless
Gasket66%
Forging20%
Suspension System10%
Anti-Vibration and Hose4%
Revenue 9MFY18
Gasket100%
Revenue FY07
Evolving Product Portfolio
25
Evolution Continues...

Diversified Customer - OEM
26
2 Wheeler Passenger HCV/LCV
Hedged customer base, 40% revenue from top 5 customers
Agri & Off Loader Exports

Manufacturing Facilities
27
GasketFaridabad, Haryana (2 plants & R&D Centre) Pune, Maharashtra & Sitarganj, Uttarakhand
ForgingBawal – Haryana
Nippon LeaklessBawal – Haryana Haridwar – Uttarakhand
Talbros Marugo RubberManesar – Gurgaon
Magneti Marelli TalbrosFaridabad - Haryana

28
Financials Highlights
Financial Highlights

Consolidated P & L Statement
29* As per Indian GAAP
Particulars (Rs. In Crs) Q3 FY18 Q3 FY17 Y-o-Y 9M FY18 9M FY17 Y-o-Y
Revenue (Net of Excise) 131.93 102.42 28.81% 371.48 315.71 17.66%
Other Income 3.28 2.18 6.30 5.70
Total Income from Operations 135.22 104.60 377.78 321.42
Raw Material 75.62 56.86 213.44 177.39
Employee Cost 16.64 14.13 46.98 42.62
Other Expenses 25.84 21.21 71.78 63.04
EBITDA 17.10 12.39 38.08% 45.58 38.36 18.81%
EBITDA Margin 12.65% 11.84% 12.07% 11.94%
Finance Cost 3.74 4.11 10.95 12.49
Depreciation 4.02 3.58 12.33 11.32
Profit before Tax 9.34 4.69 99.00% 22.30 14.56 53.17%
Tax 2.93 0.21 6.70 2.89
Adjusted PAT 6.41 4.49 42.94% 15.60 11.66 33.73%
Adjusted PAT Margin % 4.74% 4.29% 4.13% 3.63%
Exceptional Item (Gain) / Loss 0.00 0.00 2.16 0.00
PAT 6.41 4.49 42.94% 17.75 11.66 52.23%
PAT Margin % 4.74% 4.29% 4.70% 3.63%

Consolidated Balance Sheet
30* As per Indian GAAP
Rs. In Crs Sep-17 Mar-17
Total Shareholders' Fund 151.67 141.91
Share Capital 12.35 12.35
Reserves and Surplus 139.32 129.57
Total Non Current Liabilities 30.39 27.91
Long Term Borrowings 22.19 20.34
Deferred Tax Liabilities (Net) 4.39 4.10
Other Long Term Liabilities 0.22 0.11
Long Term Provisions 3.59 3.36
Total Current Liabilities 268.76 234.09
Short Term Borrowings 94.62 86.78
Trade Payable 142.42 114.37
Other Current Liabilities 28.50 29.62
Short Term Provisions 3.22 3.32
Total - Equity and Liabilities 450.82 403.91
Rs. In Crs Sep-17 Mar-17
Total Non Current Assets 169.97 167.61
Fixed Assets 150.37 147.96
Non Current Investments 7.96 8.06
Long Term Loans and Advances 10.99 11.01
Other Non Current Assets 0.65 0.57
Total Current Assets 280.84 236.30
Inventories 113.31 111.44
Trade Receivables 122.65 90.28
Cash and Bank Balances 17.26 12.50
Short Term Loans and Advances 26.75 20.80
Other Current Assets 0.88 1.28
Total - Assets 450.82 403.91

Consolidated P & L Statement
31* As per IndAS
Particulars (Rs. In Crs) Q3 FY18 Q3 FY17 Y-o-Y 9M FY18 9M FY17 Y-o-Y
Revenue (Net of Excise) 101.99 78.53 29.86% 282.81 241.89 16.92%
Other Income 1.99 1.77 4.21 3.68
Total Income from Operations 103.98 80.30 287.02 245.56
Raw Material 57.99 42.85 159.52 132.77
Employee Cost 13.29 11.61 38.28 35.42
Other Expenses 19.61 16.46 57.01 49.21
EBITDA 13.09 9.38 39.55% 32.21 28.16 14.35%
EBITDA Margin 12.59% 11.68% 11.22% 11.47%
Depreciation 3.32 2.84 10.14 9.20
Finance Cost 3.53 3.97 10.41 11.77
Profit before share of profit/loss from JVs 6.23 2.56 11.66 7.20
Share of Profit from JVs 1.49 1.07 5.26 3.29
Profit before Tax before Exceptional Items 7.72 3.64 112.11% 16.92 10.48 61.41%
Tax 2.05 -0.30 3.74 1.06
Adjusted PAT 5.67 3.94 44.07% 13.19 9.43 39.89%
Adjusted PAT Margin % 5.45% 4.90% 4.59% 3.84%
Exceptional Items 0.00 0.00 2.16 0.00
Other Comprehensive Income 3.92 -0.36 5.36 1.68
Total Comprehensive Income 9.59 3.58 167.74% 20.71 11.11 86.36%
TCI Margin % 9.22% 4.46% 7.21% 4.52%
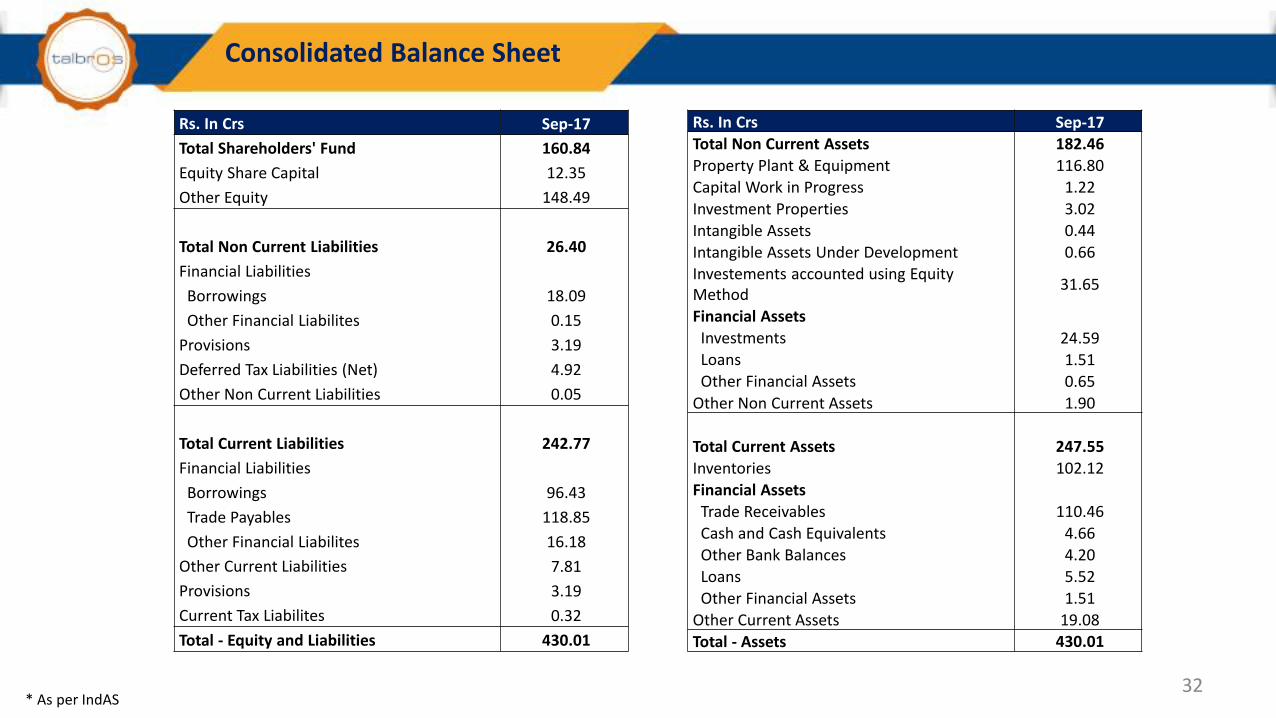
Consolidated Balance Sheet
32* As per IndAS
Rs. In Crs Sep-17
Total Shareholders' Fund 160.84
Equity Share Capital 12.35
Other Equity 148.49
Total Non Current Liabilities 26.40
Financial Liabilities
Borrowings 18.09
Other Financial Liabilites 0.15
Provisions 3.19
Deferred Tax Liabilities (Net) 4.92
Other Non Current Liabilities 0.05
Total Current Liabilities 242.77
Financial Liabilities
Borrowings 96.43
Trade Payables 118.85
Other Financial Liabilites 16.18
Other Current Liabilities 7.81
Provisions 3.19
Current Tax Liabilites 0.32
Total - Equity and Liabilities 430.01
Rs. In Crs Sep-17Total Non Current Assets 182.46
Property Plant & Equipment 116.80
Capital Work in Progress 1.22
Investment Properties 3.02
Intangible Assets 0.44
Intangible Assets Under Development 0.66Investements accounted using Equity Method
31.65
Financial Assets
Investments 24.59Loans 1.51Other Financial Assets 0.65
Other Non Current Assets 1.90
Total Current Assets 247.55
Inventories 102.12
Financial Assets
Trade Receivables 110.46
Cash and Cash Equivalents 4.66
Other Bank Balances 4.20
Loans 5.52
Other Financial Assets 1.51
Other Current Assets 19.08
Total - Assets 430.01

Equity
33
1.51.51.5
1.21.21.21.21.21.0
FY17FY09 FY10 FY11 FY14 FY16FY12 FY15FY13
Consistently paying Dividend for the last 50 years
Jun-14
54%
44%
54%
38%
Jun-11 Jun-15Jun-12
46%
Jun-13
46%51%
Jun-09 Jun-10
42%
57%57%
Jun-16 Mar-17Dec-16
Promoter Shareholding
In Rs

Company : Investor Relations Advisors :
Talbros Automotive Components Ltd.CIN: L29199HR1956PLC033107
Mr. Navin Juneja – Director & Group CFOEmail: [email protected]
www.talbros.com
Strategic Growth Advisors Pvt. Ltd.CIN: U74140MH2010PTC204285
Mr. Rahul Agarwal / Ms. Nirali [email protected] / [email protected]: 9821438864 / 97736 17347www.sgapl.net
For further information, please contact:
34