driving capital efficiency to fuel oil and gas projects · 2016-11-25 · capital employed. capital...
TRANSCRIPT

www.pwc.com
Driving capital efficiency to fuel oil and gas projects
Capital projects and infrastructure: Energy
June 2016

Driving capital efficiency to fuel oil and gas projects Capital projects and infrastructure: Energy
Does your team select, plan, and execute projects with capital efficiency?
Between 2006 and 2013 upstream oil and
gas players spent more than $3.1 trillion
in capital expenditure towards
exploration and production projects
alone.1 Due to this investment, and the
increasing lifting costs and increase in
capital productivity, there was a
projected deceleration of capital velocity
in 2014. For some of the more mature
E&Ps, this deceleration was accompanied
by a heightened focus on selectivity and
capital discipline in 2015. Even those
companies that were deliberate about
their capital investments in 2014 and
2015—redirecting capital from gas to oil
and liquids-rich plays, or maintaining
activity in productive plays while shutting
down operations in less productive assets
with more expensive lifting costs—have
doubled down on capital discipline in
2016 due to today’s “leaner for longer”
environment. Industry veterans who
have lived through previous oil
slumps feel that the need for ruthless
selectivity and capital efficiency has
never been greater.
With this market volatility comes the
demand for energy companies to adhere
to stricter policies toward capital
allocation and more frequent capital
reprioritization decisions. Mega-projects,
asset developments, and even drilling
programs have been delayed or cancelled
due to the uncertainty in today’s market.
Oil and gas investors are looking for
more accuracy in project estimates which
typically deteriorate when cost or
schedule deviate from the originally
planned AFE (Authorization For
Expenditure) and business case. In
addition, these investors desire a higher
degree of project monitoring, visibility of
suppliers and 3rd party costs, and
management reporting to measure
capital productivity.
E&Ps are reviewing capital allocation and
performance at higher frequencies,
assessing strategy and accelerating
or deferring projects on a monthly basis
to ensure capital dollars are directed
towards the highest return. This will
better position those players to not only
survive but thrive when oil prices and
profitability return.
Highlights
Define capital efficiency, how critical it is in today’s market, and where there are opportunities to improve.
Identify the measures for capital efficiency and how they are implemented throughout the asset lifecycle.
Determine how efficiently your organization allocates its capital to ensure you take advantage of opportunities to sharpen the sword and optimize return on capital employed.
Address the shift from capital efficiency being driven by capital selectivity, not velocity.
June 2016
1 PwC, “Driving Value,” Thought Leadership, 2013.
2-5 PwC Energy Executive Series Webcast Survey, 2015.
74% 64% 30% 70%
Energy executives see the demand…
…and are driving to meet that demand.
Getting started…
It’s time to close the gap.
74% of the 600+ energy leaders we surveyed see capital efficiency as a business
imperative in today’s market.2
64% acknowledge they have implemented both cost-
reduction and capital-allocation efforts to utilize their capital
more effectively.3
30% of respondents across all sectors (upstream, midstream,
and downstream) have attempted stronger capital
project controls to drive returns on capital employed.4
Over 70% of respondents believe their organizations’
ability to drive capital efficiency was not at a high level of
maturity from a project controls (estimating, risk, cost, schedule,
change and scope control) point of view.5

PwC 2
The twelve elements of capital efficiency
Capital efficiency is required throughout the entire asset lifecycle from strategy through execution. Benchmarking your organization
against a standard framework (see figure below) helps to determine blind spots where you can capture value and achieve the most
benefit from your capital allocation strategy, selection, and project execution.
Capital agility: Understanding the unique dependencies between these twelve elements allows organizations to better integrate
strategy with planning and execution—through measurement, feedback, and lessons learned—to better inform capital allocation.
As an example, the ability to quantify the benefits of a capital project through value measurement creates a more holistic basis to
define how to measure value and strengthen corporate strategy and shareholder value.
3 Driving capital efficiency to fuel oil and gas projects
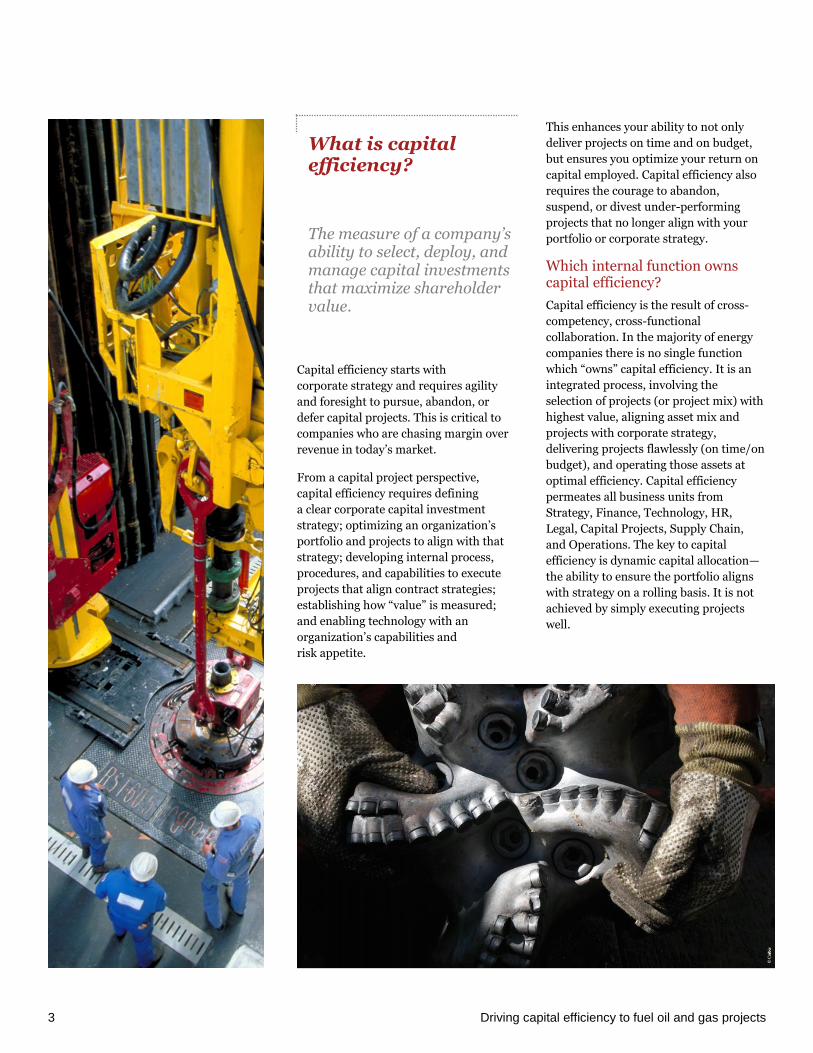
Capital efficiency starts with
corporate strategy and requires agility
and foresight to pursue, abandon, or
defer capital projects. This is critical to
companies who are chasing margin over
revenue in today’s market.
From a capital project perspective,
capital efficiency requires defining
a clear corporate capital investment
strategy; optimizing an organization’s
portfolio and projects to align with that
strategy; developing internal process,
procedures, and capabilities to execute
projects that align contract strategies;
establishing how “value” is measured;
and enabling technology with an
organization’s capabilities and
risk appetite.
This enhances your ability to not only
deliver projects on time and on budget,
but ensures you optimize your return on
capital employed. Capital efficiency also
requires the courage to abandon,
suspend, or divest under-performing
projects that no longer align with your
portfolio or corporate strategy.
Which internal function owns capital efficiency?
Capital efficiency is the result of cross-
competency, cross-functional
collaboration. In the majority of energy
companies there is no single function
which “owns” capital efficiency. It is an
integrated process, involving the
selection of projects (or project mix) with
highest value, aligning asset mix and
projects with corporate strategy,
delivering projects flawlessly (on time/on
budget), and operating those assets at
optimal efficiency. Capital efficiency
permeates all business units from
Strategy, Finance, Technology, HR,
Legal, Capital Projects, Supply Chain,
and Operations. The key to capital
efficiency is dynamic capital allocation—
the ability to ensure the portfolio aligns
with strategy on a rolling basis. It is not
achieved by simply executing projects
well.
What is capital efficiency?
The measure of a company’s ability to select, deploy, and manage capital investments that maximize shareholder value.

PwC 4
What does capital efficiency look like?
For an organization to achieve a high level
of capital efficiency, it will need to
establish and implement a robust capital
decision and project lifecycle framework.
There are five key components to
achieving this:
Align growth portfolio with
business strategy.
Establish a formal approach to
portfolio optimization, including
a strong framework for evaluation
and prioritization of investment
alternatives.
Identify and select investment
alternatives based on strategy,
values, risks, and dependency.
Monitor performance and reevaluate
the capital allocation at the portfolio
or project level.
Maintain rigor throughout investment
lifecycle and measure benefits
realized at all stages.
A holistic approach manages projects in a
dynamic sense: they can be initiated,
altered, maintained, suspended, and
terminated based upon market,
competitive, and internal environments.
By establishing these processes,
methodologies, and tools, your capital
investments are more likely to hit budget,
schedule, scope, and strategic targets.
From bit to boardroom
A key element of measuring capital project
performance of a field, pad, well,
infrastructure project, or portfolio is
having sufficient granularity of data (cost,
schedule, safety, quantity, quality) and
integration of the tools used to capture,
analyze, and report to leadership.
Removing subjectivity in the chain of
custody, progress, and financial reporting
ensures capital allocation or redeployment
decisions are informed with accurate real-
time data.
Five super-majors: BP, Chevron, Exxon Mobil, Shell, and Total
Source: Form 10-Ks for each of the aforementioned super-majors
0%
50%
100%
150%
200%
250%
300%
350%
2005 2006 2007 2008 2009 2010 2011 2012 2013 2014 2015
Capex and production for five supermajors
Development Costs Production

5 Driving capital efficiency to fuel oil and gas projects
Enhancing value and free cash flow (FCF)
To be more productive, capital projects
and operations must be pushed to the
superior free cash flow curve shown below.
The ability to influence cost reduction
through continuous improvement and
lessons learned depends on early
intervention in the well-field lifecycle.
Efficiencies that drive both cost and
schedule reduction will optimize free
cash flow and drive field, pad, or
wellhead, profitability.
When discussing measures of capital
efficiency, each sector and segment has its
own methodology to quantify capital
efficiency. Regardless of how capital
efficiency is quantifed, the underlying goal
is to be ruthlessly disciplined in measuring
the capital invested and the value captured
from each dollar spent.
Capital efficiency in play
Given today’s macro-economic market
conditions and the need for dynamic
capital allocation in the oil and gas
sector, competitive pressures are forcing
management to improve productivity and
effieincy to drive and sustain profits.
Capital efficiency is being deployed in the
E&P space today, but mainly in highly
productive assets with very little activity.
When E&Ps attempt to scale these benefits
on an enterprise-wide level, integration of
front- and back-office resource and cost
systems becomes essential to enable
bit-to-boardroom decision support. In
order to accomplish capital efficiency at
this enterprise-wide level, management
has been exploring the use of emerging
technology.
Efficiency gains have been achieved
partially through enhanced oversight,
decreased volume, allowing increased
transparency and granularity due to less
activity. Sustaining those gains will
require elements of capital efficiency.
Below is a summary of some of the more
popular capital efficiency units:
Return on investment (ROI):
the amount of return on an
investment relative to the
investment’s cost.
Fully burdened operating
income (FBOI): the amount of
profit realized from a business’s
operations after taking out operating
expenses and depreciation.
Return on capital employed
(ROCE): the rate of return the
business is generating compared to
the capital employed to generate
those returns.
Operating margin: a measurement
of what proportion of a company's
revenue is left over after paying for all
operating costs such as variable and
fixed costs.
Capital velocity: ratio of annual
capex to the capital employed in the
business and a proxy for measuring
the growth agenda of organizations in
capital intensive industries.
Capital productivity: a company’s
ability to use the capital employed in
the business to generate revenue.
Calculated by dividing average
revenue by average capital employed
Measuring capital efficiency
Capital efficiency is tailored by each oil and gas organization in terms of compatibility with enterprise value, strategy and asset mix.
Explore Appraise Develop OperateDeferred Operate
Put on Production (POP)
Cost Reduction
Schedule Reduction
Deferred POP
Free-Cash-Flow (FCF) Timeline

PwC 6
In capital-intensive industries like oil and
gas, ongoing measurement of value from
capital investment is standard practice.
This return fluctuates with commodity
price, resulting in inconsistent and
unpredictable revenue forecasts.
Successful E&Ps will differentiate
themselves from their competitors by
optimizing the return from each capital
dollar invested.
Determining the best metric to evaluate
performance against your peers provides
opportunities to learn from those in the
top quartile, as well as see how others are
interpreting current trends and market
recovery scenarios and in turn managing
their portfolio of assets. While each
organization may measure capital
efficiency in a different manner, baselines
have been developed in order to compare
organizations’ capital spending
effectiveness.
Other measures provide qualitative insight
into an organization’s ability to manage
its portfolio to better achieve capital
efficiency. The PwC capital efficiency
scorecard is one such baseline that
allows an organization to see where their
strengths/weaknesses lie. (See page 8 for
more details.)
How can capital efficiency be compared?
Benchmarking against peers using
ROCE is a worthy proxy for comparing
value, but a key question for investors and
company executives is whether the capital
invested is earning a higher return than
other investments with a lower risk
profile. This can be derived through a
focus on operating efficiency and capital
productivity (i.e., ROCE).
The significant reductions in operators’
capital spending, coupled with the natural
depletion curves of oil extracted from
shale formations, will likely continue to
constrain US production growth.
However, we expect the decline to be
gradual given the number of drilled but
uncompleted wells. At the same time, we
see global demand growth similar to 2015,
which is a bit more than most are
expecting. Taken together, an inflection
point is on the horizon.
No one can predict when E&Ps will
increase velocity following the slowdown
in 2015 and more recently in 2016; but
when the time comes for companies to
pursue future growth (velocity), they will
have different measures of value against
their peers—measures focused more on
capital efficiency than velocity.
How do you stack up?
Benchmarking among peers is critical
Capital efficiency is driven by continuous improvement initiatives as well as the use of external benchmarks.
7 Driving capital efficiency to fuel oil and gas projects
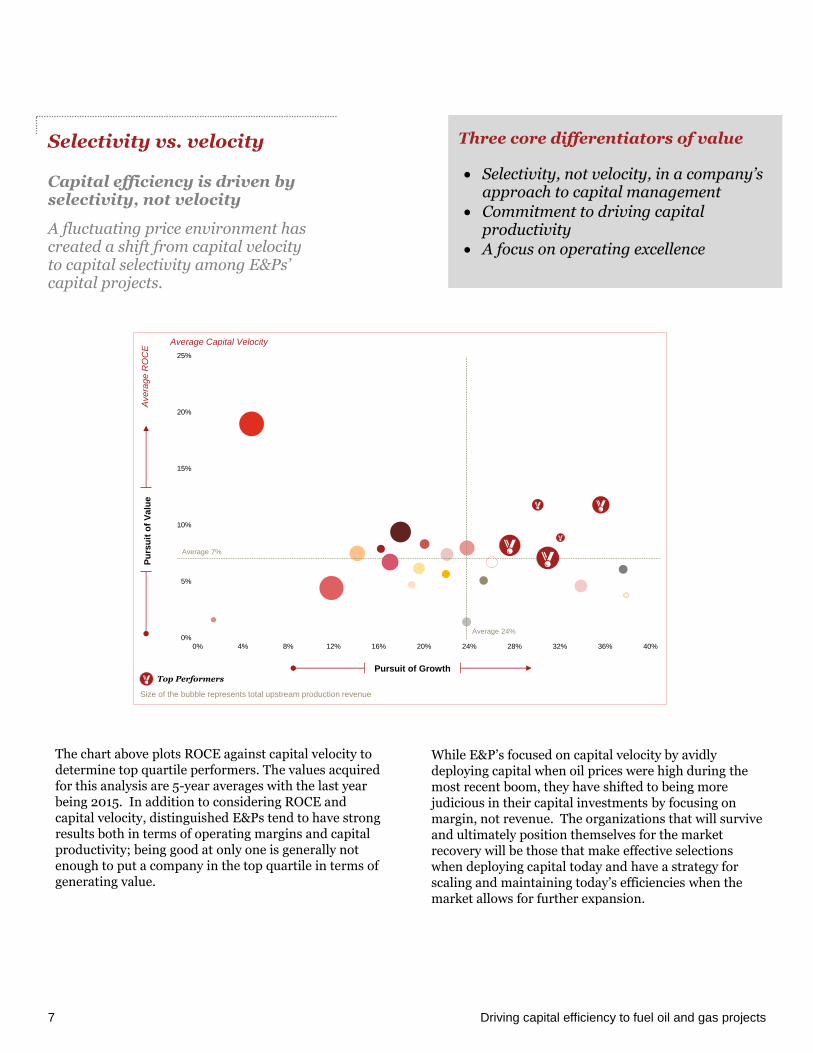
The chart above plots ROCE against capital velocity to determine top quartile performers. The values acquired for this analysis are 5-year averages with the last year being 2015. In addition to considering ROCE and capital velocity, distinguished E&Ps tend to have strong results both in terms of operating margins and capital productivity; being good at only one is generally not enough to put a company in the top quartile in terms of generating value.
While E&P’s focused on capital velocity by avidly deploying capital when oil prices were high during the most recent boom, they have shifted to being more judicious in their capital investments by focusing on margin, not revenue. The organizations that will survive and ultimately position themselves for the market recovery will be those that make effective selections when deploying capital today and have a strategy for scaling and maintaining today’s efficiencies when the market allows for further expansion.
Selectivity vs. velocity
Capital efficiency is driven by selectivity, not velocity
A fluctuating price environment has created a shift from capital velocity to capital selectivity among E&Ps’ capital projects.
0%
5%
10%
15%
20%
25%
0% 4% 8% 12% 16% 20% 24% 28% 32% 36% 40%
Average Capital Velocity
Average 7%
Average 24%
Ave
rag
e R
OC
E
Size of the bubble represents total upstream production revenue
Pu
rsu
it o
f V
alu
e
Pursuit of GrowthTop Performers
Three core differentiators of value
Selectivity, not velocity, in a company’s approach to capital management
Commitment to driving capital productivity
A focus on operating excellence

© 2016 PwC. All rights reserved. PwC refers to the US member firm or one of its subsidiaries or affiliates, and may sometimes refer to the PwC network. Each member firm is a separate legal entity. Please see www.pwc.com/structure for further details. This content is for general information purposes only, and should not be used as a substitute for consultation with professional advisors.
A special thanks to Irina Penovska and Casey Carringer for their contributions to this publication
PwC capital efficiency scorecard
By working with organizations pursuing
capital efficiency, PwC has developed a
“capital efficiency scorecard” which is an
organizational assessment of all “elements
of capital efficiency” tailored to energy
specific drivers. The assessment addresses
all elements—from strategy, capital
allocation to performance
measurements—to identify gaps, quick
wins, and long-term strategies, all of
which help develop a roadmap to enhance
your capital efficiency along with a relative
score to allow “apples to apples”
comparison with peers.
Those in the oil and gas sector can safely
assume there will be continued need for
capital efficiency and increased
productivity. Top performers will be
measured by their ability to ride out the
“leaner for longer” storm, while
competitive forces and oil prices will
challenge companies to find new and
innovative ways of deploying capital to its
highest and best use. Capital efficiency is
not “one size fits all” and requires breaking
down barriers in organizations to fully
enable cross-functional initiatives required
to drive capital efficiency.
To have a deeper discussion about capital efficiency, please contact:
Anthony Caletka Capital projects and infrastructure Partner (347) 574-2285 [email protected] Peter Raymond Capital projects and infrastructure US leader (703) 918-1580 [email protected] Brett Bisaga Capital projects and infrastructure Director (856) 816-5222 [email protected]
Reid Morrison
US energy advisory Leader and partner (713) 356-4132 [email protected] Peter Totev Capital projects and infrastructure Director (713) 356-5978 [email protected] Donna Coallier Strategic value consulting Partner (646) 471-8760 [email protected]
How PwC can help
254
Corporate Strategy
Finance Strategy
Budgeting Authority
Capital Process
Investment Options
Value Measurement
Resource Balancing
Portfolio Optimization
Value Performance
Delivery & Execution
Capital Agility
Strategic Review
All US
companies
Your sector
peersYou
254
The aggregate Capital Efficiency
Score using our proprietary
formula provides a quick
benchmark against your peers.
Demonstrating leading practices on
every aspect of an element is illustrated
by reaching this outer circle.