driver feedback mobile app - upcommons.upc.edu · driver feedback mobile app 5 0. abstract in this...
TRANSCRIPT
TESINA D’ESPECIALITAT
Títol
DRIVER FEEDBACK MOBILE APP
Autor/a
MIRALLES MIQUEL, ENRIC
Tutor/a
SORIGUERA MARTÍ, FRANCESC
Departament
ITT – Departament d’Infraestructura del Transport i del Territori
Intensificació
Data
Setembre 2015

DRIVER FEEDBACK MOBILE APP
2
DRIVER FEEDBACK MOBILE APP
3
Contents’ index 0. ABSTRACT .............................................................................................................................. 5
0. RESUM ................................................................................................................................... 5
1. INTRODUCTION ..................................................................................................................... 6
2. OBJECTIVES ............................................................................................................................ 9
3. METHODOLOGY .................................................................................................................. 10
3.1. The experiment ........................................................................................................... 10
3.2. Establish the driving context ....................................................................................... 11
3.3. Measure of the driving aggressiveness ....................................................................... 12
3.4. Relating aggressiveness with safe driving ................................................................... 18
4. RESULTS OF THE PILOT STUDY ............................................................................................ 22
4.1. Results of the experiment ........................................................................................... 22
4.2. Driving contexts ........................................................................................................... 24
4.3. Drivers’ aggressiveness ............................................................................................... 27
4.4. Relationship between DBQ results and drivers’ aggressiveness................................. 29
4.5. Grading results ............................................................................................................ 33
5. CONCLUSIONS ..................................................................................................................... 34
6. ACKNOWLEDGEMENTS ....................................................................................................... 36
7. REFERENCES ........................................................................................................................ 37
8. APPENDIX ............................................................................................................................ 38
8.1. Experiment Manual ..................................................................................................... 39
8.2. Survey .......................................................................................................................... 42
8.3. Jerk Samples ................................................................................................................ 54
DRIVER FEEDBACK MOBILE APP
4
Figure’s index Figure 1. Heinrich pyramid ............................................................................................................ 8
Figure 2. Treatment process ....................................................................................................... 10
Figure 3. Example of derived approach using the central differences method. ......................... 12
Figure 4. Axis position inside the car in the following sample. ................................................... 13
Figure 5. Graphics projections X-Z, Y-Z and X-Y of jerk vector. Also attached graphic example of
the ellipsoid of revolution. .......................................................................................................... 13
Figure 6. Example of PCA applied to a Multivariate Gaussian distribution in 2D. ...................... 14
Figure 7. Example of one distribution of jerk values ................................................................... 15
Figure 8. Curves of the sensitivity analysis .................................................................................. 16
Figure 9. DBQ category diagram ................................................................................................. 18
Figure 10. Graphics of Cluster Analysis with 3, 4, 5 and 6 clusters ............................................. 25
Figure 11. Dendrogram of Cluster Analysis and analysis of different clusters (optimal: 3) ........ 25
Figure 12. Spain’s road clasification ............................................................................................ 26
Figure 13. Graphic of the final choice and the set boundaries ................................................... 26
Figure 14. Comparison between one calmed driver and one aggressive in cars ........................ 27
------------------------------------------------------------------------------------------------------------------------------
Table’s index Table 1. 2014 SCT Yearbook’s factors statistics ............................................................................ 6
Table 2. Statistics of the three driving samples .......................................................................... 16
Table 3. DBQ questions (28) ........................................................................................................ 20
Table 4. DBQ index ...................................................................................................................... 20
Table 5. Final boundaries of the different groups ....................................................................... 26
Table 6. Number of samples depending on the driver and the area .......................................... 26
Table 7. Driver aggressiveness jerk vectors divided in zone and type of vehicle. ...................... 28
Table 8. Curvature’s indicators and average of every zone ........................................................ 29
Table 9. Relationships of car drivers ........................................................................................... 30
Table 10. Relationships of motorbike drivers ............................................................................. 31
Table 11. Linear regressions ........................................................................................................ 32
Table 12. Grades of each driver .................................................................................................. 33
Table 13: Results of all the samples. ........................................................................................... 58
DRIVER FEEDBACK MOBILE APP
5
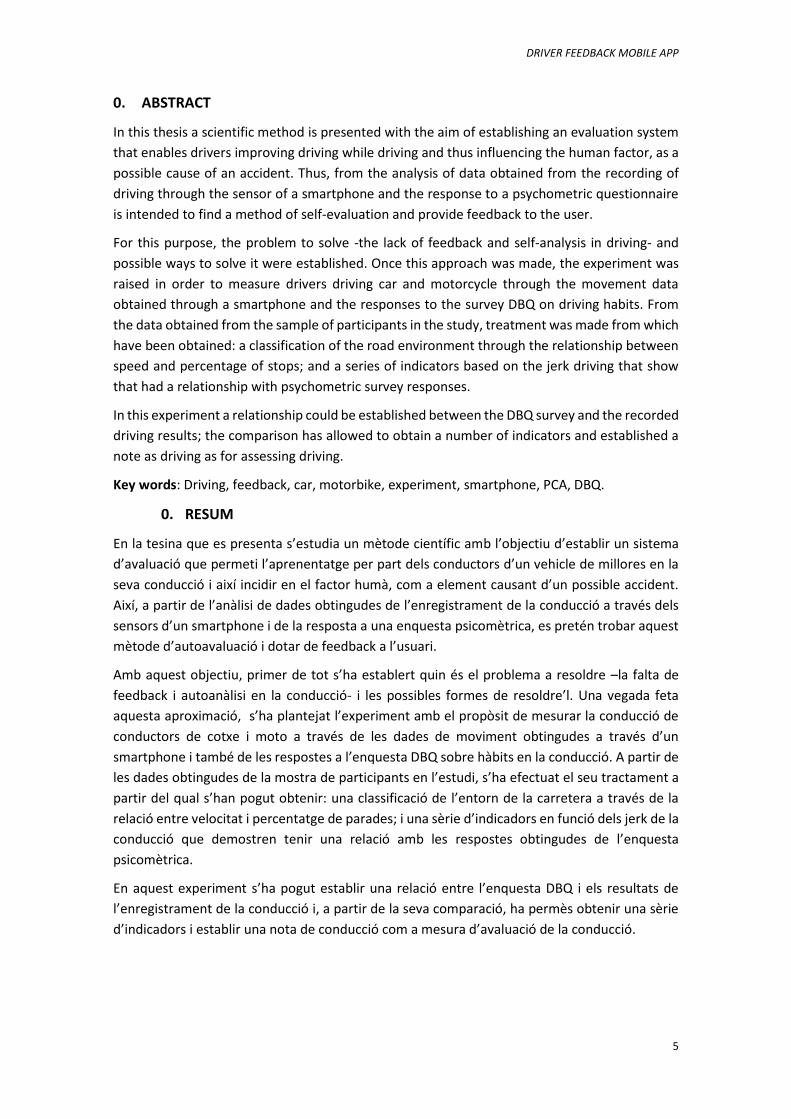
0. ABSTRACT
In this thesis a scientific method is presented with the aim of establishing an evaluation system
that enables drivers improving driving while driving and thus influencing the human factor, as a
possible cause of an accident. Thus, from the analysis of data obtained from the recording of
driving through the sensor of a smartphone and the response to a psychometric questionnaire
is intended to find a method of self-evaluation and provide feedback to the user.
For this purpose, the problem to solve -the lack of feedback and self-analysis in driving- and
possible ways to solve it were established. Once this approach was made, the experiment was
raised in order to measure drivers driving car and motorcycle through the movement data
obtained through a smartphone and the responses to the survey DBQ on driving habits. From
the data obtained from the sample of participants in the study, treatment was made from which
have been obtained: a classification of the road environment through the relationship between
speed and percentage of stops; and a series of indicators based on the jerk driving that show
that had a relationship with psychometric survey responses.
In this experiment a relationship could be established between the DBQ survey and the recorded
driving results; the comparison has allowed to obtain a number of indicators and established a
note as driving as for assessing driving.
Key words: Driving, feedback, car, motorbike, experiment, smartphone, PCA, DBQ.
0. RESUM
En la tesina que es presenta s’estudia un mètode científic amb l’objectiu d’establir un sistema
d’avaluació que permeti l’aprenentatge per part dels conductors d’un vehicle de millores en la
seva conducció i així incidir en el factor humà, com a element causant d’un possible accident.
Així, a partir de l’anàlisi de dades obtingudes de l’enregistrament de la conducció a través dels
sensors d’un smartphone i de la resposta a una enquesta psicomètrica, es pretén trobar aquest
mètode d’autoavaluació i dotar de feedback a l’usuari.
Amb aquest objectiu, primer de tot s’ha establert quin és el problema a resoldre –la falta de
feedback i autoanàlisi en la conducció- i les possibles formes de resoldre’l. Una vegada feta
aquesta aproximació, s’ha plantejat l’experiment amb el propòsit de mesurar la conducció de
conductors de cotxe i moto a través de les dades de moviment obtingudes a través d’un
smartphone i també de les respostes a l’enquesta DBQ sobre hàbits en la conducció. A partir de
les dades obtingudes de la mostra de participants en l’estudi, s’ha efectuat el seu tractament a
partir del qual s’han pogut obtenir: una classificació de l’entorn de la carretera a través de la
relació entre velocitat i percentatge de parades; i una sèrie d’indicadors en funció dels jerk de la
conducció que demostren tenir una relació amb les respostes obtingudes de l’enquesta
psicomètrica.
En aquest experiment s’ha pogut establir una relació entre l’enquesta DBQ i els resultats de
l’enregistrament de la conducció i, a partir de la seva comparació, ha permès obtenir una sèrie
d’indicadors i establir una nota de conducció com a mesura d’avaluació de la conducció.
DRIVER FEEDBACK MOBILE APP
6
1. INTRODUCTION
Every year approximately 1.2 million people worldwide die from traffic accidents; this
represents the second cause of mortality in the world, behind diseases. The figures speak for
themselves and bring us to plan and think how we can reverse this situation and influence,
especially in its main cause: the human being.
Driving involves three elements: the driver, the vehicle and the road or environment. While the
vehicle and the road can be developed via technological innovations; it is more difficult to
influence the conductive element, because one can only allocate awareness campaigns or
penalty, but it is very difficult to set a direct action as the other elements.
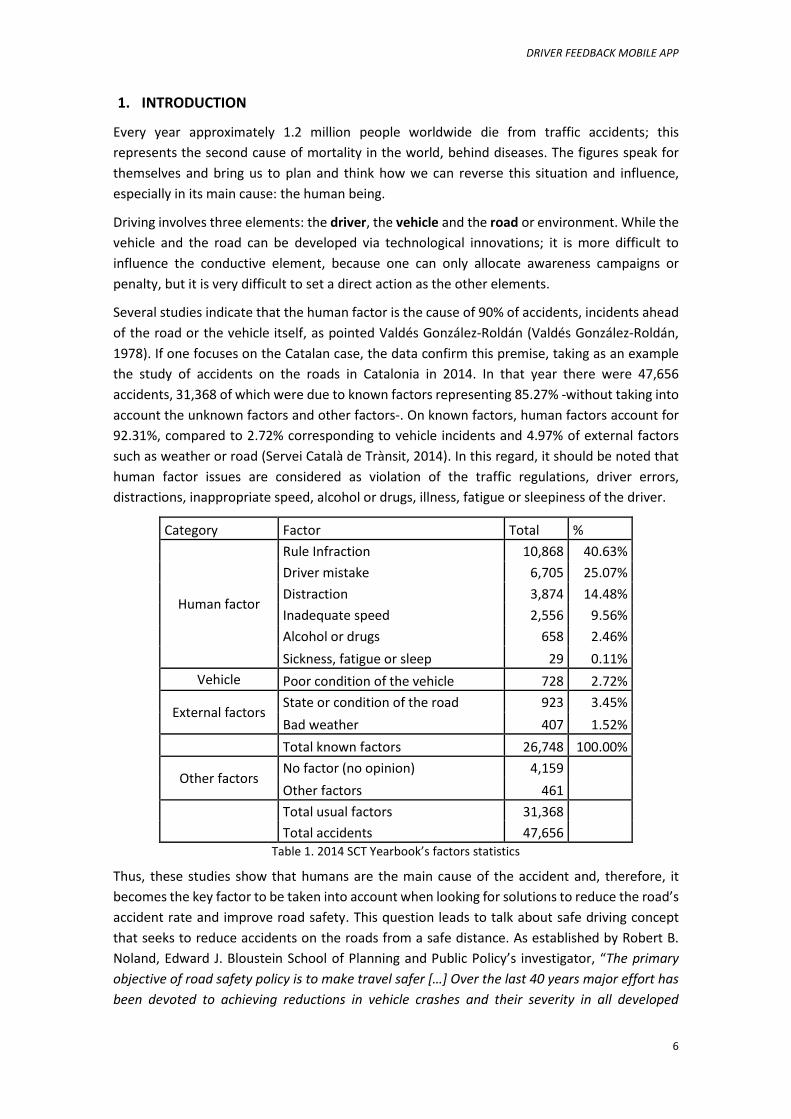
Several studies indicate that the human factor is the cause of 90% of accidents, incidents ahead
of the road or the vehicle itself, as pointed Valdés González-Roldán (Valdés González-Roldán,
1978). If one focuses on the Catalan case, the data confirm this premise, taking as an example
the study of accidents on the roads in Catalonia in 2014. In that year there were 47,656
accidents, 31,368 of which were due to known factors representing 85.27% -without taking into
account the unknown factors and other factors-. On known factors, human factors account for
92.31%, compared to 2.72% corresponding to vehicle incidents and 4.97% of external factors
such as weather or road (Servei Català de Trànsit, 2014). In this regard, it should be noted that
human factor issues are considered as violation of the traffic regulations, driver errors,
distractions, inappropriate speed, alcohol or drugs, illness, fatigue or sleepiness of the driver.
Category Factor Total %
Human factor
Rule Infraction 10,868 40.63%
Driver mistake 6,705 25.07%
Distraction 3,874 14.48%
Inadequate speed 2,556 9.56%
Alcohol or drugs 658 2.46%
Sickness, fatigue or sleep 29 0.11%
Vehicle Poor condition of the vehicle 728 2.72%
External factors State or condition of the road 923 3.45%
Bad weather 407 1.52%
Total known factors 26,748 100.00%
Other factors No factor (no opinion) 4,159
Other factors 461
Total usual factors 31,368
Total accidents 47,656 Table 1. 2014 SCT Yearbook’s factors statistics
Thus, these studies show that humans are the main cause of the accident and, therefore, it
becomes the key factor to be taken into account when looking for solutions to reduce the road’s
accident rate and improve road safety. This question leads to talk about safe driving concept
that seeks to reduce accidents on the roads from a safe distance. As established by Robert B.
Noland, Edward J. Bloustein School of Planning and Public Policy’s investigator, “The primary
objective of road safety policy is to make travel safer […] Over the last 40 years major effort has
been devoted to achieving reductions in vehicle crashes and their severity in all developed
DRIVER FEEDBACK MOBILE APP
7
countries, with mixed results. For example, Sweden and the United Kingdom, have seen dramatic
reductions in both fatal and injury outcomes over the last 40 years, whether measured per capita
or per vehicle-kilometer traveled (VKT), both having the best overall safety records of any
country. The US, on the other hand, has seen smaller reductions. For many years the total number
of fatalities stagnated at about 42,000 per year, only recently dropping in 2008 with the global
financial crisis” (Noland, 2013).
It is clear, then, what the focus of action should be, in order to reduce accidents on the roads:
the human factor. But how can one influence this issue? What impact do governments’ actions
have towards drivers? If you consider the Catalan scope, on which the study of this thesis will
be, the impact on the driver once he has obtained a driving license is almost nil. Thus, Catalans
have to perform theoretical and driving tests to obtain permission once in life, and once they
have it, they just have to pay for the vehicle and its derivatives (gasoline, insurance, mechanical
repairs and taxes) in order to continue driving. This leads to speak of the existence of an
inefficient model, in which every 2 or 3 years changes in the rules of driving are made, and there
is no real proof that these drivers are aware and comply with this new regulation.
In addition, although each year the data determine that the human factor is the main cause of
accidents, the only evaluation in the renewal of the license is based on the necessary medical
tests and administrative payment, rather than on an assessment of exercised behavior or
knowledge of the driver. However, in order to influence the driving behavior and road safety
awareness, the Spanish government introduced the point’s program in 2006 penalizing the
accumulation of fines of certain behaviors, such as alcohol or speeding. As a result, offenders
have to attend training courses of road safety.
Regarding the analysis of the human factor, one should consider that driving consists of two
elements: the capacity to drive, which includes errors and lapses of the driver; and deliberate
violations, including violations of the laws and aggressive violations, such rebuked other road
users or not respecting safety distance with other vehicles as a form of confrontation with other
drivers (Parker, Reason, Manstead, & Stradling, 1995).
All this involves a number of issues present in driving but in which the user does not have any
type of feedback, although it has many advantages (Zhao & Wu, 2012). How does a person know
if his driving is good or bad? The user is aware of his aggressive driving or failure to comply with
certain regulations? Now it seems that the only possible feedback is received in response to
warnings by the traffic authorities and other drivers to their own driving. If, for example, a driver
skips a stop and gets complaints from another affected driver, it’s highly probable that he will
understand that is driving badly.
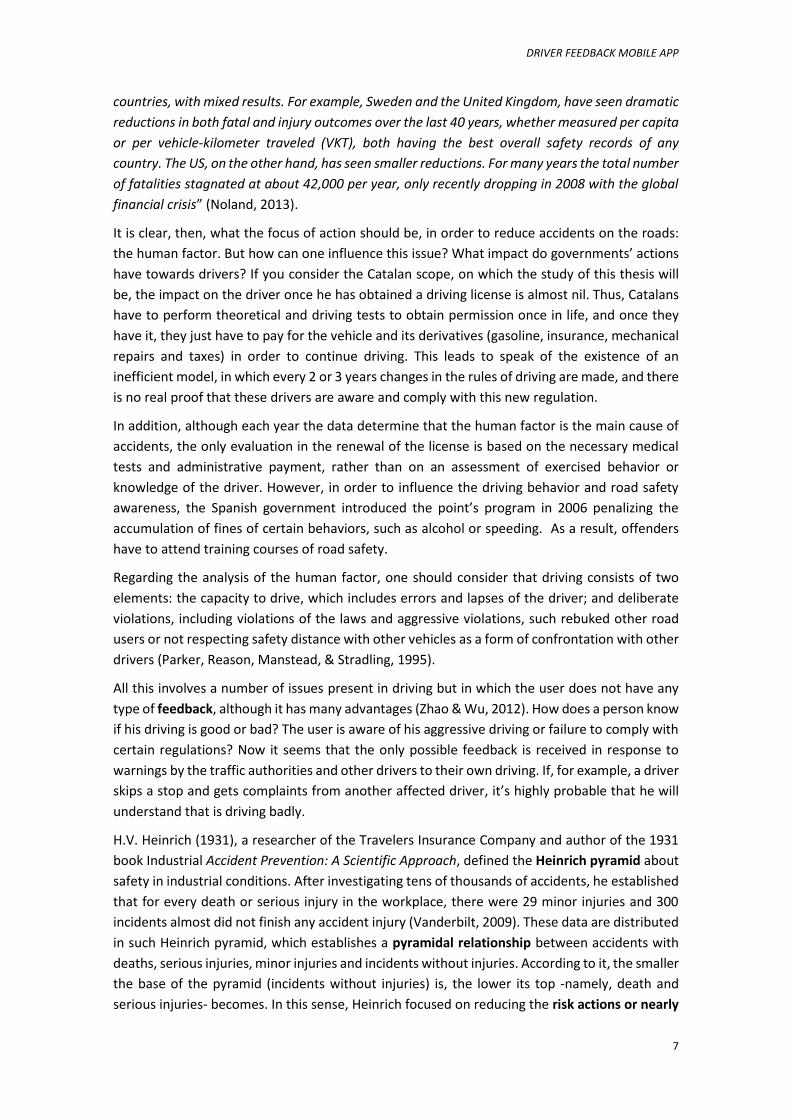
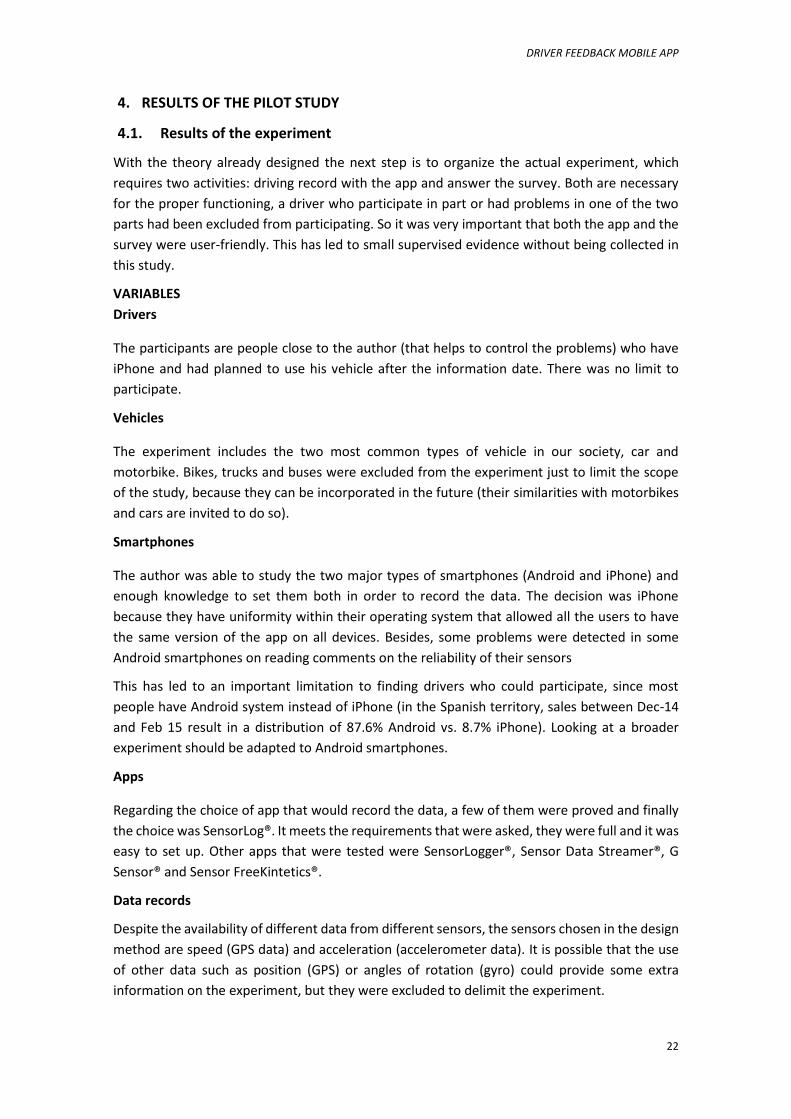
H.V. Heinrich (1931), a researcher of the Travelers Insurance Company and author of the 1931
book Industrial Accident Prevention: A Scientific Approach, defined the Heinrich pyramid about
safety in industrial conditions. After investigating tens of thousands of accidents, he established
that for every death or serious injury in the workplace, there were 29 minor injuries and 300
incidents almost did not finish any accident injury (Vanderbilt, 2009). These data are distributed
in such Heinrich pyramid, which establishes a pyramidal relationship between accidents with
deaths, serious injuries, minor injuries and incidents without injuries. According to it, the smaller
the base of the pyramid (incidents without injuries) is, the lower its top -namely, death and
serious injuries- becomes. In this sense, Heinrich focused on reducing the risk actions or nearly
DRIVER FEEDBACK MOBILE APP
8
accidents, in the case of driving would be the moment in which a driver avoids an accident by
an extreme corrective action. (Vanderbilt, 2009)
Figure 1. Heinrich pyramid
How can one reduce or even avoid risky actions or near accidents? How can one measure
driving? Is there an indicator regarding driving behavior? Is there any relation between this
indicator and the past and even future level of accidents? This approach will be the basis of the
study of the thesis presented, which aims to find a scientific way to assess the human factor, the
conduct of a person driving, and which allows to establish a self-assessment system in which a
person can train and improve as a driver.
DRIVER FEEDBACK MOBILE APP
9
2. OBJECTIVES
As mentioned above, this thesis aims to find by scientific study an indicator to assess the
behavior of a person at the wheel. This way the driver will be able to evaluate his own driving
and improve his performance, and thus nearly accidents would be reduced therefore, accident
rates on their person and globally.
Is there an indicator for assessing driving? How can one make this assessment available to
drivers? For this purpose this thesis will study the use of smartphones and sensors which have
as a way of obtaining experimental data of drivers. From the numerical data of motion captured
by mobile phone while driving will be analyzed in order to establish a behavior of each user. To
enrich this data, the data will be complemented with responses from a survey with the aim of
resolving human behavior while driving a vehicle. Thus, these two forms of data collection are
expected to establish an evaluation model of autonomous driving, based on a schedule that will
mark a zone of safe driving and driving area of risk.
This model would facilitate the possible creation of a mobile application, not just to collect data
driving, but to score and evaluate the human factor and allow self-assessment of drivers in a
constant learning to improve.
In this regard, we must take into account the existence of other applications of similar initiatives
especially developed for insurance companies or fleets with great interest to conserve resources
related to accident rates of customers or employees. For example, one can speak of AxaDrive,
application developed by the insurer AXA, which includes an assessment of the driving route,
which requires positioning the mobile concrete form, and also offers tips and encourages
sharing the results in social networks to promote social competitiveness between users. In the
case of the United States, there are several similar applications, whose existence are known but
have not been tested.
Therefore, this thesis seeks to provide another scientific and general method to the set of
existing applications that provide feedback to drivers. This idea is based on the fundamental
question of learning through self-analysis. Like dancers who rehearse in front of a mirror and
from their own reflection are able to analyze and constantly improve themselves, or professional
trainers who apply improvements based on recordings of trainings and matches; it is thought
that the recording and later score the own driving improvements imply a change in the subject.
DRIVER FEEDBACK MOBILE APP
10
3. METHODOLOGY
3.1. The experiment
The experiment is based on the recording of the drivers driving via smartphones. Drivers of
vehicles will record driving data via the app and send it back for numerical treatment. Carrying
out a survey to compare the data and calibrate the model is also included. Below a set of
variables that are necessary for the proper performance of the experiment are listed and
explained. These variables will be studied and chosen through sensitivity analyzes and decisions,
and they will mark the boundaries of the experiment.
- Driver: Type of drivers, according to age, gender, driving experience.
- Vehicle: car, motorcycle, bicycle, truck, bus...
- Smartphone: iPhone, Android, Windows Phone...
- App: depending on the smartphone operating system.
- Recording data: GPS, acceleration, angles of rotation, magnetic field...
- Frequency at which the data will be recorded.
- Duration of each subsample, the result of cutting the entire sample into parts that are
equal for comparison.
- Location and orientation of the smartphone.
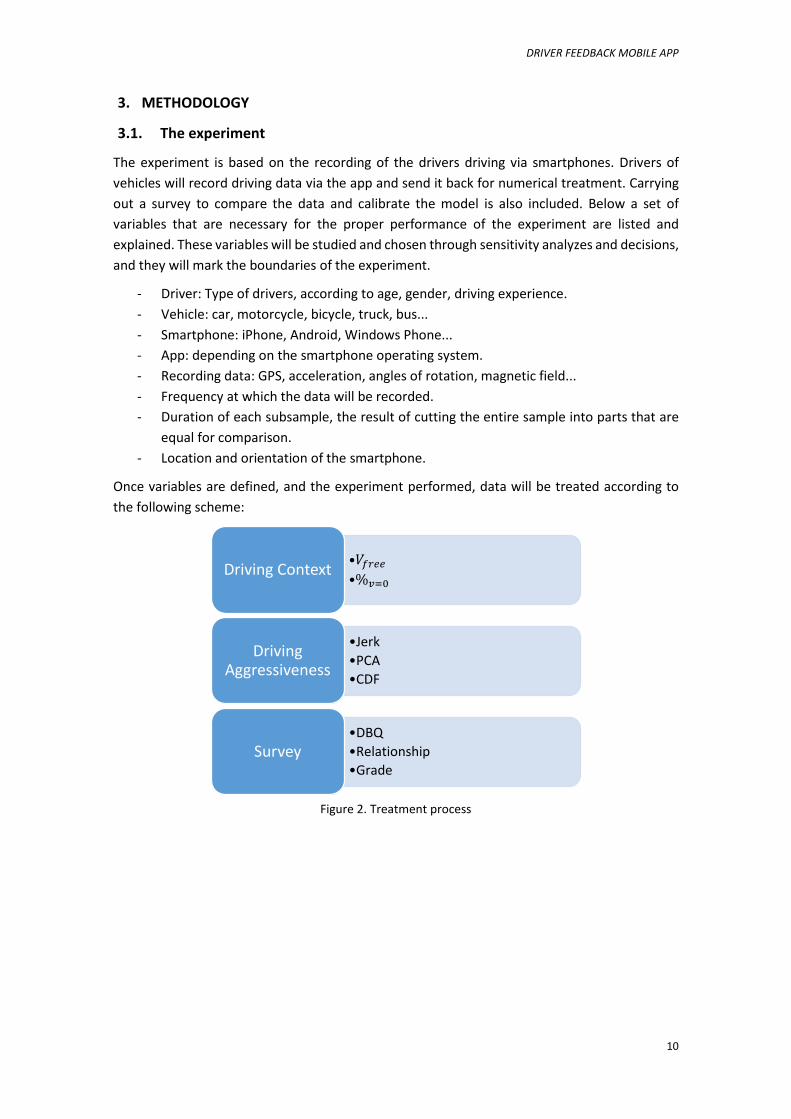
Once variables are defined, and the experiment performed, data will be treated according to
the following scheme:
Figure 2. Treatment process
•𝑉𝑓𝑟𝑒𝑒
•%𝑣=0Driving Context
•Jerk
•PCA
•CDF
Driving Aggressiveness
•DBQ
•Relationship
•GradeSurvey
DRIVER FEEDBACK MOBILE APP
11
3.2. Establish the driving context
Definition of the variables (average moving speed and %stopped time)
One of the main conditioning when comparing jerk data is to compare data in similar situations.
The driving requirement will not be the same through the center of Barcelona at the rush hour
or through a freeway at three in the morning. So before comparing the jerk data an indicator
that allows separate groups of data to analyze has to be found.
For the study of the driving context GPS location could be used to cross it with a database where
all the infrastructure of Catalonia and know what kind of environment it is, but this procedure
is excessive, unnecessary and inaccurate, because you could know what kind of street was but
you wouldn’t know if there was traffic or not.
So, it was decided to use data from the speed indicated by GPS in order to define the areas of
same driving characteristics. We have the position and speed time for each record. With these
data we need to calculate the average speed of a data sample, and we can make two
calculations: 1) taking the position of the GPS coordinates, measure and calculate the total
displacement, and calculate the speed as Displacement/Time, and 2) the average values of
speed that gives the GPS. We could use the two ways to find the average speed, but the second
is easier, takes advantage of the calculations of the GPS, and has a very interesting feature which
will use further, quantifying the time the vehicle has been stopped (𝑉𝑖 = 0). In addition, it can
be shown that the two average speed give the same value:
𝑉𝑚 =∑ 𝑑𝑥𝑖
𝑁𝑖=1
∑ 𝑑𝑡𝑁𝑖=1
=∑ 𝑑𝑥𝑖
𝑁𝑖=1
∑ 𝑑𝑡𝑁𝑖=1
=∑ 𝑉𝑖𝑑𝑡𝑁
𝑖=1
𝑁 · 𝑑𝑡=
∑ 𝑉𝑖𝑁𝑖=1
𝑁= 𝑉𝑖
In addition to speed, a new variable was defined: the time that the vehicle has been stopped,
𝑉 = 0. This new variable is calculated by counting the whole speed data from a sample (e.g. a
sample of 5 minutes and 10Hz = 3000 values), and counting the number of data that were less
than 2 km/h. This decision was made after observing that in areas with very low speed rates it
was equivalent to being stopped. To relate it to time, the count of data (𝑉 = 0) over the whole
data is considered the percentage of the time being stopped, because the data are equally
spaced in time.
With these two variables we are able to study the different driving context. What we can see is
that the two variables are interrelated, because longer stopping lowers the average speed in the
same conditions. Thus, before studying the different environments, it is necessary a
mathematical operation to break up these two variables into other two independent variables,
and this is done by calculating the free speed, the average speed when the vehicle is traveling
at V≥2km/h.
𝑉𝑓𝑟𝑒𝑒 =100 · 𝑉
100 − %𝑉≤2
Definition of driving context through cluster analysis
These experimental data will generate some point clouds with coordinates 𝑉𝑓𝑟𝑒𝑒 and %𝑉≤2. In
order to group the data set a cluster analysis will be applied. The program used will be IBM SPSS
Statistics.
DRIVER FEEDBACK MOBILE APP
12
The choice of the final cluster result will be based in other cluster analysis’s experiences and the
real-life experience. It must be somewhere in the middle between a purely mathematical
approach and real life.
3.3. Measure of the driving aggressiveness
Jerk Data: The Ellipsoid of Revolution
In each driving context the subsample generates an indicator of aggressiveness. The variables of
the vector come out from accelerometer, and instead of choosing the acceleration vector it is
chosen jerk vector, calculated from the acceleration vector as explained below.
The calculation is as follows: the smartphone records the three components of the acceleration
vector in motion mode, i.e., only accelerations resulting from subtracting the acceleration of
gravity from the total acceleration.
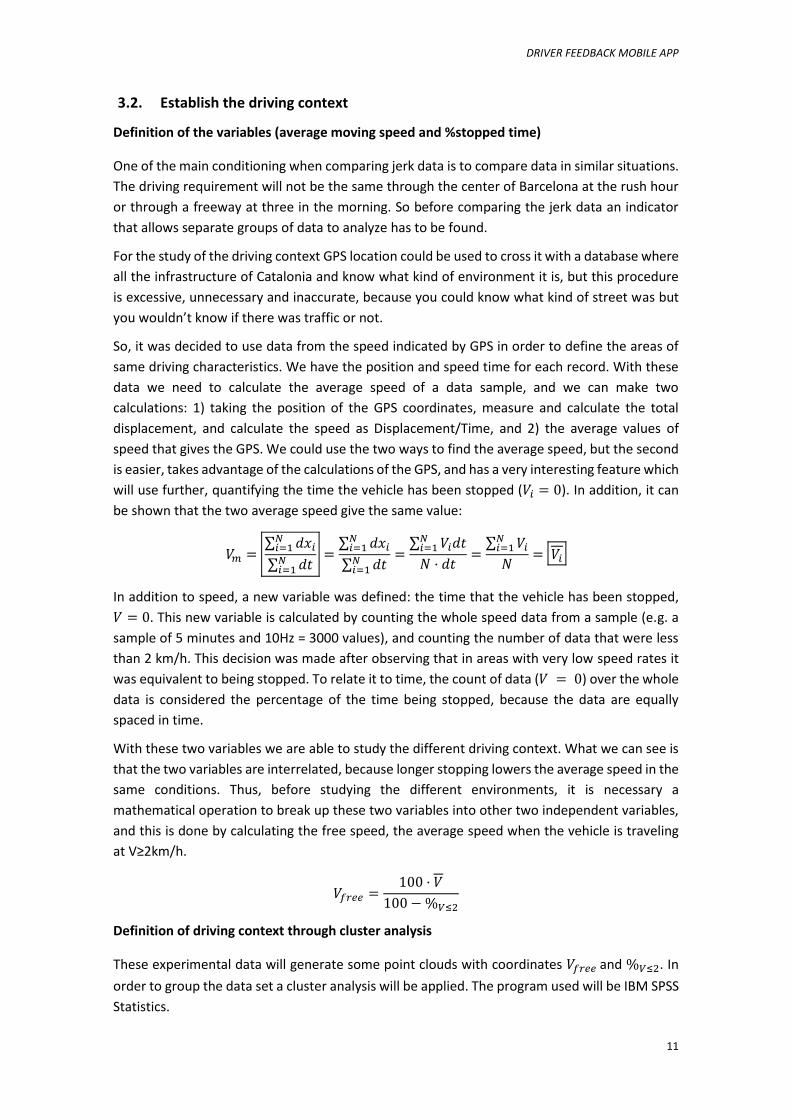
This correction is inward and found that the smartphone is balanced with a certain acceptable
error. The components of the acceleration vector derived variable with respect to time using the
central differences method. The results are the three components of the vector jerk.
𝑗𝑖 = 𝑎𝑖′ =
𝑎𝑖𝑡+1− 𝑎𝑖𝑡−1
(𝑡 + 1) − (𝑡 − 1)
Where 𝑖 = 𝑥, 𝑦, 𝑧
Figure 3. Example of derived approach using the central differences method.
With the conversion from acceleration data to jerk data, the experimental jerk data has provided
some information: the highest value of jerk is made by vertical accelerations. Its shape is an
ellipsoid of revolution. That is found in a specifically axis position.
DRIVER FEEDBACK MOBILE APP
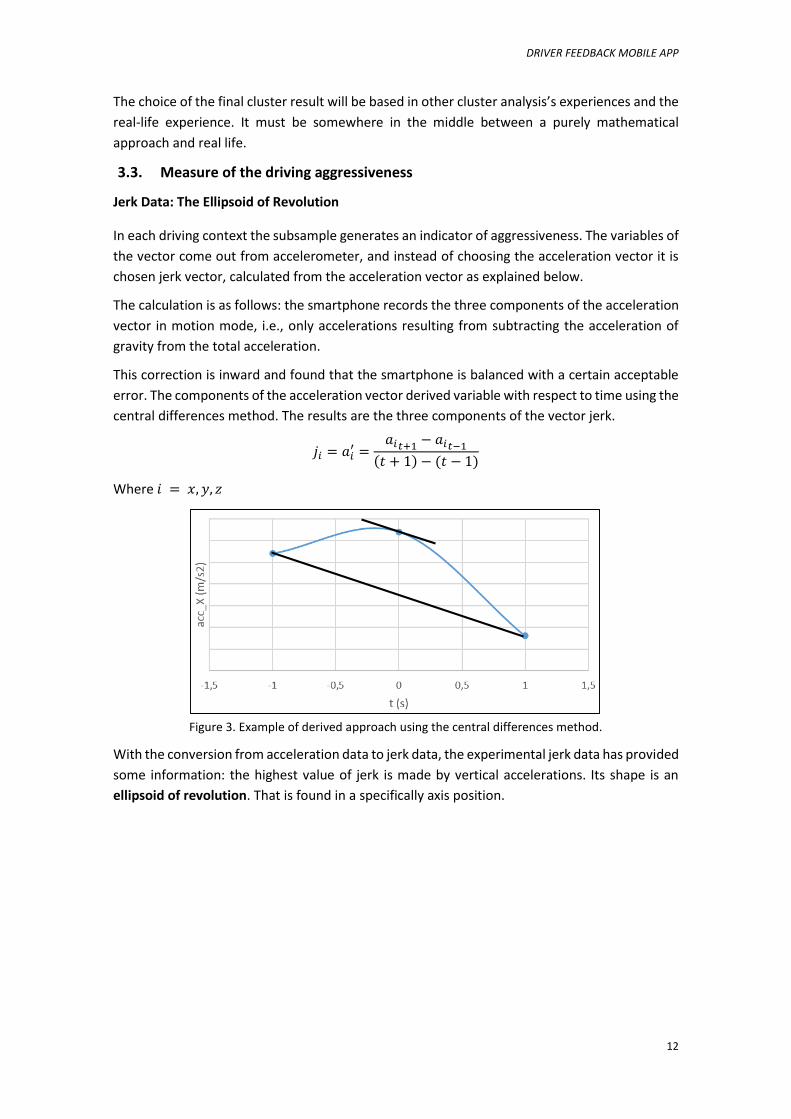
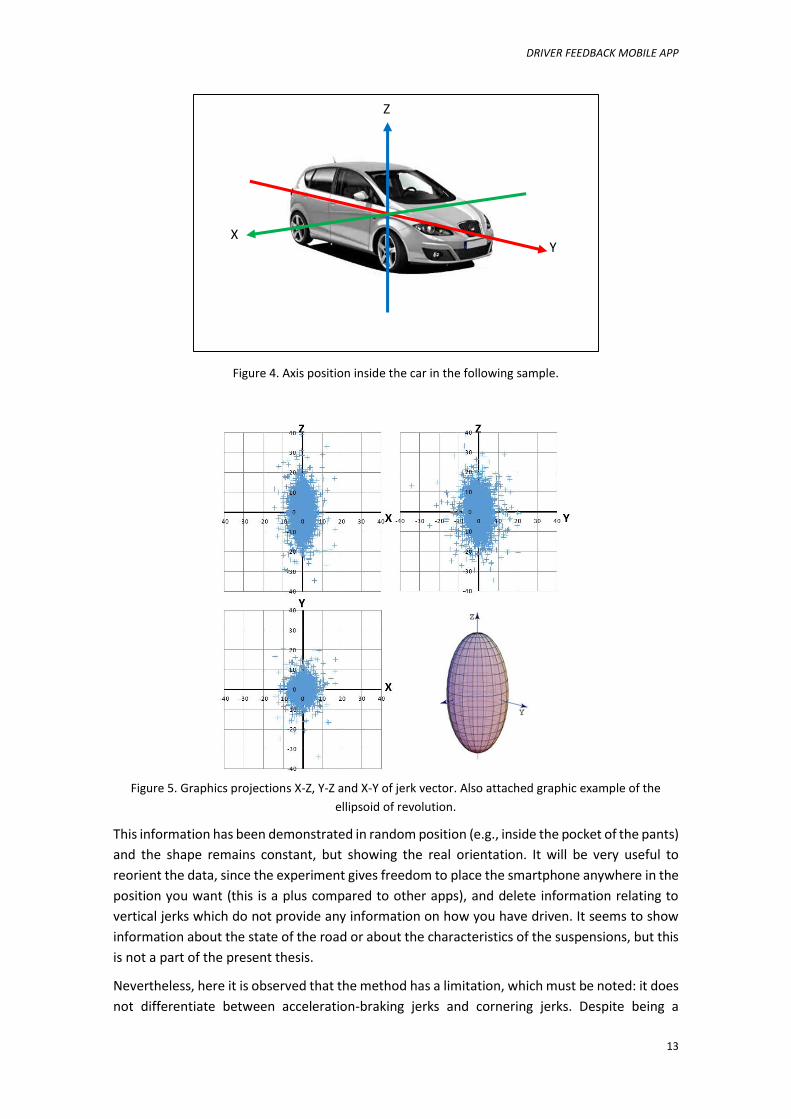
13
Figure 4. Axis position inside the car in the following sample.
Figure 5. Graphics projections X-Z, Y-Z and X-Y of jerk vector. Also attached graphic example of the
ellipsoid of revolution.
This information has been demonstrated in random position (e.g., inside the pocket of the pants)
and the shape remains constant, but showing the real orientation. It will be very useful to
reorient the data, since the experiment gives freedom to place the smartphone anywhere in the
position you want (this is a plus compared to other apps), and delete information relating to
vertical jerks which do not provide any information on how you have driven. It seems to show
information about the state of the road or about the characteristics of the suspensions, but this
is not a part of the present thesis.
Nevertheless, here it is observed that the method has a limitation, which must be noted: it does
not differentiate between acceleration-braking jerks and cornering jerks. Despite being a
X Y
Z
DRIVER FEEDBACK MOBILE APP
14
limitation, when observing the circular projection XY Figure 3 can be noticed that the
magnitudes are very similar and therefore an axis analysis would also give similar results. In
addition, the combination of two jerk values can aggravate jerk effect, in the same way that the
combination of two acceleration values increases global acceleration.
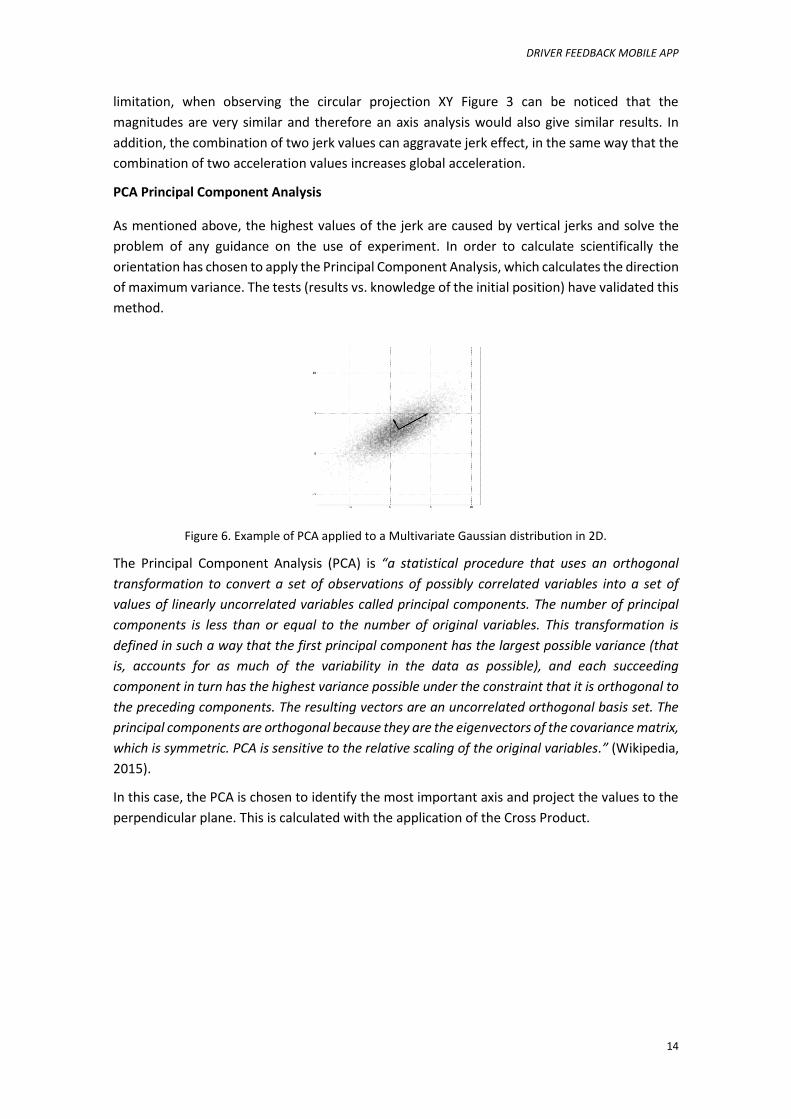
PCA Principal Component Analysis
As mentioned above, the highest values of the jerk are caused by vertical jerks and solve the
problem of any guidance on the use of experiment. In order to calculate scientifically the
orientation has chosen to apply the Principal Component Analysis, which calculates the direction
of maximum variance. The tests (results vs. knowledge of the initial position) have validated this
method.
Figure 6. Example of PCA applied to a Multivariate Gaussian distribution in 2D.
The Principal Component Analysis (PCA) is “a statistical procedure that uses an orthogonal
transformation to convert a set of observations of possibly correlated variables into a set of
values of linearly uncorrelated variables called principal components. The number of principal
components is less than or equal to the number of original variables. This transformation is
defined in such a way that the first principal component has the largest possible variance (that
is, accounts for as much of the variability in the data as possible), and each succeeding
component in turn has the highest variance possible under the constraint that it is orthogonal to
the preceding components. The resulting vectors are an uncorrelated orthogonal basis set. The
principal components are orthogonal because they are the eigenvectors of the covariance matrix,
which is symmetric. PCA is sensitive to the relative scaling of the original variables.” (Wikipedia,
2015).
In this case, the PCA is chosen to identify the most important axis and project the values to the
perpendicular plane. This is calculated with the application of the Cross Product.
DRIVER FEEDBACK MOBILE APP
15
Cross Product
In order to project the vectors in the
perpendicular plane to the resultant vector of the
PCA, i.e., the horizontal plane, which is also the
distance from vector to the line, it will be
calculated the cross product of the first principal
vector of the PCA with each of the vectors that
we want to project. As will be demonstrated
below, if the principal vector is unitary module
(and it is), the module of the result of the cross
product will be exactly the wanted projection.
|𝑢→ ∗
𝑣→| = |
𝑢→| ∗ |
𝑣→| ∗ sin(𝛼) = |
𝑢→| ∗ sin(𝛼)
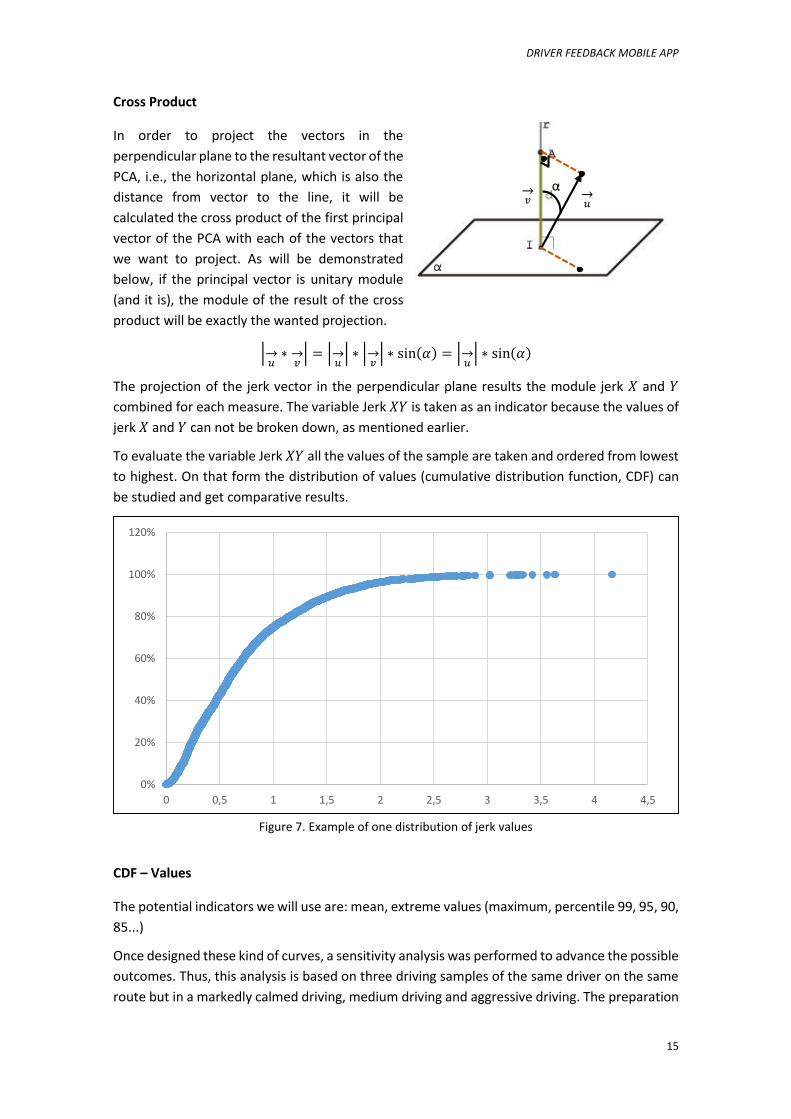
The projection of the jerk vector in the perpendicular plane results the module jerk 𝑋 and 𝑌
combined for each measure. The variable Jerk 𝑋𝑌 is taken as an indicator because the values of
jerk 𝑋 and 𝑌 can not be broken down, as mentioned earlier.
To evaluate the variable Jerk 𝑋𝑌 all the values of the sample are taken and ordered from lowest
to highest. On that form the distribution of values (cumulative distribution function, CDF) can
be studied and get comparative results.
Figure 7. Example of one distribution of jerk values
CDF – Values
The potential indicators we will use are: mean, extreme values (maximum, percentile 99, 95, 90,
85...)
Once designed these kind of curves, a sensitivity analysis was performed to advance the possible
outcomes. Thus, this analysis is based on three driving samples of the same driver on the same
route but in a markedly calmed driving, medium driving and aggressive driving. The preparation
0%
20%
40%
60%
80%
100%
120%
0 0,5 1 1,5 2 2,5 3 3,5 4 4,5
α 𝑣→
𝑢→
DRIVER FEEDBACK MOBILE APP
16
of these samples has been in an environment isolated from other road users and has not been
violated any rule of circulation.
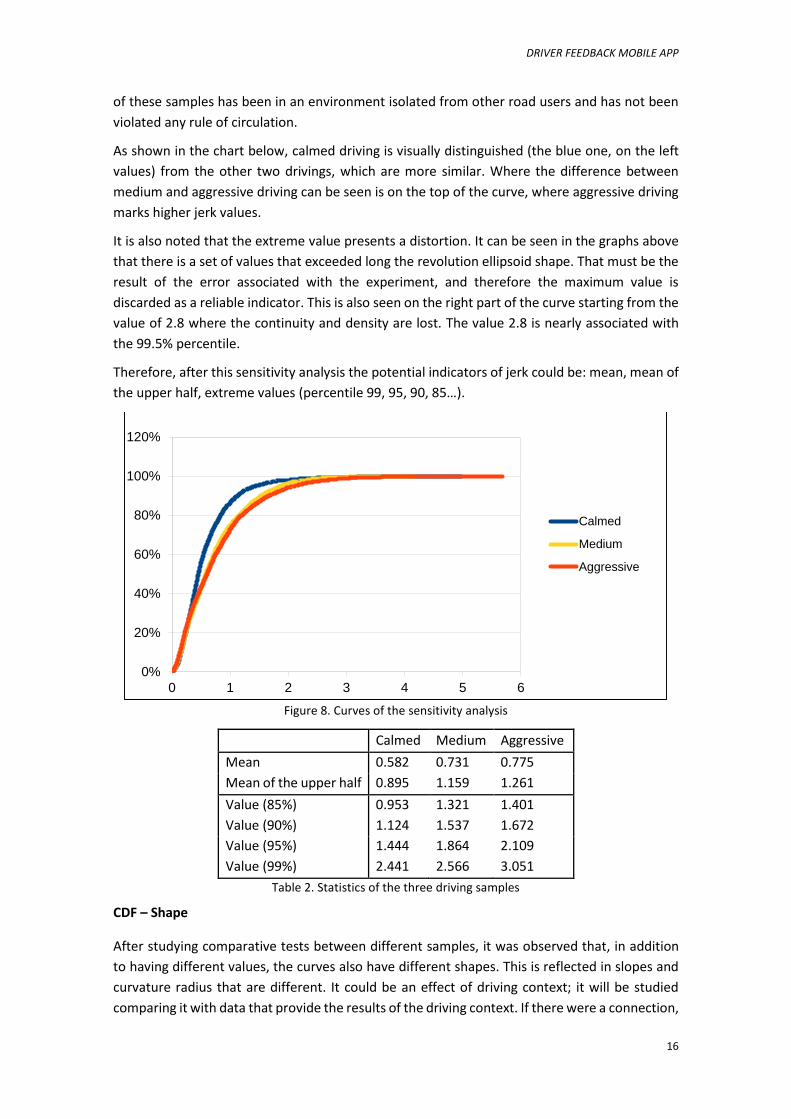
As shown in the chart below, calmed driving is visually distinguished (the blue one, on the left
values) from the other two drivings, which are more similar. Where the difference between
medium and aggressive driving can be seen is on the top of the curve, where aggressive driving
marks higher jerk values.
It is also noted that the extreme value presents a distortion. It can be seen in the graphs above
that there is a set of values that exceeded long the revolution ellipsoid shape. That must be the
result of the error associated with the experiment, and therefore the maximum value is
discarded as a reliable indicator. This is also seen on the right part of the curve starting from the
value of 2.8 where the continuity and density are lost. The value 2.8 is nearly associated with
the 99.5% percentile.
Therefore, after this sensitivity analysis the potential indicators of jerk could be: mean, mean of
the upper half, extreme values (percentile 99, 95, 90, 85…).
Figure 8. Curves of the sensitivity analysis
Calmed Medium Aggressive
Mean 0.582 0.731 0.775
Mean of the upper half 0.895 1.159 1.261
Value (85%) 0.953 1.321 1.401
Value (90%) 1.124 1.537 1.672
Value (95%) 1.444 1.864 2.109
Value (99%) 2.441 2.566 3.051
Table 2. Statistics of the three driving samples
CDF – Shape
After studying comparative tests between different samples, it was observed that, in addition
to having different values, the curves also have different shapes. This is reflected in slopes and
curvature radius that are different. It could be an effect of driving context; it will be studied
comparing it with data that provide the results of the driving context. If there were a connection,
0%
20%
40%
60%
80%
100%
120%
0 1 2 3 4 5 6
Calmed
Medium
Aggressive
DRIVER FEEDBACK MOBILE APP
17
it would be possible to renounce the GPS data from the sampling, which improves privacy and
reduces the battery consumption and the number of data sent.
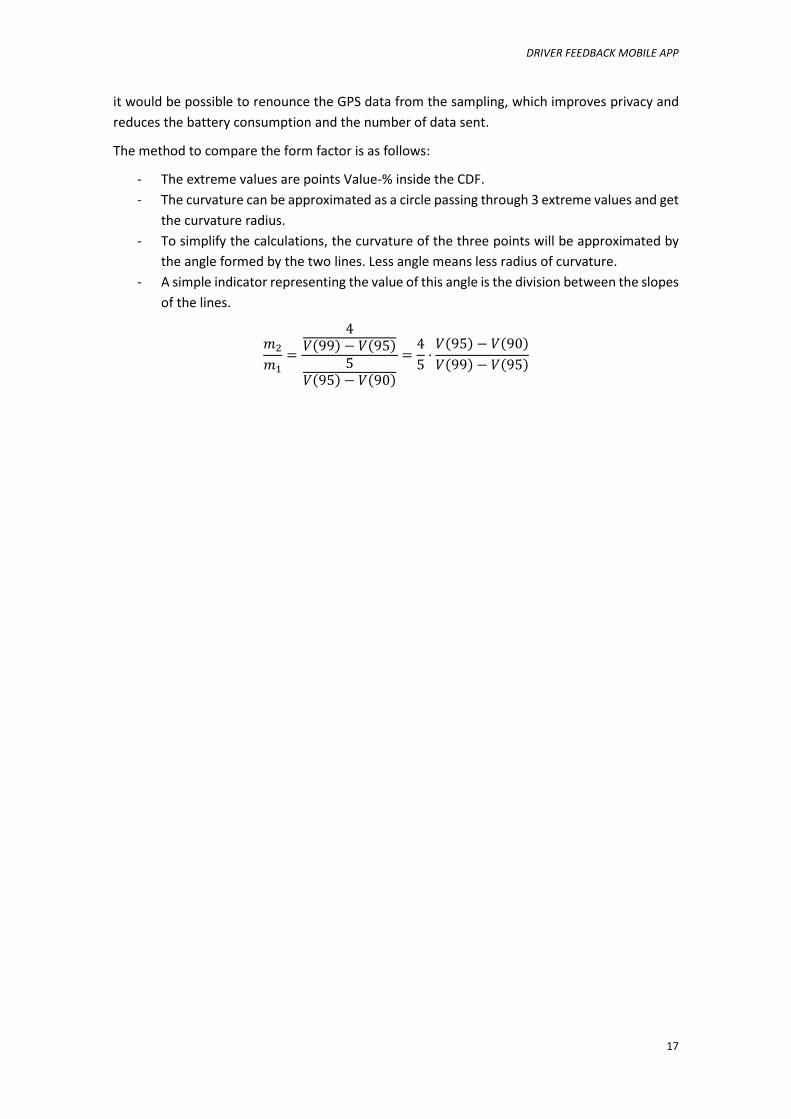
The method to compare the form factor is as follows:
- The extreme values are points Value-% inside the CDF.
- The curvature can be approximated as a circle passing through 3 extreme values and get
the curvature radius.
- To simplify the calculations, the curvature of the three points will be approximated by
the angle formed by the two lines. Less angle means less radius of curvature.
- A simple indicator representing the value of this angle is the division between the slopes
of the lines.
𝑚2
𝑚1=
4𝑉(99) − 𝑉(95)
5𝑉(95) − 𝑉(90)
=4
5·
𝑉(95) − 𝑉(90)
𝑉(99) − 𝑉(95)
DRIVER FEEDBACK MOBILE APP
18
3.4. Relating aggressiveness with safe driving
Origins and description of the survey
The theoretical part of the experiment is a survey with a number of elements aimed at designing
indicators on human behavior driving. The choice of a survey responds to create an ”easy and
fast instrument that provides useful information on what is analyzed” (Leandro, 2008).
Here are the categories on which the survey was created:
- Taking samples
- Personal data
- Vehicle information (car/motorcycle, characteristics)
- Experience as a drive and vehicle usage
- Accidents rate
- Traffic tickets
- Driving habits (DBQ questionnaire)
Questions are meant to be brief and clear, limiting as far as possible the doubts generated from
the survey by questioning three people and receive feedback on the questions arising.
To help participants to complete the survey, first Sample Zero and in the future entire sample,
the survey was implemented in Google Forms®. Thus, through the internet all participants were
able to participate properly.
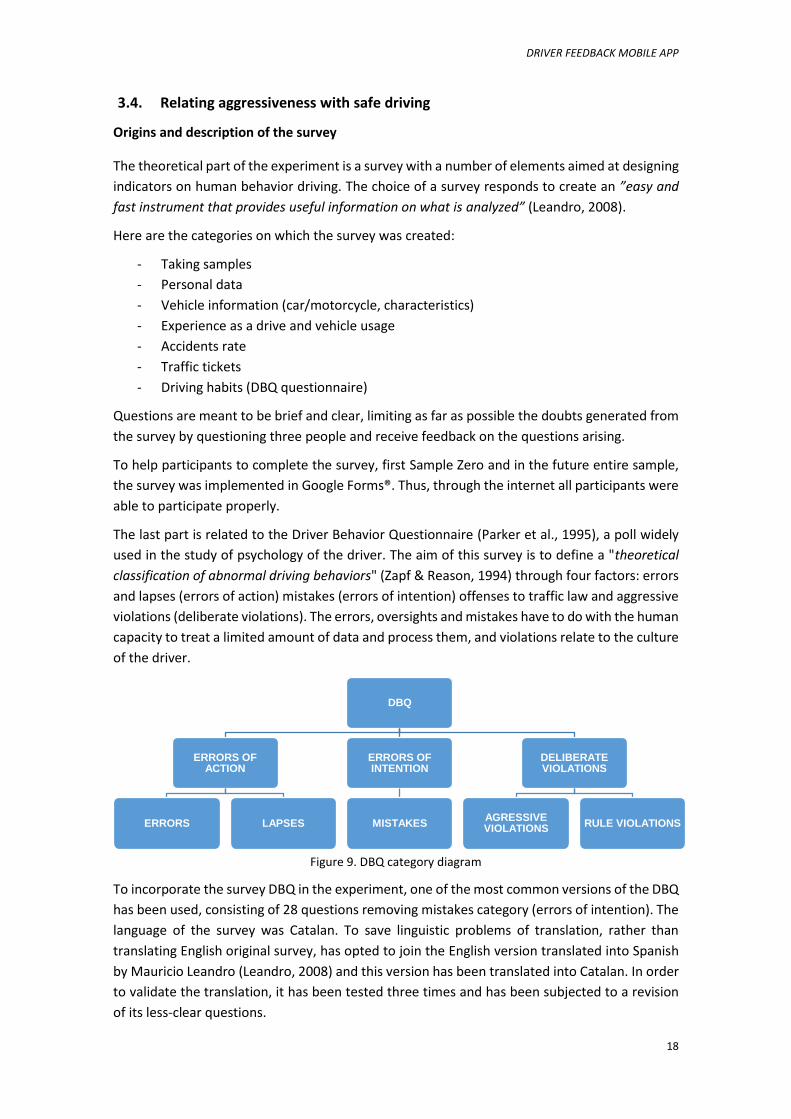
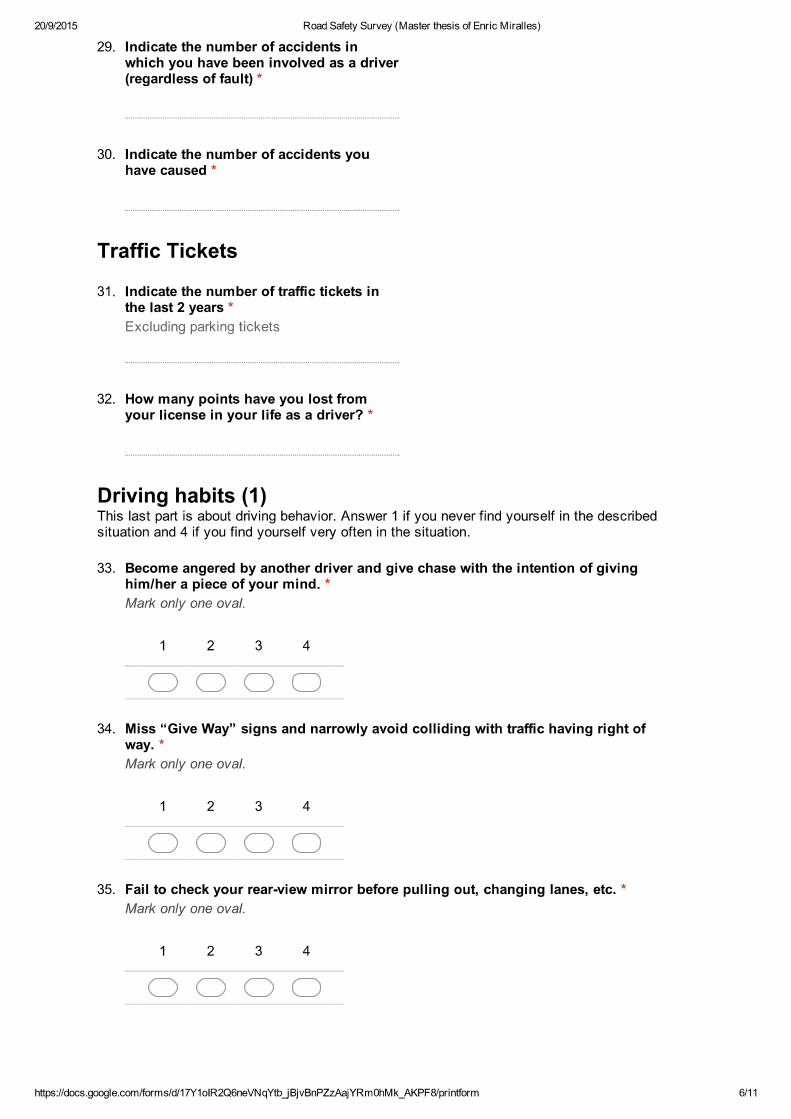
The last part is related to the Driver Behavior Questionnaire (Parker et al., 1995), a poll widely
used in the study of psychology of the driver. The aim of this survey is to define a "theoretical
classification of abnormal driving behaviors" (Zapf & Reason, 1994) through four factors: errors
and lapses (errors of action) mistakes (errors of intention) offenses to traffic law and aggressive
violations (deliberate violations). The errors, oversights and mistakes have to do with the human
capacity to treat a limited amount of data and process them, and violations relate to the culture
of the driver.
Figure 9. DBQ category diagram
To incorporate the survey DBQ in the experiment, one of the most common versions of the DBQ
has been used, consisting of 28 questions removing mistakes category (errors of intention). The
language of the survey was Catalan. To save linguistic problems of translation, rather than
translating English original survey, has opted to join the English version translated into Spanish
by Mauricio Leandro (Leandro, 2008) and this version has been translated into Catalan. In order
to validate the translation, it has been tested three times and has been subjected to a revision
of its less-clear questions.
DBQ
ERRORS OF ACTION
ERRORS LAPSES
ERRORS OF INTENTION
MISTAKES
DELIBERATE VIOLATIONS
AGRESSIVE VIOLATIONS
RULE VIOLATIONS
DRIVER FEEDBACK MOBILE APP
19
The choice of the survey DBQ is due to the overall concepts. It has four different categories
against other surveys that focus on only one category, being more precise. Other options were
surveys DAS (Driver Anger Scale) and TPB (Theory of Planned Behavior), but DAS survey only
asked for the aggression, and TPB survey -even asking about attitudes, norms and perceived
control- is based only in questions about the speed limit.
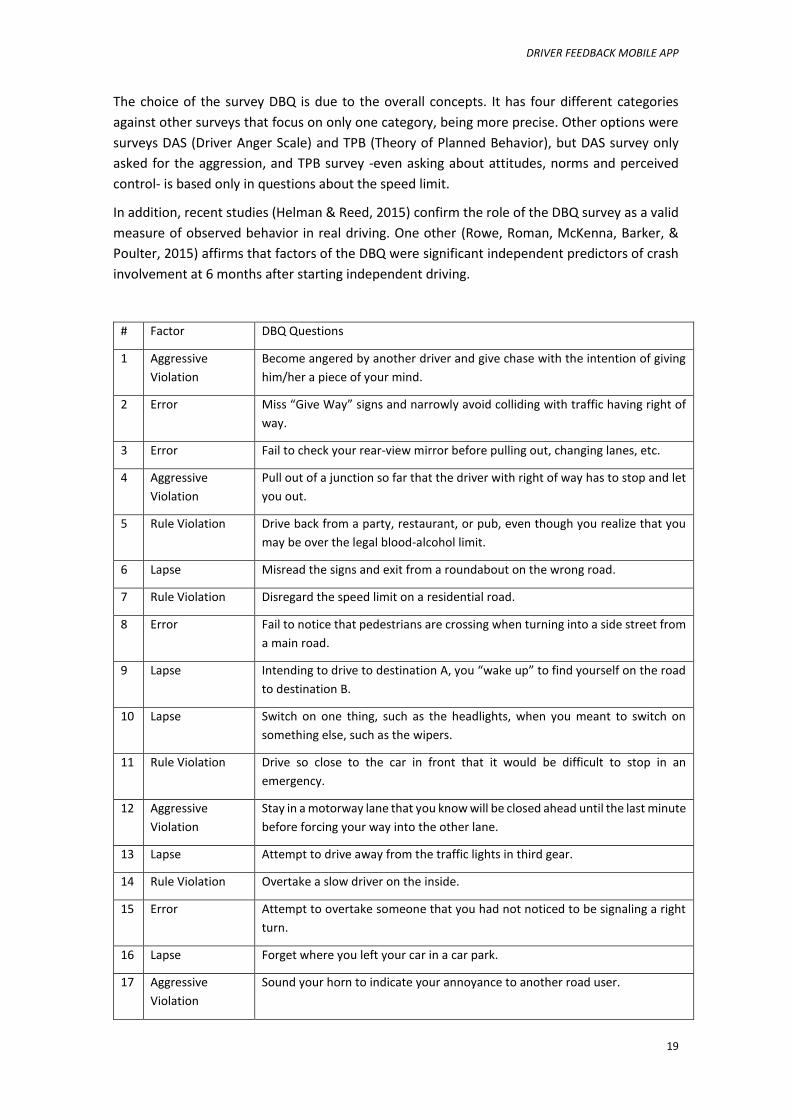
In addition, recent studies (Helman & Reed, 2015) confirm the role of the DBQ survey as a valid
measure of observed behavior in real driving. One other (Rowe, Roman, McKenna, Barker, &
Poulter, 2015) affirms that factors of the DBQ were significant independent predictors of crash
involvement at 6 months after starting independent driving.
# Factor DBQ Questions
1 Aggressive
Violation
Become angered by another driver and give chase with the intention of giving
him/her a piece of your mind.
2 Error Miss “Give Way” signs and narrowly avoid colliding with traffic having right of
way.
3 Error Fail to check your rear-view mirror before pulling out, changing lanes, etc.
4 Aggressive
Violation
Pull out of a junction so far that the driver with right of way has to stop and let
you out.
5 Rule Violation Drive back from a party, restaurant, or pub, even though you realize that you
may be over the legal blood-alcohol limit.
6 Lapse Misread the signs and exit from a roundabout on the wrong road.
7 Rule Violation Disregard the speed limit on a residential road.
8 Error Fail to notice that pedestrians are crossing when turning into a side street from
a main road.
9 Lapse Intending to drive to destination A, you “wake up” to find yourself on the road
to destination B.
10 Lapse Switch on one thing, such as the headlights, when you meant to switch on
something else, such as the wipers.
11 Rule Violation Drive so close to the car in front that it would be difficult to stop in an
emergency.
12 Aggressive
Violation
Stay in a motorway lane that you know will be closed ahead until the last minute
before forcing your way into the other lane.
13 Lapse Attempt to drive away from the traffic lights in third gear.
14 Rule Violation Overtake a slow driver on the inside.
15 Error Attempt to overtake someone that you had not noticed to be signaling a right
turn.
16 Lapse Forget where you left your car in a car park.
17 Aggressive
Violation
Sound your horn to indicate your annoyance to another road user.
DRIVER FEEDBACK MOBILE APP
20
18 Lapse Realize that you have no clear recollection of the road along which you have
just been travelling.
19 Rule Violation Cross a junction knowing that the traffic lights have already turned against you.
20 Error On turning left nearly hit a cyclist who has come up on your inside.
21 Error Queuing to turn left onto a main road, you pay such close attention to the main
stream of traffic that you nearly hit the car in front.
22 Aggressive
Violation
Become angered by a certain type of a driver and indicate your hostility by
whatever means you can.
23 Error Underestimate the speed of an oncoming vehicle when overtaking.
24 Lapse Hit something when reversing that you had not previously seen.
25 Lapse Get into the wrong lane approaching a roundabout or a junction.
26 Aggressive
Violation
Get involved in unofficial races.
27 Error Brake too quickly on a slippery road or steer the wrong way in a skid.
28 Rule Violation Disregard the speed limit on a motorway.
Table 3. DBQ questions (28)
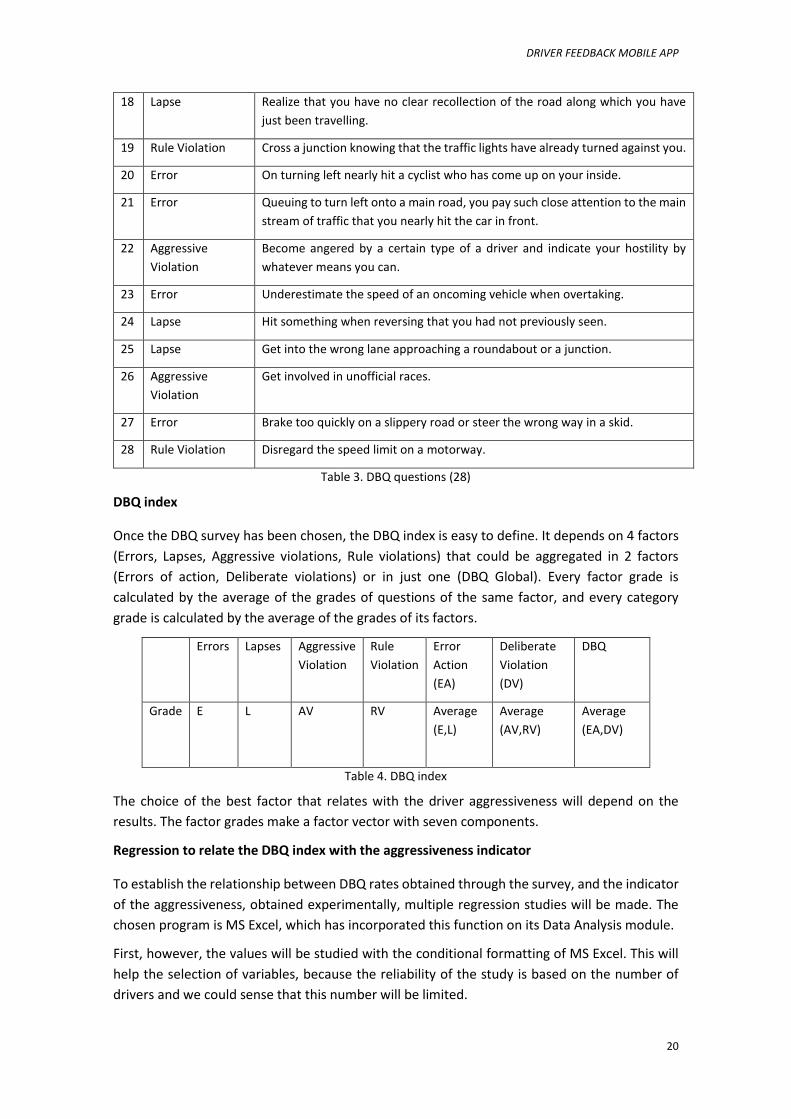
DBQ index
Once the DBQ survey has been chosen, the DBQ index is easy to define. It depends on 4 factors
(Errors, Lapses, Aggressive violations, Rule violations) that could be aggregated in 2 factors
(Errors of action, Deliberate violations) or in just one (DBQ Global). Every factor grade is
calculated by the average of the grades of questions of the same factor, and every category
grade is calculated by the average of the grades of its factors.
Errors Lapses Aggressive
Violation
Rule
Violation
Error
Action
(EA)
Deliberate
Violation
(DV)
DBQ
Grade E L AV RV Average
(E,L)
Average
(AV,RV)
Average
(EA,DV)
Table 4. DBQ index
The choice of the best factor that relates with the driver aggressiveness will depend on the
results. The factor grades make a factor vector with seven components.
Regression to relate the DBQ index with the aggressiveness indicator
To establish the relationship between DBQ rates obtained through the survey, and the indicator
of the aggressiveness, obtained experimentally, multiple regression studies will be made. The
chosen program is MS Excel, which has incorporated this function on its Data Analysis module.
First, however, the values will be studied with the conditional formatting of MS Excel. This will
help the selection of variables, because the reliability of the study is based on the number of
drivers and we could sense that this number will be limited.
DRIVER FEEDBACK MOBILE APP
21
Normalization of the indicator and obtaining the grade
If there is a linear relationship between aggressiveness vector and the result of the survey DBQ,
it will be set that the mark of drivers is the indicator of aggressiveness vector transformed
linearly according to this relationship DBQ-vector, and transformed the note of the interval [1-
4] (1 being the best mark) on the interval [4-10], 10 being the best mark.
This transformation normalizes the notes in a standard format that is easily readable in the field
of study, Catalonia. The decision of the interval [4-10] corresponds to the idea of not punishing
people with very low notes and not transforming it into a tool where drivers compete to get the
worst grade. In addition, the high grades suggest positivity and encouragement to improve.
The transformation will be:
𝐺𝑟𝑎𝑑𝑒 = 12 − 2 ∗ 𝐷𝐵𝑄 = 12 − 2 ∗ [𝑓(𝑎𝑔𝑔𝑟𝑒𝑠𝑠𝑖𝑣𝑒𝑛𝑒𝑠𝑠 𝑣𝑒𝑐𝑡𝑜𝑟)]
The choice of the aggressiveness vectors’ components and its calibration will show which
concepts (errors, lapses, aggressive violation, and rule violation) have more importance in bad
driving.
DRIVER FEEDBACK MOBILE APP
22
4. RESULTS OF THE PILOT STUDY
4.1. Results of the experiment
With the theory already designed the next step is to organize the actual experiment, which
requires two activities: driving record with the app and answer the survey. Both are necessary
for the proper functioning, a driver who participate in part or had problems in one of the two
parts had been excluded from participating. So it was very important that both the app and the
survey were user-friendly. This has led to small supervised evidence without being collected in
this study.
VARIABLES
Drivers
The participants are people close to the author (that helps to control the problems) who have
iPhone and had planned to use his vehicle after the information date. There was no limit to
participate.
Vehicles
The experiment includes the two most common types of vehicle in our society, car and
motorbike. Bikes, trucks and buses were excluded from the experiment just to limit the scope
of the study, because they can be incorporated in the future (their similarities with motorbikes
and cars are invited to do so).
Smartphones
The author was able to study the two major types of smartphones (Android and iPhone) and
enough knowledge to set them both in order to record the data. The decision was iPhone
because they have uniformity within their operating system that allowed all the users to have
the same version of the app on all devices. Besides, some problems were detected in some
Android smartphones on reading comments on the reliability of their sensors
This has led to an important limitation to finding drivers who could participate, since most
people have Android system instead of iPhone (in the Spanish territory, sales between Dec-14
and Feb 15 result in a distribution of 87.6% Android vs. 8.7% iPhone). Looking at a broader
experiment should be adapted to Android smartphones.
Apps
Regarding the choice of app that would record the data, a few of them were proved and finally
the choice was SensorLog®. It meets the requirements that were asked, they were full and it was
easy to set up. Other apps that were tested were SensorLogger®, Sensor Data Streamer®, G
Sensor® and Sensor FreeKintetics®.
Data records
Despite the availability of different data from different sensors, the sensors chosen in the design
method are speed (GPS data) and acceleration (accelerometer data). It is possible that the use
of other data such as position (GPS) or angles of rotation (gyro) could provide some extra
information on the experiment, but they were excluded to delimit the experiment.
DRIVER FEEDBACK MOBILE APP
23
Frequency at which records data
In a Swedish researchers’ experiment (Bagdadi & Várhelyi, 2011), with measured data between
2001 and 2003, the jerk from the second derivative of the measures of speed, with a frequency
of 5Hz was calculated. This second derivative implies a considerable level of inaccuracy.
Nowadays smartphones can record the values of its accelerometers to 50Hz, but after making
tests it has been considered 50 test samples each second was excessive and did not contribute
additional precision experiment, which has been decided to take 10 acceleration measurements
every second (10Hz) and thus improves the accuracy of 5Hz, in addition to saving an
approximation of the derivative.
Duration of each subsample
The decision to choose the time interval of each subsample became a trade-off between the
two elements: on one hand, it should be a long interval in order to accurately define the ellipsoid
of revolution (at least upper 2-3 minutes); on the other hand, it should not be a long interval
since it would be classified according to the driving environment in which it would have been
driven, and if they were long intervals the results will be mixed environments.
It has been decided that the samples would be 5 minutes long. All samples from 5 'to 10Hz (3000
measurements) have a data set in ellipsoidal shape with precision to extract a speed that
corresponds to the zone where it has been driven.
Location and orientation of the smartphone
Related of the location, drivers were requested to locate the smartphone on a fixed place where
its movement was very similar to the vehicle. The orientation is not influenced because the study
with the PCA has solved this problem.
Manual of the App
Once chosen and tested the app, a manual was created in order to allow participants of the
experiment to configure the app independently. This manual had been revised after verifying its
effectiveness in people of different ages. The latest version is based on seven self-explanatory
points, and incorporates the logo of the app, screenshots and links to the survey and the app
(web address format and QR code). The format of the manual is a letter addressed to drivers
encouraging them to participate. This manual is included in the Annex to this thesis.
Choice of the method of distribution of the survey
The choice of method of distributing the survey began between the face-to-face version and the
online one. We chose the online version assuming that everyone that has a smartphone would
know how to answer an online survey, or would have someone nearby who could help. The
choice of the type of web survey was easy, because from the start the idea was Google Forms®
and has brought good results. However there were investigated other options such as Google
Doodle® or SurveyMonkey®. The survey is also included in the appendix of this dissertation.
Treatment and validation of the data
Once all the samples of the participants were received in ".csv" files they were processed
through a program written in MATLAB R2014a. The complete automation of data processing has
meant more hours of programming compared to manual processing, but has allowed to include
DRIVER FEEDBACK MOBILE APP
24
many validations that give reliability to the experiment and improve the processing of data in
the future if the experiment will continue.
EXPERIMENT RESULTS
Sample size
The final size of the sample is 7 drivers, 4 car drivers and 3 motorcycle drivers. It is a very small
sample because of the many requirements had to be met to participate. It was easy to find a
high number of drivers interested in participating, but the problem was that few of these had
an iPhone. Although there are three more drivers taking part in the experiment, we were not
able to include them as they had problems with the app.
Driver statistics
About the seven drivers should be noted that the majority are men (6/7). The age range is [26-
57] years, being the average 35 years. The average experience is 14 years.
Other data from the survey:
Car drivers knew all the hp of the vehicle, while not everyone knew cylinder capacity.
In the case of motorcycles is the opposite, everyone knew the cylinder capacity and
not all knew the hp.
All participants work. This may be a consequence of the age of the drivers (26-57
years).
Drivers follow a pattern of mobility associated with an urban environment such as
Barcelona. All drivers use the motorbike to go to work while the car half the drivers
are used to go to work while the other half used for other daily.
Most drivers have been involved in an accident while they do not have a close
relative who has suffered a serious accident.
Study duration
The data collection for the experiment lasted two months. Drivers were reported to start on 1
March and the last samples received consist of 29 April. At this time samples were collected and
after trying them it correspond to a study lasting 7.33 hours, divided into 88 complete and valid
subsamples of 5 minutes. The average duration is one hour per driver. The valid measures
correspond to 305.27 kilometers and an average speed of 41.63 km/h.
4.2. Driving contexts
Results of the cluster analysis
A number of different routes were recorded and one series of experimental situations V-% were
taken. There were recorded in both motorcycle and car, in order to have diversity of types of
roads. It has achieved 469 samples of 5 minutes: that means 39.1 hours of recording. It has to
be mentioned that only a small part of the 469 samples of driving context were accepted in the
study as valid subsamples, as mentioned above. Most of the subsamples were discarded due to
the Android smartphones, recorded in the start experiment and before choosing iPhone
smartphones.
DRIVER FEEDBACK MOBILE APP
25
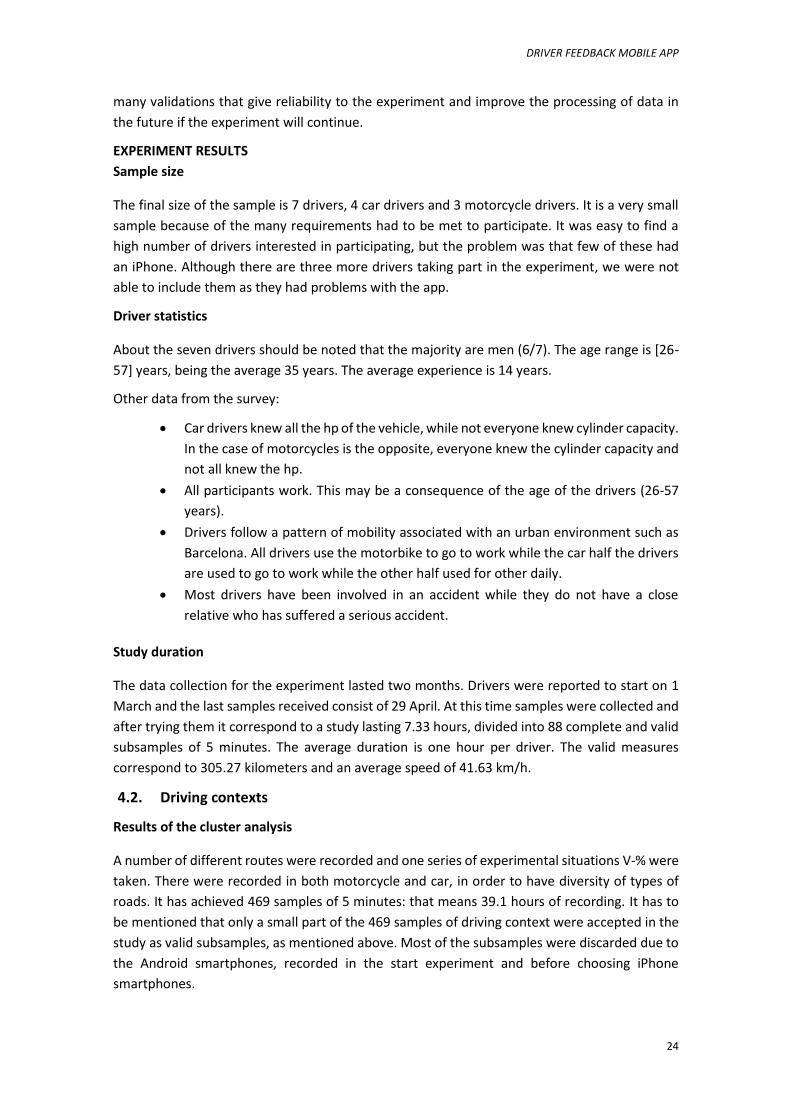
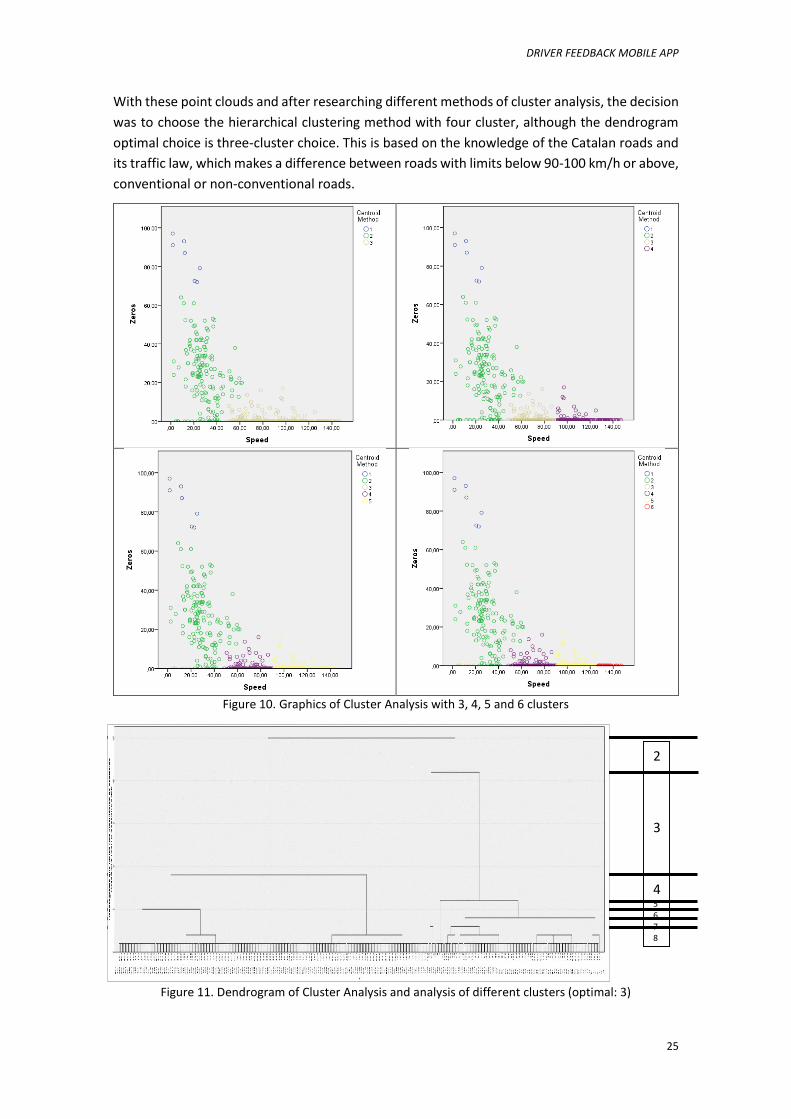
With these point clouds and after researching different methods of cluster analysis, the decision
was to choose the hierarchical clustering method with four cluster, although the dendrogram
optimal choice is three-cluster choice. This is based on the knowledge of the Catalan roads and
its traffic law, which makes a difference between roads with limits below 90-100 km/h or above,
conventional or non-conventional roads.
Figure 10. Graphics of Cluster Analysis with 3, 4, 5 and 6 clusters
Figure 11. Dendrogram of Cluster Analysis and analysis of different clusters (optimal: 3)
2 3
4 5 6 7 8
DRIVER FEEDBACK MOBILE APP
26
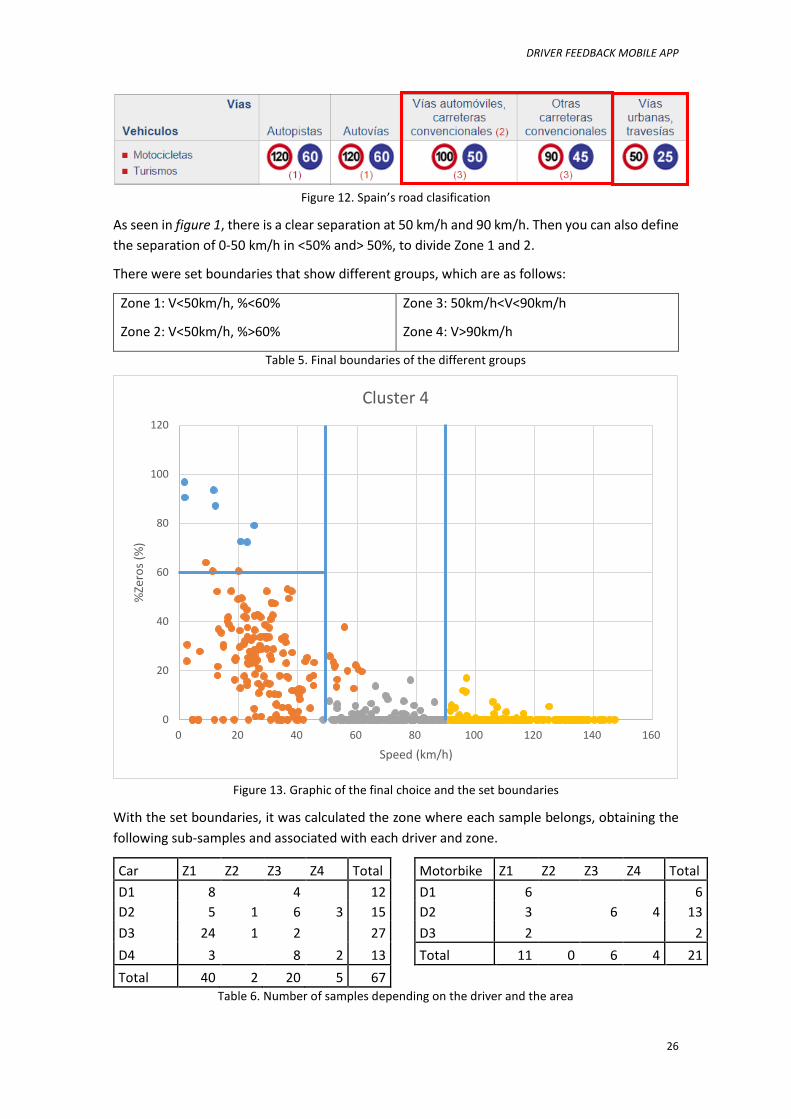
Figure 12. Spain’s road clasification
As seen in figure 1, there is a clear separation at 50 km/h and 90 km/h. Then you can also define
the separation of 0-50 km/h in <50% and> 50%, to divide Zone 1 and 2.
There were set boundaries that show different groups, which are as follows:
Zone 1: V<50km/h, %<60%
Zone 2: V<50km/h, %>60%
Zone 3: 50km/h<V<90km/h
Zone 4: V>90km/h
Table 5. Final boundaries of the different groups
Figure 13. Graphic of the final choice and the set boundaries
With the set boundaries, it was calculated the zone where each sample belongs, obtaining the
following sub-samples and associated with each driver and zone.
Car Z1 Z2 Z3 Z4 Total Motorbike Z1 Z2 Z3 Z4 Total
D1 8 4 12 D1 6 6
D2 5 1 6 3 15 D2 3 6 4 13
D3 24 1 2 27 D3 2 2
D4 3 8 2 13 Total 11 0 6 4 21
Total 40 2 20 5 67
Table 6. Number of samples depending on the driver and the area
0
20
40
60
80
100
120
0 20 40 60 80 100 120 140 160
%Ze
ros
(%)
Speed (km/h)
Cluster 4
DRIVER FEEDBACK MOBILE APP
27
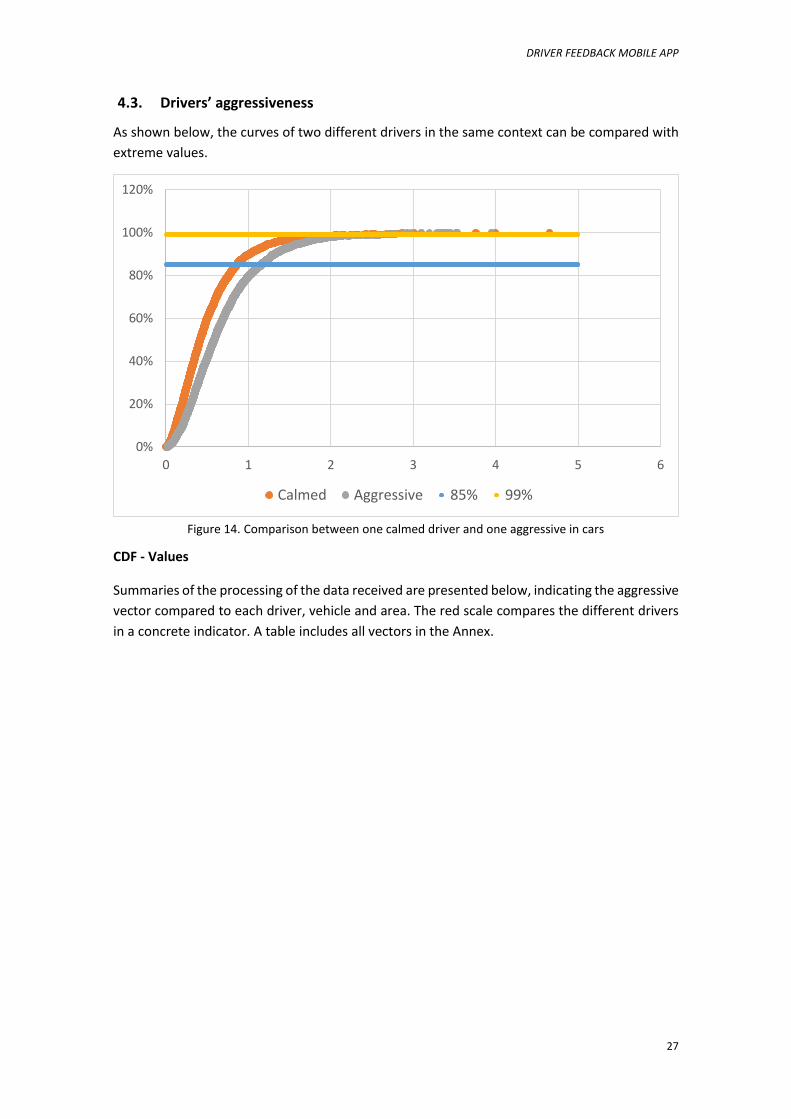
4.3. Drivers’ aggressiveness
As shown below, the curves of two different drivers in the same context can be compared with
extreme values.
Figure 14. Comparison between one calmed driver and one aggressive in cars
CDF - Values
Summaries of the processing of the data received are presented below, indicating the aggressive
vector compared to each driver, vehicle and area. The red scale compares the different drivers
in a concrete indicator. A table includes all vectors in the Annex.
0%
20%
40%
60%
80%
100%
120%
0 1 2 3 4 5 6
Calmed Aggressive 85% 99%
DRIVER FEEDBACK MOBILE APP
28
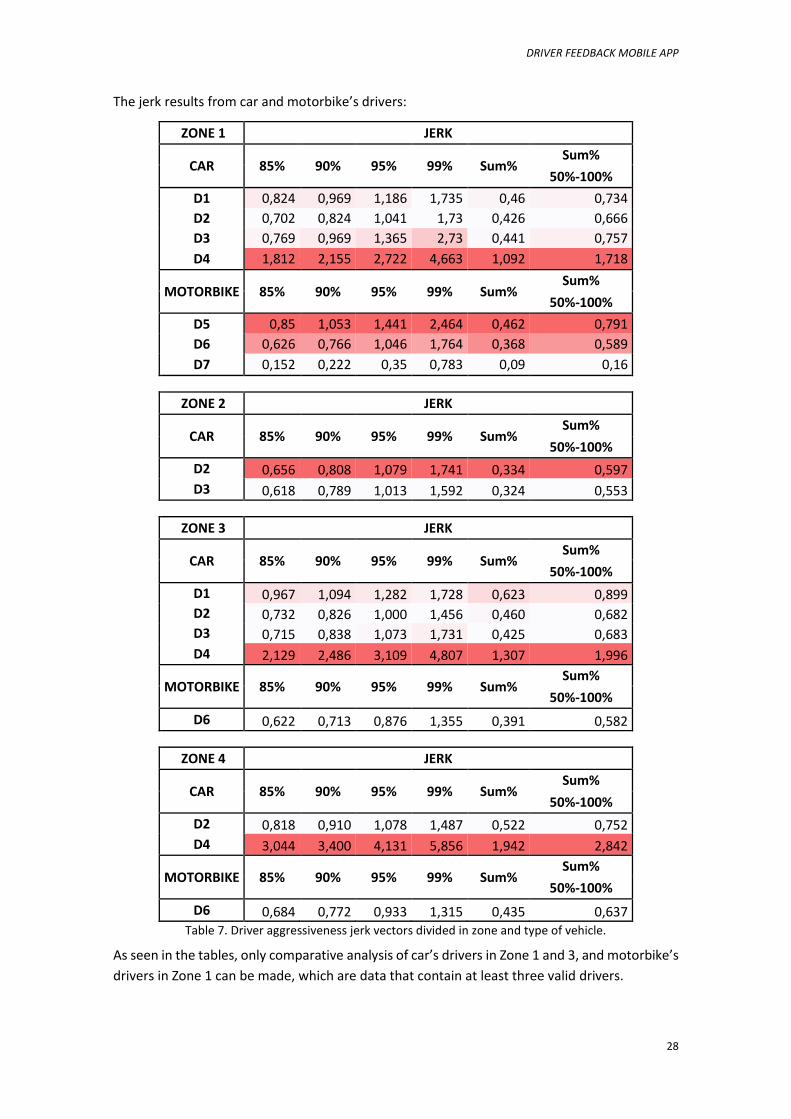
The jerk results from car and motorbike’s drivers:
ZONE 1 JERK
CAR 85% 90% 95% 99% Sum% Sum%
50%-100%
D1 0,824 0,969 1,186 1,735 0,46 0,734
D2 0,702 0,824 1,041 1,73 0,426 0,666
D3 0,769 0,969 1,365 2,73 0,441 0,757
D4 1,812 2,155 2,722 4,663 1,092 1,718
MOTORBIKE 85% 90% 95% 99% Sum% Sum%
50%-100%
D5 0,85 1,053 1,441 2,464 0,462 0,791
D6 0,626 0,766 1,046 1,764 0,368 0,589
D7 0,152 0,222 0,35 0,783 0,09 0,16
ZONE 2 JERK
CAR 85% 90% 95% 99% Sum% Sum%
50%-100%
D2 0,656 0,808 1,079 1,741 0,334 0,597
D3 0,618 0,789 1,013 1,592 0,324 0,553
ZONE 3 JERK
CAR 85% 90% 95% 99% Sum% Sum%
50%-100%
D1 0,967 1,094 1,282 1,728 0,623 0,899
D2 0,732 0,826 1,000 1,456 0,460 0,682
D3 0,715 0,838 1,073 1,731 0,425 0,683
D4 2,129 2,486 3,109 4,807 1,307 1,996
MOTORBIKE 85% 90% 95% 99% Sum% Sum%
50%-100%
D6 0,622 0,713 0,876 1,355 0,391 0,582
ZONE 4 JERK
CAR 85% 90% 95% 99% Sum% Sum%
50%-100%
D2 0,818 0,910 1,078 1,487 0,522 0,752
D4 3,044 3,400 4,131 5,856 1,942 2,842
MOTORBIKE 85% 90% 95% 99% Sum% Sum%
50%-100%
D6 0,684 0,772 0,933 1,315 0,435 0,637 Table 7. Driver aggressiveness jerk vectors divided in zone and type of vehicle.
As seen in the tables, only comparative analysis of car’s drivers in Zone 1 and 3, and motorbike’s
drivers in Zone 1 can be made, which are data that contain at least three valid drivers.
DRIVER FEEDBACK MOBILE APP
29
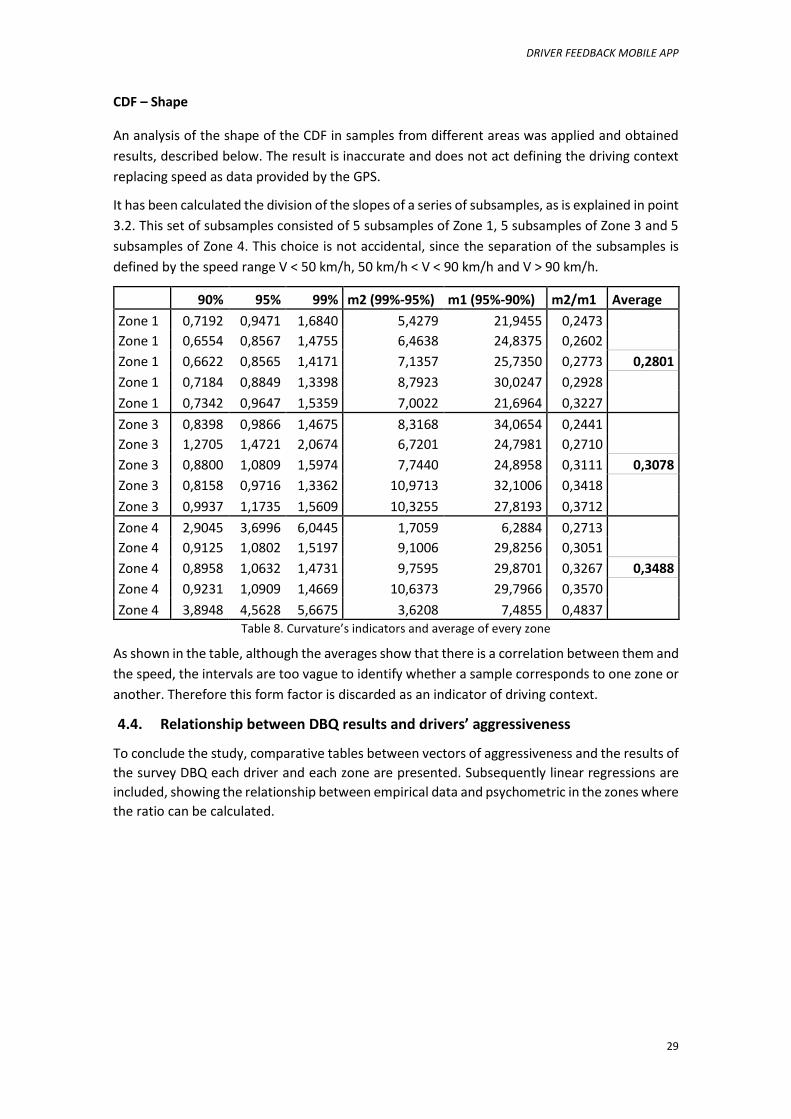
CDF – Shape
An analysis of the shape of the CDF in samples from different areas was applied and obtained
results, described below. The result is inaccurate and does not act defining the driving context
replacing speed as data provided by the GPS.
It has been calculated the division of the slopes of a series of subsamples, as is explained in point
3.2. This set of subsamples consisted of 5 subsamples of Zone 1, 5 subsamples of Zone 3 and 5
subsamples of Zone 4. This choice is not accidental, since the separation of the subsamples is
defined by the speed range V < 50 km/h, 50 km/h < V < 90 km/h and V > 90 km/h.
90% 95% 99% m2 (99%-95%) m1 (95%-90%) m2/m1 Average
Zone 1 0,7192 0,9471 1,6840 5,4279 21,9455 0,2473
Zone 1 0,6554 0,8567 1,4755 6,4638 24,8375 0,2602
Zone 1 0,6622 0,8565 1,4171 7,1357 25,7350 0,2773 0,2801
Zone 1 0,7184 0,8849 1,3398 8,7923 30,0247 0,2928
Zone 1 0,7342 0,9647 1,5359 7,0022 21,6964 0,3227
Zone 3 0,8398 0,9866 1,4675 8,3168 34,0654 0,2441
Zone 3 1,2705 1,4721 2,0674 6,7201 24,7981 0,2710
Zone 3 0,8800 1,0809 1,5974 7,7440 24,8958 0,3111 0,3078
Zone 3 0,8158 0,9716 1,3362 10,9713 32,1006 0,3418
Zone 3 0,9937 1,1735 1,5609 10,3255 27,8193 0,3712
Zone 4 2,9045 3,6996 6,0445 1,7059 6,2884 0,2713
Zone 4 0,9125 1,0802 1,5197 9,1006 29,8256 0,3051
Zone 4 0,8958 1,0632 1,4731 9,7595 29,8701 0,3267 0,3488
Zone 4 0,9231 1,0909 1,4669 10,6373 29,7966 0,3570
Zone 4 3,8948 4,5628 5,6675 3,6208 7,4855 0,4837 Table 8. Curvature’s indicators and average of every zone
As shown in the table, although the averages show that there is a correlation between them and
the speed, the intervals are too vague to identify whether a sample corresponds to one zone or
another. Therefore this form factor is discarded as an indicator of driving context.
4.4. Relationship between DBQ results and drivers’ aggressiveness
To conclude the study, comparative tables between vectors of aggressiveness and the results of
the survey DBQ each driver and each zone are presented. Subsequently linear regressions are
included, showing the relationship between empirical data and psychometric in the zones where
the ratio can be calculated.
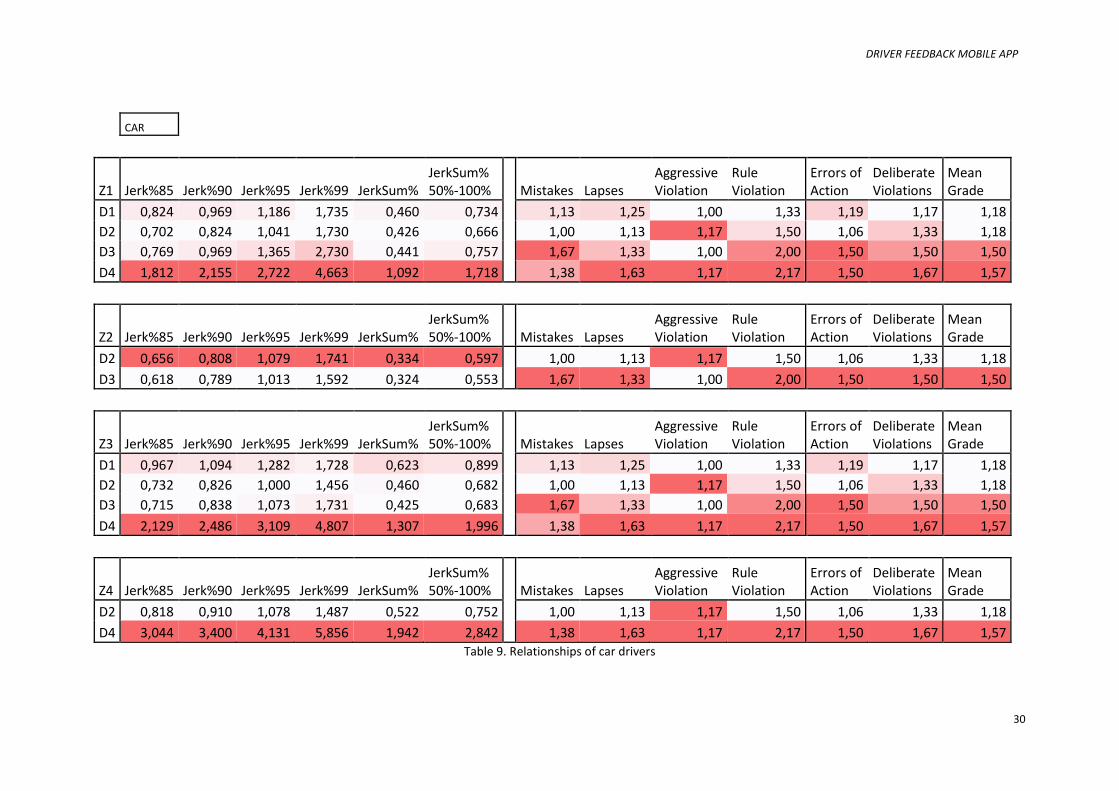
DRIVER FEEDBACK MOBILE APP
30
CAR
Z1 Jerk%85 Jerk%90 Jerk%95 Jerk%99 JerkSum% JerkSum% 50%-100% Mistakes Lapses
Aggressive Violation
Rule Violation
Errors of Action
Deliberate Violations
Mean Grade
D1 0,824 0,969 1,186 1,735 0,460 0,734 1,13 1,25 1,00 1,33 1,19 1,17 1,18
D2 0,702 0,824 1,041 1,730 0,426 0,666 1,00 1,13 1,17 1,50 1,06 1,33 1,18
D3 0,769 0,969 1,365 2,730 0,441 0,757 1,67 1,33 1,00 2,00 1,50 1,50 1,50
D4 1,812 2,155 2,722 4,663 1,092 1,718 1,38 1,63 1,17 2,17 1,50 1,67 1,57
Z2 Jerk%85 Jerk%90 Jerk%95 Jerk%99 JerkSum% JerkSum% 50%-100% Mistakes Lapses
Aggressive Violation
Rule Violation
Errors of Action
Deliberate Violations
Mean Grade
D2 0,656 0,808 1,079 1,741 0,334 0,597 1,00 1,13 1,17 1,50 1,06 1,33 1,18
D3 0,618 0,789 1,013 1,592 0,324 0,553 1,67 1,33 1,00 2,00 1,50 1,50 1,50
Z3 Jerk%85 Jerk%90 Jerk%95 Jerk%99 JerkSum% JerkSum% 50%-100% Mistakes Lapses
Aggressive Violation
Rule Violation
Errors of Action
Deliberate Violations
Mean Grade
D1 0,967 1,094 1,282 1,728 0,623 0,899 1,13 1,25 1,00 1,33 1,19 1,17 1,18
D2 0,732 0,826 1,000 1,456 0,460 0,682 1,00 1,13 1,17 1,50 1,06 1,33 1,18
D3 0,715 0,838 1,073 1,731 0,425 0,683 1,67 1,33 1,00 2,00 1,50 1,50 1,50
D4 2,129 2,486 3,109 4,807 1,307 1,996 1,38 1,63 1,17 2,17 1,50 1,67 1,57
Z4 Jerk%85 Jerk%90 Jerk%95 Jerk%99 JerkSum% JerkSum% 50%-100% Mistakes Lapses
Aggressive Violation
Rule Violation
Errors of Action
Deliberate Violations
Mean Grade
D2 0,818 0,910 1,078 1,487 0,522 0,752 1,00 1,13 1,17 1,50 1,06 1,33 1,18
D4 3,044 3,400 4,131 5,856 1,942 2,842 1,38 1,63 1,17 2,17 1,50 1,67 1,57 Table 9. Relationships of car drivers
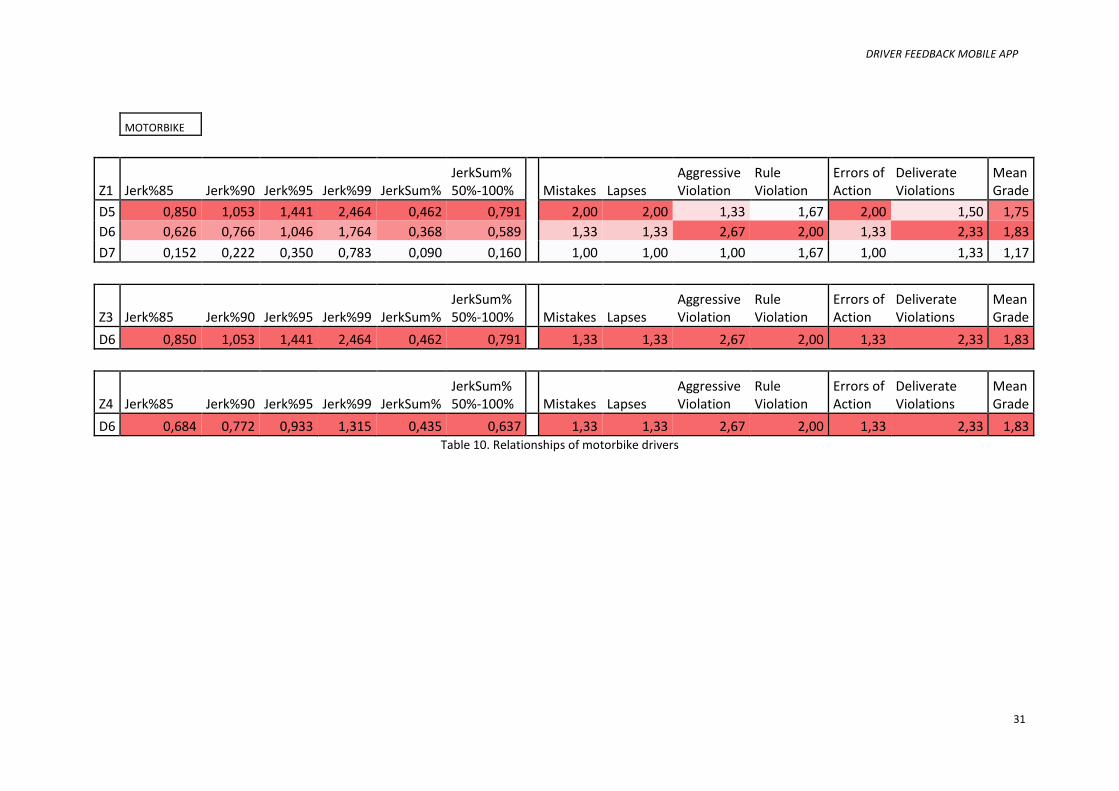
DRIVER FEEDBACK MOBILE APP
31
MOTORBIKE
Z1 Jerk%85 Jerk%90 Jerk%95 Jerk%99 JerkSum% JerkSum% 50%-100% Mistakes Lapses
Aggressive Violation
Rule Violation
Errors of Action
Deliverate Violations
Mean Grade
D5 0,850 1,053 1,441 2,464 0,462 0,791 2,00 2,00 1,33 1,67 2,00 1,50 1,75
D6 0,626 0,766 1,046 1,764 0,368 0,589 1,33 1,33 2,67 2,00 1,33 2,33 1,83
D7 0,152 0,222 0,350 0,783 0,090 0,160 1,00 1,00 1,00 1,67 1,00 1,33 1,17
Z3 Jerk%85 Jerk%90 Jerk%95 Jerk%99 JerkSum% JerkSum% 50%-100% Mistakes Lapses
Aggressive Violation
Rule Violation
Errors of Action
Deliverate Violations
Mean Grade
D6 0,850 1,053 1,441 2,464 0,462 0,791 1,33 1,33 2,67 2,00 1,33 2,33 1,83
Z4 Jerk%85 Jerk%90 Jerk%95 Jerk%99 JerkSum% JerkSum% 50%-100% Mistakes Lapses
Aggressive Violation
Rule Violation
Errors of Action
Deliverate Violations
Mean Grade
D6 0,684 0,772 0,933 1,315 0,435 0,637 1,33 1,33 2,67 2,00 1,33 2,33 1,83 Table 10. Relationships of motorbike drivers
DRIVER FEEDBACK MOBILE APP
32
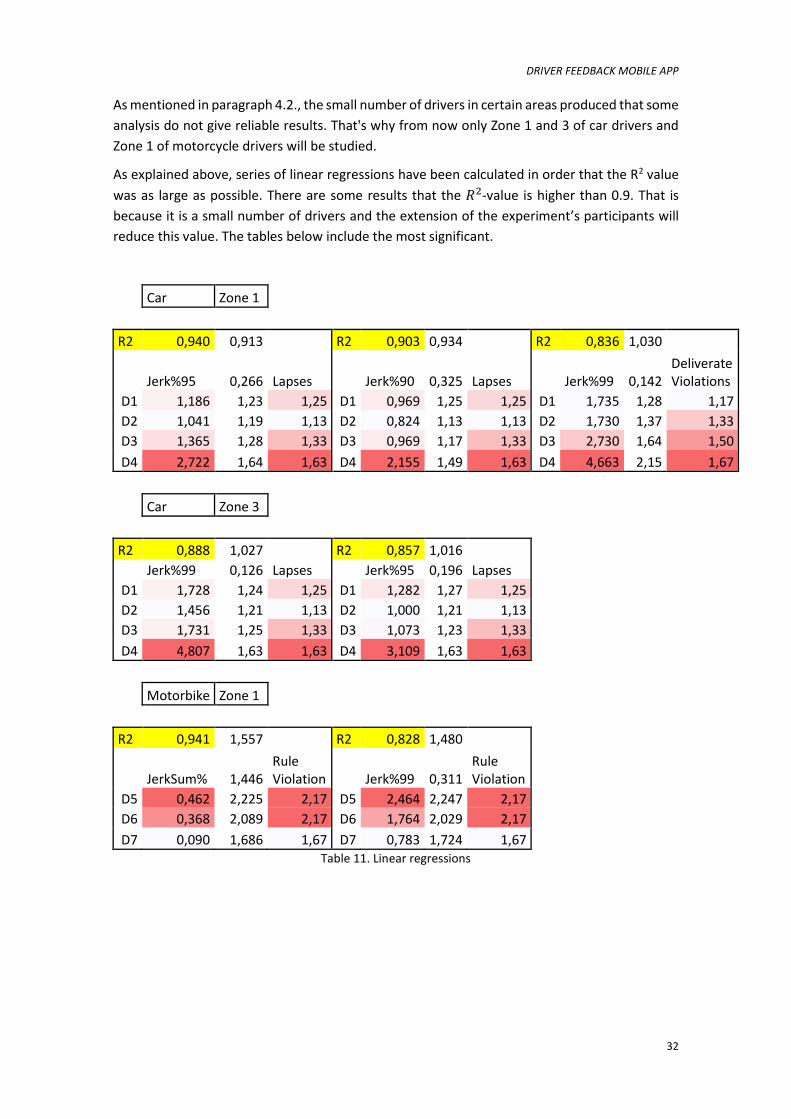
As mentioned in paragraph 4.2., the small number of drivers in certain areas produced that some
analysis do not give reliable results. That's why from now only Zone 1 and 3 of car drivers and
Zone 1 of motorcycle drivers will be studied.
As explained above, series of linear regressions have been calculated in order that the R2 value
was as large as possible. There are some results that the 𝑅2-value is higher than 0.9. That is
because it is a small number of drivers and the extension of the experiment’s participants will
reduce this value. The tables below include the most significant.
Car Zone 1
R2 0,940 0,913 R2 0,903 0,934 R2 0,836 1,030
Jerk%95 0,266 Lapses Jerk%90 0,325 Lapses Jerk%99 0,142 Deliverate Violations
D1 1,186 1,23 1,25 D1 0,969 1,25 1,25 D1 1,735 1,28 1,17
D2 1,041 1,19 1,13 D2 0,824 1,13 1,13 D2 1,730 1,37 1,33
D3 1,365 1,28 1,33 D3 0,969 1,17 1,33 D3 2,730 1,64 1,50
D4 2,722 1,64 1,63 D4 2,155 1,49 1,63 D4 4,663 2,15 1,67
Car Zone 3
R2 0,888 1,027 R2 0,857 1,016
Jerk%99 0,126 Lapses Jerk%95 0,196 Lapses
D1 1,728 1,24 1,25 D1 1,282 1,27 1,25
D2 1,456 1,21 1,13 D2 1,000 1,21 1,13
D3 1,731 1,25 1,33 D3 1,073 1,23 1,33
D4 4,807 1,63 1,63 D4 3,109 1,63 1,63
Motorbike Zone 1
R2 0,941 1,557 R2 0,828 1,480
JerkSum% 1,446 Rule Violation Jerk%99 0,311
Rule Violation
D5 0,462 2,225 2,17 D5 2,464 2,247 2,17
D6 0,368 2,089 2,17 D6 1,764 2,029 2,17
D7 0,090 1,686 1,67 D7 0,783 1,724 1,67 Table 11. Linear regressions
DRIVER FEEDBACK MOBILE APP
33
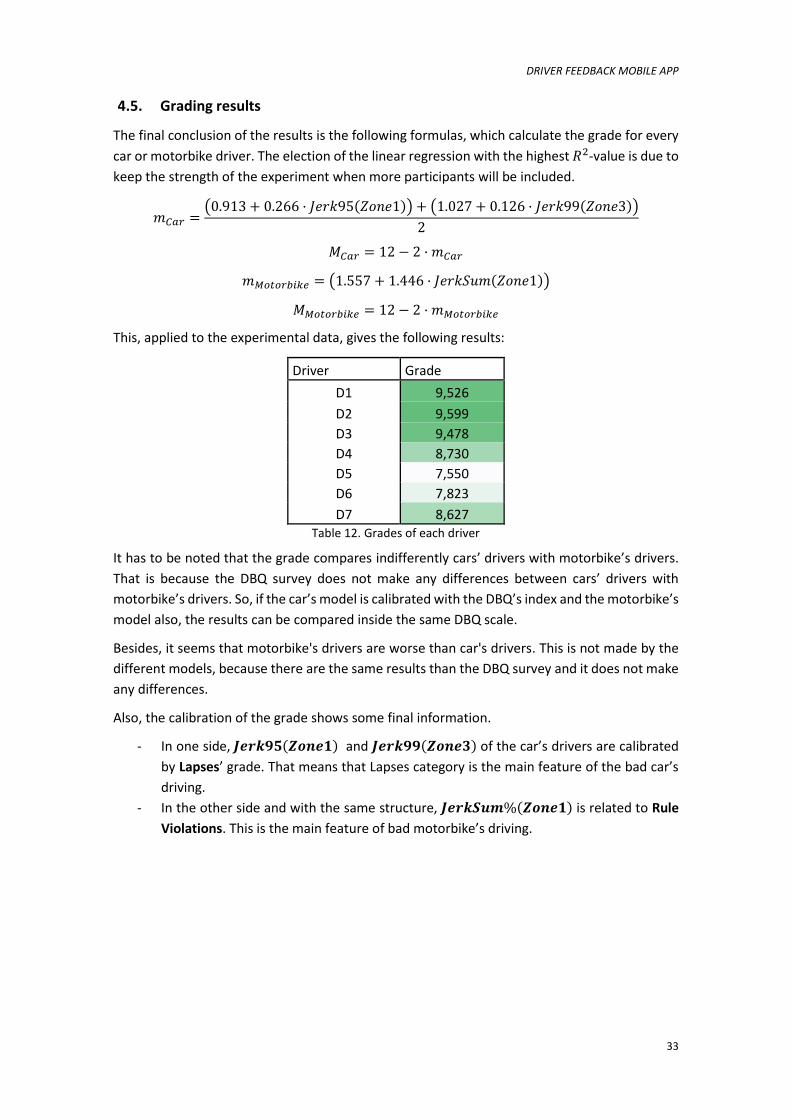
4.5. Grading results
The final conclusion of the results is the following formulas, which calculate the grade for every
car or motorbike driver. The election of the linear regression with the highest 𝑅2-value is due to
keep the strength of the experiment when more participants will be included.
𝑚𝐶𝑎𝑟 =(0.913 + 0.266 · 𝐽𝑒𝑟𝑘95(𝑍𝑜𝑛𝑒1)) + (1.027 + 0.126 · 𝐽𝑒𝑟𝑘99(𝑍𝑜𝑛𝑒3))
2
𝑀𝐶𝑎𝑟 = 12 − 2 · 𝑚𝐶𝑎𝑟
𝑚𝑀𝑜𝑡𝑜𝑟𝑏𝑖𝑘𝑒 = (1.557 + 1.446 · 𝐽𝑒𝑟𝑘𝑆𝑢𝑚(𝑍𝑜𝑛𝑒1))
𝑀𝑀𝑜𝑡𝑜𝑟𝑏𝑖𝑘𝑒 = 12 − 2 · 𝑚𝑀𝑜𝑡𝑜𝑟𝑏𝑖𝑘𝑒
This, applied to the experimental data, gives the following results:
Driver Grade
D1 9,526
D2 9,599
D3 9,478
D4 8,730
D5 7,550
D6 7,823
D7 8,627 Table 12. Grades of each driver
It has to be noted that the grade compares indifferently cars’ drivers with motorbike’s drivers.
That is because the DBQ survey does not make any differences between cars’ drivers with
motorbike’s drivers. So, if the car’s model is calibrated with the DBQ’s index and the motorbike’s
model also, the results can be compared inside the same DBQ scale.
Besides, it seems that motorbike's drivers are worse than car's drivers. This is not made by the
different models, because there are the same results than the DBQ survey and it does not make
any differences.
Also, the calibration of the grade shows some final information.
- In one side, 𝑱𝒆𝒓𝒌𝟗𝟓(𝒁𝒐𝒏𝒆𝟏) and 𝑱𝒆𝒓𝒌𝟗𝟗(𝒁𝒐𝒏𝒆𝟑) of the car’s drivers are calibrated
by Lapses’ grade. That means that Lapses category is the main feature of the bad car’s
driving.
- In the other side and with the same structure, 𝑱𝒆𝒓𝒌𝑺𝒖𝒎%(𝒁𝒐𝒏𝒆𝟏) is related to Rule
Violations. This is the main feature of bad motorbike’s driving.
DRIVER FEEDBACK MOBILE APP
34
5. CONCLUSIONS
Main findings
This thesis has defined an experiment in order to measure participants’ driving, which has made
a manual on the use of data collection application and a survey as a psychometric instrument.
On the treatment of the data in this study, it should be noted that, from each of the samples
obtained from motion sensors mobiles, two indicators have been taken: the free speed (𝑉𝑓𝑟𝑒𝑒),
and the percentage of time in which the vehicle is stopped (%𝑉=0). And from these driving
context has been established, which is useful for comparing samples that come from the same
environment. Thus, from the comparison of these data by recording driving, it got a series of
indicators to establish a note of driving depending on jerk as a measure of the aggressive driving.
Indicators later were compared with the psychometric survey of each user to establish a
relationship.
Therefore, as seen in this study, it has been demonstrated the relationship between the data
obtained through the survey DBQ, which provides psychological outcomes, and data obtained
through phone’s sensors that provide empirical results. Thus, in cases in which the survey data
show a profile of unsafe driver, the results of the data from the accelerometers also confirm this
fact. In this regard, it should be noted that using this particular study and analysis of the
relationship between the empirical instrument and the psychometric one (survey). The record
of driving has been set a pattern from which to assess driving a subject on a scale from 4 to 10,
which is the fourth driver sharper profile (i.e., with more braking, acceleration and sudden
twists); 10 while the driver would be smoother. Also, the calibration of the grade shows which
are the main features of bad driving, lapses in car’s drivers and rule violations in motorbike’s
drivers. However, it should be noted that the strength of the experiment is low, as it is based on
a small sample, as the number of drivers who participated in the experiment was rather low.
Further research
In this regard, it should be noted that even being able to demonstrate a relationship between
the survey and the analysis of driving data, as well as having been able to establish a pattern for
assessing driving could provide a tool self-assessment of drivers; this study has found that there
is still a long way to go from the findings of the analysis. On one hand, it would be necessary to
improve the robustness of the experiment having a higher sample; certainly, if it could count on
the resources of a public institution or private company, it could be possible to create a
completely customized application for this purpose, and have a system to facilitate participation
and dissemination in order to ensure a broad sample of users drivers.
Therefore, with the existence of a specific application designed for the sole purpose of obtaining
the necessary data driving through the sensors of the smartphone, the experiment could be
expanded to Android devices. Moreover, it should also be sensitive to analysis of certain parts
like the choice of the duration of the samples or the sampling frequency. It can be considered
somewhat arbitrary decision that the samples are 5 minutes instead of 2, 3 or 10 minutes, or
justify the fact 10Hz sampling rate -the highest considering comments about the veracity of the
data- towards lower frequencies that involve less thick data and less battery consumption.
Finally, there is another important point about enough processing of data recorded in the pipes
that should be taken into account for future studies: the search for the separation of jerks XY in
DRIVER FEEDBACK MOBILE APP
35
jerks braking-and-acceleration and rotation jerks could bring greater precision to the results
obtained and greater control of reality.
There is another experiment’s limit that could be studied, the survey data. In this thesis only
DBQ data was compared to jerk data. Survey’s questions could be used to define new indicators
and compare them to jerk data.
Final conclusion
Thus, through this thesis is expected to have provided a new avenue of study, with the aim of
setting up a method that facilitates learning and self-assessment of driving users. A scientific
formula for assessing the human factor that could make possible the existence of applications
or programs available to drivers to allow constant improvement in driving and could arrive to
act on the human factor -the greatest cause of accidents- still, even avoiding nearby accidents
and, therefore, the accident rate.
DRIVER FEEDBACK MOBILE APP
36
6. ACKNOWLEDGEMENTS
The result of this thesis is due in large part to the participation of people who have contributed
to it through their advice, help in the approach and method of data collection, and support.
I want to especially thank you to:
JuanPe Roldán, for his support as a partner study
Bernat Garcia, for his mathematical contribution
Cesar Trapote, to facilitate me the way and let me know the survey DBQ
Manuel Villarroya, for his precise corrections
Driver participants, both those who have been part of the sample as those who have been
excluded, without whom this study would not have been possible
My family, for their interest, contribution and support
Àngels Valls, for their inexhaustible contributions, patience and support
And, especially, thank you to the tutor of this thesis Francesc Soriguera, for his critical monitoring
and his countless suggestions. Certainly his demand has done better this study.
My thanks to each and every one of those people who, in one way or another, have made this
job what it is.
DRIVER FEEDBACK MOBILE APP
37
7. REFERENCES
Bagdadi, O., & Várhelyi, A. (2011). Jerky driving - An indicator of accident proneness? Accident Analysis and Prevention, 43(4), 1359–1363. http://doi.org/10.1016/j.aap.2011.02.009
Helman, S., & Reed, N. (2015). Validation of the driver behaviour questionnaire using behavioural data from an instrumented vehicle and high-fidelity driving simulator. Accident Analysis & Prevention, 75, 245–251. http://doi.org/10.1016/j.aap.2014.12.008
Leandro, M. (2008). Tres instrumentos para el estudio de la conducta de conducir (p. 19).
Noland, R. B. (2013). From theory to practice in road safety policy: Understanding risk versus mobility. Research in Transportation Economics, 43(1), 71–84. http://doi.org/10.1016/j.retrec.2012.12.007
Parker, D., Reason, J. T., Manstead, A. S. R., & Stradling, S. G. (1995). Driving errors, driving violations and accident involvement. Ergonomics, 38(5), 1036–1048. http://doi.org/10.1080/00140139508925170
Rowe, R., Roman, G. D., McKenna, F. P., Barker, E., & Poulter, D. (2015). Measuring errors and violations on the road: A bifactor modeling approach to the Driver Behavior Questionnaire. Accident Analysis & Prevention, 74, 118–125. http://doi.org/10.1016/j.aap.2014.10.012
Servei Català de Trànsit. (2014). 2014 Statistical yearbook of traffic accidents in Catalonia.
Vanderbilt, T. (2009). Traffic: Why we drive the way we do (and what it says about us). Penguin Books Limited.
Zapf, D., & Reason, J. T. (1994). Introduction- human errors and error handling. Applied Psychology - An International Review - Psychologie Appliquee - Revue Internationale, 43(4), 427–432. http://doi.org/10.1111/j.1464-0597.1994.tb00838.x
Zhao, G., & Wu, C. (2012). The effects of driver identity on driving safety in a retrospective feedback system. Accident Analysis and Prevention, 45, 354–365. http://doi.org/10.1016/j.aap.2011.08.002

DRIVER FEEDBACK MOBILE APP
38
8. APPENDIX

DRIVER FEEDBACK MOBILE APP
39
8.1. Experiment Manual
As follows, the experiment manual is included. It is not the real version because the drivers’
language was Catalan.
Explanation iPhone English
Hi,
I’m working in my final master thesis, in road safety. The experiment is simple; it’s based on
recording accelerations to which vehicles are subjected in the course of any journey. Once
getting the data, I’ll turn them into statistical variables to find the connection with a survey about
the driver profile and his historic record of traffic accidents and fines. If you participate, you
record the data of only one vehicle.
Steps to follow:
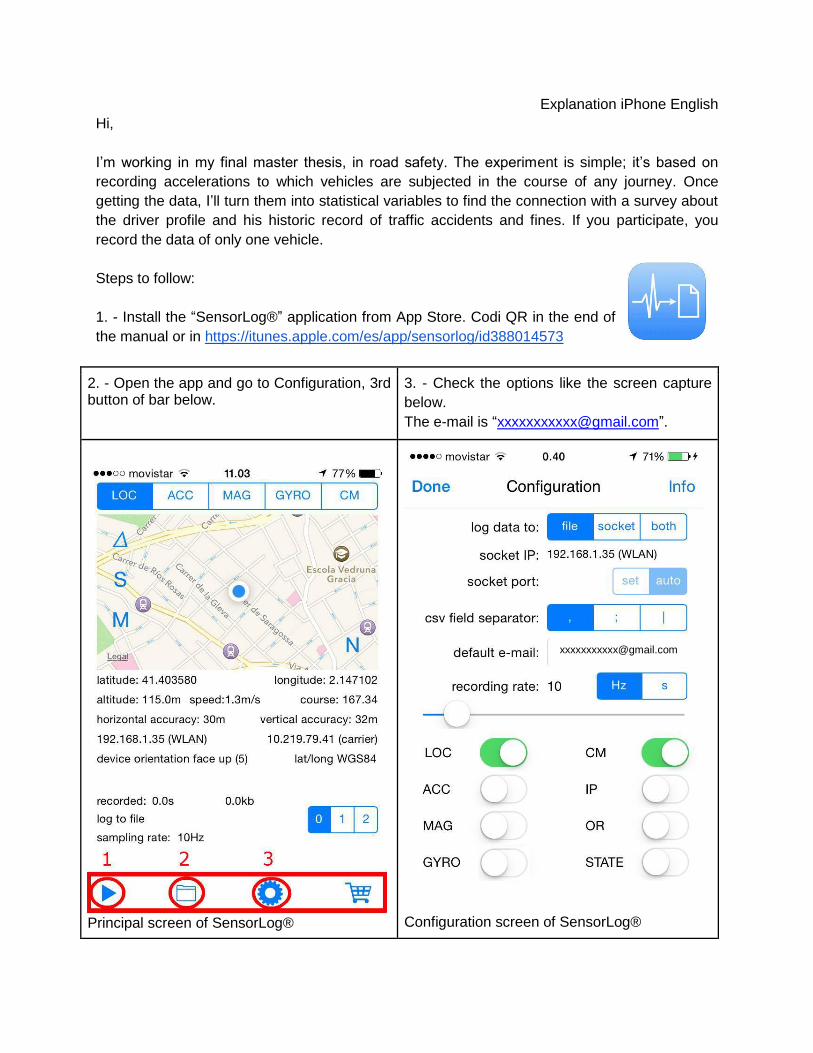
1. - Install the “SensorLog®” application from App Store. Codi QR in the end of
the manual or in https://itunes.apple.com/es/app/sensorlog/id388014573
3. - Check the options like the screen capture
below.
The e-mail is “[email protected]”.
2. - Open the app and go to Configuration, 3rd button of bar below.
Configuration screen of SensorLog®
Principal screen of SensorLog®
4.- Before starting the vehicle, go to the application, active the recording (1st button on the
bottom bar) and without leaving the application or closing the screen, let the iPhone somewhere
where it will not move during the road, no matter the position. Once you are ready, then you can
start the car and drive.
5. - Once you're parked, stop recording by clicking the same button that activated the recording.
You can close the application.
6. - Then, with mobile data or Wi-Fi, reopen the application and send me the data by pressing
the 2nd button on the bottom bar. It will show you the list of recorded files, click on the data
you've recorded and send it by e-mail.
7. – Before or after recording the data, you should answer the survey. QR code below.
Link: http://goo.gl/forms/cgZMq2u0Rq
QR code:
App SensorLog for iPhone English survey
Thank you very much for taking part.
Enric Miralles

DRIVER FEEDBACK MOBILE APP
42
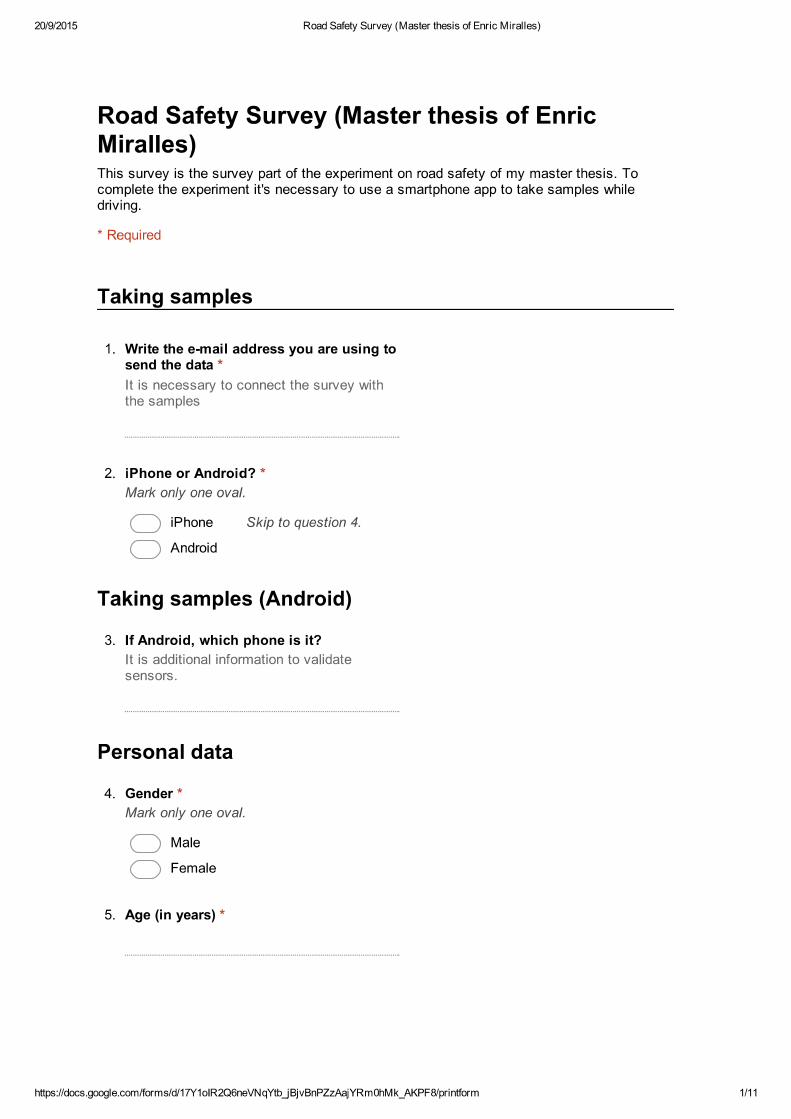
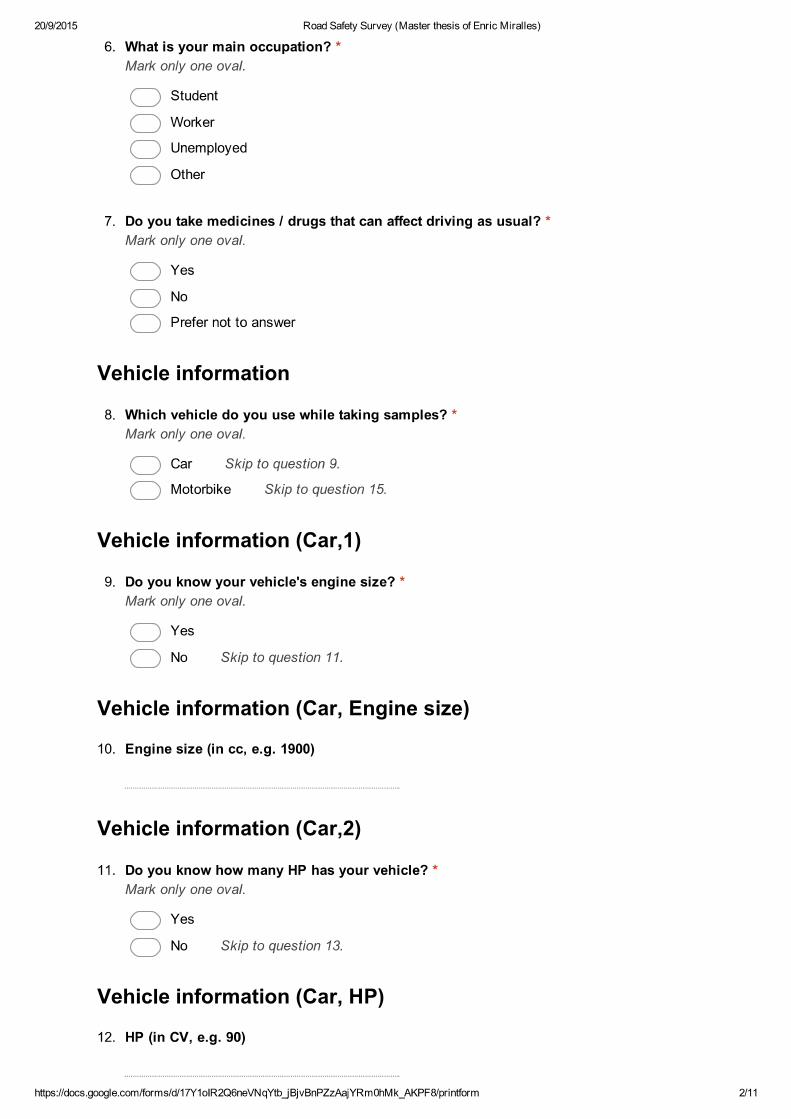
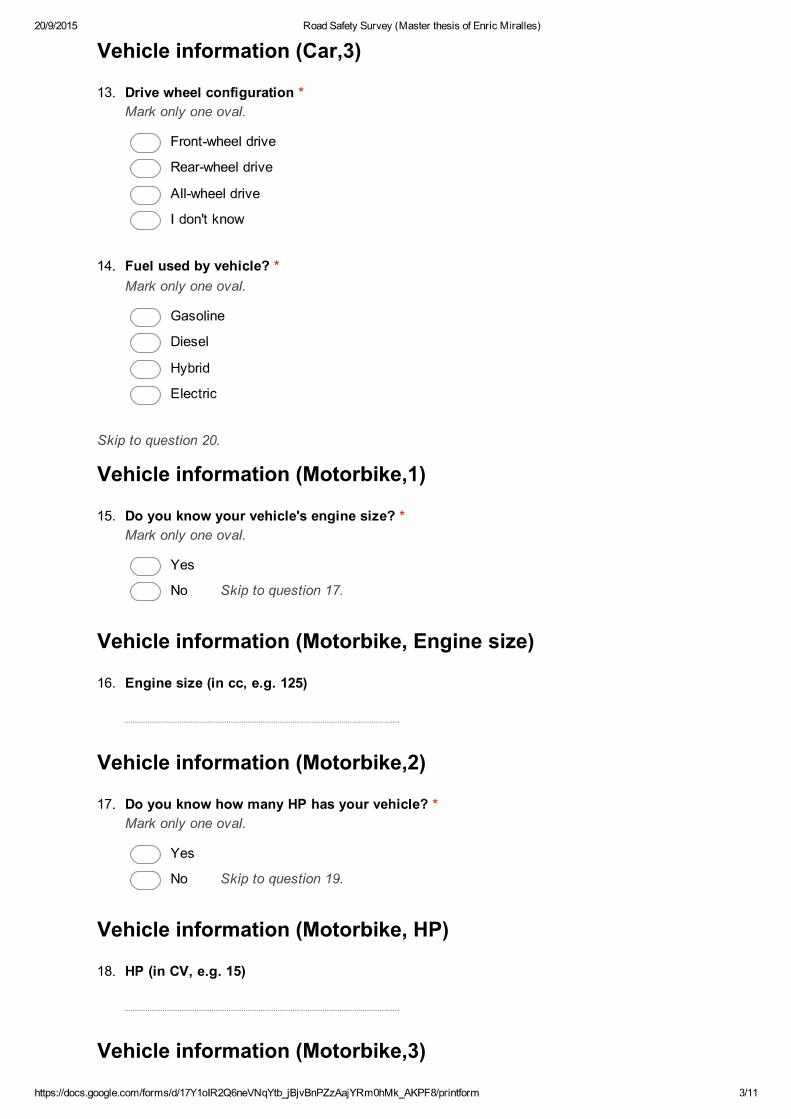
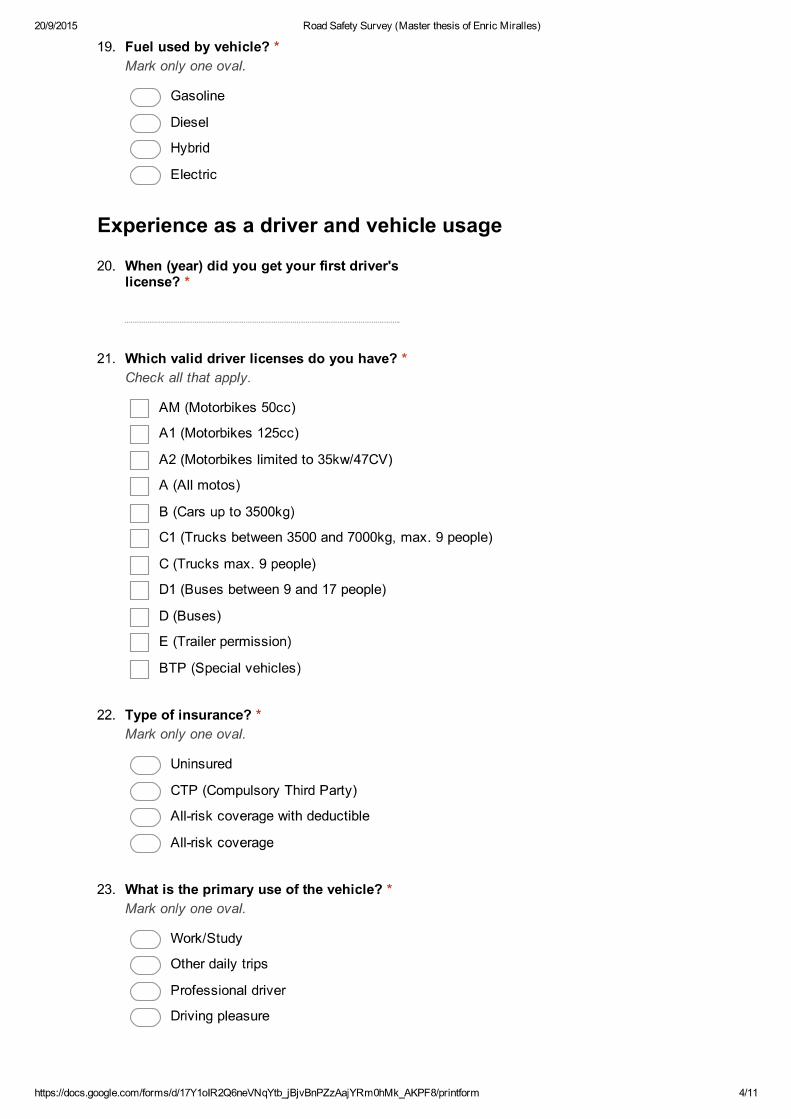
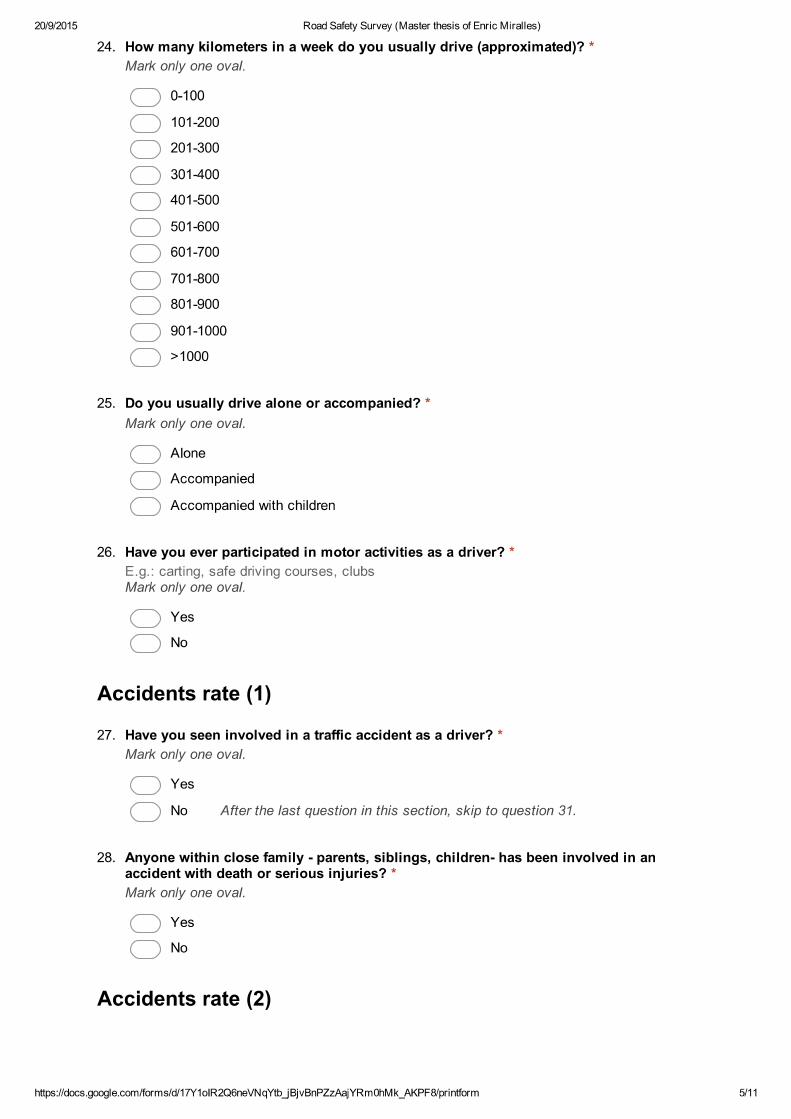
8.2. Survey
The following pages contain the English version of the survey. Likewise the manual, the language
of the survey was Catalan and this is the translation of the original one.

DRIVER FEEDBACK MOBILE APP
54
8.3. Jerk Samples
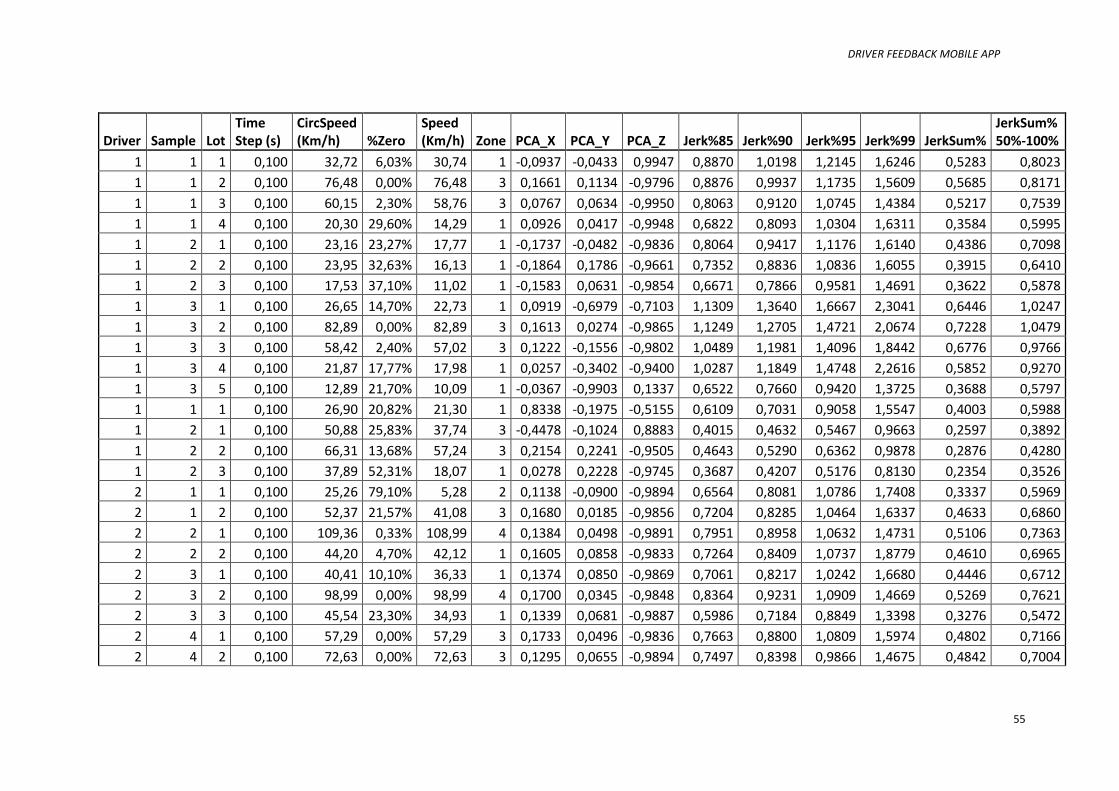
Here are included the results of all the treatment of the samples. It is structured as follows:
driver, sample and subsample (lot, part of the sample). In every subsample is calculated the time
step, because even that was required to record ten data each second, the results show that it
has some precision error and this is one of the most important variables of the experiment. The
results include also the calculus of the free speed and the percent of stops, the classification of
these variables inside the driving contexts, the PCA resulting vector that shows the orientation
of the smartphone, and the different values of the CDF curve selected to define the aggressive
vector.
DRIVER FEEDBACK MOBILE APP
55
Driver Sample Lot Time Step (s)
CircSpeed (Km/h) %Zero
Speed (Km/h) Zone PCA_X PCA_Y PCA_Z Jerk%85 Jerk%90 Jerk%95 Jerk%99 JerkSum%
JerkSum% 50%-100%
1 1 1 0,100 32,72 6,03% 30,74 1 -0,0937 -0,0433 0,9947 0,8870 1,0198 1,2145 1,6246 0,5283 0,8023
1 1 2 0,100 76,48 0,00% 76,48 3 0,1661 0,1134 -0,9796 0,8876 0,9937 1,1735 1,5609 0,5685 0,8171
1 1 3 0,100 60,15 2,30% 58,76 3 0,0767 0,0634 -0,9950 0,8063 0,9120 1,0745 1,4384 0,5217 0,7539
1 1 4 0,100 20,30 29,60% 14,29 1 0,0926 0,0417 -0,9948 0,6822 0,8093 1,0304 1,6311 0,3584 0,5995
1 2 1 0,100 23,16 23,27% 17,77 1 -0,1737 -0,0482 -0,9836 0,8064 0,9417 1,1176 1,6140 0,4386 0,7098
1 2 2 0,100 23,95 32,63% 16,13 1 -0,1864 0,1786 -0,9661 0,7352 0,8836 1,0836 1,6055 0,3915 0,6410
1 2 3 0,100 17,53 37,10% 11,02 1 -0,1583 0,0631 -0,9854 0,6671 0,7866 0,9581 1,4691 0,3622 0,5878
1 3 1 0,100 26,65 14,70% 22,73 1 0,0919 -0,6979 -0,7103 1,1309 1,3640 1,6667 2,3041 0,6446 1,0247
1 3 2 0,100 82,89 0,00% 82,89 3 0,1613 0,0274 -0,9865 1,1249 1,2705 1,4721 2,0674 0,7228 1,0479
1 3 3 0,100 58,42 2,40% 57,02 3 0,1222 -0,1556 -0,9802 1,0489 1,1981 1,4096 1,8442 0,6776 0,9766
1 3 4 0,100 21,87 17,77% 17,98 1 0,0257 -0,3402 -0,9400 1,0287 1,1849 1,4748 2,2616 0,5852 0,9270
1 3 5 0,100 12,89 21,70% 10,09 1 -0,0367 -0,9903 0,1337 0,6522 0,7660 0,9420 1,3725 0,3688 0,5797
1 1 1 0,100 26,90 20,82% 21,30 1 0,8338 -0,1975 -0,5155 0,6109 0,7031 0,9058 1,5547 0,4003 0,5988
1 2 1 0,100 50,88 25,83% 37,74 3 -0,4478 -0,1024 0,8883 0,4015 0,4632 0,5467 0,9663 0,2597 0,3892
1 2 2 0,100 66,31 13,68% 57,24 3 0,2154 0,2241 -0,9505 0,4643 0,5290 0,6362 0,9878 0,2876 0,4280
1 2 3 0,100 37,89 52,31% 18,07 1 0,0278 0,2228 -0,9745 0,3687 0,4207 0,5176 0,8130 0,2354 0,3526
2 1 1 0,100 25,26 79,10% 5,28 2 0,1138 -0,0900 -0,9894 0,6564 0,8081 1,0786 1,7408 0,3337 0,5969
2 1 2 0,100 52,37 21,57% 41,08 3 0,1680 0,0185 -0,9856 0,7204 0,8285 1,0464 1,6337 0,4633 0,6860
2 2 1 0,100 109,36 0,33% 108,99 4 0,1384 0,0498 -0,9891 0,7951 0,8958 1,0632 1,4731 0,5106 0,7363
2 2 2 0,100 44,20 4,70% 42,12 1 0,1605 0,0858 -0,9833 0,7264 0,8409 1,0737 1,8779 0,4610 0,6965
2 3 1 0,100 40,41 10,10% 36,33 1 0,1374 0,0850 -0,9869 0,7061 0,8217 1,0242 1,6680 0,4446 0,6712
2 3 2 0,100 98,99 0,00% 98,99 4 0,1700 0,0345 -0,9848 0,8364 0,9231 1,0909 1,4669 0,5269 0,7621
2 3 3 0,100 45,54 23,30% 34,93 1 0,1339 0,0681 -0,9887 0,5986 0,7184 0,8849 1,3398 0,3276 0,5472
2 4 1 0,100 57,29 0,00% 57,29 3 0,1733 0,0496 -0,9836 0,7663 0,8800 1,0809 1,5974 0,4802 0,7166
2 4 2 0,100 72,63 0,00% 72,63 3 0,1295 0,0655 -0,9894 0,7497 0,8398 0,9866 1,4675 0,4842 0,7004
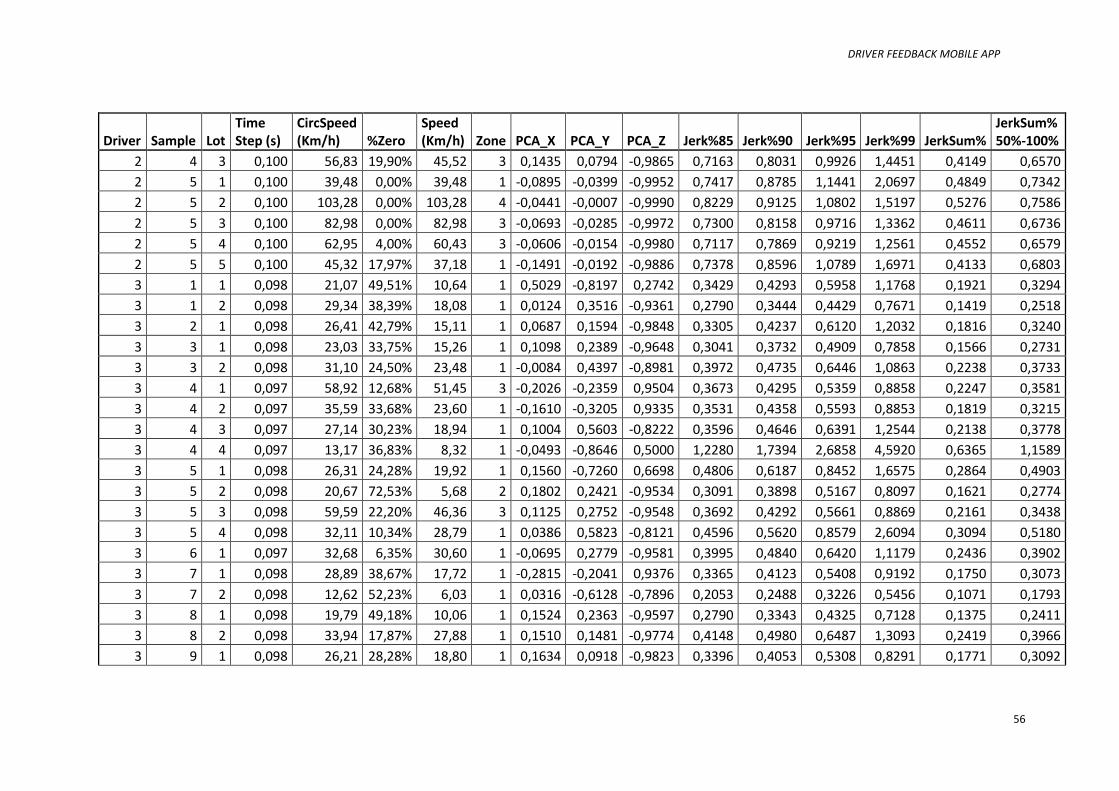
DRIVER FEEDBACK MOBILE APP
56
Driver Sample Lot Time Step (s)
CircSpeed (Km/h) %Zero
Speed (Km/h) Zone PCA_X PCA_Y PCA_Z Jerk%85 Jerk%90 Jerk%95 Jerk%99 JerkSum%
JerkSum% 50%-100%
2 4 3 0,100 56,83 19,90% 45,52 3 0,1435 0,0794 -0,9865 0,7163 0,8031 0,9926 1,4451 0,4149 0,6570
2 5 1 0,100 39,48 0,00% 39,48 1 -0,0895 -0,0399 -0,9952 0,7417 0,8785 1,1441 2,0697 0,4849 0,7342
2 5 2 0,100 103,28 0,00% 103,28 4 -0,0441 -0,0007 -0,9990 0,8229 0,9125 1,0802 1,5197 0,5276 0,7586
2 5 3 0,100 82,98 0,00% 82,98 3 -0,0693 -0,0285 -0,9972 0,7300 0,8158 0,9716 1,3362 0,4611 0,6736
2 5 4 0,100 62,95 4,00% 60,43 3 -0,0606 -0,0154 -0,9980 0,7117 0,7869 0,9219 1,2561 0,4552 0,6579
2 5 5 0,100 45,32 17,97% 37,18 1 -0,1491 -0,0192 -0,9886 0,7378 0,8596 1,0789 1,6971 0,4133 0,6803
3 1 1 0,098 21,07 49,51% 10,64 1 0,5029 -0,8197 0,2742 0,3429 0,4293 0,5958 1,1768 0,1921 0,3294
3 1 2 0,098 29,34 38,39% 18,08 1 0,0124 0,3516 -0,9361 0,2790 0,3444 0,4429 0,7671 0,1419 0,2518
3 2 1 0,098 26,41 42,79% 15,11 1 0,0687 0,1594 -0,9848 0,3305 0,4237 0,6120 1,2032 0,1816 0,3240
3 3 1 0,098 23,03 33,75% 15,26 1 0,1098 0,2389 -0,9648 0,3041 0,3732 0,4909 0,7858 0,1566 0,2731
3 3 2 0,098 31,10 24,50% 23,48 1 -0,0084 0,4397 -0,8981 0,3972 0,4735 0,6446 1,0863 0,2238 0,3733
3 4 1 0,097 58,92 12,68% 51,45 3 -0,2026 -0,2359 0,9504 0,3673 0,4295 0,5359 0,8858 0,2247 0,3581
3 4 2 0,097 35,59 33,68% 23,60 1 -0,1610 -0,3205 0,9335 0,3531 0,4358 0,5593 0,8853 0,1819 0,3215
3 4 3 0,097 27,14 30,23% 18,94 1 0,1004 0,5603 -0,8222 0,3596 0,4646 0,6391 1,2544 0,2138 0,3778
3 4 4 0,097 13,17 36,83% 8,32 1 -0,0493 -0,8646 0,5000 1,2280 1,7394 2,6858 4,5920 0,6365 1,1589
3 5 1 0,098 26,31 24,28% 19,92 1 0,1560 -0,7260 0,6698 0,4806 0,6187 0,8452 1,6575 0,2864 0,4903
3 5 2 0,098 20,67 72,53% 5,68 2 0,1802 0,2421 -0,9534 0,3091 0,3898 0,5167 0,8097 0,1621 0,2774
3 5 3 0,098 59,59 22,20% 46,36 3 0,1125 0,2752 -0,9548 0,3692 0,4292 0,5661 0,8869 0,2161 0,3438
3 5 4 0,098 32,11 10,34% 28,79 1 0,0386 0,5823 -0,8121 0,4596 0,5620 0,8579 2,6094 0,3094 0,5180
3 6 1 0,097 32,68 6,35% 30,60 1 -0,0695 0,2779 -0,9581 0,3995 0,4840 0,6420 1,1179 0,2436 0,3902
3 7 1 0,098 28,89 38,67% 17,72 1 -0,2815 -0,2041 0,9376 0,3365 0,4123 0,5408 0,9192 0,1750 0,3073
3 7 2 0,098 12,62 52,23% 6,03 1 0,0316 -0,6128 -0,7896 0,2053 0,2488 0,3226 0,5456 0,1071 0,1793
3 8 1 0,098 19,79 49,18% 10,06 1 0,1524 0,2363 -0,9597 0,2790 0,3343 0,4325 0,7128 0,1375 0,2411
3 8 2 0,098 33,94 17,87% 27,88 1 0,1510 0,1481 -0,9774 0,4148 0,4980 0,6487 1,3093 0,2419 0,3966
3 9 1 0,098 26,21 28,28% 18,80 1 0,1634 0,0918 -0,9823 0,3396 0,4053 0,5308 0,8291 0,1771 0,3092
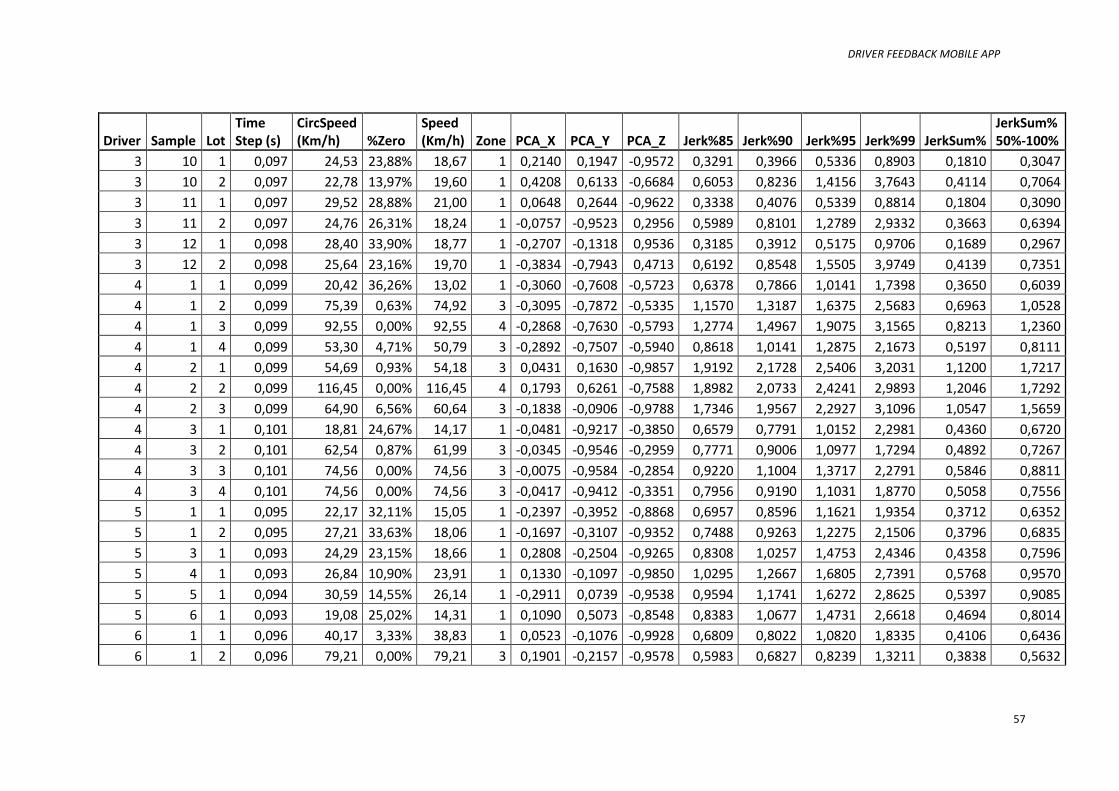
DRIVER FEEDBACK MOBILE APP
57
Driver Sample Lot Time Step (s)
CircSpeed (Km/h) %Zero
Speed (Km/h) Zone PCA_X PCA_Y PCA_Z Jerk%85 Jerk%90 Jerk%95 Jerk%99 JerkSum%
JerkSum% 50%-100%
3 10 1 0,097 24,53 23,88% 18,67 1 0,2140 0,1947 -0,9572 0,3291 0,3966 0,5336 0,8903 0,1810 0,3047
3 10 2 0,097 22,78 13,97% 19,60 1 0,4208 0,6133 -0,6684 0,6053 0,8236 1,4156 3,7643 0,4114 0,7064
3 11 1 0,097 29,52 28,88% 21,00 1 0,0648 0,2644 -0,9622 0,3338 0,4076 0,5339 0,8814 0,1804 0,3090
3 11 2 0,097 24,76 26,31% 18,24 1 -0,0757 -0,9523 0,2956 0,5989 0,8101 1,2789 2,9332 0,3663 0,6394
3 12 1 0,098 28,40 33,90% 18,77 1 -0,2707 -0,1318 0,9536 0,3185 0,3912 0,5175 0,9706 0,1689 0,2967
3 12 2 0,098 25,64 23,16% 19,70 1 -0,3834 -0,7943 0,4713 0,6192 0,8548 1,5505 3,9749 0,4139 0,7351
4 1 1 0,099 20,42 36,26% 13,02 1 -0,3060 -0,7608 -0,5723 0,6378 0,7866 1,0141 1,7398 0,3650 0,6039
4 1 2 0,099 75,39 0,63% 74,92 3 -0,3095 -0,7872 -0,5335 1,1570 1,3187 1,6375 2,5683 0,6963 1,0528
4 1 3 0,099 92,55 0,00% 92,55 4 -0,2868 -0,7630 -0,5793 1,2774 1,4967 1,9075 3,1565 0,8213 1,2360
4 1 4 0,099 53,30 4,71% 50,79 3 -0,2892 -0,7507 -0,5940 0,8618 1,0141 1,2875 2,1673 0,5197 0,8111
4 2 1 0,099 54,69 0,93% 54,18 3 0,0431 0,1630 -0,9857 1,9192 2,1728 2,5406 3,2031 1,1200 1,7217
4 2 2 0,099 116,45 0,00% 116,45 4 0,1793 0,6261 -0,7588 1,8982 2,0733 2,4241 2,9893 1,2046 1,7292
4 2 3 0,099 64,90 6,56% 60,64 3 -0,1838 -0,0906 -0,9788 1,7346 1,9567 2,2927 3,1096 1,0547 1,5659
4 3 1 0,101 18,81 24,67% 14,17 1 -0,0481 -0,9217 -0,3850 0,6579 0,7791 1,0152 2,2981 0,4360 0,6720
4 3 2 0,101 62,54 0,87% 61,99 3 -0,0345 -0,9546 -0,2959 0,7771 0,9006 1,0977 1,7294 0,4892 0,7267
4 3 3 0,101 74,56 0,00% 74,56 3 -0,0075 -0,9584 -0,2854 0,9220 1,1004 1,3717 2,2791 0,5846 0,8811
4 3 4 0,101 74,56 0,00% 74,56 3 -0,0417 -0,9412 -0,3351 0,7956 0,9190 1,1031 1,8770 0,5058 0,7556
5 1 1 0,095 22,17 32,11% 15,05 1 -0,2397 -0,3952 -0,8868 0,6957 0,8596 1,1621 1,9354 0,3712 0,6352
5 1 2 0,095 27,21 33,63% 18,06 1 -0,1697 -0,3107 -0,9352 0,7488 0,9263 1,2275 2,1506 0,3796 0,6835
5 3 1 0,093 24,29 23,15% 18,66 1 0,2808 -0,2504 -0,9265 0,8308 1,0257 1,4753 2,4346 0,4358 0,7596
5 4 1 0,093 26,84 10,90% 23,91 1 0,1330 -0,1097 -0,9850 1,0295 1,2667 1,6805 2,7391 0,5768 0,9570
5 5 1 0,094 30,59 14,55% 26,14 1 -0,2911 0,0739 -0,9538 0,9594 1,1741 1,6272 2,8625 0,5397 0,9085
5 6 1 0,093 19,08 25,02% 14,31 1 0,1090 0,5073 -0,8548 0,8383 1,0677 1,4731 2,6618 0,4694 0,8014
6 1 1 0,096 40,17 3,33% 38,83 1 0,0523 -0,1076 -0,9928 0,6809 0,8022 1,0820 1,8335 0,4106 0,6436
6 1 2 0,096 79,21 0,00% 79,21 3 0,1901 -0,2157 -0,9578 0,5983 0,6827 0,8239 1,3211 0,3838 0,5632
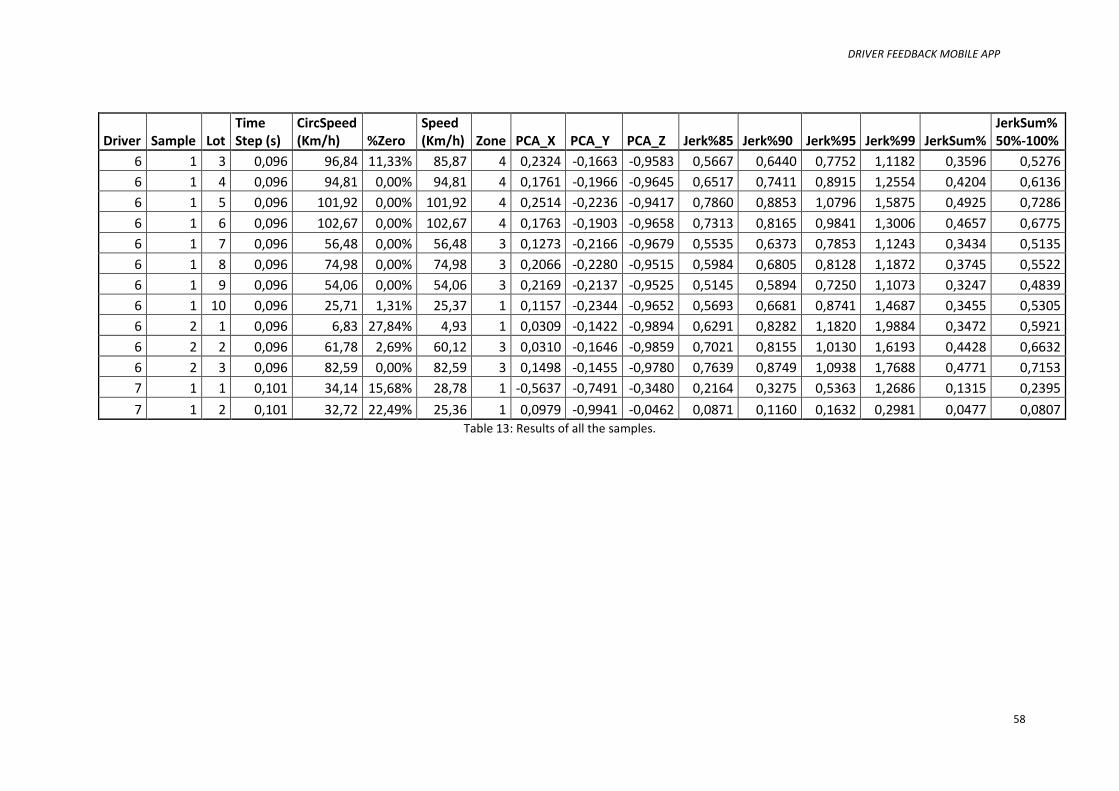
DRIVER FEEDBACK MOBILE APP
58
Driver Sample Lot Time Step (s)
CircSpeed (Km/h) %Zero
Speed (Km/h) Zone PCA_X PCA_Y PCA_Z Jerk%85 Jerk%90 Jerk%95 Jerk%99 JerkSum%
JerkSum% 50%-100%
6 1 3 0,096 96,84 11,33% 85,87 4 0,2324 -0,1663 -0,9583 0,5667 0,6440 0,7752 1,1182 0,3596 0,5276
6 1 4 0,096 94,81 0,00% 94,81 4 0,1761 -0,1966 -0,9645 0,6517 0,7411 0,8915 1,2554 0,4204 0,6136
6 1 5 0,096 101,92 0,00% 101,92 4 0,2514 -0,2236 -0,9417 0,7860 0,8853 1,0796 1,5875 0,4925 0,7286
6 1 6 0,096 102,67 0,00% 102,67 4 0,1763 -0,1903 -0,9658 0,7313 0,8165 0,9841 1,3006 0,4657 0,6775
6 1 7 0,096 56,48 0,00% 56,48 3 0,1273 -0,2166 -0,9679 0,5535 0,6373 0,7853 1,1243 0,3434 0,5135
6 1 8 0,096 74,98 0,00% 74,98 3 0,2066 -0,2280 -0,9515 0,5984 0,6805 0,8128 1,1872 0,3745 0,5522
6 1 9 0,096 54,06 0,00% 54,06 3 0,2169 -0,2137 -0,9525 0,5145 0,5894 0,7250 1,1073 0,3247 0,4839
6 1 10 0,096 25,71 1,31% 25,37 1 0,1157 -0,2344 -0,9652 0,5693 0,6681 0,8741 1,4687 0,3455 0,5305
6 2 1 0,096 6,83 27,84% 4,93 1 0,0309 -0,1422 -0,9894 0,6291 0,8282 1,1820 1,9884 0,3472 0,5921
6 2 2 0,096 61,78 2,69% 60,12 3 0,0310 -0,1646 -0,9859 0,7021 0,8155 1,0130 1,6193 0,4428 0,6632
6 2 3 0,096 82,59 0,00% 82,59 3 0,1498 -0,1455 -0,9780 0,7639 0,8749 1,0938 1,7688 0,4771 0,7153
7 1 1 0,101 34,14 15,68% 28,78 1 -0,5637 -0,7491 -0,3480 0,2164 0,3275 0,5363 1,2686 0,1315 0,2395
7 1 2 0,101 32,72 22,49% 25,36 1 0,0979 -0,9941 -0,0462 0,0871 0,1160 0,1632 0,2981 0,0477 0,0807 Table 13: Results of all the samples.