dri standard operating procedure -...
TRANSCRIPT
DRI STANDARD OPERATING PROCEDURE
DRI Model 2001 Thermal/Optical Carbon Analysis (TOR/TOT) of Aerosol Filter Samples – Method IMPROVE_A
DRI SOP #2-216.1 Revised November 2005
Prepared by:
Desert Research Institute Division of Atmospheric Sciences
2215 Raggio Parkway Reno, NV 89506

TABLE OF CONTENTS
1 GENERAL DISCUSSION.......................................................................................... 7
1.1 Purpose of Procedure ...................................................................................................... 7
1.2 Measurement Principle ................................................................................................... 7
1.3 Measurement Interferences and Their Minimization...................................................... 8
1.4 Ranges and Typical Values of Measurements ................................................................ 9
1.5 Typical Lower Quantifiable Limits, Precision, and Accuracy ..................................... 10
1.6 Personnel Responsibilities ............................................................................................ 11
1.7 Definitions for IMPROVE_A Thermal Protocol for Carbon Analysis ........................ 11
1.8 Related Procedures ....................................................................................................... 14
2 APPARATUS, INSTRUMENTATION, REAGENTS, AND FORMS.................... 14 2.1 Apparatus and Instrumentation..................................................................................... 14
2.1.1 Description............................................................................................................ 14 2.1.2 Instrument Characterization.................................................................................. 20 2.1.3 Maintenance.......................................................................................................... 21 2.1.4 Spare Parts ............................................................................................................ 22 2.1.5 Reagents................................................................................................................ 23 2.1.6 Gases ..................................................................................................................... 24 2.1.7 Forms and Paperwork ........................................................................................... 25
3 PROCEDURES ......................................................................................................... 28
3.1 Detailed Procedures ...................................................................................................... 28
3.1.1 Analyzer Start-Up ................................................................................................. 28 3.1.2 Leak Checks.......................................................................................................... 29
3.1.2.1 Manual Leak Check .......................................................................................... 29 3.1.3 Oven Bake............................................................................................................. 31
3.1.3.1 Manual Oven Bake ........................................................................................... 31 3.1.3.2 Automatic Oven Bake....................................................................................... 32
3.1.4 OC/EC Analysis.................................................................................................... 34 3.1.4.1 Analysis Preparation ......................................................................................... 34 3.1.4.2 Loading the Filter Punch................................................................................... 35 3.1.4.3 Post-Analysis .................................................................................................... 36
3.1.5 Special Analysis.................................................................................................... 41 3.1.5.1 System Blanks................................................................................................... 41 3.1.5.2 Carbonate Analysis ........................................................................................... 41
3.1.6 Analyzer Shut-Down ............................................................................................ 42 3.2 Abbreviated Procedures ................................................................................................ 43
3.2.1 Analyzer Start-Up ................................................................................................. 43
DRI STANDARD OPERATING PROCEDURE Page: 3 of 79 Date: July 15, 2005 Title: DRI Model 2001 Thermal/Optical Carbon Analysis Number: 2-216.2 (TOR/TOT) of Aerosol Filter Samples - Method IMPROVE_A Revision: 3
3.2.2 Leak Checks and Oven Baking............................................................................. 44 3.2.3 OC/EC Analysis.................................................................................................... 45
3.2.3.1 Analysis Preparation ......................................................................................... 45 3.2.3.2 Loading the Filter Punch................................................................................... 45 3.2.3.3 Post Analysis..................................................................................................... 45
3.2.4 Special Analysis.................................................................................................... 46 3.2.4.1 System Blanks................................................................................................... 46 3.2.4.2 Carbonate Analysis ........................................................................................... 46
3.2.5 Analyzer Shut-Down: ........................................................................................... 46 4 QUANTIFICATION ................................................................................................. 47
4.1 Instrument Calibration .................................................................................................. 47
4.1.1 End-of-Run Calibrations (Description) ................................................................ 47 4.1.2 Routine Calibrations (Description)....................................................................... 48
4.1.2.1 Automated Routine Calibration (Description & Instructions).......................... 48 4.1.2.2 Manual Routine Calibration (Instructions) ....................................................... 49
4.1.3 Full Calibration (Description)............................................................................... 52 4.1.3.1 Preparation, Ranges and Traceability of Standards .......................................... 52 4.1.3.2 Calculating Calibration Slope........................................................................... 54 4.1.3.3 Typical Accuracy of Calibration Standards...................................................... 55 4.1.3.4 Data Treatment for Calibration Data ................................................................ 56 4.1.3.5 Calculations ...................................................................................................... 58
4.2 Instrument Calibration Instructions .............................................................................. 59
4.2.1 Full Gas Calibration.............................................................................................. 59 4.2.2 Full Sucrose and KHP Calibrations ...................................................................... 60
5 TEMPERATURE CALIBRATIONS........................................................................ 62
5.1 Temperature Indicators ................................................................................................. 62
5.1.1 Standard Preparation............................................................................................. 62 5.1.2 Temperature Program ........................................................................................... 62
6 QUALITY CONTROL ............................................................................................. 65
6.1 Performance Testing ..................................................................................................... 65
6.2 Reproducibility Testing ................................................................................................ 67
6.3 Control Charts and Procedures ..................................................................................... 67
6.4 Analysis Flags............................................................................................................... 68
6.5 Data Validation and Feedback...................................................................................... 69

DRI STANDARD OPERATING PROCEDURE Page: 4 of 79 Date: July 15, 2005 Title: DRI Model 2001 Thermal/Optical Carbon Analysis Number: 2-216.2 (TOR/TOT) of Aerosol Filter Samples - Method IMPROVE_A Revision: 3
6.5.1 Daily Validation.................................................................................................... 69 6.5.1.1 Validation of Final Data File ............................................................................ 72
7 REFERENCES.......................................................................................................... 78
DRI STANDARD OPERATING PROCEDURE Page: 5 of 79 Date: July 15, 2005 Title: DRI Model 2001 Thermal/Optical Carbon Analysis Number: 2-216.2 (TOR/TOT) of Aerosol Filter Samples - Method IMPROVE_A Revision: 3
LIST OF TABLES
Table 6-1. Common DRI Analysis Flags..................................................................................... 68 Table 6-2. DRI Carbon Analysis Temporary Flags ..................................................................... 76 Table 6-3. DRI Carbon Analysis Validation Comments ............................................................. 77

DRI STANDARD OPERATING PROCEDURE Page: 6 of 79 Date: July 15, 2005 Title: DRI Model 2001 Thermal/Optical Carbon Analysis Number: 2-216.2 (TOR/TOT) of Aerosol Filter Samples - Method IMPROVE_A Revision: 3
LIST OF FIGURES
Figure 2-1. DRI Model 2001 Thermal/Optical Carbon Analyzer ............................................... 15 Figure 2-2. DRI Model 2001 Thermal/Optical Carbon Analyzer Schematic Diagram............... 16 Figure 2-3. DRI Model 2001 Thermal/Optical Carbon Analyzer Sealing Diagram ................... 17 Figure 2-4. DRI Model 2001 Thermal/Optical Carbon Analyzer Gas Flow Schematic ............. 18 Figure 2-5. DRI Model 2001 Thermal/Optical Carbon Analyzer Combustion Oven ................. 19 Figure 2-6. DRI Carbon Sample Analysis Run List. ................................................................... 26 Figure 2-7 DRI Carbon Analysis Logbook Format. .................................................................... 27 Figure 3-1. DRI Welcome Screen................................................................................................ 30 Figure 3-2. Daily Analyzer Checklist .......................................................................................... 33 Figure 3-3a. Setup Screen for the DRI Model 2001 Thermal/Optical Carbon Analysis Program
................................................................................................................................... 37 Figure 3-3b. The Analysis Screen during Sample Analysis for DRI Model 2001 Thermal/Optical
Carbon Analysis Program ......................................................................................... 38 Figure 3-4. Tabular Printout from DRI Model 2001 Thermal/Optical Carbon Analysis Program
................................................................................................................................... 39 Figure 3-5. Graphical output from DRI Model 2001 Thermal/Optical Analysis Program ......... 40 Figure 4-1. Calibration thermogram from the cmdAutoCalibCheck command of the DRI Model
2001 Thermal/Optical Carbon Analyzer. .................................................................. 49 Figure 4-2. Carbon analyzer Analysis Setup screen .................................................................... 51 Figure 4-3. Example of calibration summary worksheet used to determine calibration slope. ... 55 Figure 4-4. Example DRI Carbon Analyzer Calibration Curves................................................. 56 Figure 5-1. Temperature ramping with a Tempilaqº G temperature indicator rated at 184 °C.
Also shown are reflectance and transmittance of the temperature indicator (if available). The vertical dashed line indicates the achievement of the rated temperature. ............................................................................................................... 64
Figure 5-2. Reflectance and transmittance measurements and their first and second derivatives over time with a Tempilaqº G temperature indicator rated at 184 °C (Figure 5-1). The vertical dashed line indicates the achievement of the rated target temperature. 65
Figure 6-1. Tabular Output from the DRI Thermal/Optical Carbon Analyzer............................ 71

DRI STANDARD OPERATING PROCEDURE Page: 7 of 79 Date: July 15, 2005 Title: DRI Model 2001 Thermal/Optical Carbon Analysis Number: 2-216.2 (TOR/TOT) of Aerosol Filter Samples - Method IMPROVE_A Revision: 3
1 GENERAL DISCUSSION
1.1 Purpose of Procedure
This standard operating procedure is intended to:
• Provide a basic understanding of the principles of carbon analysis and carbon analyzer operation;
• Describe routine determination of organic, elemental, and carbonate carbon from ambient- and source-filter samples using the DRI Model 2001 Thermal/Optical Carbon Analyzer; and
• Detail the concerns and procedures which will ensure a state-of-the-art carbon analysis measurement process.
This procedure will be followed by all analysts at the Environmental Analysis Facility of the Division of Atmospheric Sciences of the Desert Research Institute, Reno, Nevada, USA.
1.2 Measurement Principle
The operation of the DRI Model 2001 Thermal/Optical Carbon Analyzer is based on the preferential oxidation of organic carbon (OC) compounds and elemental carbon (EC) at different temperatures. Its function relies on the fact that organic compounds can be volatilized from the sample deposit in a non-oxidizing helium (He) atmosphere, while elemental carbon must be combusted by an oxidizer. The analyzer operates by: 1) liberating carbon compounds under different temperature and oxidation environments from a small sample punch taken from a quartz-fiber filter; 2) converting these compounds to carbon dioxide (CO2) by passing the volatilized compounds through an oxidizer (heated manganese dioxide, MnO2); 3) reducing CO2 to methane (CH4) by passing the flow through a methanator (hydrogen-enriched nickel catalyst); and 4) quantifying CH4 equivalents with a flame ionization detector (FID).
The principal function of the optical (laser reflectance and transmittance) component of the analyzer is to correct for pyrolysis charring of OC compounds into EC. Without this correction, the OC fraction of the sample might be underestimated and the EC fraction might include some pyrolyzed OC. The correction for pyrolysis is made by continuously monitoring the filter reflectance and/or transmittance (via a helium-neon laser and a photodetector) throughout an analysis cycle. The reflectance and transmittance, largely dominated by the presence of light absorbing EC, decrease as pyrolysis takes place and increase as light-absorbing carbon is liberated during the latter part of the analysis. By monitoring the reflectance and transmittance,
DRI STANDARD OPERATING PROCEDURE Page: 8 of 79 Date: July 15, 2005 Title: DRI Model 2001 Thermal/Optical Carbon Analysis Number: 2-216.2 (TOR/TOT) of Aerosol Filter Samples - Method IMPROVE_A Revision: 3
the portion of the EC peak corresponding to pyrolyzed OC can be accurately assigned to the OC fraction. The correction for the charring conversion of OC to EC is essential for a less-biased measurement of carbon fractions (Johnson et al., 1981). The Thermal Optical Reflectance (TOR) and Thermal Optical Transmittance (TOT) charring corrections are not necessarily the same, owing to charring of organic vapors adsorbed within the quartz fiber filter (Chow et al., 2004; Chen et al., 2004). OC and EC determined by both methods are reported.
Carbonate carbon can be determined by measuring the CO2 evolved upon acidification of the sample punch before the normal carbon analysis procedure.
Seven temperature fractions, as well as the TOR and TOT charring correction, are individually quantified and reported when the IMPROVE (Chow et al., 1993, 2001) temperature protocol is applied. Values routinely reported include total OC, total EC, total carbon (TC, sum of total OC and total EC), and pyrolized carbon, monitored by both reflectance (OPR) and transmittance (OPT). Depending on the thermal/optical protocol applied for quantification, thermally-derived subfractions of OC and EC, and of carbonate carbon, are reported.
1.3 Measurement Interferences and Their Minimization
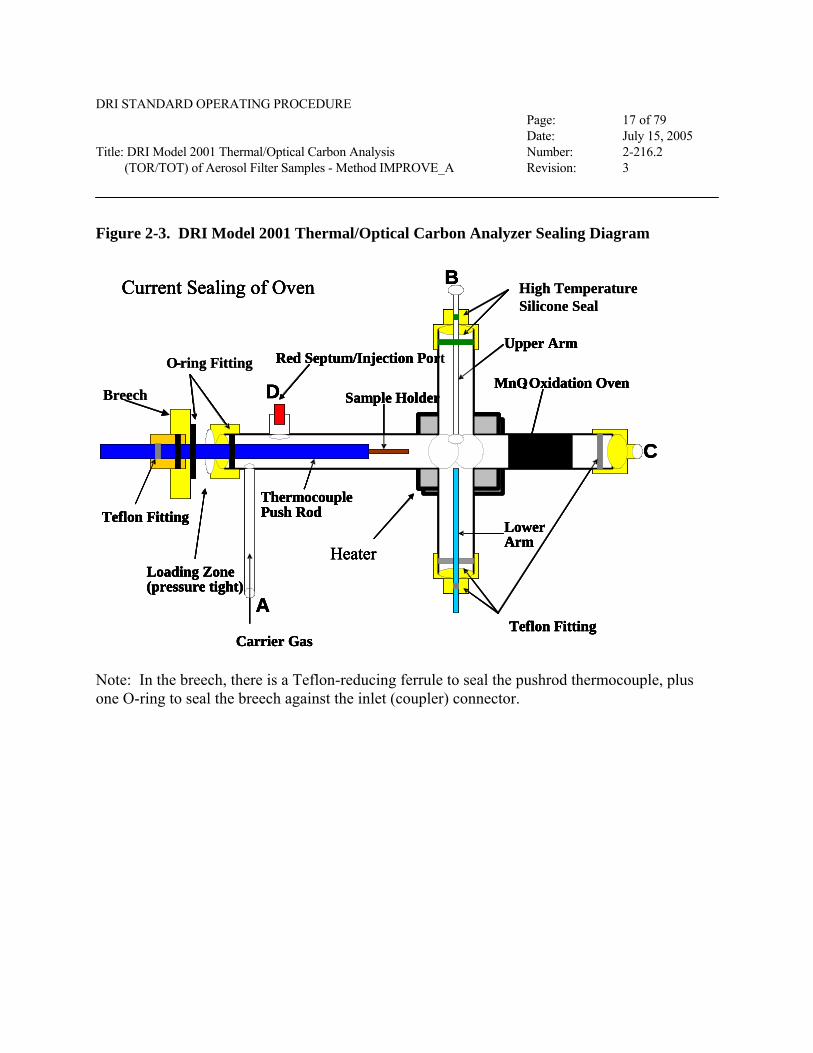
Precision of thermal/optical carbon analysis depends on the sample temperature in the analysis. Therefore, the correlation between sample temperature and thermocouple temperature should be established and calibrated semiannually so that the thermal protocol can truly reflect the sample temperature during the analysis (Chow et al., 2005). The thermocouple’s position in relation to the sample, as well as the different heating properties of the thermocouple and the sample govern the temperature offset. This relationship must be maintained for the temperature calibration to hold. The analyzer must not be used if the sample boat shifts position or becomes loose in its holder (see Figure 2-3) .
Carbonate carbon may bias carbon concentrations if it constitutes more than 5% of total carbon in the ambient or source sample. Carbonate carbon may be measured as either OC or EC depending on the chemical nature of the carbonates and their thermal decomposition temperatures. Acid pretreatment of filter samples can eliminate the carbonate interference (Novakov, 1981, 1982; Rosen et al., 1982). Carbonate carbon has been found at only a few IMPROVE monitoring sites, and then at levels that do not appreciably bias OC and EC concentrations (Chow and Watson, 2002).
The presence of certain minerals in some soils can affect the laser correction for pyrolysis. These minerals change color as the sample punch is heated, generally resulting in a darker
DRI STANDARD OPERATING PROCEDURE Page: 9 of 79 Date: July 15, 2005 Title: DRI Model 2001 Thermal/Optical Carbon Analysis Number: 2-216.2 (TOR/TOT) of Aerosol Filter Samples - Method IMPROVE_A Revision: 3
sample. For samples which contain large fractions of resuspended soils, the split between OC and EC should be examined manually.
Some minerals, again predominantly in soil samples or soil-dominated samples, may affect the laser correction by temporarily changing color or changing the surface texture of the deposit residue. Unlike the effect described above, these changes are reversible and temperature-dependent.
Some colored organic compounds can affect the laser correction, causing increased reflectance or decreased transmittance as these compounds are removed. This effect is ascertained by examining the laser response during the organic portion of the analysis. The split between OC and EC should be examined manually if the effect is large.
The presence of certain elements (Na, K, Pb, Mn, V, Cu, Ni, Co, and Cr), existing either as contaminants on the filters (e.g., glass-fiber filters), or as part of the deposit material, has been shown to catalyze the removal of EC at lower temperatures (Lin and Friedlander, 1988). Such catalysis would affect the distribution of carbon peaks during the analysis.
If present in sufficient levels, water vapor, either contained in the deposit or remaining after acidification of the sample punch can shift the FID baseline. To eliminate this effect, allow the sample punch to dry in the analyzer by passing carrier gases over it before starting the analysis.
1.4 Ranges and Typical Values of Measurements
Source-dominated or heavily polluted environments, which would normally have carbon concentrations above the working range of the carbon analyzer, may be sampled and analyzed within the range of the carbon analyzer by increasing the filter deposit area or by decreasing the sampling flow in the field equipment. Deposits that are very black, such that the initial reflectance is close to zero, provide a less precise OC/EC split, because additional blackening due to OC charring is not quantified by the reflected light.
The carbon analyzer can effectively measure between 0.05 and 750 µg carbon/cm2 for a typical punch size of 0.5 cm2. The upper limit depends on the particular compounds on the filter and the temperatures at which they evolve. This upper limit may be extended by reducing the punch size or extending analysis times at lower temperature plateaus to avoid an over-range FID signal.
DRI STANDARD OPERATING PROCEDURE Page: 10 of 79 Date: July 15, 2005 Title: DRI Model 2001 Thermal/Optical Carbon Analysis Number: 2-216.2 (TOR/TOT) of Aerosol Filter Samples - Method IMPROVE_A Revision: 3
Typical carbon values range between 10 and 100 µg carbon/cm2 for 24-hour ambient samples. The distribution between OC and EC depends on the particulate source types, ranging from negligible levels of EC (e.g., secondary sulfate) to 80% or more EC (e.g., diesel exhaust).
1.5 Typical Lower Quantifiable Limits, Precision, and Accuracy
The lower quantifiable limits (LQLs) of thermal carbon methods depend on the variable carbon content of the blank quartz filters, as well as the analysis method. For better LQLs, the unexposed filters should be pre-fired in an oven at high temperatures for several hours to remove any residual carbon contamination (Fung, 1986; Huntzicker, 1986; Rau, 1986; DRI, 2004). All quartz-fiber filters originating from DRI are pre-inspected for defects such as pinholes or tears. They are then pre-fired for a minimum of four hours at 900 °C and 2% of these are acceptance-tested for blank levels before use in the IMPROVE network. Batches containing filters that fail to pass the preset acceptance levels (1.5 µg OC, 0.5 µg EC, and 2.0 µg TC per cm2) are not used for sample collection. Average pre-fired blank levels are 0.15 ± 0.15 µg OC/cm2, 0.00 ± 0.02 µg EC/cm2, and 0.15 ± 0.15 µg TC/cm2. Because pre-fired filters can adsorb organic vapors during shipping and storage, the LQL of analysis on a particular set of filters depends on the number of field blanks analyzed and the variability in the results from those blanks. To reduce the risk of contamination during shipping and storage, samples are vacuum-sealed and stored in a freezer.
The minimum detection limit (MDL) of the DRI Model 2001 carbon analyzers used for IMPROVE_A protocol is based on the analyses of 214 blank quartz-fiber filters. The MDL is defined as three times the standard deviation of their measured results. They are:
total OC 0.45 µg/cm2 total EC 0.06 µg/cm2 TC 0.45 µg/cm2
Acid-evolved carbonate levels in pre-fired quartz-fiber filters have been shown to be quite variable (0.0-1.0 µg/cm2) over time. The reaction of ambient CO2 with alkaline sites on the quartz fibers may be the cause of such variable blank levels. Acceptance testing for carbonate is only performed for special projects that require carbonate analysis.
The precision of carbon analysis has been reported to range from 2-4% (Johnson, 1981). For analysis of actual ambient and source filters, homogeneity of the deposit is most important for reproducible results. For homogeneous deposits containing >5 µg/cm2 (~10 times MDL) of TC, precision is generally 10% or better; for inhomogeneous deposits replicates may deviate by as much as 30%. The precision of carbonate analysis results is ~10%.
DRI STANDARD OPERATING PROCEDURE Page: 11 of 79 Date: July 15, 2005 Title: DRI Model 2001 Thermal/Optical Carbon Analysis Number: 2-216.2 (TOR/TOT) of Aerosol Filter Samples - Method IMPROVE_A Revision: 3
The precision of the laser-dependent split between OC and EC fractions depends upon how rapidly the laser is increasing at the time of the split and whether or not the split falls in the middle of a large carbon peak. Typically, relative laser split times are reproducible within 10 seconds and deviations in calculated splits are <5% of the total measured carbon.
The accuracy of the thermal/optical reflectance method for TC determined by analyzing a known amount of carbon is between 2-6% (Rau, 1986). Precision of the OC/EC split is between 5% and 10%. This precision is also influenced by the filter loading and source type.
1.6 Personnel Responsibilities
Before performing carbon analysis, all analysts in the laboratory should read and understand the entire Standard Operating Procedure (SOP), including routine system calibration, actual analysis, and immediate review of the data as it is produced, in order to correct system problems.
The responsibilities of the laboratory manager or supervisor are: to ensure that the carbon analyses procedures are properly followed; to examine and document all replicate, standard, and blank performance test data; to designate samples for reanalysis; to arrange for maintenance and repair; to maintain the supplies and gases necessary to ensure uninterrupted analysis; and to deliver the analysis results in database format to the project manager within the specified time period.
The quality assurance (QA) officer of DRI's Division of Atmospheric Sciences is responsible for determining the extent and methods of quality assurance to be applied to each project, to estimate the level of effort involved in this quality assurance, to update this procedure periodically, and to ascertain that these tasks are budgeted and carried out as part of the performance on each contract.
1.7 Definitions for IMPROVE_A Thermal Protocol for Carbon Analysis
The following terms are used in this document:
IMPROVE_A Thermal Protocol:
A thermal protocol is used in carbon analyzers to quantify carbon fractions evolved at different temperature plateaus. The IMPROVE_A thermal protocol derives from the Interagency Monitoring of Protected Visual Environments (IMPROVE) thermal protocol initiated in 1987 (Chow et al., 2005).
Calibration Injection: The injection of calibration gases, either CO2 or CH4, into the

DRI STANDARD OPERATING PROCEDURE Page: 12 of 79 Date: July 15, 2005 Title: DRI Model 2001 Thermal/Optical Carbon Analysis Number: 2-216.2 (TOR/TOT) of Aerosol Filter Samples - Method IMPROVE_A Revision: 3
sample stream at the beginning and end of each work day to check instrument performance.
Calibration Peak: The FID peak resulting from the automatic injection of methane calibration gas (CH4/He) at the end of each analysis run for each sample. All integrated peak areas are divided by the calibration peak area and multiplied by an instrument-specific calibration factor to obtain µg carbon per sample punch.
FID Split Time: The time at which the laser split occurs plus the transit time required for thermally evolved carbon to travel from the sample punch to the FID.
Organic Carbon: Carbon evolved from the filter punch in a He-only (>99.999%) atmosphere at 140, 280, 480 and 580 °C plus pyrolyzed organic carbon. This is the same as Volatile Organic Carbon (VOC) plus high-temperature OC.
Elemental Carbon: Carbon evolved from the filter punch in a 98% He/2% O2 atmosphere at 580, 740, and 840 °C minus any pyrolyzed OC.
High Temperature OC: Carbon evolved from the filter punch in a He-only atmosphere at 280, 480, and 580 °C plus pyrolyzed organic carbon. This is OC minus the first OC peak (OC1).
High Temperature EC: Carbon evolved from the filter punch in a 98% He/2% O2 atmosphere at 740 and 840 °C minus any pyrolyzed organic carbon present in these two peaks. This is EC minus the first EC peak (EC1).
Laser Split: The separation between OC and EC, which depends on the laser-measured reflectance and/or transmittance of the filter punch returning to its initial value. At this point all pyrolyzed OC has been removed and EC is beginning to evolve.
Lower Split Time: The time at which the laser-measured reflectance and/or transmittance of the filter punch reaches its initial value minus the precision of the laser signal (currently defined as 10 counts).
Pyrolysis: The conversion of OC compounds to EC due to thermal
DRI STANDARD OPERATING PROCEDURE Page: 13 of 79 Date: July 15, 2005 Title: DRI Model 2001 Thermal/Optical Carbon Analysis Number: 2-216.2 (TOR/TOT) of Aerosol Filter Samples - Method IMPROVE_A Revision: 3
decomposition; this may be envisioned as "charring" during the organic portion of the analysis.
OC1: Carbon evolved from the filter punch in a He-only (>99.999%) atmosphere from ambient (~25 °C) to 140 °C.
OC2: Carbon evolved from the filter punch in a He-only (>99.999%) atmosphere from 140 to 280 °C.
OC3: Carbon evolved from the filter punch in a He-only (>99.999%) atmosphere from 280 to 480 °C.
OC4: Carbon evolved from the filter punch in a He-only (>99.999%) atmosphere from 480 to 580 °C.
OP: The carbon evolved from the time that the carrier gas flow is changed from He to 98% He/2% O2 at 580 °C to the time that the laser-measured filter reflectance (OPR) or transmittance (OPT) reaches its initial value. A negative sign is assigned if the laser split occurs before the introduction of O2.
EC1: Carbon evolved from the filter punch in a 98% He/2% O2 atmosphere at 580 °C.
EC2: Carbon evolved from the filter punch in a 98% He/2% O2 atmosphere from 580 to 740 °C.
EC3: Carbon evolved from the filter punch in a 98% He/2% O2 atmosphere from 740 to 840 °C.
Regular Split Time: The time at which the laser-measured reflectance and/or transmittance of the filter punch reaches its initial value.
Total Carbon (TC): All carbon evolved from the filter punch between ambient and 840 °C under He and 98% He /2% O2 atmospheres.
Upper Split Time: The time at which the laser-measured reflectance and/or transmittance of the filter punch reaches its initial value plus the precision of the laser signal (currently defined as 10 counts).

DRI STANDARD OPERATING PROCEDURE Page: 14 of 79 Date: July 15, 2005 Title: DRI Model 2001 Thermal/Optical Carbon Analysis Number: 2-216.2 (TOR/TOT) of Aerosol Filter Samples - Method IMPROVE_A Revision: 3
1.8 Related Procedures
Standard Operating Procedures (SOPs), related carbon analysis activities, and other manuals that should be reviewed in conjunction with this document are:
DRI SOP #6-001.1 Shipping and Mailing Procedures. DRI SOP #6-009.1 Field and Laboratory Safety Procedures. Any SOPs dealing
with filter handling and shipping in conjunction with the specific sampling method used.
DRI SOP #2-106.1 Pre-Firing of Quartz Filters for Carbon Analysis.
The DRI Model 2001 Thermal/Optical Carbon Analyzer Owner's Manual, revised 3/2004 (Atmoslytic, Calabasas, CA).
The DRI Model 2001 Thermal/Optical Carbon Analyzer Installation, Operation and Troubleshooting Manual, revised 12/2004 (Atmoslytic, Calabasas, CA).
2 APPARATUS, INSTRUMENTATION, REAGENTS, AND FORMS
2.1 Apparatus and Instrumentation 2.1.1 Description
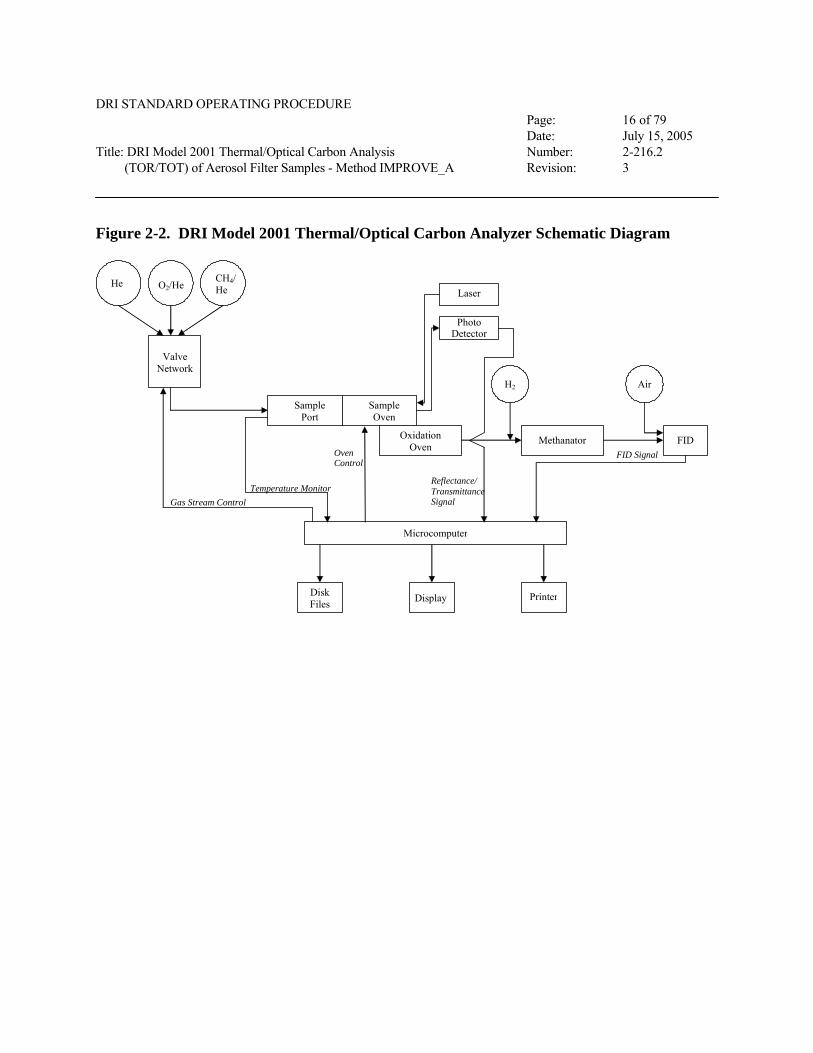
The components of the DRI Model 2001 Thermal/Optical Carbon Analyzer are depicted in Figures 2-1 through 2-3; the complete gas flow schematic is shown in Figure 2-4. Other details of the configuration of the DRI Model 2001 Thermal/Optical Carbon Analyzer are referred to in the owner's manual. The programmable combustion oven is the heart of the carbon analyzer and includes loading, combustion, and oxidation zones in a single quartz "oven" as depicted in Figure 2-5.
In addition to the DRI Model 2001 thermal/optical analyzer, which is connected to a Pentium 4x compatible computer, the following items are needed for routine carbon analysis:
• Stainless steel punching tool: 5/16-inch diameter, 0.5 cm2 nominal area for removing small sample punches from quartz filters. This punching tool must be kept clean and sharp. If the punching tool is resharpened, the punch area must be re-verified. Verification is performed by removing 10 punches from a 47-mm quartz-fiber filter (17.35 cm2); then calculating the punch area [= 17.35 cm2 x (average weight of 10 punches / original filter weight)]. Further verification can be done by taking a precise measurement of the punching tool.

DRI STANDARD OPERATING PROCEDURE Page: 15 of 79 Date: July 15, 2005 Title: DRI Model 2001 Thermal/Optical Carbon Analysis Number: 2-216.2 (TOR/TOT) of Aerosol Filter Samples - Method IMPROVE_A Revision: 3
Figure 2-1. DRI Model 2001 Thermal/Optical Carbon Analyzer
DRI STANDARD OPERATING PROCEDURE Page: 16 of 79 Date: July 15, 2005 Title: DRI Model 2001 Thermal/Optical Carbon Analysis Number: 2-216.2 (TOR/TOT) of Aerosol Filter Samples - Method IMPROVE_A Revision: 3
Figure 2-2. DRI Model 2001 Thermal/Optical Carbon Analyzer Schematic Diagram
Temperature Monitor
He O2/He CH4/ He
Valve Network
Sample Port
Sample Oven
Laser
Photo Detector
Oxidation Oven
Methanator FID
Microcomputer
FID Signal
Reflectance/ Transmittance Signal
Oven Control
Gas Flow Control
H2 Air
Disk Files Display Printer
Gas Stream Control
DRI STANDARD OPERATING PROCEDURE Page: 17 of 79 Date: July 15, 2005 Title: DRI Model 2001 Thermal/Optical Carbon Analysis Number: 2-216.2 (TOR/TOT) of Aerosol Filter Samples - Method IMPROVE_A Revision: 3
Figure 2-3. DRI Model 2001 Thermal/Optical Carbon Analyzer Sealing Diagram
High TemperatureSilicone Seal
Teflon FittingCarrier Gas
Red Septum/Injection PortO-ring Fitting
Teflon Fitting
Loading Zone (pressure tight)
MnO2 Oxidation Oven
B
C
A
D
Current Sealing of Oven
Heater
Upper Arm
Lower Arm
ThermocouplePush Rod
Sample Holder
Teflon FittingCarrier Gas
Red Septum/Injection Port
Breech
-
Teflon Fitting
Loading Zone (pressure tight)
MnO2 Oxidation Oven
B
C
A
D
Current Sealing of Oven
Heater
Upper Arm
Lower Arm
ThermocouplePush Rod
Sample Holder
Note: In the breech, there is a Teflon-reducing ferrule to seal the pushrod thermocouple, plus one O-ring to seal the breech against the inlet (coupler) connector.

DRI STANDARD OPERATING PROCEDURE Page: 18 of 79 Date: July 15, 2005 Title: DRI Model 2001 Thermal/Optical Carbon Analysis Number: 2-216.2 (TOR/TOT) of Aerosol Filter Samples - Method IMPROVE_A Revision: 3
Figure 2-4. DRI Model 2001 Thermal/Optical Carbon Analyzer Gas Flow Schematic

DRI STANDARD OPERATING PROCEDURE Page: 19 of 79 Date: July 15, 2005 Title: DRI Model 2001 Thermal/Optical Carbon Analysis Number: 2-216.2 (TOR/TOT) of Aerosol Filter Samples - Method IMPROVE_A Revision: 3
Figure 2-5. DRI Model 2001 Thermal/Optical Carbon Analyzer Combustion Oven
DRI STANDARD OPERATING PROCEDURE Page: 20 of 79 Date: July 15, 2005 Title: DRI Model 2001 Thermal/Optical Carbon Analysis Number: 2-216.2 (TOR/TOT) of Aerosol Filter Samples - Method IMPROVE_A Revision: 3
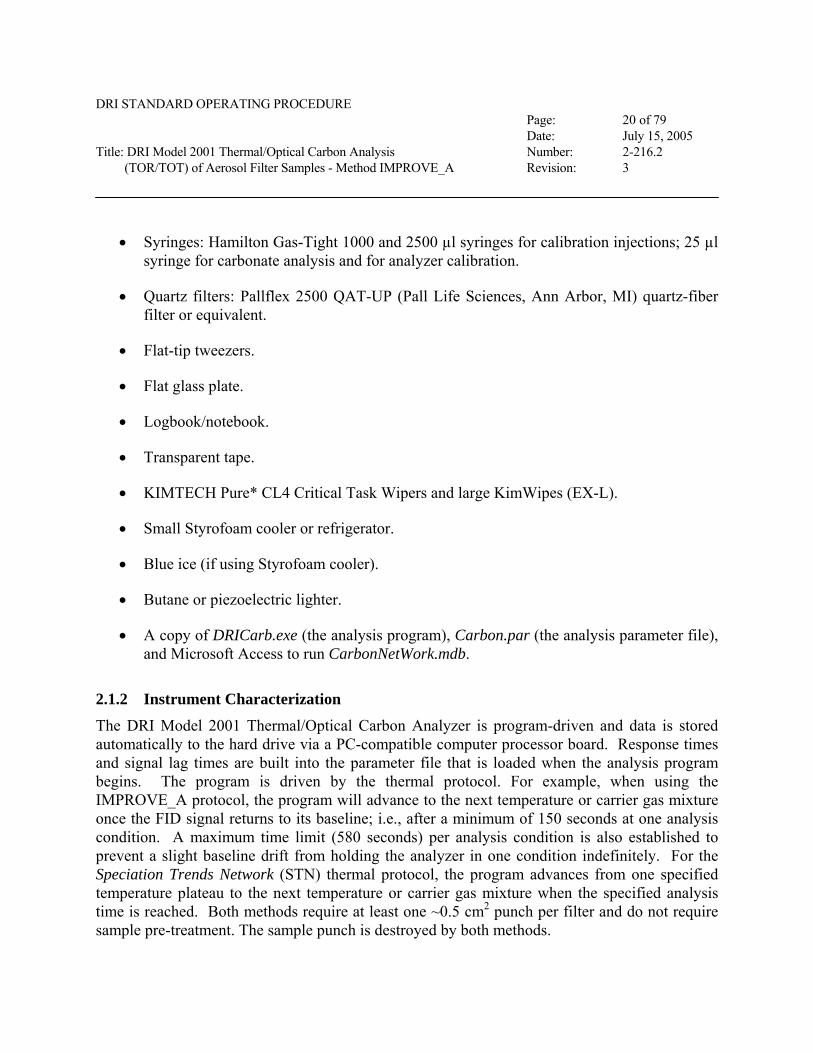
• Syringes: Hamilton Gas-Tight 1000 and 2500 µl syringes for calibration injections; 25 µl syringe for carbonate analysis and for analyzer calibration.
• Quartz filters: Pallflex 2500 QAT-UP (Pall Life Sciences, Ann Arbor, MI) quartz-fiber filter or equivalent.
• Flat-tip tweezers.
• Flat glass plate.
• Logbook/notebook.
• Transparent tape.
• KIMTECH Pure* CL4 Critical Task Wipers and large KimWipes (EX-L).
• Small Styrofoam cooler or refrigerator.
• Blue ice (if using Styrofoam cooler).
• Butane or piezoelectric lighter.
• A copy of DRICarb.exe (the analysis program), Carbon.par (the analysis parameter file), and Microsoft Access to run CarbonNetWork.mdb.
2.1.2 Instrument Characterization
The DRI Model 2001 Thermal/Optical Carbon Analyzer is program-driven and data is stored automatically to the hard drive via a PC-compatible computer processor board. Response times and signal lag times are built into the parameter file that is loaded when the analysis program begins. The program is driven by the thermal protocol. For example, when using the IMPROVE_A protocol, the program will advance to the next temperature or carrier gas mixture once the FID signal returns to its baseline; i.e., after a minimum of 150 seconds at one analysis condition. A maximum time limit (580 seconds) per analysis condition is also established to prevent a slight baseline drift from holding the analyzer in one condition indefinitely. For the Speciation Trends Network (STN) thermal protocol, the program advances from one specified temperature plateau to the next temperature or carrier gas mixture when the specified analysis time is reached. Both methods require at least one ~0.5 cm2 punch per filter and do not require sample pre-treatment. The sample punch is destroyed by both methods.

DRI STANDARD OPERATING PROCEDURE Page: 21 of 79 Date: July 15, 2005 Title: DRI Model 2001 Thermal/Optical Carbon Analysis Number: 2-216.2 (TOR/TOT) of Aerosol Filter Samples - Method IMPROVE_A Revision: 3
Operator concerns for correct routine operation of the instrument include the following (refer to Section 4 for more details):
• Verify sample oven pressure reading and specified flow range in the front-panel flow meters.
• DO NOT leave the room until the analysis begins.
• Check the graphical printout after each analysis run to ensure that the: 1) FID (Flame Ionization Detector), 2) temperature, and 3) laser signals are behaving as expected (Section 4.1). Report any anomalies to the lab supervisor immediately.
• The quartz oven is susceptible to breakage. Care should be taken when handling and cleaning.
• Be careful that no fiber from the KIMTECH wiper is left on the sample punch, tweezers, and/or glass plate.
2.1.3 Maintenance
Regular maintenance for the analyzer involves daily checking of compressed gas supplies, cleaning the punching tool and tweezers between each sample with dry KIMTECH, ensuring that the lab is clean, and backing up data files to disc on a daily basis (unless files are automatically backed up to server). Temperature calibrations for the six temperature plateaus (140, 280, 480, 580, 740, and 840 °C) need to be performed semiannually (see details in Section 5). Checks of laser adjustments (physical and electrical) and leaks are made at least monthly. The procedure for leak checks can be found in Section 3.1.2. Additional leak tests are performed with a He leak detector each time a part is replaced, and whenever the analyzer fails the leak check during the daily routine. The system should show no He leaks at the various connections of the quartz cross oven. Since He has high diffusivity, freedom from He leaks will safeguard against O2 diffusion into the system. These O2 levels are determined quarterly using a gas chromatography/mass spectrometry (GC/MS) instrument on the analyzer. When a fresh He cylinder is installed, the O2 level should be checked in one of the analyzers hooked up to the gas line to assure the quality of the gas supply and the condition of the O2 scrubber. If the cmdAutoCalibCheck command is used for calibration, the condition of the catalysts will be indicated and appropriate action can be taken (such as catalyst replacement). All calibrations, repairs, and checks must be recorded in the Carbon Analyzer Logbook (Figure 2-7). Flow rates of all operating gases should be checked

DRI STANDARD OPERATING PROCEDURE Page: 22 of 79 Date: July 15, 2005 Title: DRI Model 2001 Thermal/Optical Carbon Analysis Number: 2-216.2 (TOR/TOT) of Aerosol Filter Samples - Method IMPROVE_A Revision: 3
and adjusted (if needed) whenever a new quartz oven or methanator is installed or serviced. Additionally, a flow balance should be performed as well.
2.1.4 Spare Parts
The following spare parts must be kept on hand to ensure minimal interruptions in carbon analysis:
• Quartz furnace tube available from the manufacturer (Atmoslytic, Calabasas, CA).
• Quartz rods: 3 mm nominal diameter, optical quality (Atmoslytic, Calabasas, CA), polished for optical clarity with 104 mm (upper arm) and 119 mm (lower arm) lengths. The version of the carbon analyzer manufactured in 2001 uses a 98 mm rod for the upper arm. Measure the old rods for reference.
• Catalyst ovens: Watlow 15.24 cm length, 2.54 cm tube diameter element from the analyzer supplier.
• Quartz boats (Atmoslytic, Calabasas, CA).
• Thermocouple rods: 24.13 cm length by 0.32 cm outside diameter (OD), Type-K ground isolated with Inconel sheath (Omega, Part #TJ36-CAIN-18E-9.5, Stamford, CT). Remove 1 cm of the sheath with a file to obtain the longer tip needed in this application.
• FID flame tips: for Gow-Mac #12-800 FIDs (Gow-Mac, #132-117, Bethlehem, PA).
• Septa: Standard 0.32 cm or 0.64 cm cylindrical (Alltech Associates #6524, Deerfield, IL) for injection ports. Silicon septa 0.25 cm and 1.11 cm for oven seals (Alltech #15427 and #15429, Deerfield, IL).
• 25 µl syringes.
• Replacement needles for syringes (Alltech #7729-06, Deerfield, IL).
• Replacement oxygen/moisture trap (R&D Separations, Model OT3-2, Rancho Cordova, CA).
• Replacement hydrocarbon trap (R&D Separations, Model HT200-4, Rancho Cordova, CA).

DRI STANDARD OPERATING PROCEDURE Page: 23 of 79 Date: July 15, 2005 Title: DRI Model 2001 Thermal/Optical Carbon Analysis Number: 2-216.2 (TOR/TOT) of Aerosol Filter Samples - Method IMPROVE_A Revision: 3
• Replacement indicating oxygen trap (Chromatography Research Supplies, Model 202223, Louisville, KY).
• Quartz wool: For repacking the oxidation oven (Alltech Associates, #4033, Deerfield, IL).
• Viton O-rings: Size 013. Two needed for quartz oven tube inlet.
• Teflon ferrules: Parker or Swagelok style 0.64 cm front and back ferrule for the quartz oven tube outlet connections (Swagelock, T-400-SET, Solon, OH). Refer to instrument user manual for specific ferrule sizes.
• Teflon ferrules: 0.32 cm to 0.64 cm (Alltech Associates, #RF-400/200-T, Deerfield, IL), for the thermocouple rod at the inlet breech. Refer to instrument user manual for specific ferrule sizes (style varies by location on analyzer).
• High temperature silicone seals for quartz light rods and connector, prepared by Alltech Associates, #15427 and #15429, Deerfield, IL.
• Heating element for oven (Watlow, #VC401A06A-0000R [90° bend], Columbia, MO).
• Printer paper and toner cartridge.
• Computer CD for backup if not on server backup.
2.1.5 Reagents
The following chemicals should be reagent grade or better:
• Potassium hydrogen phthalate (KHP), for calibration (Fisher Scientific, cat #P-243, CAS 877-24-7, Fairlawn, NJ).
• Sucrose, for calibration use (EM Science, #SX1075-1, Gibbstown, NJ).
• Manganese dioxide (MnO2), crystalline, as an oxidizer in the oxidation oven (Nurnberg Scientific, #C5162, Portland, OR; Aldrich Chemicals #24344-2, St. Louis, MO; or equivalent).
• Nickelous nitrate [Ni(NO3)2·6H2O], crystalline, used to prepare the nickel catalyst in the methanator (Fisher Scientific, cat #N62-5000, CAS 13478-00-70, Fairlawn, NJ).

DRI STANDARD OPERATING PROCEDURE Page: 24 of 79 Date: July 15, 2005 Title: DRI Model 2001 Thermal/Optical Carbon Analysis Number: 2-216.2 (TOR/TOT) of Aerosol Filter Samples - Method IMPROVE_A Revision: 3
• Chromosorb A, 20/30 mesh, used as a support for nickel catalyst in the methanator (from any chromatography supplier, such as Alltech cat #2-0165). Both nickelous nitrate and Chromosorb A are for preparing the reduction catalyst in the methanator.
• Hydrochloric acid (HCl), 0.4 molar solution, for use in cleaning punch and quartz ovens, and for use in carbonate analysis (Fisher Scientific, cat #A508-212, CAS 7647-01-0, Fairlawn, NJ).
• Hydrofluoric acid (HF), diluted to 15% for removing the white deposits from devitrification (white deposits of SiO2) on the quartz oven parts (Fisher Scientific, cat #A147-1LB, CAS 7664-39-3, Fairlawn, NJ).
• Nanopure water. (used as described in Section 4.1.3.1).
2.1.6 Gases
The following compressed gases should be ultra-high purity (UHP) grade or better:
• He for a carrier gas, regulated to 15-40 psi with a metal diaphragm regulator. The higher pressure is required due to the pressure drop across the Supelco oxygen scrubber.
• 5% CH4 by volume in He for calibration injections and calibration peaks; regulated to 10 psi by a metal diaphragm regulator.
• 5% CO2 by volume in He for calibration injections; regulated to 10 psi by a metal diaphragm regulator.
• 10% O2 by volume in He as a carrier gas, regulated to 15 psi by a metal diaphragm regulator.
In addition, the following gases are required:
• Hydrogen for the FID flame, regulated to 15 psi with a metal diaphragm regulator.
• Hydrocarbon-free air to supply O2 to the FID, regulated to 15 psi by a metal diaphragm regulator from a zero air generator.
• Compressed air for pneumatic activation, regulated to ~25 psi.

DRI STANDARD OPERATING PROCEDURE Page: 25 of 79 Date: July 15, 2005 Title: DRI Model 2001 Thermal/Optical Carbon Analysis Number: 2-216.2 (TOR/TOT) of Aerosol Filter Samples - Method IMPROVE_A Revision: 3
At least one backup cylinder per gas type should be kept on hand at all times. The 90% He/10% O2 mixture are typically replaced every four to six weeks; H2 and He are replaced once a week. All gases are replaced when the cylinder pressure drops below 500 psi. Check the O2 scrubber and follow the manufacturer’s recommendations for scheduling its replacement.
The flow settings on the flow meters (rotameters) are based on an input of 15 psi for He, 90% He/10% O2, H2, and FID air. The pneumatic drivers for the breech should have a pressure of ~25 psi to operate effectively (sealing the opening).
2.1.7 Forms and Paperwork
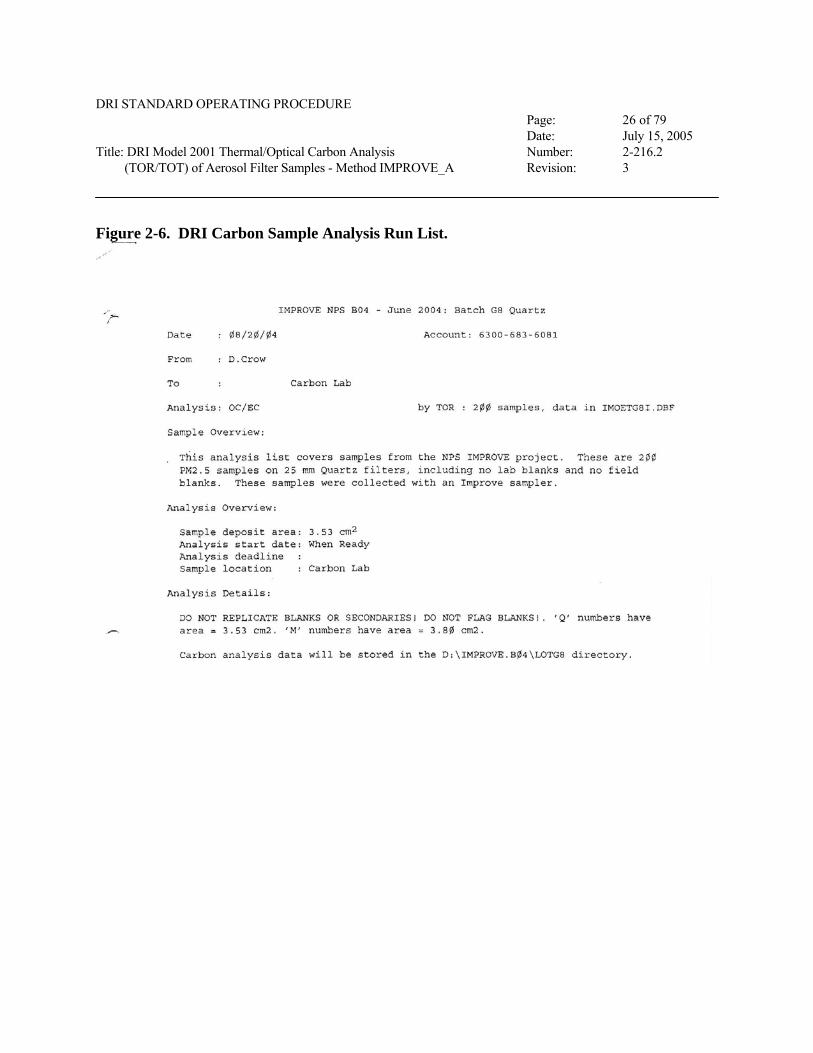
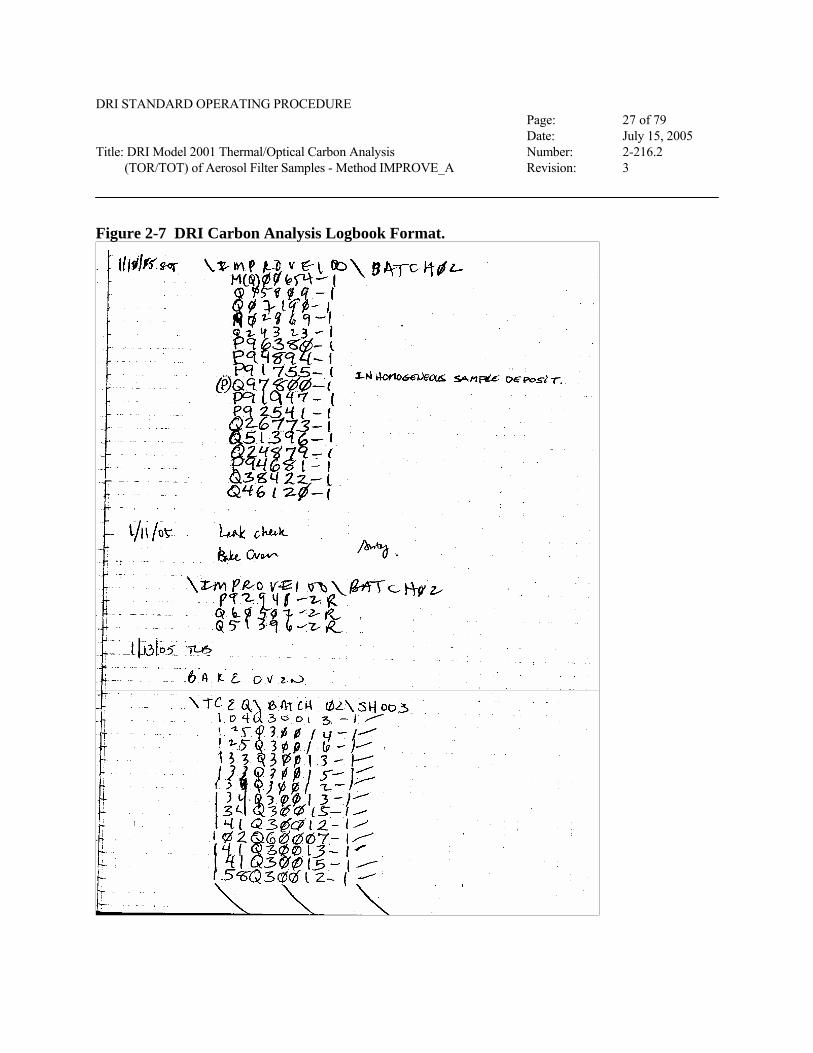
All samples are logged in upon receipt at the laboratory. A sample analysis list will be prepared by the laboratory supervisor or designated technician indicating which samples will be analyzed, plus any special instructions. Figure 2-6 provides an example of the sample analysis run list. As individual samples are analyzed, entries are made in the Carbon Analyzer Logbook, as shown in Figure 2-7.
DRI STANDARD OPERATING PROCEDURE Page: 26 of 79 Date: July 15, 2005 Title: DRI Model 2001 Thermal/Optical Carbon Analysis Number: 2-216.2 (TOR/TOT) of Aerosol Filter Samples - Method IMPROVE_A Revision: 3
Figure 2-6. DRI Carbon Sample Analysis Run List.
DRI STANDARD OPERATING PROCEDURE Page: 27 of 79 Date: July 15, 2005 Title: DRI Model 2001 Thermal/Optical Carbon Analysis Number: 2-216.2 (TOR/TOT) of Aerosol Filter Samples - Method IMPROVE_A Revision: 3
Figure 2-7 DRI Carbon Analysis Logbook Format.

DRI STANDARD OPERATING PROCEDURE Page: 28 of 79 Date: July 15, 2005 Title: DRI Model 2001 Thermal/Optical Carbon Analysis Number: 2-216.2 (TOR/TOT) of Aerosol Filter Samples - Method IMPROVE_A Revision: 3
3 PROCEDURES
3.1 Detailed Procedures 3.1.1 Analyzer Start-Up
If the analyzer is started up for the first time, or after an extended period of non-operation, it will take a period of conditioning to reach a stable system background. At the start, allow all the gases to purge through the system for ~30 minutes before heating the various zones in a stepwise manner. Allow the FID and Line Heaters to reach operating temperatures of 120 °C and 105 °C, respectively, before heating up the oxygenator and methanator. Heat both catalysts at 120 °C for about half an hour, then in ~100 °C increments with ~30 min. hold time until the final temperatures of 912 °C and 420 °C are reached for the oxygenator and methanator, respectively.
The following steps outline analyzer start-up:
• Check all gas cylinder pressures; cylinders with gas pressures less than 500 psi should be replaced before beginning the day's analysis.
• Check that all gas delivery pressures are correct:
Hydrogen (H2) 15 psi Helium(He) 15-40 psi (check label on
regulator for current setting) Compressed air 15 psi for FID, 25 psi for
breech actuation O2/He mix 15 psi CH4/He mix 10 psi CO2/He mix 10 psi
• Check that the FID is lit by holding a pair of tweezers over the FID exhaust stack and watching for condensation. If the FID is not lit (as immediately after the H2 or compressed air cylinders are changed), relight the flame by turning the H2 rotameter to the upper limit (as posted on the flow meter) and holding a butane lighter or match over the FID stack. A soft pop indicates that the flame has been lighted. Verify that the flame remains lit by the tweezers test. Often the flame will not stay lit the first try, especially after the H2 cylinder is changed and air gets into the gas lines. Return the rotameter to the operation setting after the flame is lit.
DRI STANDARD OPERATING PROCEDURE Page: 29 of 79 Date: July 15, 2005 Title: DRI Model 2001 Thermal/Optical Carbon Analysis Number: 2-216.2 (TOR/TOT) of Aerosol Filter Samples - Method IMPROVE_A Revision: 3
• Check and readjust, if necessary, all gas flows at the analyzer. The correct readings are posted on each rotameter. Read through the center of the ball. If drastic adjustments are required on one analyzer, recheck that flows on the other analyzers have not been affected.
• Turn on the computer monitor. Note: the computers are generally left on at all times; only the monitors are turned off when the analyzers are not in use.
• Confirm that the date and time on the computer are correct.
• Wipe the sample tweezers, flat glass plate, and punching tool with clean KIMTECH wiper, taking care not to contact the cleaned surfaces with fingers or other dirty items. Check to make sure that no fibers from the KIMTECH wiper are left on the surfaces.
• Begin the daily entry in the Carbon Analyzer Logbook. Entries should follow the format in Figure 2-7.
• Make sure that the printer has enough paper for the day and that the toner cartridge is producing legible text and graphics.
NOTE: When using the carbon analysis software, clicking on the Exit button closes the program. Exiting in the midst of an analysis is not advisable, as the analyzer will revert to the default settings (see settings under Options\Manual); in such a case, a hot thermocouple will retract, possibly damaging the Teflon seal.
If for some reason the program freezes, allow the sample oven to cool to below 200 °C and then close the program and restart DRICarb.exe.
3.1.2 Leak Checks
Perform leak checks daily to detect leakage in the sample oven.
3.1.2.1 Manual Leak Check
• To begin the manual leak check, go to C:\CarbonNet, then double click the DRICarb.exe program icon to begin the carbon program (or double click the DRICarb.exe shortcut on the computer desktop). The DRI welcome screen appears as depicted in Figure 3-1. Verify that the correct version of the software and database are being used. For normal
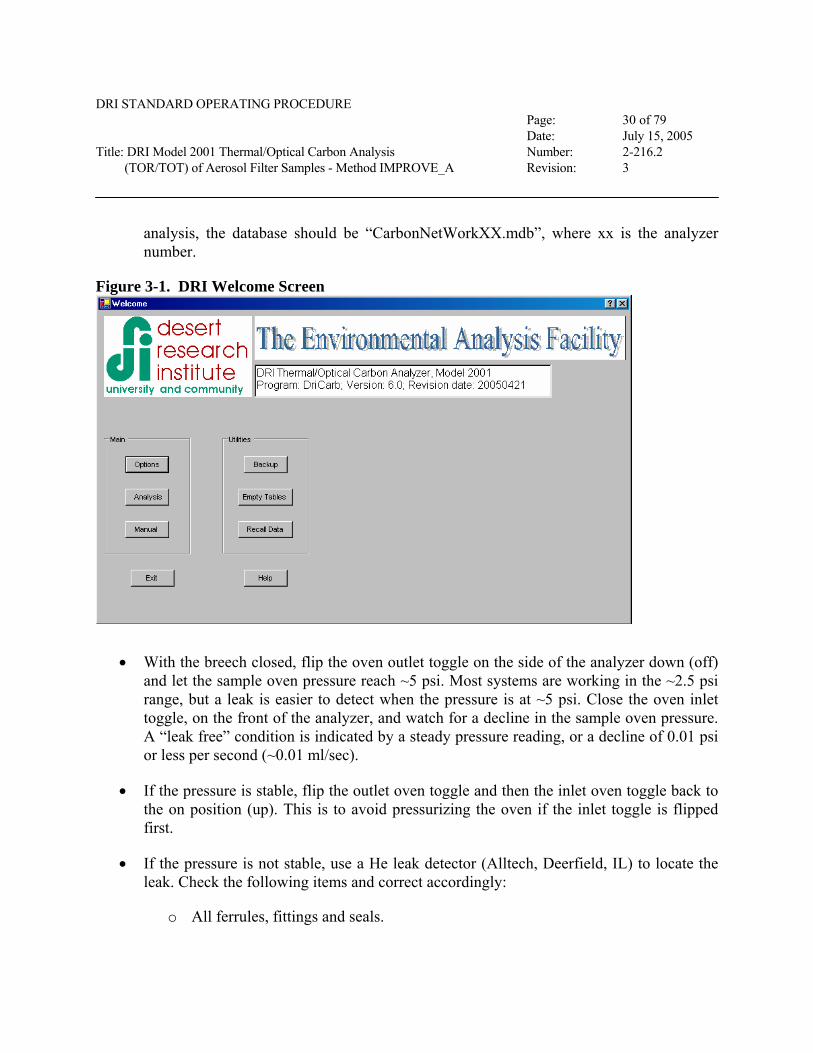
DRI STANDARD OPERATING PROCEDURE Page: 30 of 79 Date: July 15, 2005 Title: DRI Model 2001 Thermal/Optical Carbon Analysis Number: 2-216.2 (TOR/TOT) of Aerosol Filter Samples - Method IMPROVE_A Revision: 3
analysis, the database should be “CarbonNetWorkXX.mdb”, where xx is the analyzer number.
Figure 3-1. DRI Welcome Screen
• With the breech closed, flip the oven outlet toggle on the side of the analyzer down (off) and let the sample oven pressure reach ~5 psi. Most systems are working in the ~2.5 psi range, but a leak is easier to detect when the pressure is at ~5 psi. Close the oven inlet toggle, on the front of the analyzer, and watch for a decline in the sample oven pressure. A “leak free” condition is indicated by a steady pressure reading, or a decline of 0.01 psi or less per second (~0.01 ml/sec).
• If the pressure is stable, flip the outlet oven toggle and then the inlet oven toggle back to the on position (up). This is to avoid pressurizing the oven if the inlet toggle is flipped first.
• If the pressure is not stable, use a He leak detector (Alltech, Deerfield, IL) to locate the leak. Check the following items and correct accordingly:
o All ferrules, fittings and seals.
DRI STANDARD OPERATING PROCEDURE Page: 31 of 79 Date: July 15, 2005 Title: DRI Model 2001 Thermal/Optical Carbon Analysis Number: 2-216.2 (TOR/TOT) of Aerosol Filter Samples - Method IMPROVE_A Revision: 3
o Quartz oven.
o All tubing.
o Thermocouple.
o Breech O-ring.
• If the system still leaks, wipe all threads and ferrules with a dry KIMTECH wiper, reassemble, and retry.
• Also, check the breech O-ring to ensure that it sits squarely in the groove and that there is sufficient pressure to close the breech.
• Refer to the carbon analyzer’s Troubleshooting Manual for additional tips and procedures.
Once the system passes the leak test, make sure that the analyzer’s multi-function switch (at the left of the front panel) is set at Auto in order to continue with routine analysis. Allow the system pressure to return to its original value and record this value on the Daily Analyzer Checklist shown in Figure 3-2. The pressure should be consistent with previous day’s values.
3.1.3 Oven Bake
A daily oven bake is performed to ensure the system is clean before beginning analysis. The oven bake can be performed manually or by using an automated command from the command table. Use the following procedures to do a manual oven bake:
3.1.3.1 Manual Oven Bake
• Select “Manual” from the “Main” submenu. From the “Manual” screen, select “Control” on the drop-down menu list. (Note: analyzer must be in “Auto” mode for the manual control to work.) This will bring up the “Control” screen. Change the “Oven Temperature” field to “1000”. Change the “Sample Position” field to “Analyze”. Click “Go”. This will heat the oven to approximately 950 °C, depending on the instrument’s calibration. Exercise caution when working around hot surfaces of the analyzer.
• Repeat until the system is clean. Sample runs or calibrations may then begin.
• System blanks (section 3.1.4.1) are run after the oven bake.
DRI STANDARD OPERATING PROCEDURE Page: 32 of 79 Date: July 15, 2005 Title: DRI Model 2001 Thermal/Optical Carbon Analysis Number: 2-216.2 (TOR/TOT) of Aerosol Filter Samples - Method IMPROVE_A Revision: 3
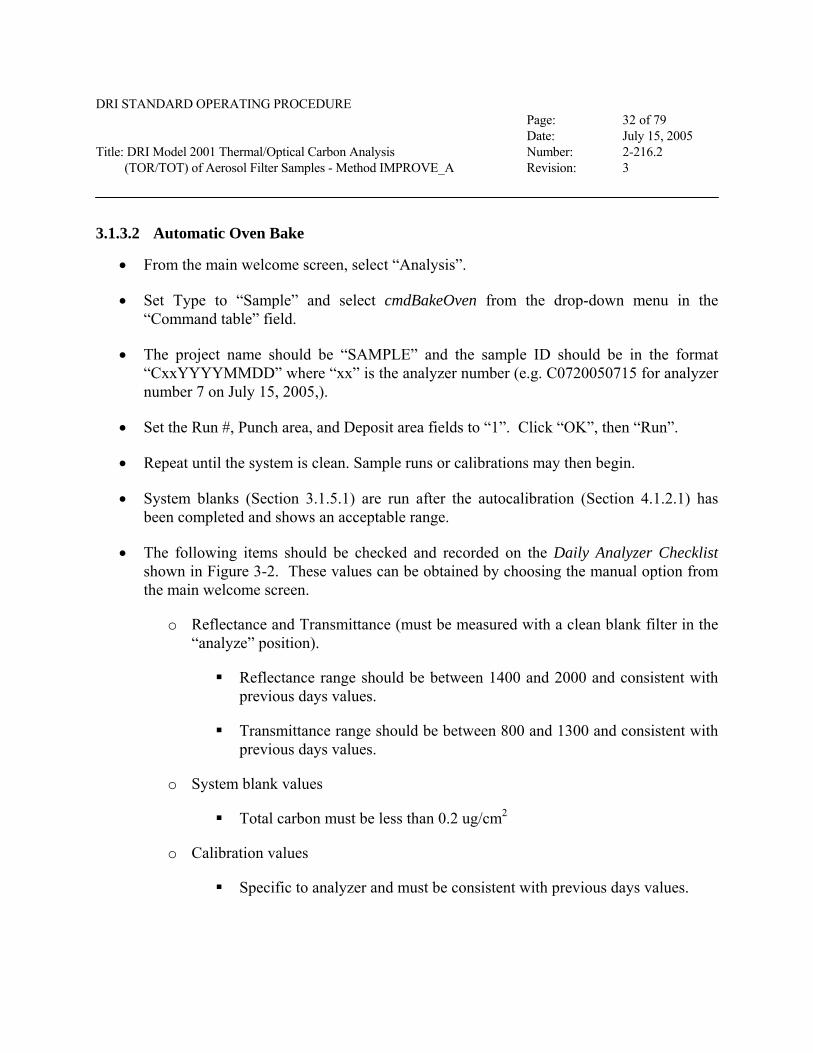
3.1.3.2 Automatic Oven Bake
• From the main welcome screen, select “Analysis”.
• Set Type to “Sample” and select cmdBakeOven from the drop-down menu in the “Command table” field.
• The project name should be “SAMPLE” and the sample ID should be in the format “CxxYYYYMMDD” where “xx” is the analyzer number (e.g. C0720050715 for analyzer number 7 on July 15, 2005,).
• Set the Run #, Punch area, and Deposit area fields to “1”. Click “OK”, then “Run”.
• Repeat until the system is clean. Sample runs or calibrations may then begin.
• System blanks (Section 3.1.5.1) are run after the autocalibration (Section 4.1.2.1) has been completed and shows an acceptable range.
• The following items should be checked and recorded on the Daily Analyzer Checklist shown in Figure 3-2. These values can be obtained by choosing the manual option from the main welcome screen.
o Reflectance and Transmittance (must be measured with a clean blank filter in the “analyze” position).
Reflectance range should be between 1400 and 2000 and consistent with previous days values.
Transmittance range should be between 800 and 1300 and consistent with previous days values.
o System blank values
Total carbon must be less than 0.2 ug/cm2
o Calibration values
Specific to analyzer and must be consistent with previous days values.

DRI STANDARD OPERATING PROCEDURE Page: 33 of 79 Date: July 15, 2005 Title: DRI Model 2001 Thermal/Optical Carbon Analysis Number: 2-216.2 (TOR/TOT) of Aerosol Filter Samples - Method IMPROVE_A Revision: 3
Figure 3-2. Daily Analyzer Checklist
.
DRI STANDARD OPERATING PROCEDURE Page: 34 of 79 Date: July 15, 2005 Title: DRI Model 2001 Thermal/Optical Carbon Analysis Number: 2-216.2 (TOR/TOT) of Aerosol Filter Samples - Method IMPROVE_A Revision: 3
3.1.4 OC/EC Analysis
Based on the analysis list for the day, retrieve the samples to be analyzed from the sample freezer and place in a Styrofoam cooler with blue ice, or in the analysis room refrigerator.
Routine analysis procedure assumes carbonate will not be measured. For carbonate analysis, refer to Section 3.1.5.2, “Special Analysis”.
Always execute the cmdBakeOven command to bake the oven before beginning analysis each day (refer to section 3.1.3). This will ensure the system is clean (1.5 µg OC, 0.5 µg EC, and 2.0 µg TC per cm2). Run a system blank with the IMPROVE_A protocol.
3.1.4.1 Analysis Preparation
• Verify the computer date and time is correct.
• Verify sample oven pressure reading and specified flow ranges in the front-panel flow meters.
• Wipe the flat glass plate, tweezers, and punching tool thoroughly with a dry KIMTECH wiper.
• Based on the analysis list, remove the sample to be analyzed from the Styrofoam cooler or refrigerator.
• Record the filter ID in the analyzer log book (Figure 2-7).
• Open DRICarb.exe from the c:\CarbonNet folder or use the desktop “shortcut” to DRICarb.exe. Verify correct software version number on the Welcome screen.
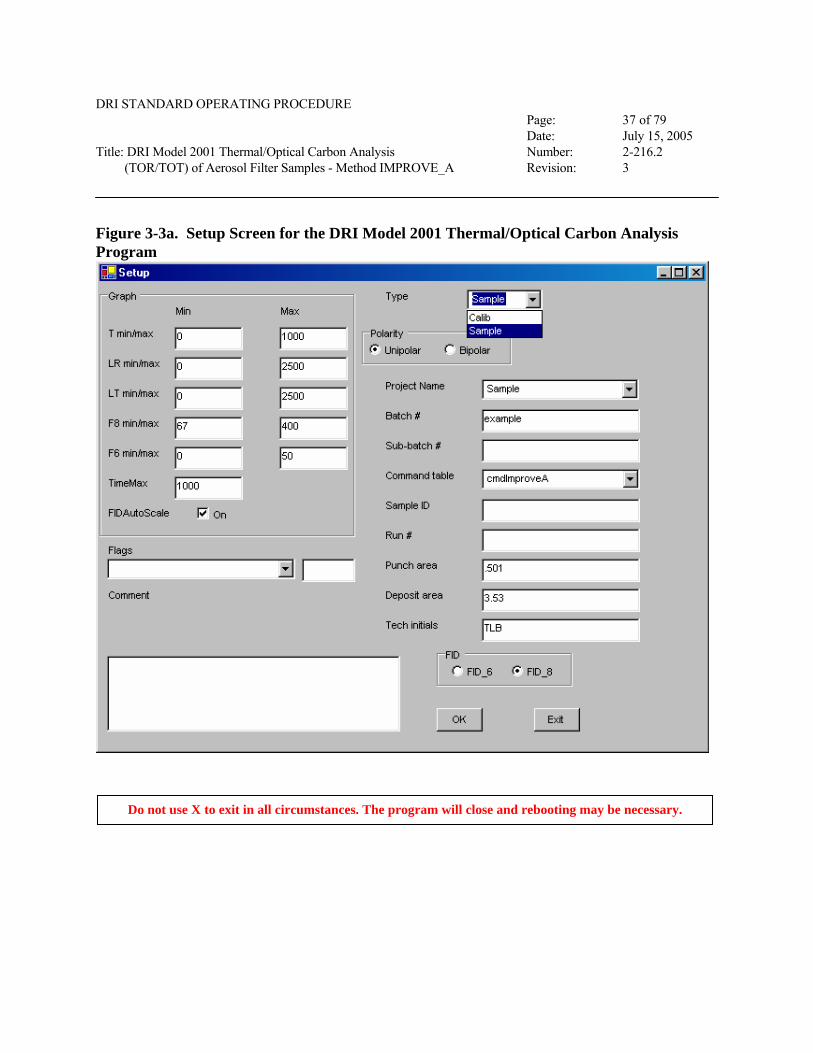
• Select “Analysis” from the “Main” submenu of the Welcome form. This will initiate the analysis protocol, as shown in Figure 3-3. You can also select FID ID (typically FID_8) to determine the FID peak sensitivity.
• In the analysis “Setup” form, enter “Sample” for the Type.
• Polarity should default to “Unipolar”.

DRI STANDARD OPERATING PROCEDURE Page: 35 of 79 Date: July 15, 2005 Title: DRI Model 2001 Thermal/Optical Carbon Analysis Number: 2-216.2 (TOR/TOT) of Aerosol Filter Samples - Method IMPROVE_A Revision: 3
• Fill out the information about the sample, including: Project Name, Batch #, and Sub-batch #.
• Under “Command Table” select cmdImproveA.
• Enter the Sample ID number, or place your mouse cursor in the field and use a barcode scanner to read the barcode on the Petri dish.
• Enter the Run #, Punch area and Deposit area for the filter being analyzed.
• Enter technician initials in the “Tech initials” field.
• Select any pre-analysis flags from the drop-down menu in the “Flags” field. A list of valid choices is presented on the screen.
• Visually examine the filter and note any non-uniformity or unusual deposit. Remove it from the Petri slide or Petri dish with tweezers, handling the filter only by the edge. Place the filter on the flat glass plate and remove a sample punch by pushing down gently on the punching tool. Rocking the punching tool slightly will ensure that the punch is completely severed. Try to remove the punch from the edge of the deposit to avoid wasting the filter, while trying to avoid areas of non-uniform deposits.
• Leaving the sample punch in the punching tool, place the punching tool on a clean KIMTECH wiper. Return the filter to the Petri slide or dish, being careful to handle only the filter with the tweezers.
• If this is the first run of the day, or if the analyzer has been cooled down, the analyzer will verbally prompt you to load the punch (“Please load filter analysis”). If the analyzer was previously used, it will cool to 100 °C, then pull the boat back to the calibration position, continue cooling to 50 °C, and pull the boat back to the load position for the next analysis.
3.1.4.2 Loading the Filter Punch
• Use tweezers to remove punch from punch tool and place in analyzer boat.
• Click “OK” on the analysis “Setup” screen. The boat will load to the calibration position and the computer will ask, “Would you like to proceed or would you like to delay
DRI STANDARD OPERATING PROCEDURE Page: 36 of 79 Date: July 15, 2005 Title: DRI Model 2001 Thermal/Optical Carbon Analysis Number: 2-216.2 (TOR/TOT) of Aerosol Filter Samples - Method IMPROVE_A Revision: 3
analysis?” Check to make sure a 90-second delay is in the “delay” box. Click “OK” and analysis will begin.
• Wipe the tweezers, flat glass plate, and punching tool with a clean KIMTECH wiper.
3.1.4.3 Post-Analysis
At the end of each analysis, data is saved to the database, split times are calculated, carbon peaks are integrated, and tabular and graphical printouts are produced. The sample boat will retract to the calibration position when it is sufficiently cooled by the fan (to >100 °C) and will continue to cool until it reaches less than 50 °C.
• Examine the tabular printout (Figure 3-4) to confirm that the calibration peak counts are within specifications (typically 25,000 counts, see Section 4.1).
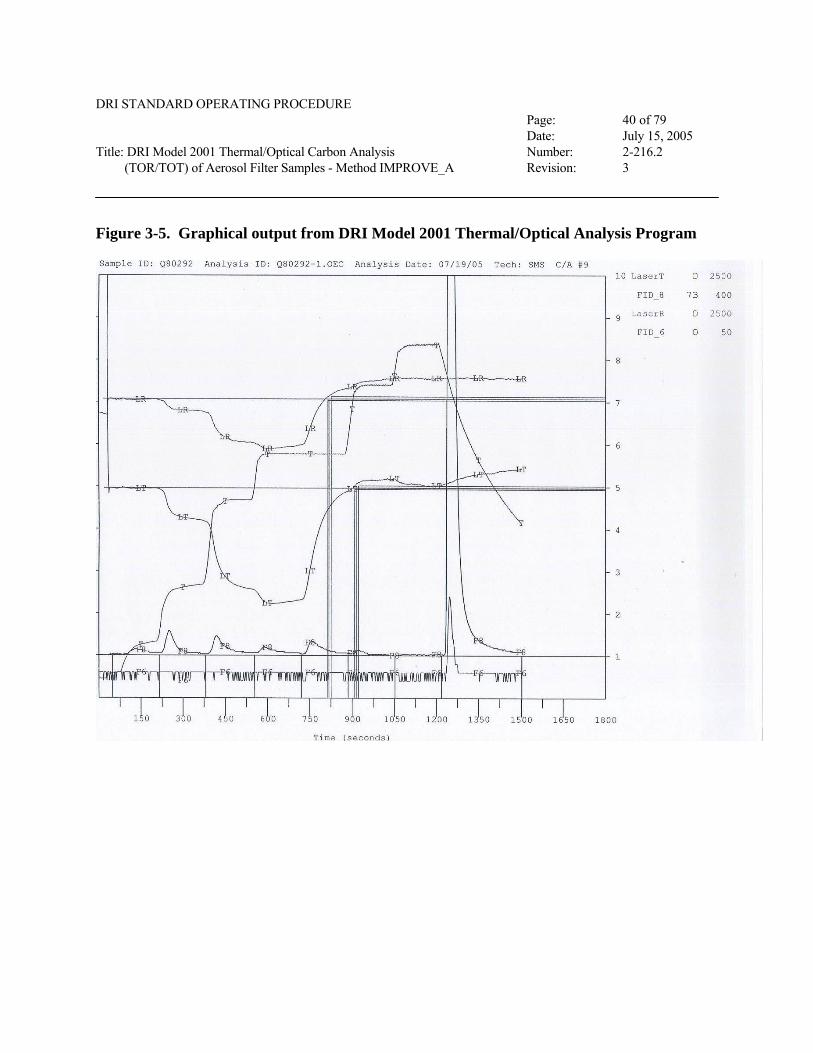
• Examine the thermogram (Figure 3-5) for proper laser response, temperature profiles, realistic carbon peaks, and the presence of the calibration peak at the end of the analysis.
• Examine the laser signal at the end of the run.
• If a problem is found, register it in the analyzer log book and run list, and notify the lab supervisor immediately.
• If all aspects of the analysis appear correct, select the appropriate analysis flag from the post-analysis form that appears at the end of the run.
• Mark the analysis date on the sample analysis run list.
• Using clean tweezers, remove the punch from the boat and tape it to the thermogram with transparent tape, ensuring that the punch is deposit-side up.
Repeat the above steps for additional analysis runs.
DRI STANDARD OPERATING PROCEDURE Page: 37 of 79 Date: July 15, 2005 Title: DRI Model 2001 Thermal/Optical Carbon Analysis Number: 2-216.2 (TOR/TOT) of Aerosol Filter Samples - Method IMPROVE_A Revision: 3
Figure 3-3a. Setup Screen for the DRI Model 2001 Thermal/Optical Carbon Analysis Program
Do not use X to exit in all circumstances. The program will close and rebooting may be necessary.
DRI STANDARD OPERATING PROCEDURE Page: 38 of 79 Date: July 15, 2005 Title: DRI Model 2001 Thermal/Optical Carbon Analysis Number: 2-216.2 (TOR/TOT) of Aerosol Filter Samples - Method IMPROVE_A Revision: 3
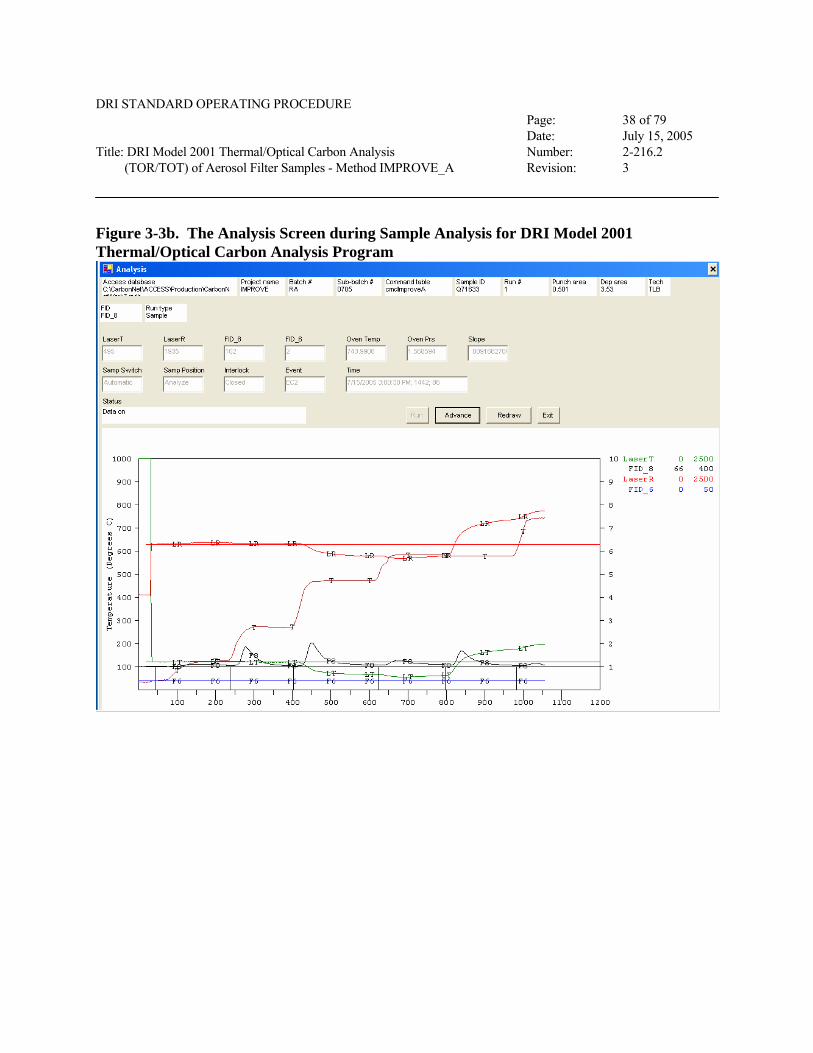
Figure 3-3b. The Analysis Screen during Sample Analysis for DRI Model 2001 Thermal/Optical Carbon Analysis Program

DRI STANDARD OPERATING PROCEDURE Page: 39 of 79 Date: July 15, 2005 Title: DRI Model 2001 Thermal/Optical Carbon Analysis Number: 2-216.2 (TOR/TOT) of Aerosol Filter Samples - Method IMPROVE_A Revision: 3
Figure 3-4. Tabular Printout from DRI Model 2001 Thermal/Optical Carbon Analysis Program
DRI STANDARD OPERATING PROCEDURE Page: 40 of 79 Date: July 15, 2005 Title: DRI Model 2001 Thermal/Optical Carbon Analysis Number: 2-216.2 (TOR/TOT) of Aerosol Filter Samples - Method IMPROVE_A Revision: 3
Figure 3-5. Graphical output from DRI Model 2001 Thermal/Optical Analysis Program

DRI STANDARD OPERATING PROCEDURE Page: 41 of 79 Date: July 15, 2005 Title: DRI Model 2001 Thermal/Optical Carbon Analysis Number: 2-216.2 (TOR/TOT) of Aerosol Filter Samples - Method IMPROVE_A Revision: 3
3.1.5 Special Analysis
3.1.5.1 System Blanks
System blanks are run at the beginning of each day. Follow the steps outlined in Section 3.1.3 on oven baking with the following exceptions:
• Go through all the steps for a routine analysis (Section 3.1.4), but when prompted to load filter punch, remove the filter from the previous day and leave the boat empty for the analysis..
• Use project name “Sysblk”, Batch # “mm” for the month and Sub-batch # “dd” for the day. Punch area and Deposit area should be “1”.
• Use an ID number derived from the current date: e.g., SB071805 for July 18, 2005.
• Calculated carbon concentrations should not be more than 0.2 µg carbon. Values greater than this warrant additional system blanks. Samples may not be analyzed until the system blank is <0.2 µg carbon.
3.1.5.2 Carbonate Analysis
• Enter the Sample ID, Run #, Punch area, and Deposit area. Select cmdImproveA_Carbonate from the Command Table drop-down field and start the analysis program.
• Follow the steps under Section 3.1.3 until the sample punch is loaded into the boat. Load sample and click “OK”. When asked if you want to delay or continue analysis, click “OK”. After 90 seconds the punch automatically centers under the acid injection port. The computer will prompt you to inject the HCl, and then will state “Load syringe” and “XX seconds to acid injection”.
• Inject 20 µl of 0.4 M HCl through the septum port to the sample.
• Prior to acidification (approximately 90 seconds elapsed analysis time), flush the 25 µl syringe with 0.4 M hydrochloric acid (HCl) into a waste beaker. When prompted to inject HCl eject 20 µl HCl onto the filter punch, ensuring that the needle bevel is turned toward the punch and that the needle tip is touching the top of the punch.
DRI STANDARD OPERATING PROCEDURE Page: 42 of 79 Date: July 15, 2005 Title: DRI Model 2001 Thermal/Optical Carbon Analysis Number: 2-216.2 (TOR/TOT) of Aerosol Filter Samples - Method IMPROVE_A Revision: 3
• When the analysis is underway, flush the syringe with Nanopure water to prevent corrosion of the syringe plunger.
• After analysis, the program will delay any further analysis for 900 seconds to allow the punch to dry.
• After the carbonate analysis is completed, a tabular summary and a copy of the graph will be printed (similar in format to Figures 3-4 and 3-5). Select cmdImproveA from the Command Table drop-down field and click “OK”. Click “Run” on the analysis Setup screen. The program will automatically cycle into the normal OC/EC analysis, using the same Sample ID. Heat from the oxidation oven will dry the sample in this position (for approximately 15 minutes) without prematurely baking carbon from the sample; the sample temperature should not exceed 42 °C. When the punch is dry proceed with normal OC/EC analysis.
3.1.6 Analyzer Shut-Down
After the final sample for the day is analyzed, shut down the analyzers using the following procedures:
• Leave the last analyzed punch in the boat with the boat positioned in the Calibrate position. This punch will be used as the system blank the following morning and then taped to the corresponding thermogram.
• Perform end-of-the-day calibration gas injection routine, or use cmdAutoCalibCheck command, and record the calibration peak counts. Any values outside the expected ranges should be investigated and rerun. Because low values from the end-of-day calibration could potentially invalidate the entire day's runs, any deviation from the accepted ranges must be noted and the cause identified. Notify the lab supervisor.
• Leave the DRICarb.exe software open.
• If desired, He-1, Cal Gas, He-2, and Air may be turned off with the toggle valves to conserve gases. However, all other gases should be left on as long as the oxygenator and methanator are heated.

DRI STANDARD OPERATING PROCEDURE Page: 43 of 79 Date: July 15, 2005 Title: DRI Model 2001 Thermal/Optical Carbon Analysis Number: 2-216.2 (TOR/TOT) of Aerosol Filter Samples - Method IMPROVE_A Revision: 3
• Place all of the day’s printouts, including calibration data in a file folder labeled with the date and analyzer number. Place on the lab supervisor's desk for Level I validation (Section 6.5).
• Leave the computers and analyzers on overnight unless the potential for power outages or surges exists. Turn off the monitors overnight.
• Make a final check of the gas cylinder pressures to ensure that gas flow, especially the compressed air, will continue until someone will be available to check them again.
• Move the samples and blue ice in the Styrofoam cooler or refrigerator back into the sample storage freezer and verify that the freezer is completely closed.
• If the 25 or 50 µl syringe was used for carbonate analysis, thoroughly rinse the syringe with distilled water and tightly cap all solutions. Store solutions in the refrigerator. Freezer storage may cause crystallization.
• Lock the carbon analysis room.
3.2 Abbreviated Procedures 3.2.1 Analyzer Start-Up
• Check pressures and delivery pressures in all gas cylinders.
• Check that all FIDs are lit by holding a pair of tweezers over the FID exhaust stack and watching for condensation. Relight if necessary.
• Check all gas flows at the analyzer; readjust if necessary.
• Turn on the computer monitor.
• Confirm that the date and time on the computer are correct.
• Execute the DRICarb.exe either from the shortcut on the computer desktop or from C:\CarbonNet\.
• Confirm that the printers have enough paper for the day and that the toner cartridge is producing legible text and graphics.

DRI STANDARD OPERATING PROCEDURE Page: 44 of 79 Date: July 15, 2005 Title: DRI Model 2001 Thermal/Optical Carbon Analysis Number: 2-216.2 (TOR/TOT) of Aerosol Filter Samples - Method IMPROVE_A Revision: 3
• Wipe the sample tweezers, flat glass plate, and punching tool with a clean KIMTECH wiper.
• Begin the daily entry in the Carbon Analyzer Logbook.
• Bake the oven for 10 minutes, or bake during leak test.
• Perform a leak test, involving isolating the oven and operating the Carle valve.
• Execute the cmdAutoCalibCheck command to verify the analyzer’s performance.
• Retrieve the samples to be analyzed from the sample freezer.
• Complete Daily Analyzer Check Sheet posted on each analyzer.
3.2.2 Leak Checks and Oven Baking
• Use manual option to set temperature to 900 °C and let analyzer reach this temperature.
• With breech closed, flip oven outlet toggle to the off position and let sample oven pressure reach ~5 psi.
• Flip the oven inlet toggle to the off position and watch for a decline in the sample oven pressure. If system is leak free, the pressure will remain stable.
• If the system is not stable, use a He leak detector to locate the leak; disassemble and reassemble the port fitting if necessary and check the O-ring for correct placement and pressure.
• When system is stable, flip both the inlet and outlet oven toggles back to the on position.
• An oven bake can also be executed without a leak check by selecting cmdBakeOven from the drop-down menu in the Command table.
• Update the Daily Analyzer Checklist and verify values are within expected range.
DRI STANDARD OPERATING PROCEDURE Page: 45 of 79 Date: July 15, 2005 Title: DRI Model 2001 Thermal/Optical Carbon Analysis Number: 2-216.2 (TOR/TOT) of Aerosol Filter Samples - Method IMPROVE_A Revision: 3
3.2.3 OC/EC Analysis
3.2.3.1 Analysis Preparation
• Clean the tweezers, flat glass plate, and punching tool with dry KIMTECH wiper.
• Based on the analysis list, remove the sample to be analyzed from the Styrofoam cooler or refrigerator. Verify the sample ID against the analysis list.
• Remove a sample punch from the filter.
• Record the Sample ID in the analyzer logbook, along with any comments on the condition of the deposit or any other conditions which might affect analysis results.
3.2.3.2 Loading the Filter Punch
• Begin the analysis by clicking on “Analysis” in the Welcome window and inputting the Sample ID, Run #, Punch area, and Deposit area.
• After the boat has cooled to 50 °C or less, remove the previously analyzed sample punch and load the current sample punch.
• Clean the tweezers, flat glass plate, and punching tool with a dry KIMTECH wiper.
• Replace the Petri slide or Petri dish containing the filter into the Styrofoam cooler or refrigerator.
• Upon analysis completion, use a small piece of transparent tape to attach the sample punch to its thermogram, ensuring that the deposit side is facing up.
• At the end of the analysis, the push rod will automatically be pulled back to the Calibrate position to begin cooling.
3.2.3.3 Post Analysis
• Examine the thermogram for proper laser response, temperature profiles, realistic carbon peaks, and the presence of the calibration peak at the end of the analysis. Examine the tabular printout to confirm that the calibration peak counts are within specifications (see Section 4.1). Finally, examine the laser signal at the end of the run.
DRI STANDARD OPERATING PROCEDURE Page: 46 of 79 Date: July 15, 2005 Title: DRI Model 2001 Thermal/Optical Carbon Analysis Number: 2-216.2 (TOR/TOT) of Aerosol Filter Samples - Method IMPROVE_A Revision: 3
Indicate successful analyses on the sample analysis list by recording the date. Notify the lab supervisor of any problems and record them in the log book and on the run list.
• Repeat the above steps for additional samples.
3.2.4 Special Analysis
3.2.4.1 System Blanks
• Go through all the steps for a normal analysis, but do not remove the punch from the previous analysis. Proceed with the routine analysis.
• Use project name “Sysblk”, Batch # “mm” for the month and Sub-batch # “dd” for the day. Punch area and Deposit area should be “1”.
• Calculated carbon concentrations from the system blank should not be more that 0.2 µg carbon. Values greater than this warrant an additional system blank or oven bake.
3.2.4.2 Carbonate Analysis
• Follow the steps under Routine OC/EC Analysis until the sample punch is loaded into the boat.
• Enter the Sample ID, Run #, Punch area, and Filter area.
• When prompted for injection, eject 20 µl 0.4 M HCl onto the filter punch.
• Flush the syringe with Nanopure water between samples.
• Continue the normal OC/EC analysis when the carbonate cycle is complete.
3.2.5 Analyzer Shut-Down:
• Leave the last analyzed punch in the boat with the boat positioned in the Calibrate position. This punch will be used as the system blank the following morning and then taped to the corresponding thermogram.
DRI STANDARD OPERATING PROCEDURE Page: 47 of 79 Date: July 15, 2005 Title: DRI Model 2001 Thermal/Optical Carbon Analysis Number: 2-216.2 (TOR/TOT) of Aerosol Filter Samples - Method IMPROVE_A Revision: 3
• Execute the cmdAutoCalibCheck command to verify the analyzer’s performance.
• When the analysis is complete, record the calibration peak counts and calculated injection calibration in the logbook. Any values outside the ranges defined in Section 4.1 should be investigated and rerun.
• Backup the day's data files to disk, if not automatically backed up on a server.
• Remove the printouts and attach them to a file folder labeled with the date and analyzer number. Place on the lab supervisor's desk.
• Turn off the computer monitors.
• Make a final check of the gas cylinder pressures.
• Move the samples and blue ice in the Styrofoam cooler or refrigerator back into the sample storage freezer and verify that the freezer is completely closed.
• If the 25 µl syringe was used for carbonate analysis, thoroughly rinse the syringe with Nanopure water and tightly cap all solutions. Store at 4 °C.
• Lock the carbon analysis room.
4 QUANTIFICATION
4.1 Instrument Calibration
The calibration procedures for the carbon analyzers are of three types: 1) the end-of-run calibration peak; 2) the routine beginning and end-of-day calibration injections of He/CH4 and He/CO2 (you can also use the auto calibration check using the cmdAutoCalibCheck command); and 3) full instrument calibration, performed every six months, using KHP, sucrose, and the two calibration gases.
4.1.1 End-of-Run Calibrations (Description)
The end-of-run calibration consists of a set quantity of He/CH4 calibration gas which is automatically injected by the carbon program. All FID readings during the analysis run are normalized to this peak to minimize the effects of FID performance and electronic drift over time. The end-of-run calibration occurs automatically at the end of each analysis run and
DRI STANDARD OPERATING PROCEDURE Page: 48 of 79 Date: July 15, 2005 Title: DRI Model 2001 Thermal/Optical Carbon Analysis Number: 2-216.2 (TOR/TOT) of Aerosol Filter Samples - Method IMPROVE_A Revision: 3
requires no operator intervention. The integrated calibration peak counts should be checked by the operator immediately after each run to confirm that the analyzer is operating satisfactorily. Calibration peak area counts should be greater than 20,000. Check daily records to compare and determine analyzer performance and stability.
4.1.2 Routine Calibrations (Description)
Routine calibrations must be performed at the beginning and end of each day, either manually or by using the automated routine calibration command (cmdAutoCalibCheck) in the CarbonNetWork database Command table.
4.1.2.1 Automated Routine Calibration (Description & Instructions)
The automated calibration uses the Carle valve to inject the methane standard once in a He-only atmosphere, once in a He/O2 atmosphere, and finally, the normal calibration peak at the end of analysis. The three peaks should have identical peak areas if the catalysts are in good condition and the calibration factor holds (See Figure 4-1). Use the following steps to perform this automated calibration:
• From the DRICarb.exe Welcome screen, select “Analysis” from the “Main” submenu.
• Set Type to “SAMPLE” and select cmdAutoCalibCheck from the drop-down menu in the “Command table” field.
• The project name should be “Calib”, the Batch # should be “0” and the sample ID should be in the format “CxxYYYYMMDD” where “xx” is the analyzer number (e.g. C0720050710 for analyzer number 7, run on July 10, 2005).
• Set the Run # (“1” for first calibration of the day and “2” for second calibration of the day, etc.). Enter “1” in the Punch area, and Deposit area fields. Click on “OK” and then click “Run”.
• Review the thermogram and record these values in the logbook as shown in Figure 2-7. The three calibration peak counts (OC3, EC1, LtPyMid) should be above 20,000 and should be almost identical in area (and within 10% of the “Calibration Peak Area” value show on the tabular printouts). Check the average C value for the calibration gas against those posted on each carbon analyzer.

DRI STANDARD OPERATING PROCEDURE Page: 49 of 79 Date: July 15, 2005 Title: DRI Model 2001 Thermal/Optical Carbon Analysis Number: 2-216.2 (TOR/TOT) of Aerosol Filter Samples - Method IMPROVE_A Revision: 3
• Whenever the MnO2 or Ni catalyst is replaced, an automated routine calibration should be run to confirm that the previous calibration curve holds.
Figure 4-1. Calibration thermogram from the cmdAutoCalibCheck command of the DRI Model 2001 Thermal/Optical Carbon Analyzer.
4.1.2.2 Manual Routine Calibration (Instructions)
• From the DRICarb.exe Welcome screen, select “Analysis” from the “Main” submenu.
• Set Type to “CALIB” and select cmdCalib-HeO2 (for example) from the drop-down menu in the “Command table” field.
DRI STANDARD OPERATING PROCEDURE Page: 50 of 79 Date: July 15, 2005 Title: DRI Model 2001 Thermal/Optical Carbon Analysis Number: 2-216.2 (TOR/TOT) of Aerosol Filter Samples - Method IMPROVE_A Revision: 3
• A project name is not required. The sample ID should be in the format “MIxYYYYMMDD” for CH4 injection or “CIxYYYYMMDD” for CO2 injection where x is the analyzer number (e.g. MI720050710 for a CH4 injection on analyzer number 7, run on July 10, 2005).
• Set the Run # (“1” for first calibration of the day and “2” for second calibration of the day, etc.). Enter “1” in the Punch area, and Deposit area fields. Click on “OK” and then click “Run”.
• Select the atmosphere for calibration under the “Cal Gas” (either CH4 or CO2) menu and select the proper “Carrier Gas” (either HeO2 or He; HeO2 for beginning of day and HE only for end of day). These should be alternated with the calibration gas. Verify the command table matches the options selected.
• Choose “OK” to proceed with the analysis, or “Exit” to leave the program. The analysis will start with the following screen as shown in Figure 4-2. You will note that the top portion contains all the information in the analysis Setup screen. The bottom half will display the thermogram when the run is initiated.
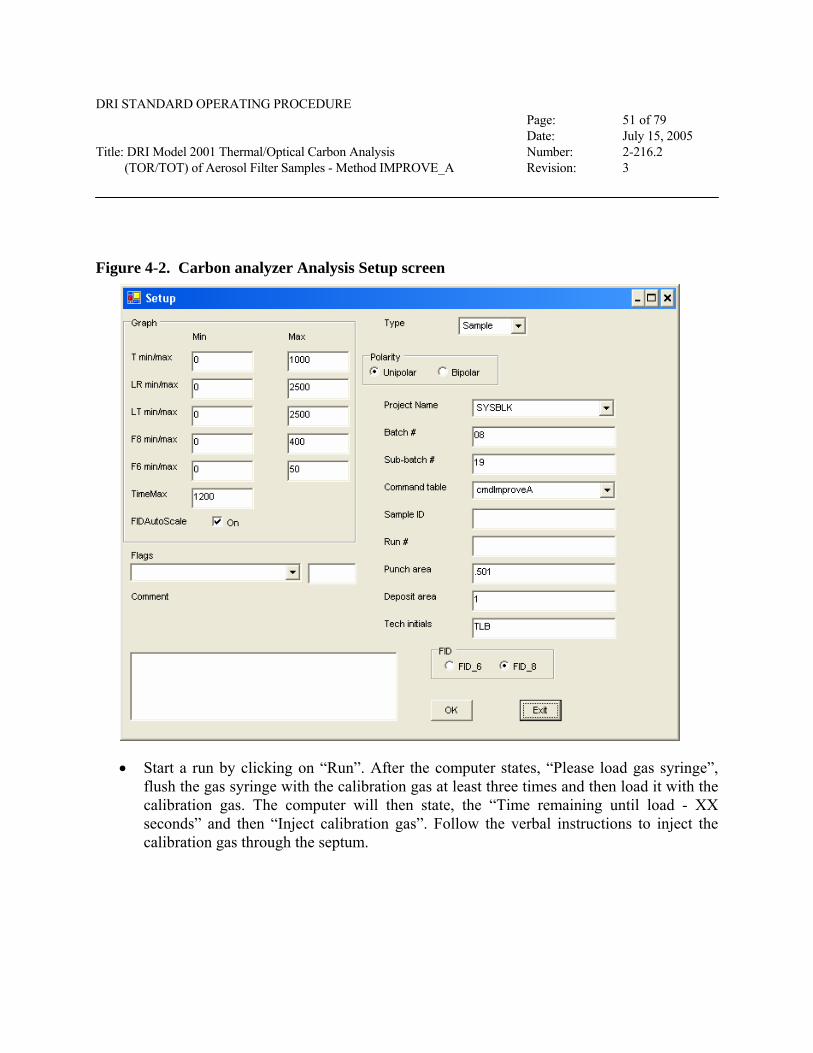
DRI STANDARD OPERATING PROCEDURE Page: 51 of 79 Date: July 15, 2005 Title: DRI Model 2001 Thermal/Optical Carbon Analysis Number: 2-216.2 (TOR/TOT) of Aerosol Filter Samples - Method IMPROVE_A Revision: 3
Figure 4-2. Carbon analyzer Analysis Setup screen
• Start a run by clicking on “Run”. After the computer states, “Please load gas syringe”, flush the gas syringe with the calibration gas at least three times and then load it with the calibration gas. The computer will then state, the “Time remaining until load - XX seconds” and then “Inject calibration gas”. Follow the verbal instructions to inject the calibration gas through the septum.

DRI STANDARD OPERATING PROCEDURE Page: 52 of 79 Date: July 15, 2005 Title: DRI Model 2001 Thermal/Optical Carbon Analysis Number: 2-216.2 (TOR/TOT) of Aerosol Filter Samples - Method IMPROVE_A Revision: 3
• Calibration gas injections should be in the following ranges for 100 µl gas:
Manual Injection Lower Allowable Limit Upper Allowable Limit CH4 20.36 µg carbon 1 * 22.50 µg carbon 1 * CO2 20.28 µg carbon 2 * 22.41 µg carbon 2 * Final Calibration Peak 20,000 --
1 Calculated in a real laboratory environment. For a 5.12% CH4 standard at 646 mm Hg at 24 °C, actual mass of methane is 21.43 µg carbon.
2 Calculated in a real laboratory environment. For a 5.10% CO2 standard at 646 mm Hg at 24 °C, actual mass of carbon dioxide is 21.34 µg carbon.
* Lower Allowable Limit equals to 5% lower than the actual mass; Upper Allowable Limit equals to 5% higher than the actual mass. Limits should be adjusted according to the real laboratory environment.
• Note: Each time the MnO2 or Ni catalyst is replaced, the instrument calibration should be checked to confirm that the previous calibration curve holds. This can be done by running two points from the six CH4/He calibration volumes and two points from the six CO2/He volumes used in the full calibration.
4.1.3 Full Calibration (Description)
Full instrument calibration, performed semi-annually, establishes the calibration slope used in converting counts to µg of carbon, as explained in the next section. Instrument calibration involves spiking pre-fired quartz punches with 5.0 to 20.0 µl of the 1800 ppm KHP and sucrose solutions (Section 4.1) and injecting 100 to 1500 µl of the CO2 and CH4 gases.
Four types of standards are used to calibrate the carbon analyzers: 5% nominal CH4 in He, 5% nominal CO2 in He, KHP, and sucrose. Only the calibration gases are used on a daily basis as analyzer performance monitors. KHP and sucrose are used in conjunction with CH4 and CO2 semiannually to establish the calibration curve of each analyzer.
4.1.3.1 Preparation, Ranges and Traceability of Standards
The calibration is done by injection of a known volume of the standard to yield a calibration curve of peak area ratio of injected carbon: CH4 (internal standard) versus µg of carbon injected (Internal Standard Calibration Method). For the best accuracy, the temperature and pressure at

DRI STANDARD OPERATING PROCEDURE Page: 53 of 79 Date: July 15, 2005 Title: DRI Model 2001 Thermal/Optical Carbon Analysis Number: 2-216.2 (TOR/TOT) of Aerosol Filter Samples - Method IMPROVE_A Revision: 3
the time of analysis need to be taken into account. For a 100% CH4 or CO2 standard at 760 mm Hg at 20 °C, each microliter = 0.499 µg carbon. For a 5% standard, it will be 0.02495 µg carbon/µl at standard temperature and pressure (STP; 20 °C, 760 mm Hg). The Ideal Gas Law should be used to correct for the temperature and pressure of the laboratory.
12gas cal of %0.08206
1273.15)(T1
760PaµLper C µg Acutal ××⎟
⎠⎞
⎜⎝⎛⎟⎟⎠
⎞⎜⎜⎝
⎛+
⎟⎠⎞
⎜⎝⎛=
where Pa is pressure in mmHg, T is ambient temperature.
The calibration gases are traceable to NIST standards. The calibration gases are assayed for exact concentrations by the gas supplier; the assay value is obtained from the tag on the cylinders and is typically determined by gas chromatography (GC).
To prepare an 1800 ppm standard, the KHP is dried at 110 °C for two hours before dispensing. Transfer 0.3826 g of KHP into a glass 100 ml volumetric flask after the KHP has come to room temperature inside a desiccator. The weight of KHP used must be recorded. Dilute to volume with 0.4 M concentrated hydrochloric acid (HCl) and 99.6 ml Nanopure water. Mix the KHP thoroughly. Store this solution in a refrigerator until it is used for calibration purposes. This solution is good for 40 days. Label the flask with the chemical name, the date of preparation, the name of the chemist preparing the solution, and the exact concentration. The concentration, nominally 1800 ppm carbon, is calculated by:
⎟⎠⎞
⎜⎝⎛ ×⎟⎟⎠
⎞⎜⎜⎝
⎛=
KHP ofMW 12 KHPin carbon of no
µlin prepsolution of volµgin used KHP ofweight µLper µgC Actual
⎟⎟⎠
⎞⎜⎜⎝
⎛⎟⎟⎠
⎞⎜⎜⎝
⎛⎟⎠⎞
⎜⎝⎛ ×⎟⎠⎞
⎜⎝⎛=
−
gµg 10
µlml 10
204.2312 8
ml 100used KHP ofweight 63
DRI STANDARD OPERATING PROCEDURE Page: 54 of 79 Date: July 15, 2005 Title: DRI Model 2001 Thermal/Optical Carbon Analysis Number: 2-216.2 (TOR/TOT) of Aerosol Filter Samples - Method IMPROVE_A Revision: 3
The nominal 1800 ppm sucrose solution is prepared by transferring 0.428 µg of sucrose into a glass 100 ml volumetric flask. Dilute to volume with acidified Nanopure water (see blank solution preparation instructions below). Mix the sucrose thoroughly. Store this solution in a refrigerator until it is used for calibration purposes. This solution is good for 40 days. Label the flask with the chemical name, the date of preparation, the name of the chemist preparing the solution, and the exact concentration. The concentration is calculated by:
⎟⎠⎞
⎜⎝⎛ ×⎟⎟⎠
⎞⎜⎜⎝
⎛=
sucrose ofMW 12 sucrosein carbon of no
µlin prepsolution of volµgin used sucrose ofweight µLper µgC Actual
⎟⎟⎠
⎞⎜⎜⎝
⎛⎟⎟⎠
⎞⎜⎜⎝
⎛⎟⎠⎞
⎜⎝⎛ ×⎟⎠⎞
⎜⎝⎛=
−
gµg 10
µlml 10
342.3112 12
ml 100µgin used sucrose ofweight 63
To prepare a blank solution, add 0.4 ml of concentrated HCl to a glass 100 ml volumetric flask and dilute to volume with Nanopure water. This acidified Nanopure water is made fresh each time a 1800 ppm KHP stock solution is prepared.
No primary standards (NIST-traceable) currently exist for carbon analysis. Ideally, such standards should include a range of organic compounds from low- to high-molecular weights and with varying degrees of susceptibility to pyrolysis, as well as EC and carbonate compounds. Currently, KHP, sucrose, and the two calibration gases are used at DRI for calibration and system audit purposes.
4.1.3.2 Calculating Calibration Slope
The calibration slopes derived from the two gases and the KHP- and sucrose-spiked filter punches are averaged together to yield a single calibration slope for a given analyzer. This slope represents the response of the entire analyzer to generic carbon compounds and includes the efficiencies of the oxidation and methanator zones and the sensitivity of the FID. Note that the current calibration procedure is based only on TC, as no routine procedure exists to check the accuracy of the OC/EC split. An example of the spreadsheet is shown in Figure 4-3.

DRI STANDARD OPERATING PROCEDURE Page: 55 of 79 Date: July 15, 2005 Title: DRI Model 2001 Thermal/Optical Carbon Analysis Number: 2-216.2 (TOR/TOT) of Aerosol Filter Samples - Method IMPROVE_A Revision: 3
Figure 4-3. Example of calibration summary worksheet used to determine calibration slope.
Calibration volume C in CH4/He Injection Calibration Injection/Standard Run # (µL) (µg) Peak Counts Peak Counts Calibration Slope
CH4 MI0719-3 100 2.14 2531 25076 0.1009 21.16CH4 MI0719-4 250 5.34 6171 24962 0.2472 21.60CH4 MI0719-5 500 10.68 12563 24977 0.5030 21.23CH4 MI0719-6 1000 21.36 24589 24907 0.9872 21.63CH4 MI0719-7 1000 21.36 25164 25120 1.0018 21.32CH4 MI0719-11 1500 32.03 37275 25207 1.4788 21.66CO2 CI0508-2 100 2.13 2488 25135 0.0990 21.49CO2 CI0508-3 250 5.32 6066 24932 0.2433 21.86CO2 CI0508-4 500 10.64 12294 24918 0.4934 21.56CO2 CI0508-5 1000 21.27 24531 24942 0.9835 21.63CO2 CI0508-6 1000 21.27 25123 25221 0.9961 21.36CO2 CI0508-9 1500 31.91 36300 25172 1.4421 22.13SUC SUC5-2 5 9.04 11266 25753 0.4375 20.67SUC SUC10 10 18.09 22904 25320 0.9046 20.00SUC SUC15-1 15 27.13 33168 25130 1.3199 20.56SUC SUC15-2 15 27.13 32668 25114 1.3008 20.86SUC SUC20 20 36.18 44168 25230 1.7506 20.67KHP KHP5-2 5 9.17 10968 25143 0.4362 21.01KHP KHP10 10 18.33 22160 25335 0.8747 20.96KHP KHP15-1 15 27.50 33042 24571 1.3448 20.45KHP KHP15-2 15 27.50 33165 24730 1.3411 20.50KHP KHP20 20 36.66 43276 24853 1.7413 21.06
Slope: 21.05 Scatter: 0.1619 Correlation: 0.99857
4.1.3.3 Typical Accuracy of Calibration Standards
The accuracy of the calibration standards is primarily limited by the accuracy of the calibration gas assays, the accuracy of the preparation of the KHP and sucrose solutions, and the technician’s injection technique. The calibration slopes determined by these four compounds historically differ by less than 5% on a given analyzer if sufficient care is taken during the calibration procedure (Section 4.1). Figure 4-4 shows an example of plotted calibration curves.
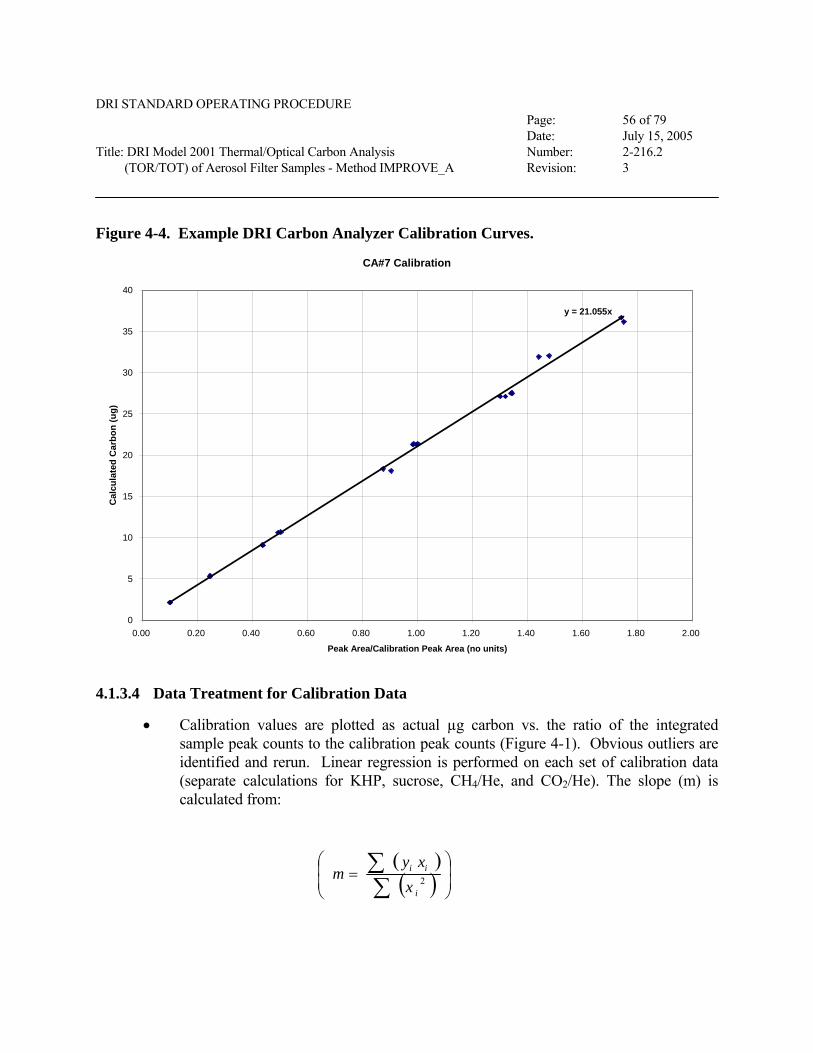
DRI STANDARD OPERATING PROCEDURE Page: 56 of 79 Date: July 15, 2005 Title: DRI Model 2001 Thermal/Optical Carbon Analysis Number: 2-216.2 (TOR/TOT) of Aerosol Filter Samples - Method IMPROVE_A Revision: 3
Figure 4-4. Example DRI Carbon Analyzer Calibration Curves.
CA#7 Calibration
y = 21.055x
0
5
10
15
20
25
30
35
40
0.00 0.20 0.40 0.60 0.80 1.00 1.20 1.40 1.60 1.80 2.00
Peak Area/Calibration Peak Area (no units)
Cal
cula
ted
Car
bon
(ug)
4.1.3.4 Data Treatment for Calibration Data
• Calibration values are plotted as actual µg carbon vs. the ratio of the integrated sample peak counts to the calibration peak counts (Figure 4-1). Obvious outliers are identified and rerun. Linear regression is performed on each set of calibration data (separate calculations for KHP, sucrose, CH4/He, and CO2/He). The slope (m) is calculated from:
( )( ) ⎟⎟⎠
⎞⎜⎜⎝
⎛=∑∑
2i
ii
xxy
m
DRI STANDARD OPERATING PROCEDURE Page: 57 of 79 Date: July 15, 2005 Title: DRI Model 2001 Thermal/Optical Carbon Analysis Number: 2-216.2 (TOR/TOT) of Aerosol Filter Samples - Method IMPROVE_A Revision: 3
The standard deviation (s) is calculated by:
where:
and:
• Note that this is a special form of the regression formula which ensures that the curve passes through the origin.
• The resulting slope is compared to previous calibration results. New values should be no more than ±10% different than previous calibrations if no major analyzer changes have been made. If variation is >10%, calibration must be redone to verify values.
• The new slope for each analyzer (derived from combined CH4, KHP, and sucrose data) is placed into the Carbon.par file for each analyzer; this file contains analyzer parameters which are read into the Carbon program when it is first started. The date and version number in the Carbon.par file is also updated.
• Calibration data and plots are retained in file folders in the file cabinet with raw analysis data.
( )∑
∑ −
−= 2
2
11
i
ii
x
mxyn
σ
( )( )
xinjected carbon peak area
calibration peak areai =
( )y calculated carbon in spiked filter or manual injection gi = µ
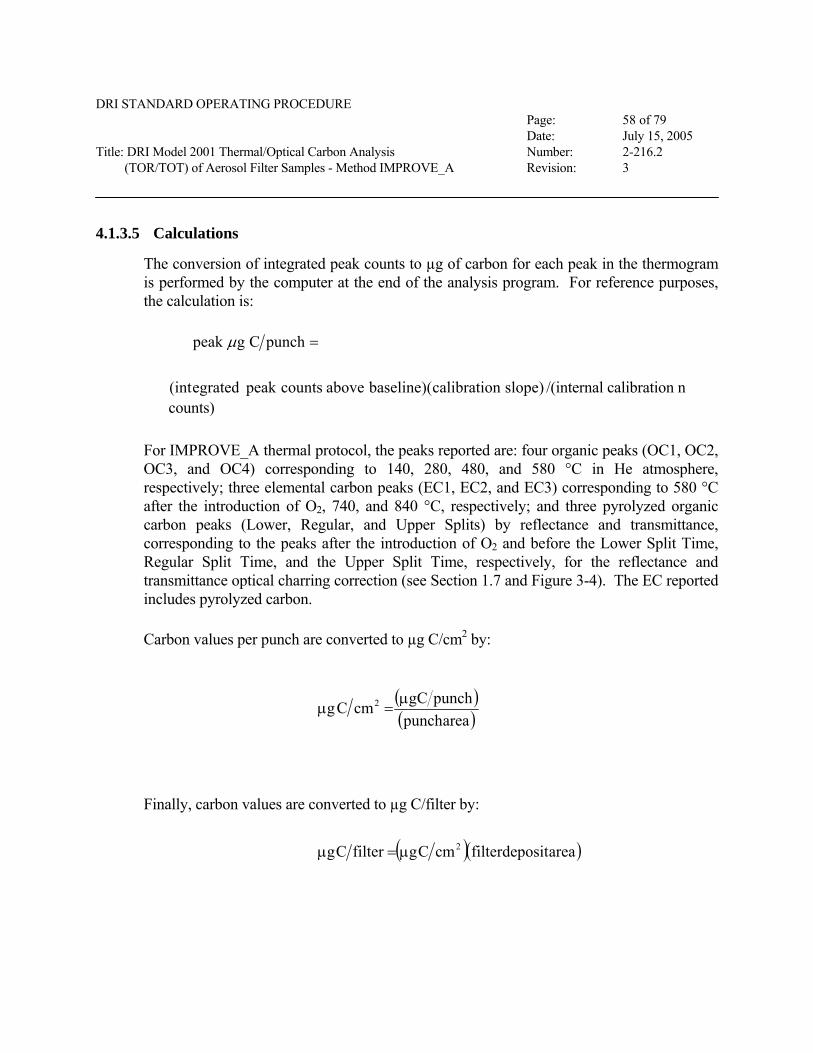
DRI STANDARD OPERATING PROCEDURE Page: 58 of 79 Date: July 15, 2005 Title: DRI Model 2001 Thermal/Optical Carbon Analysis Number: 2-216.2 (TOR/TOT) of Aerosol Filter Samples - Method IMPROVE_A Revision: 3
4.1.3.5 Calculations
The conversion of integrated peak counts to µg of carbon for each peak in the thermogram is performed by the computer at the end of the analysis program. For reference purposes, the calculation is:
For IMPROVE_A thermal protocol, the peaks reported are: four organic peaks (OC1, OC2, OC3, and OC4) corresponding to 140, 280, 480, and 580 °C in He atmosphere, respectively; three elemental carbon peaks (EC1, EC2, and EC3) corresponding to 580 °C after the introduction of O2, 740, and 840 °C, respectively; and three pyrolyzed organic carbon peaks (Lower, Regular, and Upper Splits) by reflectance and transmittance, corresponding to the peaks after the introduction of O2 and before the Lower Split Time, Regular Split Time, and the Upper Split Time, respectively, for the reflectance and transmittance optical charring correction (see Section 1.7 and Figure 3-4). The EC reported includes pyrolyzed carbon.
Carbon values per punch are converted to µg C/cm2 by:
Finally, carbon values are converted to µg C/filter by:
peak g C punchµ =
(int )( )egrated peak counts above baseline calibration slope /(internal calibration n counts)
( )( )areapunch
punchCgcmCg 2 µ=µ
( )( )areadepositfiltercmCgfilterCg 2µ=µ

DRI STANDARD OPERATING PROCEDURE Page: 59 of 79 Date: July 15, 2005 Title: DRI Model 2001 Thermal/Optical Carbon Analysis Number: 2-216.2 (TOR/TOT) of Aerosol Filter Samples - Method IMPROVE_A Revision: 3
Precision calculations are performed as the data is merged into the final database (Section 5.5).
4.2 Instrument Calibration Instructions 4.2.1 Full Gas Calibration
• To perform the full calibration, select “Analysis” from the Main menu of the DRICarb.exe program Welcome screen.
• Choose “CALIB” under the “Type” drop down menu. In the Command table drop-down, select cmdCalib-He (for example). Fill out the Sample ID, Run #, and Tech Initials fields. The sample ID should be in the format, “MIxYYYYMMDD_zzz” (where “MI” is for CH4 injection; use “CI” for CO2 injection; x is for the analyzer number and zzz is the volume of gas injected). You can also select FID ID (typically FID_8) to determine the FID peak area and make comments and flag the analysis from this screen before the analysis starts.
• Select the atmosphere for calibration under the “Cal Gas” menu and select the proper “Carrier Gas”. Verify the command table matches the options selected.
• Enter the technician initials in the “Tech initials” field.
• Choose “OK” to run the analysis, or “Exit” to leave the program. The analysis will start with the screen as shown in Figure 3-3. You will note that the top portion contains all the information in the Setup screen. The bottom half will display the thermogram when the run is initiated.
• Start a run by clicking on the Run command button. After the computer states “Please load gas syringe” flush the gas syringe with the calibration gas at least three times and then load it with the calibration gas. Time remaining until load will be stated, and then “Inject calibration gas”. Inject the gas through the septum. Hold the plunger down with needle still inside septum for 10 seconds, or until peak appears.
• The CO2 and CH4 calibrations are run using the “Calibration” options from the main menu. The following volumes are injected:
• 100 µl CO2 gas (use 1000 µl syringe) • 250 µl CO2 gas (use 1000 µl syringe) • 500 µl CO2 gas (use 1000 µl syringe)

DRI STANDARD OPERATING PROCEDURE Page: 60 of 79 Date: July 15, 2005 Title: DRI Model 2001 Thermal/Optical Carbon Analysis Number: 2-216.2 (TOR/TOT) of Aerosol Filter Samples - Method IMPROVE_A Revision: 3
• 1000 µl CO2 gas (do once with 1000 µl syringe and once with 2500 µl syringe)
• 1500 µl CO2 gas (do with 2500 µl syringe)
• Repeat for CH4
• Record these calibration values in the logbook as in Figure 2-7.
• The integrated peak counts are extracted manually from the tabular printouts and entered into the spreadsheet which is used to determine the final calibration. The total peak is calculated by adding the peak area from OC1, OC2, OC3, and OC4, as well as EC1, EC2, and EC3. Pyrolysis counts are not included in the total.
4.2.2 Full Sucrose and KHP Calibrations • To perform the full calibration, select “Analysis” from the Main menu of the
DRICarb.exe program Welcome screen.
• Choose “Calib” under the “Type” drop down menu. Complete the information about the sample, including: Project Name, Batch #, and Sub-batch #. The Project Name should be “CALIB” and the Batch # should be “SUKHPCAL”.
• A clean blank quartz punch is baked in the analyzer oven at 900 °C for 10 minutes using cmdBakeOven from the Command Table.
• After baking the quartz punch, change to cmdImproveA under Command Table.
• Perform system blank before running KHP or sucrose.
• Enter the Sample ID number or place your mouse cursor in the field. The sample ID should be in the format, “SUxYYYYmmdd_zzz” (where “SU” is for sucrose spiking; use “KHP” for KHP spiking; x is the analyzer number and zzz is the volume [05, 10, 15, or 20 µl]). You can also select FID ID (typically FID_8) to determine the FID peak area and make comments and flag the analysis from this screen before the analysis starts.
• Enter the Run #; the Punch area and Deposit area should be “1” for the filter being analyzed.
• Enter technician initials in the “Tech initials” field.

DRI STANDARD OPERATING PROCEDURE Page: 61 of 79 Date: July 15, 2005 Title: DRI Model 2001 Thermal/Optical Carbon Analysis Number: 2-216.2 (TOR/TOT) of Aerosol Filter Samples - Method IMPROVE_A Revision: 3
• After the punch has cooled to less than 50 °C, the KHP or sucrose solution (prepared as described in Section 4.1.3.1 and kept at room temperature) is injected onto the punch using a 25 µl syringe. The following volumes are used:
• 5 µl KHP and sucrose solution • 10 µl KHP and sucrose solution • 15 µl KHP and sucrose solution (do twice) • 20 µl KHP and sucrose solution • no injection (as a system blank; see Section 3.1.5.1) • 20 µl acidified Nanopure water only (check of background level of Nanopure
water)
• Flush the syringe at least three times with the calibration solution before taking up the volume for injection. Pump the syringe plunger to remove any trapped bubbles.
• Slowly spike the solution in the center of quartz punch and wash the syringe with Nanopure after use. If the solution is spiked too quickly it will bead up and run off the punch.
• Click “OK” on the analysis “Setup” screen. The boat will load to the calibration position.
• The computer will ask, “Would you like to proceed or would you like to delay analysis?” Enter the length of time in seconds you wish to delay the beginning of the analysis in the Delay box. This is used to purge dry a filter disc that has been deposited with an aliquot of KHP or sucrose standard solution, or when the sample is acidified for carbonate removal. In general, allow ~1 minute of purge time for every µl of solution deposited (e.g., 5 µl=300s, 10µl=600s, 15µl=900s and 20µl=1200s). Click “OK” and analysis will begin.
• Allow the punch to dry thoroughly; the punch will turn from translucent to opaque as it dries. The punch must be dry to avoid water vapor effects on the FID and the laser reflectance and transmittance signals. Select the cmdImproveA option from the analysis menu to start.
• The integrated peak counts for all seven temperature fractions for the sample and calibration peaks are recorded. The total peak is calculated by adding the peak area from OC1, OC2, OC3, and OC4, as well as EC1, EC2, and EC3. Pyrolysis counts are not included in the total.

DRI STANDARD OPERATING PROCEDURE Page: 62 of 79 Date: July 15, 2005 Title: DRI Model 2001 Thermal/Optical Carbon Analysis Number: 2-216.2 (TOR/TOT) of Aerosol Filter Samples - Method IMPROVE_A Revision: 3
5 TEMPERATURE CALIBRATIONS Temperature calibrations are performed semiannually on all instruments to verify that the sample temperature is as accurate as possible.
5.1 Temperature Indicators
Since it is not possible to sense the temperature of the sample directly, materials were sought that: 1) could be placed where the sample would normally be located, and 2) would cause sharp reactions when known temperatures were achieved. Quick-drying temperature-indicating liquids of different melting points, Tempilaqº G (Tempil, Inc., South Plainfield, NJ, USA), were used as temperature indicators in muffle furnaces. A Tempilaqº G set contains long-chain hydrocarbons suspended in an organic solvent, which change their appearance at 44 specific temperatures spanning 80-100 °C. The accuracy of Tempilaq° G is certified within ±1% of its designated temperature and is traceable to the National Institute of Standards and Technology (NIST). Tempilaqº G is bottled in liquid form and dries quickly to a dull, opaque film when applied to a surface. As the surface is heated to the designated temperature, the film liquefies and is accompanied by a change of appearance that can be optically monitored to determine sample temperature.
5.1.1 Standard Preparation
Temperature calibration requires two pre-fired quartz-fiber filter (#2500 QAT-UP, Pall Life Sciences, Ann Arbor, MI) punches (0.3 cm2 and 0.5 cm2 for DRI analyzer) and a clean matching-sized quartz disk (Continental Glass Engineering, Burbank, CA). Quartz-fiber filter punches are sliced in half with a filter-slicing device (Fung et al., 2004). A thin layer of Tempilaqº G (25 µL) is uniformly applied to the quartz disk surface with a 0.1 ml Eppendorf graduated Combitip (Brinkman Instruments Inc., Westbury, NY), and, before drying, is immediately covered with a sliced filter punch. For cost savings, a glass, instead of quartz, disk can be used for Temiplaqº G at temperatures less than 520 °C. Higher temperatures require the quartz disc to prevent melting. The disc sandwich (i.e., temperature standard) is then loaded on a sample holder for analysis. The mass of applied Tempilaqº G is determined gravimetrically to ensure its mass is ~10%.
5.1.2 Temperature Program
After insertion of the temperature standard into the analyzer, the temperature is slowly (2 °C/min) ramped across a 50 °C range containing the specified Tempilaq° G melting point. This slow ramping creates a quasi-equilibrium condition that allows the phase transition point to be resolved. When the specified temperature is reached, the Tempilaqº G liquefies, causing a sharp change in reflectance and transmittance.

DRI STANDARD OPERATING PROCEDURE Page: 63 of 79 Date: July 15, 2005 Title: DRI Model 2001 Thermal/Optical Carbon Analysis Number: 2-216.2 (TOR/TOT) of Aerosol Filter Samples - Method IMPROVE_A Revision: 3
Figure 5-1 demonstrates the thermocouple temperature, reflectance, and transmittance as a function of thermal analysis time. In the example provided, the reflectance and transmittance remained relatively flat until the temperature approaches its specified value of 184 °C. Figure 5-2 compares the time series of reflectance, transmittance, and their respective first- and second-order derivatives. The second-order derivative (change in the slope) recorded the inflection point of reflectance or transmittance that provided the best indication of the attainment of the designated temperature. Thermocouple temperature at this critical point was recorded as “measured” temperature. The temperature deviation (∆T) between the sample and the thermocouple temperatures is determined by comparing the rated Tempilaqº G temperature with this measured value (Chow et al., 2005).
In the Model 2001, the reflectance-based method generally gave a lower liquefying temperature than the transmittance-based method, within ±2 ºC. Given the uncertainty in the Tempilaqº G temperature rating of ±1%, calibrations based on the two optical methods were considered to be equivalent; therefore, their means were used. Among temperature indicators that achieve an adequate signal/noise ratio, temperature indicators of 140, 280, 480, 580, 740, and 840 °C were chosen for IMPROVE_A protocol temperature calibration (Chow et al., 2005).
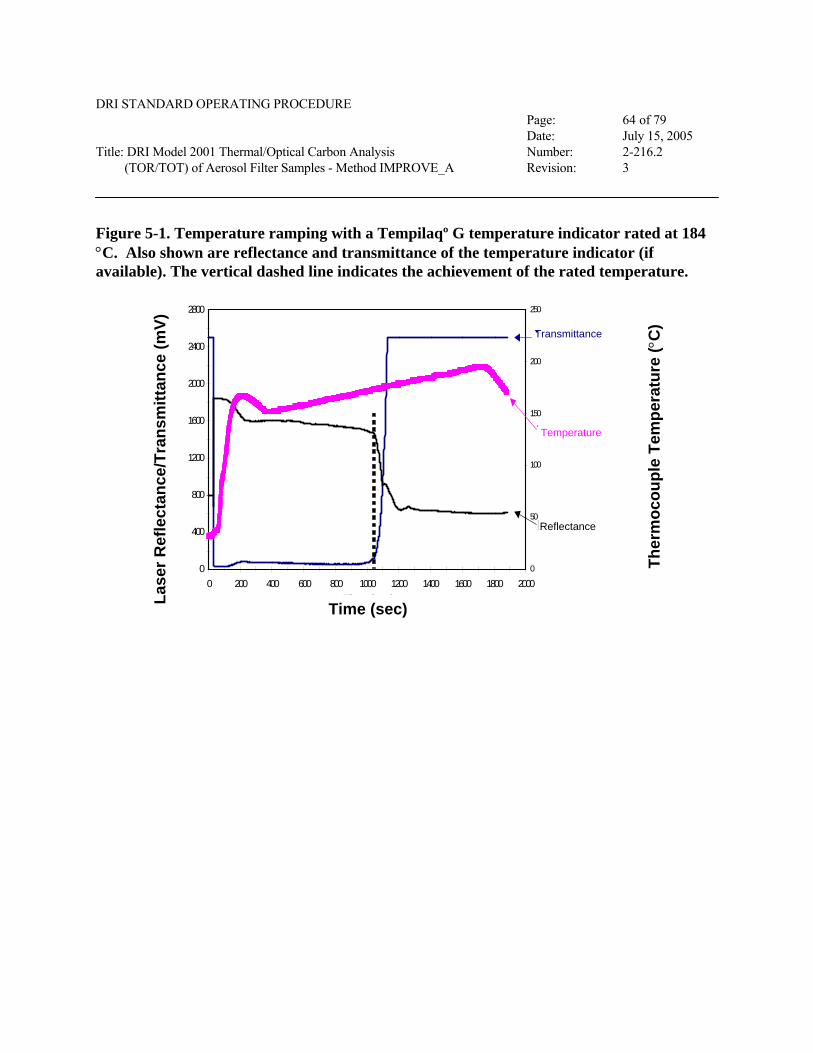
DRI STANDARD OPERATING PROCEDURE Page: 64 of 79 Date: July 15, 2005 Title: DRI Model 2001 Thermal/Optical Carbon Analysis Number: 2-216.2 (TOR/TOT) of Aerosol Filter Samples - Method IMPROVE_A Revision: 3
Figure 5-1. Temperature ramping with a Tempilaqº G temperature indicator rated at 184 °C. Also shown are reflectance and transmittance of the temperature indicator (if available). The vertical dashed line indicates the achievement of the rated temperature.
0
400
800
1200
1600
2000
2400
2800
0 200 400 600 800 1000 1200 1400 1600 1800 2000
Time (sec)
0
50
100
150
200
250
Transmittance Reflectance Temperature
Lase
r Refl
ectan
ce/Tr
ansm
ittan
ce (m
V)
Transmittance
Reflectance
Temperature
Th
erm
ocou
ple
Tem
pera
ture
(°C
)
Transmittance
Temperature
Reflectance
Lase
r Ref
lect
ance
/Tra
nsm
ittan
ce (m
V)
Time (sec)

DRI STANDARD OPERATING PROCEDURE Page: 65 of 79 Date: July 15, 2005 Title: DRI Model 2001 Thermal/Optical Carbon Analysis Number: 2-216.2 (TOR/TOT) of Aerosol Filter Samples - Method IMPROVE_A Revision: 3
Figure 5-2. Reflectance and transmittance measurements and their first and second derivatives over time with a Tempilaqº G temperature indicator rated at 184 °C (Figure 5-1). The vertical dashed line indicates the achievement of the rated target temperature.
0
400
800
1200
1600
2000
2400
2800
0 200 400 600 800 1000 1200 1400 1600 1800 2000Time (sec)
-35
-25
-15
-5
5
15
25
35
Firs
t/Sec
ond
Der
ivat
ive
Lase
r Ref
lect
ance
/Tra
nsm
ittan
ce (m
V)
(Tempilaq’s melting point 184 ± 2 ºC)
Transmittance
Reflectance
1st Reflectance Derivative
1st Transmittance Derivative
2nd Reflectance Derivative2nd Transmittance Derivative
6 QUALITY CONTROL
6.1 Performance Testing
System blanks are performed at the beginning of each day to confirm the system is not introducing bias in the carbon results and to confirm that the laser signal is not temperature-dependent. Contamination is potentially due to:
• Operator practices, such as improper cleaning of tweezers and punch.

DRI STANDARD OPERATING PROCEDURE Page: 66 of 79 Date: July 15, 2005 Title: DRI Model 2001 Thermal/Optical Carbon Analysis Number: 2-216.2 (TOR/TOT) of Aerosol Filter Samples - Method IMPROVE_A Revision: 3
• Teflon particles on the push rod getting into the heated zone of the quartz oven.
• Sample boat contamination.
• Contamination of the carrier gas.
• Fibers left on the punch tool or on the flat glass plate during cleaning.
• Contamination from field operator.
• Contamination from normal use of analyzer.
A temperature-dependent laser signal is potentially due to:
• Physical coupling of the push rod to the boat during the run.
• Boat movement due to loose boat holder.
• A quartz rod (laser light pipe) ready for replacement. As quartz is heated to high temperatures, devitrification (white deposits of SiO2) occurs that leads to a decrease in the laser intensity. The end surface becomes frosty. The bottom light pipe also receives droppings of quartz particles from filter discs during analysis. Thus, the bottom light pipe will deteriorate faster than the upper light pipe. Microscopic cracks in the quartz rod will increase internal reflectance of the laser light; as the number of these cracks multiply, the effect of temperature on these cracks, and thus on the reflectance, becomes an interference in the laser signal.
As described in Section 4.1, the calibration peak at the end of each analysis run serves as a regular standard; the integrated area under the calibration peak serves as a measure of analyzer performance. In addition, the daily injections of two calibration gases further serve as standards. Primary standards in the form of NIST-traceable spiked filter punches do not exist. The cmdAutoCalibCheck command check allows the condition of the catalysts to be monitored and verified.
DRI STANDARD OPERATING PROCEDURE Page: 67 of 79 Date: July 15, 2005 Title: DRI Model 2001 Thermal/Optical Carbon Analysis Number: 2-216.2 (TOR/TOT) of Aerosol Filter Samples - Method IMPROVE_A Revision: 3
6.2 Reproducibility Testing
Replicates of analyzed samples are performed at the rate of one per group of ten samples. The replicate is selected randomly and run immediately after a group of ten is completed. It is run on a randomly selected analyzer (it can be the same or a separate analyzer as the original). This practice provides a better indication of potential differences if samples are analyzed by different laboratories. The µg/cm2 values for OC, EC and TC are compared with the original run. The values should fall into the following criteria:
Range Criteria OC, EC & TC < 10 µg/cm2 < ±1.0 µg/cm2 OC and TC > 10 µg/cm2 < 10 % of average of the 2 values EC > 10 µg/cm2 < 20 % of average of the 2 values
Notice that the criteria converge at 10 µg/cm2. Replicates which do not fall within the above criteria must be investigated for analyzer or sample anomalies. Analyzer anomalies include poor response (as reflected in the calibration peak areas) or poor laser signals affecting the splits between OC and EC. Typical sample anomalies include inhomogeneous deposits or contamination during analysis or from the field sampling location. Inconsistent replicates for which a reason cannot be found must be rerun again.
When samples are analyzed with an automated sample loader, the sample chamber tray will be set up such that the loader number six location will be a replicate of the first sample, the 12th location a standard spike of sucrose or KHP, and the 18th location a replicate of the sample in loader position.
6.3 Control Charts and Procedures
Control charts are updated at the beginning of each month. These charts include a month of calibration data and are posted in the carbon room until the end of the month, after which they are filed with the raw analysis results.
The control chart gives a plot of calibration peak counts as percent deviation from a historical mean versus date. Instances where the calibration peak area deviates by more than 10% from the historical mean must be investigated and the cause must be corrected. The historical mean covers results from the previous three months and is updated either quarterly, when the CH4
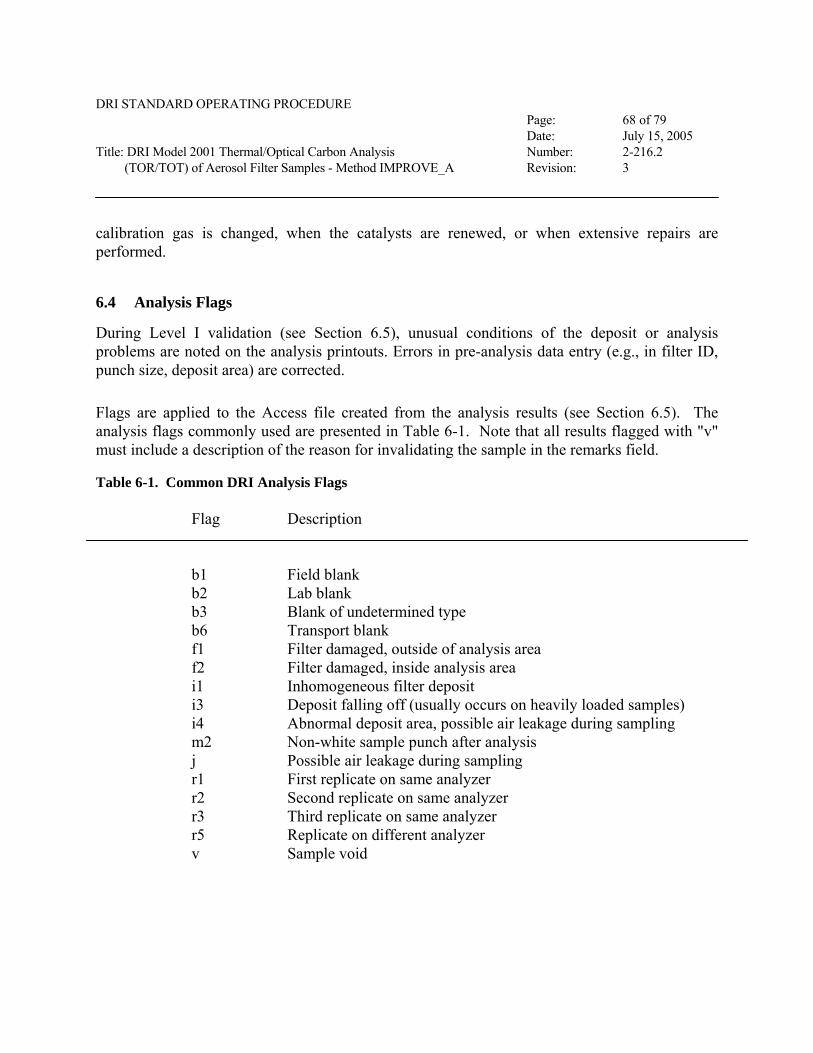
DRI STANDARD OPERATING PROCEDURE Page: 68 of 79 Date: July 15, 2005 Title: DRI Model 2001 Thermal/Optical Carbon Analysis Number: 2-216.2 (TOR/TOT) of Aerosol Filter Samples - Method IMPROVE_A Revision: 3
calibration gas is changed, when the catalysts are renewed, or when extensive repairs are performed.
6.4 Analysis Flags
During Level I validation (see Section 6.5), unusual conditions of the deposit or analysis problems are noted on the analysis printouts. Errors in pre-analysis data entry (e.g., in filter ID, punch size, deposit area) are corrected.
Flags are applied to the Access file created from the analysis results (see Section 6.5). The analysis flags commonly used are presented in Table 6-1. Note that all results flagged with "v" must include a description of the reason for invalidating the sample in the remarks field.
Table 6-1. Common DRI Analysis Flags Flag Description b1 Field blank b2 Lab blank b3 Blank of undetermined type b6 Transport blank f1 Filter damaged, outside of analysis area f2 Filter damaged, inside analysis area i1 Inhomogeneous filter deposit i3 Deposit falling off (usually occurs on heavily loaded samples) i4 Abnormal deposit area, possible air leakage during sampling m2 Non-white sample punch after analysis j Possible air leakage during sampling r1 First replicate on same analyzer r2 Second replicate on same analyzer r3 Third replicate on same analyzer r5 Replicate on different analyzer v Sample void

DRI STANDARD OPERATING PROCEDURE Page: 69 of 79 Date: July 15, 2005 Title: DRI Model 2001 Thermal/Optical Carbon Analysis Number: 2-216.2 (TOR/TOT) of Aerosol Filter Samples - Method IMPROVE_A Revision: 3
6.5 Data Validation and Feedback 6.5.1 Daily Validation
Level I validation is performed by manually checking the tabular and thermogram printouts the day after the analysis is performed. The laboratory supervisor or a designated technician is responsible for checking the data. The following items are checked on the tabular data (Figure 6-1):
• The filter ID is correct and Punch #.
• For calibration runs, the tabular and thermogram printouts are checked to make sure the catalysts are operating at required level.
• The analysis date and time is correct.
• The punch area is correct; errors in entry require that the calculated carbon concentrations be recalculated.
• The deposit area is correct; errors in entry require that the calculated carbon concentrations be recalculated by hand.
• The calibration peak area is in the correct range (Section 4.1).
• The initial and the final FID baseline readings are within three counts of each other; excessive FID baseline drift is a cause for re-analysis. NOTE: Some very heavily loaded filters will have an FID baseline drift greater than three counts no matter which carbon analyzer the sample is run on; typically a FID baseline drift greater than three counts signals either a problem with the run or with the carbon analyzer.
• The lower laser split time and the upper laser split time are within 10 seconds of each other. If the times differ by more than 10 seconds, check that the lower split OC and upper split OC differ by no more than 5%. OC values which differ by more than 5%, unless due to a small change in laser signal resulting from an extremely clean or very dark sample, requires re-analysis.
Calculated carbon values for calibration injection runs are within 10% of the current mean value for the injected gas type on that analyzer.
DRI STANDARD OPERATING PROCEDURE Page: 70 of 79 Date: July 15, 2005 Title: DRI Model 2001 Thermal/Optical Carbon Analysis Number: 2-216.2 (TOR/TOT) of Aerosol Filter Samples - Method IMPROVE_A Revision: 3
Acceptance runs for pre-fired quartz filters result in <1.5 µg/cm2 OC, <0.5 µg/cm2 EC, and <2.0 µg/cm2 TC for IMPROVE_A thermal protocol. Filters which exceed these levels must be re-fired.
Items which are found to be okay are underlined in red. Items which have problems are circled in red.

DRI STANDARD OPERATING PROCEDURE Page: 71 of 79 Date: July 15, 2005 Title: DRI Model 2001 Thermal/Optical Carbon Analysis Number: 2-216.2 (TOR/TOT) of Aerosol Filter Samples - Method IMPROVE_A Revision: 3
Figure 6-1. Tabular Output from the DRI Thermal/Optical Carbon Analyzer

DRI STANDARD OPERATING PROCEDURE Page: 72 of 79 Date: July 15, 2005 Title: DRI Model 2001 Thermal/Optical Carbon Analysis Number: 2-216.2 (TOR/TOT) of Aerosol Filter Samples - Method IMPROVE_A Revision: 3
The thermograms are checked for the following (Figure 3-5):
• The initial FID baseline is flat, indicating that the analyzer has been thoroughly purged before analysis began.
• The final FID baseline prior to the calibration peak is within three milliVolts of the initial FID baseline; excessive drift is cause for reanalysis.
• The laser reflectance signal during the first two minutes, prior to sample introduction to the “Analysis” position, appears near the bottom of the graph and shifts position once the sample is in the “Analysis” position. The transmittance signal will be out-of-scale until the sample is in the “Analysis” position.
• The laser signal should dip below the initial laser line until O2 is introduced, at which point the signal should rise steeply. (For most samples, charring does occur). High temperature soot samples may not show this characteristic.
• The temperature readings reflect stable and smooth temperatures at each level and quick transitions between levels.
• Problems or deviations from normal should be circled in red. If the sample punch taped to the thermogram is not white, it is also circled.
If examination of the tabular and thermogram printouts results in a decision that a sample should be reanalyzed, write "Rerun" in red on the printouts and prepare a re-analysis list. This list should be posted immediately after the validation is complete, and those samples should be rerun as soon as they can be conveniently fit into the current day's analyses.
Evidence of persistent analyzer problems must be resolved, either by physically examining the analyzer or reviewing the problems with the analyzer operator.
6.5.1.1 Validation of Final Data File
The following steps are followed to create an Excel file containing carbon data and to perform Level "I" validation on it:

DRI STANDARD OPERATING PROCEDURE Page: 73 of 79 Date: July 15, 2005 Title: DRI Model 2001 Thermal/Optical Carbon Analysis Number: 2-216.2 (TOR/TOT) of Aerosol Filter Samples - Method IMPROVE_A Revision: 3
• Each analyzer will have an Access database containing all of the raw carbon data.
• A query is used to generate the project data in µg/cm2 or µg/filter and a validation report is then generated from this query.
• The output of the Access query is saved as an Excel file for data validation and processing. The MS Excel file naming convention calls for a name in the following format:
xxOETnnt.xls
where:
xx is the two-character project identifier
OET stands for organic/elemental carbon
nn is the two-digit batch number (generally used to distinguish between different projects for the same client or between sampling quarters for an extended project)
t stands for the sample type based on sampler technology: A Agricultural burn emissions dilution sampler C Combination particle/gaseous sampler
D Dichotomous sampler for PM2.5, PMcoarse, and PM10 G Gaseous H High-volume sampler I IMPROVE/NPS sampler P MiniVol Sampler Q Audit samples R Resuspension chamber S Sequential filter sampler (SFS) W Wet Deposition X Unknown Y Y-sampler (DRI source sampler)
• The final MS Excel file name is specified on the analysis list posted in the carbon room.
DRI STANDARD OPERATING PROCEDURE Page: 74 of 79 Date: July 15, 2005 Title: DRI Model 2001 Thermal/Optical Carbon Analysis Number: 2-216.2 (TOR/TOT) of Aerosol Filter Samples - Method IMPROVE_A Revision: 3
• Begin validation by matching the filters listed on the analysis list with the filters listed on the MS Excel printout. There must be at least one entry on the printout for every filter listed on the analysis list.
• Flag field and lab blanks while the list is being reviewed by placing "b1", "b2", "b3", or "b6" in the second column of the printout. Because the MS Excel printout is sorted by ID number, replicates and reruns will be grouped together.
• Indicate missing data by writing the missing filter ID in the margin with an arrow drawn to the appropriate place of insertion. Scan the printout for unusual IDs which may have been mistyped or misread by the scanner during analysis. Generally, these will appear at the beginning or end of the printout, due to the sorting process. Make sure that all samples listed on a rerun list appear on the printout.
• Resolve all missing data. Scan the deposit area column for incorrect entries. Circle the incorrect entries to ensure that corrected values replace those currently in the database.
• Scan the filter IDs for multiple entries of ID numbers. Under normal conditions, the only times multiple entries should occur are reruns and replicates. All multiple entries must be flagged to indicate the reason for their existence.
• Scan for missing runs. The most common example is the first run being aborted or lost for some reason, and the only entry in the MS Excel file is the second run. An entry for the first run must be inserted, flagged as invalid, and labeled as to the reason it was invalid. All punches taken from the filters MUST be accounted for and documented in the file.
• Pull the analysis folders and go through the analysis summaries and thermograms one by one. At this time, resolve all circled items and all missing flags.
o Determine if analyses flagged by the operator are legitimate. These flags are determined by the operator at the end of the analysis run (Section 6.4) and are defined in Table 6-2.
o If the temporary flag is not warranted, draw a line through the flag to indicate that it should be removed.
o If the sample should be rerun, add it to a rerun list.

DRI STANDARD OPERATING PROCEDURE Page: 75 of 79 Date: July 15, 2005 Title: DRI Model 2001 Thermal/Optical Carbon Analysis Number: 2-216.2 (TOR/TOT) of Aerosol Filter Samples - Method IMPROVE_A Revision: 3
o If the analysis has some anomaly, but still appears to be legitimate, either flag or add notes to the comments field as appropriate.
o Analysis flags are defined in Section 6.4.
o All samples flagged as invalid must have an entry in the comments field to describe the reason that the sample is invalid. Typical notes and comments are presented in Table 6-3.
• Scan the OC and EC columns looking for unusually high or low values. At this time make sure that the field blanks and/or lab blanks are all close to one another. Circle any possible outliers for further investigation.
• Compare replicates against original run. The values should meet the following criteria:
Range Criteria OC, EC & TC < 10 µg/cm2 < ±1.0 µg/cm2 OC and TC > 10 µg/cm2 < 10 % of average of the 2 values EC > 10 µg/cm2 < 20 % of average of the 2 values
• Check the OC/TC ratio. Typically it should not be less than 0.65. Circle any possible outliers for further investigation.
• Scan for records where EC is greater than OC. These may require additional investigation, depending on loading and sample source. Circle records for further investigation.
• Scan blanks for OC being greater than 3.95*deposit area and for EC greater than the deposit area. Rerun any unusually high blanks.
• Compare primary and secondary filters for validity. Secondary filters should have OC and EC measurements less than the corresponding primary filter. Secondary filters should have EC less than or equal to 3.8. OC should be less than or equal to 18. Circle any records that require further investigation.
• All operator-generated flags must be either converted to standard analysis flags (Table 6-1) or removed. The flags in Table 6-2 are temporary flags only and are not recognized as legitimate analysis flags at DRI.

DRI STANDARD OPERATING PROCEDURE Page: 76 of 79 Date: July 15, 2005 Title: DRI Model 2001 Thermal/Optical Carbon Analysis Number: 2-216.2 (TOR/TOT) of Aerosol Filter Samples - Method IMPROVE_A Revision: 3
• After all thermograms have been reviewed and all possible reruns have been identified, post the rerun list in the carbon room and have the reruns done as soon as possible.
• Review the data from the reruns, looking for inconsistencies. Confirm that the reasons for the rerun have been addressed. Mark the printout with the new values for manual insertion into the MS Excel file. Previous runs must be flagged as invalid or the reruns flagged as replicates.
• Finally, all comments, flags, insertions, and other changes made to the printout are entered into the MS Excel file. After all changes are made, generate a new printout. Label the new printout with the file name and printout date. Forward a copy of the printout and the MS Excel file on disk to the person putting the final report together.
Table 6-2. DRI Carbon Analysis Temporary Flags Flag Description EI Error in sample ID EA Error in sample deposit area ST Suspect temperature profile SF Suspect FID signal SL Suspect laser signal Mi Miscellaneous problem m2 Non-white sample punch after analysis v Invalid run r Replicate b Blank i Inhomogeneous f Filter media damaged g Sample deposit damaged d Sample dropped n Foreign substance on filter w Sample wet
DRI STANDARD OPERATING PROCEDURE Page: 77 of 79 Date: July 15, 2005 Title: DRI Model 2001 Thermal/Optical Carbon Analysis Number: 2-216.2 (TOR/TOT) of Aerosol Filter Samples - Method IMPROVE_A Revision: 3
Table 6-3. DRI Carbon Analysis Validation Comments Comments Description "Anomalous laser" Despite good initial laser, laser signal drifted
above initial laser signal before dropping (typical of auto emissions).
"Operator error" Used with "v" flag; operator exited program
unexpectedly. "Analyzer malfunction" Used with "v" flag; analyzer malfunction or
problem beyond the control of the operator such as plugged FID, broken oven heater, etc.
"Poor replicate" Replicate is outside the normal criteria, but no
reason can be found for the discrepancy. "Poor initial laser" Used with "v" flag; severe coupling or boat not
pushed in time for calculation of initial laser signal.
"Potential contamination" “Power failure”
Used with "v" flag; rerun of sample yields lower values or different peaks. Typically used with blanks or reruns of replicates. Used with "v" flag; power surge or power failure.
DRI STANDARD OPERATING PROCEDURE Page: 78 of 79 Date: July 15, 2005 Title: DRI Model 2001 Thermal/Optical Carbon Analysis Number: 2-216.2 (TOR/TOT) of Aerosol Filter Samples - Method IMPROVE_A Revision: 3
7 REFERENCES
Chen, L.-W.A.; Chow, J.C.; Watson, J.G.; Moosmüller, H.; and Arnott, W.P. (2004). Modeling reflectance and transmittance of quartz-fiber filter samples containing elemental carbon particles: Implications for thermal/optical analysis. J. Aerosol Sci., 35(6):765-780.
Chow, J.C.; Watson, J.G.; Pritchett, L.C.; Pierson, W.R.; Frazier, C.A.; and Purcell, R.G. (1993). The DRI Thermal/Optical Reflectance carbon analysis system: Description, evaluation and applications in U.S. air quality studies. Atmos. Environ., 27A(8):1185-1201.
Chow, J.C.; Watson, J.G.; Crow, D.; Lowenthal, D.H.; and Merrifield, T.M. (2001). Comparison of IMPROVE and NIOSH carbon measurements. Aerosol Sci. Technol., 34(1):23-34.
Chow, J.C.; and Watson, J.G. (2002). PM2.5 carbonate concentrations at regionally representative Interagency Monitoring of Protected Visual Environment sites. J. Geophys. Res., 107(D21):ICC 6-1-ICC 6-9.
Chow, J.C.; Watson, J.G.; Chen, L.-W.A.; Arnott, W.P.; Moosmüller, H.; and Fung, K.K. (2004). Equivalence of elemental carbon by Thermal/Optical Reflectance and Transmittance with different temperature protocols. Environ. Sci. Technol., 38(16):4414-4422.
Chow, J.C.; Watson, J.G.; Chen, L.-W.A.; Chang, M.C.; and Paredes-Miranda, G. (2005). Comparison of the DRI/OGC and Model 2001 Thermal/Optical carbon analyzers. Prepared for the IMPROVE Steering Committee, Fort Collins, CO, by Desert Research Institute, Reno, NV.
Desert Research Institute (2004). Pre-firing of quartz filters for carbon analysis. SOP #2-106r4. Desert Research Institute: Reno, NV.
Fung, K.K. (1986). Personal communication.
Huntzicker, J.J. (1986). Personal communication.
Johnson, R.L. (1981). Development and evaluation of a thermal/optical method for the analysis of carbonaceous aerosol. M.S. Thesis, Oregon Graduate Center, Beaverton, OR.
DRI STANDARD OPERATING PROCEDURE Page: 79 of 79 Date: July 15, 2005 Title: DRI Model 2001 Thermal/Optical Carbon Analysis Number: 2-216.2 (TOR/TOT) of Aerosol Filter Samples - Method IMPROVE_A Revision: 3
Johnson, R.L.; Shah, J.J.; Cary, R.A.; and Huntzicker, J.J. (1981). An automated thermal-optical method for the analysis of carbonaceous aerosol. In Atmospheric Aerosol: Source/Air Quality Relationships, E.S. Macias and P.K. Hopke, Eds. American Chemical Society, Washington, DC, pp. 223-233.
Lin, C.; and Friedlander, S.K. (1988). Soot oxidation in fibrous filters. 2. Effects of temperature, oxygen partial pressure, and sodium additives. Langmuir, 4(4):898-903.
Novakov, T. (1981). Microchemical characterization of aerosols. In Nature, Air and Methods of Microchemistry, H. Malissa, M. Grasserbauer, and R. Belcher, Eds. Springer-Verlag, Wein, Graz, Austria, pp. 141-165.
Novakov, T. (1982). Soot in the atmosphere. In Particulate Carbon: Atmospheric Life Cycle, G.T. Wolff and R.L. Klimisch, Eds. Plenum Press, New York, NY, pp. 19-41.
Rau, J.A. (1986). Residential wood combustion aerosol characterization as a function of size and source apportionment using chemical mass balance modeling. Ph.D. Dissertation, Oregon Graduate Center, Beaverton, OR.
Rosen, H.; Hansen, A.D.A.; Dod, R.L.; Gundel, L.A.; and Novakov, T. (1982). Graphitic carbon in urban environments and the Arctic. In Particulate Carbon: Atmospheric Life Cycle, G.T. Wolff and R.L. Klimisch, Eds. Plenum Press, New York, NY, pp. 273-294.