drenos, f; talmud, pj; casas, jp; smeeth, l; palmen, j ... ·...
TRANSCRIPT

Drenos, F; Talmud, PJ; Casas, JP; Smeeth, L; Palmen, J; Humphries,SE; Hingorani, AD (2009) Integrated associations of genotypes withmultiple blood biomarkers linked to coronary heart disease risk. Hu-man molecular genetics, 18 (12). pp. 2305-16. ISSN 0964-6906 DOI:https://doi.org/10.1093/hmg/ddp159
Downloaded from: http://researchonline.lshtm.ac.uk/5443/
DOI: 10.1093/hmg/ddp159
Usage Guidelines
Please refer to usage guidelines at http://researchonline.lshtm.ac.uk/policies.html or alterna-tively contact [email protected].
Available under license: Creative Commons Attribution Non-commercialhttp://creativecommons.org/licenses/by-nc/3.0/
Integrated associations of genotypes with multipleblood biomarkers linked to coronary heartdisease risk
Fotios Drenos1, Philippa J. Talmud1,�, Juan P. Casas2, Liam Smeeth2, Jutta Palmen1,
Steve E. Humphries1 and Aroon D. Hingorani3,4
1Division of Cardiovascular Genetics, Department of Medicine, Royal Free and University College Medical School,
5 University St, London WC1E 6JF, UK, 2Department of Epidemiology and Population Health, London School of
Hygiene and Tropical Medicine, London, UK, 3Department of Epidemiology and Public Health, UCL, 1-19 Torrington
Street, London WC1E 6BT, UK and 4Centre for Clinical Pharmacology, British Heart Foundation Laboratories at UCL,
London WC1E 6JJ, UK
Received December 19, 2008; Revised and Accepted March 26, 2009
Individuals at risk of coronary heart disease (CHD) show multiple correlations across blood biomarkers.Single nucleotide polymorphisms (SNPs) indexing biomarker differences could help distinguish causalfrom confounded associations because of their random allocation prior to disease. We examined the associ-ation of 948 SNPs in 122 candidate genes with 12 CHD-associated phenotypes in 2775 middle aged men (agenic scan). Of these, 140 SNPs indexed differences in HDL- and LDL-cholesterol, triglycerides, C-reactiveprotein, fibrinogen, factor VII, apolipoproteins AI and B, lipoprotein-associated phospholipase A2, homocys-teine or folate, some with large effect sizes and highly significant P-values (e.g. 2.15 standard deviations atP 5 9.2 3 102140 for F7 rs6046 and FVII levels). Top ranking SNPs were then tested for association withadditional biomarkers correlated with the index phenotype (phenome scan). Several SNPs (e.g. in APOE,CETP, LPL, APOB and LDLR) influenced multiple phenotypes, while others (e.g. in F7, CRP and FBB)showed restricted association to the index marker. SNPs influencing six blood proteins were used to evaluatethe nature of the associations between correlated blood proteins utilizing Mendelian randomization. MultipleSNPs were associated with CHD-related quantitative traits, with some associations restricted to a singlemarker and others exerting a wider genetic ‘footprint’. SNPs indexing biomarkers provide new tools forinvestigating biological relationships and causal links with disease. Broader and deeper integrated analyses,linking genomic with transcriptomic, proteomic and metabolomic analysis, as well as clinical events could, inprinciple, better delineate CHD causing pathways amenable to treatment.
INTRODUCTION
Like many common disorders, coronary heart disease (CHD)results from a complex interplay between environmental andgenetic factors, complicating the identification of the causal path-ways, and delaying the development of new treatments (1). By1981, over 200 phenotypic and other differences had beenshown in those with, or at higher risk of CHD (2). Alterationsin circulating blood phenotypes (also referred to as
biomarkers) such as lipid and lipoprotein particles, proteinsinvolved in inflammation and coagulation, as well as metabolitesand markers of oxidant stress, tend to cluster among those athigher risk, making it difficult to ascertain the nature and direc-tion of biological relationships between biomarkers, and theindependent effect of any one biomarker on CHD risk (3).These associations may be causal, but alternatively could arisebecause they mark subclinical disease (reverse causation),other causal factors (confounding) or some combination of
�To whom correspondence should be addressed at: Centre for Cardiovascular Genetics, Division of Medicine, UCL, London WC1E 6JJ, UK. Tel: þ442076796968; Fax: þ44 2076796212; Email: [email protected]
# 2009 The Author(s).This is an Open Access article distributed under the terms of the Creative Commons Attribution Non-Commercial License (http://creativecommons.org/licenses/by-nc/2.0/uk/) which permits unrestricted non-commercial use, distribution, and reproduction in any medium, provided the original work isproperly cited.
Human Molecular Genetics, 2009, Vol. 18, No. 12 2305–2316doi:10.1093/hmg/ddp159Advance Access published on March 31, 2009
Downloaded from https://academic.oup.com/hmg/article-abstract/18/12/2305/645042by London School of Hygiene & Tropical Medicine useron 23 February 2018

the two. Thus far it has only been possible to establish unequivo-cally a causal role in CHD for one blood phenotype(LDL-cholesterol). This was achieved in large part by develop-ing the HMG-CoA reductase inhibitor (statin) class of drugsthat reduce blood level of LDL-cholesterol and testing theireffects in randomized trials (4). However, the expense and riskassociated with the development of the many selective drugsneeded to target the vast array of blood phenotypes implicatedin CHD, currently precludes a comprehensive and systematicapproach to understanding their causal relevance and limitstranslation of the basic science and epidemiological findingsinto new treatments.
Many (if not all) of the circulating biomarkers associatedwith CHD behave as heritable quantitative traits, andcommon single nucleotide polymorphisms (SNPs) influencingtheir variance are now being identified both by candidate geneand genome wide studies (5–8). Unlike the associationsbetween biomarkers, or the association of biomarkers withCHD risk, genetic associations should be protected fromreverse causation because genotype is an invariant character-istic, such that there is a unidirectional flow of informationfrom common genome variation to mRNA to protein tocomplex phenotype and disease. Moreover, since genotype isdetermined at random at conception, for SNPs affectingCHD risk, intermediate phenotypes (such as blood markers),residing off the causal pathway from SNP to disease, shouldbe balanced evenly among the different genotypic groups, asthey are in a randomized clinical trial, whereas biomarkersthat mediate the effect of genomic variation on disease risksshould differ by genotype. We hypothesized that SNPs,which affect the variance in biomarkers linked to CHD,could be used as unbiased tools with which to understandtheir causal relevance and to explore the extent to which cor-relation between multiple CHD-associated phenotypes areaffected by confounding. This principle of Mendelian ran-domization has been applied to assess the causal role of indi-vidual biomarkers with CHD risk (9,10). Here we appliedMendelian randomization to help distinguish causal from con-founded links between multiple biomarkers.
Formerly, association studies in the cardiovascular geneticsfield typed SNPs in a single gene or locus of interest. Morerecently, genome wide association studies (GWAS) (5–7)have extended the breadth of genetic information, but thefocus of these studies has been on a single continuous traitor disease outcome, limiting the ability to address inter-relationships among traits. We utilized a genotyping strategythat exploits the recent finding that gene variants regulatingexpression commonly reside in the vicinity of genes(11–13), to build a panel of SNPs influencing variance inone or more CHD-related biomarkers to investigate thenature of the association between markers.
RESULTS
Between-phenotype correlations and associationswith CHD risk
In the prospective Northwick Park Heart Study II of 3102initially healthy men followed prospectively for a median of13.6 years, there were 296 definite fatal or non-fatal
CHD events. Measures of 14 intermediate phenotypes wereavailable, six with annual repeat measures (on six occasions)and single measures for the remaining eight (SupplementaryMaterial, Table S1). To delineate the potential for confoundingin the associations of blood markers and other phenotypes withCHD, we assessed between-phenotype correlations. Men whodeveloped a CHD event on follow-up exhibited multiple pheno-types which distinguished them from those who remaineddisease free, and these differences were highly inter-correlated(Fig. 1 and Supplementary Material, Table S1). Seventy-two ofthe 105 possible pair-wise correlations between blood markersand other CHD-related traits were significant with aP-value � 0.05 (68 traits significant with a P-value � 0.01),which significantly exceeds the five expected by chance alone(P , 1 � 1028 for observed versus the expected). Many ofthe associations were highly significant and the absoluteP-values are provided in Supplementary Material, Figure S1.
Genic scan
We genotyped 948 SNPs in 122 genes chosen for a high priorprobability of association with CHD-associated phenotypes inNPHS II based on prior association studies and biological evi-dence. A total of 134 SNP-trait associations were identifieddistributed as follows: 12 SNPs in APOB, LDLR, PCSK9,APOE-C1-C2-C4 and LRP5 with total cholesterol; 23 SNPsin APOB, LDLR, APOE-C1-C2-C4, PLA2G7, PCSK9,CDKN, EXT2, C3 and GSTM3 with LDL-cholesterol and 6SNPs in CETP, ALOX5AP APOA5-A4-C3-A1, LIPC andLPL with HDL cholesterol. Thirty-seven SNPs in LPL,APOA5-A4-C3-A1, TGFB1, PECAM, IL6R, C2, ILRN1, INS,LDLR, F7, ANGPTL4, APOB, GCKR, IL18RAP, PCSK9 andLRP5 were associated with triglyceride levels. Nine SNPs inLIPC, CETP, ALOX5AP, APOA5-A4-C3-A1, APOE-C1-C2-C4, IGF2, C3 and LPL were associated with apoAIlevels. Twelve SNPs were associated with apoB levels; thesewere in APOE-C1-C2-C4, APOB, LDLR, PCSK9, LPLGSTM4 and EXT2. Three SNPs in APOE-C1-C2-C4 andNOS3 were associated with Lp-PLA2 activity. Seven SNPsin the F7 gene itself and one in PROCR exhibited veryhighly significant association with blood factor VII level.Seven SNPs in the FIBA-B-G cluster, UCP3, GSTM4 andthe APOA5-A4-C3-A1 cluster were associated with fibrinogen.Five SNPs from two genes, APOE-C1-C2-C4 and CRP, wereassociated with C-reactive protein. These represented 98unique SNPs in 36 genes. The full range of SNP-phenotypeassociations is illustrated in Figure 2A-l and summarized inSupplementary Material, Table S2. Because of the gene-centric strategy, the SNP-phenotype associations clusteredwithin genes, even though SNPs had been chosen as tagSNPs. These associations remained significant even after theLD structure between them was considered (see Supplemen-tary Material, Table S6). Thus, for some genes, severalSNPs remain associated with the blood biomarker, supportingthe possibility of independent associations at a given locus, aswe noted previously for CRP (14).
Significance and validity of the genetic associations. Despitethe moderate size of the data set, nearly 13% (18 of 140) of theassociations achieved the level of significance conventionally
2306 Human Molecular Genetics, 2009, Vol. 18, No. 12
Downloaded from https://academic.oup.com/hmg/article-abstract/18/12/2305/645042by London School of Hygiene & Tropical Medicine useron 23 February 2018

applied to GWAS (P-value , 1027). Sixteen of the 134 SNPswere also directly typed and were significant hits in recentGWASs of blood markers (Table 1) including: rs6511720 inLDLR (5,15), SNPs in LD with rs42935/rs7412 with APOESNPs and LDL-cholesterol (5,6); as well as rs708272 inCETP with HDL-cholesterol (5,6,15).
Notably, for each genic scan where the outcome was asingle-protein phenotype at least one cis-acting SNP in thegene encoding the cognate protein was always identifiedamong the most significantly associated SNPs, with P-valuesgenerally between 1024 and 1027, but as extreme as 102140
for rs6046 in F7 and blood factor VII levels. In line with arecent report, we refer to these genes as protein quantitativetrait genes (pQTGs) (8) and the SNPs as pQTSNPs.
Effect size. The effect of each associating SNP was expressedboth in terms of the proportion of the trait variance explained,and as the standardized mean difference in trait level betweensubjects homozygous for the alternative alleles (Fig. 3A andB), allowing effect sizes to be expressed on a commonscale. When considered solely in terms of the variance, theeffect size for individual SNPs appeared modest with onlytwo SNPs in the F7 gene, each explaining �20% of the var-iance of factor VII (Fig. 3A), both independently significantof each other. However, for 28 SNPs (24%) crossing theFDR threshold, the difference in average trait valuesbetween homozygous subjects exceeded 0.5 standard devi-ations (SD) of the population distribution, with the differenceexceeding 0.75 SD for 17 SNPs. For 10 SNPs, the differencein trait values between homozygous subjects exceeded 1 SD,with the most extreme differences for a common allele(.5%) being 2.15 SD for the difference in Factor VII levels
between subjects homozygous for alternative alleles ofrs6046 in F7 (Fig. 3C).
Phenome scan
We next assessed the association of top ranking genes from thegenic scan with additional phenotypes and the findings areillustrated graphically in Figure 4A–H by means ofphenome plots. The phenome scan examines the relationshipbetween variants of the gene of interest and all the intermedi-ate traits studied. This is in contrast with the genic scan whereeach intermediate trait of interest is considered and all thegenetic variants associated with it are examined as a Manhat-tan plot. In the phenome scan, the gene of interest is depictedas an ellipse and the associated phenotypic traits as circlesradiating out from it. The circle diameter of each phenotypeis a measure of the variance of the phenotype explained bythe variation encompassing all SNPs in that gene of interest,with the value (coefficient of determination, R2) given along-side the relevant circle. In addition, for each phenotype, thedistance from the gene is a measure of the significancevalue, adjusted for multiple testing using the false discoveryrate (FDR), for the SNP with the strongest signal within thegene of interest. In the phenome scan, we applied a more strin-gent significance threshold, focusing on those phenotypescrossing an FDR adjusted P-value of ,0.1. An inner squareof dotted lines has been drawn at this threshold with thegene of interest and the phenotype(s) with FDRs ,0.1 beingshown in the enlarged subpanel.
SNPs in certain pQTGs (e.g. in F7, CRP and the FIBA-B-Gcluster) exhibited phenotypic effects that were restricted to analteration only in the cognate gene product. The restricted
Figure 1. Correlations between multiple phenotypes linked to CHD in 2775 men from the NPHSII study. Values in cells indicate Pearson’s correlation coeffi-cient R. �P , 0.01, ��P , 0.001 (see colour code). Baseline and five repeat measures were available for cholesterol, triglycerides (TG), coagulation factor VII(FVIIc), fibrinogen, blood pressure (BP), smoking and body mass index (BMI) and single measures for the remaining traits.
Human Molecular Genetics, 2009, Vol. 18, No. 12 2307
Downloaded from https://academic.oup.com/hmg/article-abstract/18/12/2305/645042by London School of Hygiene & Tropical Medicine useron 23 February 2018

nature of the SNP effects for these genes contrasted sharplywith the extensive direct phenotypic associations of the pro-teins they encode (Fig. 1).
SNPs in several other genes and regions, involved in lipidand lipoprotein transport or metabolism, appeared to exertmore diverse phenotypic effects. For example, SNPs in theAPOE-C1-C2-C4 cluster were associated with three lipidand lipoprotein traits (total- and LDL-cholesterol, apoB) con-sistent with previous observations (16). The phenome scan forAPOE-C1-C2-C4 also revealed a strong association of SNPsin this region with the hepatocyte-derived inflammationmarker C-reactive protein (CRP), but interestingly not withanother hepatocyte-derived acute phase protein, fibrinogen(Fig. 4F). The APOE–CRP association was highly significant
(P ¼ 1.28 � 10210) and the effect size was at least as large asthe effect of cis-acting SNPs in the gene on CRP itself (Sup-plementary Material, Table S2). This association is also vali-dated by several candidate gene studies and by two recentGWAS (17,18). In addition, APOE-C1-C2-C4 SNPsrs429358/rs7412, which together define the E2, E3 and E4alleles, were also strongly associated with Lp-PLA2 activity(P ¼ 2.55 � 10214), and explained almost 4% of the variancein this trait, with a 0.21 SD difference in Lp-PLA2activity between homozygous subjects. The association ofAPOE-C1-C2-C4 SNPs with apoAI was also evident butbecause of the more modest levels of significance, theseassociations are not shown in Figure 4F. The CETP SNPrs708272, which exhibited the strongest association with
Figure 2. Associations of 860 SNPs by chromosome with 12 blood phenotypes. The horizontal line indicates a critical FDR threshold of 0.2, approximatelyequivalent to a P-value , 1023.
2308 Human Molecular Genetics, 2009, Vol. 18, No. 12
Downloaded from https://academic.oup.com/hmg/article-abstract/18/12/2305/645042by London School of Hygiene & Tropical Medicine useron 23 February 2018

HDL-cholesterol in the genic scan, showed additionalassociations with apoAI (Fig. 4E). These associations havebeen corroborated by meta-analyses of genetic associationstudies (19).
SNPs in the APOA5-A4-C3-A1 (Fig. 4A) cluster also exhib-ited diverse effects on blood lipid and lipoprotein phenotypes
as did variants in the LDLR gene (Fig. 4B). For the APOA5gene cluster and LPL, the anticipated association with trigly-cerides was seen (20). Furthermore, for the APOA5 cluster,although the previously reported association with apoAI wasevident, with an FDR of 0.14 it was not included in theenlarged phenome scan where the FDR cut-off was 0.1.
Table 1. SNPs from the current study showing replication with GWAS hits
Phenotype Previous GWAS hit (alternate phenotypepreviously showing association)
rs Gene P-value FDR Common versusrare HMZ
% R2 trans MAF
Triglycerides (6)(LDL) rs6589566 APOA5-A4-C3-A1 1.98E205 0.01 0.633 0.9 7.0(15) rs328 LPL 2.85E204 0.03 0.189 0.7 10.9
Cholesterol (15) rs6511720 LDLR 9.38E208 0.01 0.432 1.2 12.3(5,7,15), (42)(AD), (43)(AD) rs4420638 APOE-C1-C2-C4 2.78E206 0.01 0.370 1.0 19.1
LDL (5,15) rs6511720 LDLR 3.83E206 0.01 0.776 1.6 12.3(5,7,15,42)(AD), (43)(AD) rs4420638 APOE-C1-C2-C4 8.72E204 0.11 0.344 0.9 19.1
ApoB (15)(LDL) rs11591147 PCSK9 6.43E205 0.03 3.055 0.9 0.9(15)(LDL); (5)(LDL) rs6511720 LDLR 1.23E203 0.14 0.195 0.6 12.3(15)(TG), (5)(TG), (6)(LDL), (17)(CRP) rs780094 GCKR 3.21E203 0.20 0.207 0.5 37.8
ApoAI (15)(HDL) rs1800588 LIPC 4.72E205 0.03 0.332 1.0 20.5(15)(HDL, TG) rs328 LPL 2.14E203 0.19 0.575 0.5 10.3
CRP (7)(LDL), (15)(LDL), (5)(LDL),(42)(AD), (43)(AD)
rs4420638 APOE-C1-C2-C4 2.20E207 0.01 0.404 1.4 19.1
(17) rs3091244 CRP 2.74E204 0.05 0.182 0.7 5.5Lp-PLA2 (7)(LDL), (24)(LDL), (5)(LDL),
(42)(AD) (43) (AD)rs4420638 APOE-C1-C2-C4 1.42E206 0.01 0.490 1.48 19.1
Homocysteine (23)(CHD) rs6922269 MTHFR 2.78E205 0.03 0.375 1.5 31.1FVII (15)(HDL, TG) rs328 LPL 2.98E204 0.04 0.102 0.0 10.3
The phenotype associated with the SNP from the GWAS, if different from the current study is given in brackets.LDL, low density lipoprotein; TG, triglycerides; AD, Alzheimer’s disease, CRP, C-reactive protein, HDL, high density lipoprotein.
Figure 3. The relationship between minor allele frequency and effect size for SNP-phenotype associations exceeding the pre-specified FDR threshold. Effect sizewas expressed as: (A) variance and (B) as the standardized mean difference for comparisons of homozygous subjects. (C) Examples of SNPs with extreme effectsassessed in terms of standardized mean difference.
Human Molecular Genetics, 2009, Vol. 18, No. 12 2309
Downloaded from https://academic.oup.com/hmg/article-abstract/18/12/2305/645042by London School of Hygiene & Tropical Medicine useron 23 February 2018

2310 Human Molecular Genetics, 2009, Vol. 18, No. 12
Downloaded from https://academic.oup.com/hmg/article-abstract/18/12/2305/645042by London School of Hygiene & Tropical Medicine useron 23 February 2018

pQTSNPs as tools to distinguish causal from non-causalassociations between blood protein phenotypes
Because cis-acting variants in a gene encoding a protein trait(pQTSNPs) provide a highly specific instrument with whichto investigate the causal effects of the encoded protein (utiliz-ing the principles of Mendelian randomization), we used themost strongly associating pQTSNPs for apoAI, apoB, CRP,factor VII, fibrinogen and lipoprotein-associated phospho-lipase A2 (Lp-PLA2) as their unconfounded proxies to help
evaluate confounding in the directly observed associationsbetween these proteins (Supplementary Material, Fig. S2)and (Fig. 5).
In Figure 5, the magnitude of the association betweenprotein phenotypes is illustrated for a difference in the meanvalues of the top versus bottom tertile of the index phenotype,approximately equal to a 2 SD difference. Thus, a 2 SD differ-ence in factor VII is associated with a standardized meandifference in apoB, CRP and fibrinogen of 0.41, 0.31 and0.25, respectively. Individuals homozygous for the variant
Figure 4. Continued.
Figure 4. Phenome plots. The gene of interest is depicted as an ellipse and the associated phenotypes traits as circles. The circle diameter is a measure of thevariance of the phenotype explained by the variance of the genotypes (R2) of all the SNPs in the gene of interest. The numbers given next to each phenotype arethe percent values of the coefficient of determination R2 of the phenotype for the combined effect of all the SNPs of the gene. The distance from the gene to eachphenotype is a measure of the significance value, adjusted for multiple testing using the FDR, for the SNP with the strongest signal within the gene of interest.The number shown next to each edge is the percent value of the FDR adjusted P-value with its length measured from ellipse (gene) centre to circle (phenotype)centre. The dashed line represents those phenotypes which fall within the ,0.1 FDR with the gene of interest. Those phenotypes and the gene are then expandedalongside in the accompanying figure so that details can be seen more clearly. For the phenome scan, an even more stringent FDR adjusted P-value of ,0.1 toreduce further the risk of false-positive association. (Hcy, homocysteine; Flt, folate; SBP, systolic blood pressure; DBP, diastolic blood pressure; BMI, body massindex).
Human Molecular Genetics, 2009, Vol. 18, No. 12 2311
Downloaded from https://academic.oup.com/hmg/article-abstract/18/12/2305/645042by London School of Hygiene & Tropical Medicine useron 23 February 2018
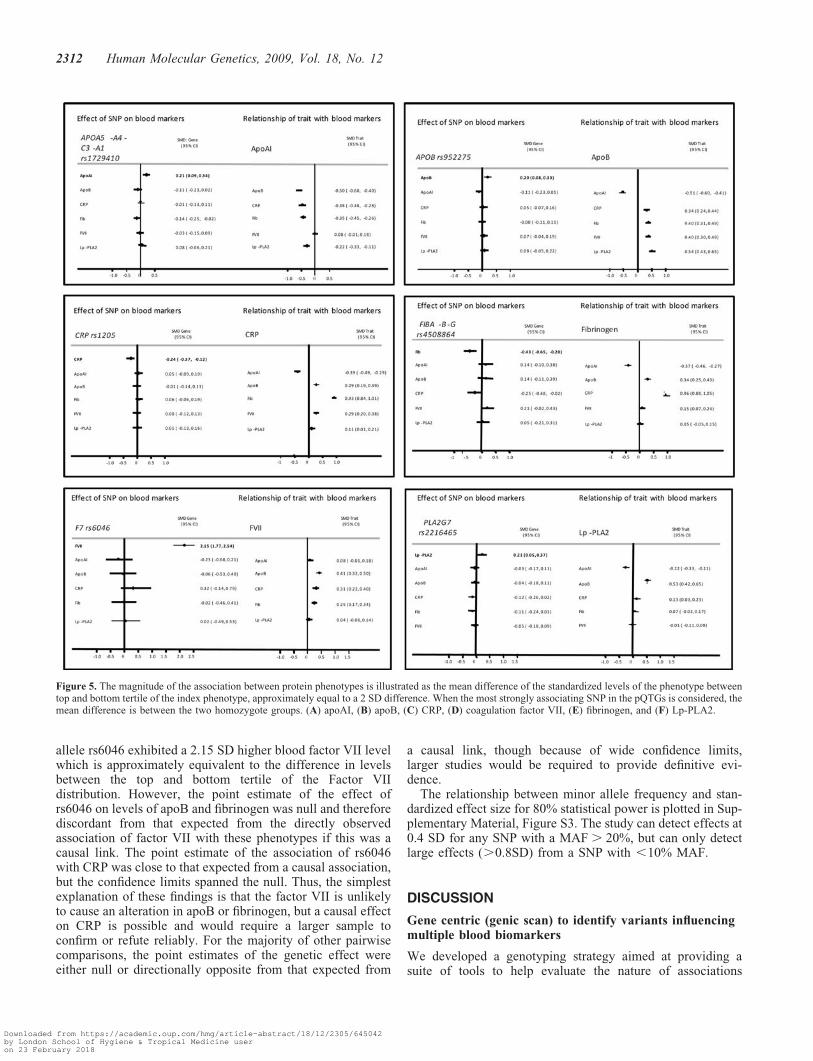
allele rs6046 exhibited a 2.15 SD higher blood factor VII levelwhich is approximately equivalent to the difference in levelsbetween the top and bottom tertile of the Factor VIIdistribution. However, the point estimate of the effect ofrs6046 on levels of apoB and fibrinogen was null and thereforediscordant from that expected from the directly observedassociation of factor VII with these phenotypes if this was acausal link. The point estimate of the association of rs6046with CRP was close to that expected from a causal association,but the confidence limits spanned the null. Thus, the simplestexplanation of these findings is that the factor VII is unlikelyto cause an alteration in apoB or fibrinogen, but a causal effecton CRP is possible and would require a larger sample toconfirm or refute reliably. For the majority of other pairwisecomparisons, the point estimates of the genetic effect wereeither null or directionally opposite from that expected from
a causal link, though because of wide confidence limits,larger studies would be required to provide definitive evi-dence.
The relationship between minor allele frequency and stan-dardized effect size for 80% statistical power is plotted in Sup-plementary Material, Figure S3. The study can detect effects at0.4 SD for any SNP with a MAF . 20%, but can only detectlarge effects (.0.8SD) from a SNP with ,10% MAF.
DISCUSSION
Gene centric (genic scan) to identify variants influencingmultiple blood biomarkers
We developed a genotyping strategy aimed at providing asuite of tools to help evaluate the nature of associations
Figure 5. The magnitude of the association between protein phenotypes is illustrated as the mean difference of the standardized levels of the phenotype betweentop and bottom tertile of the index phenotype, approximately equal to a 2 SD difference. When the most strongly associating SNP in the pQTGs is considered, themean difference is between the two homozygote groups. (A) apoAI, (B) apoB, (C) CRP, (D) coagulation factor VII, (E) fibrinogen, and (F) Lp-PLA2.
2312 Human Molecular Genetics, 2009, Vol. 18, No. 12
Downloaded from https://academic.oup.com/hmg/article-abstract/18/12/2305/645042by London School of Hygiene & Tropical Medicine useron 23 February 2018

between multiple blood markers associated with a high risk ofCHD using Mendelian randomization. We used a gene-centricapproach based on genes with a high prior probability ofassociation with the traits of interest in NPHSII. This provedto be an efficient strategy providing a high yieldof SNP-biomarker associations even at conservative levelsof statistical significance and a stringent FDR threshold,with134 SNP-associations out of the 948 SNPs ( for whichgenotype was available), distributed among �36 genes.These findings are in keeping with emerging data fromGWAS of gene expression (11), blood proteins (8), lipid andother non-protein traits (5,6) and metabolic profiles (21).Together these provide strong evidence that regulatory SNPsare found commonly in the vicinity of genes and validate agene-centric approach to identify genotypes influencing mul-tiple blood traits linked to CHD and other complex disorders.The scope and breadth of gene-centric studies is likely to beextended by the emergence of comprehensive disease-specificgene-centric custom SNP arrays such as the ITMAT/BROAD/CARE (IBC) ‘cardio-metabolic chip’ that covers around 2100genes from lipid, inflammation, coagulation, oxidants stress,matrix and other pathways linked to CHD (http://bioinf.itmat.upenn.edu/cvdsnp/index.php) (22).
Although the genotyping strategy was focused on candidategenes, some novel associations also emerged, e.g. associationsof SNPs in APOE with Lp-PLA2 activity. Lp-PLA2 is phys-ically associated with LDL particles where it could exertpro-atherogenic actions through hydrolysis of oxidized phos-pholipids to lysophosphatidylcholine and oxidized free fattyacids. Although APOE-C1-C2-C4 SNPs also influence thelevel of circulating LDL, and theoretically might thereforeinfluence Lp-PLA2 activity simply through an effect on theconcentration of this particle, other SNPs that affectedLDL-cholesterol concentration (e.g. APOB, and LDLR) werenot associated with Lp-PLA2 activity, suggesting a moredirect link between apoE and Lp-PLA2 that is worthy offurther investigation.
Though 16 of the genetic associations we identified havebeen corroborated by both candidate gene studies andGWAS, and can be considered robust, the relevance andutility of such associations has been debated given that theproportion of the total variance in a continuous trait explainedby common alleles can be small (commonly ,5%) (9).However, our study suggests that interpretations based onthis metric alone may provide an incomplete picture. Formany SNPs whose contribution to the variance in a phenotypewas small, we found evidence of a substantial effect size whenexpressed in terms of the standardized mean difference in bio-marker level between homozygous subjects. We noted manyexamples of differences over 0.5 SD, and several of over 1SD for variants influencing triglycerides, apoB, Lp-PLA2and factor VII. These would be considered very substantialeffects for a drug designed to modify the level of one ofthese biomarkers. For example, standard doses of statindrugs in clinical use reduce LDL-cholesterol by about 1 SD(4). However, even SNPs with small effect could be important,because therapies that might arise from the genetic findingscould be designed to have much more potent effects than thenatural genetic variation. For example, variants in HMGCRthat encodes the target enzyme for cholesterol-lowering statin
drugs, affect LDL-cholesterol but did not emerge among thetop-ranking SNPs in recent GWAS for CHD (23), althoughan association of these SNPs with CHD risk has been sub-sequently reported (24).
We also noted a trend for less common genetic variants toexert larger effects when expressed in terms of the standar-dized mean difference but not in terms of the variance(Fig. 3). This finding is consistent with the emerging paradigmof an inverse association between allele frequency andpenetrance (25).
Phenome scans and use of SNPs as tools to distinguishcausal from confounded links between biomarkers
It has been common for genome wide and candidate geneassociation studies to focus on SNP associations with asingle trait or disease outcome, but the pathway fromdisease-relevant SNP to disease potentially involves multiplephenotypic perturbations both in series and in parallel. It istherefore of interest not only to determine the full spectrumof SNPs affecting a single trait or outcome, but also therange of phenotypes altered by single SNP or gene. (26).We noted several genes and SNPs with effects on multiple cir-culating biomarkers, suggesting that some genes may have abroad footprint of effects on the proteome and metabolome.This is often referred to as pleiotropy but it may be importantto distinguish between the multiplicity of effects arising fromthe generation of more than one protein product as a result ofalternative splicing of an mRNA transcript of a gene, from thethose arising from the broad ranging downstream effects of asingle protein product (such as an enzyme or transporter)involved in lipid and lipoprotein pathways (e.g. apoE or cho-lesteryl ester transfer protein), which is the more likely expla-nation for the range of SNP effects observed in the presentstudy.
Though some SNPs exerted a broad footprint of phenotypiceffects, for others (e.g. in F7 and FIB), there was a moretightly restricted association of SNPs in the encoding genewith the cognate protein but no other trait, despite the exten-sive directly observed correlations between the protein itselfand other markers. This contrast between the range of genoty-pic and phenotypic associations is likely to arise from the ran-domized assignment of alleles, and the non-randomized(clustered) association of phenotypes (see Fig. 1) (27,28).This renders SNPs in certain pQTGs particularly well suitedas proxies (instruments) with which to investigate the causalrelevance for CHD of the proteins they encode because, incontrast to the proteins themselves, the genetic associationsshould not be prone to confounding or reverse causation bias(29–31).
For example, CRP is strongly correlated with fibrinogen(R2 ¼ 0.43; Fig. 1). This association could arise because of acausal relationship (in either direction) or because of acommon association of both these biomarkers with anotherfactor. This makes it difficult to assess whether CRP and fibri-nogen lie on the same causal pathway to CHD, and whether itis legitimate to make statistical adjustment for fibrinogen inthe many observational associations of CRP with CHD (andvice versa). Statistical adjustment, which is the orthodoxapproach to dealing with confounding in observational
Human Molecular Genetics, 2009, Vol. 18, No. 12 2313
Downloaded from https://academic.oup.com/hmg/article-abstract/18/12/2305/645042by London School of Hygiene & Tropical Medicine useron 23 February 2018

epidemiology, would be legitimate only if the association ofCRP with CHD was not mediated (even in part) by anelevation in the level of fibrinogen. The absence of an associ-ation of CRP SNPs with fibrinogen level (or FIBA-B-Gwith CRP level) (Fig. 4I), which is consistent with thefindings from other studies of these variants (29,32) indicatesthat CRP and fibrinogen do not exhibit a direct causalassociation with one another and that statistical adjustmentis appropriate in observational studies of these biomarkerswith CHD.
Whereas cis-acting SNPs in the encoding gene offer themost specific genetic instrument with which to assess thecausal role of a protein in CHD, there may not be a singlebest instrument for a non-protein trait such as the level ofHDL- or LDL-cholesterol that are influenced by a number ofdifferent genes encoding enzymes and transporters. Wenoted SNPs from a range of genes influencing the same lipidtrait (Supplementary Material, Table S2). Validation of theuse of multiple SNPs for such causal analysis for non-proteintraits is illustrated using the example of LDL-cholesterol, theonly blood phenotype for which a causal role in CHD hasalready been firmly established.
Rare variants in LDLR, APOB and gain-of-functionmutations in PCSK9 result in extreme elevations inLDL-cholesterol, as in Familial Hypercholesterolemia (33),while PCSK9 loss-of-function variants are associated withvery low LDL-cholesterol levels and are protective of CHD(34). In addition, common variants of APOE (16), PSRC1/CELSR/ SORT1, LDLR and PCSK9 (5–7,35), includingsome tagged by SNPs in the current study that cause moremodest changes in LDL-cholesterol, have also been associatedwith alterations in risk of CHD (5,34,35), with the geneticeffects on disease risk directionally concordant and in pro-portion to the size of the effect on LDL-cholesterol.
Implications of the current findings for future work
The principles applied in the current study could be extendedto incorporate rare SNPs or copy number variants, or regulat-ory SNPs remote from genes using denser new generationGWAS platforms. The phenotypes evaluated could beextended both proximally to include mRNA expression andmore distally to include more complex phenotypes linked toCHD such as carotid-intima media thickness or measures ofcoronary artery calcification. The breadth of the approachcould also be extended laterally at the level of protein and non-protein phenotypes using proteomic and metabolomics,respectively. Our study highlights the importance of well-phenotyped population samples and emphasizes the require-ment for large sample sizes. However, whether this approachwill aid in developing causal networks and genotype: pheno-type maps, as outlined recently by Rockman, remains to beseen (36).
In summary, we demonstrate how integrating informationon genotype and blood phenotypes in humans can be used toconstruct association networks with a high-level of credibility,due to the particular properties of genetic variants, which arerandomly allocated and unmodifiable by disease process, fea-tures which are not shared by any other natural biologicalexposure (e.g. mRNA levels or protein levels) Our study
emphasizes the potential translational application emergingfrom the recent genomic advances.
MATERIAL AND METHODS
Study design and phenotypic measures
The Northwick Park Heart Study II (NPHSII) is a prospectivestudy of 3012 healthy middle-aged men aged 50–64 years atrecruitment, sampled from nine UK general practicesbetween 1989 and 1994 (37). Men were free from disease atthe time of recruitment, and information on lifestyle habits,height, weight and blood pressure were recorded at baselineand on subsequent prospective follow-up. Measures weremade of at least 15 circulating blood factors associated withCHD risk that included both circulating proteins (CRP, lipidfractions and non-protein metabolites), all the measuresbeing obtained before the development of clinical events,with repeated measurements available for some factors (Sup-plementary Material, Table S1). A DNA repository was estab-lished using samples from 2775 men obtained at the time ofrecruitment. By December 2005, after a median follow-up of13.6 years, there had been 296 definite fatal or non-fatalCHD events (230 in 2401 of the genotyped sample). Fulldetails of recruitment, measurements, follow-up and defi-nitions of incident disease have been reported elsewhere (37).
Genic scan
A customized Illumina 768 SNP genotyping array wasassembled to comprehensively capture common genetic vari-ation in more than 76 genes chosen (1): for their involvementin the following pathways linked to CHD risk; lipid metab-olism (10 genes), inflammation (23 genes), oxidative stress(13 genes), thrombosis and haemostasis (3 genes); (2) for apreviously described association with the risk of CHD ortype 2 diabetes (T2D) mellitus, including SNPs from arecent whole-genome analysis of T2D which marginallyfailed the P , 1027 significance threshold for genome widesignificance (Prof Philippe Froguel, personal communication);or (3) for their ability to tag copy number variation (38). Foreach gene or region, tagging (t) SNPs, optimized for the Illu-mina platform, was selected using HapMap, applying an R2
threshold of 0.8 with a minor allele frequency threshold of0.04. Where possible, coding (c) SNPs were included in thetag set. Illumina Goldengate SNPs with pre-optimized assayswere chosen where possible, however roughly 10% of thechosen SNPs failed the assay design. A complete list ofgenes selected and the tSNPs for each gene for which geno-type was available is shown in Supplementary Material,Tables S3 and S5. Genotypes from the Illumina array weresupplemented with information on 173 SNPs in a further 82genes previously typed in this data set (SupplementaryMaterial, Tables S4 and S6). SNPs were examined for associ-ations with 12 blood phenotypes available in NPHSII of whichsix were protein phenotypes (CRP, fibrinogen, apoAI, apoB,Lp-PLA2 and factor VII) and six were non-protein metabolicphenotypes (total-cholesterol, HDL- and calculatedLDL-cholesterol, triglycerides, homocysteine and folate). Werefer to this as a genic scan to distinguish the focused high
2314 Human Molecular Genetics, 2009, Vol. 18, No. 12
Downloaded from https://academic.oup.com/hmg/article-abstract/18/12/2305/645042by London School of Hygiene & Tropical Medicine useron 23 February 2018
SNP density, gene-centric approach used here from broader,generally lower SNP density, genome-wide analyses.
Phenome scan
We examined the effect of the genes containing the highestranking SNPs from the genic scan on additional blood bio-markers beyond the index trait and the results are illustratedby means of a phenome plot (vide infra). These findings aresummarized by means of phenome plots that summarize theassociations of SNPs in a gene with blood marker(s) both interms of the FDR q-value (vide infra) and proportion of thevariance of the trait explained, using a stepwise regressionto find the adjusted coefficient of determination (adjR2)under the model of best fit.
Statistical analysis
Phenotypes were tested for deviation from the normal and trans-formed where appropriate, using the Box-Cox transformation.Pair-wise linear relationships between blood phenotypes weretested using Pearson correlation. If the phenotypic variant wasmeasured once in the study, an ANOVA was used to test forits association with genotype. Where multiple measurementswere available, the average value of the available measurementswas calculated and a general linear model was fitted through thedata using indicator variables. The regression coefficientsobtained for the indicator variables compared to the referencecategory were assessed for significance using a Wald test.Based on the number of hypotheses tested, a FDR adjustedP-value was calculated using the methodology of Benjaminiand Hochberg (39). Defining FDR as the proportion of falselyrejected hypotheses, i.e. for which the null was actually true,this new P-value, known as the q-value (40), is the minimumFDR when rejecting a null hypothesis from a list of testednull hypothesis, conditioned on at least one positive findinghaving occurred. For the construction of the phenomic plots, astepwise regression was used to find the adjusted coefficientof determination (adjR2) under the model of best fit. Thenumber of independent loci associated with each phenotypewas calculated using the LD-based result clumping procedurein PLINK (v1.05, http://pngu.mgh.harvard.edu/purcell/plink/(41). An extremely conservative R2 of 0.1% was used toclump SNPs, identified previously as statistically significant,in independent loci.
SUPPLEMENTARY MATERIAL
Supplementary Material is available at HMG online.
Conflict of Interest statement. None declared.
FUNDING
This work was supported by the British Heart Foundation(grant number PG2005/014; F.D., P.J.T., J.P. and S.E.H. anda Senior Fellowship to A.D.H., FS2005/125). Funding to pay
the Open Access charge was provided by the British HeartFoundation.
REFERENCES
1. Rader, D.J. and Daugherty, A. (2008) Translating molecular discoveriesinto new therapies for atherosclerosis. Nature, 451, 904–913.
2. Hopkins, P.N. and Williams, R.R. (1981) A survey of 246 suggestedcoronary risk factors. Atherosclerosis, 40, 1–52.
3. Brotman, D.J., Walker, E., Lauer, M.S. and O’Brien, R.G. (2005) Insearch of fewer independent risk factors. Arch. Intern. Med., 165, 138–145.
4. Baigent, C., Keech, A., Kearney, P.M., Blackwell, L., Buck, G., Pollicino,C., Kirby, A., Sourjina, T., Peto, R., Collins, R. et al. (2005) Efficacy andsafety of cholesterol-lowering treatment: prospective meta-analysis ofdata from 90,056 participants in 14 randomised trials of statins. Lancet,366, 1267–1278.
5. Willer, C.J., Sanna, S., Jackson, A.U., Scuteri, A., Bonnycastle, L.L.,Clarke, R., Heath, S.C., Timpson, N.J., Najjar, S.S., Stringham, H.M.et al. (2008) Newly identified loci that influence lipid concentrations andrisk of coronary artery disease. Nat. Genet., 40, 161–169.
6. Wallace, C., Newhouse, S.J., Braund, P., Zhang, F., Tobin, M., Falchi, M.,Ahmadi, K., Dobson, R.J., Marcano, A.C., Hajat, C. et al. (2008)Genome-wide association study identifies genes for biomarkers ofcardiovascular disease: serum urate and dyslipidemia. Am. J. Hum. Genet.,82, 139–149.
7. Sandhu, M.S., Waterworth, D.M., Debenham, S.L., Wheeler, E.,Papadakis, K., Zhao, J.H., Song, K., Yuan, X., Johnson, T., Ashford, A.et al. (2008) LDL-cholesterol concentrations: a genome-wide associationstudy. Lancet, 371, 483–491.
8. Melzer, D., Perry, J.R., Hernandez, D., Corsi, A.M., Stevens, K., Rafferty,I., Lauretani, F., Murray, A., Gibbs, J.R., Paolisso, G. et al. (2008)A genome-wide association study identifies protein quantitative trait loci(pQTLs). PLoS Genet., 4, e1000072.
9. Hingorani, A. and Humphries, S. (2005) Nature’s randomised trials.Lancet, 366, 1906–1908.
10. Davey, S.G., Timpson, N. and Ebrahim, S. (2008) Strengthening causalinference in cardiovascular epidemiology through Mendelianrandomization. Ann. Med., 40, 524–541.
11. Morley, M., Molony, C.M., Weber, T.M., Devlin, J.L., Ewens, K.G.,Spielman, R.S. and Cheung, V.G. (2004) Genetic analysis ofgenome-wide variation in human gene expression. Nature, 430, 743–747.
12. Cheung, V.G., Spielman, R.S., Ewens, K.G., Weber, T.M., Morley, M.and Burdick, J.T. (2005) Mapping determinants of human gene expressionby regional and genome-wide association. Nature, 437, 1365–1369.
13. Stranger, B.E., Forrest, M.S., Dunning, M., Ingle, C.E., Beazley, C.,Thorne, N., Redon, R., Bird, C.P., de Grassi, A., Lee, C. et al. (2007)Relative impact of nucleotide and copy number variation on geneexpression phenotypes. Science, 315, 848–853.
14. Verzilli, C., Shah, T., Casas, J.P., Chapman, J., Sandhu, M.S., Debenham,S.L., Boekholdt, S.M., Khaw, K.T., Wareham, N.J., Judson, R. et al.(2008) Bayesian meta-analysis of genetic association studies withdifferent sets of markers. Am. J. Hum. Genet., 82, 859–872.
15. Kathiresan, S., Melander, O., Guiducci, C., Surti, A., Burtt, N.P., Rieder,M.J., Cooper, G.M., Roos, C., Voight, B.F., Havulinna, A.S. et al. (2008)Six new loci associated with blood low-density lipoprotein cholesterol,high-density lipoprotein cholesterol or triglycerides in humans. Nat.Genet., 40, 189–197.
16. Bennet, A.M., Di Angelantonio, E., Ye, Z., Wensley, F., Dahlin, A.,Ahlbom, A., Keavney, B., Collins, R., Wiman, B., de Faire, U. et al.(2007) Association of apolipoprotein E genotypes with lipid levels andcoronary risk. JAMA, 298, 1300–1311.
17. Ridker, P.M., Pare, G., Parker, A., Zee, R.Y., Danik, J.S., Buring, J.E.,Kwiatkowski, D., Cook, N.R., Miletich, J.P. and Chasman, D.I. (2008)Loci related to metabolic-syndrome pathways including LEPR, HNF1A,IL6R, and GCKR associate with plasma C-reactive protein: the Women’sGenome Health Study. Am. J. Hum. Genet., 82, 1185–1192.
18. Ruchat, S.M., Despres, J.P., Weisnagel, S.J., Chagnon, Y.C., Bouchard, C.and Perusse, L. (2008) Genome-wide linkage analysis for circulatinglevels of adipokines and C-reactive protein in the Quebec family study(QFS). J. Hum. Genet., 53, 629–636.
Human Molecular Genetics, 2009, Vol. 18, No. 12 2315
Downloaded from https://academic.oup.com/hmg/article-abstract/18/12/2305/645042by London School of Hygiene & Tropical Medicine useron 23 February 2018

19. Thompson, A., Di Angelantonio, E., Sarwar, N., Erqou, S., Saleheen, D.,Dullaart, R.P., Keavney, B., Ye, Z. and Danesh, J. (2008) Association ofcholesteryl ester transfer protein genotypes with CETP mass and activity,lipid levels, and coronary risk. JAMA, 299, 2777–2788.
20. Talmud, P.J., Hawe, E., Martin, S., Olivier, M., Miller, G.J., Rubin, E.M.,Pennacchio, L.A. and Humphries, S.E. (2002) Relative contribution ofvariation within the APOC3-A4-A5 gene cluster in determining plasmatriglycerides. Hum. Mol. Gen., 11, 3039–3046.
21. Gieger, C., Geistlinger, L., Altmaier, E., Hrabe de Angelis, M.,Kronenberg, F., Meitinger, T., Mewes, H.W., Wichmann, H.E.,Weinberger, K.M., Adamski, J. et al. (2008) Genetics meetsmetabolomics: a genome-wide association study of metabolite profiles inhuman serum. PLoS Genet., 4, e1000282.
22. Keating, B.J., Tischfield, S., Murray, S.S., Bhangale, T., Price, T.S.,Glessner, J.T., Galver, L., Barrett, J.C., Grant, S.F., Farlow, D.N. et al.(2008) Concept, design and implementation of a cardiovasculargene-centric 50 k SNP array for large-scale genomic association studies.PLoS ONE., 3, e3583.
23. Samani, N.J., Erdmann, J., Hall, A.S., Hengstenberg, C., Mangino, M.,Mayer, B., Dixon, R.J., Meitinger, T., Braund, P., Wichmann, H.E. et al.(2007) Genomewide association analysis of coronary artery disease.N. Engl. J. Med., 357, 443–453.
24. Kathiresan, S., Melander, O., Anevski, D., Guiducci, C., Burtt, N.P., Roos,C., Hirschhorn, J.N., Berglund, G., Hedblad, B., Groop, L. et al. (2008)Polymorphisms associated with cholesterol and risk of cardiovascularevents. N. Engl. J. Med., 358, 1240–1249.
25. Bodmer, W. and Bonilla, C. (2008) Common and rare variants inmultifactorial susceptibility to common diseases. Nat. Genet., 40,695–701.
26. Jones, R., Pembrey, M., Golding, J. and Herrick, D. (2005) The search forgenenotype/phenotype associations and the phenome scan. Paediatr.Perinat. Epidemiol., 19, 264–275.
27. Chen, L., Davey, S.G., Harbord, R.M. and Lewis, S.J. (2008) Alcoholintake and blood pressure: a systematic review implementing a Mendelianrandomization approach. PLoS Med., 5, e52.
28. Smith, G.D., Lawlor, D.A., Harbord, R., Timpson, N., Day, I. andEbrahim, S. (2007) Clustered environments and randomized genes: afundamental distinction between conventional and genetic epidemiology.PLoS Med., 4, e352.
29. Casas, J.P., Shah, T., Cooper, J., Hawe, E., Mcmahon, A.D., Gaffney, D.,Packard, C.J., O’Reilly, D.S., Juhan-Vague, I., Yudkin, J.S. et al. (2006)Insight into the nature of the CRP-coronary event association usingMendelian randomization. Int. J. Epidemiol., 35, 922–931.
30. Davey, S.G., Harbord, R., Milton, J., Ebrahim, S. and Sterne, J.A. (2005)Does elevated plasma fibrinogen increase the risk of coronary heartdisease? Evidence from a meta-analysis of genetic association studies.Arterioscler. Thromb. Vasc. Biol., 25, 2228–2233.
31. Keavney, B., Danesh, J., Parish, S., Palmer, A., Clark, S., Youngman, L.,Delepine, M., Lathrop, M., Peto, R. and Collins, R. (2006) Fibrinogen and
coronary heart disease: test of causality by ‘Mendelian randomization’.Int. J. Epidemiol., 35, 935–943.
32. Davey, S.G., Lawlor, D.A., Harbord, R., Timpson, N., Rumley, A., Lowe,G.D., Day, I.N. and Ebrahim, S. (2005) Association of C-reactive proteinwith blood pressure and hypertension: life course confounding andmendelian randomization tests of causality. Arterioscler. Thromb. Vasc.
Biol., 25, 1051–1056.
33. Humphries, S.E., Cranston, T., Allen, M., Middleton-Price, H., Fernandez,M.C., Senior, V., Hawe, E., Iversen, A., Wray, R., Crook, M.A. et al.
(2006) Mutational analysis in UK patients with a clinical diagnosis offamilial hypercholesterolaemia: relationship with plasma lipid traits, heartdisease risk and utility in relative tracing. J. Mol. Med., 84, 203–214.
34. Cohen, J.C., Boerwinkle, E., Mosley, T.H. Jr and Hobbs, H.H. (2006)Sequence variations in PCSK9, low LDL, and protection against coronaryheart disease. N. Engl. J. Med., 354, 1264–1272.
35. Linsel-Nitschke, P., Gotz, A., Erdmann, J., Braenne, I., Braund, P.,Hengstenberg, C., Stark, K., Fischer, M., Schreiber, S., El Mokhtari, N.E.et al. (2008) Lifelong reduction of LDL-cholesterol related to a commonvariant in the LDL-receptor gene decreases the risk of coronary arterydisease—a Mendelian Randomisation study. PLoS ONE, 3, e2986.
36. Rockman, M.V. (2008) Reverse engineering the genotype-phenotype mapwith natural genetic variation. Nature, 456, 738–744.
37. Cooper, J.A., Miller, G.J., Bauer, K.A., Morrissey, J.H., Meade, T.W.,Howarth, D.J., Barzegar, S., Mitchell, J.P. and Rosenberg, R.D. (2000)Comparison of novel hemostatic factors and conventional risk factors forprediction of coronary heart disease. Circulation, 102, 2816–2822.
38. Redon, R., Ishikawa, S., Fitch, K.R., Feuk, L., Perry, G.H., Andrews,T.D., Fiegler, H., Shapero, M.H., Carson, A.R., Chen, W. et al. (2006)Global variation in copy number in the human genome. Nature, 444, 444–454.
39. Benjamini, Y. and Hochberg, Y. (1995) Controlling the false discoveryrate: a practical and powerful approach to multiple testing. Journal of theRoyal Statistical Society B 57: 289-300. J. Royal Stat. Soc. B, 57, 289–300.
40. Storey, J.D. (2002) A direct approach to false discovery rates. J. Royal
Stat. Soc. Ser. B, 64, 479–498.
41. Purcell, S., Neale, B., Todd-Brown, K., Thomas, L., Ferreira, M.A.,Bender, D., Maller, J., Sklar, P., de Bakker, P.I., Daly, M.J. et al. (2007)PLINK: a tool set for whole-genome association and population-basedlinkage analyses. Am. J. Hum. Genet., 81, 559–575.
42. Li, H., Wetten, S., Li, L., St Jean, P.L., Upmanyu, R., Surh, L., Hosford,D., Barnes, M.R., Briley, J.D., Borrie, M. et al. (2008) Candidatesingle-nucleotide polymorphisms from a genomewide association study ofAlzheimer disease. Arch. Neurol., 65, 45–53.
43. Webster, J.A., Myers, A.J., Pearson, J.V., Craig, D.W., Hu-Lince, D.,Coon, K.D., Zismann, V.L., Beach, T., Leung, D., Bryden, L. et al. (2008)Sorl1 as an Alzheimer’s disease predisposition gene? Neurodegener. Dis.,5, 60–64.
2316 Human Molecular Genetics, 2009, Vol. 18, No. 12
Downloaded from https://academic.oup.com/hmg/article-abstract/18/12/2305/645042by London School of Hygiene & Tropical Medicine useron 23 February 2018